
Granular Flow Impact on Shed Tunnels and the Buffering Effect of Cushion Layers


Abstract
1. Introduction
2. Methodology
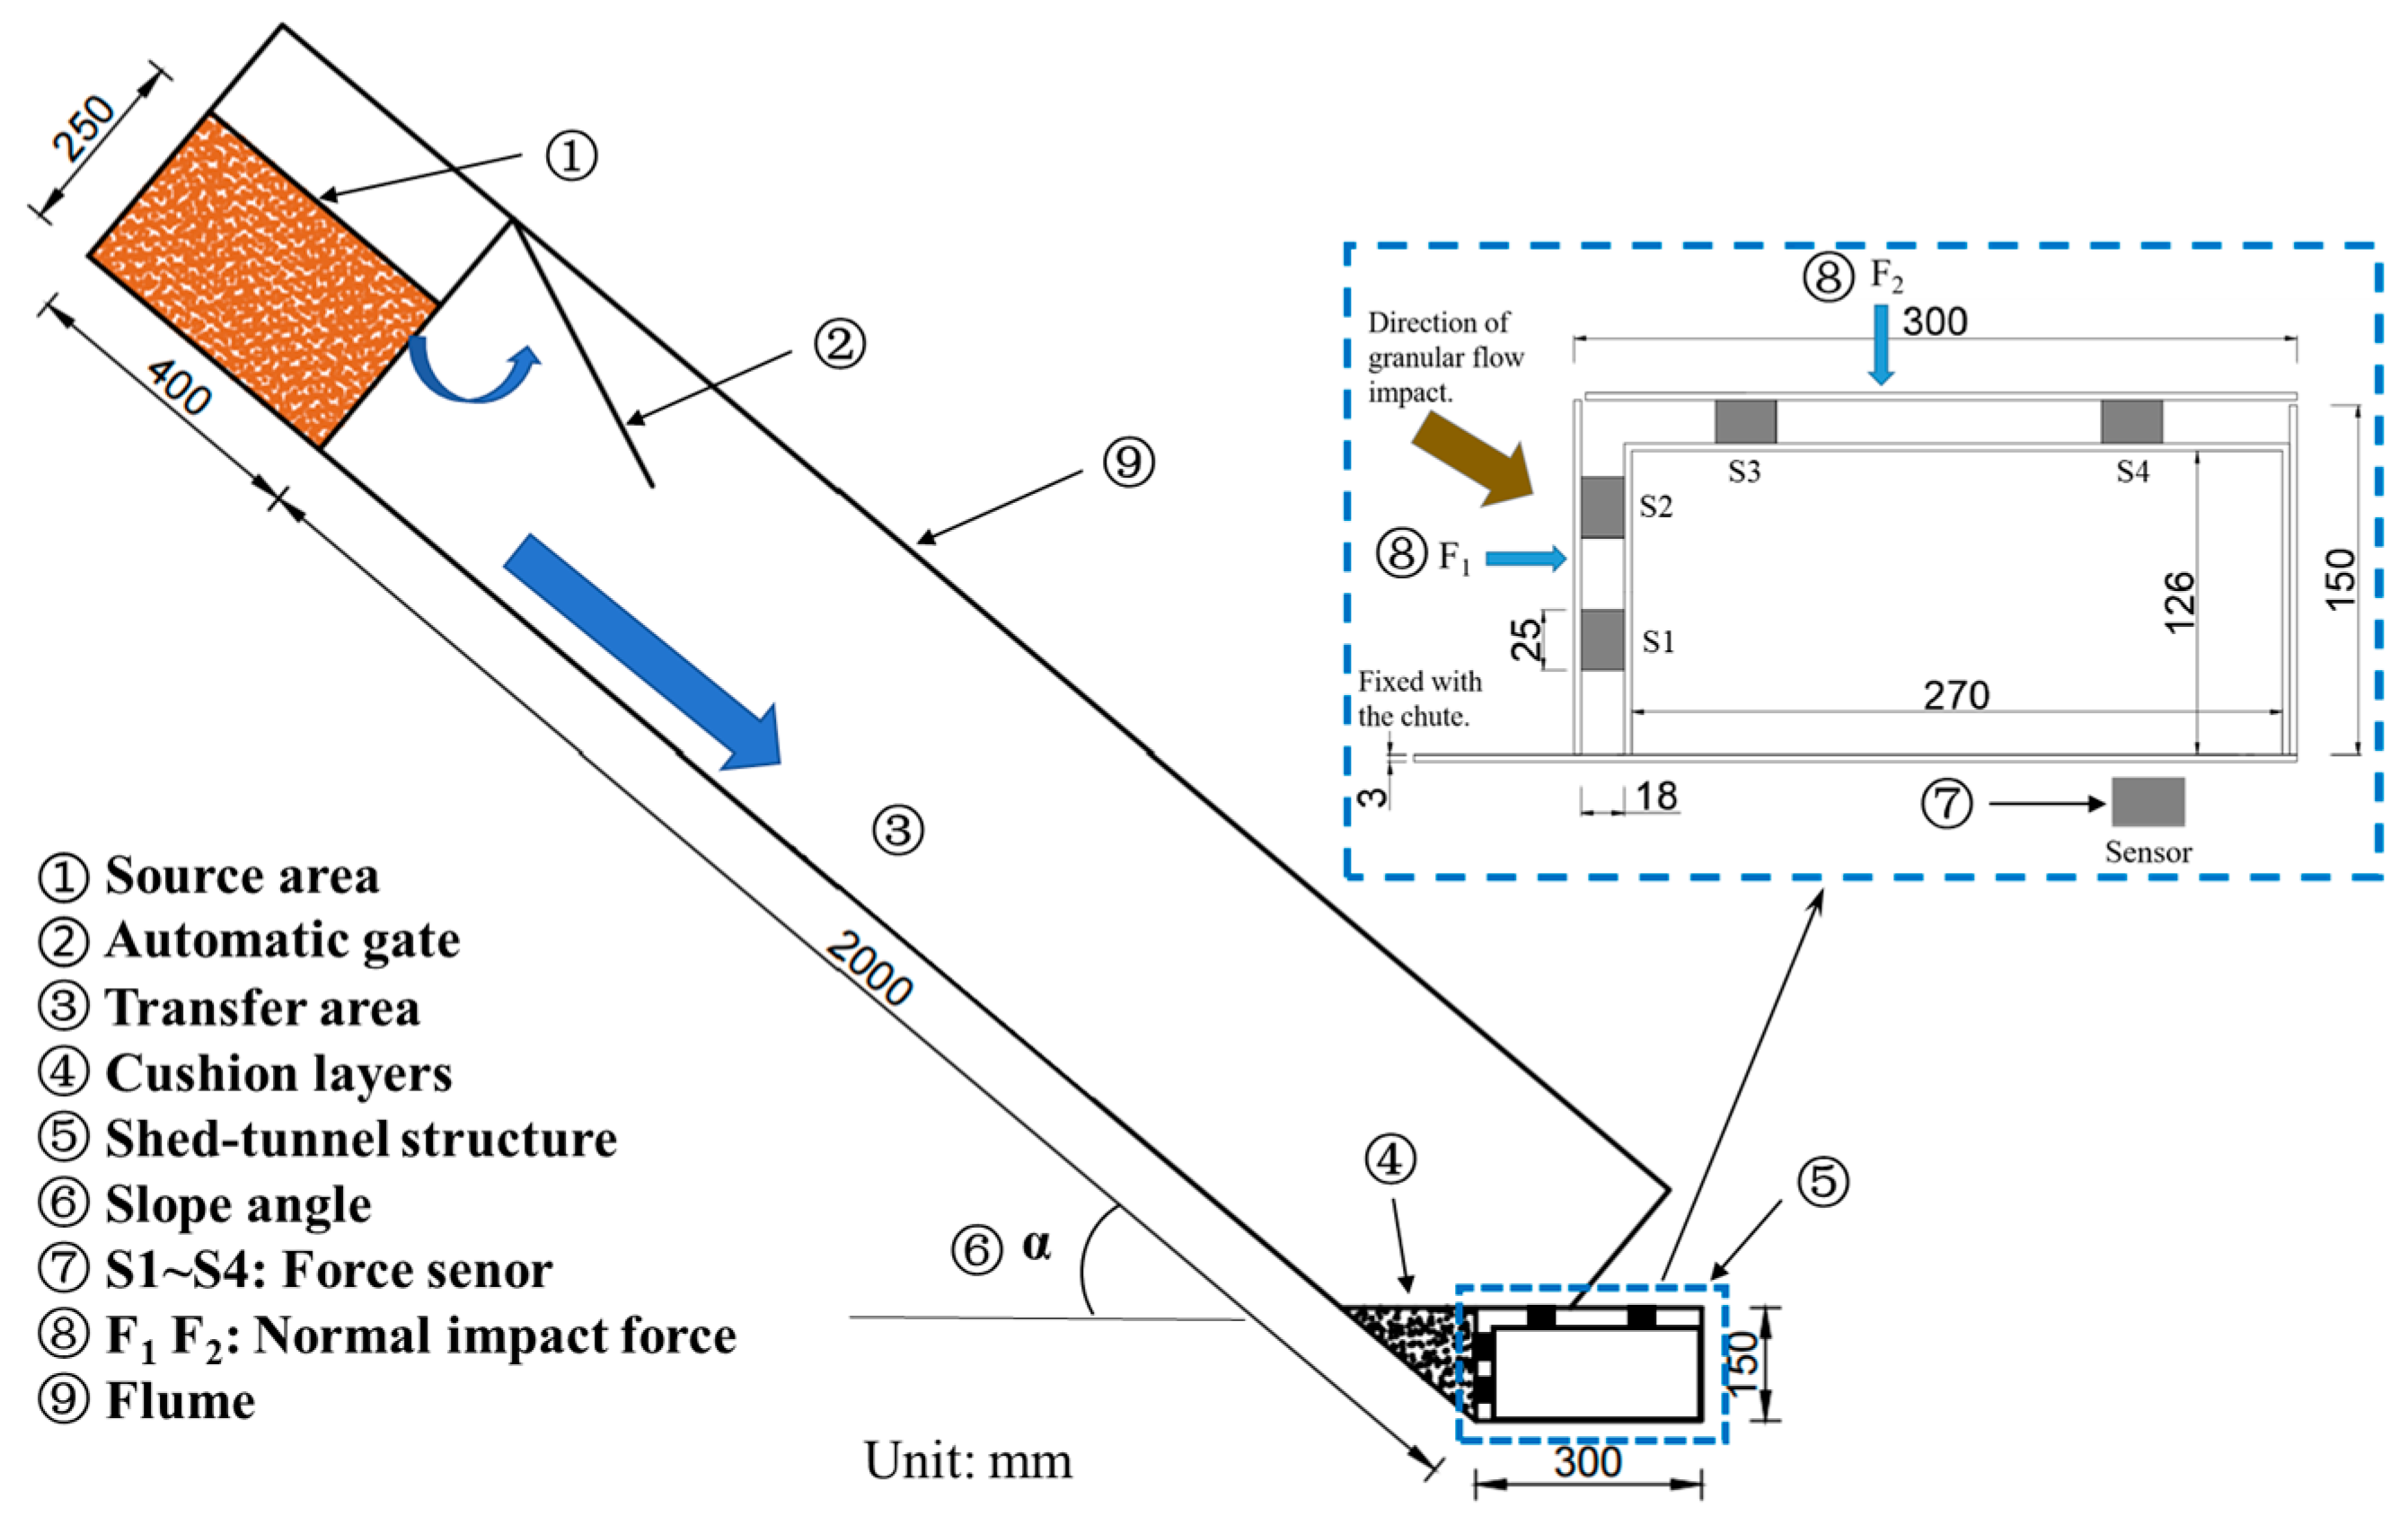
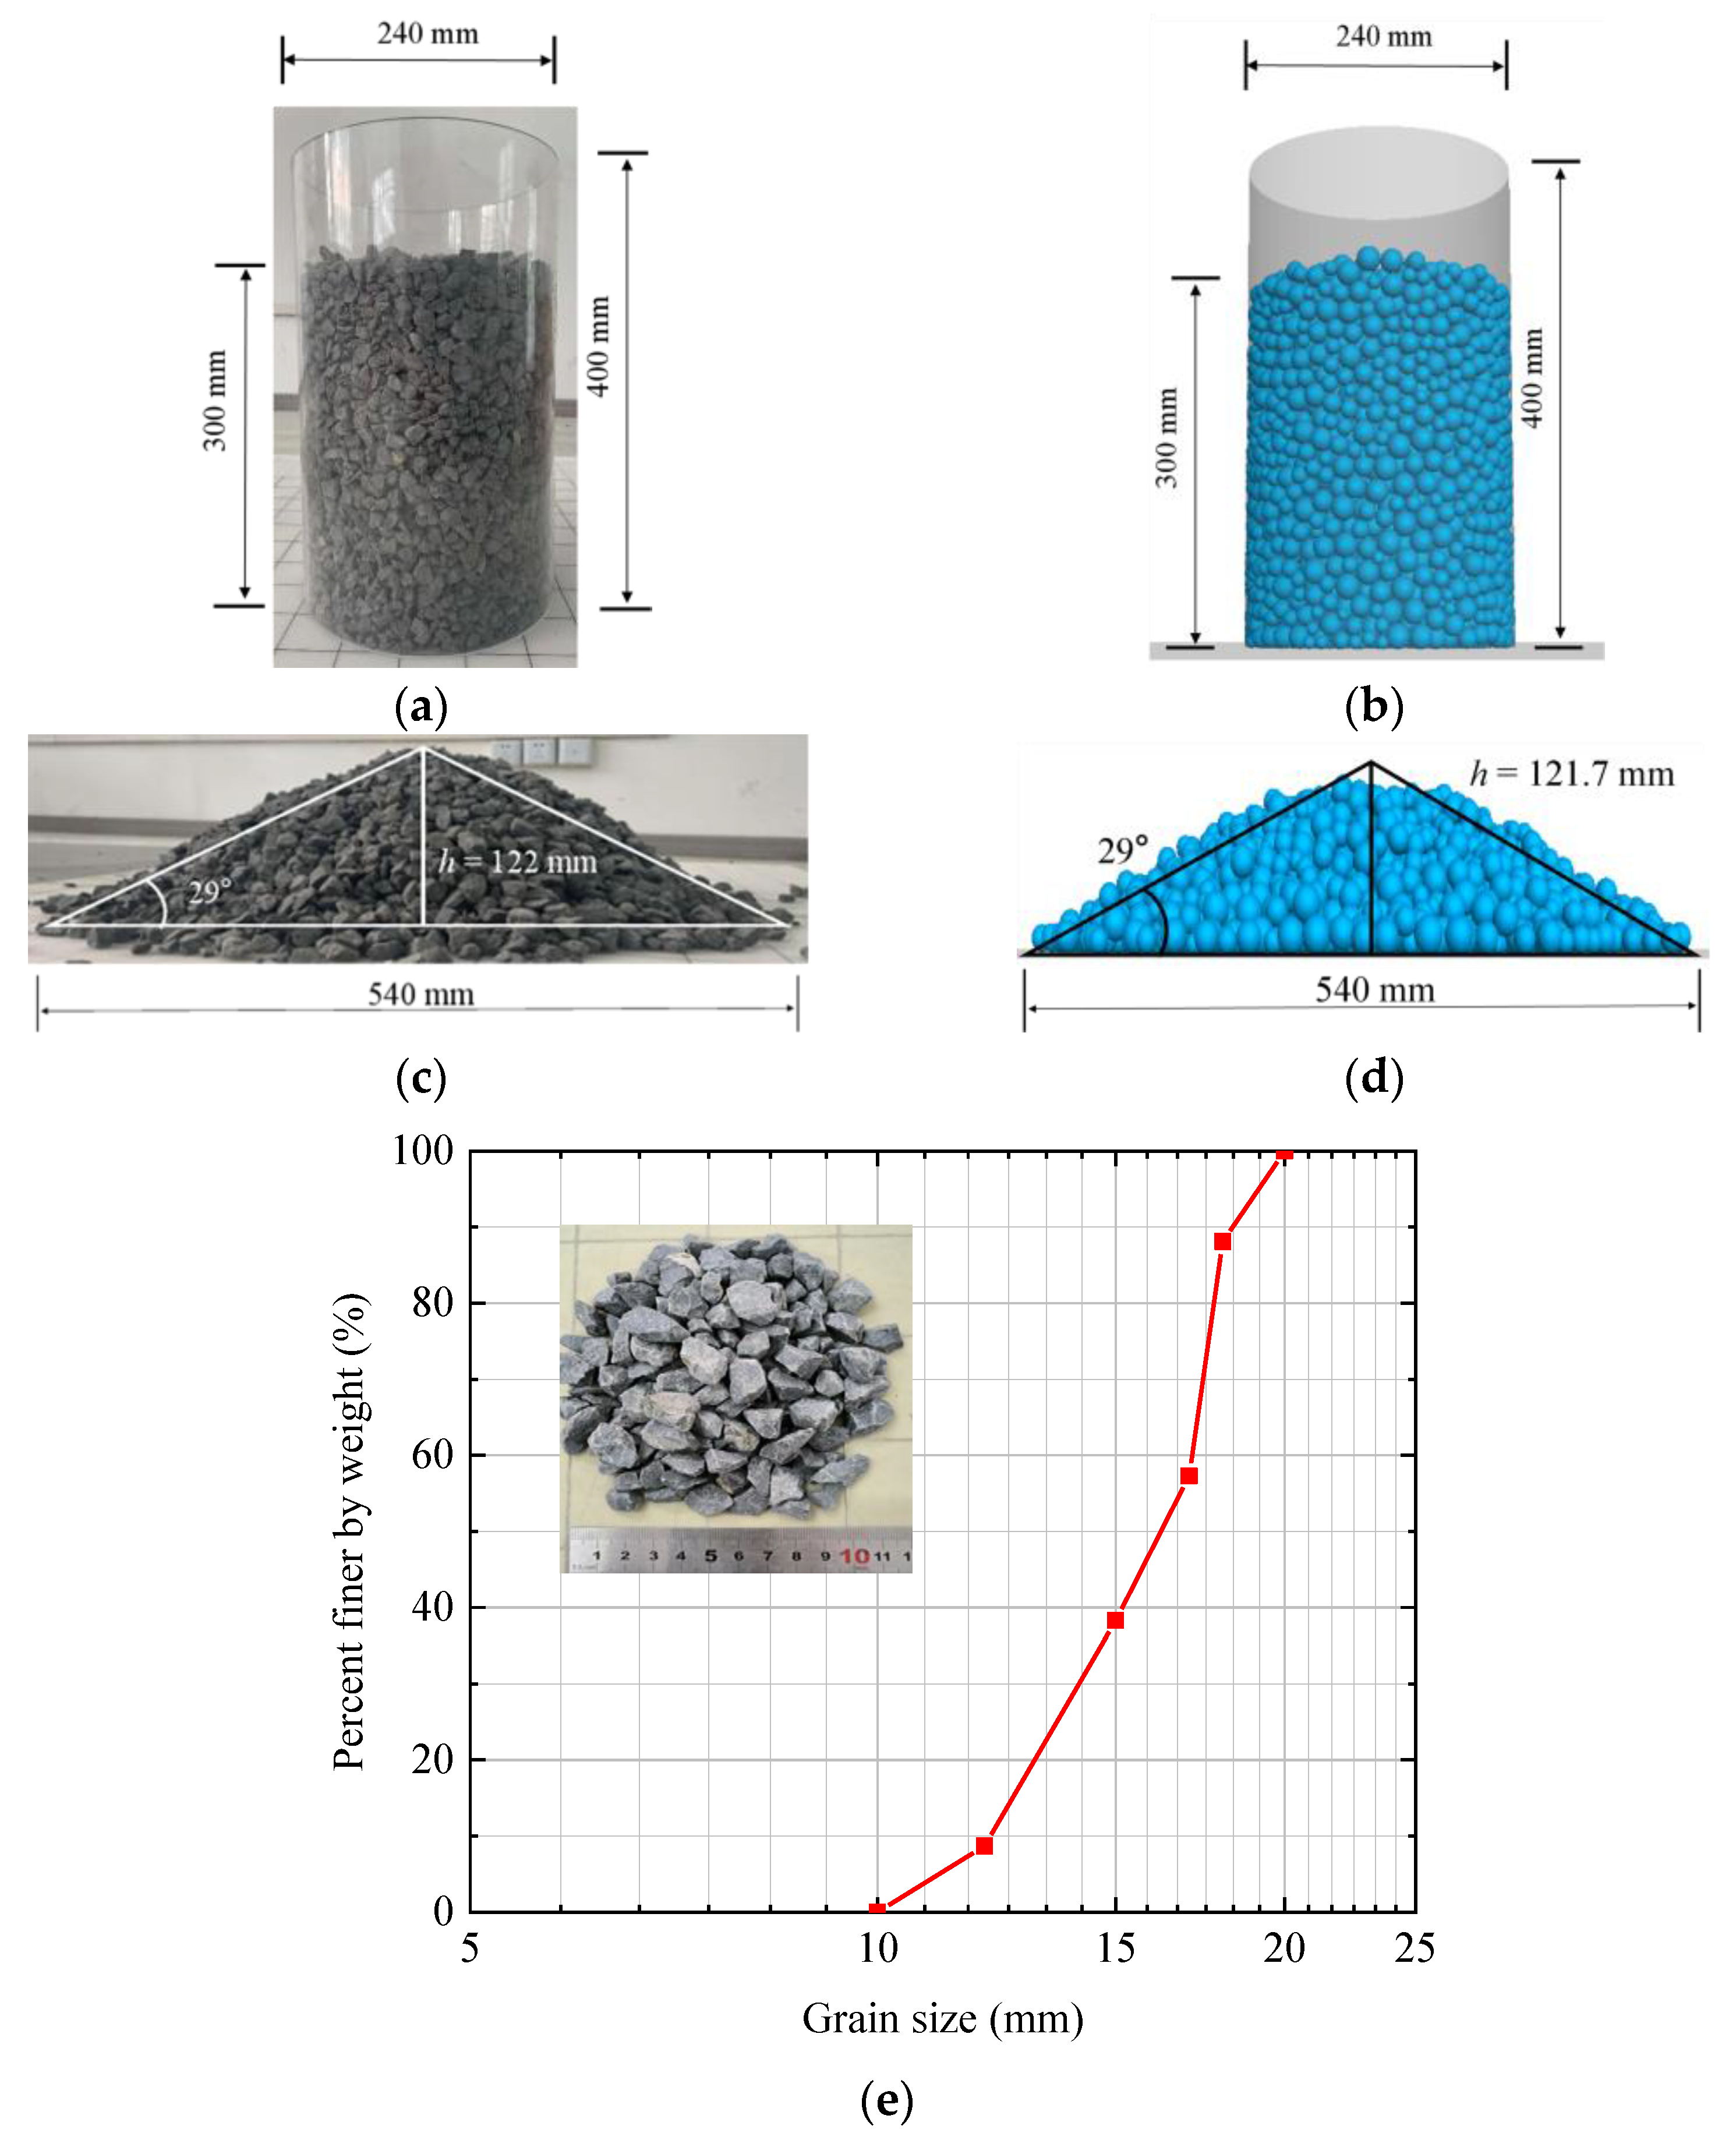
2.1. Experimental Setup
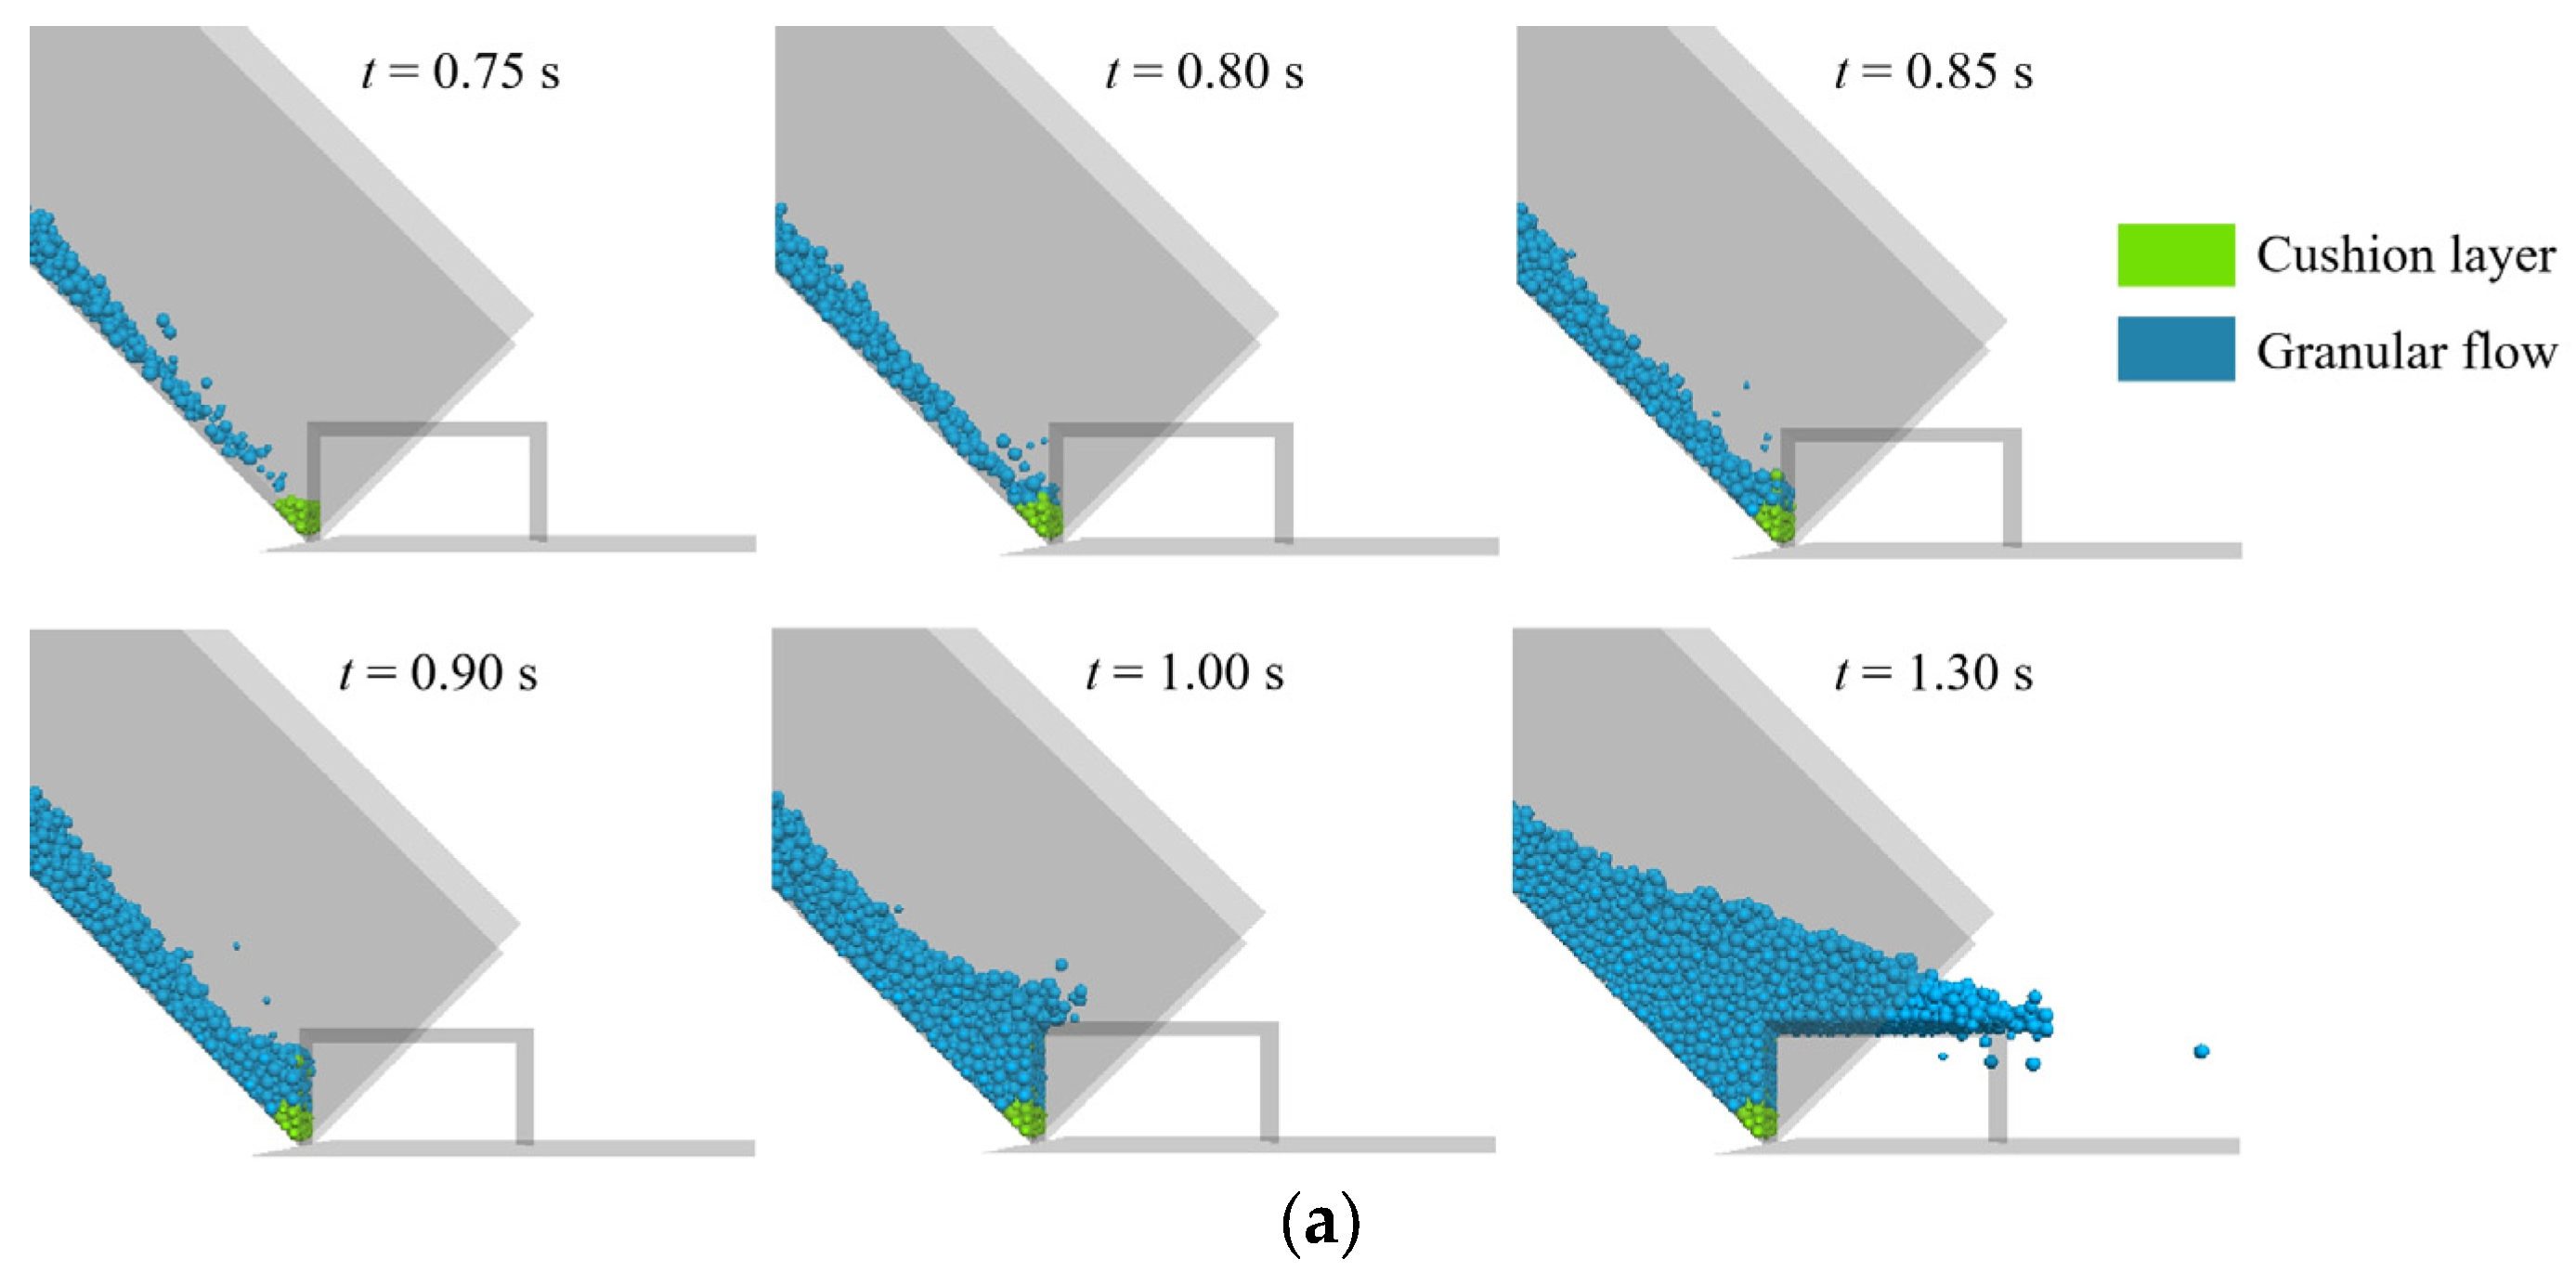
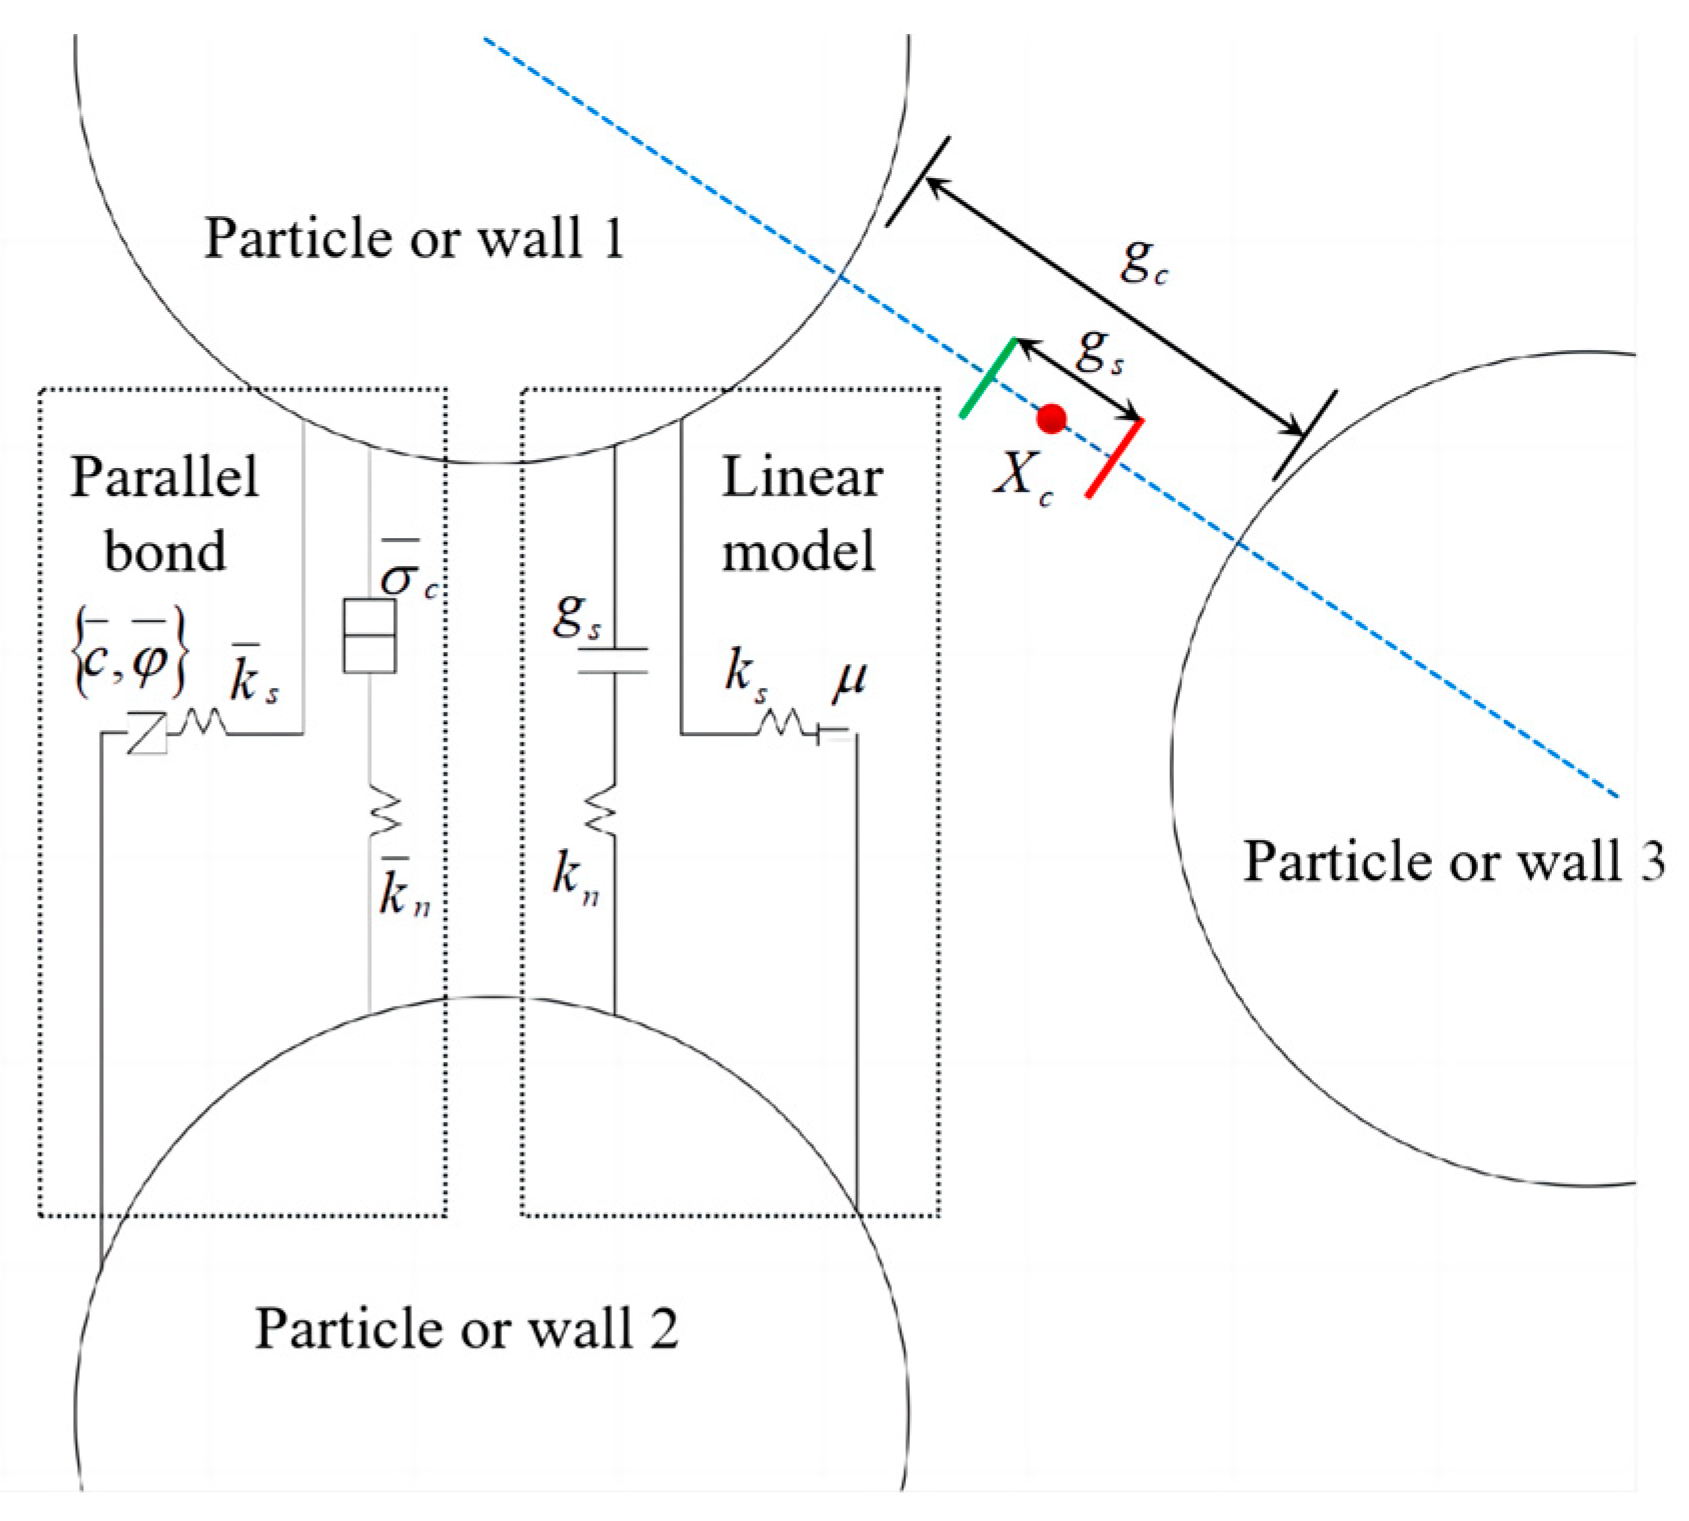
2.2. Numerical Method
2.3. Parameter Calibration
3. Results
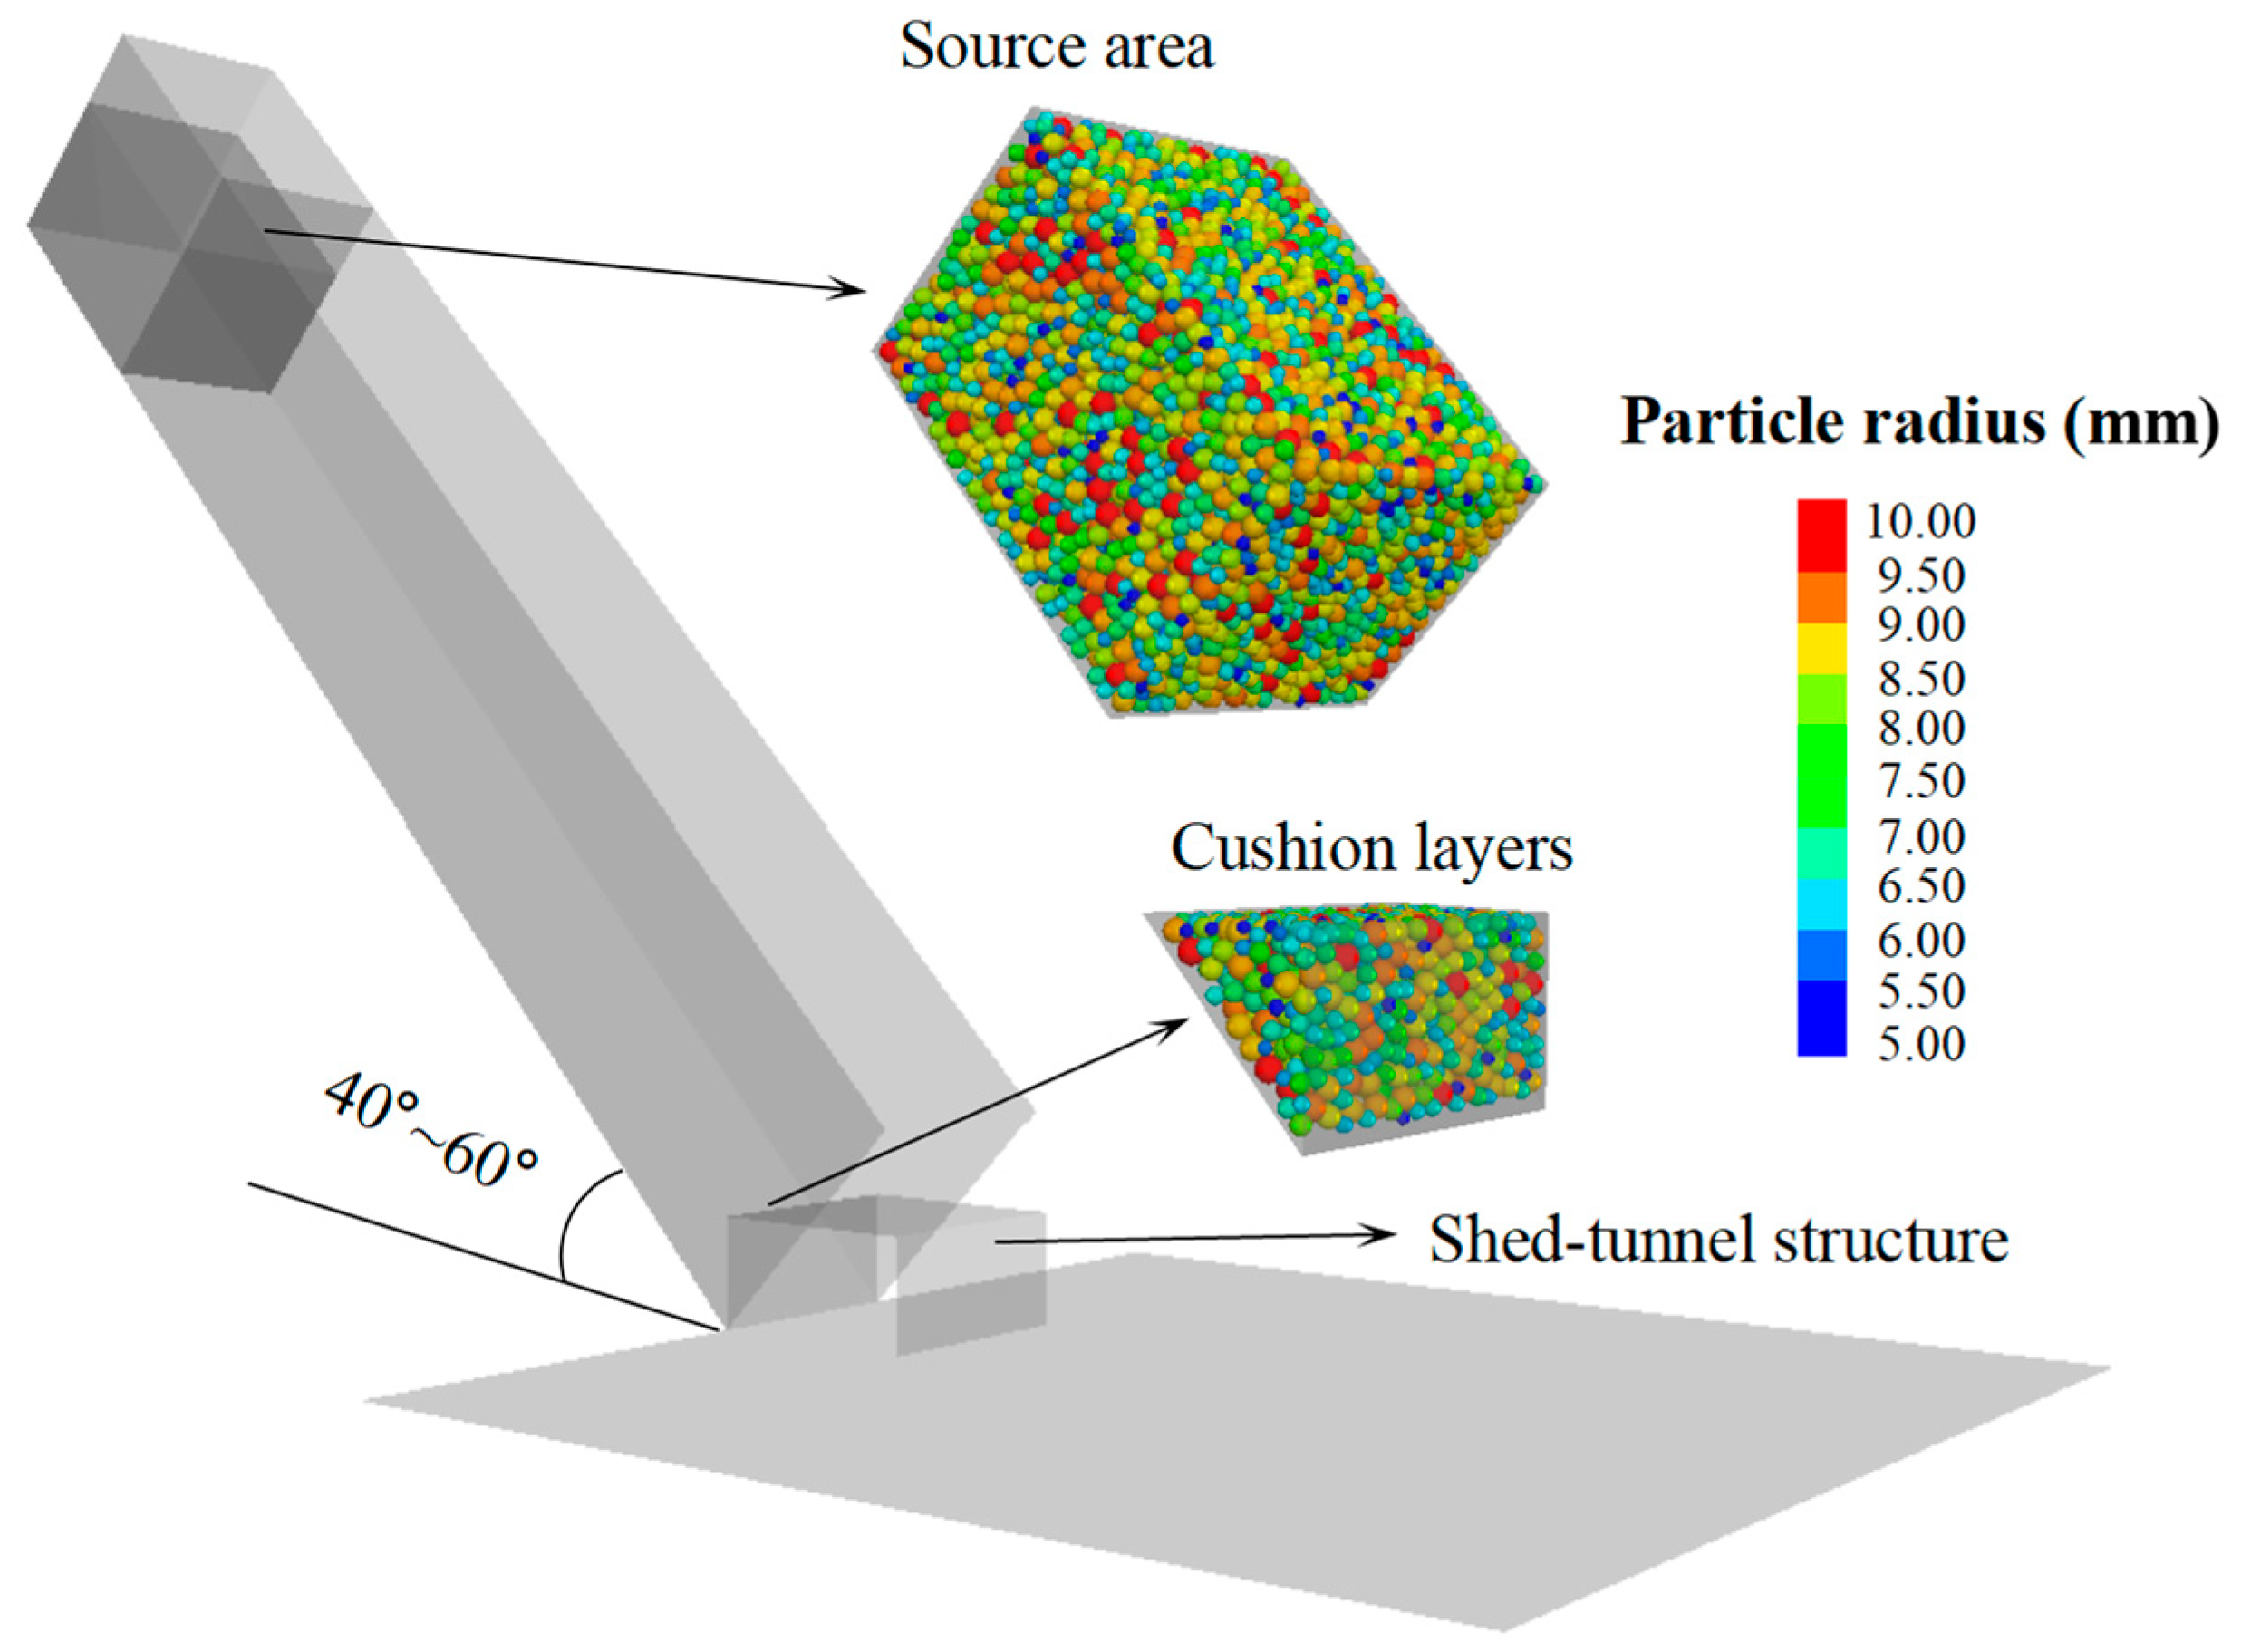
3.1. Influence of Slope Angle
3.1.1. Movement Velocity
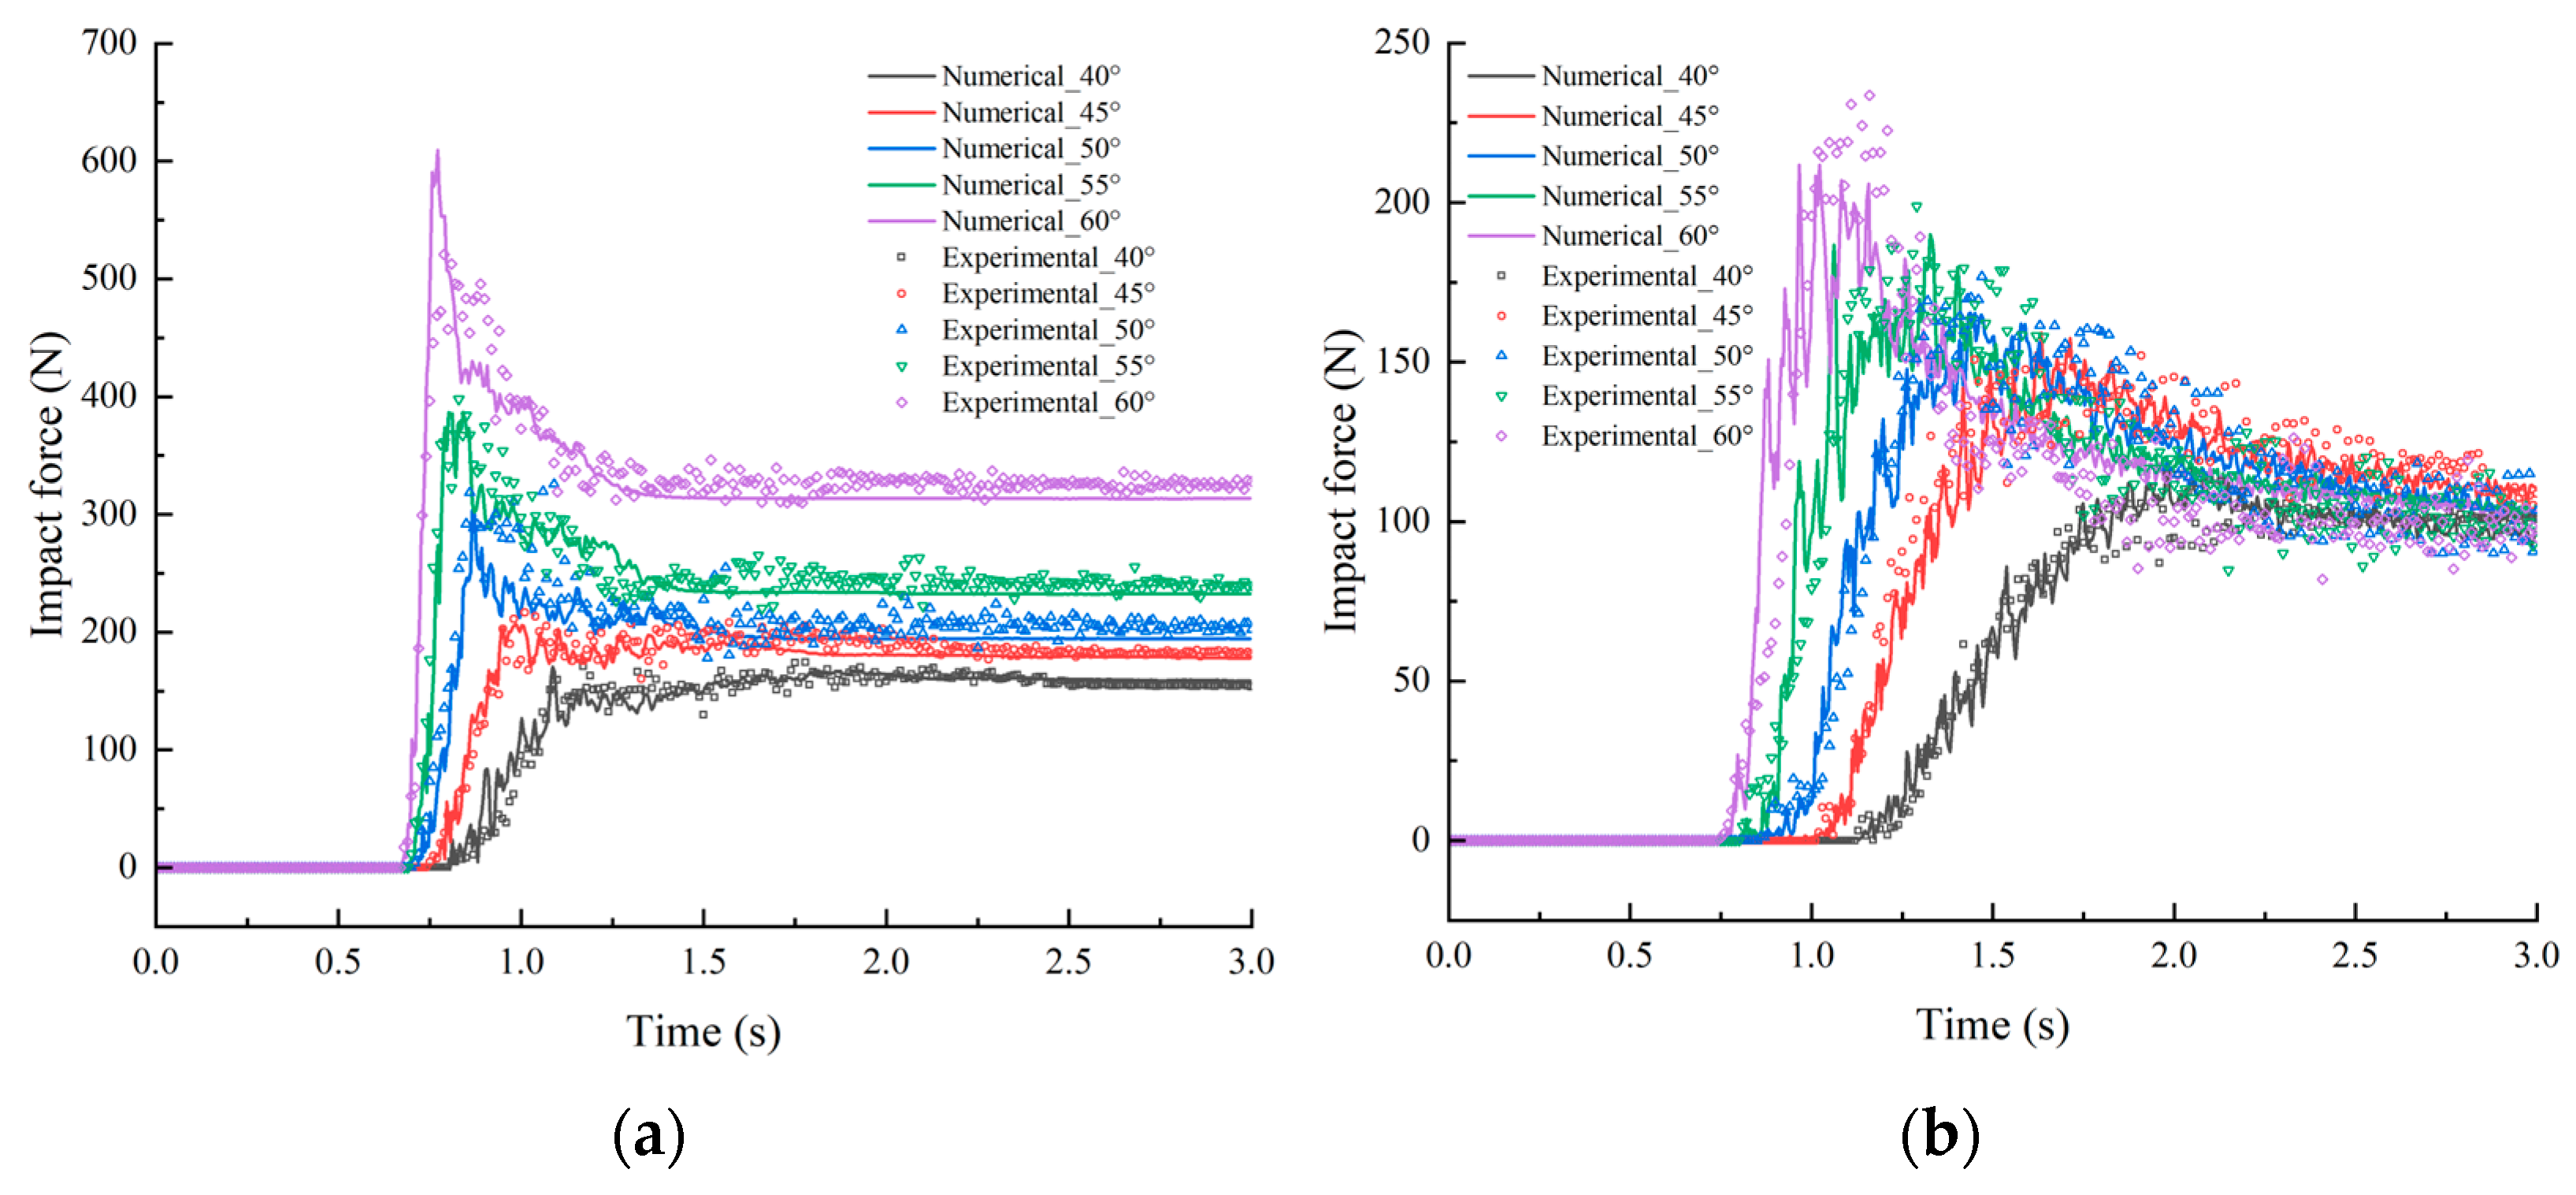
3.1.2. Impact Force
3.2. Influence of the Cushion Layer
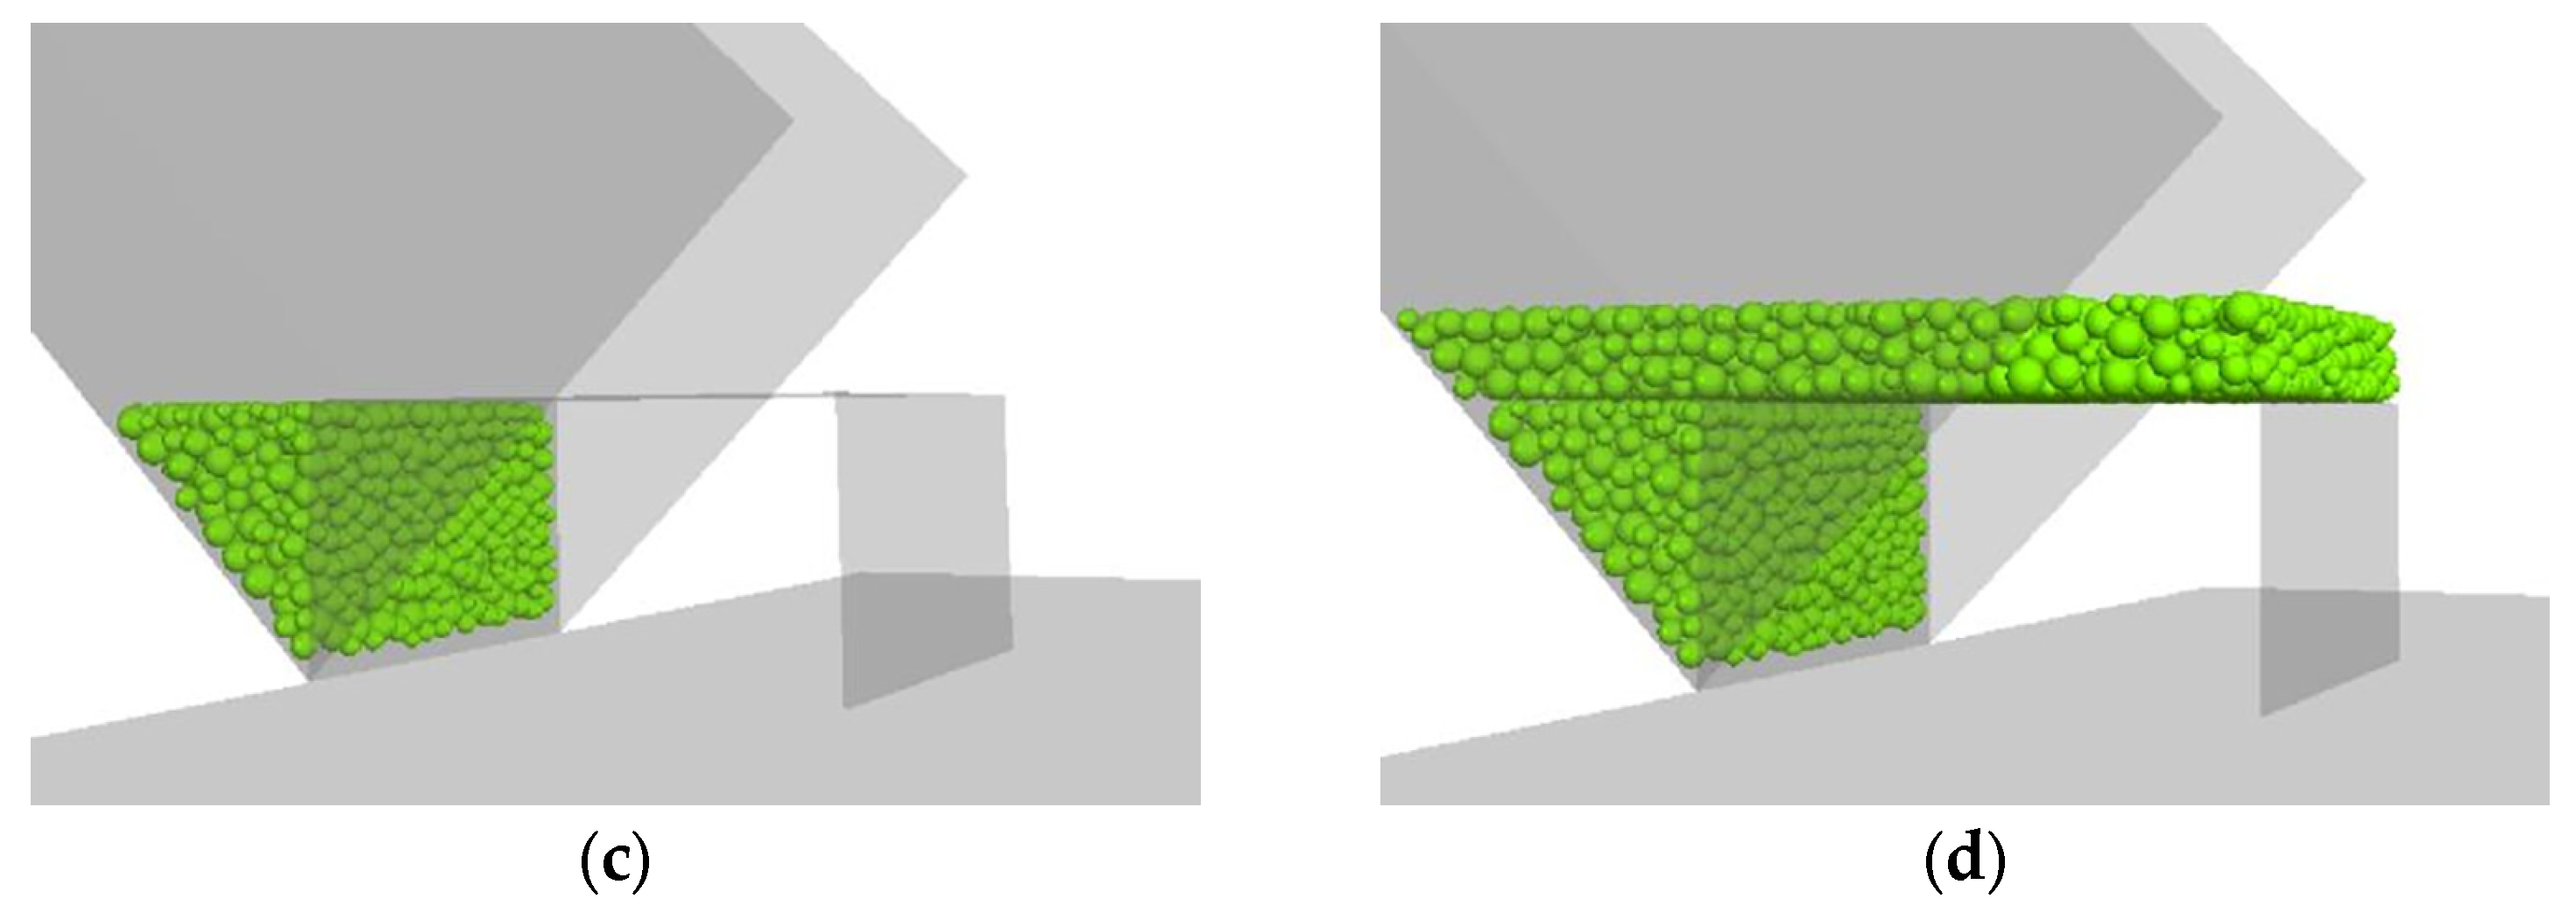
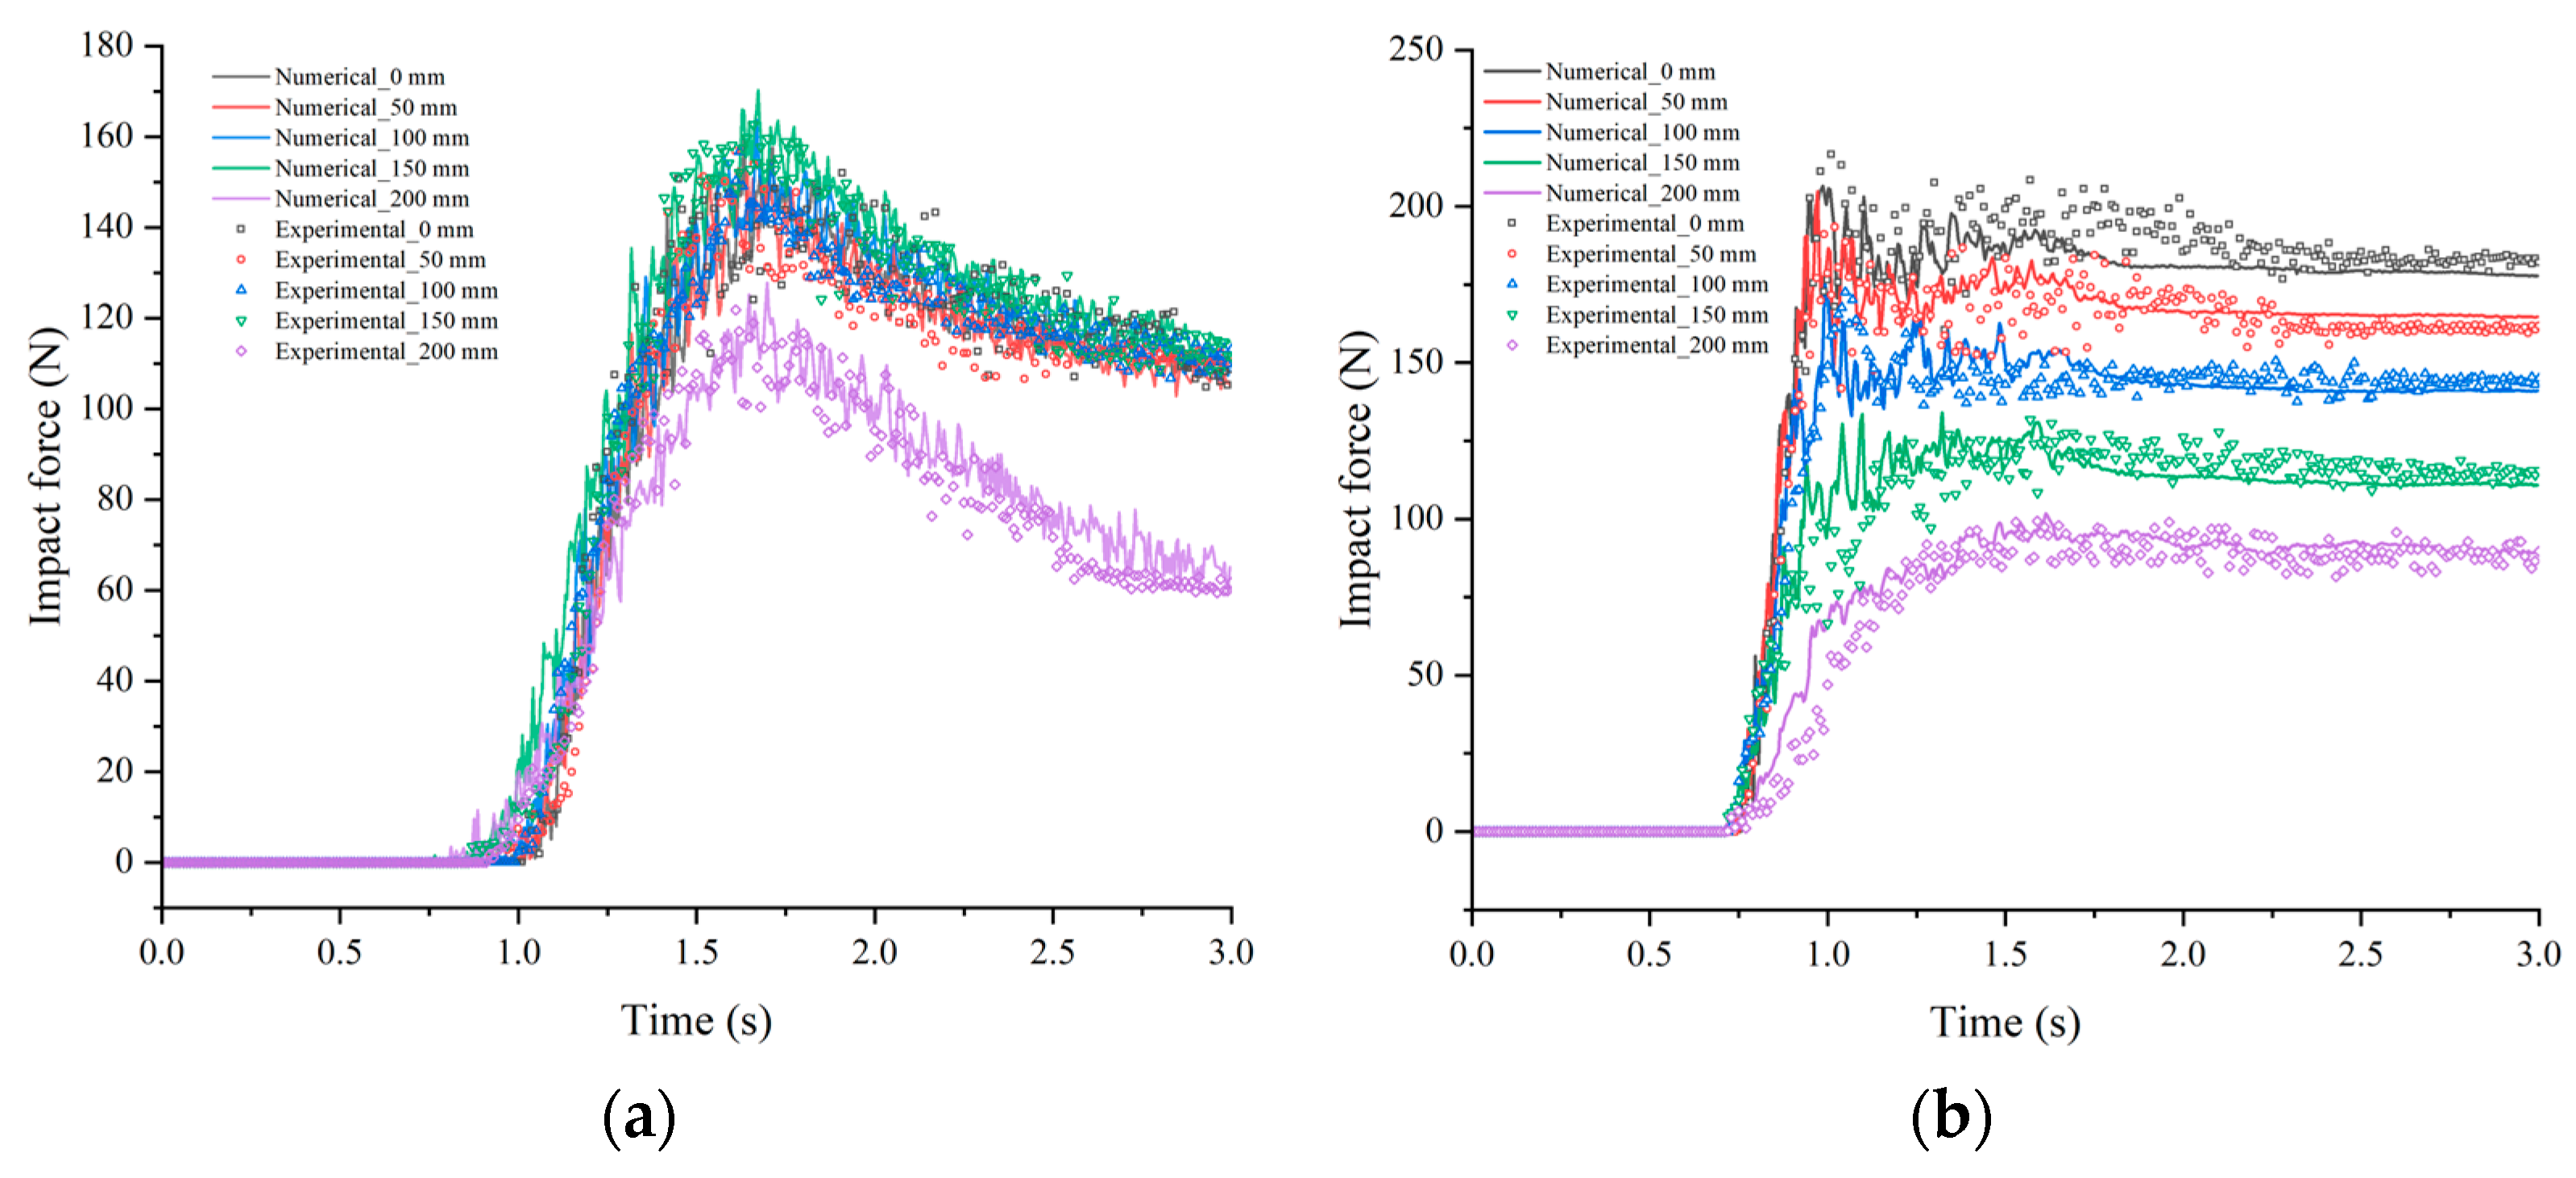
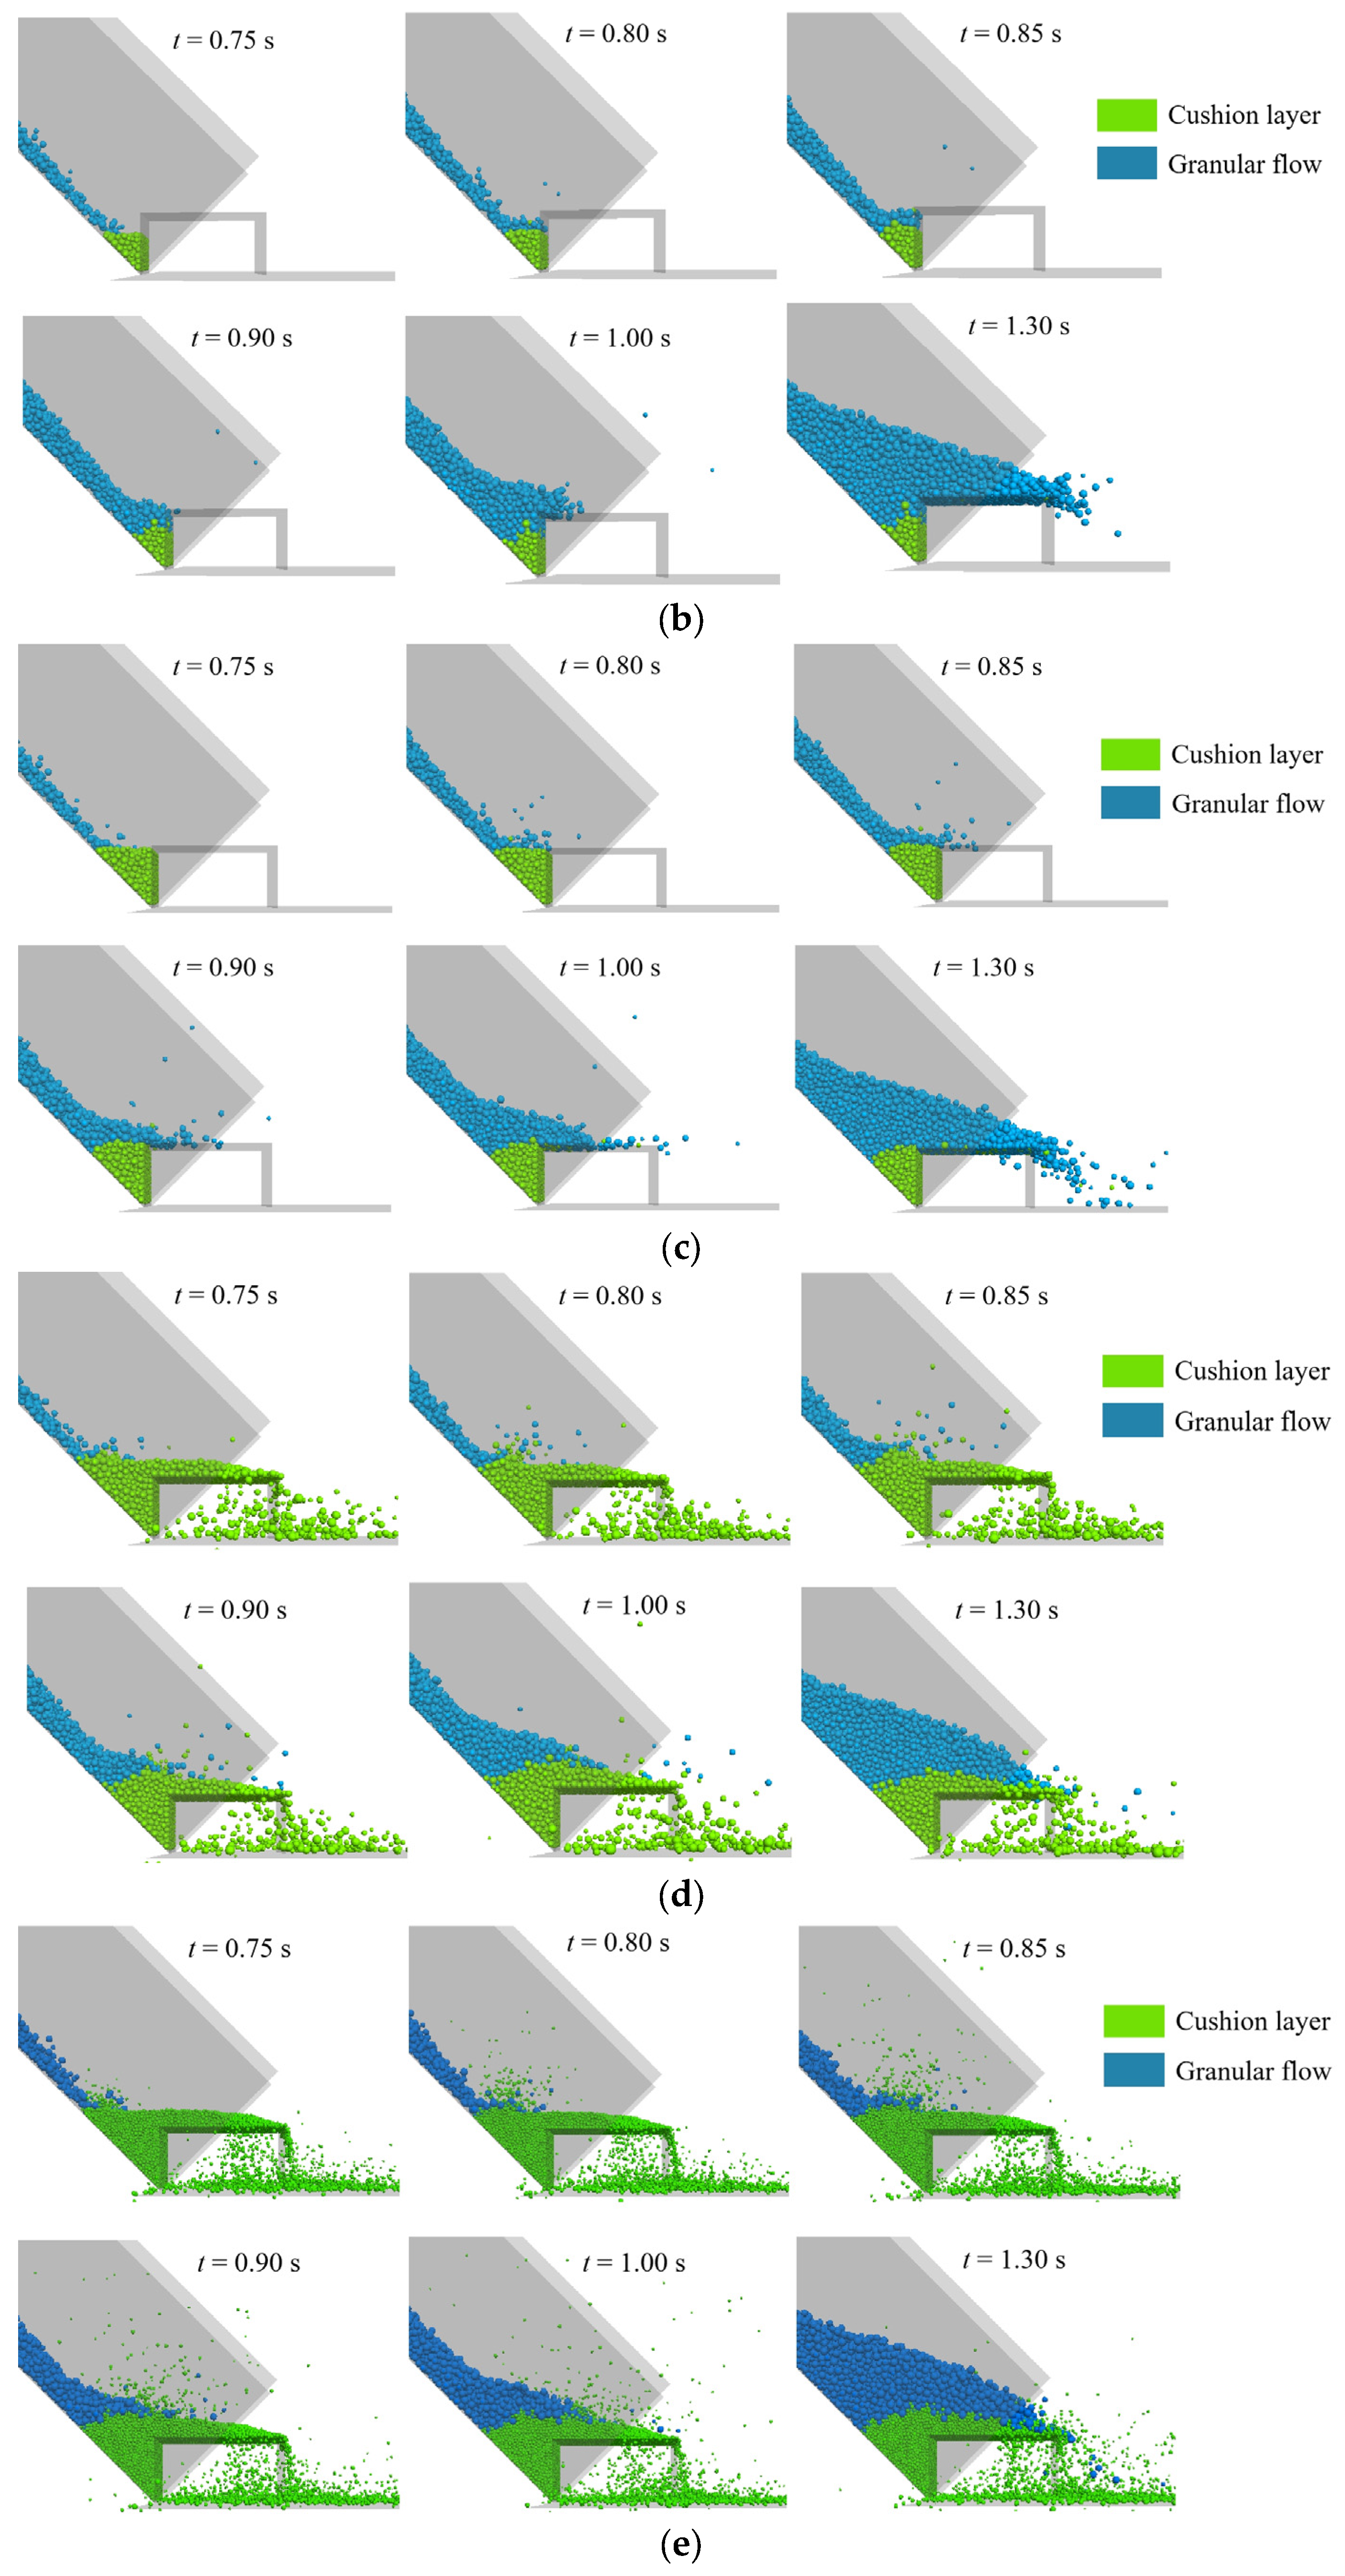
3.2.1. Thickness of the Cushion Layer

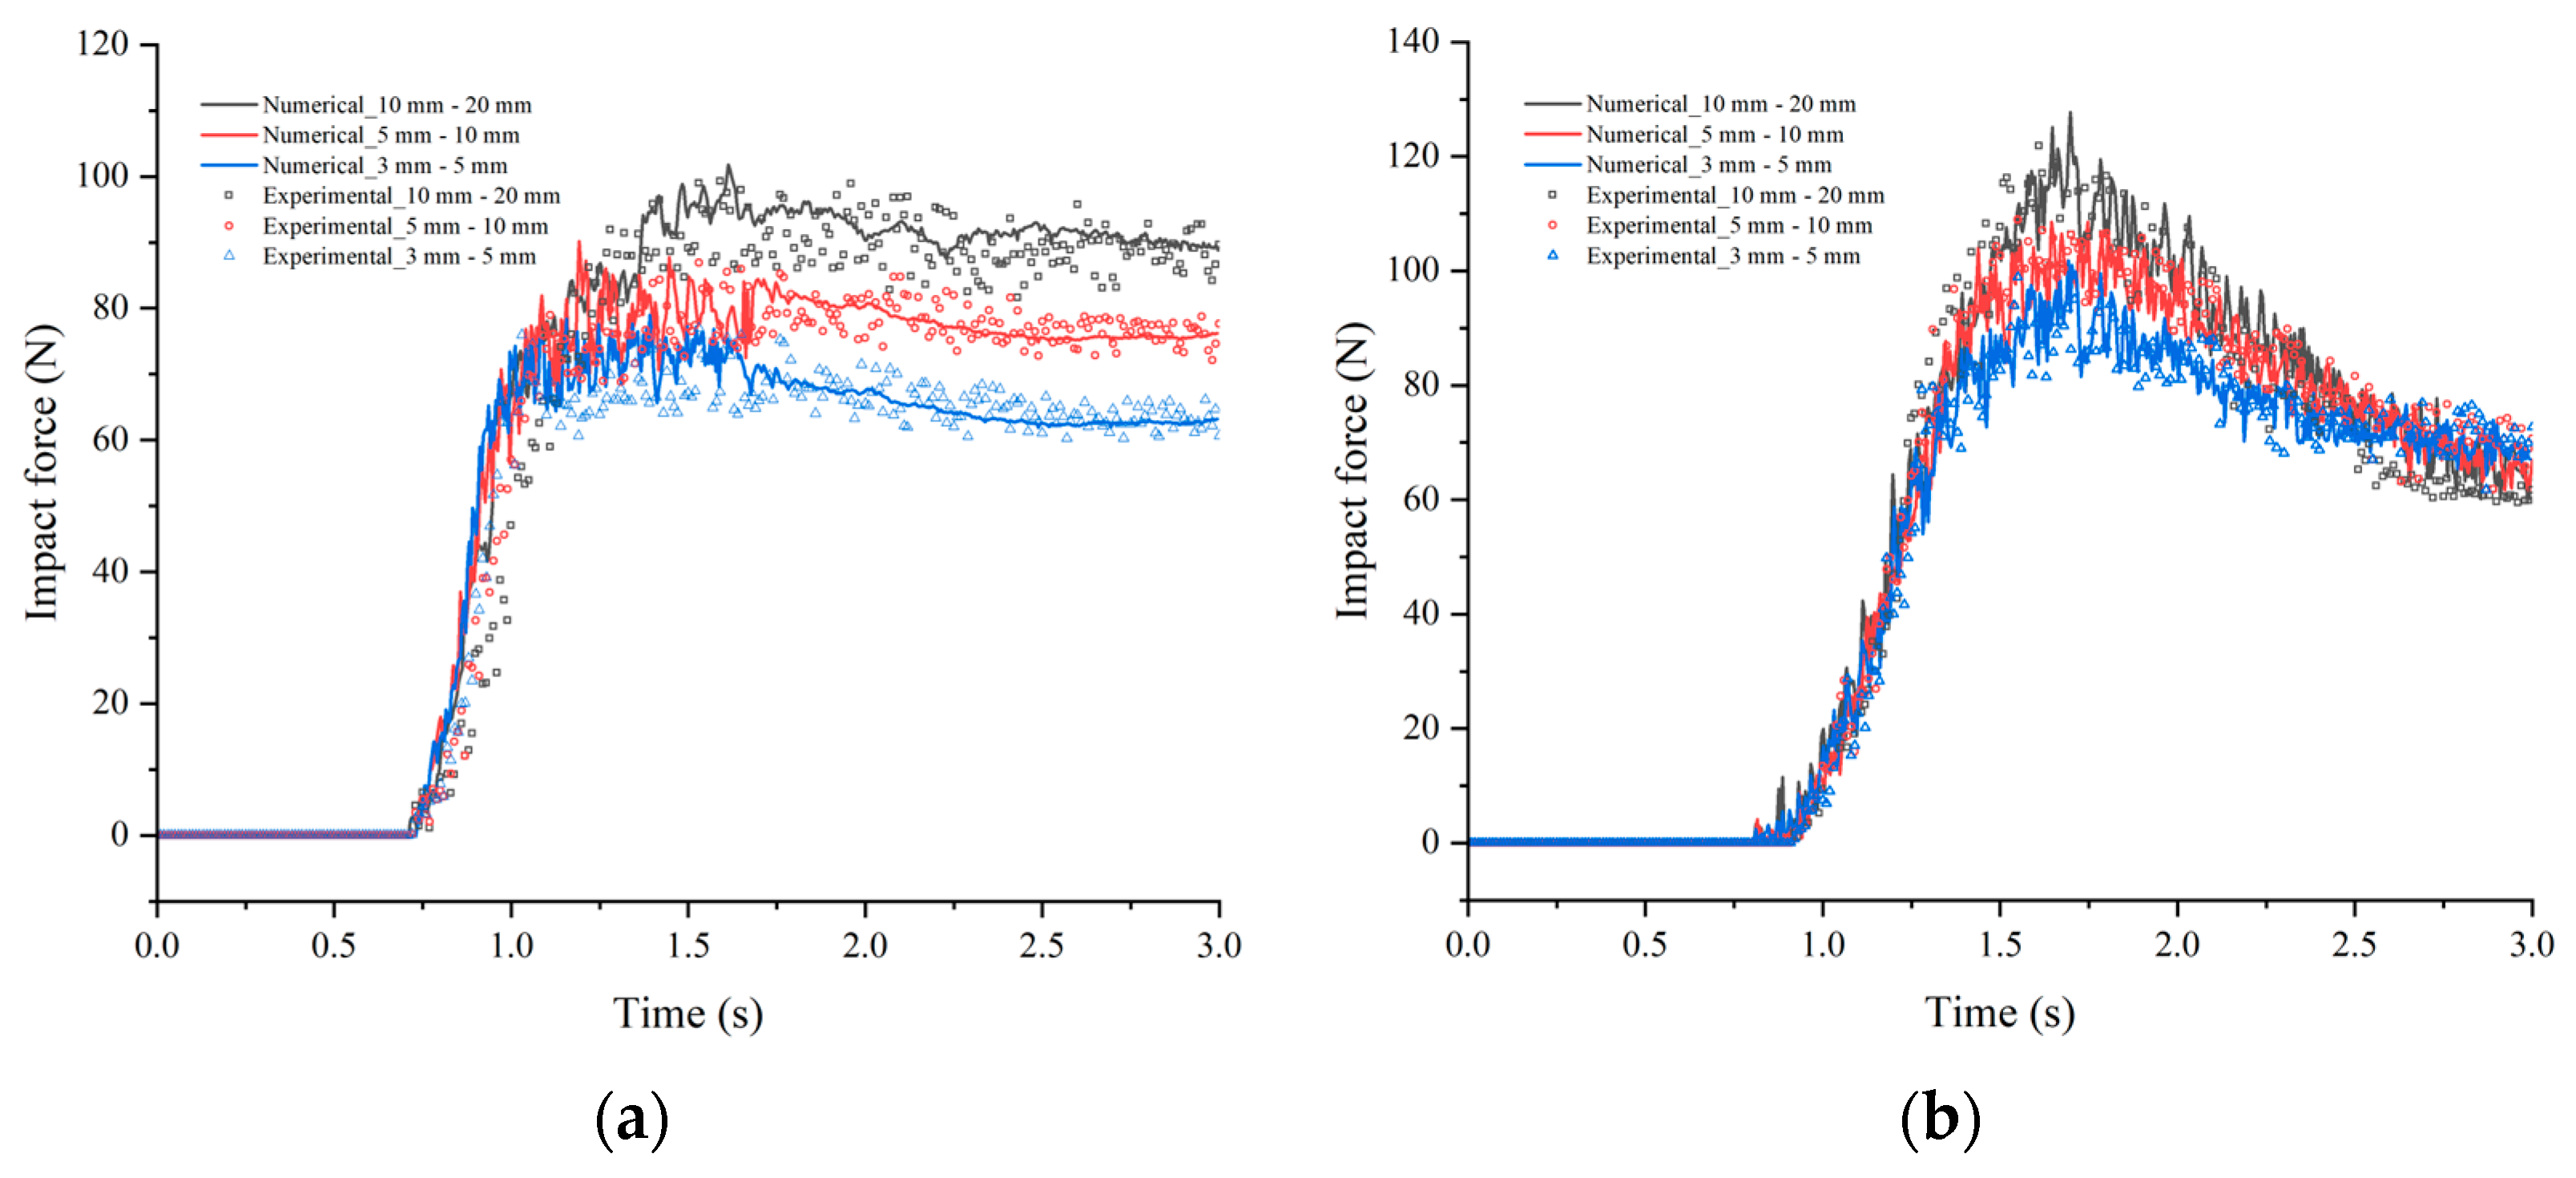
3.2.2. Particle Size of the Cushion Layer

4. Discussion
4.1. Effectiveness of Cushioning

4.2. Energy Characteristics
4.3. Limitations
5. Conclusions
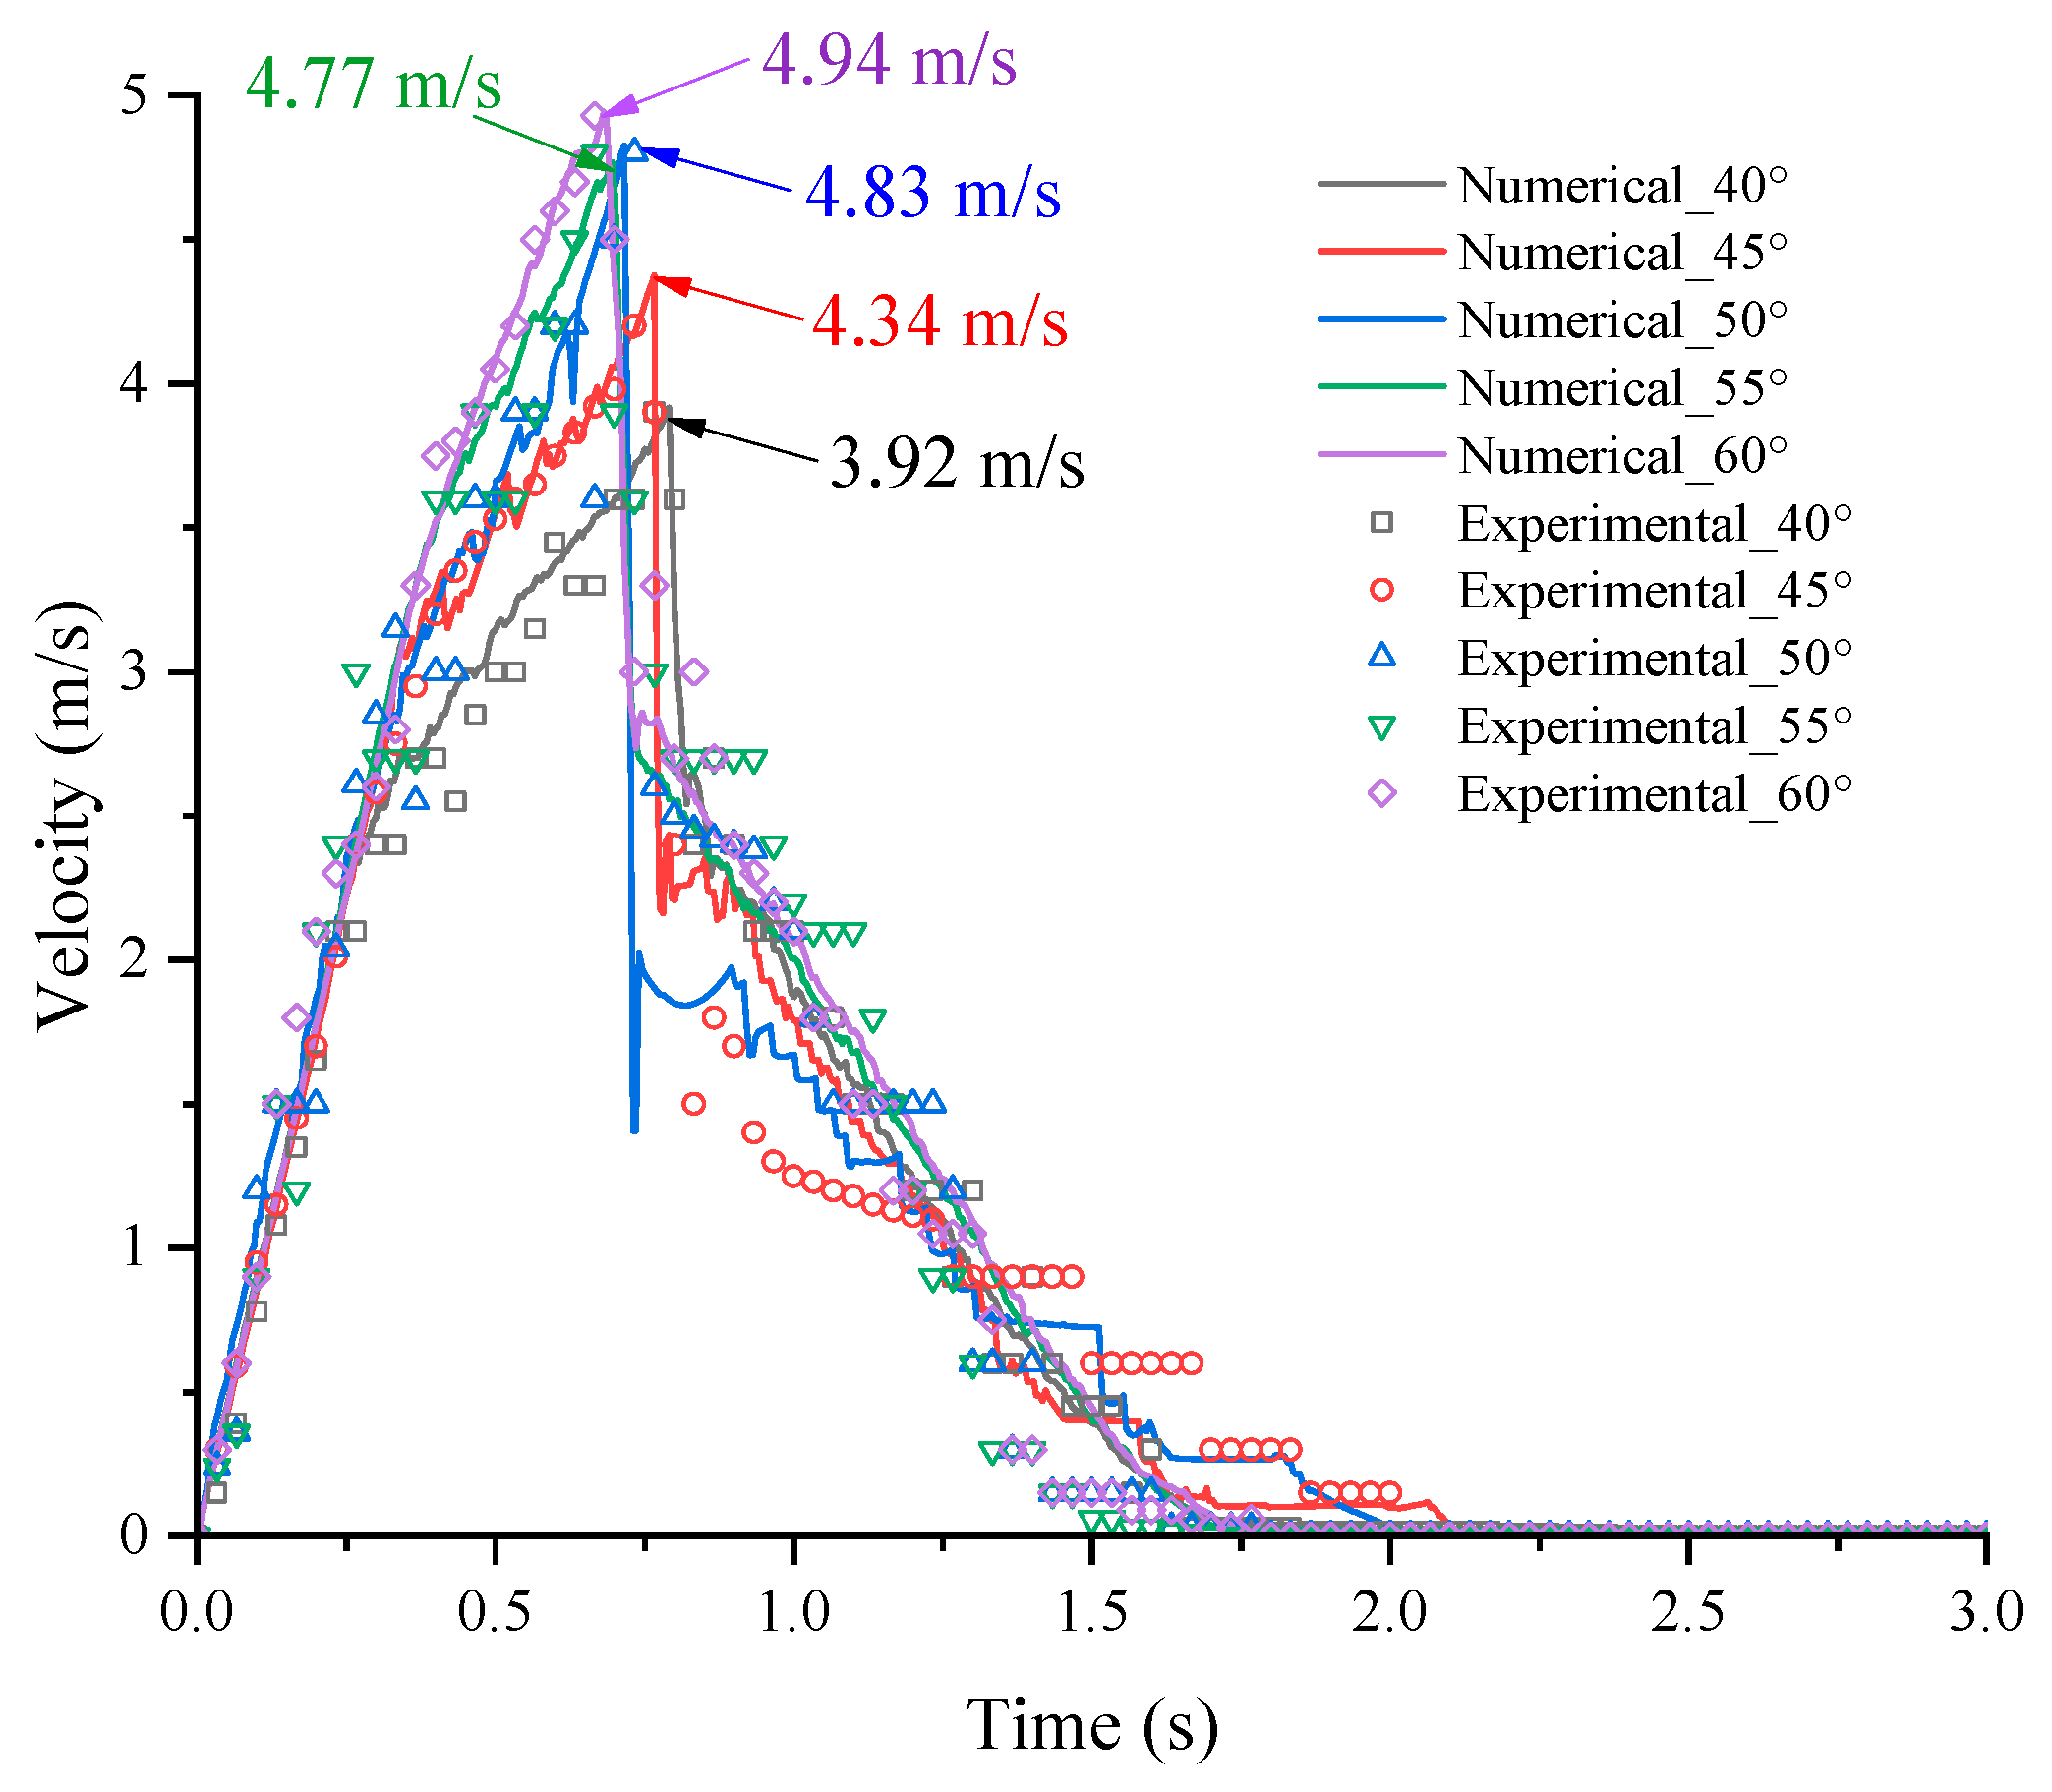
- (1)
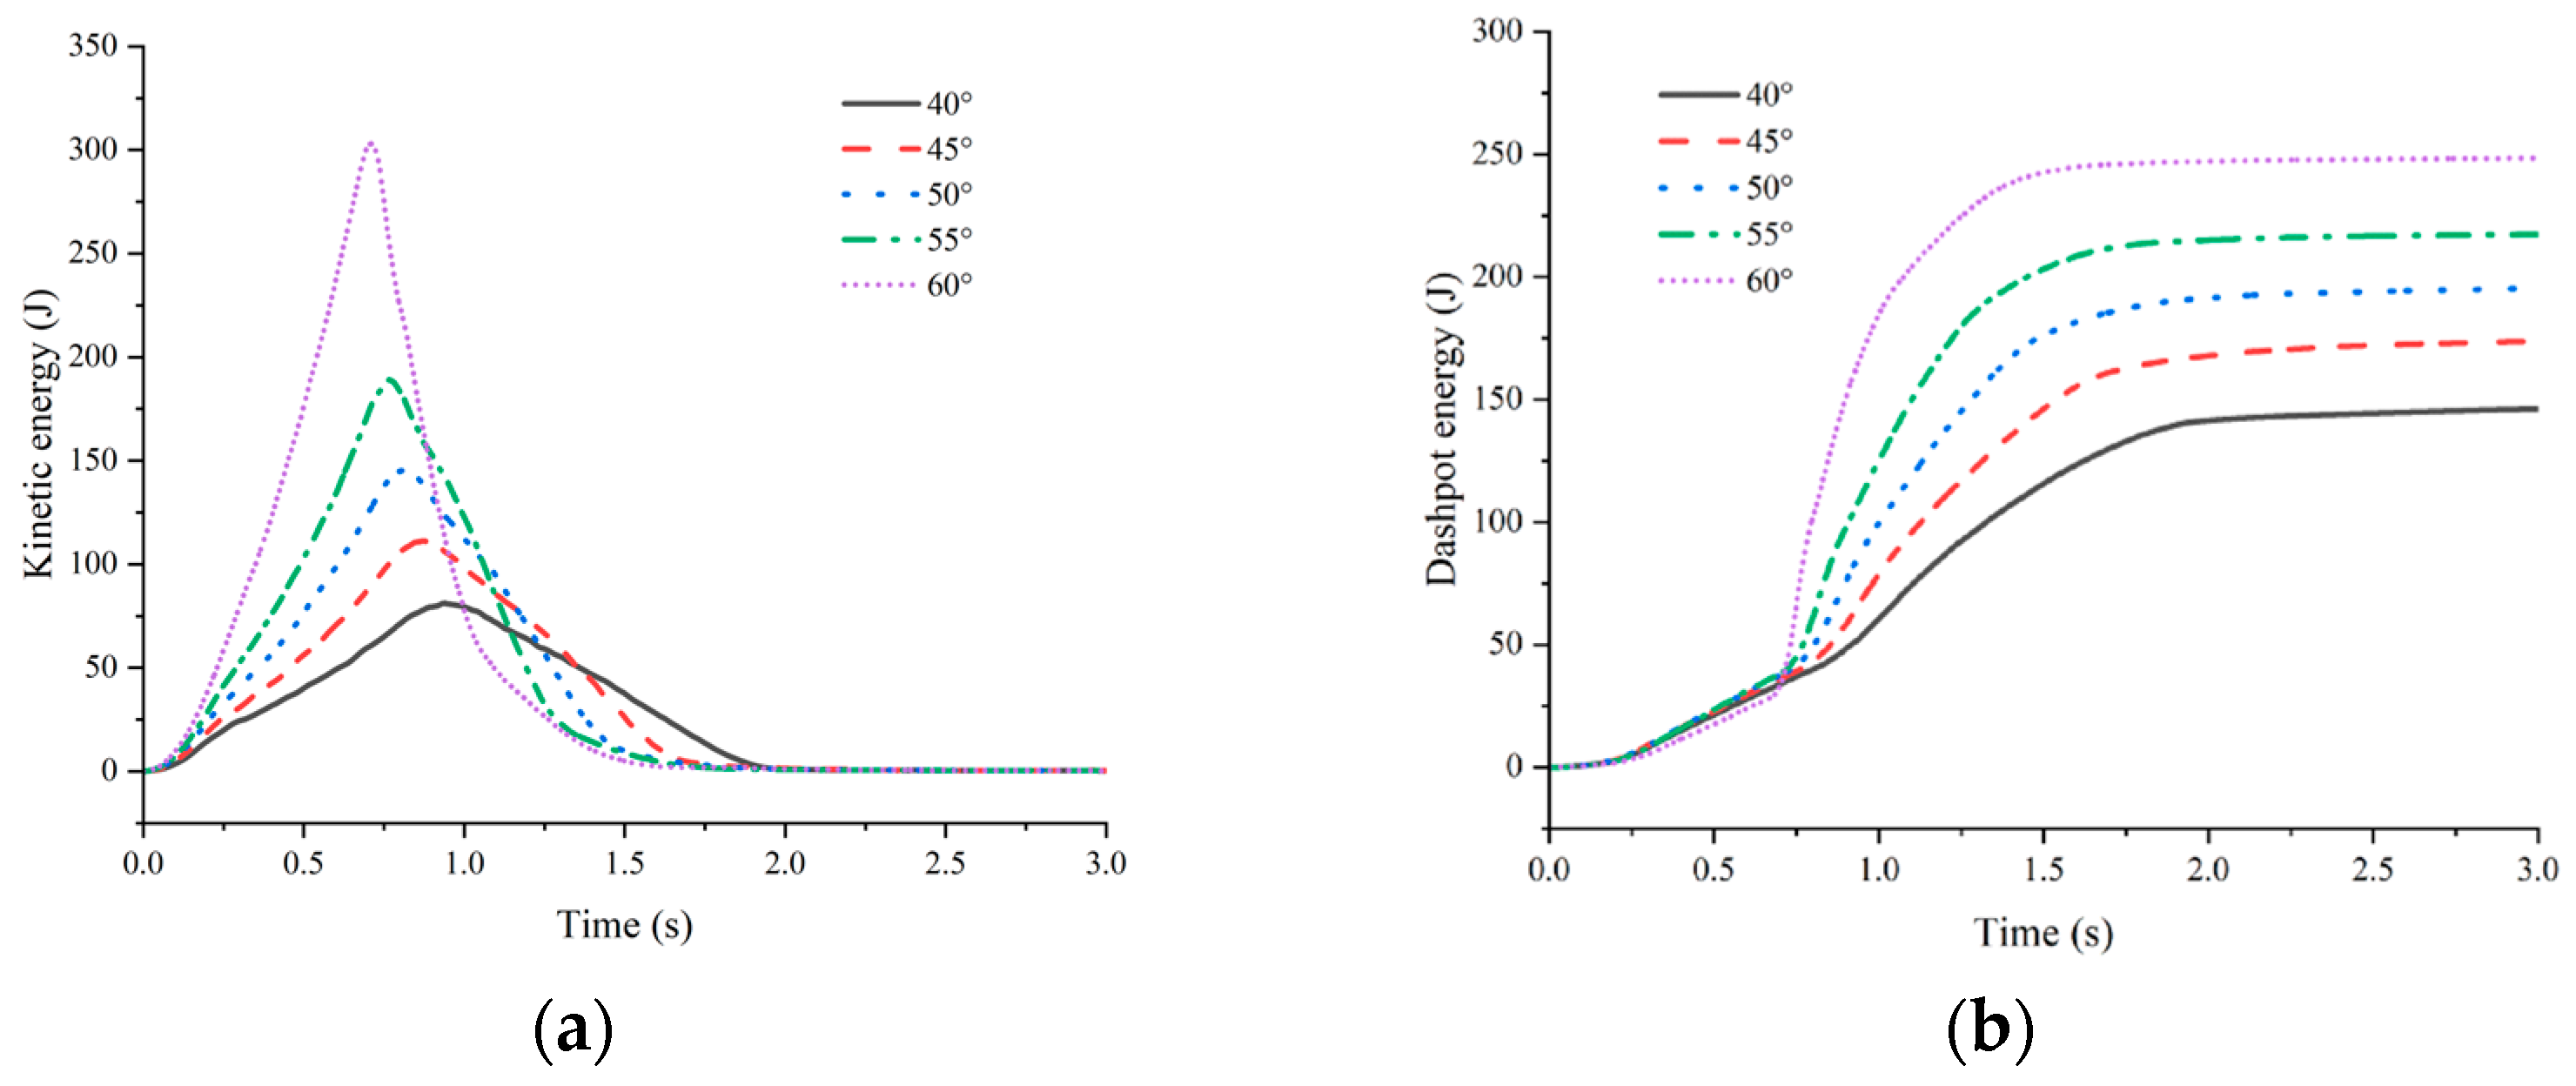
- As the slope angle increases, both the peak velocity and the impact force of the granular flow on the shed tunnel increase significantly. Increasing the slope angle from 40° to 60°, the peak velocity rises from 3.92 m/s to 4.94 m/s, indicating an increment of about 25%. Concurrently, the impact force also amplifies by 2–3 times. Additionally, an increase in slope angle leads to a rapid escalation in the kinetic energy of the granular flow. The peak kinetic energy at 60° is 2.74 times greater than that at 40°. A larger slope angle results in higher dashpot energy, indicating more intense collisions between particles and the shed tunnel.
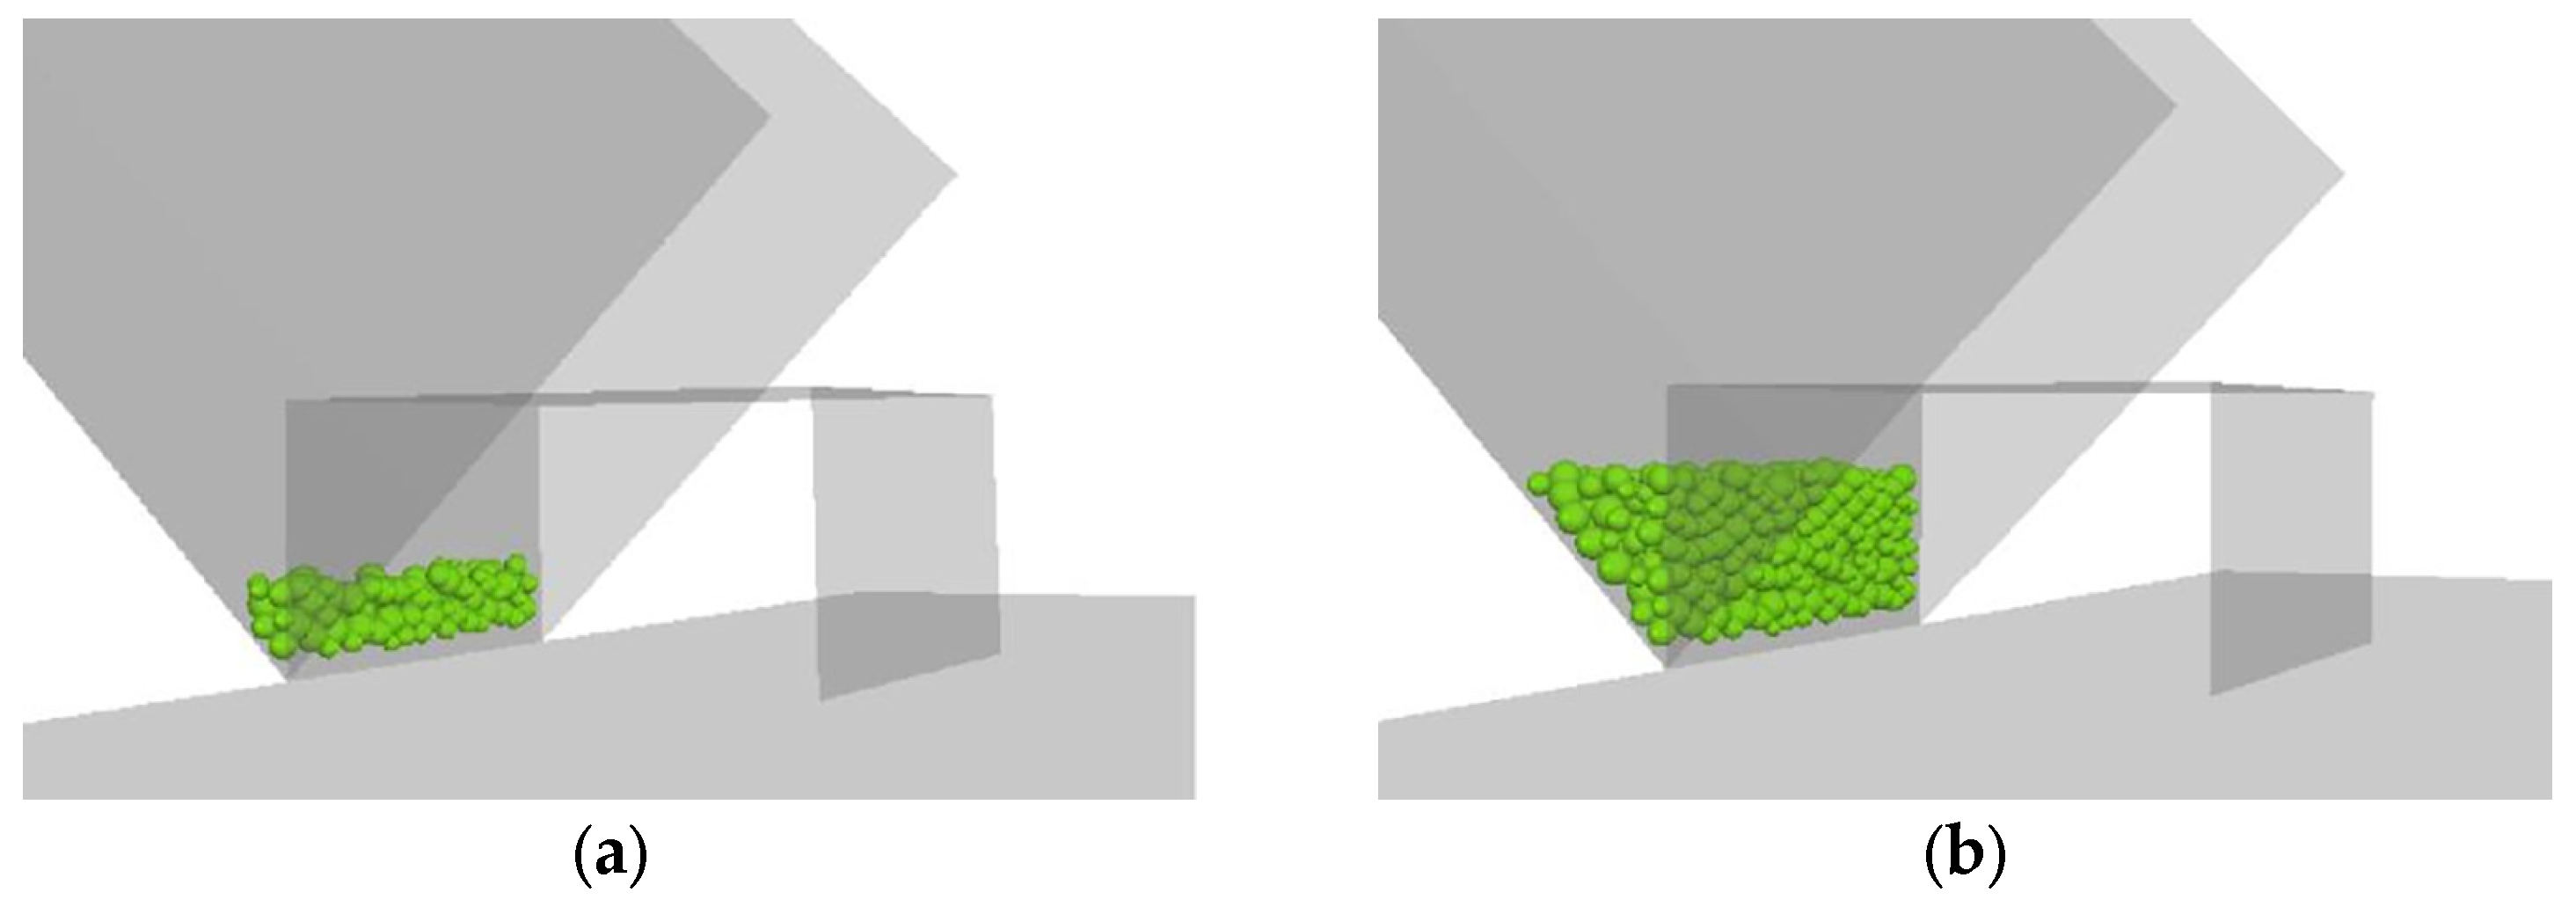
- (2)
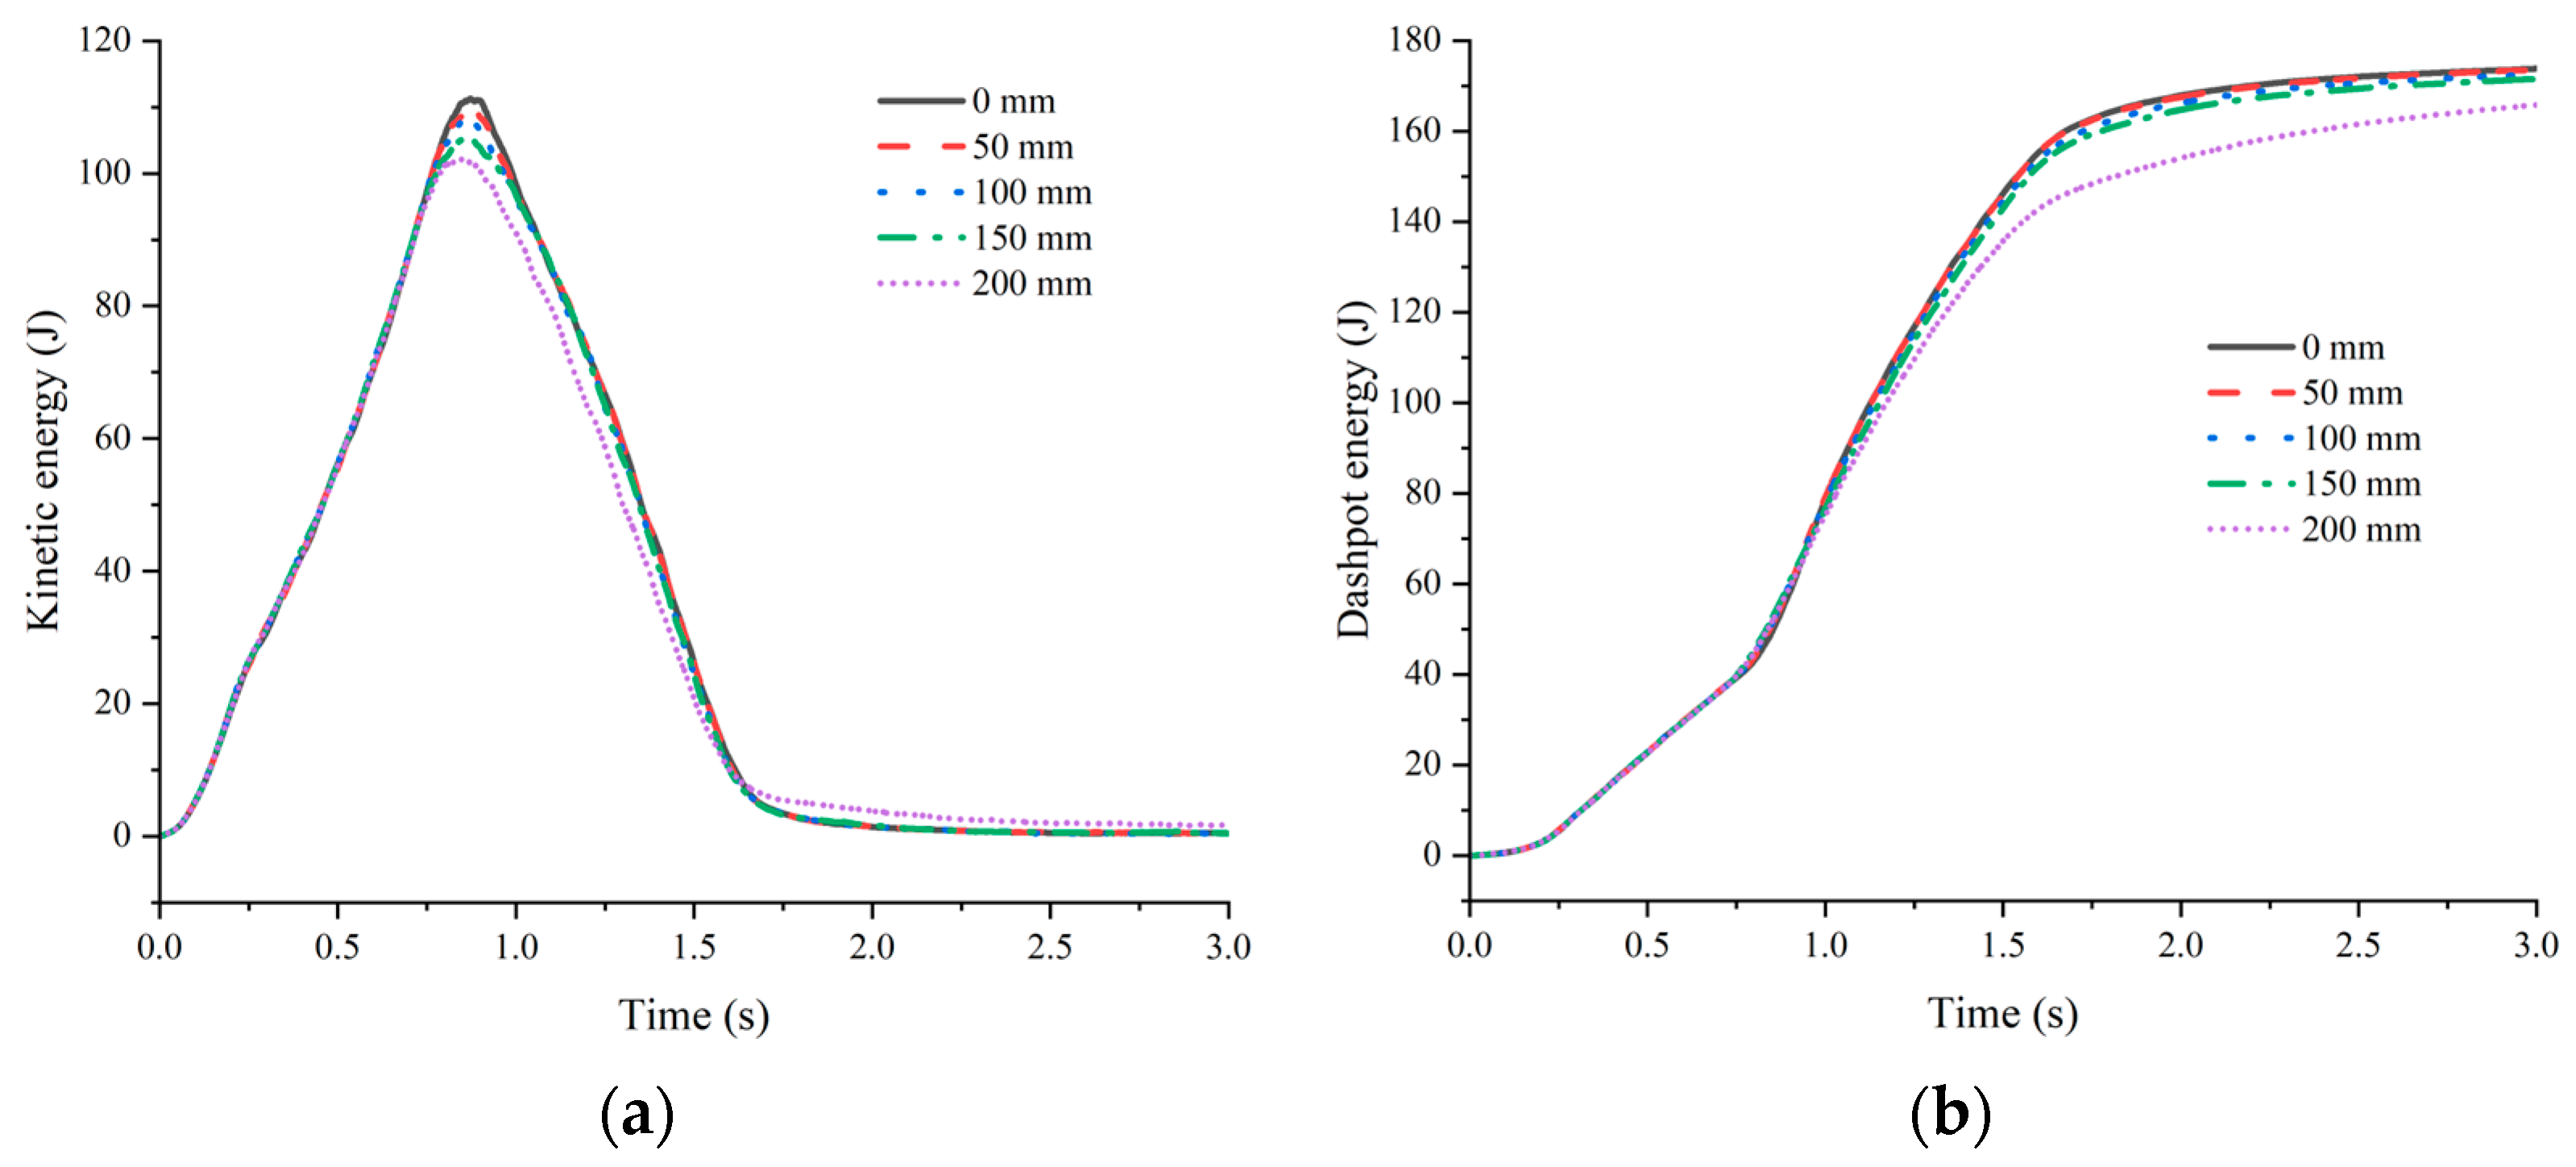
- The thickness of the cushion layer directly affects the buffering effect. The augmentation of the cushion layer thickness enhances resistance and damping, resulting in a significant reduction in the kinetic energy of the granular flow and reducing the interaction between the granular flow and the shed tunnel. This helps to reduce the impact of granular flow on the front face of the shed tunnel, thus protecting its structural integrity. When the cushion layer thickness reaches 200 mm, the peak and residual values of the impact force are reduced by 50.7% and 50.0%, respectively, compared to the case without a cushion layer. When the cushion layer covers the top of the shed tunnel, the buffering effect of the cushion layer will be better.
- (3)
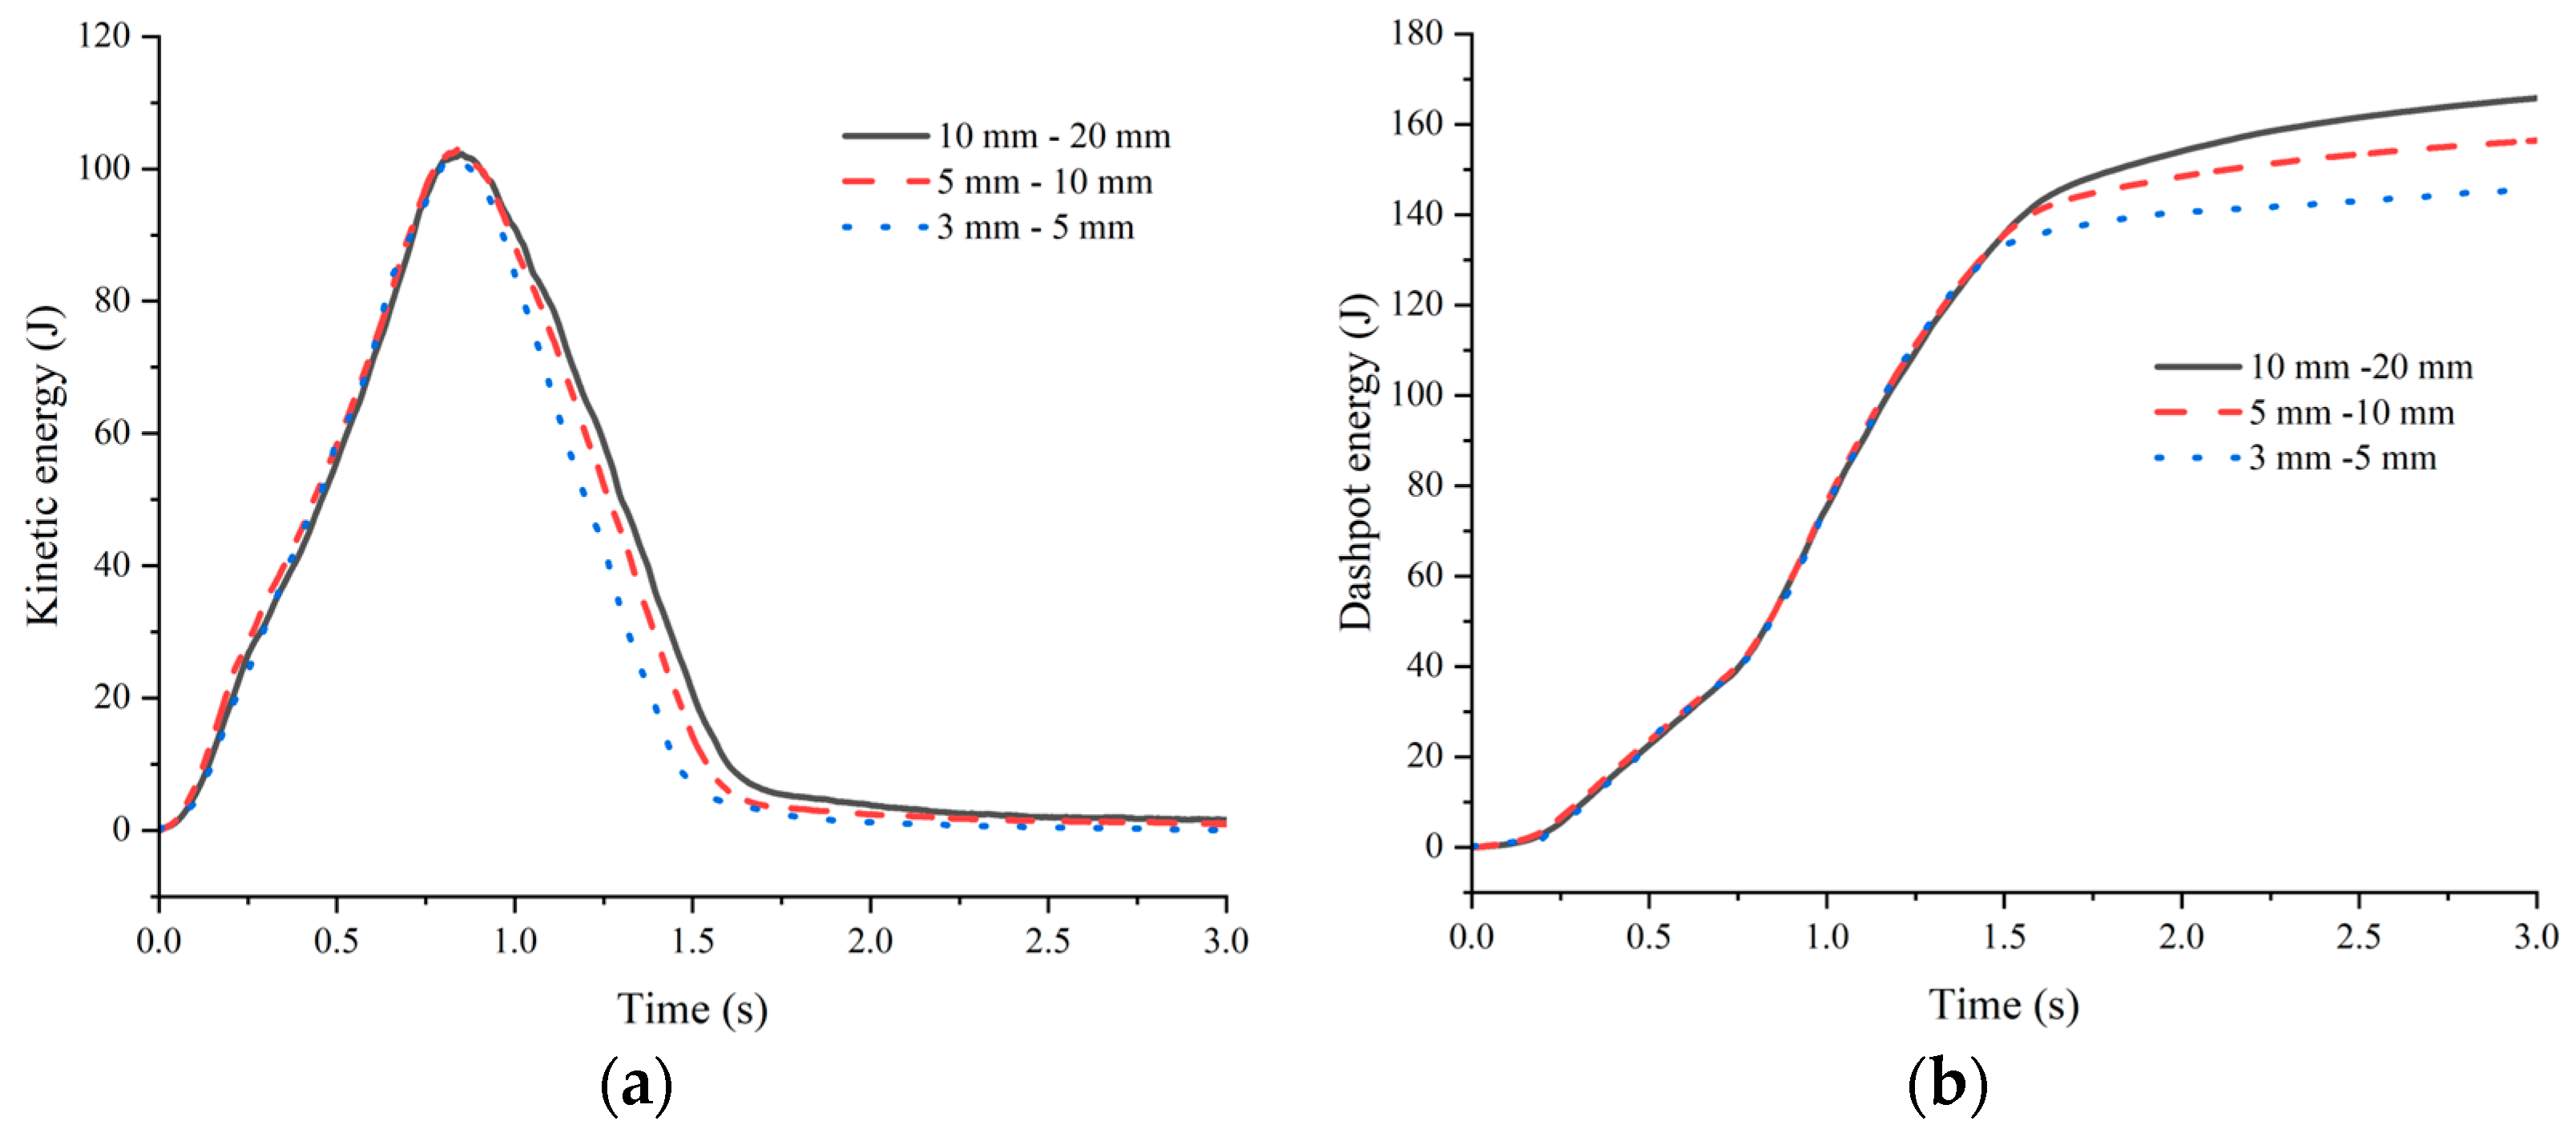
- A smaller particle size of the cushion layer effectively reduces the impact force of the granular flow on the shed tunnel structure. For a cushion layer with particle sizes ranging from 3 mm to 5 mm, the peak and residual values of the impact force on the front wall of the shed tunnel are reduced by 22.5% and 18.0%, respectively, compared to the case with particle sizes ranging from 10 mm to 20 mm. The smaller particle size of the cushion layer generates more friction with the granular flow, resulting in a significant change in its surface morphology, which can effectively reduce kinetic energy and provide stronger buffering effects in the later stage of movement.
Author Contributions
Funding
Institutional Review Board Statement
Informed Consent Statement
Data Availability Statement
Conflicts of Interest
References
- Hungr, O.; Leroueil, S.; Picarelli, L. The varnes classification of landslide types, an update. Landslides 2014, 11, 167–194. [Google Scholar] [CrossRef]
- Zhang, Y.; Guo, C.; Lan, H.; Yao, X. Reactivation mechanism of ancient giant landslides in the tectonically active zone: A case study in southwest China. Environ. Earth Sci. 2015, 74, 1719–1729. [Google Scholar] [CrossRef]
- Li, P.U.; Wang, J.; Hu, K.; Shen, F. Effects of bed longitudinal inflexion and sediment porosity on basal entrainment mechanism: Insights from laboratory debris flows. Landslides 2021, 18, 3041–3062. [Google Scholar] [CrossRef]
- Ijaz, N.; Ye, W.M.; Rehman, Z.U.; Dai, F.C.; Ijaz, Z. Numerical study on stability of lignosulphonate-based stabilized surficial layer of unsaturated expansive soil slope considering hydro-mechanical effect. Transp. Geotech. 2022, 32, 100697. [Google Scholar] [CrossRef]
- Mahmood, K.; Rehman, Z.U.; Farooq, K.; Memon, S.A. One dimensional equivalent linear ground response analysis—A case study of collapsed Margalla Tower in Islamabad during 2005 Muzaffarabad Earthquake. J. Appl. Geophys. 2016, 130, 110–117. [Google Scholar] [CrossRef]
- Cruden, D.M.; Hungr, O. The debris of the Frank Slide and theories of rockslide–avalanche mobility. Can. J. Earth Sci. 1986, 23, 425–432. [Google Scholar] [CrossRef]
- Brideau, M.A.; Pedrazzini, A.; Stead, D.; Froese, C.; Jaboyedoff, M.; van Zeyl, D. Three-dimensional slope stability analysis of south peak, Crowsnest pass, Alberta, Canada. Landslides 2011, 8, 139–158. [Google Scholar] [CrossRef]
- Wang, F.W.; Sassa, K. Landslide simulation by a geotechnical model combined with a model for apparent friction change. Phys. Chem. Earth Parts A/B/C 2010, 35, 149–161. [Google Scholar] [CrossRef]
- Boon, C.W.; Houlsby, G.T.; Utili, S. New insights into the 1963 Vajont slide using 2D and 3D distinct-element method analyses. Géotechnique 2010, 64, 800–816. [Google Scholar] [CrossRef]
- Wolter, A.; Stead, D.; Clague, J.J. A morphologic characterization of the 1963 Vajoint Slide, Italy, using long-range terrestrial photogrammetry. Geomorphology 2014, 206, 147–164. [Google Scholar] [CrossRef]
- Kojan, E. Mayunmarca rockslide and debris flow, Peru. Rockslides Avalanches 1978, 14, 315–361. [Google Scholar] [CrossRef]
- Delaney, K.B.; Evans, S.G. The 2000 Yigong landslide (Tibetan Plateau), rockslide-dammed lake and outburst flood: Review, remote sensing analysis, and process modelling. Geomorphology 2015, 246, 377–393. [Google Scholar] [CrossRef]
- Zhou, J.W.; Cui, P.; Hao, M.H. Comprehensive analyses of the initiation and entrainment processes of the 2000 Yigong catastrophic landslide in Tibet, China. Landslides 2016, 13, 39–54. [Google Scholar] [CrossRef]
- Xu, Q.; Shang, Y.; van Asch, T.; Wang, S.; Zhang, Z.; Dong, X. Observations from the large, rapid Yigong rock slide–debris avalanche, southeast Tibet. Can. Geotech. J. 2012, 49, 589–606. [Google Scholar] [CrossRef]
- Yin, Y.P. Researches on the geo-hazards triggered by Wenchuan earthquake, Sichuan. J. Eng. Geol. 2008, 16, 433–444. [Google Scholar]
- Xu, C.; Dai, F.C.; Xu, X.W. Wenchuan earthquake-induced landslides: An overview. Geol. Rev. 2010, 56, 860–874. [Google Scholar]
- Fan, X.M.; van Westen, C.J.; Xu, Q.; Tolga, G.; Dai, F.C. Analysis of landslide dams induced by the 2008 Wenchuan earthquake. J. Asian Earth Sci. 2012, 57, 25–37. [Google Scholar] [CrossRef]
- Mather, A.E.; Hartley, A.J.; Griffiths, J.S. The giant coastal landslides of Northern Chile: Tectonic and climate interactions on a classic convergent plate margin. Earth Planet. Sci. Lett. 2014, 388, 249–256. [Google Scholar] [CrossRef]
- Naito, N.; Maeda, K.; Konno, H.; Ushiwatari, Y.; Suzuki, K.; Kawase, R. Rockfall impacts on sand cushions with different soil mechanical characteristics using discrete element method. Soils Found. 2020, 60, 384–397. [Google Scholar] [CrossRef]
- Bhatti, A.Q. Falling-weight impact response for prototype RC type rock-shed with sand cushion. Mater. Struct. 2015, 48, 3367–3375. [Google Scholar] [CrossRef]
- He, S.M.; Shen, J.; Wu, Y. Rock shed dynamic response to impact of rock-fall. Rock Soil Mech. 2011, 32, 781–788. [Google Scholar]
- Gottardi, G.; Govoni, L. Full-scale modelling of falling rock protection barriers. Rock Mech. Rock Eng. 2010, 43, 261–274. [Google Scholar] [CrossRef]
- Chen, T.J.; Xiang, X.; Zhang, G.C. Hertz theory based study on punching characteristics of rockfall impacting on shed-tunnel structure. J. Eng. Geol. 2023, 31, 199–206. [Google Scholar]
- Wang, L.F.; Liu, L.; Tang, F.; Tang, H.M. Study on impact force of rockfall impact experiment on shed tunnel. J. Disaster Prev. Mitig. Eng. 2018, 38, 973–979. [Google Scholar]
- Wang, H.; Guo, C.; Wang, F.; Ni, P.; Sun, W. Peridynamics simulation of structural damage characteristics in rock sheds under rockfall impact. Comput. Geotech. 2022, 143, 104625. [Google Scholar] [CrossRef]
- Song, Y.; Jiang, Y.J.; Wang, M. Buffering effect of gravel cushion layer on the impact of dry granular flow against a rock shed. Chin. J. Rock Mech. Eng. 2018, 37, 2359–2369. [Google Scholar]
- Jiang, Y.J.; Song, Y.; Ning, P.; Wang, Z.Z. Research on the buffering measure of rock shed against the impact of dry granular flow with concern of structure damage. Landslides 2022, 19, 2605–2627. [Google Scholar] [CrossRef]
- Liu, C.; Yu, Z.; Zhao, S. Consideration of maximum impact force design for a rock shed against dry granular flow. Eur. J. Environ. Civ. Eng. 2022, 26, 2963–2984. [Google Scholar] [CrossRef]
- Jiang, Y.J.; Wang, Z.Z.; Song, Y.; Xiao, S.Y. Cushion layer effect on the impact of a dry granular flow against a curved rock shed. Rock Mech. Rock Eng. 2018, 51, 2191–2205. [Google Scholar] [CrossRef]
- Khasraghy, S.G.; Kishi, N.; Vogel, T. Numerical Simulation of Consecutive Rockfall Impacts on Reinforced Concrete Slabs. In IABSE Symposium Bangkok 2009. Sustainable Infrastructure. Environment Friendly, Safe and Resource Efficient International Association for Bridge and Structural Engineering Chulalongkorn University, Thailand Asian Institute of Technology; National Academy of Sciences: Washington, DC, USA, 2009. [Google Scholar]
- Kishi, N.; Okada, S.Y.; Kon-No, H. Numerical impact response analysis of rockfall protection galleries. Struct. Eng. Int. 2009, 19, 313–320. [Google Scholar] [CrossRef]


| Parameters | Values |
|---|---|
| Density, ρ (kg/m3) | 2650 |
| Bond effective modulus of ball–ball, E (Pa) | 2.4 × 10⁶ |
| Bond effective modulus of ball–facet, E′ (Pa) | 1.0 × 10⁵ |
| Bond normal-to-shear stiffness ratio, kn/ks (/) | 1.00 |
| Particle friction coefficient, μp (/) | 0.50 |
| Wall friction coefficient, μw (/) | 0.38 |
| Particle diameter, d (mm) | 10.0–20.0 |
Disclaimer/Publisher’s Note: The statements, opinions and data contained in all publications are solely those of the individual author(s) and contributor(s) and not of MDPI and/or the editor(s). MDPI and/or the editor(s) disclaim responsibility for any injury to people or property resulting from any ideas, methods, instructions or products referred to in the content. |
© 2024 by the authors. Licensee MDPI, Basel, Switzerland. This article is an open access article distributed under the terms and conditions of the Creative Commons Attribution (CC BY) license (https://creativecommons.org/licenses/by/4.0/).
Share and Cite
Wei, L.; Wang, J.; Dai, Z. Granular Flow Impact on Shed Tunnels and the Buffering Effect of Cushion Layers. Appl. Sci. 2024, 14, 3409. https://doi.org/10.3390/app14083409
Wei L, Wang J, Dai Z. Granular Flow Impact on Shed Tunnels and the Buffering Effect of Cushion Layers. Applied Sciences. 2024; 14(8):3409. https://doi.org/10.3390/app14083409
Chicago/Turabian StyleWei, Li, Jianghong Wang, and Zili Dai. 2024. "Granular Flow Impact on Shed Tunnels and the Buffering Effect of Cushion Layers" Applied Sciences 14, no. 8: 3409. https://doi.org/10.3390/app14083409
APA StyleWei, L., Wang, J., & Dai, Z. (2024). Granular Flow Impact on Shed Tunnels and the Buffering Effect of Cushion Layers. Applied Sciences, 14(8), 3409. https://doi.org/10.3390/app14083409