Article

Cylindrical Steel Tanks Subjected to Long-Duration and High-Pressure Triangular Blast Load: Current Practice and a Numerical Case Study

1
Department Safety, Security and Resilience of Technical Systems, Fraunhofer-Institute for High-Speed Dynamics, Ernst-Mach-Institut, EMI, Am Klingelberg 1, 79588 Efringen-Kirchen, Germany
2
Linde GmbH, Engineering Division, Dr.-Carl-von-Linde-Strasse 6-14, 82049 Pullach, Germany
*
Author to whom correspondence should be addressed.
Appl. Sci. 2024, 14(8), 3465; https://doi.org/10.3390/app14083465
Submission received: 8 March 2024 / Revised: 5 April 2024 / Accepted: 16 April 2024 / Published: 19 April 2024
(This article belongs to the Special Issue Recent Advances in the Effect of Blast Loads on Structures)

Abstract

:
This paper presents an investigation into the design of ammonia tanks for long-duration and high-pressure blast loads. The focus is on cylindrical steel tanks that apply as outer pressure-tight containers for double-walled tanks storing refrigerated liquefied gases. Based on limited empirical data, it is known in the tank industry that these tanks can withstand an explosion pressure up to a peak overpressure of approximately 10 kPa and 100 ms positive load duration. However, there is a growing need to design tanks for higher peak overpressures in order to establish a higher safety standard and accommodate unforeseen future requirements. This paper explores the concept of adapting established steel tank designs to handle high-pressure and long-duration overpressure due to blast events. Numerical analysis is conducted on a representative steel tank geometry subjected to a triangular blast load of 30 kPa with a 300 ms positive load duration. Various load application and calculation options are analyzed numerically. Considering the challenging nature of analyzing tank structures under blast load, the paper addresses controversial aspects discussed in the literature and presents a suitable analysis concept for a deflagration blast scenario for cylindrical tanks. The results provide insights into the expected structural behavior of the tank under high-pressure and long-duration overpressure. The main finding is that the calculation method developed in this study demonstrates the feasibility of utilizing steel tanks in scenarios involving long-duration and high-pressure blast loads. Furthermore, the paper provides recommendations to guide future studies in this area. The findings have implications for the design and construction of tanks in critical infrastructure and offer valuable insights for engineers and researchers in this field, improving safety standards and ensuring adaptability to future utilization concepts.

1. Introduction

Renewable energies are of the utmost importance in tackling the global energy challenges the world is facing today. The transition towards clean and sustainable energy sources is essential to mitigate climate change, reduce greenhouse gas emissions, and secure a sustainable future for generations to come. While the establishment of LNG (liquefied natural gas) capacities, including LNG terminals, has been instrumental in diversifying energy sources and reducing reliance on fossil fuels, it is crucial to acknowledge that LNG cannot be considered as climate neutral. Although its life cycle emits fewer greenhouse gases compared to traditional fossil fuels, LNG still contributes to carbon emissions. As a result, the focus is shifting towards alternative energy sources that have the potential to be truly climate neutral. Hydrogen and ammonia are emerging as promising candidates. In particular, ammonia has gained considerable attention as a future energy source and hydrogen carrier due to its high energy density, ease of storage, and potential for zero-carbon emissions [1]. Ammonia can be produced using renewable energy sources such as wind, solar, or hydroelectric power, making it an attractive option for achieving a sustainable energy mix. Moreover, ammonia can be used as a fuel, providing opportunities for clean energy applications in transportation, power generation, and other sectors. Currently, in Europe, ammonia import terminals are planned, for example, in Rotterdam [2] and Brunsbüttel [3]. Furthermore, the planned LNG terminal in Stade shall be designed and implemented in a way that is ammonia-ready, allowing for a modular approach to accommodate the market ramp-up of hydrogen [4]. However, there are still challenges and open questions related to the use of ammonia as an energy source. For example, the infrastructure for the production, transportation, storage, and utilization of ammonia needs to be developed. Safety aspects particularly in terms of storage must be considered as ammonia is highly toxic.
Ammonia storage tanks can be designed as single, double, or full containment tanks. Well-known tank design standards are API 625 Standard [5] in combination with API 620 Standard [6], Annex R, and EN 14620 Part 1 to 5 [7,8,9,10,11]. It should be mentioned that European standardization committees are already developing a new EN 14620 Part 7 that will specifically address requirements for ammonia storage tanks [12]. In addition to such tank design standards, national or local requirements are frequently applying for the safe handling and storage of ammonia. One example of such national regulations is the PGS-12 regulation [13], newly developed by the Dutch government. The PGS-12 [13] will define minimum safety standards such as defined impact loads of an explosion or flying object. In addition, Belgium has implemented a directive [14] that also specifies minimum requirements. Regarding the design, the tanks typically consist of a supporting structure to securely hold the container, an insulation layer to control temperature, and an external protective layer. Insulation is particularly important to minimize the loss of ammonia through evaporation. The specific choice of tank type depends on various factors, including location, safety assessment, regulatory requirements, and risk level. A safe and economic design for such tank structures can be provided by the cylindrical double wall steel tank: the inner tank holds the liquid ammonia and acts as the primary container. The outer tank as the secondary container provides an extra layer of protection in case of any inner tank failure, containing the ammonia and holding the vapor pressure. The outer tank is designed to be structurally robust and capable of withstanding inner pressure and external forces, such as blast overpressure.
For cylindrical steel tanks, explosion pressure safety—provided it has been considered in the design—for a peak overpressure of approximately 10 kPa is recognized as common value by the industry. Clancey [15] gives overpressure values from 14 to 20 kPa as estimation for rupture of oil storage tanks. The TNO Green Book [16] assumes the roof of a storage tank will collapse at 7 kPa, while cracking in empty oil tanks occurs at around 20 to 30 kPa. Furthermore, in Chapter 2, Section 7.2.2, of [16], a positive load duration equal to 100 ms is adopted for blast studies in industrial facilities. Based on these data, steel tanks can be accepted as a reliable containment system against a blast load of 10 kPa overpressure with a positive load duration of 100 ms. However, tank designers should consider site- and project-specific requirements for verification of the blast resistance of the tank structure.
In future planning processes, the design of ammonia storage tanks for significantly higher peak overpressures will become important. There are two main reasons for this: firstly, the design of tanks for high blast overpressure is intended to establish a higher safety standard. This is particularly important because tank structures are components of critical infrastructure. A failure not only affects the tank and its immediate production environment but also often has far-reaching consequences. A higher safety standard in the design, especially against accidental loads such as explosion pressure, can lead to lower failure probabilities. Secondly, the design of a tank for today’s requirements should not result in any limitations for future projects with requirements that are not yet foreseeable. In the ever-faster changing world, it is also necessary to design industrial sites and in particular receiving terminals for future changing utilization concepts.
To date, prestressed concrete external tanks have usually been used when a risk of high explosion pressure loads exists. Nevertheless, the construction of concrete tanks, especially as an outer shell with an internal steel tank, is more elaborate than the installation of steel tanks. The authors of [17] estimate that utilizing a double steel full containment tank instead of a full containment tank with a pre-stressed concrete secondary liquid container may result in a potential reduction in overall tank system cost ranging from 20% to 40%. However, it is important to note that the actual cost savings will vary depending on factors such as the tank size and geographical location. In addition to considering construction costs, it is also important to assess the long-term maintenance costs associated with different types of tank systems. Maintaining pre-stressed concrete structures is more complex compared to steel structures. Regular inspections, specialized repair techniques, and environmental considerations are necessary for concrete structures. The expertise and training required for pre-stressed concrete maintenance are higher compared to steel structures. While steel structures also require maintenance, it is generally less intricate and maintenance costs are therefore lower. It is generally known that cement production constitutes a significant share of the total CO2 emissions worldwide. From this perspective, steel tanks may be interesting as well looking at the latest developments in climate-neutral steel production.
The aim of this publication is to address the following two issues in the context of steel tanks: (i) the feasibility of utilizing steel tanks in scenarios involving long-duration and high-pressure blast loads and (ii) introduction of an appropriate methodology for the analysis of blast-loaded steel tanks. Therefore, this paper presents the results of a study that investigates the potential for effectively adapting existing steel tank designs suitable for ammonia storage to withstand high explosion pressure loads over a prolonged duration. A representative steel tank geometry of an ammonia tank was numerically investigated for a peak overpressure of 30 kPa and 300 ms positive phase load duration. The load scenario was selected based on its inclusion as a requirement for safe tank design in both the Belgian and Dutch guidelines [13,14]. It can be anticipated that these requirements will be widely adopted as a global standard in the future.
Since the investigation of tank structures under detonation load is still a challenging topic and not subject of regular engineering work, a suitable analysis concept is presented considering the special aspect of a triangular shape of the pressure–time curve. Furthermore, some aspects in the analysis of blast-loaded tanks—such as load application and distribution around the tank’s circumference and onto the roof as well as the handling of blast load due to vapor cloud explosion—are controversial; these aspects will be discussed in a short literature review. These problems will be presented, and recommendations will be given. Finally, an overview of the performed simulations with different levels of computational precision and the corresponding results is given. With the proposed analysis concept for ammonia tanks—but also for cylindrical (LNG) tanks made of steel in general—an evaluation of the expected structural behavior at high-pressure and with long-duration blast loads is provided.

2. Simulation of Blast Events

The structural response to blast loads can be analyzed in several ways. Hydrocodes offer the possibility to perform complex computer fluid dynamic (CFD) analyses where the blast wave and the structure interact directly by calculating the blast wave propagation and the structural response coupled in a global computational model. However, such procedures are very computationally (time) intensive. Next to a coupled CFD, simplified procedures are suitable. These methods vary from the decoupled dynamic analysis of the pressure propagation and the structural response in two different calculation models to simplified dynamic methods that only calculate the structural response using a semi-analytically determined blast pressure load. The latter is a method that is frequently adopted in the blast analysis of building structures. Here, the pre-calculated blast pressure load is applied to the simulation model as a load time history without considering the effect of the structural deformation on the pressure propagation and distribution. Then, the structural response is determined. Due to the very short load duration of usually a few milliseconds, hydrocodes can also be efficiently employed for such simplified methods. However, static methods are used as well, in which the dynamic characteristics of the load and structural response are taken into account in a highly simplified manner using so-called dynamic increase factors.
In this research, a simplified dynamic approach is applied with the hydrocode LS-DYNA [18]. The reason for choosing a simplified method and not the fully coupled CFD analysis is that this method is reproducible in practical engineering applications, and it is relatively easy to implement. Furthermore, the focus is also on finding an answer to the question of whether steel tanks are generally suitable for sustaining high-pressure and long-duration blast loads. Of course, this requires an adequate application of the pressure load, but the focus is less on blast wave propagation and more on the structural response. In addition, in chemical industry plants or LNG process unit design, an explosion pressure load is usually specified as a pressure–time history and less via a reacting quantity of explosive, whose pressure propagation must first be determined using CFD.
The key challenge of the simplified dynamic calculation approach is to apply the adequate blast load to the overall tank structure as well as to capture the material behavior in a proper way. Finally, a static approach is used to evaluate the most suitable analysis method for tank design practice.

2.1. Characteristics of Blast Load and Pressure Wave Propagation

Blast loads are generally defined by the peak overpressure, the positive phase duration, and the shape of the pressure versus time curve. Although ammonia process units and import terminals with storage tanks for ammonia are already in operation [19], there are no specific codes or industry standards for specifying the blast load for ammonia tank design. A look at LNG process units or even the entire chemical or petroleum industry as well as storage areas shows the same normative regulatory gap. Only guidelines such as the TNO Green Book [16] contain specifications for industrial buildings, for example. The definition of the applicable blast load is typically derived from a project specific risk assessment that considers explosion sources within and outside the battery limit of the new facility. Since ammonia has a relatively high minimum ignition temperature, the risk of an explosion within an ammonia plant is considered very low. However, due to the high toxicity of the ammonia product and the circumstance that new ammonia projects are approaching storage sizes in the range of world-scale LNG facilities, authorities intend to define minimum blast and impact loads to be considered by design [13,14]. The minimum blast load requirements only specify the peak overpressure and positive phase duration. But the information regarding the shape of the time curve or the cause of the explosion is missing, which is necessary for accurately specifying the overpressure time history.
When discussing accidents caused by explosions in tank farms, the Buncefield event is often the first to come to mind. In 2005, a vapor cloud explosion occurred at Buncefield Oil Storage Depot, UK, generating significant blast pressures, which is reviewed, e.g., in [20]. Further reviews of accidental explosions in tank storage facilities can be found in the literature. The authors of [21] studied 242 accidents of storage tanks that occurred in industrial facilities. Their finding is that most of those accidents would have been avoided if good engineering had been practiced. A further summary on explosion events in a tank farm was carried out by Taveau [22]. This article gives an overview of accident frequencies of atmospheric storage tanks and past accidents described in the open literature to show the possible accidental sequences, underline the most frequent causes involved in explosions of atmospheric storage tank, and highlight the potential consequences of such accidents [22]. In general, within the wide range of accidental explosion types, vapor cloud explosions are a major concern in the petrochemical and petroleum industry [20,23,24,25,26]. The same applies to LNG process units [27,28,29] and can therefore be adopted to ammonia process units as the main cause for the blast overpressure analysis and design. Furthermore, there is a growing threat of terrorist attacks targeting tank structures, which are considered critical infrastructures. These attacks typically involve the use of explosive materials like TNT to cause significant damage [30,31,32]. While the latter event is characterized by an instantaneous increase in pressure and is referred to as detonation with a propagation velocity of the shock wave above the speed of sound, an explosive event due to a vapor cloud explosion can show different characteristics. An extremely energetic vapor cloud explosion can, in the same way, propagate in the form of shock waves in the near and far field [23,33]. But most vapor cloud explosions are characterized by slow deflagration and propagate in the form of pressure waves that usually travel below the speed of sound, which is slower in comparison to shock waves. In special cases, it is also possible that a pressure wave caused by a vapor cloud explosion transfers while propagating to a shock wave, the so-called deflagration-to-detonation transition (DDT) [23,33,34]. However, the possibility of DDTs is lower than the one of deflagrations.
Shock waves differ from pressure waves by the higher propagation velocity and considerably higher peak overpressure. In addition, the duration of the positive and negative phase is much shorter than that of pressure waves. In this contribution, an explosion blast load with high peak pressure and long duration shall be analyzed. A high peak pressure tends to correspond to a detonation scenario with a shock wave loading. However, the long pressure duration corresponds more to a slow deflagration scenario, which also matches the basic hazard in an ammonia plant. Considering the order of magnitude of pressure and duration (30 kPa and 300 ms proposed in [13,14]), the source of an explosion is assumed to be from outside the plant boundaries rather than inside of them, i.e., in principle, it can also correspond to a solid explosion followed by a blast wave. Indeed, the analysis of detonation scenarios with shock wave loading has been investigated quite often, as the literature review in Section 2.3 will show. Dealing with a blast wave from slow deflagration scenarios is a more challenging task and has hardly been analyzed so far. Therefore, a slow deflagration scenario is mainly analyzed in this contribution. To provide an understanding of the analysis approach derived in Section 3.5, some basic aspects of blast load, shock and pressure waves are explained first.
In general, an explosion event—solid detonation or slow deflagration—is characterized by a rapid release of energy and a propagating incident blast wave Pinc. If the incident wave strikes a target, it rebounds with greater amplitudes as the reflected blast wave Pref. For detonation events, the pressure time histories of both incident and reflected pressure show an instantaneous pressure increase followed by decay behavior with an exponential rate until they reach the ambient value P0. Slow deflagration events are characterized by a gradual increase in pressure leading to a peak overpressure (either incident Pinc or reflected Pref), followed by a gradual decrease in pressure and a negative phase. The corresponding period of both pressure time histories for solid detonation and slow deflagration time is known as the positive phase duration td. Furthermore, the pressure value drops below the ambient pressure P0, creating suction, and finally grows once more until it reaches the ambient value after a duration, which is referred to as the negative phase duration. Figure 1 shows a simplified representation of such pressure time histories, also defined as a shock wave for solid detonation (Figure 1a) and pressure wave for slow deflagration (Figure 1b). The incident and correspondingly reflected impulse Iinc and Iref for each of the two phases is defined and calculated as the area between the pressure curve of incident and reflected pressure and the time axis.

2.2. Determination of Shock Wave Parameter

The intensity of the shock wave and thus the peak overpressure, but also the positive and negative phase duration, depend on the distance to the position of the explosive charge. The farther a target is from the source, the smaller the peak overpressure, but the longer the positive and negative phase duration.
Various blast load equations that enable the calculation of the parameter of the shock pressure time history curve are available in the literature. The Kingery–Bulmash [35] equation is the most widely used. It has been adopted by UFC 3-340-02 [32] and is referred to, for example, in [32]. It provides rules to determine the blast parameter depending on the scaled distance Z to the explosive charge:
Z = R/W1/3,
where R is the distance from the explosive charge and W is the equivalent TNT weight of the charge. Blast parameters considered in Kingery–Bulmash [35] and in comparable research to determine the pressure time history are the maximal incident and reflected blast overpressures, the corresponding impulses, the arrival time of the shock wave, the duration of positive (and negative) pressure phase, and the velocity of the shock wave. To sum up, the blast load application should consider the following aspects:
  • The velocity of propagation of the shock wave is considered; elements located farther from the explosive charge are loaded later than elements located at a shorter distance; the velocity and the arrival time of the shock wave are the relevant parameters.
  • The peak pressure decreasing with the distance from the detonation source is considered; elements located farther from the explosive charge have a lower peak pressure than elements at a shorter distance; the determination of the maximal incident and reflected blast overpressures and their corresponding impulses is relevant.
  • The loading duration of the applied shock wave is considered; elements located farther away from the explosive charge are loaded for a longer time than elements located at a shorter distance; the determination of the positive (and negative) pressure phase duration is relevant.
In the simplest way, the time-dependent decay behavior of the incident and reflected blast overpressures of free field detonations can be described by Friedlander’s equation [36]:
P t = P · e b t t a 1   t t a ,
where P is the pressure, td is the positive phase duration and b describes the decay behavior of the curve (see also Figure 1a). The blast load applied to a structure is defined as the effective pressure. When the blast wave crosses a target surface at an oblique angle of incidence θ, the effective pressure Peff is given using the following equation:
Peff = Pref · cos2θ + Pin · (1 + cosθ − 2 cos2θ),
with the angle of incidence θ as depicted in Figure 2. This approach, described in [37], for example, can be summarized as follows:
  • Structural parts that are oriented perpendicular to the blast wave direction receive the maximal reflected pressure: θ = 0°: Peff = Pref.
  • Structural parts that face away from the charge receive only the incident pressure: 90° ≤ θ ≤ 180°: Peff = Pinc.
Further explanations and definitions of the blast load and its wave propagation are given in the literature [23,30,32].
The described phenomena of shock wave propagation and their effect on structures can be modelled in LS-DYNA (smp d R13) [18] software by means of several techniques. In particular, the command *load_blast_enhanced (LBE) allows the specification of a TNT mass, distance, and the target structural elements; the load resulting from the propagating shock wave is applied automatically on the target elements according to Equations (1)–(3). This type of analysis then corresponds to a simplified dynamic analysis frequently adopted in the blast analysis of building structures. However, the feature is limited to explosion phenomena whose blast wave propagation follows the shape and laws of a shock wave (Figure 1). The implementation of the command is based on [37]; the model was originally developed for the study of vehicle response due to the blast from land mines.

2.3. Determination of Pressure Wave Parameter

Methods for determining the blast propagation for a pressure wave resulting from a vapor cloud explosion can be found in [33]. Ideal explosion sources, such as high explosives like TNT, can be characterized by a single parameter, namely their explosion energy. In Equation (1), this is represented by the mass of TNT. Consequently, the relationship between blast parameters and distance for ideal explosion sources can be represented by a single curve in energy-scaled coordinates. However, when dealing with non-ideal explosion sources like vapor cloud explosions, the situation changes. Non-ideal sources cannot be solely defined by explosion energy alone; both the explosion energy and the energy release rate are necessary to characterize these sources accurately [33]. Therefore, a set of curves describes the relationship between blast parameters and distance for vapor cloud explosions. The two predominant sets of blast curves are the Baker–Strehlow–Tang (BST) method [38,39] and TNO multi-energy method (MEM) [40], but other methods also exist [33]. For a long time, the TNT equivalence method [33] was used, which is very simple since the only parameter needed to represent the vapor cloud explosion includes the explosion energy, from which the TNT charge weight is calculated. In [33], it is stated that the TNT equivalence methods are not well suited, since blast effects from vapor cloud explosions depend not only on the explosion energy but, more importantly, on the combustion rate. Therefore, methods like BST or TNO MEM have replaced the TNT equivalence method.
If a vapor cloud explosion scenario is defined and specified in ammonia process units, the described curves of BST or TNO MEM can be used to determine the blast load. The procedure is complex and requires various input parameters. For the blast analysis in tank design, however, often, only the resulting overpressures are specified, which stress the tank structure and must be considered in the design. A risk analysis does look at specific underlying scenarios for a potential blast load. However, often—as already mentioned in the introduction (Section 1)—tank structures and entire process plants are built in such a way that future risks not yet foreseeable at the planning stage are also taken into account. Accordingly, the scenario in which a blast load is applied is secondary for the analysis of tank structures.
Although the scenario is in principle relevant for the calculation approach developed in Section 3.4, it is derived from the relationships of shock wave propagation inspired by the TNT equivalency. Therefore, the methods BST or TNO MEM for determining the blast propagation for a pressure wave are not relevant for this research and are not explained further.

2.4. State of the Art on Blast Load Analyses of Tank Structures

Due to some severe explosion events in tank farms with sometimes far-reaching negative effects, a blast load analysis should be part of the design of tanks, especially for tanks as part of critical infrastructure or for hazardous fills. However, because tanks have long been designed based on simplified rules and many years of experience, and because finite-element analysis has only been the state of the art for more complex tank analysis problems in the last two decades, blast load analyses of tank structures are still challenging and part of the current research. A large proportion of the analyzed literature uses the simplified dynamic method based on the shockwave propagation described in Section 2.2, which can be applied in LS-DYNA [18] by means of the already mentioned feature *load_blast_enhanced, for instance [24,26,41]. In contrast, there are several works that adopt a different approach. The most relevant sources are discussed in the following.
In [23], a very simple approach is proposed. Although initially suited to structures in chemical plants, it can be applied in general: in determining overpressures, the closest point of the structure to the blast source can be used as a reference for the determination of the scaled distance and corresponding blast parameter. The resulting peak overpressure can be used for the entire structure, which is quite conservative especially for blast loads in closer distances to structures and/or larger structures since the distance-related decay behavior of the overpressure is neglected. For larger structures, considering the average overpressure on the surface or the overpressure at the centroid of the surface can be less conservative. The advantage of this method lies in the user-friendliness of the application, as the same load is applied to each structural element in a simplified manner. However, the propagation velocity of the blast wave is neglected.
Here, the TNO Green Book [16] proposes a procedure that considers the time span required for a blast wave to reach the back face of a building. Furthermore, the decrease in the pressure amplitude acting on the back face of a building is considered. The procedure primarily applies to buildings. Especially for industrial buildings, values for the blast load are specified: the walls subjected to possible reflection must be designed for a reflected overpressure of 30 kPa and the roof must withstand 20 kPa with a positive phase duration equal to 100 ms each. Additionally, control buildings shall be designed for a shock wave with a reflected peak overpressure of 300 kPa for walls and 100 kPa for the roof with a positive phase duration of 15 ms. It must be mentioned that the proposal of [16] applies to buildings. It is stated that data for industrial installations other than buildings are scarce and insufficient. An application to tank structures is therefore questionable.
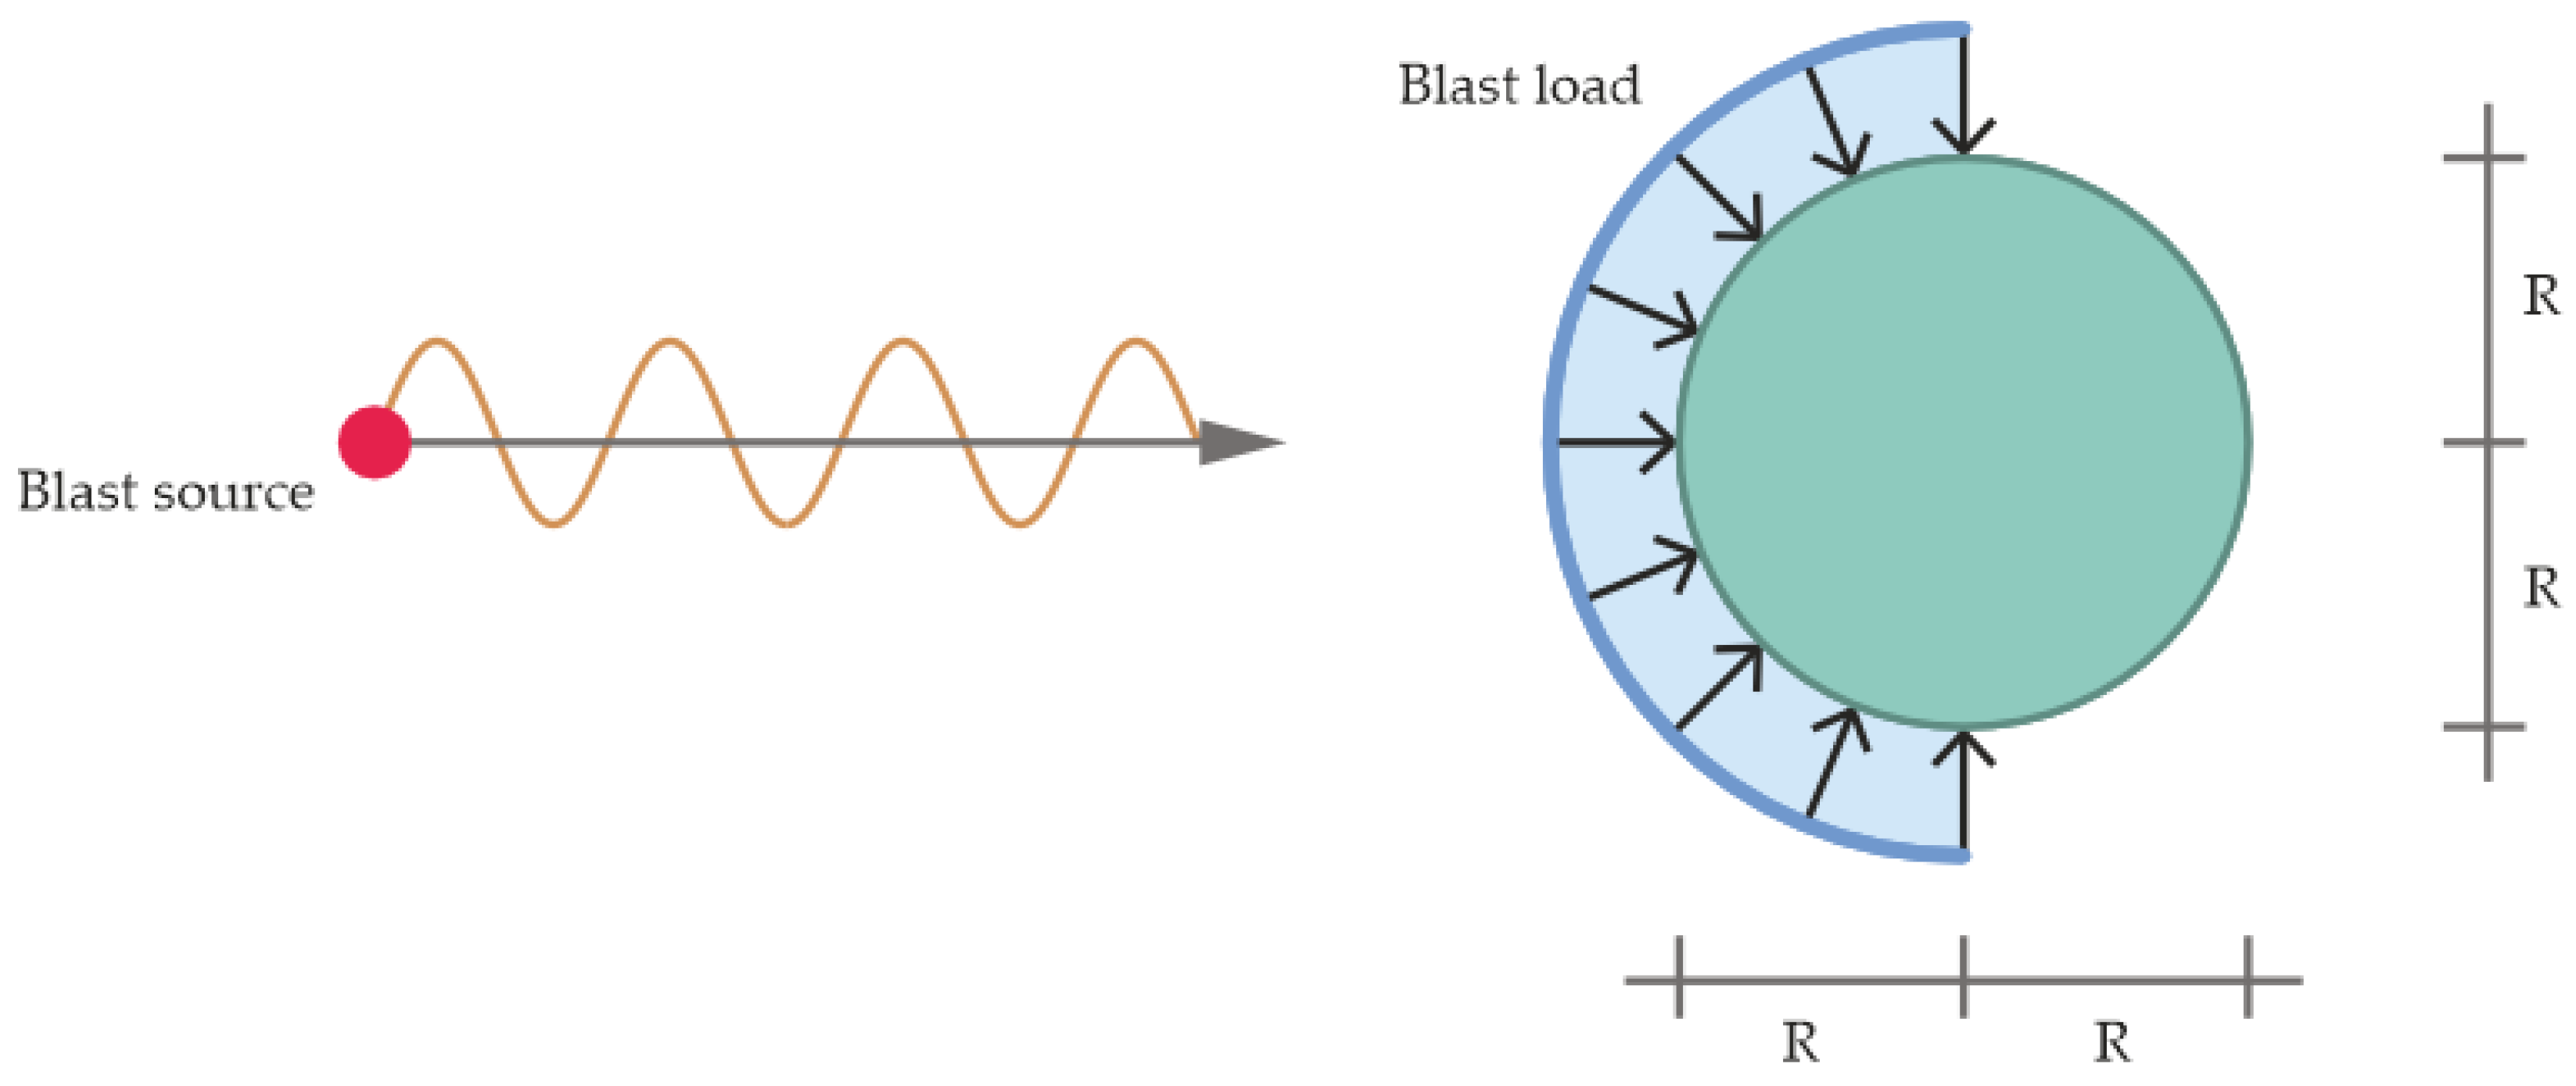
The work of Mittal et al. [31] considers the blast pressure time history applied to a cylindrical tank depending on scaled distance (Equation (1)) using a modified Friedlander equation. The resulting shock wave time history is applied normally and uniformly to one half of the cylindrical tank surface as shown in Figure 3.
The tank side facing away from the blast source is not loaded. With this type of load application, maximum overturning loads can be determined for the tank. However, the one-sided load only on the side facing the blast source seems rather conservative. The inherent advantage of the shell load-bearing capacity of a cylindrical tank, even with non-uniform loads, is completely neglected by taking one half of the shell unloaded. Furthermore, the decay behavior of the peak overpressure with increasing scaled distance to the blast source is not considered. The tank studied is not provided with a roof and the pressure distribution acting on the free liquid surface is not discussed.
Zhang et al. [27] perform a fully coupled CFD analysis using the arbitrary Lagrange–Eulerian approach for shock wave propagation. They derive a fitting formula for overpressure as a function of scaled distance, which shows good agreement with blast equations from general literature for shock waves. Furthermore, they analyze the overpressure acting on a cylindrical concrete tank at three positions along the tank circumference at the height of the explosion source. The maximum value results at the position directly perpendicular to the explosion source, while the peak overpressure decreases to about 50% at the side and rear of the tank. Details about the pressure distribution acting on the roof are not provided or discussed. The authors highlight the time effort required for the fully coupled analysis.
Further fully coupled CFD analyses are available in the literature. Timofeev et al. [42] investigated the three-dimensional shock wave interaction with an oblique cylinder. They found out that the shocked flow around the cylinder is truly three-dimensional with the quantitative parameter differing from a plane and axisymmetric case. Ding et al. [43] investigated the interaction of planar shock wave with multi-dimensional convex and concave bubbles and analyzed physical processes such as the jet or vortex formation. Further research on specific problems is available [44,45]. However, these works are important to understand the interaction of blast wave with the 3D structure but less suitable for practical engineering applications, as methods other than fully coupled CFD analyses are preferred here.
Yasseri [46] proposes a method based on an experimental background by considering a TNT-caused shock wave. Here, the general pressure time history depends on several values, which in turn vary according to the tank’s circumferential angle from the incident wave. The pressure time history rises to the peak reflected overpressure P1. Vortex formation causes a pressure drop to P2, which is then followed by a further increase in the so-called stagnation pressure P3. From then on, the pressure decays with a time-dependent drag coefficient. The pressure values, drag coefficient and duration times depend on the angle of circumference of the tank to the incident wave. When the angle equals zero, i.e., where the blast wave first strikes the tank, the maximal peak overpressure occurs, but for larger angles, its value decreases. In small-scale experiments, the pressure distribution around a tank was measured: based on the experimental results, a cosine-shaped fitting curve was developed to describe the angle-dependent behavior of the pressure values and the drag coefficient. Further diagrams are provided for the times t1, t2, and t3 that describe the points of the pressure time history, at which the peak pressures P1, P2, and P3 are reached. While the latter two are constant, the first shows angle-dependent behavior for an angle θ larger than 90°. The approach is quite complex and not easy to apply. Furthermore, since the value t1 equals zero for circumferential angles from the incident wave of 0° to 90°, it is obvious that a shock wave approach is considered and not a vapor cloud explosion in slow deflagration scenarios. However, it can be taken as general information about a pressure distribution around a cylinder that the most relevant peak pressure P1 does not drop below zero even for circumferential angles larger than 90°, i.e., on the side facing away from the tank, but it has always a positive (overpressure) value. The pressure distribution acting on a roof has not been analyzed in [46], but a recommendation is given to consider suction forces on the roof and corresponding damage to the roof and anchorage.
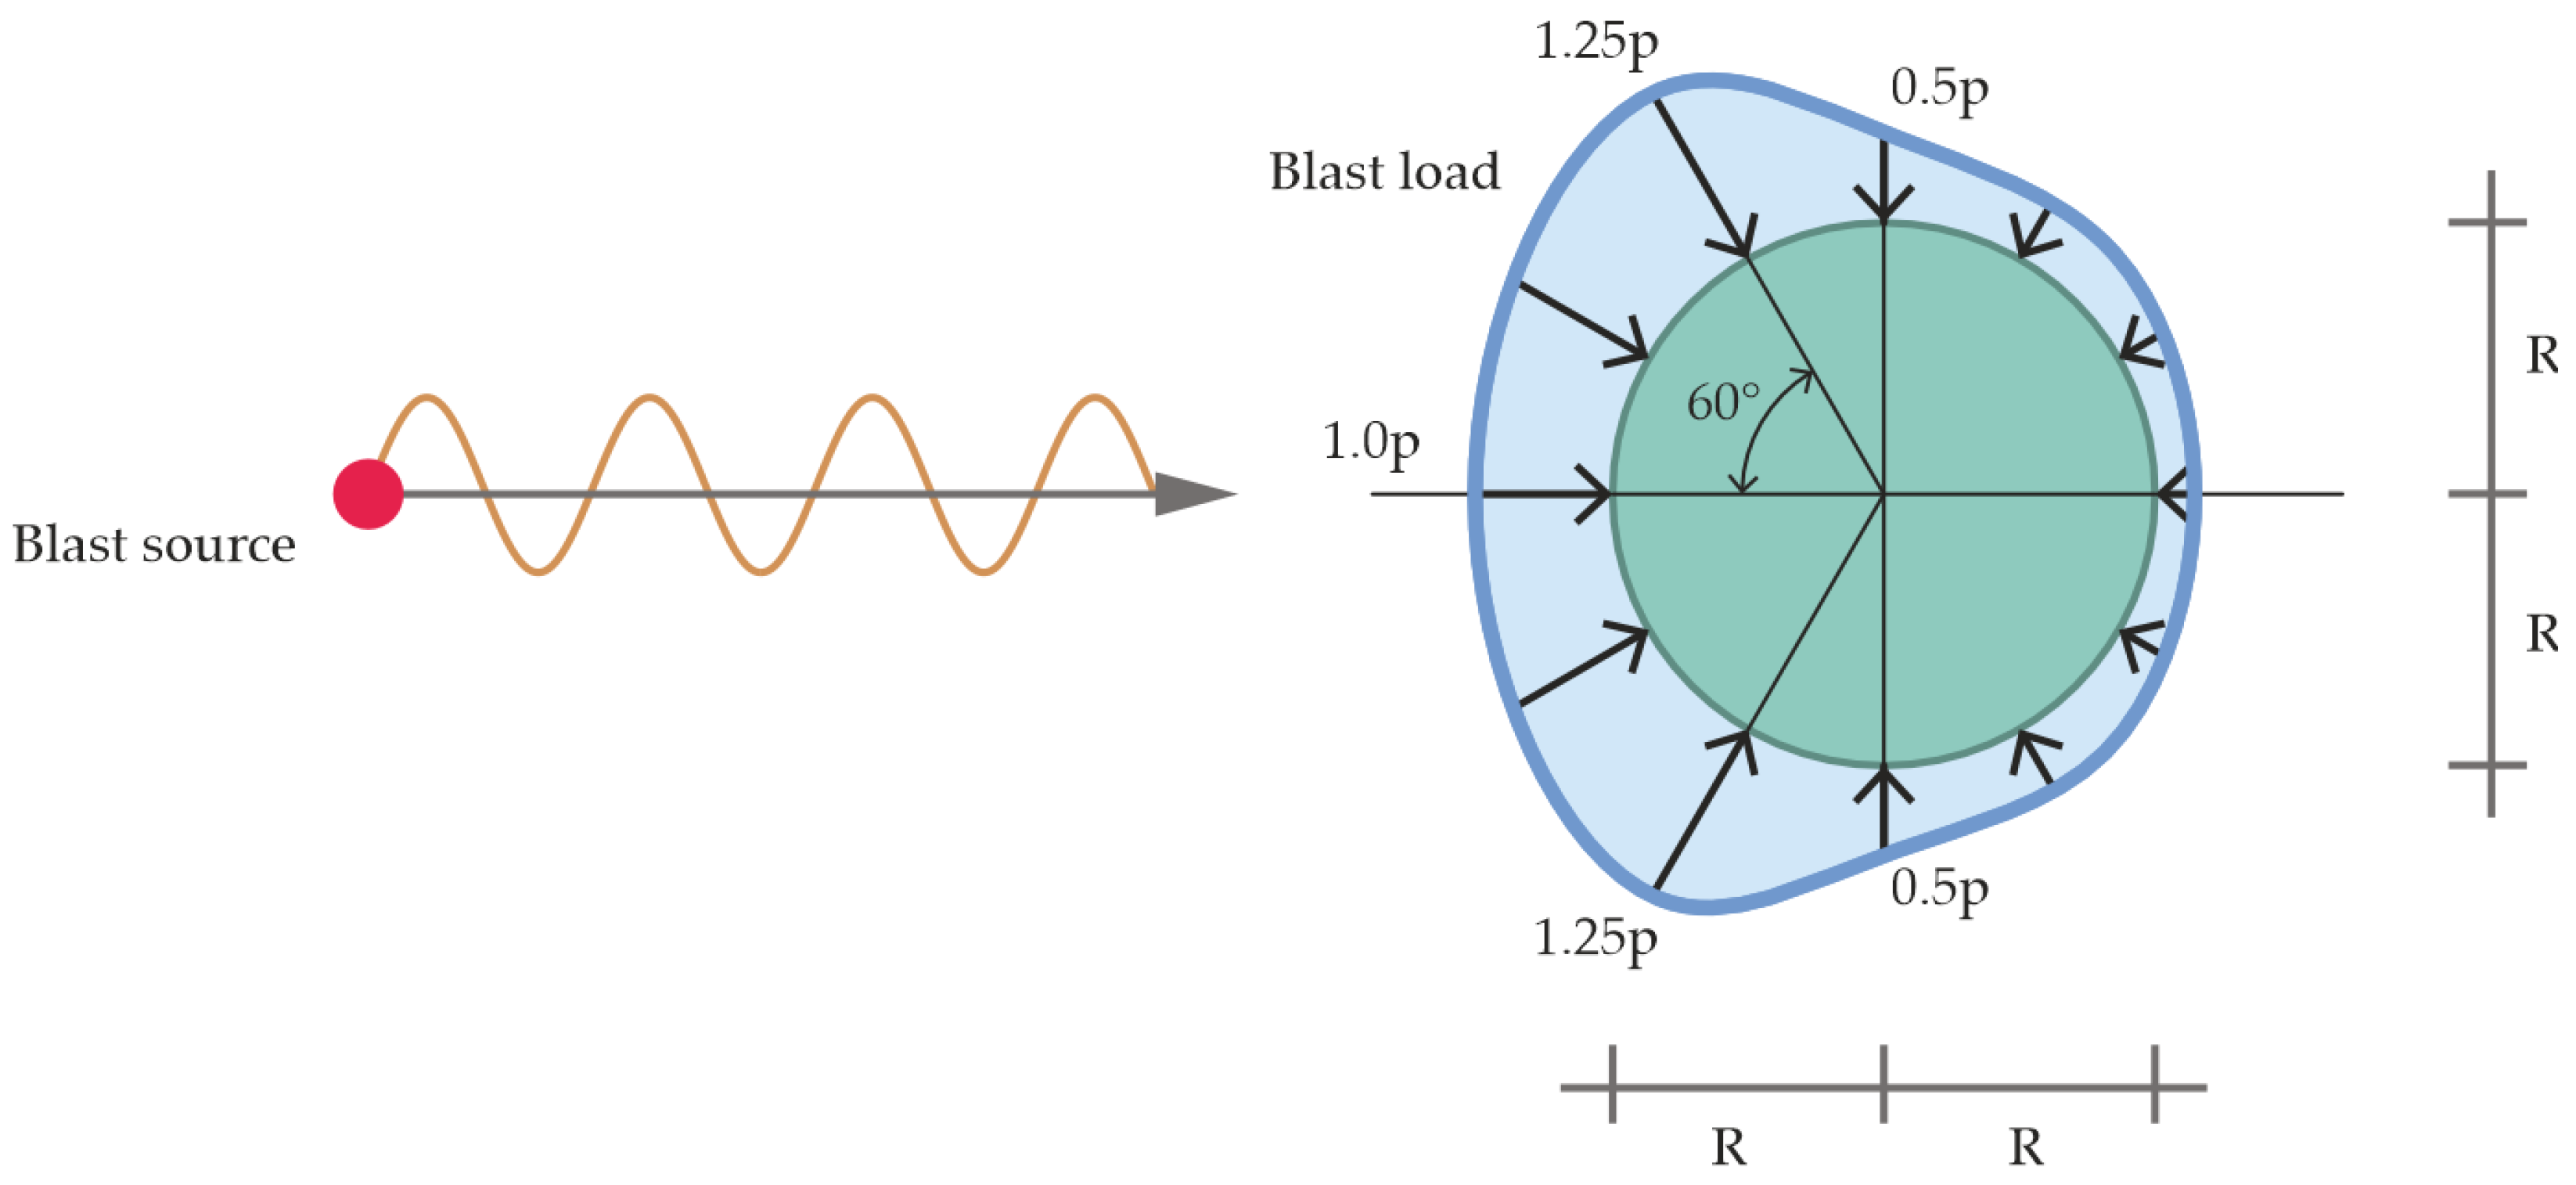
Research on the effects of long-duration blast loadings induced by the explosion of flammable vapor clouds on tank structures is rare. Roetzer and Douglas [47] provide a static calculation approach considering the dynamic characteristics of the deflagration blast load due to vapor cloud explosion by means of an increasing factor, the dynamic load factor (DLF). The use of the DLF concept, also described in the TNO Green Book, Chapter 2, Section 4.3 [16], allows the estimation of the structural response for a dynamic blast case simply by performing a static analysis. The DLF reflects the increase in response to the dynamic load with respect to an equivalent static load. It depends on the positive phase duration td of the blast loading in relation to the natural period Tn of the tank structure. The ratio td/Tn can be taken from diagrams, e.g., in [16,47], and indicates whether the loading can be treated as impulsive (td/Tn < 0.4), dynamic (0.4 ≤ td/Tn ≤ 2) or quasi-static (td/Tn > 2). Roetzer and Douglas [47] use the DLF concept to estimate the value of the peak overpressure. The corresponding blast load distribution around the tank circumference is shown in Figure 4. This pressure distribution shows a peak at an angle of circumference of 60°, while the tank side facing away from the blast source experiences reduced but still positive overpressure.
Jiang et al. [25] provide gas blast experiments as well as numerical and theoretical models to investigate the response and energy absorption mechanism of steel tanks. The experimental equipment, however, only offers the possibility of applying blast pressure to a small area of the tank. Similarly, in the numerical model, only a small circular area is subjected to uniform time-dependent blast pressure. The blast pressure distribution around the tank or on the roof is not analyzed.
The most comprehensive research so far on the blast load distribution around circular cylinders was conducted by Duong et al. [48]. A small-scale gas explosion test was developed: a rigid PVC cylinder fitted with a flat cover at the top was equipped with pressure sensors around its height, circumference, and top cover to evaluate the reflected pressure field around the whole cylinder. The pressure sensor distribution consists of three sensors along the height of the cylinder and radius of the top side, which are installed every 15° along the circumference. The pressure distribution showed the following characteristics: the peak pressure reaches a maximum at the point with a circumferential angle of 0° (directly perpendicular to the pressure source) and decreases with an increase in the circumferential angle. The time at which the peak pressure occurs at any position of the cylinder shifts backwards in time as the circumferential angle increases. The positive load phase increases as the circumferential angle increases. The negative pressure phase decreases and approaches approximately zero as the circumferential angle increases. Unfortunately, the exact explosion characteristic for pressure distribution is not provided. Although pressure gauges on the roof are applied, no information about the resulting pressure distribution is available. However, the investigations confirm that a distance-related pressure distribution occurs along the cylinder.
Furthermore, in [48], a numerical simulation was performed to evaluate the different responses of flexible or rigid cylinder walls under blast loading. These analyses were performed using LS-DYNA software with a weakly coupled approach: the blast wave of a solid explosive (TNT)—since gaseous detonation is not supported in LS-DYNA—is mapped on a coupled 3D Euler–Lagrange mesh under some simplifying assumptions. The selected case is performed on a real scale and refers to the explosion of 1 ton of TNT at a 40 m distance from the tank [48]. The numerical analysis provides the following characteristics of the pressure distribution along the circumference of the tank (rigid and flexible): the maximum peak pressure is located at the position with a circumferential angle of 0° (directly perpendicular to the pressure source) and decreases as the circumferential angle increases. The same applies to the negative peak pressure, which is in fact a plateau rather than a peak, as the circumferential angle increases. The time at which the positive peak pressure occurs shifts backwards in time as the circumferential angle increases. The positive load phase decreases as the circumferential angle increases. The last aspect is notably in contradiction with the phenomena observed in the experiment and may be due to the simplifications in the blast load application. In [48], numerical analysis is primarily used to show that neglecting fluid–structure interaction leads to an error in the evaluation of the maximum reflected positive overpressure that is lower than 5% around the tank until the separation angle and lower than 1% in the most solicited region. Therefore, this simplification might be considered a valid assumption.
Design criteria for tank structures exposed to explosion pressure are not discussed in the literature. Recognized normative verification methods such as the methods of DIN EN 1993-1-6 [49] for steel shell structures only apply to static load conditions or dynamic loads that are considered quasi-statically. In [23], it is stated that in conventional design, stresses are limited to the elastic range. In blast design, however, yielding should be acceptable and in fact desirable for economic reasons. Therefore, the adequacy of a blast-loaded component hinges on the maximum deformation rather than stress level [23]. In [23], Annex 5, deformation limits are proposed for structural members in industrial facilities. Although cylindrical shells are not particularly mentioned, the relevant criteria are mentioned here due to the lack of appropriate values for tank structures. First, a distinction is made between three damage levels—low, medium, and high. A low damage ratio comprises localized component damage with the building being usable, although repairs are required to restore the overall integrity. The description corresponds to general buildings but offers the possibility to be adopted to tank structures whose integrity should be ensured after a blast event. Next, for each damage level, a limit ductility ratio μ is specified. For steel components, low-damage-level ductility values of 1 to 5 are specified depending on the structural type [23], with the ductility ratio μ being defined as
μ = (ϵelast + ϵplast)/ϵelast,
ϵelast = fyk/E,
where ϵelast is the elastic strain, ϵplast is the plastic strain, fyk is the characteristic yield strength, and E is the modulus of elasticity.

2.5. Discussion of State of the Art on Blast Load Analyses of Tank Structures

The literature review in Section 2.4 shows that there are no specific rules for load distribution around the cylindrical shell and on the roof, nor general rules for evaluating adequate design criteria. Although many tank explosion studies can be found in the literature, a general design approach is not yet available.
There is widespread consensus that the position of the tank wall directly perpendicular to the blast source experiences the greatest peak overpressure, while, toward the tank sides, the overpressure decreases. Additionally, the application of overpressure (no suction or zero-overpressure) on the tank side facing away from the explosion source seems to be common. The experimental study presented in [48] shows that the time at which the peak pressure occurs shifts backwards in time as the circumferential angle increases and, furthermore, the positive load phase increases as the circumferential angle increases. This load approach is congruent with the load distribution as a function of both the scaled distance and the angle of incidence presented in Section 2.2, which applies for shock waves resulting from high explosives. Here, the minimal pressure applied to the tank would be the incident pressure at the tank’s backside with the longest load duration consistent with the largest scaled distance. There is no similarly simple method for the propagation of slow deflagration pressure waves that depends only on the scaled distance (see Section 2.3), but the general propagation behavior is comparable.
Therefore, in the present study, a simple approach is developed to consider the following: the combination of a distance-related pressure distribution with a distribution depending on the angle of incidence corresponds to a pressure load being applied on the overall tank structure, with varying amplitudes over the tank height and circumference and roof. This method allows the relevant correlations to be put into a formula-based context and, thus, prepared for systematic application. Section 3.4 introduces the approach in detail. The approaches of [31], displayed in Figure 3, and [47], given in Figure 4, are also examined in the present research in order to investigate the advantages and disadvantages of the individual methods for comparative analysis.
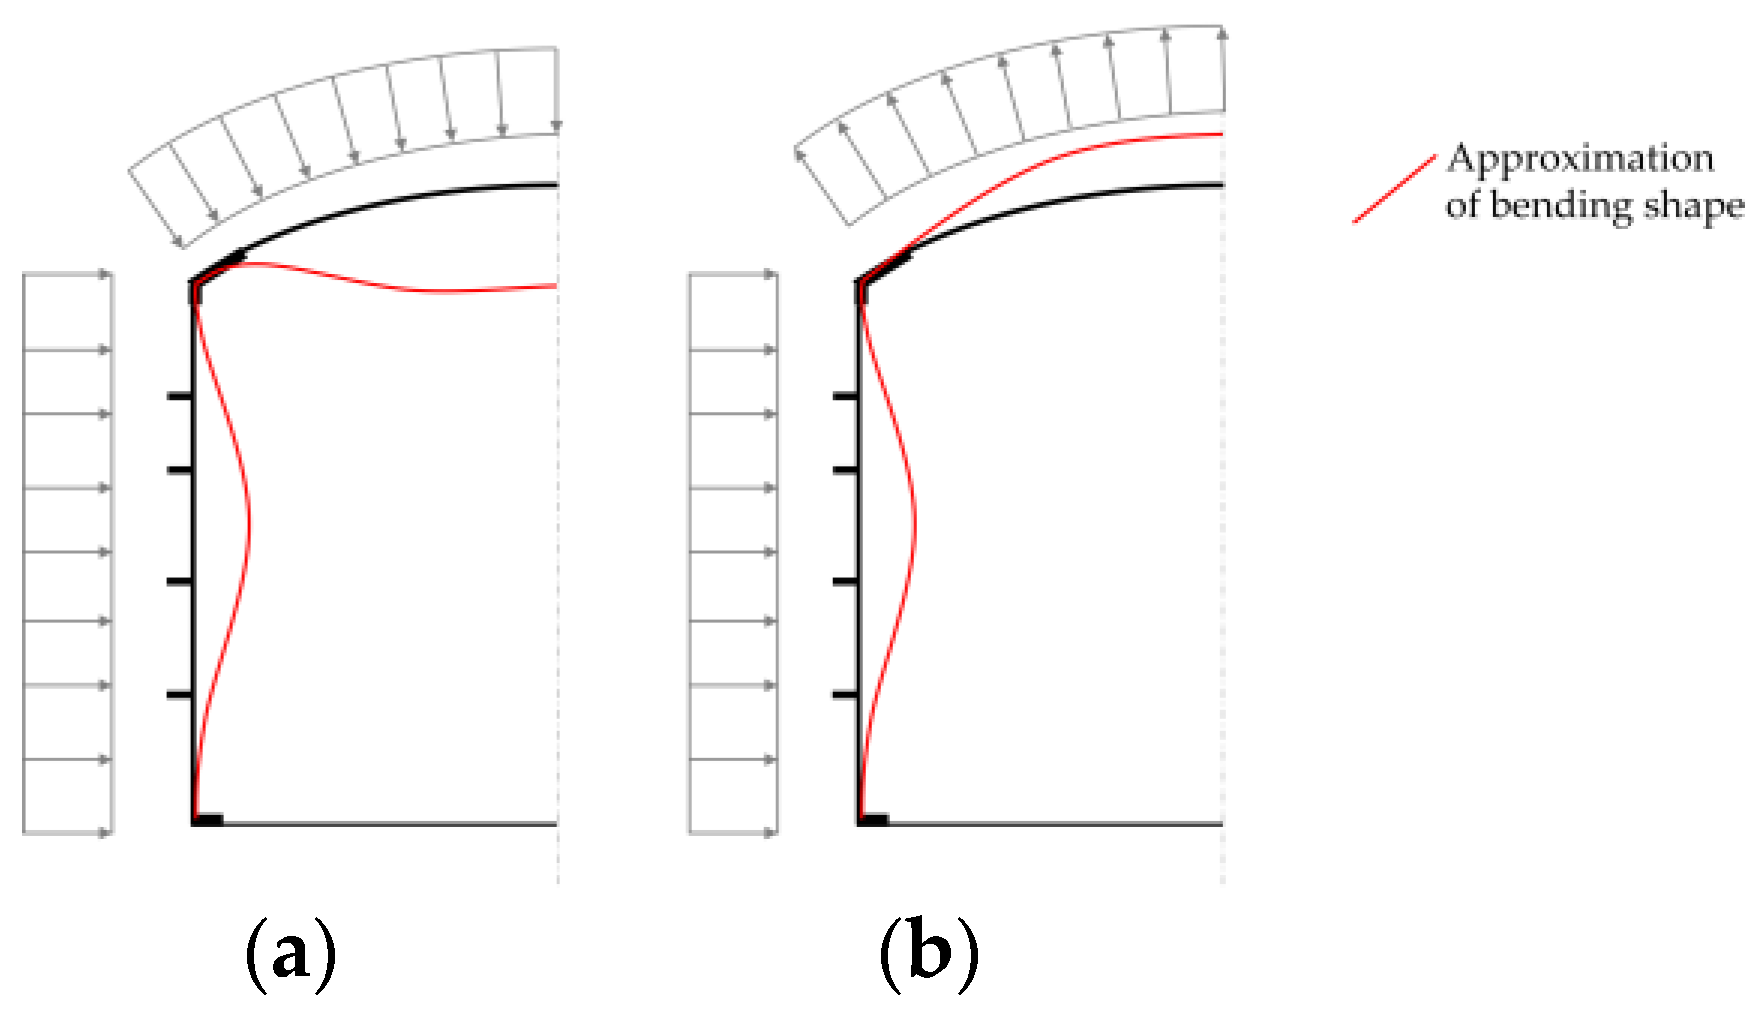
Special attention is paid to the load direction of the blast load acting on the roof surface. The approach presented in Section 2.2 and in Figure 2 states that the ordinate of the pressure load depends on the angle of incidence. When applying this approach, it results in a compression load for the entire roof surface. A non-uniform compression load can severely damage the thin-walled roof membrane. In addition, the explosion load acting as a compression load on the roof is transferred to the tank shell as axial compression load and increases the already existing axial compression load. Since thin-walled shells are typically susceptible to buckling, which can lead to critical shell loads.
However, as discussed in [46], a roof suction load introduced by blast wave propagation can occasionally damage tanks due to roof uplift. The roof to shell joint may tear and peel away the roof plate, or the roof structure may be dislodged by distortion of the shell. Additionally, the anchorage of the tank is heavily stressed due to the uplift load.
There are now two completely contradictory recommendations for load application on the roof. Following the general application of wind loads on dome roof structures according to Eurocode’s approach [50], the sign of the pressure coefficient (compression or suction) is determined depending on the relation of the tank height to diameter or roof height to diameter. For the usual dimensions of storage tanks with dome roofs, wind load is always applied as the suction load to the total roof. At this point, reference is made to DIN EN 1991-1-4, Figure 7.12 [50]. Of course, a blast pressure load is only slightly comparable to a wind load, but analogies should still be present. Thus, without further numerical CFD or experimental investigations, no clear general statement can be made about load application on tank roofs based on the current state of the art.
Therefore, in order to be able to make a reliable estimate of the performance of the tank due to a blast, two different load cases for the roof blast load are analyzed within the scope of this study: on the one hand, the load is applied as a compression load according to the relationships presented in Section 2.2. On the other, the sign of all load values is reversed while the value of the load remains identical in order to also analyze a suction load based on the recommendation from [46] and the Eurocode wind load approach on dome roofs [50].
A look at the available design criteria reveals regulatory gaps. The specification of damage ratios in [23] seems reasonable, but these must be adapted more to the consequences of damage to tank structures. Therefore, for the observation of the possible impact to a tank structure withstanding a significant blast load event, it should be considered to define the performance level of the tank structure in the way it is described in European and American standards for seismic design classification. There are two main performance levels, which can be derived from the seismic design consequence criteria:
  • OL (operating level)/OB (operating basis): After impact by a blast load event, the tank structure will remain operational.
  • CL (contingency level)/SS (safe shut-down): After impact by a blast load event, the tank structure may be damaged but without the loss of overall integrity and containment.
As the event of a blast load impact is considered a singular event in the design lifetime of a tank system, the adoption of the consequences defined for the contingency level (CL)/safe shut-down (SS) should be considered. The limit values for the ductility ratio μ proposed by [23] can be used for this purpose. As no values are explicitly given for tank structures, the lowest suggested value (μ = 1) should be conservatively adapted.

3. Simulation Model for Numerical Analyses

The tank structure investigated in this study represents a typical geometry of a double-walled cylindrical steel system containment with a dome roof that has been proven to store ammonia safely.

3.1. Representative Geometry

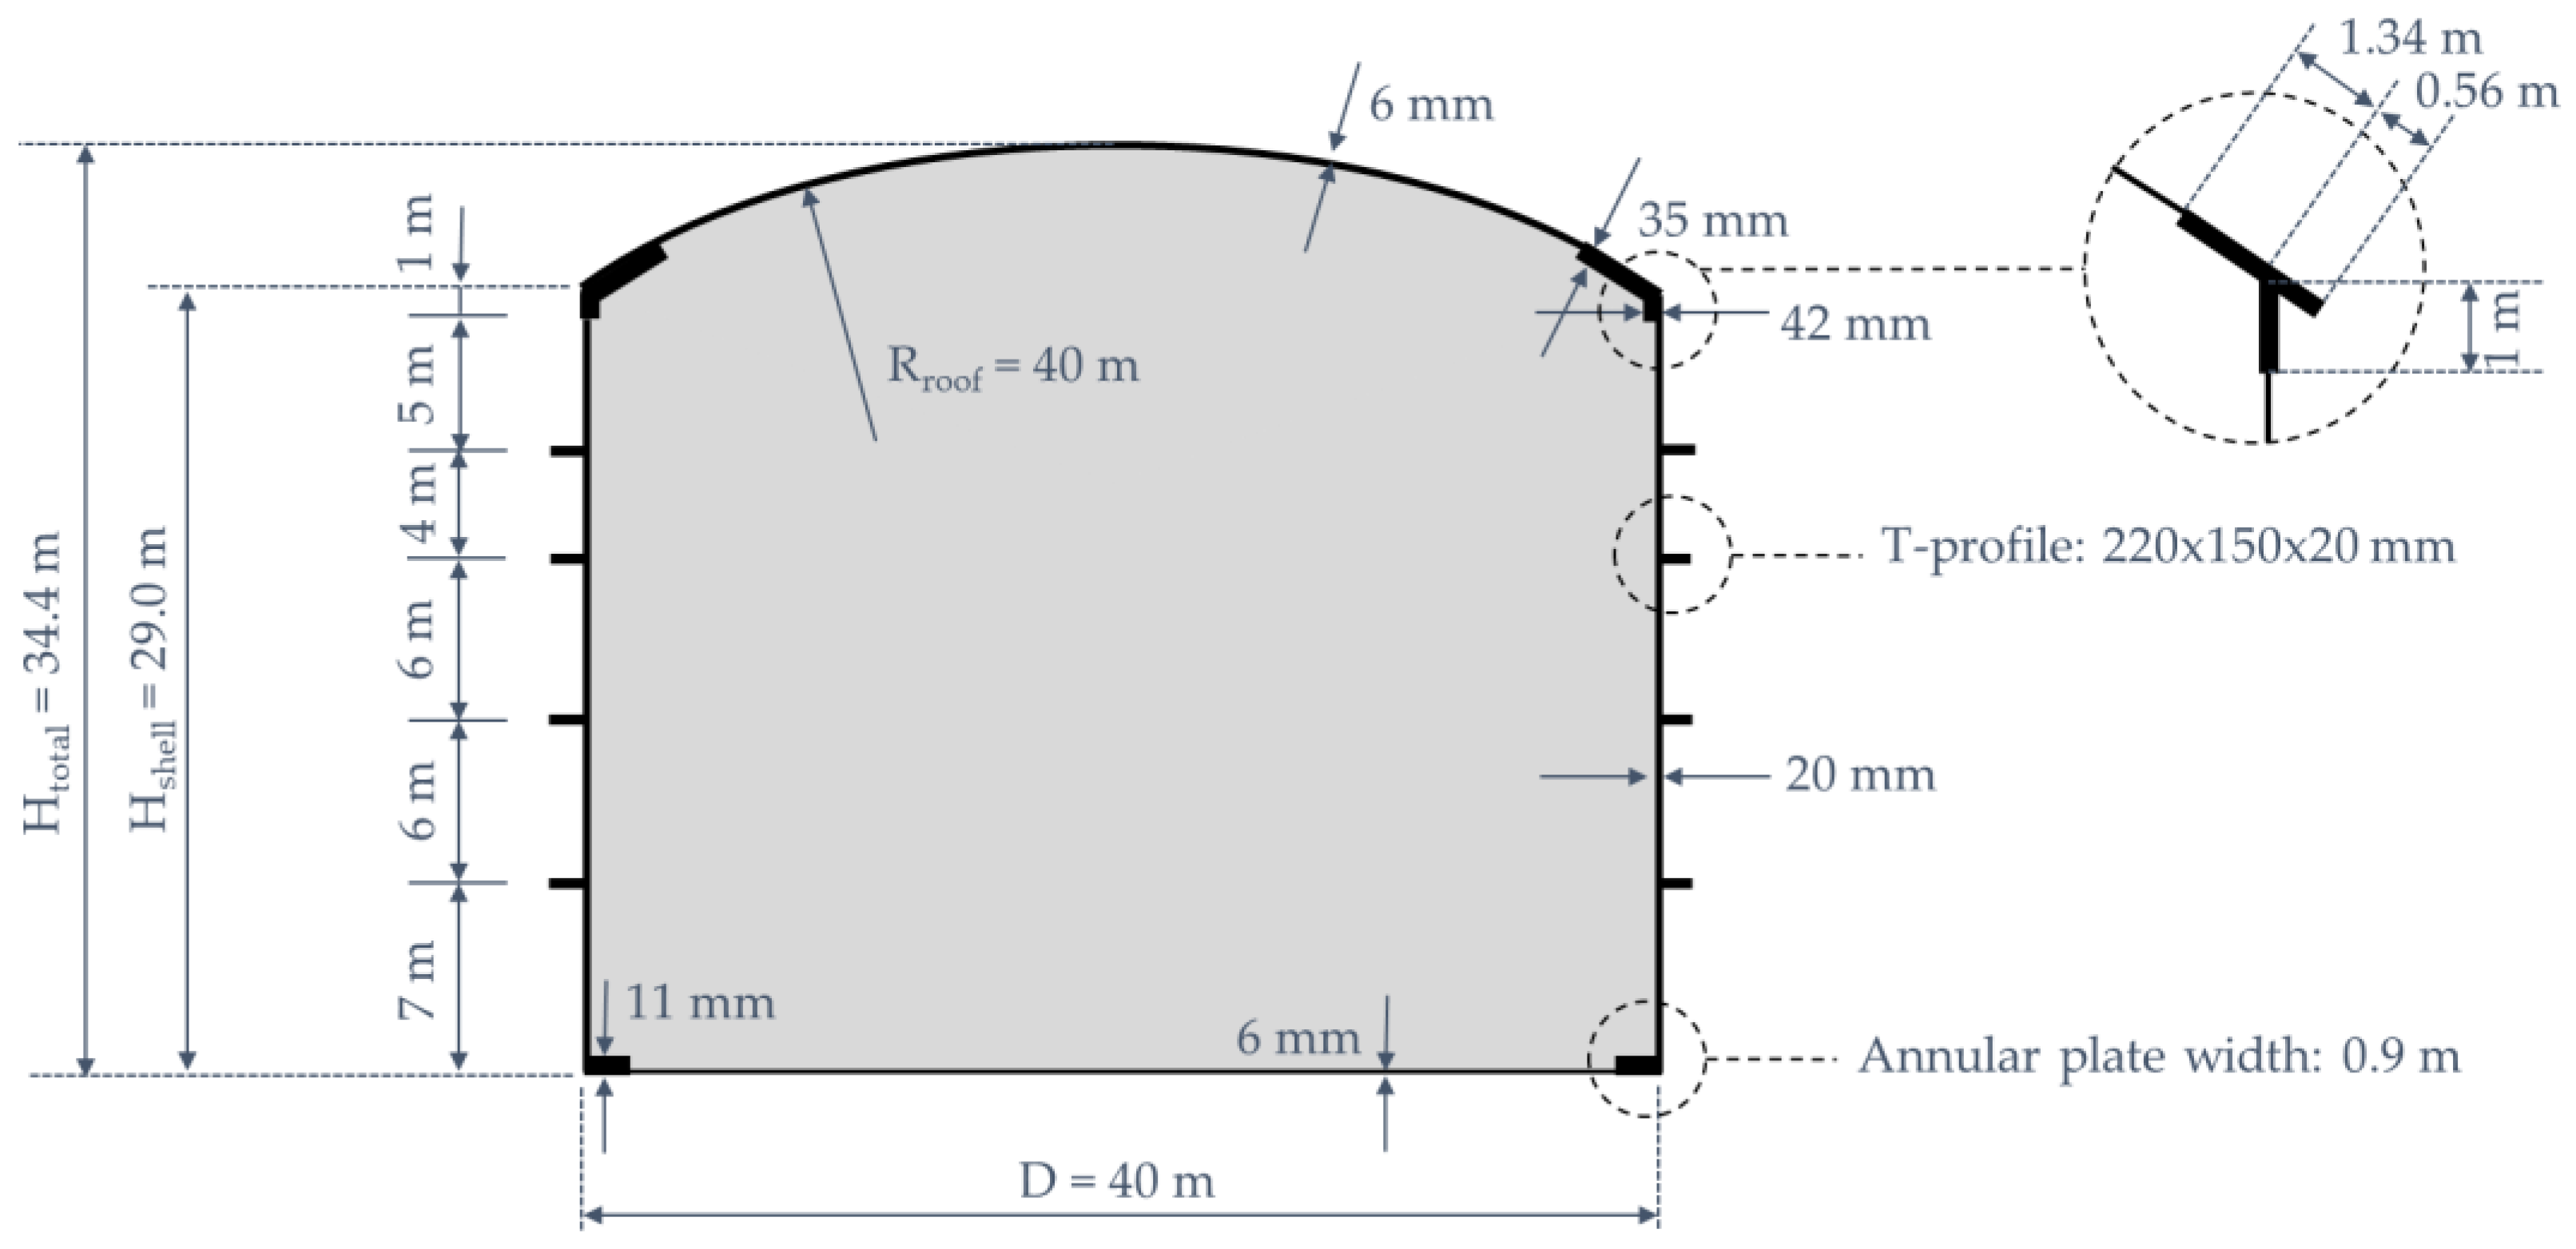
The shells of the inner and outer tank of such a system are usually not connected and the inside of the outer tank is freely accessible for inspection and maintenance work. Hence, the blast load mainly hits the outer tank structure, so the object of this study is exclusively the outer tank with its roof stiffener system. The geometry is shown in Figure 5. Tanks are usually designed economically as a stepped tank wall: the tank wall thickness increases towards the bottom, and it absorbs the increasing loads from the tank’s dead weight and filling. In this study, however, a constant wall thickness of 20 mm is considered: despite this simplification, it is possible to draw conclusions on the performance of steel tanks that are subjected to long-duration and high-pressure blast loading. Only the top section, which forms the compression ring, is thicker, in accordance with the requirements for the design of ammonia tanks. The tank wall is stabilized by several ring stiffeners (T-profile 220 × 150 × 20 mm3). The self-supporting tank roof consists of 64 rafters (I-profile 260 × 260 × 15 mm3), 2 girder rings (radius 16 m and 10 m), the crown ring (radius 3 m) and the compression ring. A roof plate with a 6 mm thickness is continuously welded to the rafters. The tank bottom plate is constructed with an annular plate that is continuously welded to the tank wall. The tank is placed on a concrete foundation plate to which the tank is anchored in the vertical direction using 64 anchor straps (170 × 11 mm2) to prevent uplift.

3.2. Numerical Model

The representative tank is examined via transient analysis using the explicit solver LS-DYNA [18]. A three-dimensional simulation model consisting of shell and beam elements is generated. The tank wall, roof plate and annular ring are idealized by reduced integration shell elements (type: Belytschko-Tsay), while the roof system, wall stiffeners and anchorages are modeled with beam elements (type: Hughes Liu). In total, 5440 beam elements were added to the model. The shortest beam is 300 mm long. Five layers of shell elements are adopted in order to capture the bending behavior in a proper way. A total of 49,652 shell elements have been used in the mesh model. Shell elements have the following dimensions: 300 × 300 mm2. The foundation is represented by an ideal-rigid plate modeled with 1936 solid elements.
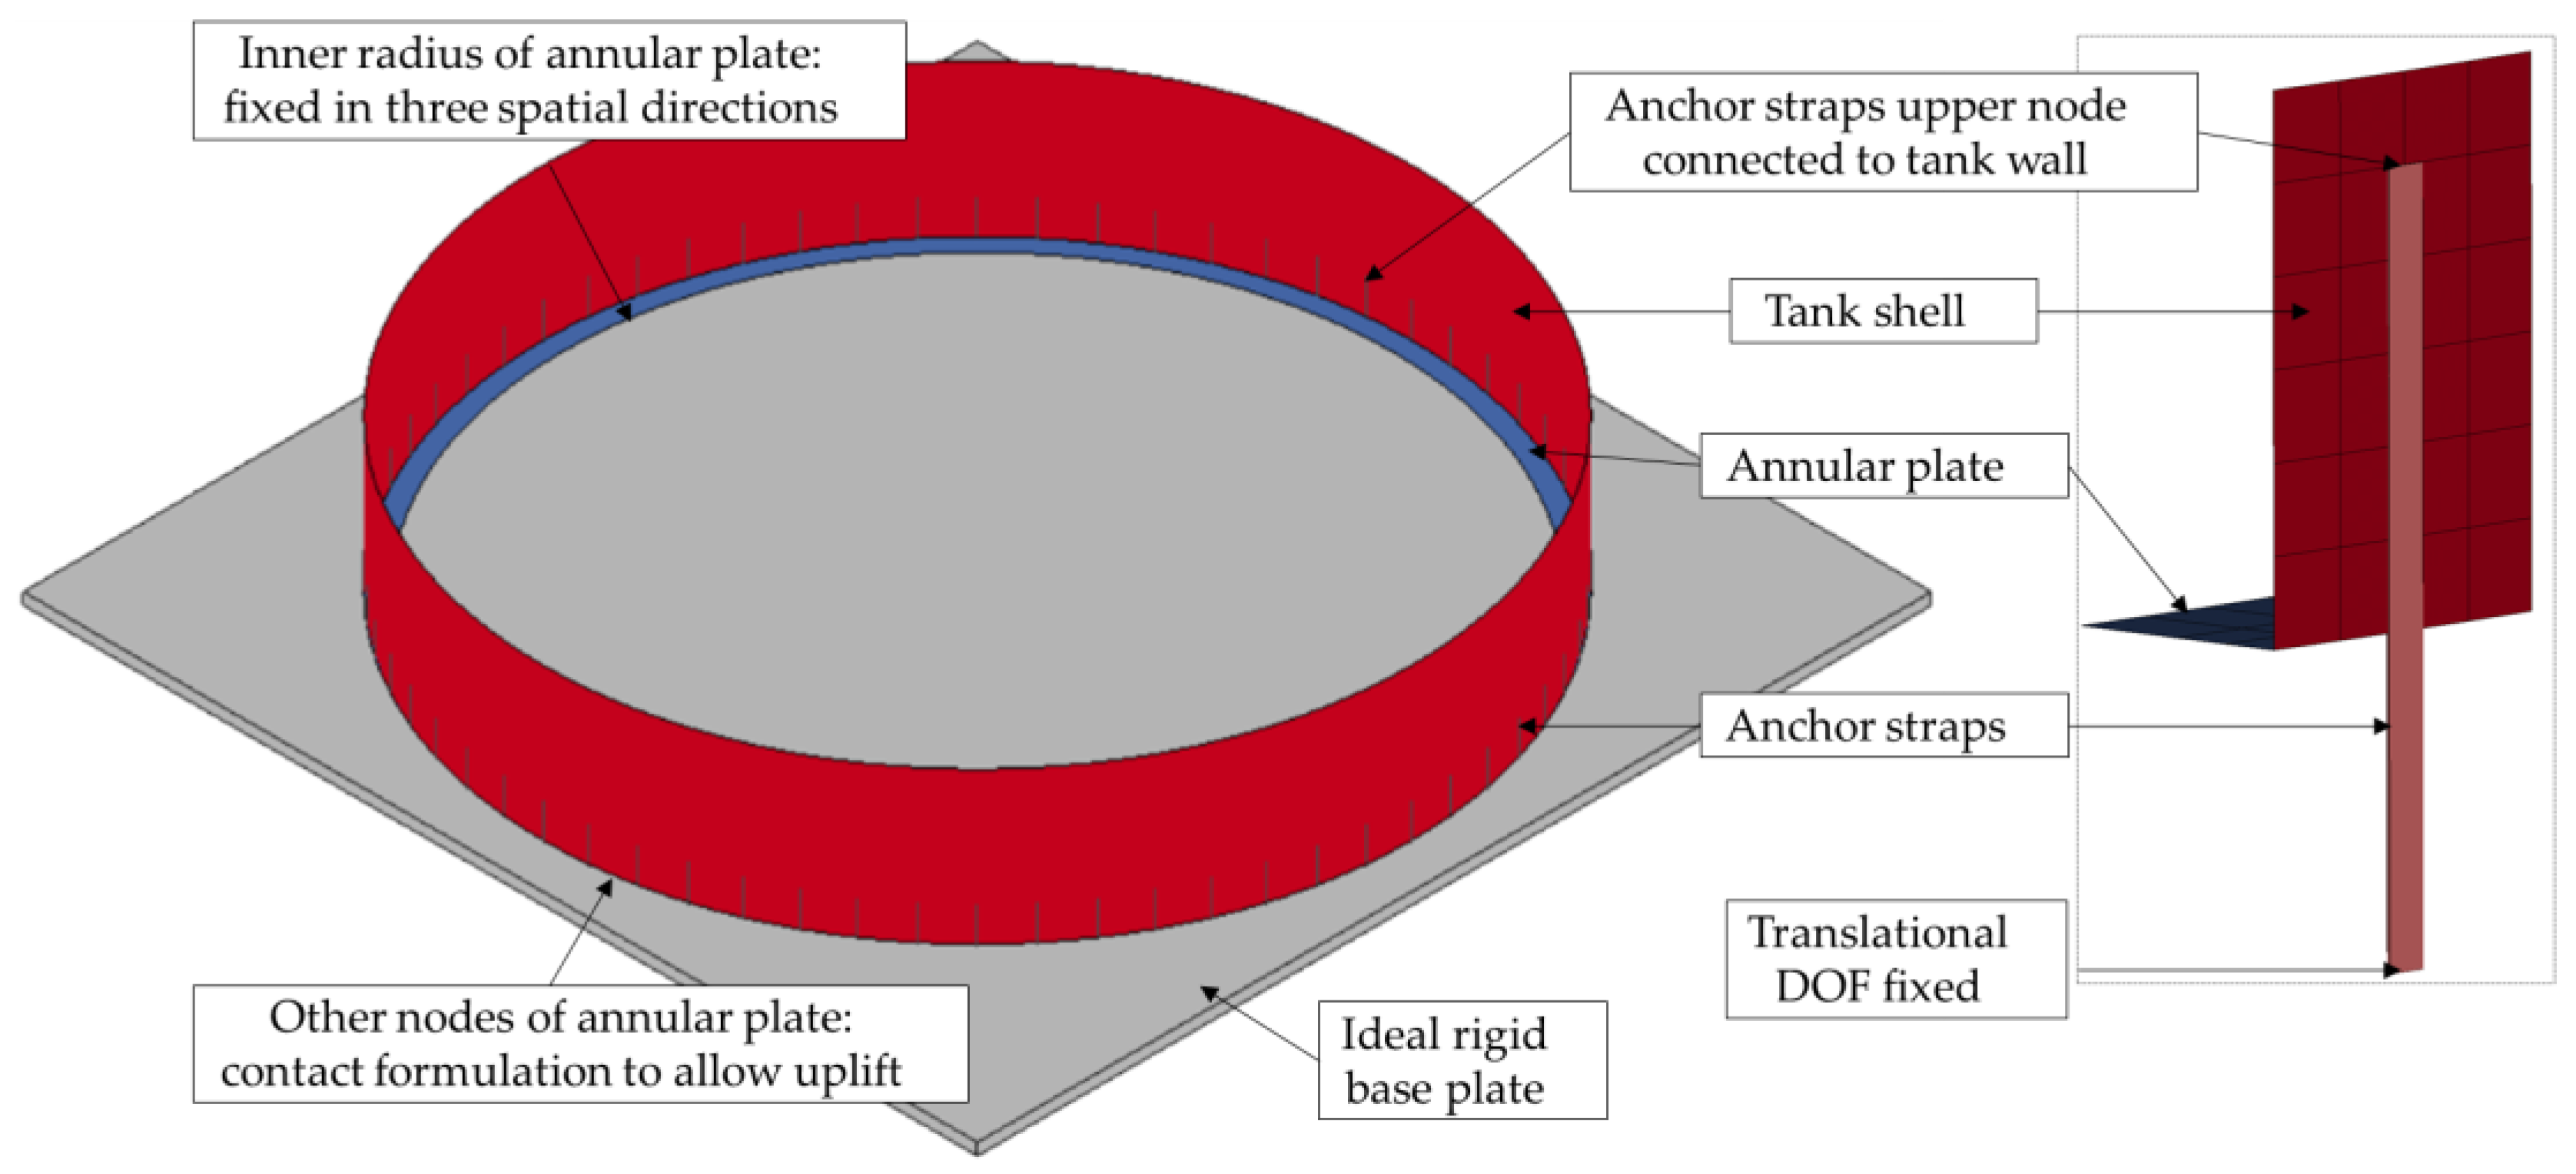
Lifting of the tank wall at the tank base due to overturning moments induced by the detonation load would, in principle, be possible. For the simulation, it is assumed that uplift can occur over the entire width of the annular ring. At the center-bottom plate, however, uplift is prevented by the restraining effects of the inner tanks’ weight and the filling. This is represented by the following boundary conditions (see also Figure 6):
  • On the inside radius of the annular plate, the nodes are fixed in the three directions of translation. This represents the fixing effect of the bottom plate between the rigid foundation and the load of the inner tank.
  • A contact definition between the ground and the other node of the annular plate allows uplift of the nodes but not penetration.
  • The upper end of each anchor strip is connected to the tank wall via congruent nodes. The displacement degrees of freedom of the lower nodes of the anchor strips are locked in the three translational directions.

3.3. Material Constitutive Models

The construction material of the representative tank is defined as steel with the designation P355 NL2, a fine-grained, weldable steel, normalized material with high toughness at cold temperatures, used, for example, for highly stressed welded joints and pressure vessels. The mechanical properties, which are considered for the material of all components of the representative tank structure, are summarized in Table 1. Nominal material values according to DIN EN 10028-3 [51] at room temperature are considered.
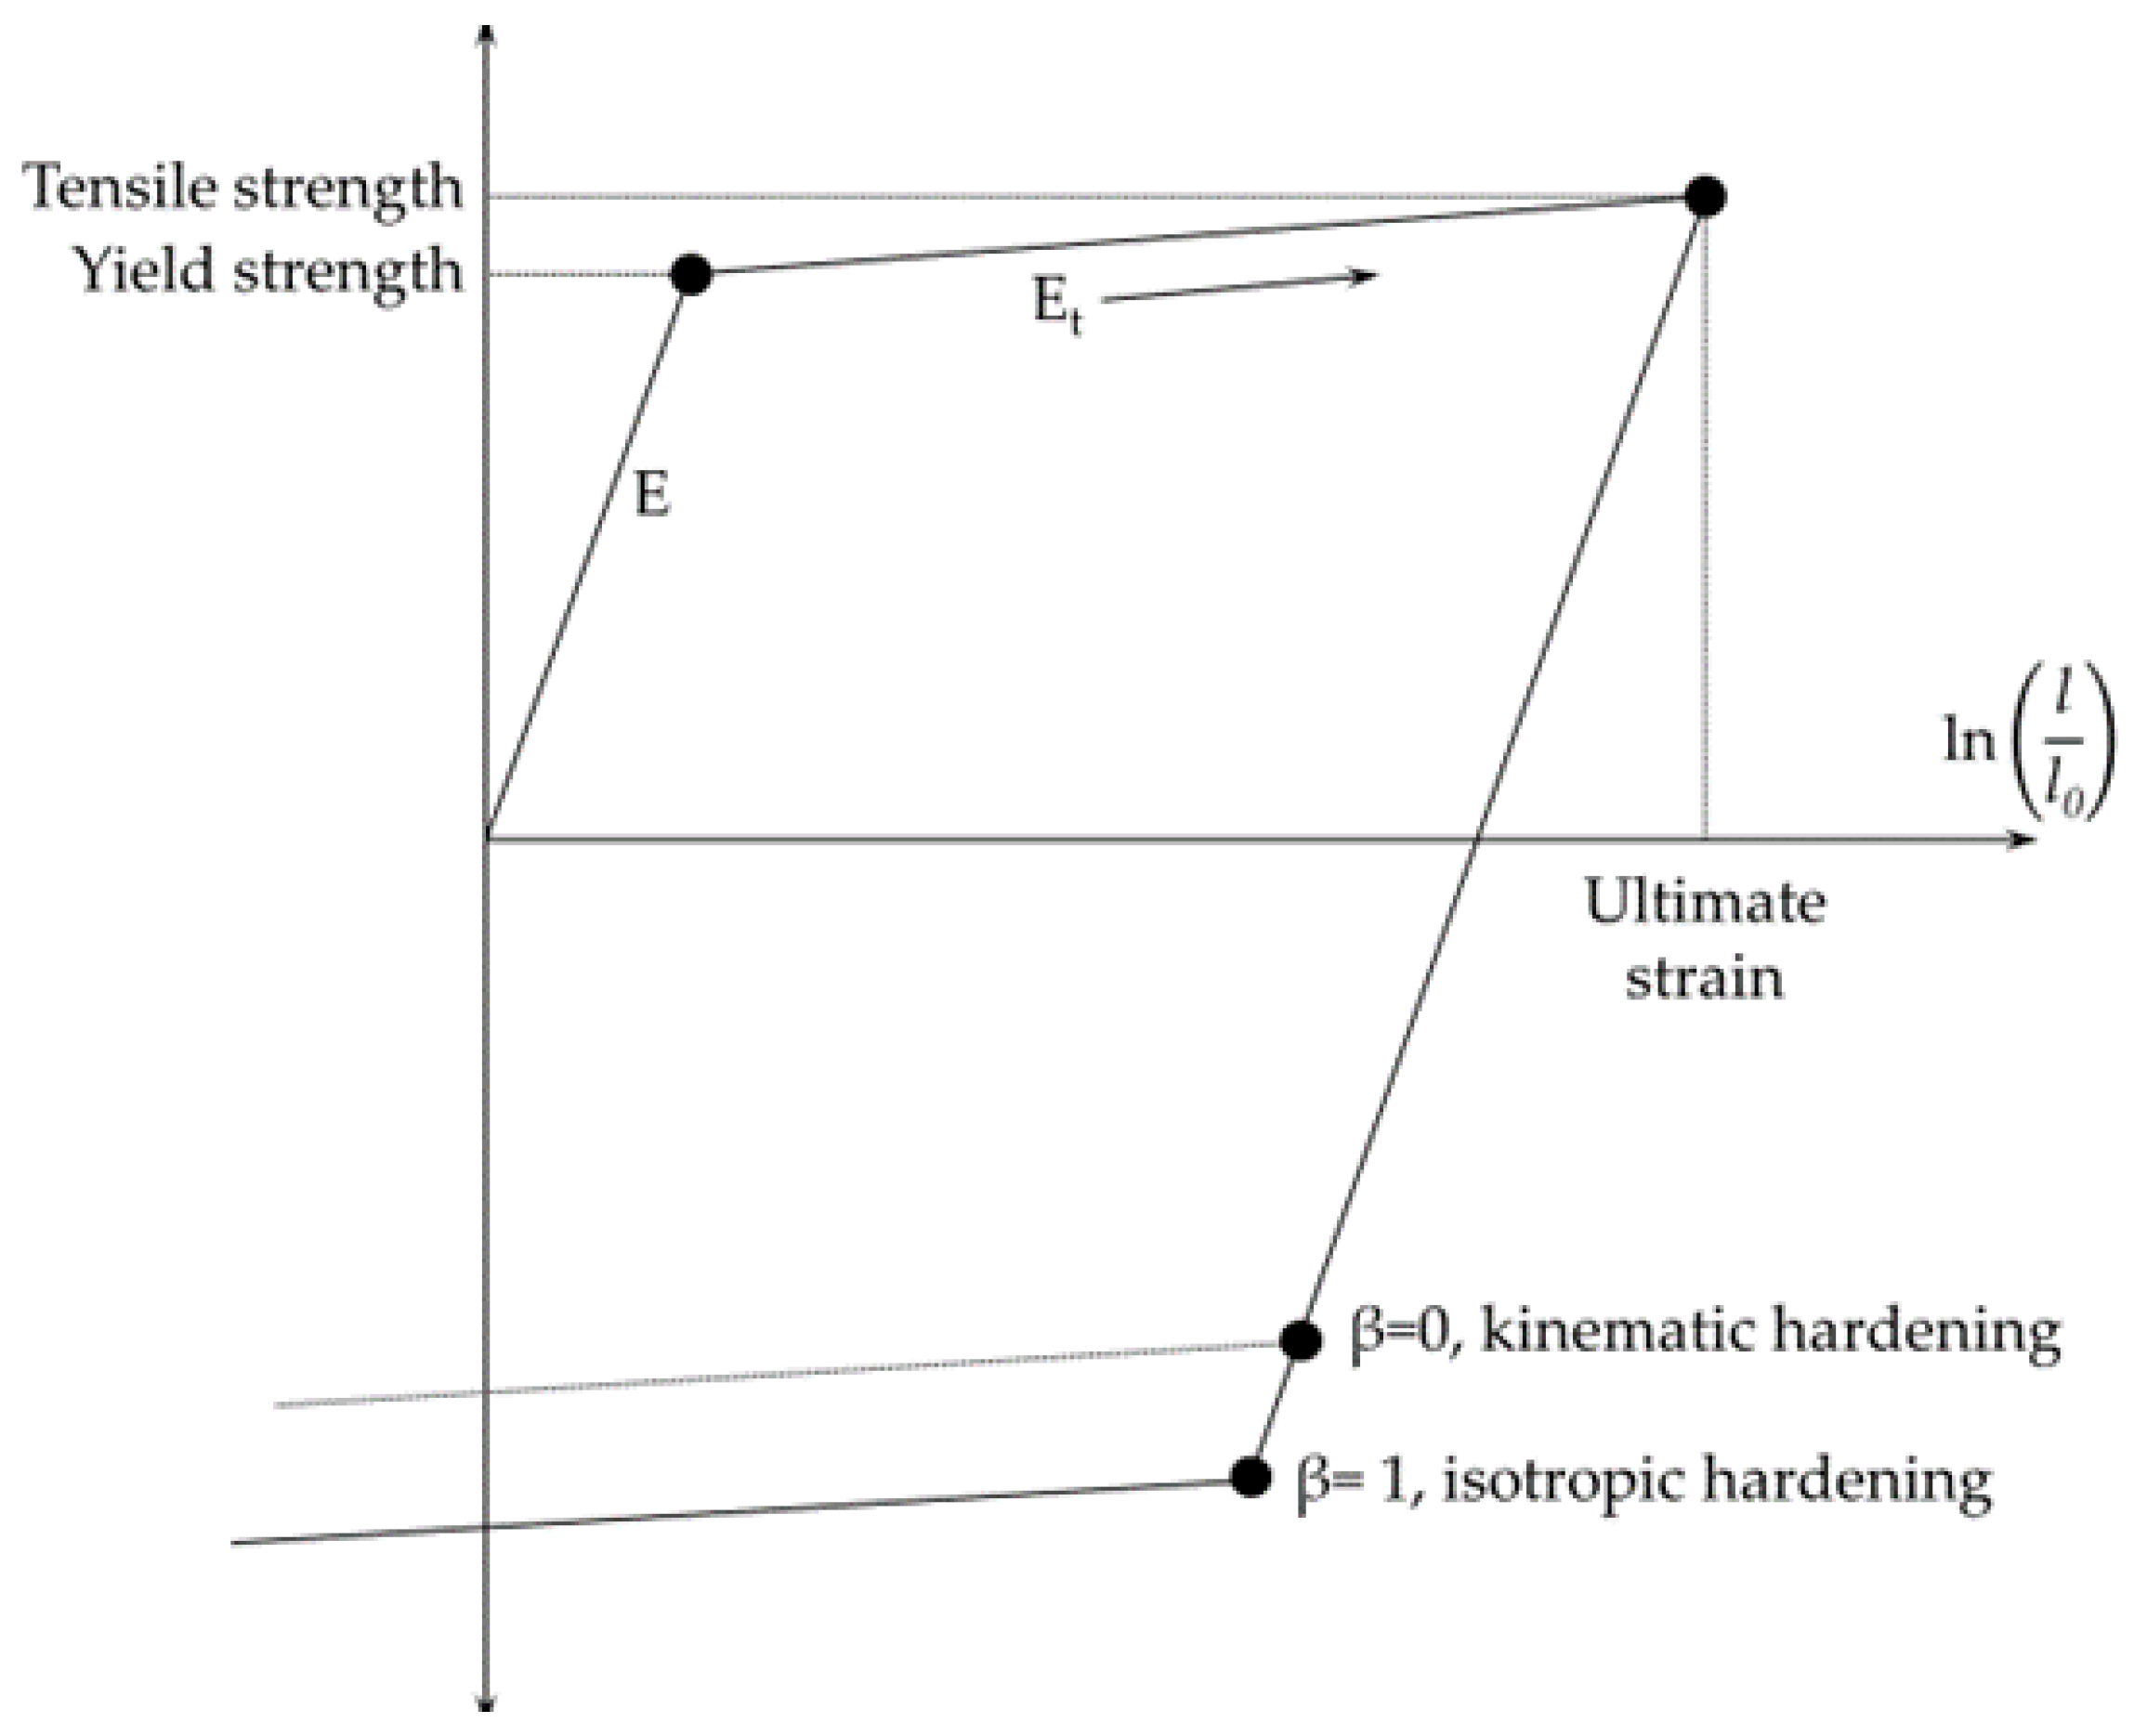
The force–displacement behavior of the steel can be described using a simple bilinear material formulation. A bilinear material constitutive model represents the behavior of steel by dividing the stress–strain curve into two linear segments. The first segment represents the elastic behavior of the steel until it reaches the yield point. The second segment represents the plastic behavior of the steel after the yield point is exceeded (Figure 7). The simplified model uses these two segments to accurately simulate the nonlinear response of steel structures under varying loads. Hardening effects are considered with the tangent modulus that can be determined using the following equation:
E t = f u k f y k ( ϵ B 0.002 ) f y k E ,
with the parameters being explained in Table 1. Such a bilinear material formulation is one of the simplest ways of mapping nonlinear material behavior. A further formulation captures the transition from the elastic to the plastic region with multiple points of the load-deformation curve. It also considers strain rate effects, where materials exhibit higher resistances at faster loading rates. Especially for highly dynamic loads that generate structural responses in the yield limit range, material formulations that take strain rate effects into account are often used. This approach is more complex but provides a more accurate representation of the material’s behavior than the bilinear formulation and can lead to higher utilization of the material properties in the simulation for loads that stress the steel around the yield point and into plastic deformation ranges.
One widely used example is the simplified Johnson–Cook model that determines the yield stress σy according to Equation (6):
σ y = A + B   ·   ε ¯ p n 1 + C   ·   ln ε ˙ * .
A, B, N, and C are material parameters, ε ¯ p is the effective plastic strain, and ε ˙ * is the normalized plastic strain rate. Material failure is defined by a critical plastic strain. If the plastic strain exceeds the critical strain, the correspondent element has no further strength. In the current problem, the load level is below the threshold for failure. The beam and shell elements of the finite-element model consider a linear equation of state to the describe the pressure state:
p = K · V , K = 2 · G   1 + ν 3   1 2 · ν , G = E 2   1 + ν ,
with p being the pressure, K the elastic bulk modulus, V the element volume, G the shear modulus and ν the Poisson’s ratio. Several studies have utilized the Johnson–Cook plasticity model to investigate the structural response of materials for various applications such as metal cutting, welding, ballistic impact, and blast, as these processes are associated with large strains and high strain rates [52]. The authors of [53] provide a review of the model and its implementation into several software packages. Application examples are given, e.g., in [54,55].
In order to show the differences between both approaches, the bilinear material formulation (*Mat_Plastic_Kinematik, *MAT003) as well as a material formulation including strain rate effects (*Mat_Simplified_Johnson_Cook, *MAT098) will be investigated. The adopted parameters used for the bilinear as well as for the simplified Johnson–Cook model are reported in Table 1 and Table 2.

3.4. Blast Load

In the present study, an idealized equivalent time-dependent pressure wave according to Figure 8 representing a high pressure and long duration over pressure is considered. The maximal peak reflected pressure acting on the tank is set to 30 kPa. The overpressure function is set as a linear function with the same gradient in increasing and decreasing parts. As already mentioned in the introduction, the load scenario was selected based on its inclusion as a requirement for safe tank design in both the Belgian and Dutch guidelines [13,14].
In contrast to shock waves for a triangular pressure wave according to Figure 8, rules to determine the blast parameter like the ratio of reflected to incident pressure, pressure wave velocity and time of arrival of the pressure wave depending on the scaled distance Z are not available. The pressure wave velocity could be determined using appropriate formulas that would also allow determining the time of arrival. However, the ratio of reflected to incident pressure remains unknown. The current state of knowledge precludes the determination of the distance- and time-dependent pressure distribution along both the tank circumference and height without having specific information about the source of the blast pressure.
In [30], it is proposed to adopt the blast parameter of a shock wave in order to transfer their distance-related behavior to the triangle pressure shape. With impulse equality, a pressure wave can be transferred to a shock wave and vice versa. That means that each ideal pressure wave can be converted to a corresponding shock wave with congruent impulse and peak pressure [23,30], as depicted in Figure 9. This method is inspired by the TNT equivalence method of blast prediction for vapor cloud explosions. As already mentioned in Section 2.3, this method is considered inaccurate [33]. However, the points of criticism relate to the fact that the conversion of the explosion source of highly flammable substances into the corresponding TNT equivalent is difficult to capture and prone to error. However, since the resulting pressure has already been determined in the present research (Figure 8) and only the missing blast parameters are to be determined, the points of concern regarding TNT equivalence appear negligible.
With the maximal peak reflective pressure specified in Figure 8, a fictive scaled distance can be determined, for example, by using the Kingery–Bulmash [35] or similar equations. From the impulse equality, it is possible to derive the scaled distance, then an equivalent TNT mass and a distance according to Equation (1). Furthermore, the blast equations allow the determination of blast parameters like the shock wave velocity and time of arrival, which can be adapted for the impulse-equal pressure wave.
Since the Kingery–Bulmash equations [35] are quite advanced for practical application, in this study, the modified blast equations proposed by Jeon et al. [56] are used. The following procedure to determine the resulting distance-related, time-dependent pressure load acting on the tank is developed:
  • The maximal peak reflected pressure is set to 30 kPa; the positive phase duration of the pressure wave is defined with 300 ms. The impulse amounts to 4500 kPa ms.
  • With the maximal peak reflected pressure of 30 kP, the scaled distance is calculated as Z = 8.365 m/kg1/3 according to Jeon et al. [56].
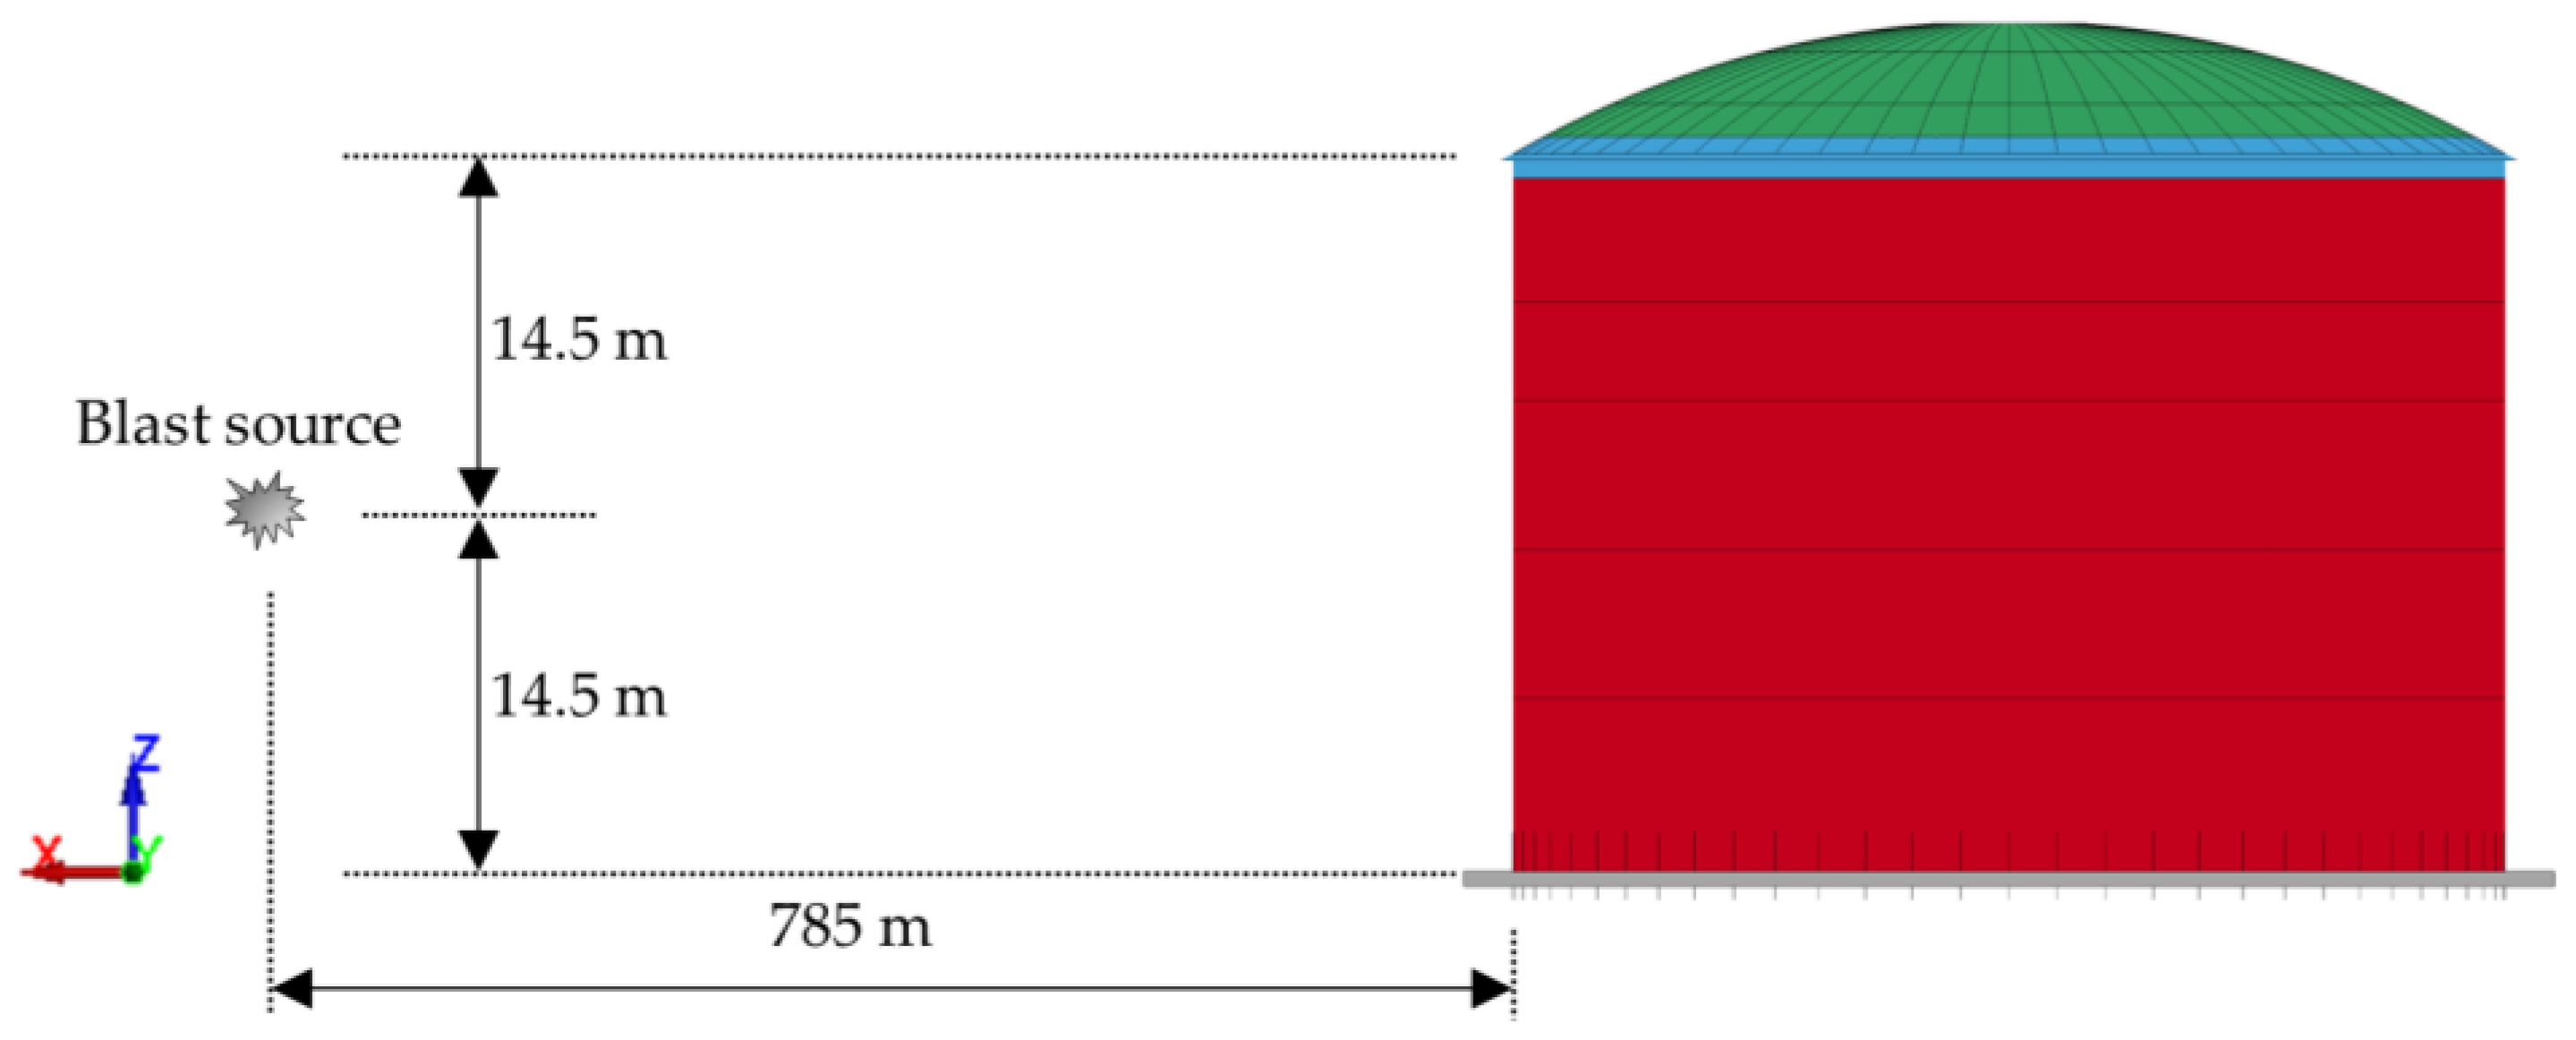
  • With impulse equality (Iref = 4500 kPa ms), the blast equation of [56] and Equation (1), a distance R and equivalent TNT-mass W can be determined: R = 785 m, W = 826.44 to.
  • An explosion scenario is therefore established. In this contribution, the blast source is set to a point in the positive x-direction as seen from the center of the tank (Figure 10). In relation to the height of the tank, a position halfway up the cylinder is selected. For each element of the tank structure, the corresponding scaled distance Z is determined.
  • For each element of the tank structure, the angle of incidence is determined.
  • For each element of the tank structure, the peak reflected pressure, peak incident pressure, time of arrival of the pressure wave and positive pressure phase duration are determined according to the modified blast equation proposed by Jeon et al. [56]. The effective pressure for each element is determined according to Equation (3).

3.5. Calculation Approach

A multi-step simulation method with explicit time integration is selected. In the first step, the static loads (dead load and internal design pressure of 50 mbar-g) are applied, linearly increasing within a time range of 300 ms. The control of the energy balance shows that with this slow load increase, no undesired dynamic effects are inserted into the system. After that, the structure remains in the loading condition for 200 ms to further control the quasi-static state. Afterwards, the blast load is applied as a pressure time history. At time 608 ms, the blast load hits the first element of the model; at time 719 ms, the last element starts being loaded. After 1022 ms, the pressure wave leaves the last elements of the tank model. The calculation continues until a total duration of 1.1 s. According to the recommendation outlined in [23] (paragraph 6.4.1), elastic material damping is conservatively ignored in the blast analyses. This is justified by the short time in which the structure reaches its maximum response. Thus, damping effects have little influence on peak displacements.
A comprehensive numerical dynamic study that reflects the behavior of the tank at different levels of computational acuity is performed. This may provide guidance for future studies to choose the optimal and most efficient calculation approach. The underlying basics of the different calculations are explained in detail below.
Two calculation runs are performed to comprehensively capture the roof stress and overall uplift loading (see Section 2.5):
  • Roof compression load;
  • Roof suction load.
Additionally, two calculations each are performed considering different load applications with the idealized pressure wave according to Figure 8:
  • A uniform peak pressure amplitude of 30 kPa to one half of the tank model. In this easily applicable approach, pressure wave propagation effects related to the decrease in the peak pressure explained in Section 2.2 are neglected. The peak pressure of 30 kPa is applied to each shell element of the blast-loaded side of the simulation model according to the proposal of [31] depicted in Figure 3. The rear side remains unloaded.
  • Consideration of varying pressure amplitude depending on scaled distance and angle of incidence according to the procedure is described in Section 3.4. In this more accurate but also more elaborate approach, the peak reflected pressure, peak incident pressure, and positive phase duration are determined for each shell element of the simulation model. The effective pressure according to Equation (3) is applied to each shell element.
Next, two different material approaches will be investigated (see Section 3.4):
  • A simplified bilinear approach (BL);
  • A Johnson–Cook material formulation (JC) considering strain rate effects.
Furthermore, an analysis is also carried out using a shock wave approach. The blast scenario with an equivalent TNT mass of W = 826.44 to and a distance R = 785 m is applied using LBE in LS-Dyna. A spherical air burst without amplification of the initial shock wave due to interaction with the ground surface and without negative phase duration is considered. The results of this impulse-congruent shock wave load are compared with the results of the pressure wave load to quantify differences in the structural response. Since, in this approach, the roof loading follows the approach depicted in Figure 2, compression of the roof load will result.
Finally, a static implicit analysis is performed with the same numerical model according to the proposal of [47]. In addition to an explicit dynamic analysis, LS-Dyna software also allows implicit and static calculations to be carried out. In some cases, adjustments to the element and/or material selection are required. In the present research, however, the selected elements and material formulations are equally suitable for an explicit and implicit analysis, so no adjustments need to be made. Since simulations with static equivalent loads are still widely used in engineering practice due to their simple application, such an analysis based on the method of [47] by use of the DLF concept is carried out here. Depending on the ratio td/TN, the dynamic load factor DLF has to be determined with the diagram given in [16,47]. An implicit modal analysis was carried out to calculate the natural period as TN = 0.3694 s. With td = 300 ms, DLF = 1.52. This factor serves as a scaling factor for the pressure distribution applied to the tank shell. According to Figure 4, the pressure distribution around the circumference of the tank depends on the angle of circumference. Reference values for the circumferential angles θ of 0°, 60°, 90° and 180° are specified with the maximal value at θ = 60°, pmax = 57 kPa. As no further information is given in [47], the curve between the four points is approximated linearly. This circumferential distribution is assumed for each height node of the tank. As [47] does not provide any information on the loading of the tank roof, the roof remains unloaded in the static analysis. The static analysis is performed primarily as a comparison and to classify the dynamic analyses with respect to the behavior of the tank shell.
In summary, a total of 11 simulation runs were performed on the tank structure (Table 3). Figure 11 shows the distribution of the peak pressure over the tank circumference for the various simulations. Considering the mentioned mesh size (see Section 3.2), a simulation run takes about 2.5 h on an eight-core workstation with double precision.

4. Results

4.1. Static Simulation

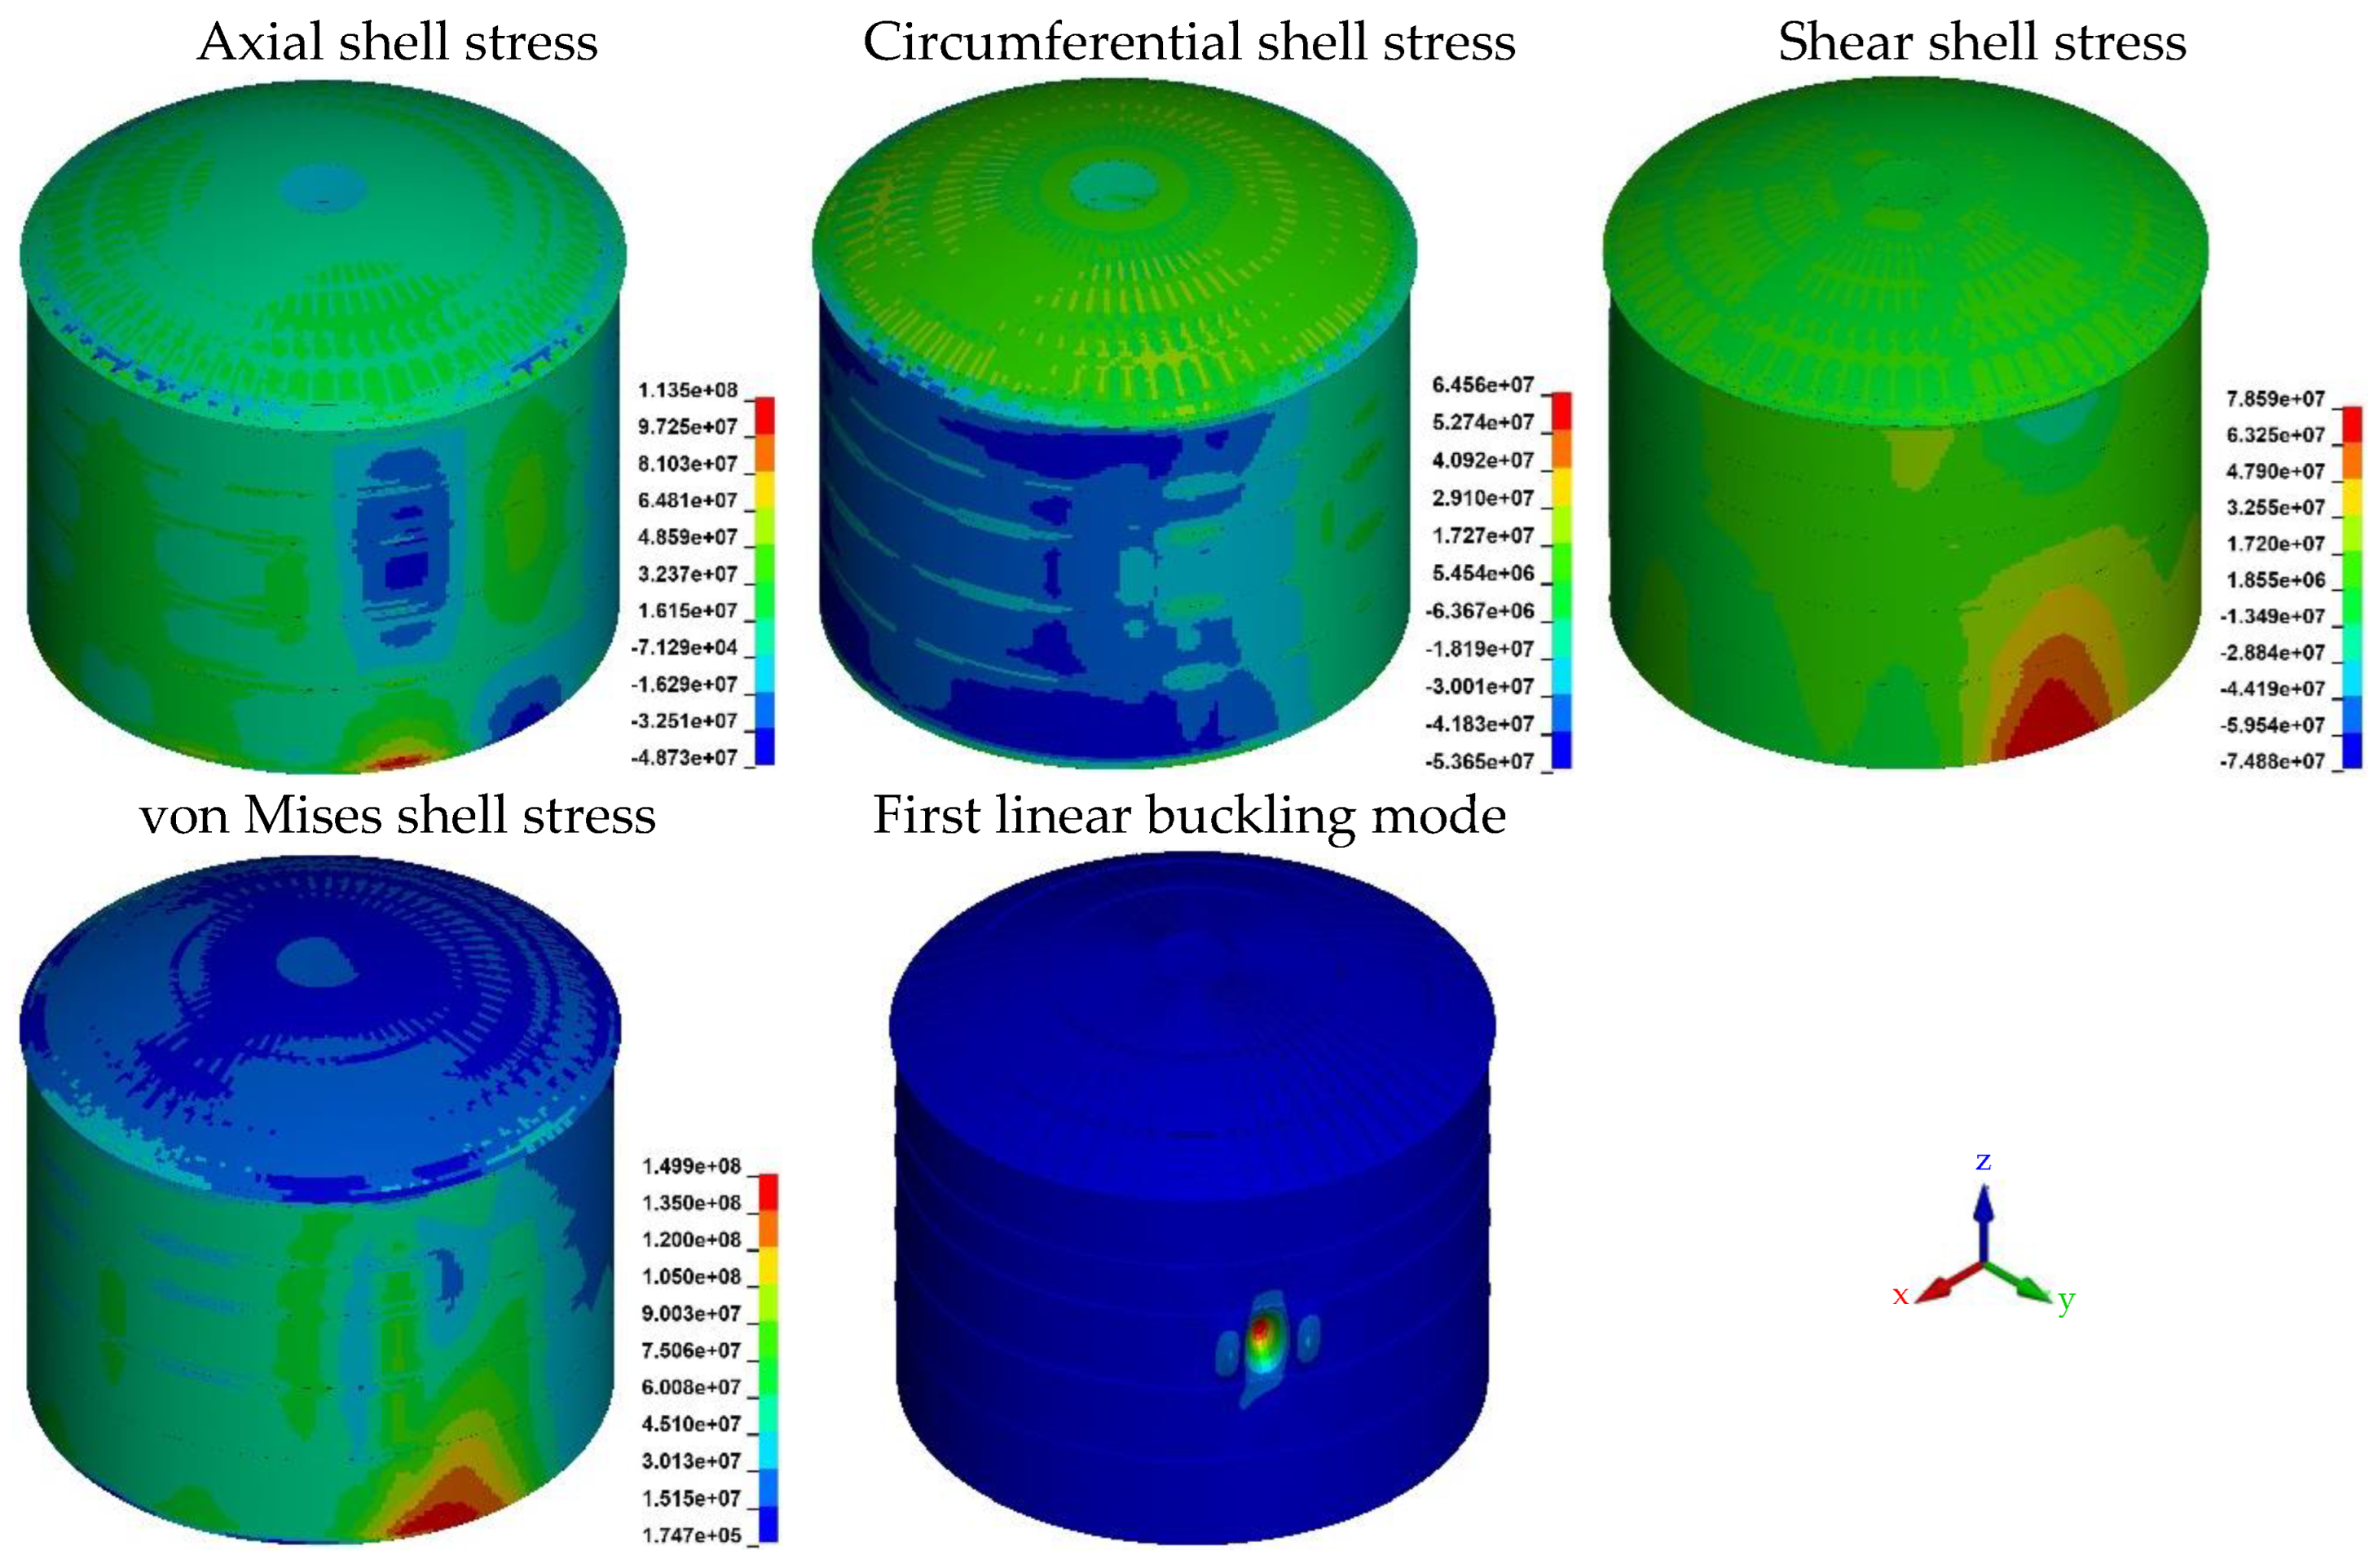
A statically non-linear, implicit analysis does not provide convergence and thus provides no result. A static linear analysis by use of an elastic material formulation (*MAT001 keycard in LS-Dyna) yields the stresses shown in Figure 12 in the axial direction, circumferential direction, shear, and the von Mises equivalent stress. The von Mises equivalent stress with a maximal value of 150 MPa is below the plastic limit of 345 MPa. However, a linear bifurcation analysis results in a load factor of 0.81 and the eigenmode given in Figure 12. This can be used in combination with the maximal von Mises equivalent stress for a buckling safety verification according to DIN EN 1993-1-6 [49] in accordance with the LBA/MNA method [57]. DIN EN 1993-1-6 [49] applies to the design of steel shells under actions, which may be treated as quasi-static. It therefore generally cannot be used for structures subject to explosion loads, but it can be used for the static analysis presented here. The LBA/MNA method combines a linear bifurcation analysis (LBA) with a material non-linear analysis (MNA; alternatively, the equivalent stress value can be used [57]) and produces a verification result of 0.37 for the problem at hand, which is unsafe. A positive verification would require values above 1.0.

4.2. Dynamic Simulations

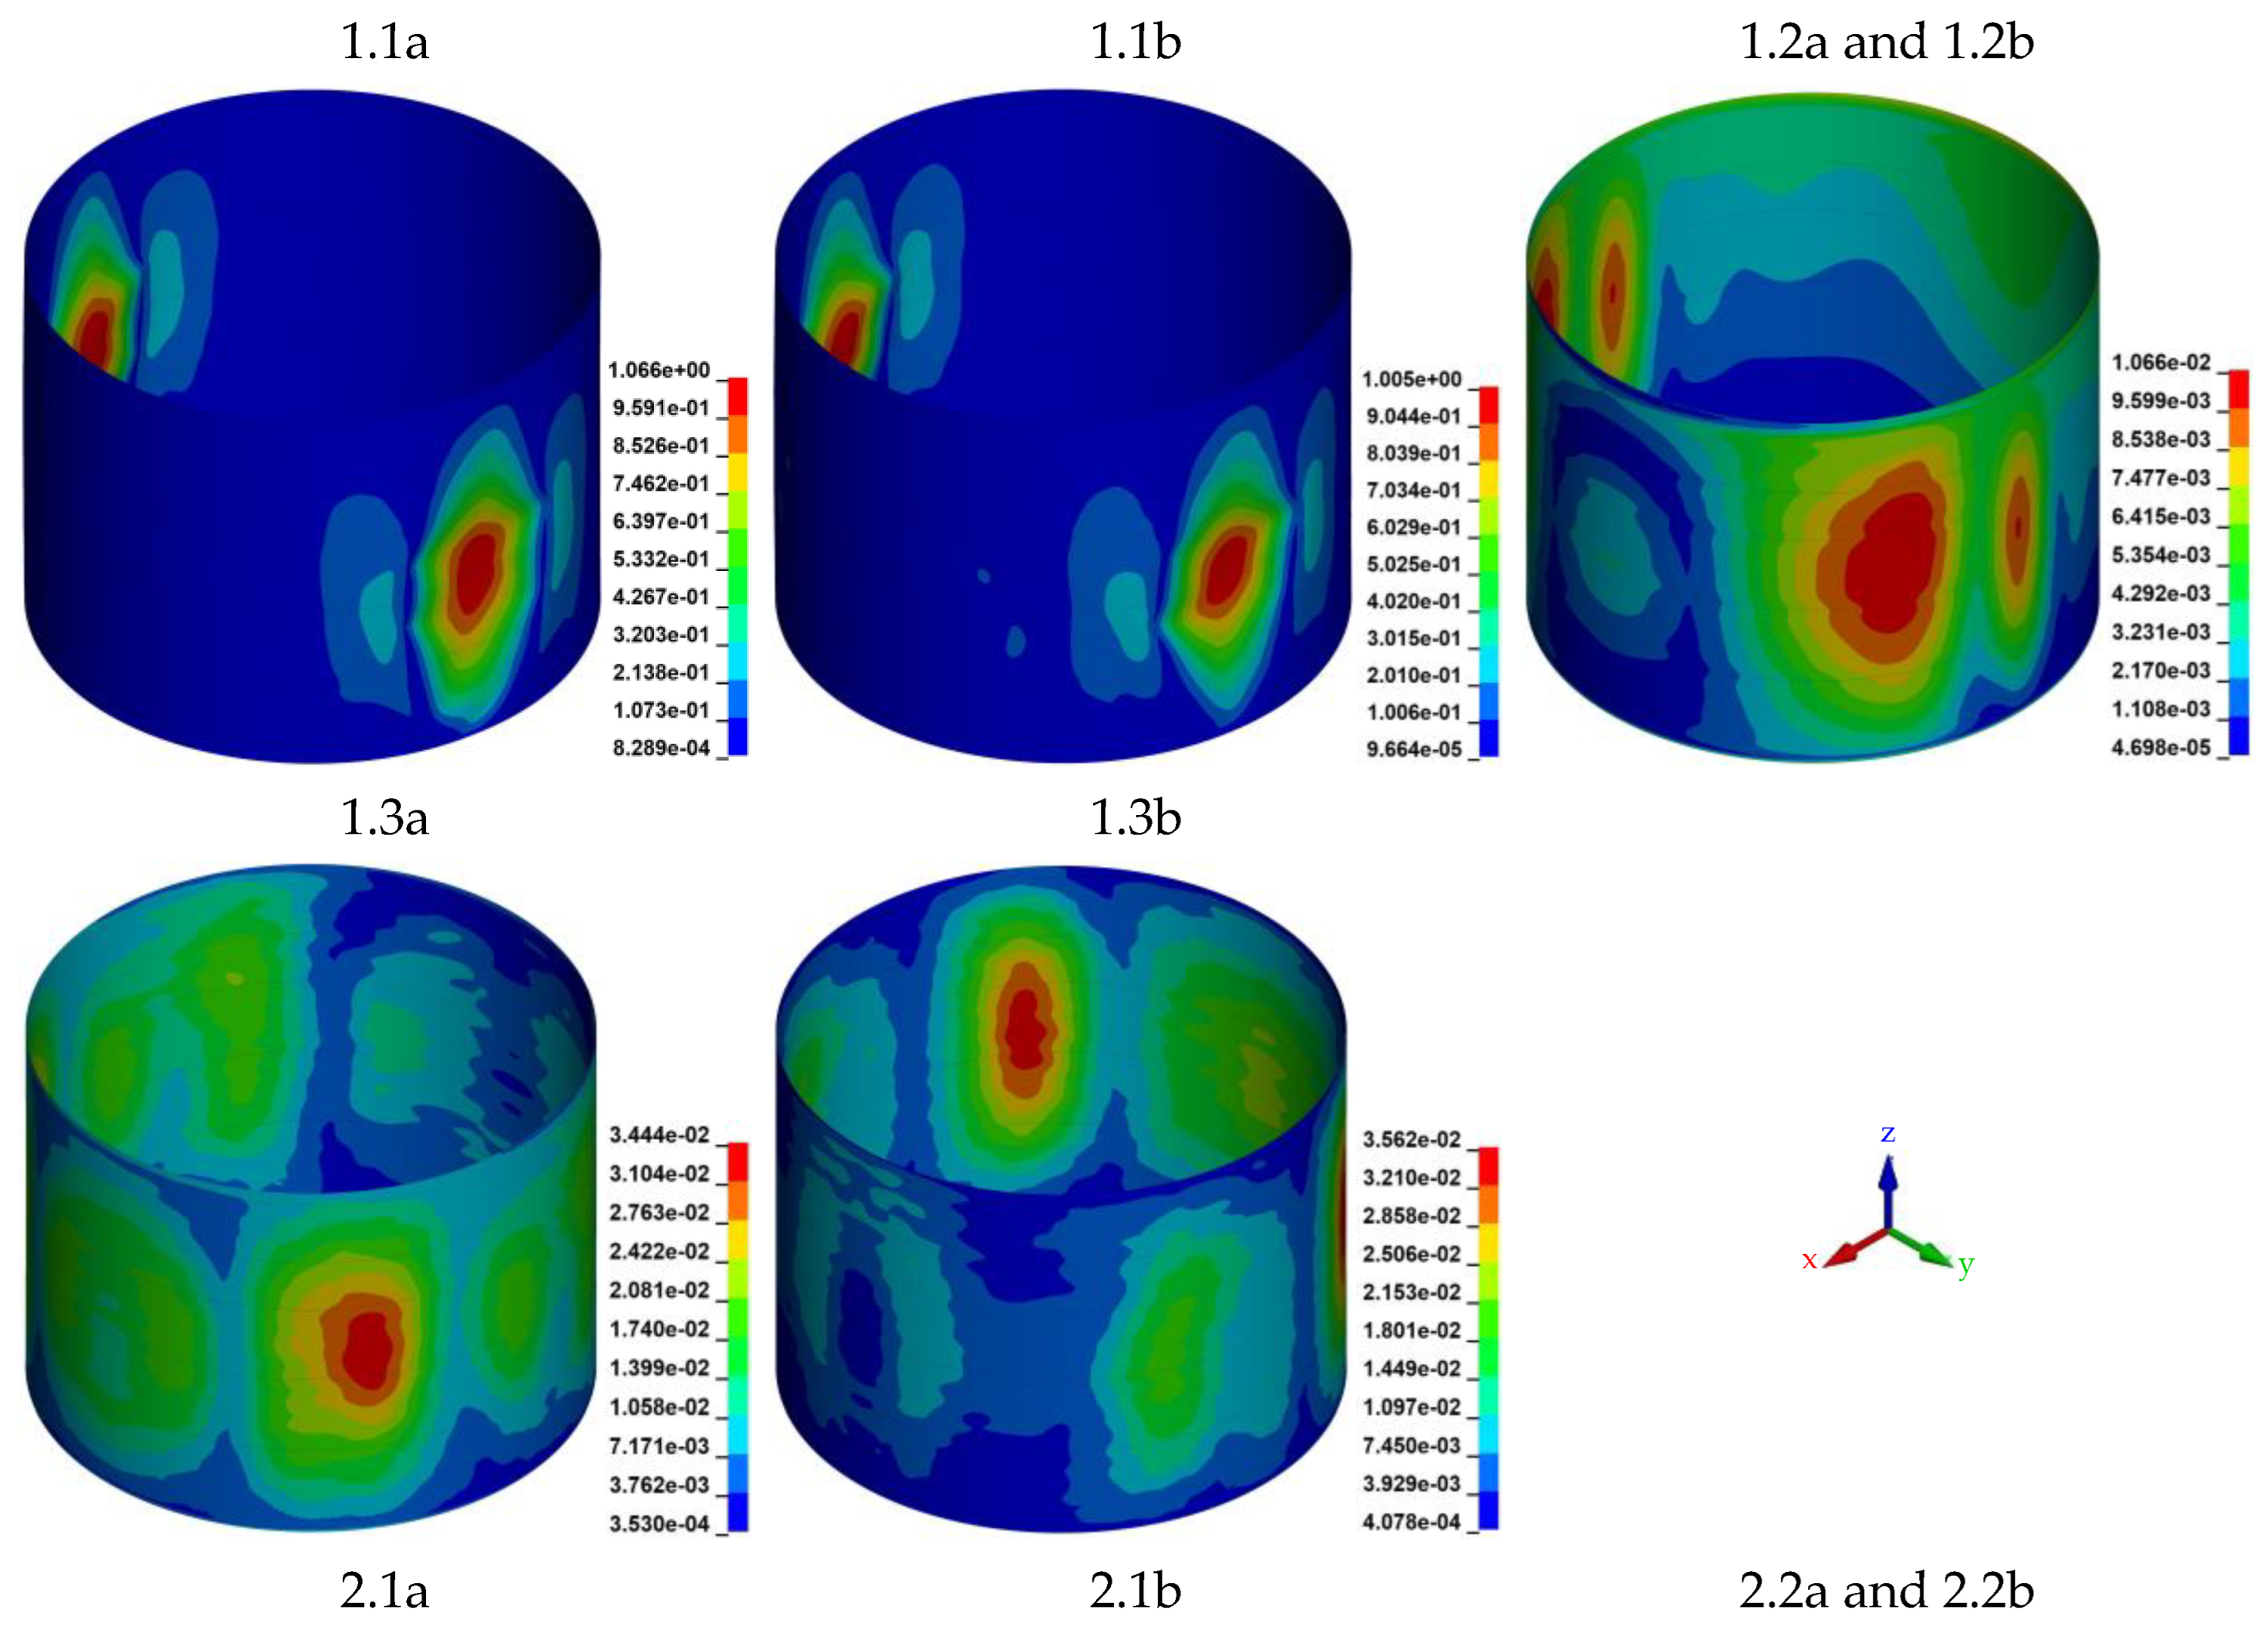
Table 4 summarizes the results of the dynamic simulations. The maximum von Mises equivalent stresses and plastic strains of the cylindrical shell, roof dome, ring and roof stiffeners and rafters (beam) and anchors are evaluated. In addition, the deformations of the cylindrical shell and roof as well as the maximum uplift height are analyzed. Furthermore, Figure 13 displays the stress distribution of the overall tank while Figure 14 depicts the displacement figures of the cylindrical tank shell. The description of the results uses the following location descriptions along the tank circumference:
  • Frontal tank wall: the tank wall in the direction of the explosion source.
  • Tank wall sides: the tank wall parallel to the direction of the explosion source.
  • Tank rear wall: the tank wall on the side facing away from the explosion pressure wave.
Figure 13 shows the von Mises equivalent stress for the various configurations of the dynamic calculation. For all figures, the color scale is selected so that the maximum value is at the nominal yield point of 345 MPa. This means that areas showing stress values of this order of magnitude or higher are displayed in red and are easily comparable. As expected, the different load profiles and material formulations used in the analyses show different results.
Applying a uniform surface pressure to half of the cylinder and the roof (Simulation 1.1a/-b) results in high stresses in the order of magnitude and above the yield on the tank wall sides, where the loaded tank shell presses against the unloaded shell. This results in plastic strain (Table 4). Maximal lifting heights of 79 mm in Simulation 1.1a and 61 mm in Simulation 1.1b and plastic strain of the anchorage are also observed. When using the Johnson–Cook (JC) formulation with the more accurate modeling of the material at the transition to the plastic region, strain rate effects are taken into account, which lead to smaller plastic deformations overall; for instance, in the tank shell, the plastic strains are only 63% compared to bilinear (BL) material formulation (ϵpl,shell,JC = 0.904%, ϵpl,shell,BL = 1.444%, ϵpl,shell,JCpl,shell,BL = 0.63; for further values, see Table 4). The pressure distribution used in Simulations 1.2a and 1.2b, on the other hand, generates von Mises equivalent stresses far below the yield point (Figure 13). The maximum stresses in the roof are 233 MPa, approximately two thirds of the nominal yield point of 345 MPa. The variation in the material formulation therefore shows no effect here; the results are identical. The anchorage remains elastic while a rather low lifting height of 6 mm at most occurs.
The approach of shock wave loading using LBE (Simulations 1.3a/-b) generates a stress distribution that reaches the yield limit in the elements of the roof, ring stiffeners and anchorage and causes plastic strains (Figure 13, Table 4). However, these are far below those from Simulations 1.1a/-b (see, e.g., in Table 4, Simulations 1.1a and 1.3a: ϵpl,roof,1.1a = 0.249% ≫ ϵpl,roof,1.3a = 0.067%). At the maximum lifting height of 11 mm, the anchorage undergoes minimal plastic deformation.
When applying a suction load to the roof, the stress distributions are essentially qualitatively comparable to the simulations with roof compressive load. Simulations 2.1a and 2.1b show, analogous to Simulations 1.1a and 1.1b, high stresses on tank wall sides in the area and above the yield strength (Figure 13). For both material formulations, slightly lower or equal values result when applying the roof suction load (Table 4) in comparison to compression. Additionally, the stresses of the anchors and the uplifting heights are slightly lower, even though the roof suction load should induce higher uplifting forces.
A look at the deformation plots in Figure 14 shows deformations congruent with the stress results. The analyses with the application of the uniform pressure load to half the tank circumference and roof (Simulations 1.1a/-b) show heavily deformed areas on the tank wall sides. The maximum deformations are approximately 1 m. Nearly the same applied to Simulations 2.1a/-b, indicating that the roof load does not influence the tank shell’s deformation. Significantly smaller deformations result in Simulations 1.2a/-b; here—with purely elastic material behavior (the minimal plastic strain of the anchorage ϵpl,anchor,2.1a = 0.005% can be neglected)—maximum deformations of 11 mm result in the tank shell and similarly on the tank wall sides, but with the location of the maximal value being moved a little more to the tank front. The equivalent analyses with roof suction load (Simulations 2.2a/-b) show different behavior here: the maximum deformation of 17 mm is concentrated on the compression ring, which forms the transition to the roof.

5. Discussion

Compared with the results of the more precise dynamic analyses, the analysis with static equivalent loads leads to very conservative results. Using the static equivalent calculation method, a steel tank cannot be qualified for the blast scenario, which is in contrast to the results of the other analyses. This method should therefore not be used for the economic design of tank structures of any kind of material subject to blast loads.
The load behavior in all dynamic analyses follows a similar approach: maximum stresses and deformations occur along the tank wall sides parallel to the direction towards the explosion source. If the highly stressed sides of the tank are taken together from all analyses, this corresponds to a range of approximately 60° to 120° of the circumferential angles. This structural response is mostly well reproduced by all analyses. Only the analyses with a roof suction load and varying compressive load (Simulation 2.2a/-b) show the tank wall–roof transition as the area subject to the highest stress and deformation.
The simplified load application with uniform pressure over half of the tank seems to produce very conservative results. The unloaded side facing away from the explosion source neglects the shell load-bearing behavior due to the supporting effect inherent in a cylindrical shell under full circumferential pressure, which is also present in the case of non-uniform circumferential pressure (different pressure amplitudes along the circumference). The stress level is calculated to be relatively high. Here, it is to be expected that an adequate design of the tank based on this approach either leads to higher material consumption (thicker shells or more wall stiffeners) or the use of steel with a significantly higher yield strength. For the latter, it should be noted that [23] advises to avoid the use of high-strength materials (greater than a nominal 350 MPa yield) in most blast applications to prevent problems with decreased ductility. Alternatively, the use of a steel construction could be completely discarded in favor of a concrete construction when using this simple calculation approach.
The consideration of a more precise load application (Simulations 1.2a/-b, 1.3a/-b, 2.2a/-b) shows that a steel construction is basically suitable to withstand long-duration and high-pressure blast loads. Qualitatively, the results are very comparable, both when applying a pressure wave load (Simulations 1.2a/-b) and a shock wave load (Simulations 1.3a/-b). However, the latter leads to higher stresses and higher deformations. Plastic deformations occur.
Using the design criteria CL/SS proposed in Section 2.5 inspired by [23] with a limit ductility level of μ = 1, using Equation (4), the plastic deformation can be qualified. With ϵelast being determined with the nominal material values according to Table 1 to ϵelast = 0.163%, an allowable plastic strain of ϵplast = 0.0813% is obtained. A look at the plastic strains listed in Table 4 for Simulations 1.3a/-b shows that this limit value is exceeded for beam elements of Simulation 1.3a (ϵplast = 0.114%).
In contrast, the structural response is purely elastic when a pressure wave load according to the developed concept is applied. The difference between a shock wave and a pressure wave is the way in which the blast waves propagate in the surrounding environment. A shock wave is a fast, abrupt blast wave that moves at supersonic speeds. In contrast, a pressure wave is a slower wave that propagates at the speed of sound. In the present research, the approach of applying the pressure wave to the structure uses blast parameters of an impulse congruent shock wave; see Section 3.4. This also adapts the propagation velocity of the shock wave for the pressure wave. For the scenario under consideration, the propagation velocity of the wave is 360.5 m/s according to the blast equation of [56] and is therefore above the speed of sound. Strictly speaking, the Simulations 1.2a/-b and 2.2a/-b therefore consider a pressure wave with a propagation velocity that is too high. It is important to note, however, that despite the high propagation velocity, the simulations considering a pressure wave result in elastic behavior, while the comparable Simulations 1.3a/-b considering a shock wave result in plastic deformation. This is because the instantaneous and abrupt pressure increase in the shock wave leads to rapid loading of the structure, while the pressure wave causes a slower rise in pressure. Therefore, in terms of structural response, a shock wave usually generates higher stresses than an impulse and peak pressure congruent pressure wave, less because of the velocity of wave propagation and more because of the instantaneous increase in pressure.
The selection of an appropriate scenario is crucial for accurately simulating the structural response. It has been observed that a shock wave scenario tends to yield conservative results, implying a higher level of safety in comparison to the impulse-congruent pressure wave scenario. However, it is important to note that this observation is based on a single calculation example. Furthermore, it raises the question of whether pursuing conservative results, which may potentially lead to a design with excessive material usage, is advisable in times of limited resources. In addition, the present work assumes a constant tank wall thickness over the tank height. This is an accurate hypothesis for a representative structure. The construction of a real tank can be planned with a graduated wall thickness with thinner sheets in the upper tank area. The developed calculation method implies material reserves so that thinner steel sheets can also withstand the stresses.
A further controversially discussed topic is roof loading. The simulation results show that the side of the tank roof that is oriented frontally towards the explosion source exhibits the highest stresses in the tank roof. Both in the case of roof compression and roof suction loading, this part is subjected to the highest load, as the largest compression/suction coordinates occur here. For the roof panel itself, higher stresses result when a compressive load is applied than when a suction load is applied despite the static preload due to internal design pressure (Table 3, e.g., comparison of Simulations 1.2a and 2.2a). The reason for this is as follows: the tank wall/roof corner of steel tanks is always designed as a so-called compression ring in accordance with current design regulations. It can be up to twice as thick or thicker than the tank wall and the roof plate. This results in a kind of restraint for the tank wall and the roof at this point. Compressive loads on the tank wall and roof produce bending deformation with strong restraints, as illustrated in Figure 15a, while a compressive load on the tank wall with simultaneous roof suction load causes less restraint, a smoother bending figure (Figure 15b), and a smaller stress level.
As expected, the anchor forces are larger when a roof suction load is applied compared to when a roof compression load is applied.

6. Recommendation and Outlook

Analyses with static equivalent loads are easy to carry out, as no special software must be used that meets the requirements for simulations in the field of high-speed dynamics. However, the results are strongly on the conservative side, so an economic design cannot be achieved.
The TNT scenario derived in this work, which is congruent to the triangle blast load, can be used to perform an analysis with the *load_blast_enhanced feature integrated in LS-DYNA. Other software products offer comparable implementations. However, it should be noted here that the results are also slightly conservative compared with the more precise calculation.
It is therefore recommended to use the calculation method derived in this paper, which applies a time- and distance-dependent triangular pressure load for each element of the tank. The approach uses an approximate TNT equivalence but should not be confused with the TNT equivalence method for determining the effect of a vapor cloud explosion. The shortcoming of the method is that a slightly too high blast wave velocity is considered. Future work could investigate the extent to which the blast wave velocity influences the results. Future research should then deal with this specific aspect. For example, complex CFD analyses can investigate the pressure propagation onto cylindrical tanks with roofs depending on the blast scenario, tank height–radius–roof height ratios and relative position of the blast source to the tank. However, future research directions should include experimental work to support and validate the numerical analyses. The challenge here is the appropriate implementation of a slow deflagration event, as experiments are mainly conducted with explosives that represent shock wave scenarios.
The type of roof load to be considered for the design cannot be conclusively clarified with the present research. One recommendation is to consider a compression load for the design of the structure but a suction load for the design of the anchoring. This covers both cases and ensures reliability. Future work in the field of CFD simulation or experimentation is also necessary.
Design criteria for blast-loaded tanks should be based on deformation rather than on stress limits. As a blast event is considered a singular event in the design lifetime of a tank system, the adoption of the consequences defined for contingency level (CL)/safe shut-down (SS) should be considered. The allowable ductility should be chosen conservatively to μ = 1 if no further research on this is available. Consideration should be given to whether larger deformations can be permitted for the anchoring.

7. Conclusions

Tanks play a critical role in various industries, including oil and gas facilities, chemical plants, and storage terminals. This research paper focuses on the analysis of blast-loaded cylindrical steel tanks, specifically addressing long-duration and high-pressure blast events. Traditionally, steel tanks have been designed to withstand medium explosion pressures. However, the need for higher safety standards and future requirements necessitates the exploration of higher peak overpressures as well as longer duration times; understanding the structural response to blast pressure is essential for ensuring structural integrity and safety.
The study reviewed research approaches to blast load calculation and application with a focus on slow deflagration events since long-duration blast pressure typically results from slow deflagration rather than solid detonation events. The literature search revealed gaps in the analysis and design of cylindrical tanks under blast load. Therefore, a calculation concept was developed based on the results of the literature search. It enables a finite-element simulation for a triangular blast load, taking into account the time- and distance-dependent propagation of the pressure wave. Numerical analysis using the developed method is conducted on a representative ammonia steel tank geometry exposed to an explosion with a peak overpressure of 30 kPa and a 300 ms positive load duration. Furthermore, different calculation approaches have been investigated to first understand the structural response of cylindrical steel tanks subjected to long-duration and high-pressure blast loads and then qualify the individual calculation methods with respect to their usability.
The main finding reveals that steel tanks can be effectively utilized under such blast loading. The research findings suggest that steel tanks can now be considered as a viable alternative to pre-stressed reinforced concrete tanks for high explosion loads. This research thus provides a numerically verified reference for the design and verification of steel tanks subjected to explosion loads with high overpressures and long durations. This presents several advantages. Firstly, the use of steel tanks can lead to cost savings during installation and maintenance. Secondly, in light of developments in climate-neutral steel production, steel tanks offer an environmental advantage over concrete structures with high CO2 emissions. The adoption of steel tanks aligns with the goal of achieving climate neutrality and reducing the industry’s carbon footprints in terms of the latest developments in climate-friendly steel production.
In addition, the research addresses aspects controversially discussed in the literature and provides recommendations for improving the analysis and design of cylindrical steel tanks subjected to blast loads. Particularly, design criteria for blast-loaded steel tanks based on deformation limits could be derived. The recommendations have implications for the design and construction of tanks in critical infrastructure, improving safety standards, and ensuring adaptability to future utilization concepts.
In conclusion, this contribution presents a comprehensive exploration of the challenges associated with determining the distance and time dependent blast pressure distribution on tank circumference and height. The study highlights the complexity of the problem, fills a knowledge gap in existing methods, and provides a basis for future research to further improve the blast load analysis of cylindrical tank structures. The publication results might help stakeholders to achieve a reliable selection of materials and design of tank structures exposed to the risks of high-pressure and long-duration blast loads.

Author Contributions

Conceptualization, J.R. and N.B.; methodology, J.R.; software, J.R. and A.S.; validation, J.R., A.S., N.B., P.W. and T.W.; formal analysis, J.R., A.S. and J.H.; investigation, J.R., N.B., A.S. and J.H.; resources, J.R.; data curation, P.W. and T.W.; writing—original draft preparation, J.R. and N.B.; writing—review and editing, A.S., J.H., P.W. and T.W.; visualization, A.S.; supervision, J.R. and N.B.; project administration, J.R. All authors have read and agreed to the published version of the manuscript.

Funding

This research received no external funding.

Institutional Review Board Statement

Not applicable.

Informed Consent Statement

Not applicable.

Data Availability Statement

The raw data supporting the conclusions of this article will be made available by the authors on request.

Conflicts of Interest

Authors Norman Bruckhaus, Philipp Weidner and Till Waas were employed by the company Linde GmbH. The remaining authors declare that the research was conducted in the absence of any commercial or financial relationships that could be construed as a potential conflict of interest.

References

  1. Valera-Medina, A.; Bañares Alcántara, R. Techno-Economic Challenges of Green Ammonia as Energy Vector; Academic Press: London, UK, 2020; ISBN 9780128205600. [Google Scholar]
  2. Devarasetti, H. OCI to Expand Ammonia Import Terminal at Port of Rotterdam. Ship Technology [Online], 16 June 2022. Available online: https://www.ship-technology.com/news/oci-ammonia-import-terminal-port-of-rotterdam/?cf-view (accessed on 29 December 2023).
  3. Lambertz, L. Import of Green Energy: RWE Builds Ammonia Terminal in Brunsbüttel; Release 18 March 2022; RWE Press: Essen, Germany, 2022. [Google Scholar]
  4. Hanseatic Energy Hub. LNG-Terminal Stade. Available online: https://www.hanseatic-energy-hub.de/ (accessed on 29 December 2023).
  5. API STD 625; Tank Systems for Refrigerated Liquefied Gas Storage. American Petroleum Institute: Washington, DC, USA, 2021.
  6. API STD 620; Design and Construction of Large, Welded, Low-Pressure Storage Tanks. American Petroleum Institute: Washington, DC, USA, 2021.
  7. DIN EN 14620-1; Design and Manufacture of Site Built, Vertical, Cylindrical, Flat-Bottomed Steel Tanks for the Storage of Refrigerated, Liquefied Gases with Operating Temperatures between 0 °C and −165 °C—Part 1: General. Beuth Verlag: Berlin, Germany, 2006.
  8. DIN EN 14620-2; Design and Manufacture of Site Built, Vertical, Cylindrical, Flat-Bottomed Steel Tanks for the Storage of Refrigerated, Liquefied Gases with Operating Temperatures between 0 °C and −165 °C—Part 2: Metallic Components. Beuth Verlag: Berlin, Germany, 2006.
  9. DIN EN 14620-3; Design and Manufacture of Site Built, Vertical, Cylindrical, Flat-Bottomed Steel Tanks for the Storage of Refrigerated, Liquefied Gases with Operating Temperatures between 0 °C and −165 °C—Part 3: Concrete Components. Beuth Verlag: Berlin, Germany, 2006.
  10. DIN EN 14620-4; Design and Manufacture of Site Built, Vertical, Cylindrical, Flat-Bottomed Steel Tanks for the Storage of Refrigerated, Liquefied Gases with Operating Temperatures between 0 °C and −165 °C—Part 4: Insulation Components. Beuth Verlag: Berlin, Germany, 2006.
  11. DIN EN 14620-5; Design and Manufacture of Site Built, Vertical, Cylindrical, Flat-Bottomed Steel Tanks for the Storage of Refrigerated, Liquefied Gases with Operating Temperatures between 0 °C and −165 °C—Part 5: Testing, Drying, Purging and Cool-down. Beuth Verlag: Berlin, Germany, 2006.
  12. Deutsches Institut für Normung e.V. Projects: Design and Manufacture of Site Built, Vertical, Cylindrical, Flat-Bottomed Tank Systems for the Storage of Refrigerated, Liquefied Gases with Operating Temperatures between 0 °C and −196 °C—Part 7: Specific Requirements for the Design and Construction of Tanks for the Storage of Liquefied Anhydrous Ammonia. Available online: https://www.din.de/en/getting-involved/standards-committees/natank/projects/wdc-proj:din21:320684053?destinationLanguage=&sourceLanguage= (accessed on 31 January 2024).
  13. Publicatiereeks Gevaarlikje Stoffen. PGS 12:2023 Versie 0.1 Fase 1 (December 2023). Available online: https://publicatiereeksgevaarlijkestoffen.nl/publicaties/online/pgs-12/2023/0-1-fase-1-december-2023#m11 (accessed on 2 February 2024).
  14. Departement OMGEVING. Handboek Risicoberekeningen: Richtlijnen voor Kwantitatieve Risicoanalyse, Indirecte Risico’s end Milieurisicoanalyse—Versie 3.2 dd 01/12/2022. Available online: https://omgeving.vlaanderen.be/sites/default/files/2022-12/2022%2012%2001%20-%20HBRB.pdf (accessed on 2 February 2024).
  15. Clancey, V.J. Diagnostic features of explosion damage. In Proceedings of the 6th International Meeting on Forensic Sciences, Edinburgh, UK, 20–26 September 1972. [Google Scholar]
  16. TNO Green Book. Methods for the Determination of Possible Damage: To People and Objects Resulting from Releases of Hazardous Materials; TNO Green Book: Voorburg, The Netherlands, 1989; ISBN 90-5307-052-4. [Google Scholar]
  17. Cooperman, A.; Garrison, J.C.; Venderley, C.H. One of a Kind: Outline How the Development of the First Double Steel, Full Containment LNG Tank Could Shake Up the LNG Industry; LNG Industry Magazine: Farnham, UK, 2022. [Google Scholar]
  18. LS-DYNA; Version smp d R13; A Program for Nonlinear Dynamic Analysis of Structures in Three Dimensions. Livermore Software Technology Corporation: Livermore, CA, USA, 2023.
  19. Riemer, M.; Schreiner, F.; Wachsmuth, J. Conversion of LNG Terminals for Liquid Hydrogen or Ammonia. Analysis of Technical Feasibility und Economic Considerations; Fraunhofer Institute for Systems and Innovation Research ISI: Karlsruhe, Germany, 2022. [Google Scholar]
  20. Johnson, D.M. The potential for vapour cloud explosions—Lessons from the Buncefield accident. J. Loss Prev. Process Ind. 2010, 23, 921–927. [Google Scholar] [CrossRef]
  21. Chang, J.I.; Lin, C.-C. A study of storage tank accidents. J. Loss Prev. Process Ind. 2006, 19, 51–59. [Google Scholar] [CrossRef]
  22. Taveau, J. Explosion of fixed roof atmospheric storage tanks, part 1: Background and review of case histories. Process Saf. Prog. 2011, 30, 381–392. [Google Scholar] [CrossRef]
  23. ASCE. Design of Blast-Resistant Buildings in Petrochemical Facilities, 2nd ed.; ASCE: Reston, VA, USA, 2011; ISBN 978-0-7844-1088-2. [Google Scholar]
  24. Zhang, B.Y.; Li, H.H.; Wang, W. Numerical study of dynamic response and failure analysis of spherical storage tanks under external blast loading. J. Loss Prev. Process Ind. 2015, 34, 209–217. [Google Scholar] [CrossRef]
  25. Jiang, Y.; Zhang, B.; Wang, L.; Wei, J.; Wang, W. Dynamic response of polyurea coated thin steel storage tank to long duration blast loadings. Thin-Walled Struct. 2021, 163, 107747. [Google Scholar] [CrossRef]
  26. Al-Yacouby, A.M.; Lo Hao, J.; Liew, M.S.; Ratnayake, R.M.C.; Samarakoon, S.M.K. Thin-Walled Cylindrical Shell Storage Tank under Blast Impacts: Finite Element Analysis. Materials 2021, 14, 7100. [Google Scholar] [CrossRef]
  27. Zhang, R.; Jia, J.; Wang, H.; Guan, Y. Shock Response Analysis of a Large LNG Storage Tank Under Blast Loads. KSCE J. Civ. Eng. 2018, 22, 3419–3429. [Google Scholar] [CrossRef]
  28. Alderman, J.A. Introduction to LNG safety. Process Saf. Prog. 2005, 24, 144–151. [Google Scholar] [CrossRef]
  29. Saloua, B.; Mounira, R.; Salah, M.M. Fire and Explosion Risks in Petrochemical Plant: Assessment, Modeling and Consequences Analysis. J. Fail. Anal. Preven. 2019, 19, 903–916. [Google Scholar] [CrossRef]
  30. Karlos, V.; Solomos, G.; Viaccoz, B. Calculation of Blast Loads for Application to Structural Components; Publications Office: Luxembourg, 2013; ISBN 978-92-79-35158-7. [Google Scholar]
  31. Mittal, V.; Chakraborty, T.; Matsagar, V. Dynamic analysis of liquid storage tank under blast using coupled Euler–Lagrange formulation. Thin-Walled Struct. 2014, 84, 91–111. [Google Scholar] [CrossRef]
  32. UFC 3-340-02; Structures to Resist the Effects of Accidental Explosions, Unified Facilities Criteria 3-340-02 (Formerly Technical Manual TM 5-1300). U.S. Department of Defense: Washington, DC, USA, 2008.
  33. American Institute of Chemical Engineers. Guidelines for Vapor Cloud Explosion, Pressure Vessel Burst, BLEVE, and Flash Fire Hazards, 2nd ed.; Wiley: Hoboken, NJ, USA, 2010; ISBN 978-0-470-25147-8. [Google Scholar]
  34. Sharma, R.K. A violent, episodic vapour cloud explosion assessment: Deflagration-to-detonation transition. J. Loss Prev. Process Ind. 2020, 65, 104086. [Google Scholar] [CrossRef]
  35. Kingery, C.N.; Bulmash, C. Air Blast Parameter from TNT Sperical Air Burst and Hemispherical Surface Burst; US Army Armament and Development Center, Ballistic Research Laboratory: Aberdeen, WA, USA, 1984. [Google Scholar]
  36. Karlos, V.; Solomos, G.; Larcher, M. Analysis of the blast wave decay coefficient using the Kingery–Bulmash data. Int. J. Prot. Struct. 2016, 7, 409–429. [Google Scholar] [CrossRef]
  37. Randers-Pehrson, G.; Bannister, K.A. Airblast Loading Model for DYNA2D and DYNA3D ARL-TR-1310, Aberdeen, USA. 1997. Available online: https://apps.dtic.mil/sti/tr/pdf/ADA322344.pdf (accessed on 21 March 2024).
  38. Tang, M.J.; Baker, Q.A. A New Set of Blast Curves from Vapor Cloud Explosion. Process Saf. Prog. 1999, 18, 235–240. [Google Scholar] [CrossRef]
  39. Tang, M.; Baker, Q. Comparison of blast curves from vapor cloud explosions. J. Loss Prev. Process Ind. 2000, 13, 433–438. [Google Scholar] [CrossRef]
  40. van den Berg, A.C. The multi-energy method: A framework for vapour cloud explosion blast prediction. J. Hazard. Mater. 1985, 12, 1–10. [Google Scholar] [CrossRef]
  41. Li, X.; Chen, G.; Khan, F.; Lai, E.; Amyotte, P. Analysis of structural response of storage tanks subject to synergistic blast and fire loads. J. Loss Prev. Process Ind. 2022, 80, 104891. [Google Scholar] [CrossRef]
  42. Timofeev, E.; Takayama, K.; Voinovich, P. Numerical and experimental observation of three-dimensional unsteady shock wave structures. In Proceedings of the 35th Aerospace Sciences Meeting and Exhibit, Reno, NV, USA, 6–9 January 1997; American Institute of Aeronautics and Astronautics: Reston, VA, USA, 1997. [Google Scholar]
  43. Ding, J.; Liang, Y.; Chen, M.; Zhai, Z.; Si, T.; Luo, X. Interaction of planar shock wave with three-dimensional heavy cylindrical bubble. Phys. Fluids 2018, 30, 106109. [Google Scholar] [CrossRef]
  44. Drikakis, D.; Ofengeim, D.; Timofeev, E.; Voionovich, P. Computation of non-stationaly shock-wave/cylinder interaction using adaptive-grid methods. J. Fluids Struct. 1997, 11, 665–692. [Google Scholar] [CrossRef]
  45. Chaudhuri, A.; Hadjadj, A.; Sadot, O.; Glazer, E. Computational study of shock-wave interaction with solid obstacles using immersed boundary methods. Numer. Meth Eng. 2012, 89, 975–990. [Google Scholar] [CrossRef]
  46. Yasseri, S. Blast pressure distribution around large storage tanks. Blast Inf. Group 2015, 67, 133–134. [Google Scholar]
  47. Roetzer, J.; Douglas, H. Hazard and safety probes for LNG tanks. LNG J. 2006, 2, 27–28. [Google Scholar]
  48. Duong, D.H.; Hanus, J.L.; Bouazaoui, L.; Pennetier, O.; Moriceau, J.; Prod’homme, G.; Reimeringer, M. Response of a tank under blast loading—Part I: Experimental characterisation of blast loading arising from a gas explosion. Eur. J. Environ. Civ. Eng. 2012, 16, 1023–1041. [Google Scholar] [CrossRef]
  49. DIN EN 1993-1-6; Eurocode 3: Design of Steel Structures—Part 1-6: Strength and Stability of Shell Structures. Beuth Verlag: Berlin, Germany, 2017.
  50. DIN EN 1991-1-4; Eurocode 1: Actions on Structures—Part 1-4: General Actions—Wind Actions. Beuth Verlag: Berlin, Germany, 2010.
  51. DIN EN 10028-3; Flat Products Made of Steels for Pressure Purposes—Part 3: Weldable Fine Grain Steels, Normalized. Beuth Verlag: Berlin, Germany, 2017.
  52. Johnson, G.; Cook, W. A Constitutive Model and Data for Metals Subjected to Large Strains, High Strain Rates, and High Temperatures. In Proceedings of the 7th International Symposium on Ballistics, The Hague, The Netherlands, 19–21 April 1983; pp. 541–547. [Google Scholar]
  53. Kumar Reddy Sirigiri, V.; Yadav Gudiga, V.; Shankar Gattu, U.; Suneesh, G.; Mohan Buddaraju, K. A review on Johnson Cook material model. Mater. Today Proc. 2022, 62, 3450–3456. [Google Scholar] [CrossRef]
  54. Umbrello, D.; M’Saoubi, R.; Outeiro, J.C. The influence of Johnson–Cook material constants on finite element simulation of machining of AISI 316L steel. Int. J. Mach. Tools Manuf. 2007, 47, 462–470. [Google Scholar] [CrossRef]
  55. Barsoum, I.; Lawal, S.A.; Simmons, R.J.; Rodrigues, C.C. Failure analysis of a pressure vessel subjected to an internal blast load. Eng. Fail. Anal. 2018, 91, 354–369. [Google Scholar] [CrossRef]
  56. Jeon, D.; Kim, K.; Han, S. Modified Equation of Shock Wave Parameters. Computation 2017, 5, 41. [Google Scholar] [CrossRef]
  57. Rosin, J.; Butenweg, C.; Klinkel, S. Stability Verification for Seismically Exposed Tank Structures according to the LBA/MNA Concept; Springer: Duesseldorf, Germany, 2016. (In German) [Google Scholar]
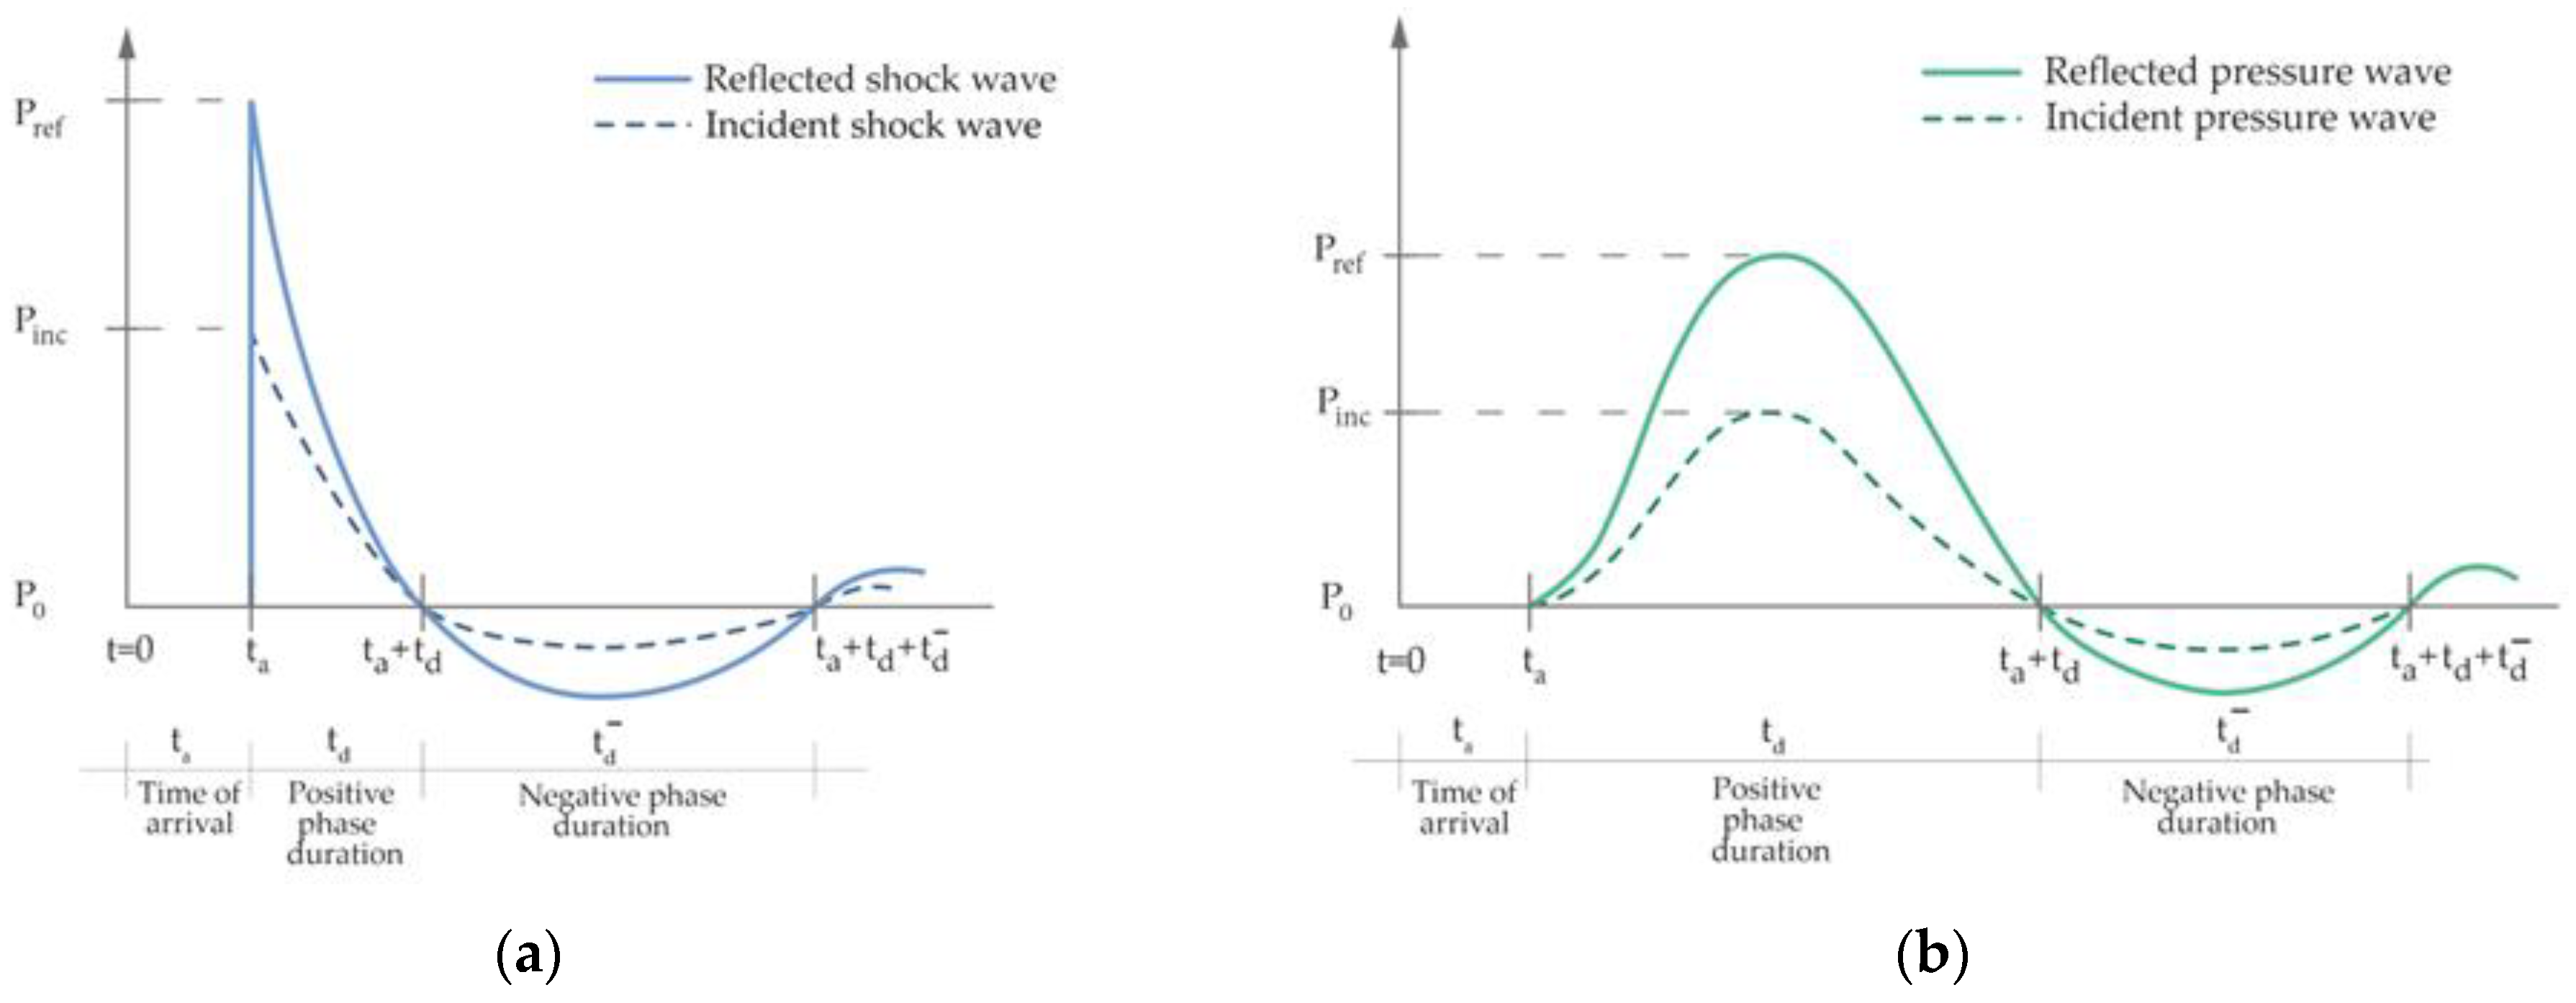
Figure 1. Explosion pressure propagation in free air: (a) characteristic shape of a shock wave; (b) characteristic shape of a pressure wave.
Applsci 14 03465 g001
Figure 2. Definition of angle of incidence.
Applsci 14 03465 g002
Figure 3. Blast load profile and distribution for a cylindrical tank used in [31].
Applsci 14 03465 g003
Figure 4. Shape of blast loading suggested in [47].
Applsci 14 03465 g004
Figure 5. Tank geometry of representative ammonia tank for numerical simulation.
Applsci 14 03465 g005
Figure 6. Boundary condition in the numerical simulation at the base of the tank.
Applsci 14 03465 g006
Figure 7. Material plastic kinematic: l and l0 are the undeformed and deformed lengths of uniaxial tension specimen while the tangent modulus Et is the slope of the bilinear stress strain curve. The adopted values are reported in Table 1 and Table 2.
Applsci 14 03465 g007
Figure 8. Idealized pressure load time history for numerical simulation.
Applsci 14 03465 g008
Figure 9. Transfer of pressure wave to shock wave via impulse equality.
Applsci 14 03465 g009
Figure 10. Assumption of blast load source in simulation model. Different colors of the tank model indicate different model parts with different sections (red: tank wall, green: tank roof panel, blue: compression ring of wall and roof, grey: base plate, black: beam elements of ring stiffeners, rafter, and anchorage).
Applsci 14 03465 g010
Figure 11. Peak pressure distribution along the tank’s circumference at the height of the explosion source, z = 14.5 m.
Applsci 14 03465 g011
Figure 12. Results of implicit, static analyses; stress results in (Pa).
Applsci 14 03465 g012
Figure 13. von Mises stress of tank elements as a result of the various simulations, in Pa. Note: Simulations 1.2a and 1.2b as well as 2.2a and 2.2b result in the same stress distribution.
Applsci 14 03465 g013
Figure 14. Displacement of tank shell elements as a result of the various simulations, in m. Note: Simulations 1.2a and 1.2b as well as 2.2a and 2.2b result in the same shell deformation figure.
Applsci 14 03465 g014aApplsci 14 03465 g014b
Figure 15. Approximation of the bending deformation of the tank wall and roof due to (a) roof compression load and (b) roof suction load.
Applsci 14 03465 g015
Table 1. Mechanical properties of steel P355 NL2.
Name Value
Tensile strengthfuk490 MPa
Yield strengthfyk355 MPa 1
345 MPa 2
Ultimate strainϵB22%
Modulus of elasticityE212 GPa
Densityρ7.82 t/m3
1 Plates with thickness t ≤ 16 mm. 2 Plates with thickness 16 mm < t ≤ 40 mm.
Table 2. Values adopted for constitutive models for numerical simulation.
Name Value
Hardening parameterβ0.5
Material parameterA345 MPa
Material parameterB51 MPa
Material parameterN0.26
Material parameterC0.014
Table 3. Simulation overview.
SimulationRoof LoadLoad to the Overall StructureMaterial
Formulation
0-Varying pressure amplitude depending on
tank’s angle of circumference, static
Linear
(*MAT001)
1.1aCompressionUniform pressure amplitude of 30 kPa
to one half of tank shell and roof
Bilinear
(*MAT003)
1.1bCompressionUniform pressure amplitude of 30 kPa
to one half of tank shell and roof
Johnson–Cook (*MAT098)
1.2aCompressionVarying pressure amplitude depending on scaled distance and angle of incidenceBilinear
(*MAT003)
1.2bCompressionVarying pressure amplitude depending on scaled distance and angle of incidenceJohnson–Cook (*MAT098)
1.3aCompressionShock wave, load application via LBEBilinear
(*MAT003)
1.3bCompressionShock wave, load application via LBEJohnson–Cook (*MAT098)
2.1aSuctionUniform pressure amplitude of 30 kPa
to one half of tank shell and roof
Bilinear
(*MAT003)
2.1bSuctionUniform pressure amplitude of 30 kPa
to one half of tank shell and roof
Johnson–Cook (*MAT098)
2.2aSuctionVarying pressure amplitude depending on scaled distance and angle of incidenceBilinear
(*MAT003)
2.2bSuctionVarying pressure amplitude depending on scaled distance and angle of incidenceJohnson–Cook (*MAT098)
Table 4. Summary of results of tank structure simulations.
Maximal von Mises Stress (MPa)Maximal Deformation (mm)Maximal Plastic Strain (%)
SimShellRoofBeamAnchorShellRoofUplift aShellRoofBeamAnchor
1.1a3523463563621089 b109791.4440.2491.5101.919
1.1b4934315035051044 b106610.9040.1561.1601.160
1.2a115233124121115760000
1.2b115233124121115760000
1.3a17534534534534821100.0670.1140.049
1.3b17340238639536821100.0280.0030.019
2.1a3502283583601004 b50631.12901.5551.650
2.1b476227494501949 b48510.53500.9341.032
2.2a149158110345173490000.005
2.2b149158110353173490000
a Maximal uplift height of annular plate. b Timestep of simulation at 1022 ms, when the pressure wave leaves the last elements of the simulation model.
Disclaimer/Publisher’s Note: The statements, opinions and data contained in all publications are solely those of the individual author(s) and contributor(s) and not of MDPI and/or the editor(s). MDPI and/or the editor(s) disclaim responsibility for any injury to people or property resulting from any ideas, methods, instructions or products referred to in the content.