Article

Offline Identification of a Laboratory Incubator

1
Department of Research and Development, Emko Elektronik A.S., 16215 Bursa, Turkey
2
Electrical-Electronic Engineering Department, Bursa Uludag University, 16059 Bursa, Turkey
*
Author to whom correspondence should be addressed.
Appl. Sci. 2024, 14(8), 3466; https://doi.org/10.3390/app14083466
Submission received: 5 March 2024 / Revised: 8 April 2024 / Accepted: 17 April 2024 / Published: 19 April 2024

Abstract

:
Laboratory incubators are used to maintain and cultivate microbial and cell cultures. In order to ensure suitable growing conditions and to avoid cell injuries and fast rise and settling times, minimum overshoot and undershoot performance indexes should be considered in the controller design for incubators. Therefore, it is important to build proper models to evaluate the performance of the controllers before implementation. In this study, we propose an approach to build a model for a laboratory incubator. In this approach, the incubator is considered a linear time-invariant single-input, single-output system. Four different model structures, namely auto-regressive exogenous, auto-regressive moving average exogenous, output error and Box–Jenkins, are applied for modeling the system. The parameters of the model structures are estimated by using prediction error methods. The performances of the model structures are evaluated in terms of mean squared error, mean absolute error and goodness of fit. Additionally, residue analysis including auto-correlation and cross-correlation plots is provided. Experiments are carried out in two scenarios. In the first scenario, the identification dataset is collected from the unit-step response, while in the second scenario, it is collected from the pseudorandom binary sequence response. The experimental study shows that the Box–Jenkins model achieves an over 90% fit percentage for the first scenario and an over 95% fit percentage for the second scenario. Based on the experimental results, it is concluded that the Box–Jenkins model can be used as a successful model for laboratory incubators.

1. Introduction

Laboratory incubators provide controlled-environment conditions for microorganisms. Biological materials have specific temperature requirements for cultivation and growth processes [1]. Despite the fact that incubators are insulated and enclosed, the material loading processes can cause significant thermal disturbances in the incubator chambers. This effect is called the door-opening effect, and the recovery from this effect is one of the most challenging problems in the design of high-performance laboratory incubators [2,3,4].
System identification methods are used to construct mathematical models for dynamic systems from collected input–output data [5]. These methods have been used in a wide variety of research fields, from material science to biomedical engineering and neuroscience to automatic control for linear and nonlinear systems, e.g., [6,7,8,9,10,11,12,13]. In [6], system identification methods are used to obtain the behavior of the entire molten salt electrolysis process. In [7], a sleep stage classification method is proposed. The method employs a system identification model, which is the state-space model, to obtain a basic model giving the discrimination features for the further classification stage. In [8,9], the identification problems in nonlinear systems by using nonlinear system identification models are examined in detail. In [10], the sample complexity of linear system identification using input–output data is analyzed. In [11], the potential to successfully use nonlinear system identification for nonlinear neural circuits is demonstrated. In [12], two model predictive control algorithms are compared to each other, and it is shown that the algorithm employing the system identification method outperforms the other. In [13], an open-source system identification software package is presented. The package includes system identification methods for input–output transfer function models and state-space models.
Prediction error methods (PEM) are one of the most popular families of system identification methods in the community. They have been applied successfully in the context of system modeling in the literature, e.g., [14,15,16,17,18]. In [14], a linear system identification procedure based on a full Bayesian framework is proposed. The procedure is applied for neural activity prediction and temperature prediction purposes. In [15], a study of model identification for two electrical vehicle battery types is presented. The equivalent circuit battery model is parameterized by PEM. In [16], a heat exchange system is parameterized through system identification. The task of parameter estimation for applied model structures is made by using PEM. In [17], the development of a flight dynamics model for an unmanned aerial vehicle is considered. System identification is applied to actual flight data, and various models with different structures are examined. In [18], the identification of a quadcopter autopilot system is presented. It is demonstrated that the proposed method has the ability to capture the autopilot dynamics and predict the outputs accurately. In [19], short-term room temperature models are obtained by using PEM. It is shown that k-step-ahead prediction gives successful performance results.
The dynamics of systems can be modeled by using previous experiences and physical knowledge that are derived from similar systems. To the best of the authors’ knowledge, no research has been found in the published literature to conduct the modeling of laboratory incubators. Besides, the multi-layered structure of laboratory incubators makes it difficult to perform mathematical modeling based on physical equations. Therefore, the studies targeting the modeling of laboratory incubators using system identification methods will make a significant contribution to the literature.
In this study, we aim to find a model for a laboratory incubator. We propose an approach based on the system identification methods for modeling the incubator by using the relationship between the input and output data. In this approach, the incubator is considered a linear time-invariant single-input, single-output system. We apply four model structures, namely auto-regressive exogenous, auto-regressive moving average exogenous, output error and Box–Jenkins, for modeling the system. The parameters of the models are estimated by using PEM. The performances of the model structures are evaluated in terms of mean squared error, mean absolute error and goodness of fit.
The rest of the paper is organized as follows. In Section 2, the physical appearance of the incubator and the technical specifications of the control system are provided. Additionally, the data collected from the incubator and the theoretical background of the applied methods are presented. Section 3 gives the experimental setup and the results. In Section 4, we discuss the experimental results. Finally, we present the conclusions of the research in Section 5.

2. Materials and Methods

2.1. Laboratory Incubator

In this study, a laboratory incubator (Nüve, Ankara, Turkey), which is shown in Figure 1, was used. We modified the incubator for data acquisition by adding an external DIN/EN 60751 [20] Class B Pt-100 temperature sensor and a 1/16 DIN standard single-loop PID controller. The thermal sensitivity of the temperature sensor was 0.1 °C/37 °C, and the PID controller had a serial communication interface, with 10 readings per second.

2.2. Data Collection

The data acquisition framework used in the study is shown in Figure 2. The system was considered at steady-state when the data collection process was started. In order to minimize the communication delay between the PID controller and the PC, we applied a Serial to Ethernet converter. We collected the input–output data of the PID controller by using the Modbus protocol. The control signal output of the PID controller was sent to the incubator by using the pulse-width modulation (PWM) technique. The period of the PWM signal was set to 1 s, and the duty cycle was chosen as 0.1% of the period. The reading sensitivity of the temperature sensor was configured to 0.1 °C.
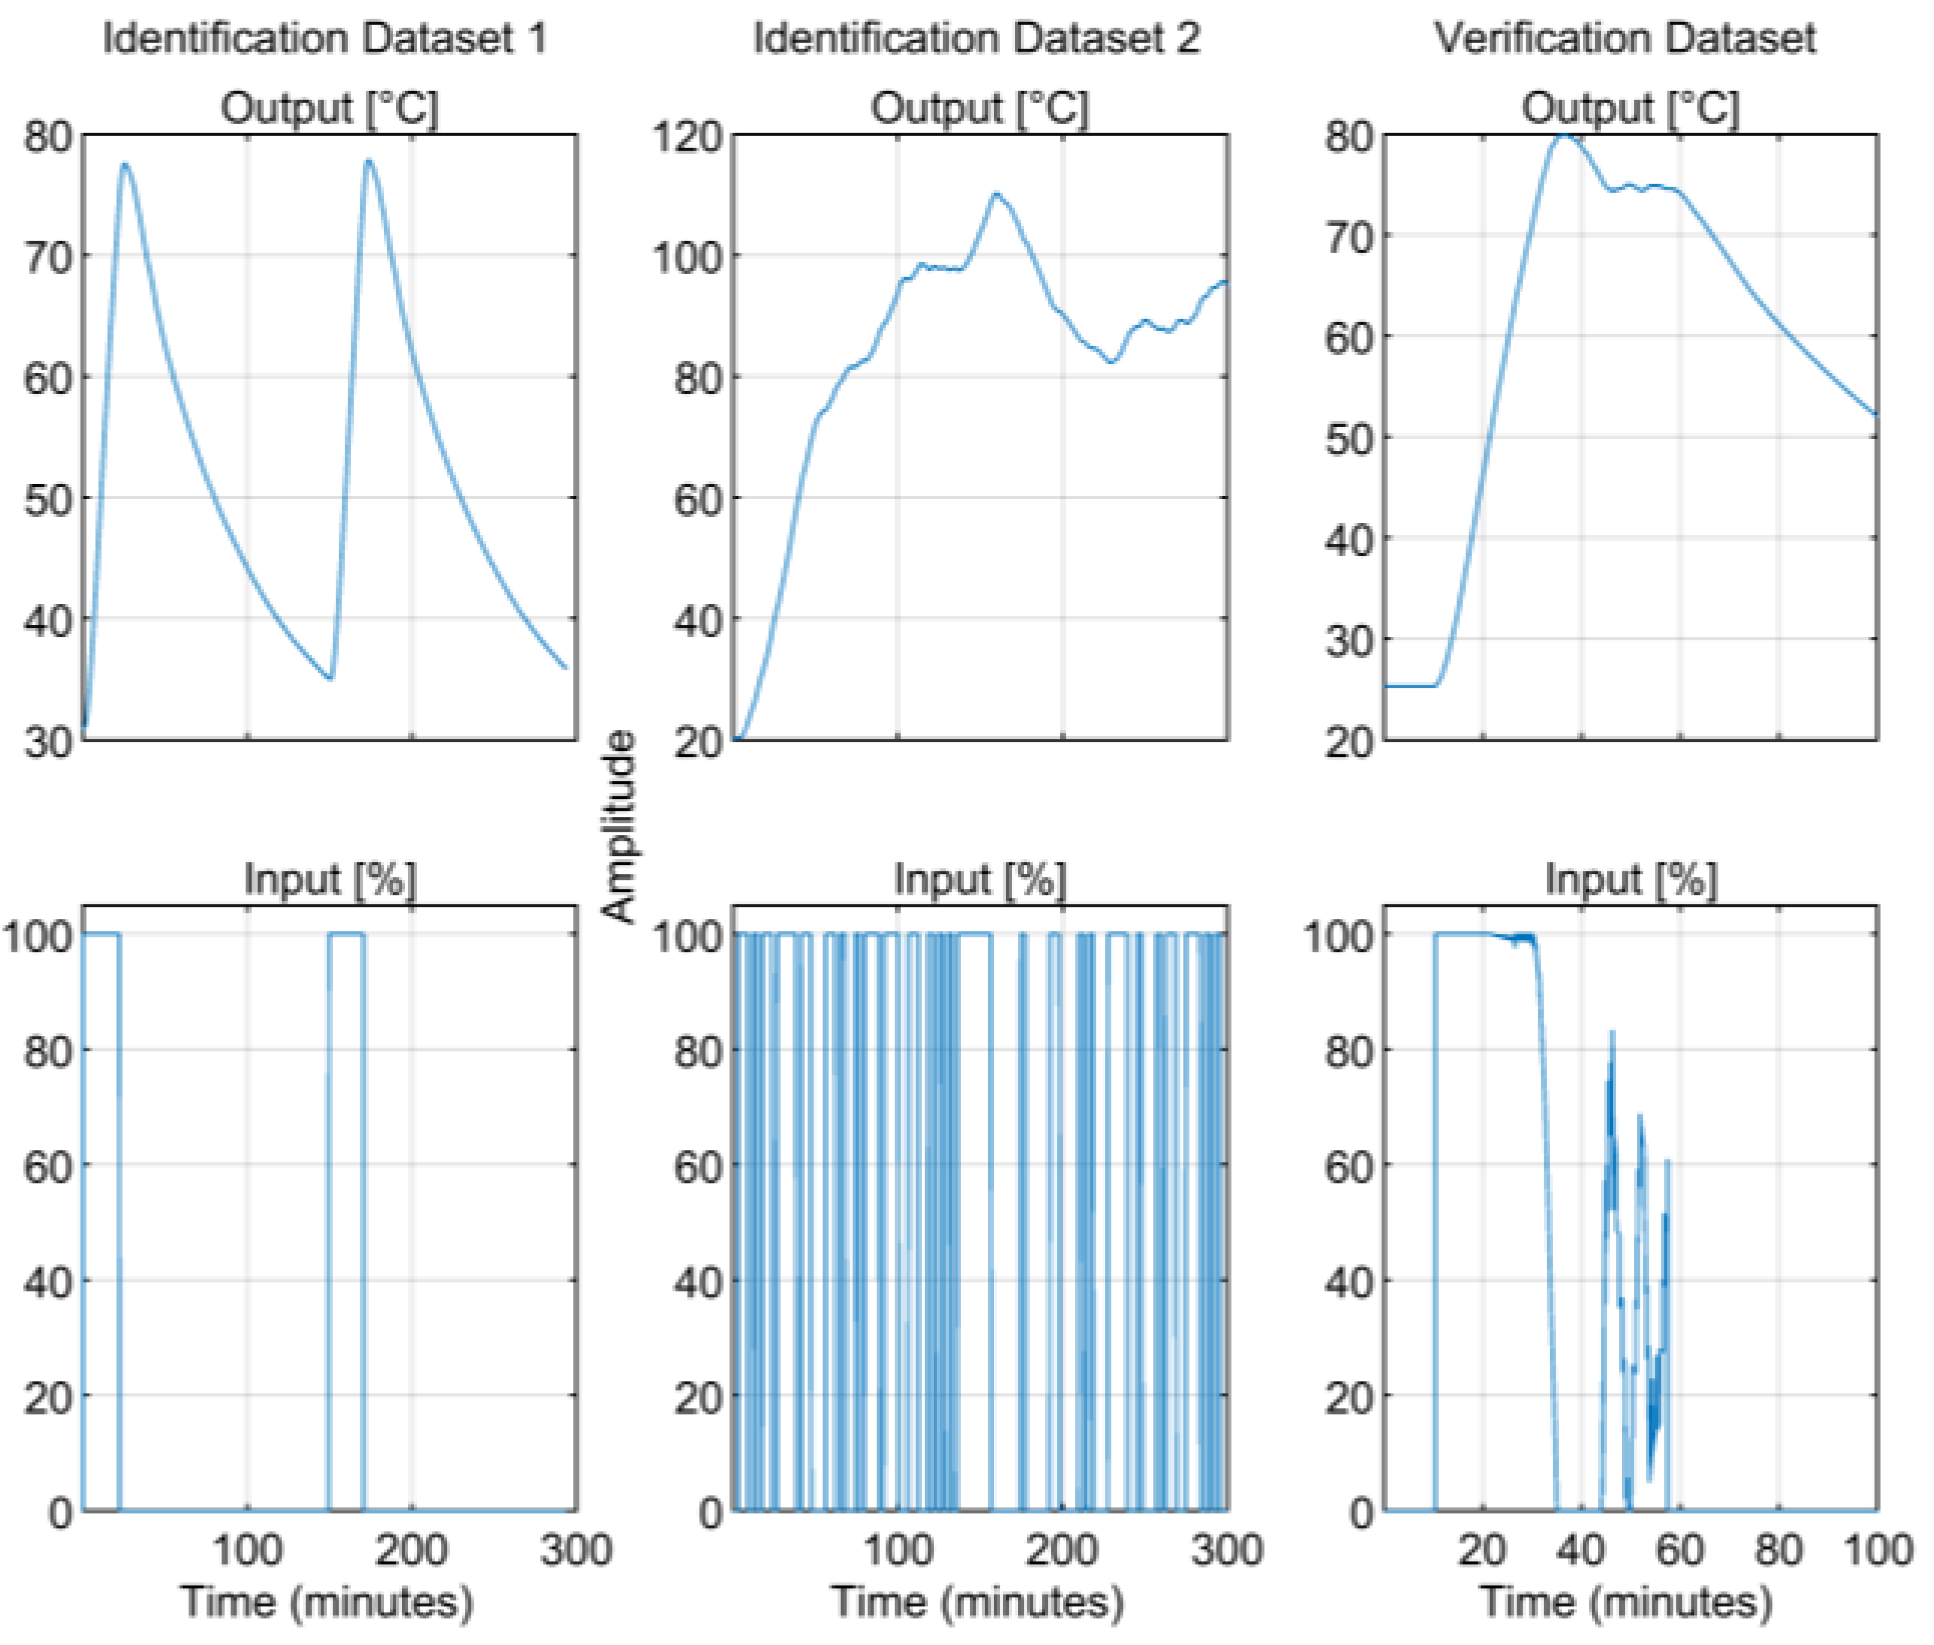
Three separate datasets, identification dataset-1, identification dataset-2 and the verification dataset, were obtained by using the data acquisition framework within a 0.1 s sampling time. Identification dataset-1 was collected from the unit-step response for 300 min, when the set and the hysteresis values were chosen as 75 °C and 40 °C, respectively. Identification dataset-2 was collected from the pseudorandom binary sequence (PRBS) response for 300 min. The verification dataset was generated from the PID tuning process for 100 min. Figure 3 illustrates the input–output graphs for the identification and verification data.

2.3. Data Preprocessing

There was a delay between the input and output samples of the datasets of about 60 s. Therefore, first of all, the output data of the datasets was shifted by the amount of latency. Then, all the data was normalized by using Equation (1) and scaled to the interval [0, 1].
X norm   = X i X m i n X m a x X m i n

2.4. System Identification

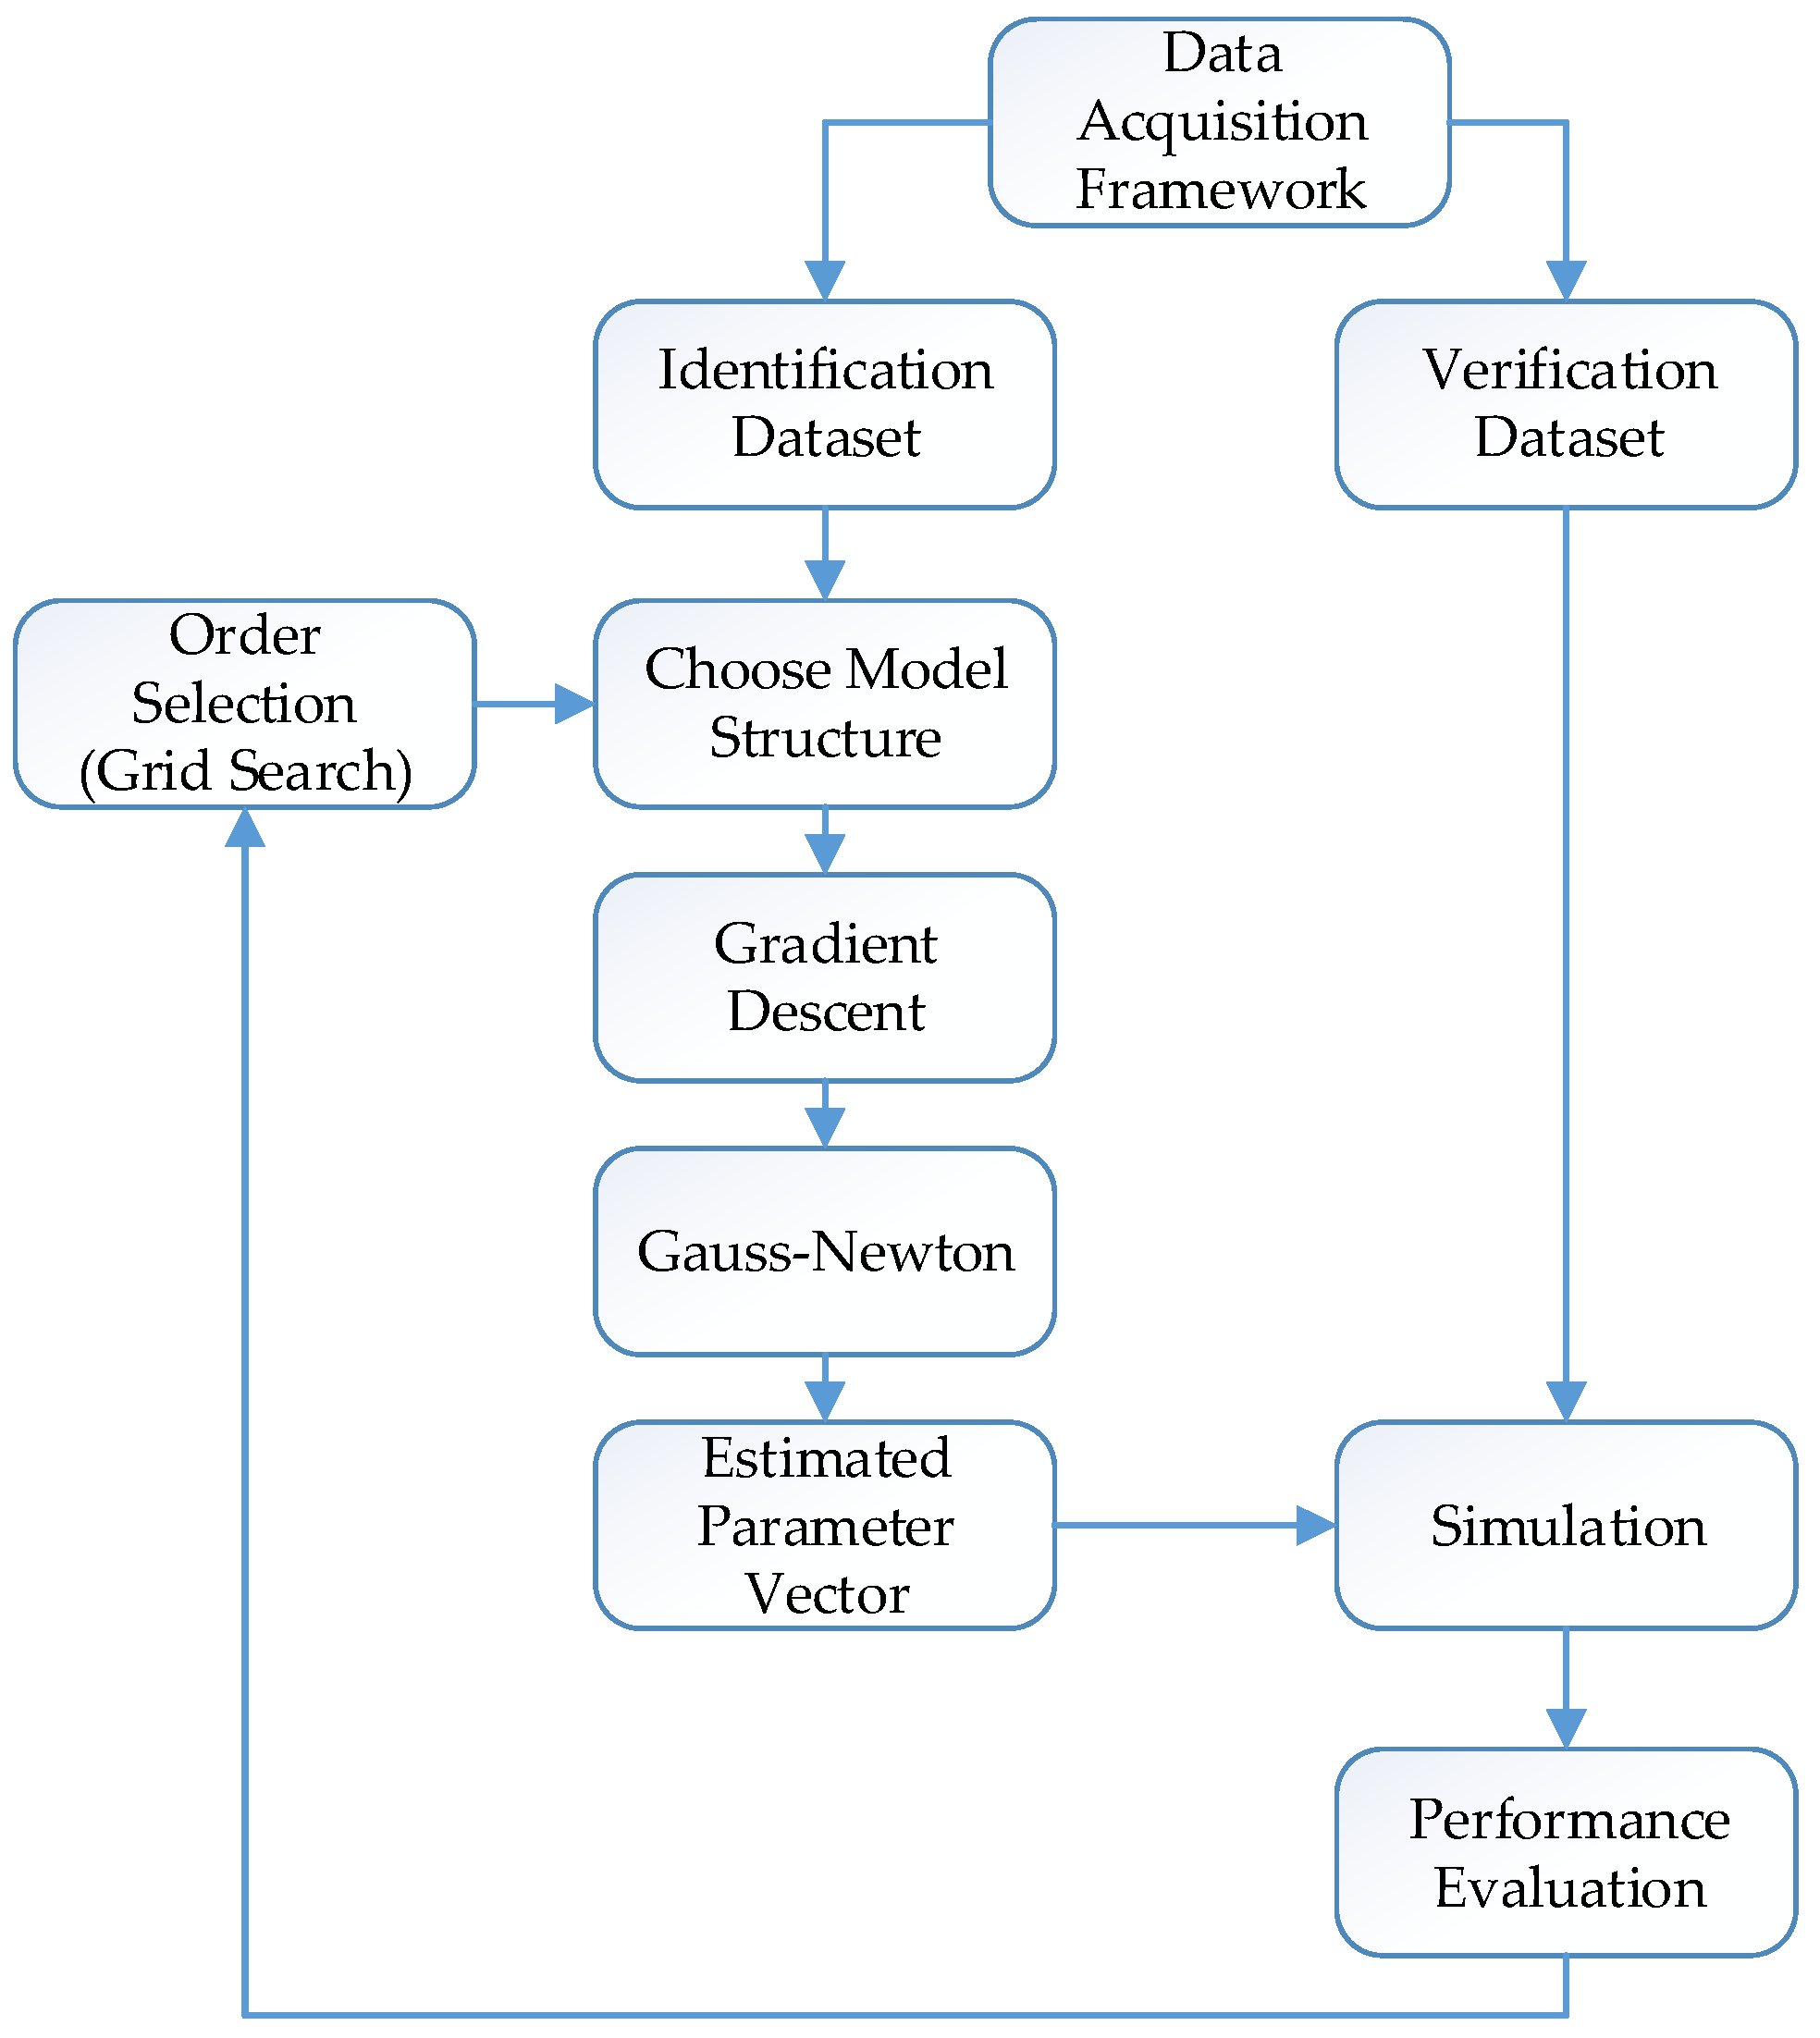
A mathematical model is a description of the properties of a real system that is suitable for a certain purpose. System identification is an analytical process aiming to derive mathematical models of dynamic systems for specific usage areas. System identification methods are used to construct mathematical models for dynamic systems using the collected input–output data from the actual system [5]. The classical system identification cycle is shown in Figure 4. The tasks represented by the rectangular boxes are executed by the computer, while the ovals are executed manually by the user [21].
System identification aims to find a model for a system with a finite number of numerical values, or coefficients. Generally, all of the coefficients cannot be directly determined from the physical mechanisms of the system’s behavior. Some coefficients should be included in the mathematical model as unknown parameters of model structures.

2.5. Model Structures

The basic description of a linear system with additive disturbance can be represented by Equation (2) and is shown in Figure 5.
y ( t ) = G ( q ) u ( t ) + H ( q ) e ( t )
where y ( t ) R and u ( t ) R are the output and input signals, respectively, and e ( t ) is the zero mean white noise signal. All the signals are scalar-valued functions, and t Z is the discrete-time sample index, G q , is the transfer function for the linear system model, and H ( q ) is the transfer function for the disturbance model. q and q 1 represent the forward and backward shift operators.
If we show the parameter vector as θ , then the model description for Equation (2) can be rearranged, as in Equation (3):
y ( t ) = G ( q , θ ) u ( t ) + H ( q , θ ) e ( t )
A generalized parametric black box model structure is defined as in Equation (4) [21]
A q , θ y t = B q , θ F q , θ u t + C q , θ D q , θ e t
In this study, a laboratory incubator was considered a linear time-invariant (LTI) single-input, single-output (SISO) system. We applied four different model structures, ARX, ARMAX, OE and Box–Jenkins, for modeling the incubator. These structures are summarized in the following subsections [21].

2.5.1. Auto-Regressive Exogenous (ARX) Model

The input–output relationship of a system can be described by using a linear difference equation, as in Equation (5):
y t + a 1 y t 1 + + a n u y t n a = b 1 u t 1 + + b n b u t n b + e t
The linear difference equation, Equation (5), has autoregressive and exogenous parts. A model structure having these two parts is called an ARX model and is represented in Equation (6):
A ( q ) y ( t ) = B ( q ) u ( t ) + e ( t )
If the parameters in Equation (4) are written with the polynomial functions given in Equations (7) and (8):
A ( q ) = 1 + a 1 q 1 + + a n a q n a
B ( q ) = b 1 q 1 + + b n b q n b
then Equation (4) corresponds to Equation (3) with the use of Equation (9):
G q , θ = B q A q ,    H ( q , θ ) = 1 A ( q )
Therefore, the predictor for the system output can be written as the following equation, Equation (10):
y ^ ( t θ ) = B ( q ) u ( t ) + [ 1 A ( q ) ] y ( t )

2.5.2. Auto Regressive Moving Average Exogenous (ARMAX) Model

The ARMAX model includes a moving average part, which makes it more flexible than the ARX model. The moving average part is added by describing the equation error in Equation (4) as the moving average of white noise. The linear difference equation is rearranged by using this moving average part, as in Equation (11):
y ( t ) + a 1 y ( t 1 ) + + a n a y t n a = b 1 u ( t 1 ) +   + b n b u t n b + e ( t ) + c 1 e ( t 1 ) + + c n c e t n c
A polynomial function for the new parameters is shown in Equation (12):
C ( q ) = 1 + c 1 q 1 + + c n c q n c
Therefore, the ARMAX model, including autoregressive, exogenous, and moving average parts, is described in Equation (13):
A ( q ) y ( t ) = B ( q ) u ( t ) + C ( q ) e ( t )
Equation (13) corresponds to Equation (3) with the use of Equation (14):
G ( q , θ ) = B ( q ) A ( q ) , H ( q , θ ) = C ( q ) A ( q )
where the parameter vector θ is given by Equation (15):
θ = a 1 a n a b 1 b n b c 1 c n c T
The predictor for the ARMAX model can be described by Equation (16):
y ^ ( t t 1 ) = B ( q ) C ( q ) u ( t ) + C ( q ) A ( q ) C ( q ) y ( t )

2.5.3. Output Error (OE) Model

An OE model is generally used for problems that do not need to estimate the noise model [17]. In the OE model structure, a linear difference equation between the input u ( t ) and the undisturbed output w ( t ) can be written as in Equation (17):
w ( t ) + f 1 w ( t 1 ) + + f n f w t n f = b 1 u ( t 1 ) + + b n b u t n b
The output signal having the white measurement noise can be represented by Equation (18):
y ( t ) = w ( t ) + e ( t )
A polynomial function of F for the parameters is written as in Equation (19):
F ( q ) = 1 + f 1 q 1 + + f n f q n f
Then, the OE model can be written as in Equation (20):
y ( t ) = B ( q ) F ( q ) u ( t ) + e ( t )
The parameter vector θ is arranged as in Equation (21):
θ = b 1    b 2 b n b f 1    f 2 f n f T
The predictor for the OE model can be described by Equation (22):
y ^ ( t t 1 ) = B ( q ) A ( q ) u ( t )

2.5.4. Box–Jenkins (BJ) Model

In the BJ model, the system and noise are modeled separately [17]. The properties of the output error in Equation (20) are described as an ARMA model, as shown in Equation (23):
y ( t ) = B ( q ) F ( q ) u ( t ) + C ( q ) D ( q ) e ( t )
A polynomial function of D for the parameters is written as in Equation (24):
D ( q ) = 1 + d 1 q 1 + + d n d q n d
The parameter vector θ is arranged as in Equation (25):
θ = b 1    b 2 b n b f 1    f 2 f n f c 1 c n c d 1 d n d T
The predictor for the BJ model can be described by Equation (26):
y ^ ( t t 1 ) = D ( q ) B ( q ) C ( q ) F ( q ) u ( t ) + C ( q ) D ( q ) C ( q ) y ( t )

2.6. Estimating the Parameter Vector ( θ )

Parameter estimation is the searching process for estimating the parameter vector θ of the model structures to give the best model. In this study, we used the prediction error identification method (PEM) to estimate the parameter vector θ . If an input–output data of the system is written as in Equation (27) [22].
Z N = y ( 1 )   ,   u ( 1 )   ,   y ( 2 )   ,   u ( 2 )   ,     ,   y ( N )   ,   u ( N )
The fitting criterion can be written as in Equation (28), which is the prediction error between the actual output of the system and the predicted output of the model.
V N ( θ ) = t = 1 N ( y ( t ) y ^ ( t θ ) ) 2
Then, for the PEM, the estimate of θ is defined by the minimization of Equation (28), as shown in Equation (29)
θ ^ N = θ ^ N Z N = a r g m i n θ D M V N θ , Z N
The minimization of (28) defines a nonlinear least squares (NLS) problem when the relationship between the parameters and the predictions is nonlinear. Iterative search methods and the gradient descent, Gauss–Newton, and Levenberg–Marquardt algorithms can be used to solve this problem iteratively [21,23,24].

2.7. Performance Evaluation

The performances of the model structures are evaluated using three measures, which are mean squared error (MSE), mean absolute error (MAE) and goodness of fit (G). The definitions of these measures are given in Equations (30)–(32) [19,22,25].
Mean Squared Error (MSE):
MSE = 1 N i = 1 N y i y ^ i 2
Mean Absolute Error (MAE):
MAE = 1 N i = 1 N y i y ^ i
Goodness of fit (G):
G = 1 i = 1 N   y ^ i y i 2 i = 1 N   y i 1 N i = 1 N   y i 2 × 100
where N represents dataset size, and y and y ^ represent the actual and predicted outputs.

2.8. System Overview for Estimating the Parameter Vector ( θ )

The system overview is summarized in Figure 6. The parameter vector ( θ ) is estimated on the identification dataset by using the gradient descent and Gauss–Newton methods in sequential, two-stage processes for four different model structures. The performances of the model structures are evaluated on the verification dataset by using MSE, MAE and G measures. The orders of the model structures are determined by using the well-known grid search algorithm for the best prediction results.

3. Experiments

3.1. Experiment Setup

The experiments were made in C++ for the laboratory incubator. In the experiments, four different model structures, ARX, ARMAX, OE and BJ, were used for modeling the incubator. The laboratory incubator was considered an LTI SISO system.
In the experiments, two scenarios were carried out. In the first scenario, the training dataset was collected from the step response of the system while it was collected from the PRBS response of the system for the second scenario.
The model order selection for all the model structures in both scenarios was made by using the well-known grid search algorithm. The orders of polynomials in the model structures were selected by performing a grid search on the intervals [1,10]. The best orders of the polynomials for the model structures were determined on the basis of the goodness of fit (G) measure.
The parameter vector ( θ ) of the model structures was estimated by using PEM for both scenarios. The minimization of V N ( θ ) was made numerically in sequential two-stage processes. In the first stage, the parameters were estimated by using the gradient-descent method. In the second stage, the values of the parameters were used as initial values for the Gauss–Newton method, and the final values for the parameters were estimated [24].
The responses of the model structures having the estimated parameter vectors ( θ ) were computed for the verification dataset, which was collected from the PID-tuning process of the laboratory incubator. In the experiments, k-step-ahead prediction responses for 2, 10 and 20 steps were computed. Additionally, the simulation response of the model structure was provided, which was the infinite horizon prediction response, in other words, the response of an open-loop simulation model.
The performances of the model structures were examined and compared to each other in terms of the MSE, MAE, G measures and residue correlations.

3.2. Experimental Results

The experimental results for two scenarios in the study are summarized in the following subsections.

3.2.1. Results for the ARX Model

The model order of the ARX model was determined as n a = 2 and n b = 2 for the first scenario, and the parameter vector θ of ARX [2 2] was estimated on the identification dataset-1. The polynomials for the ARX model in the first scenario were obtained as in Equations (33) and (34).
A ( q ) = 1 0.83094 q 1 0.16883 q 2 ,
B ( q ) = 4.02159 × 10 5 q 1 0.16883 q 2 ,
For the second scenario, the model order of the ARX model was also determined as n a = 2 and n b = 2 , and the parameter vector θ of ARX [2 2] was estimated on the identification dataset-2. The polynomials for the ARX model in the second scenario were obtained as in Equations (35) and (36).
A q = 1 1.9876 q 1 + 0.9868 q 2 ,
B ( q ) = 4.474 × 10 5 q 1 3.785 × 10 5 q 2 ,
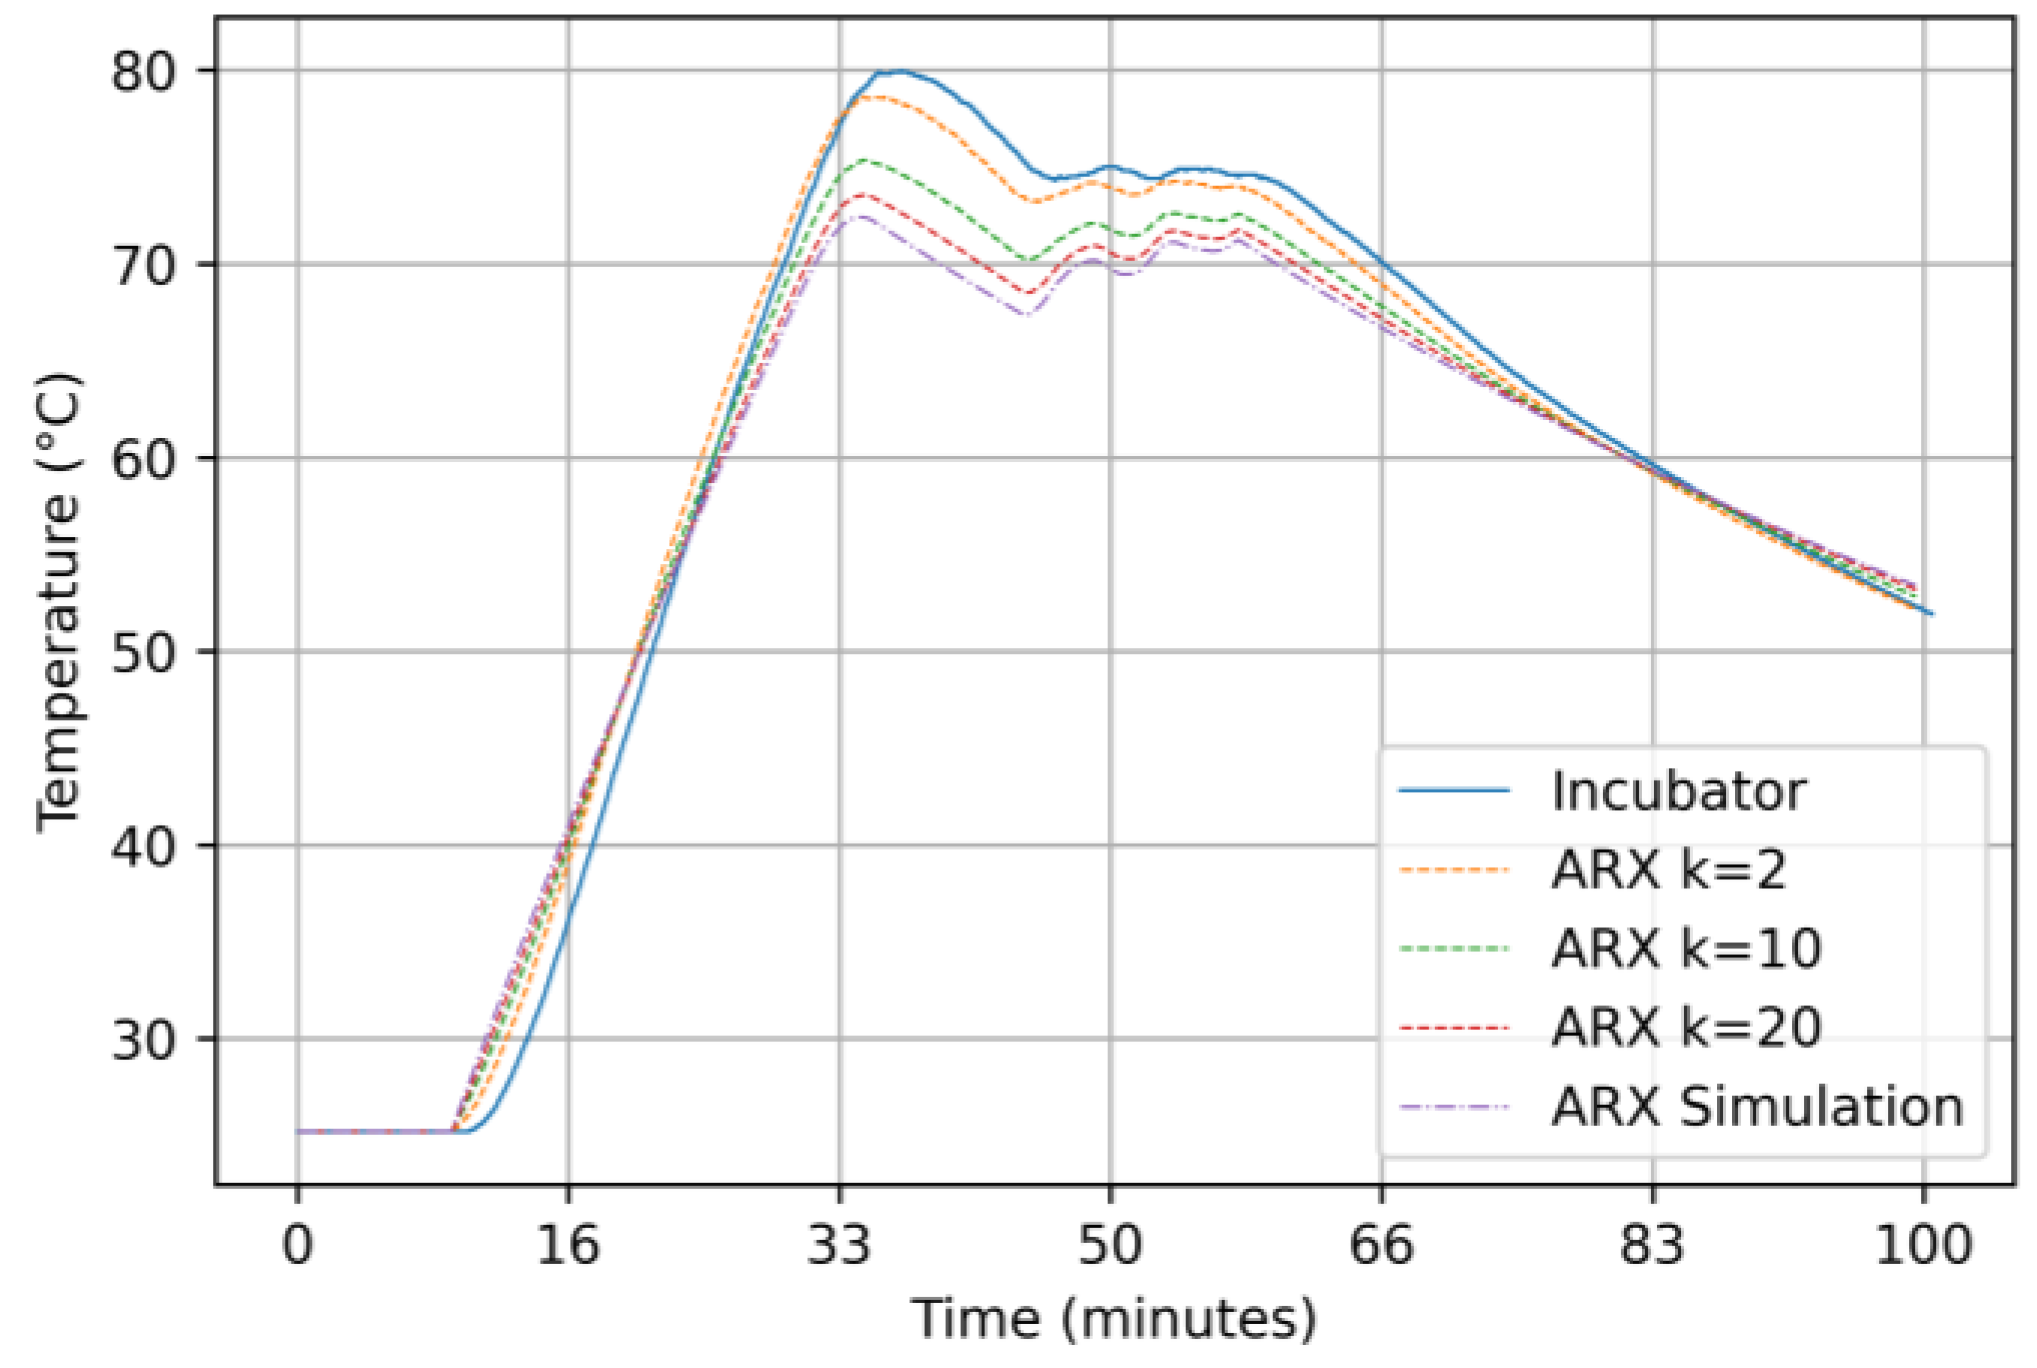
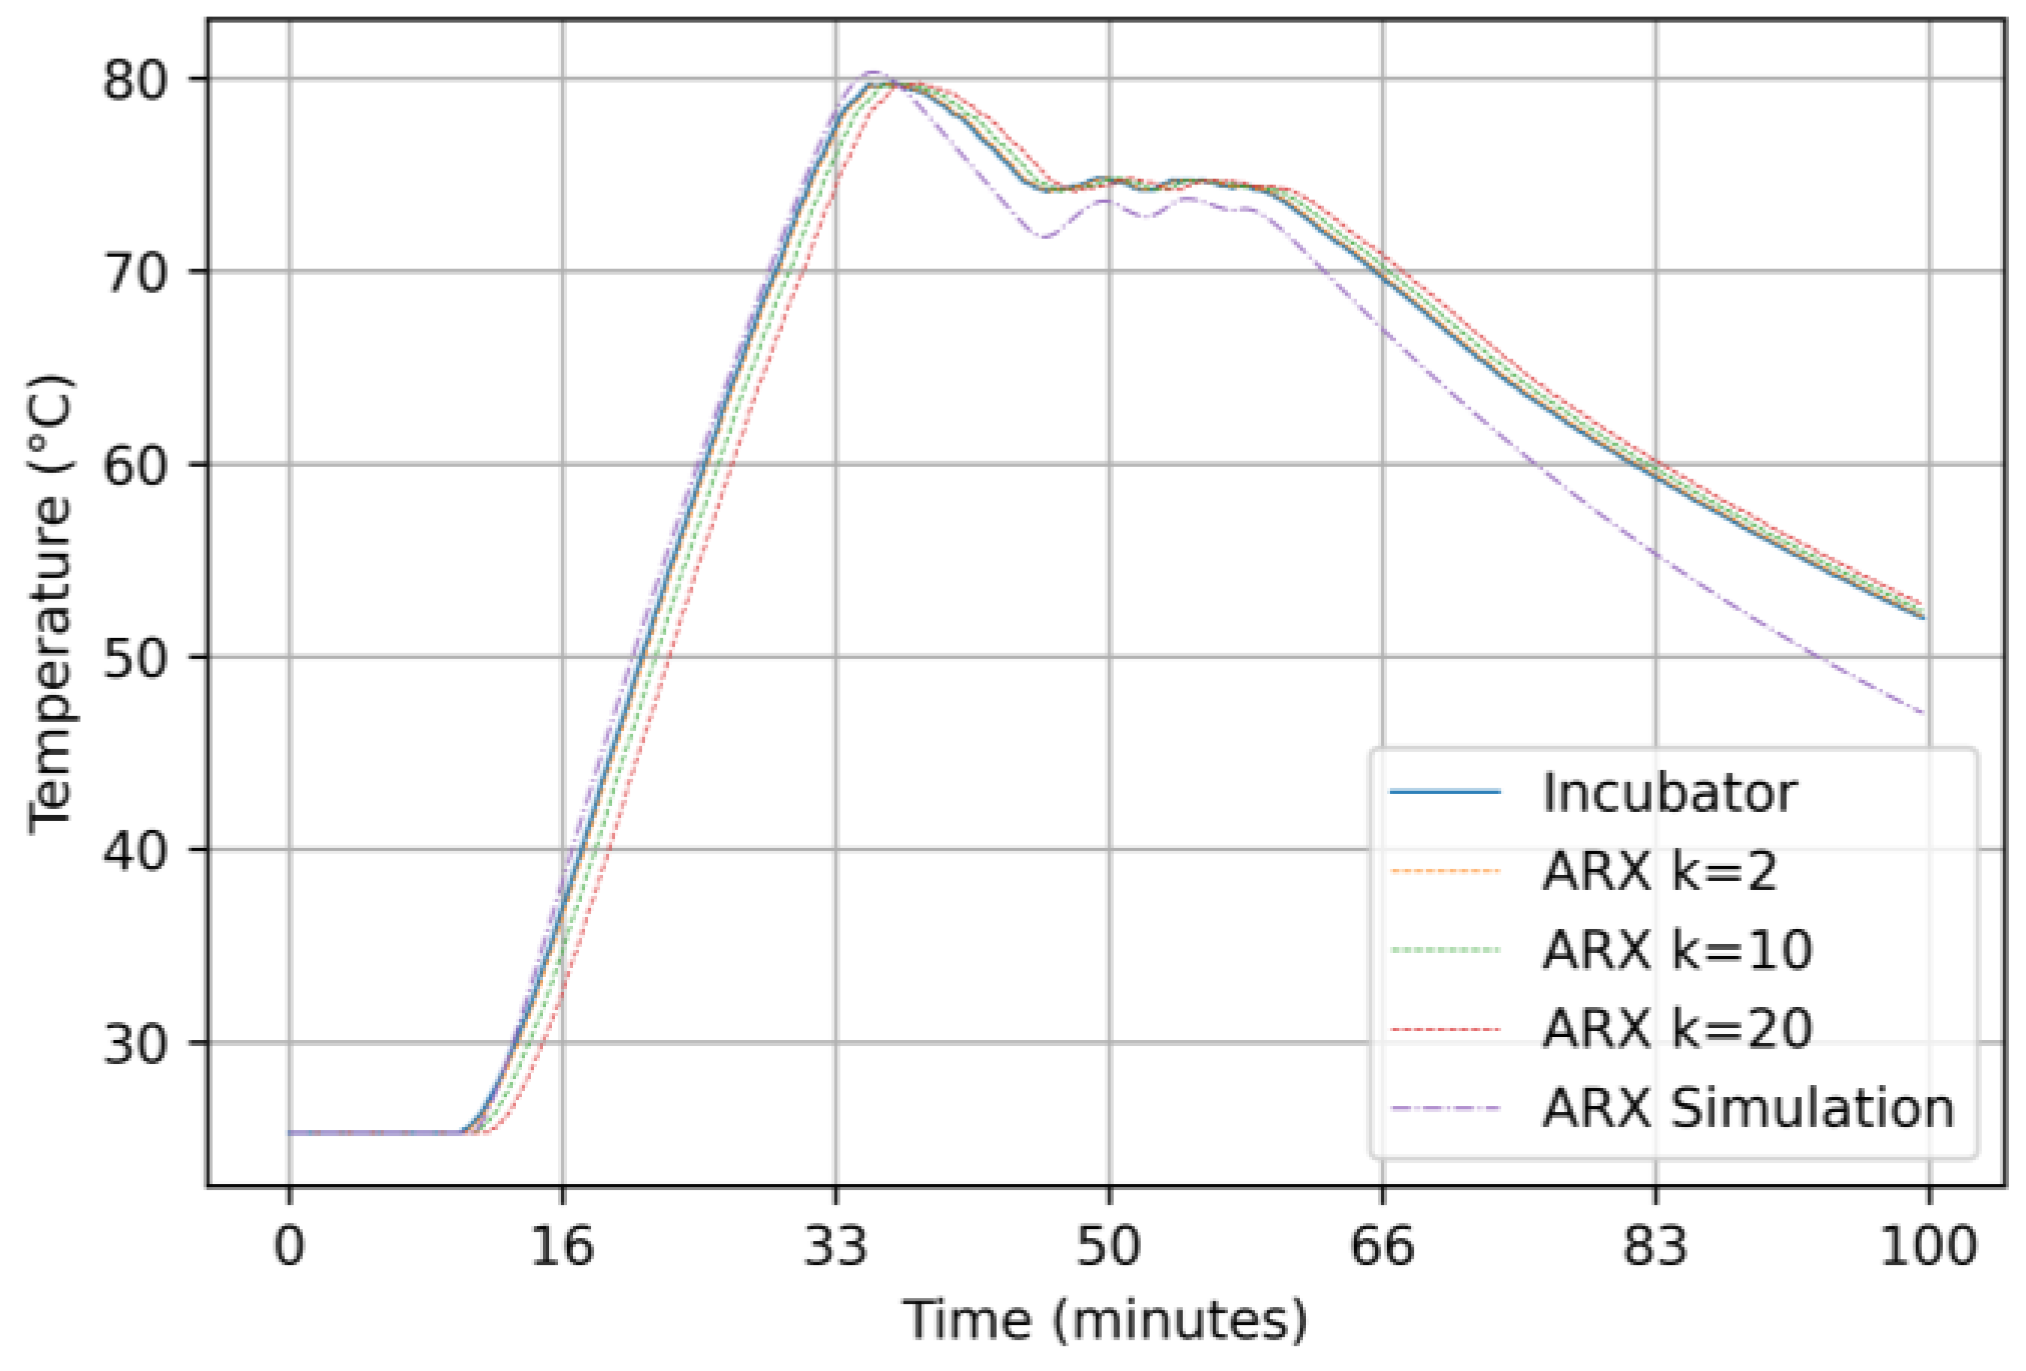
In order to make a performance evaluation of the model, the same verification dataset was used in both scenarios. The 2-step-, 10-step- and 20-step-ahead prediction and simulation responses of the model were computed for the verification dataset. The responses for both scenarios were compared with the actual output of the incubator and are visualized in Figure 7 for the first scenario and in Figure 8 for the second scenario.
In order to analyze the results of the model in more detail, the MSE, MAE and G measures were computed for k-step predictions (k = 2, 10 and 20) and simulation. The results of both scenarios for the model are represented in Table 1.
Additionally, the residue correlations, auto-correlation and cross-correlation for the model are represented in Figure 9 and Figure 10 for the first and the second scenarios, respectively.

3.2.2. Results for the ARMAX Model

For the first scenario, the orders of the polynomials in the ARMAX model were determined as n a = 2 , n b = 2 and n c = 2 . The parameter vector θ of ARMAX [2 2 2] was estimated on the identification dataset-1, and the polynomials for ARMAX model for the first scenario were obtained as in Equations (37)–(39).
A ( q ) = 1 1.99366 q 1 0.993663 q 2 ,
B ( q ) = 6.32413   ×   10 5 q 1 6.62595   ×   10 5 q 2 ,
C ( q ) = 1 1.32538 q 1 0.328971 q 2 ,
The orders of polynomials in the ARMAX model were also determined as n a = 2 , n b = 2 and n c = 2 for the second scenario, and the parameter vector θ of ARMAX [2 2 2] was estimated on the identification dataset-2. The polynomials for the ARMAX model in the second scenario were obtained as in Equations (40)–(42).
A q = 1 1.9947 q 1 + 0.99474 q 2 ,
B q = 3.7203   ×   10 5 q 1 + 3.9892   ×   10 5 q 2 ,
C q = 1 1.0346 q 1 +   0.08449 q 2 ,
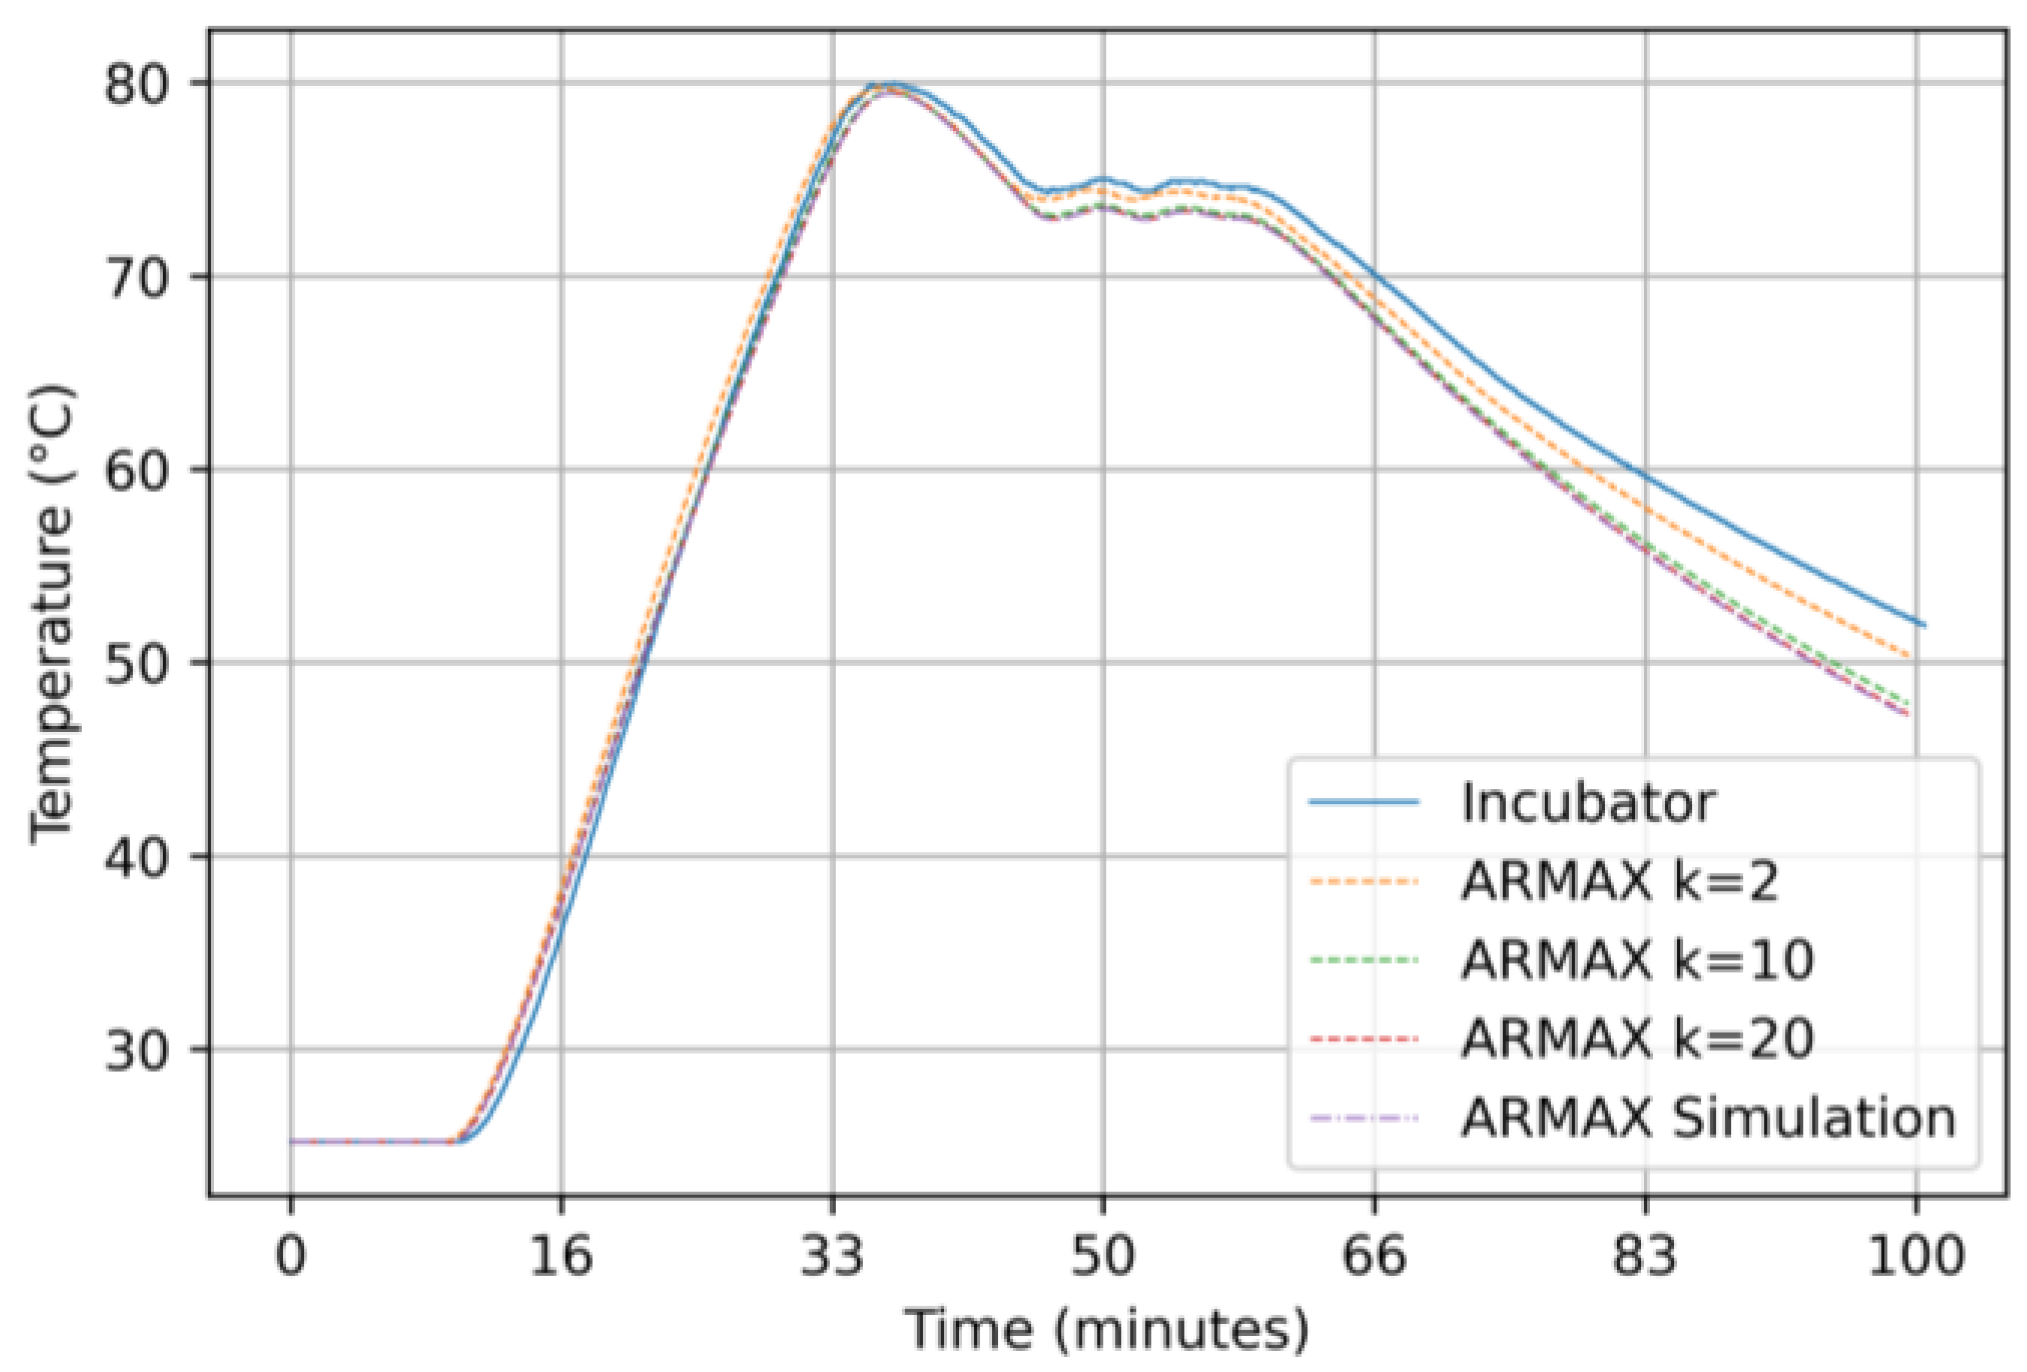
The performance evaluation of the model was made by using the same verification dataset for both scenarios. The 2-step-, 10-step- and 20-step-ahead prediction and simulation responses of the ARMAX [2 2 2] model were computed. The responses were compared with the actual output of the incubator and are visualized in Figure 11 and Figure 12 for the first and the second scenarios, respectively.
MSE, MAE and G measures for the ARMAX [2 2 2] model were computed for k-step predictions (k = 2, 10 and 20) and simulation. The results of both scenarios for the model are represented in Table 2.
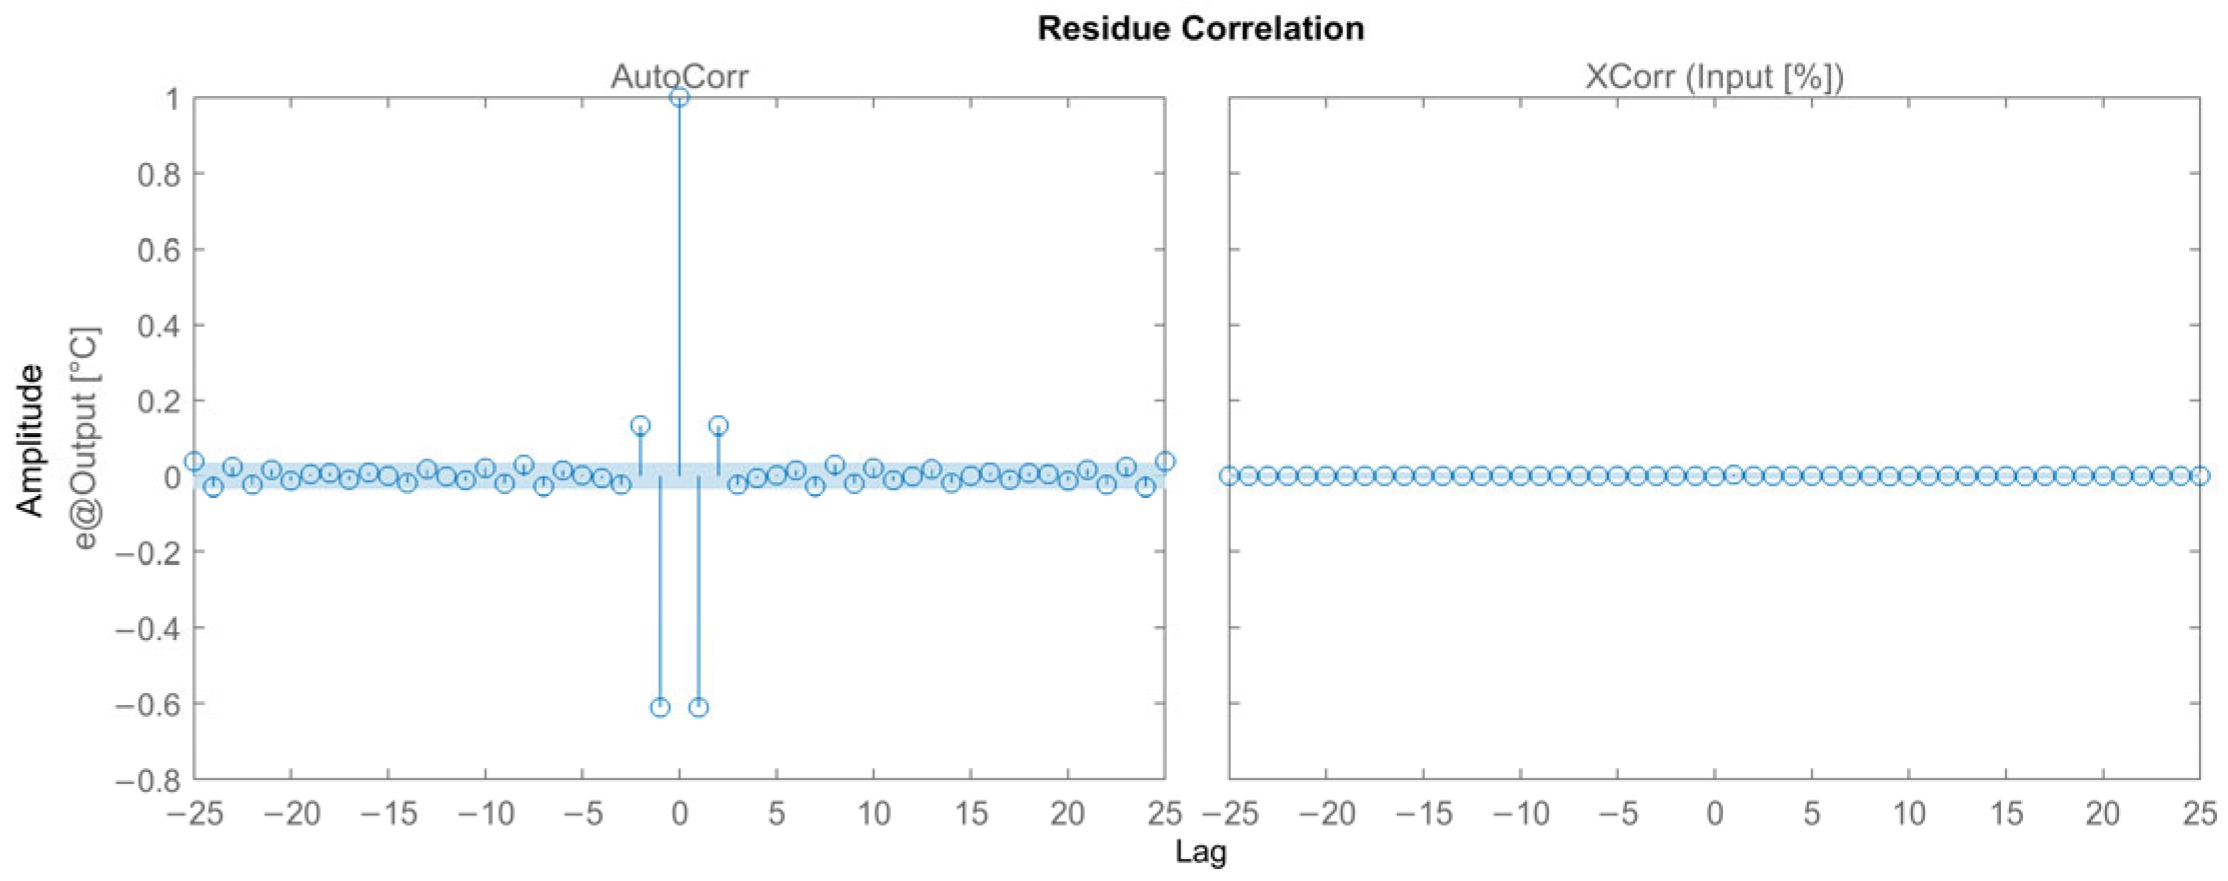
Residue correlations for the model are provided in Figure 13 and Figure 14 for both scenarios.

3.2.3. Results for the Output-Error Model

The order of polynomials in the OE model was determined as n b = 2 and n f = 2 for the first scenario. The parameter vector θ of OE [2 2] was estimated on the identification dataset-1, and the polynomials for the model for the first scenario were obtained as in Equations (43) and (44).
B q = - 5.54454   ×   10 5 q 1 + 5.89843   ×   10 5 q 2 ,
F q = 1 1.99252 q 1 + 0.99252 q 2 ,
For the second scenario, the model order of the OE model was determined as n b = 2 and n f = 2 , and the parameter vector θ of OE [2 2] was estimated on the identification dataset-2. The polynomials for the model in the second scenario were obtained as in Equations (45) and (46).
B q = 3.086   ×   10 5 q 1 + 3.409   ×   10 5 q 2 ,
F q = 1 1.993 q 1 + 0.9929 q 2 ,
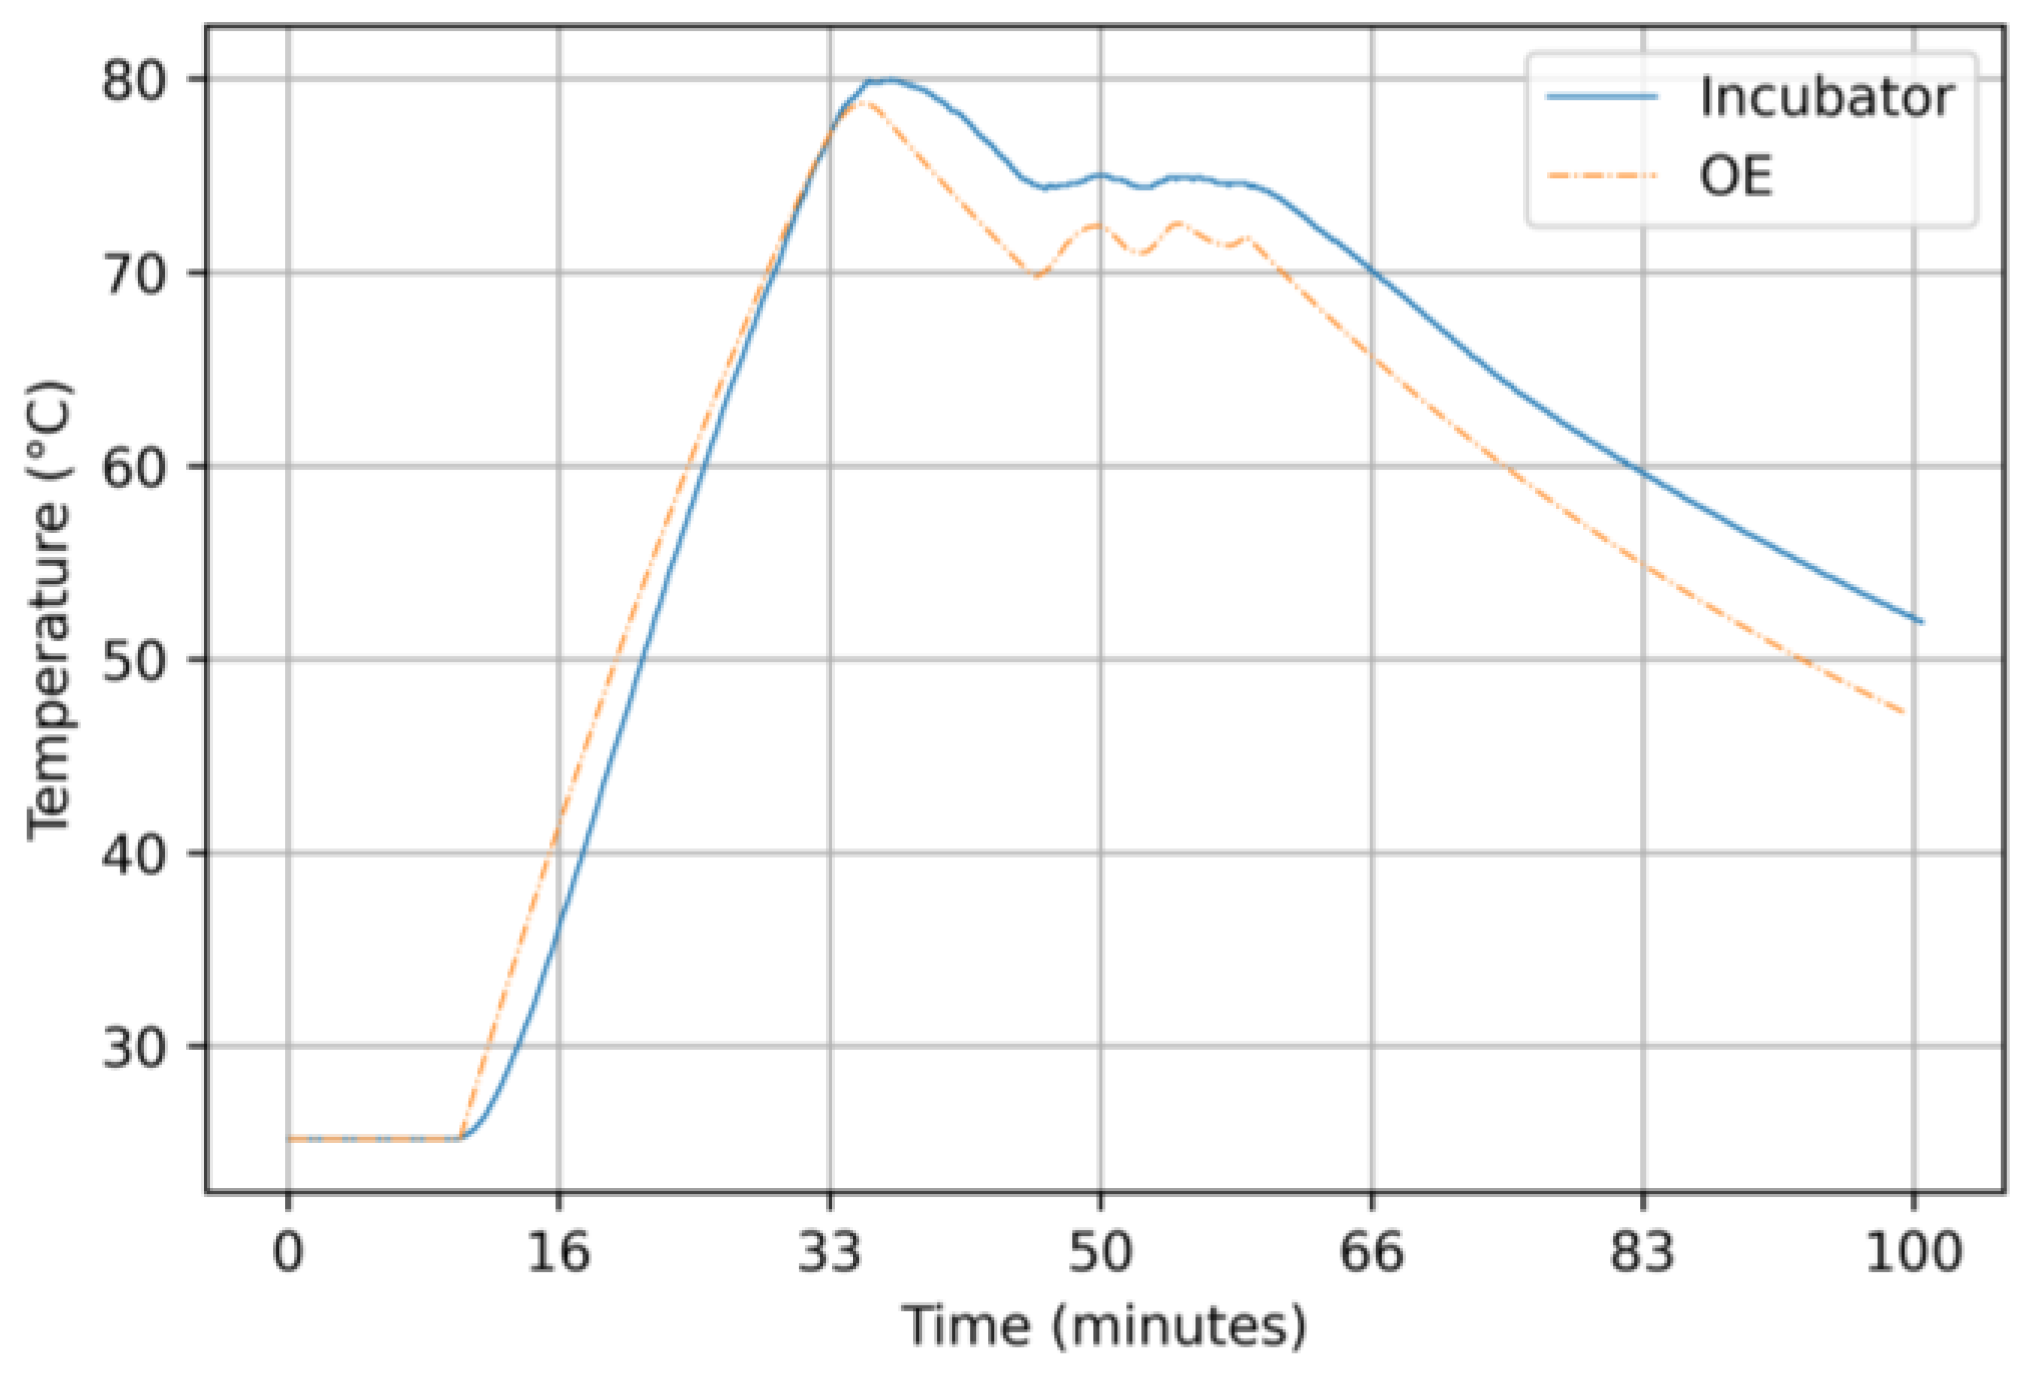
The same verification dataset was used for both scenarios. Because the OE model is a simulation model, only the simulation response of the OE [2 2] model was compared with the actual output of the incubator, as visualized in Figure 15 and Figure 16 for the first and second scenarios, respectively. It can be seen that the error between the simulation response and the actual output is very sensitive to the changes in input because the OE model does not use the past outputs.
MSE, MAE and G measures for the model were computed for the simulation response. The results of both scenarios are shown in Table 3.
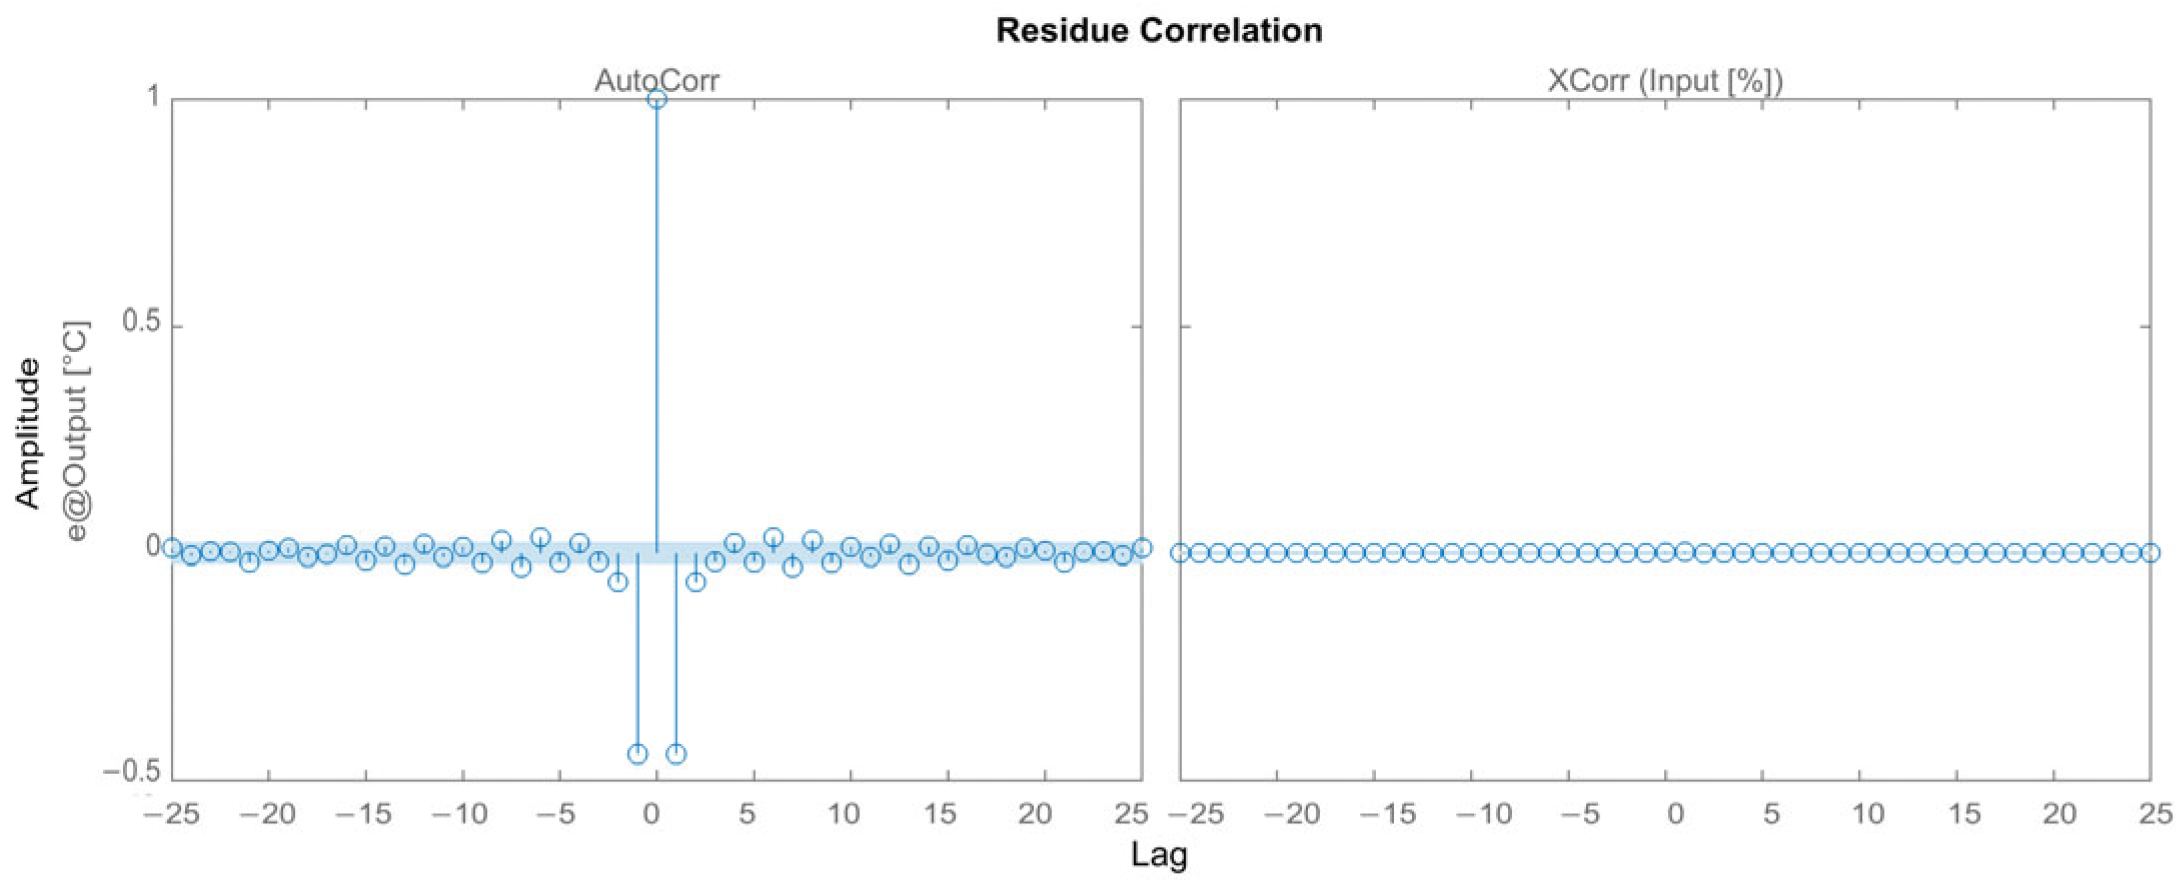
Residue correlations for the model are represented in Figure 17, and in Figure 18 for both scenarios.

3.2.4. Results for the Box–Jenkins Model

The order of the BJ model was determined as n b = 2 , n c = 2 , n d = 2 and n f = 2 for the first scenario. The parameter vector θ of BJ [2 2 2 2] was estimated on the identification dataset-1. The polynomials of the BJ model for this scenario were obtained as in Equations (47)–(50).
B ( q ) = 5.36891   ×   10 5 q 1 5.66662   ×   10 5 q 2 ,
C ( q ) = 1 0.663758 q 1 0.33229 q 2 ,
D ( q ) = 1 0.0039244 q 1 0.995552 q 2 ,
F q = 1 1.99376 q 1 + 0.993759 q 2 ,
For the second scenario, the order for the model was determined as n b = 2 , n c = 2 , n d = 2 and n f = 2 . The parameter vector θ of BJ [2 2 2 2] was estimated on the identification dataset-2. The polynomials for the BJ model were obtained as in Equations (51)–(54).
B ( q ) = 0.0001333 q 1 0.0001312 q 2 ,
C q = 1 + 0.1308 q 1 0.865 q 2 ,
D q = 1 1.296 q 1 + 0.2967 q 2 ,
F q = 1 1.996 q 1 + 0.9957 q 2 ,
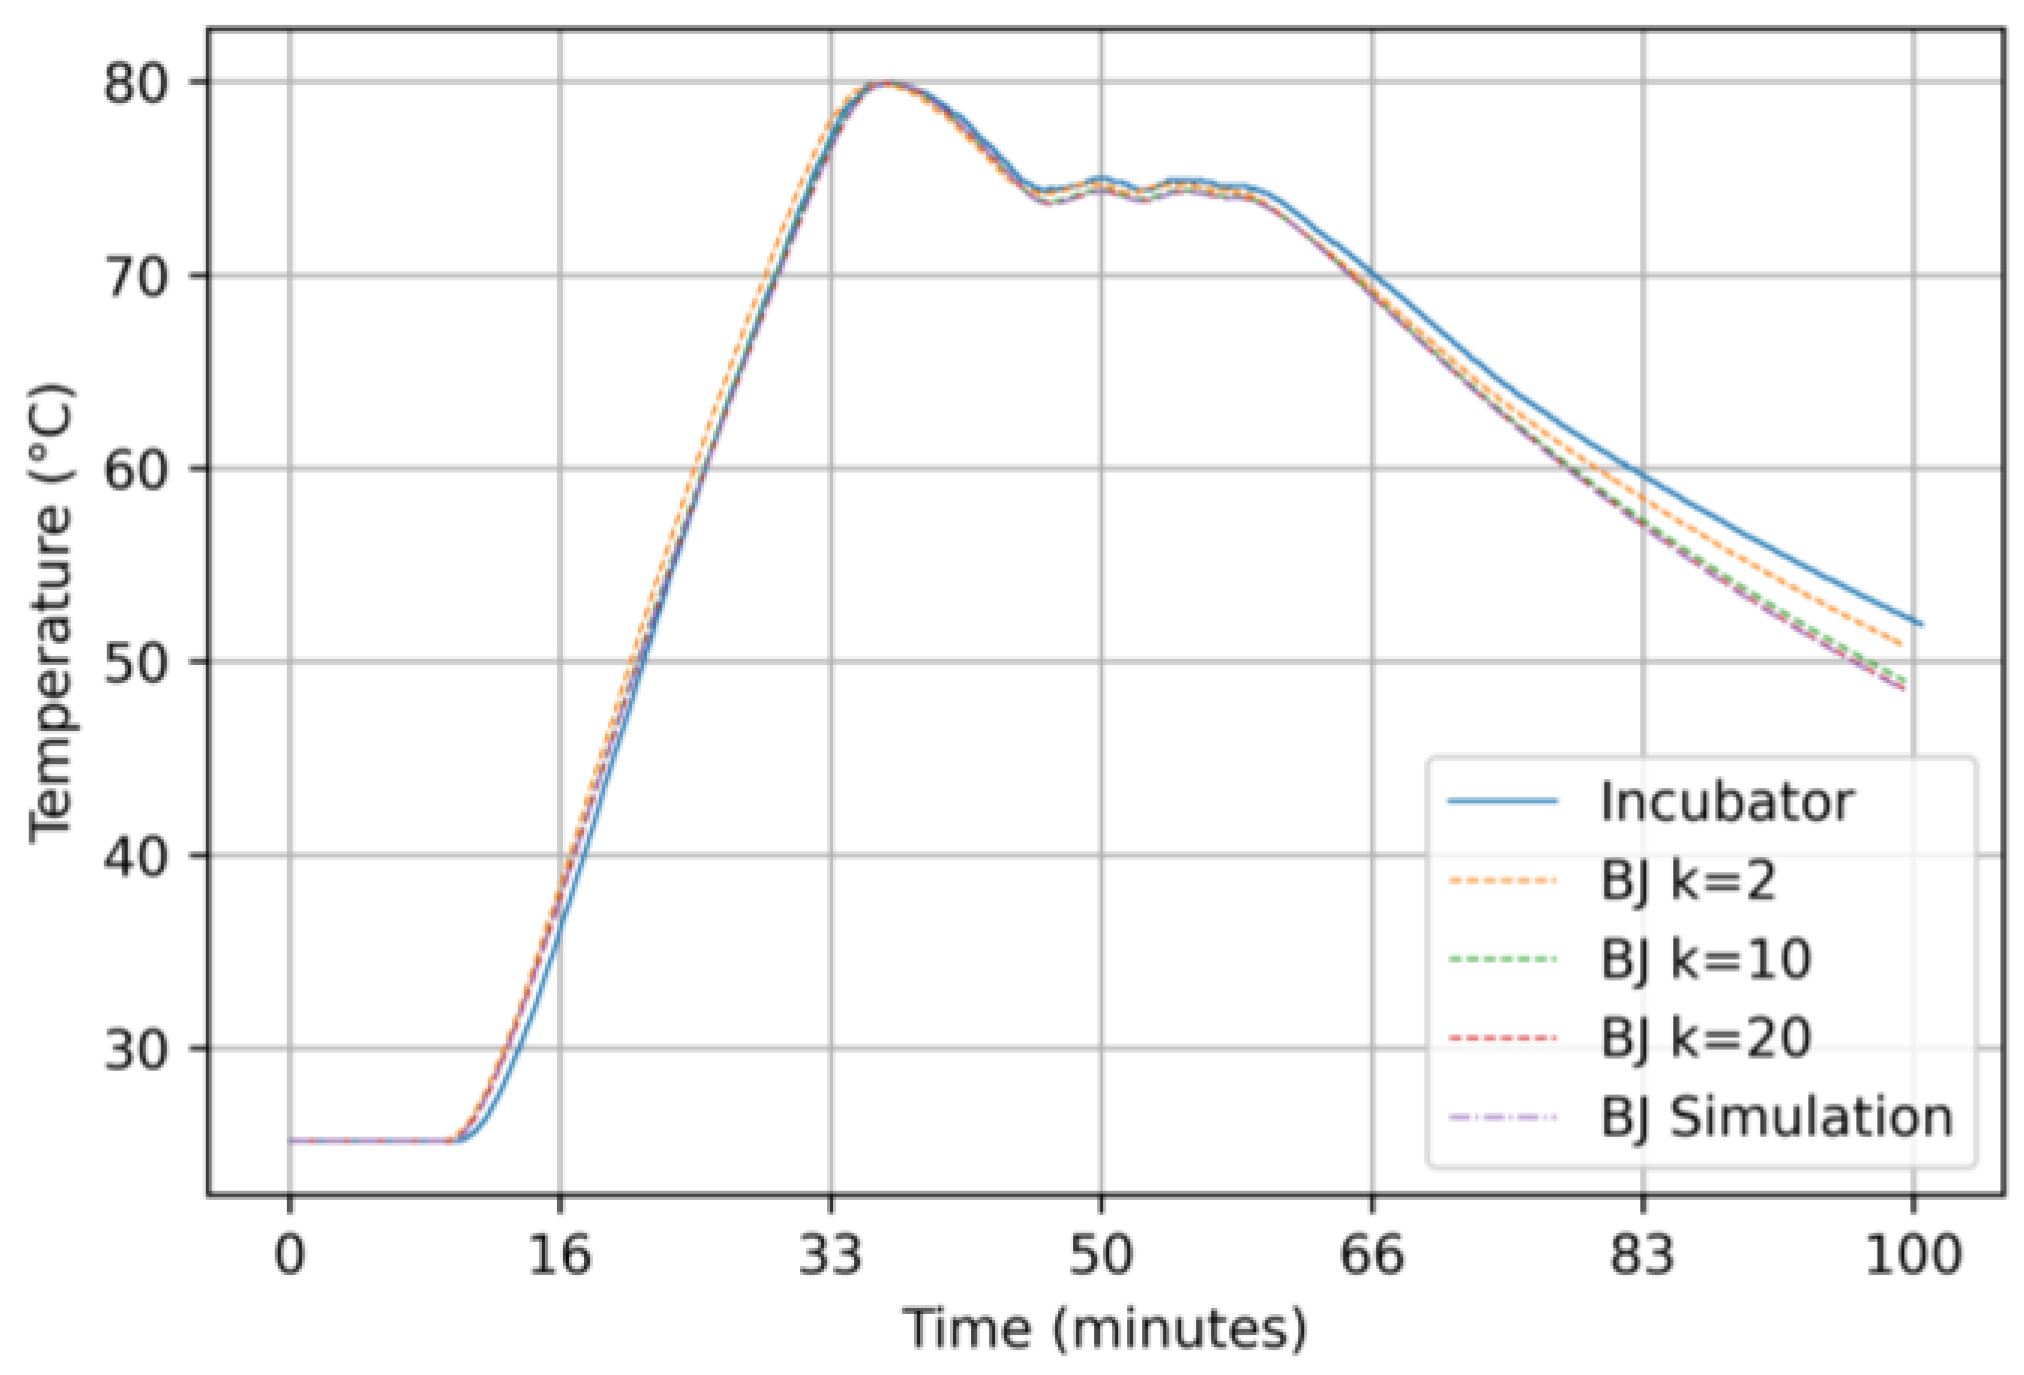
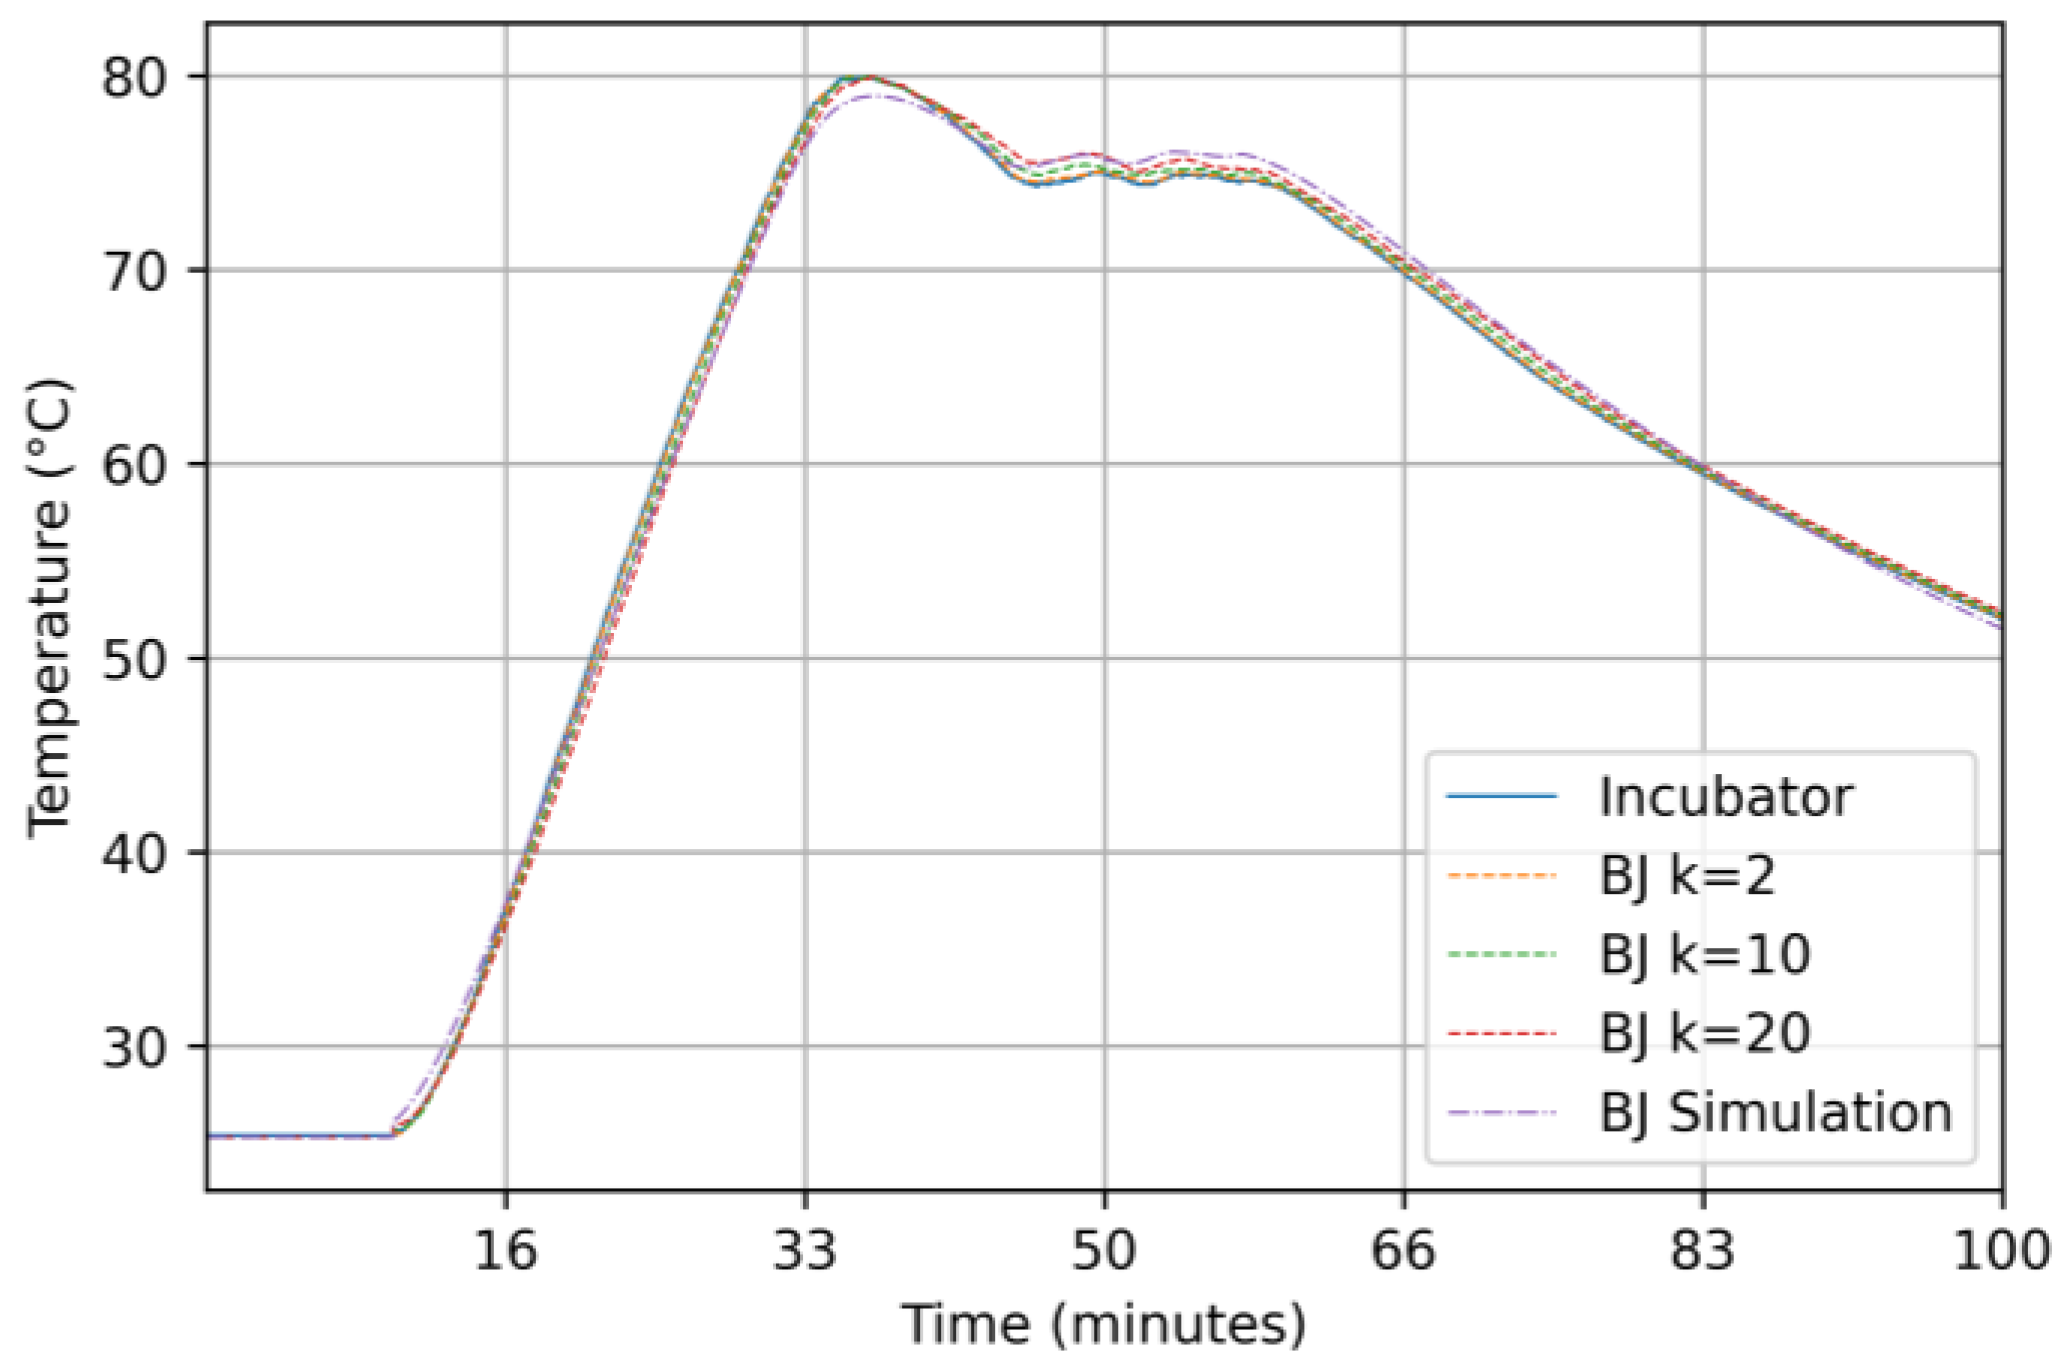
The 2-step-, 10-step- and 20-step-ahead prediction and simulation responses of the BJ [2 2 2 2] model for both scenarios were computed by using the verification dataset. The responses were compared with the actual output of the incubator and visualized in Figure 19, and in Figure 20 for the first and the second scenarios, respectively.
MSE, MAE and G measures were computed for k-step predictions (k = 2, 10 and 20) and simulation. The results for the model are represented in Table 4.
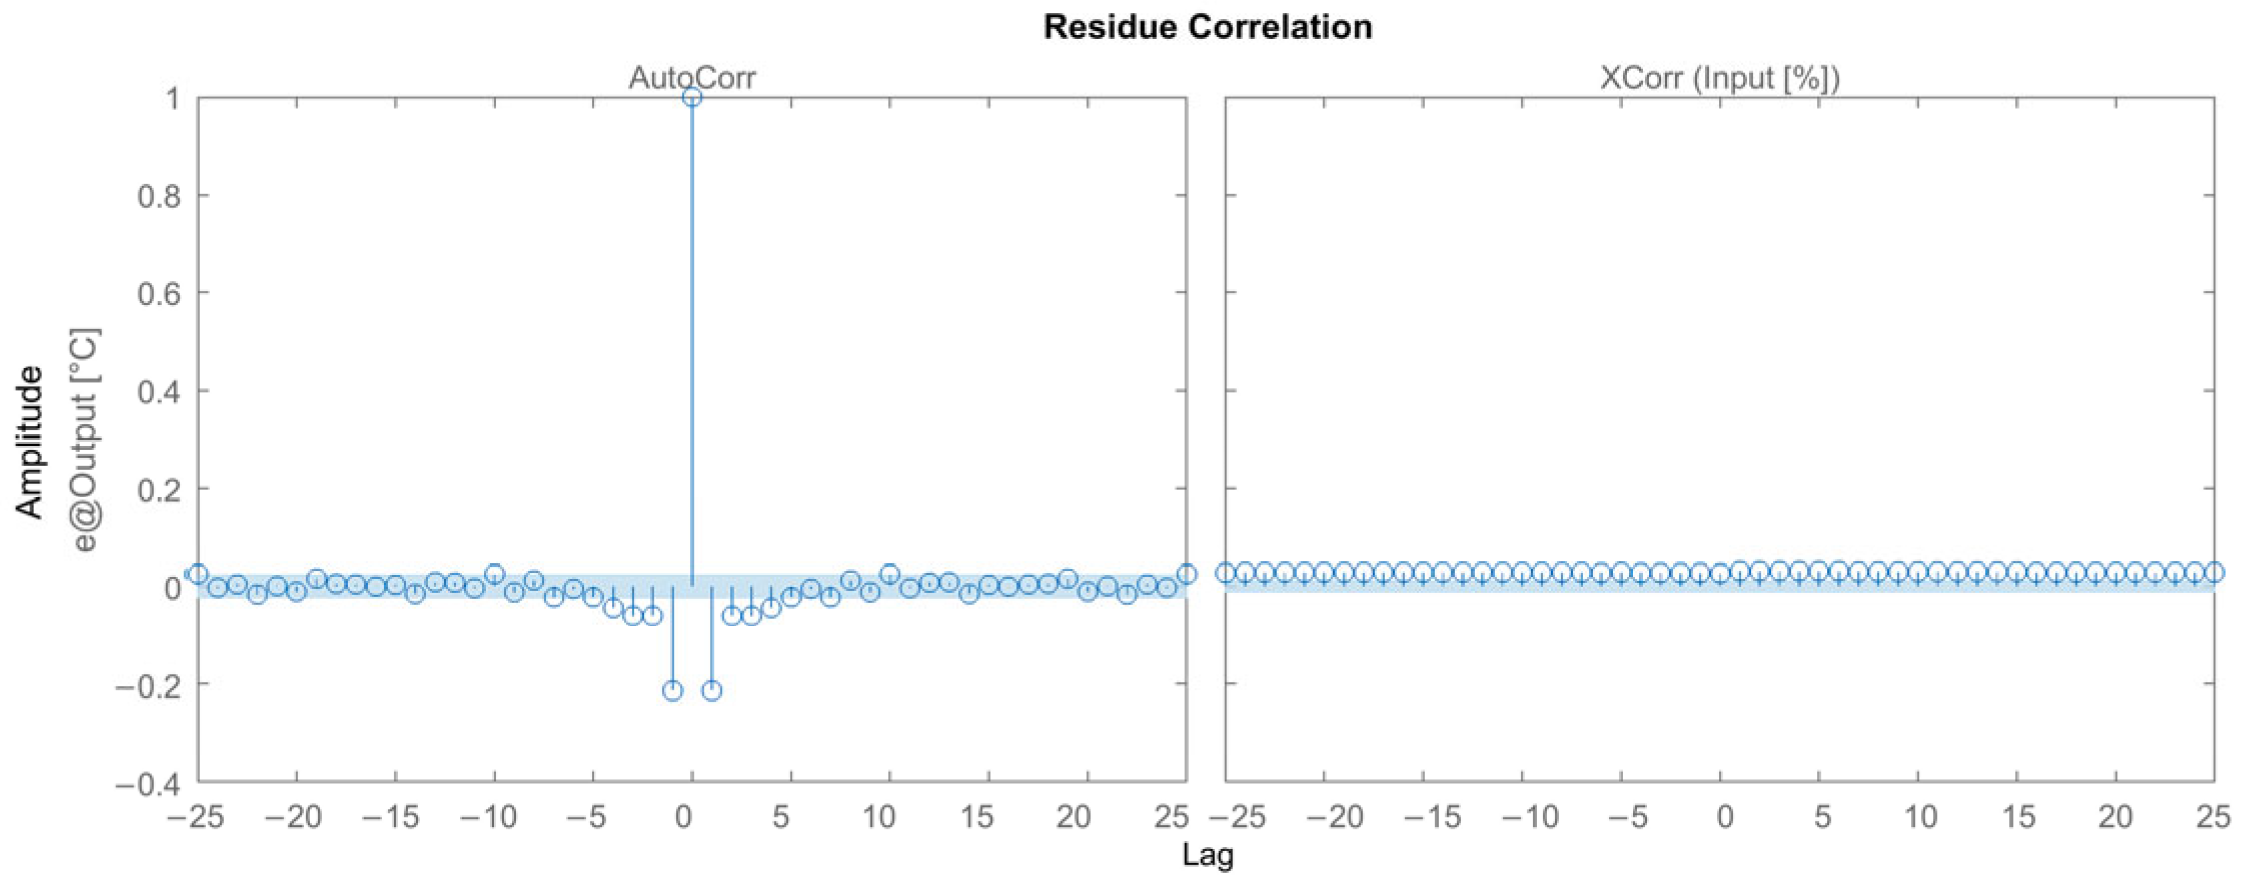
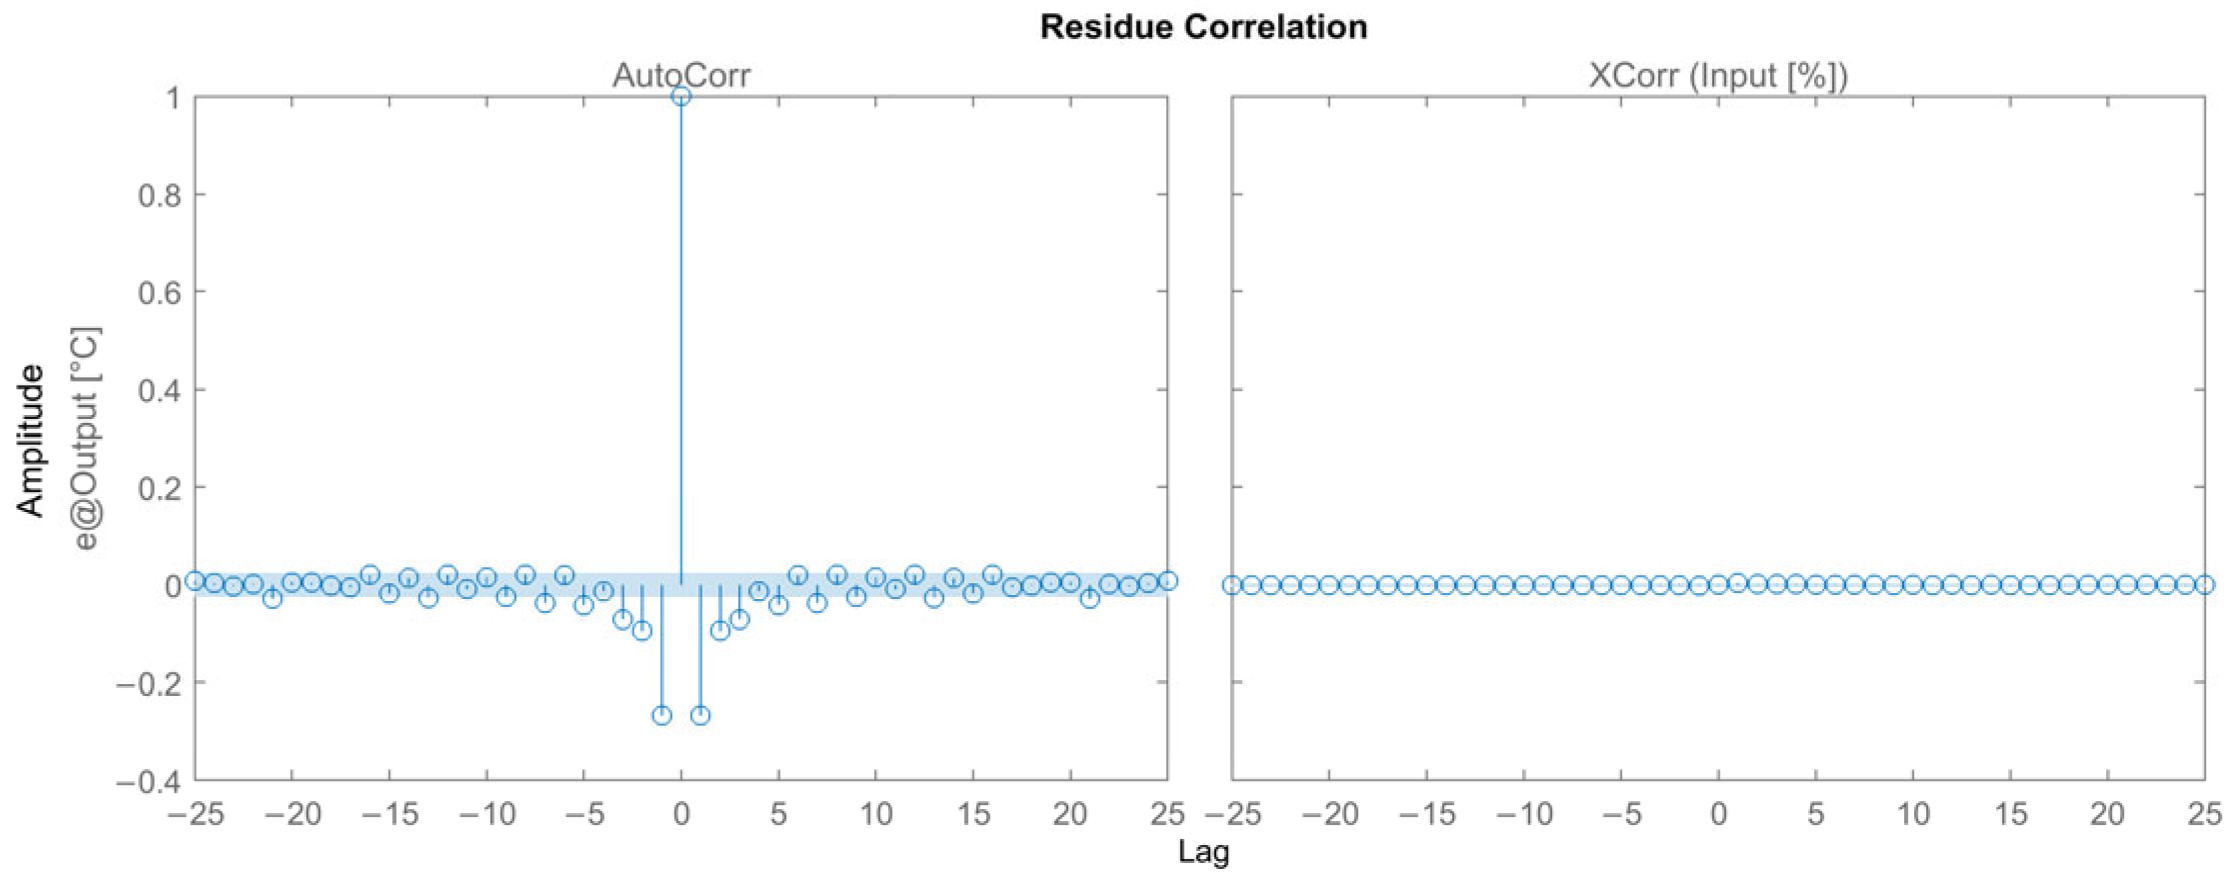
Residue correlations for the model are shown in Figure 21, and in Figure 22 for both scenarios.

4. Discussions

In order to make a comparative analysis of the performances of the models determined in the study, the results for both scenarios are represented in one table, as shown in Table 5.
It can be seen clearly from Table 5 that the best responses for all the k-step-ahead predictions and the simulation responses are achieved by the BJ model for both scenarios.
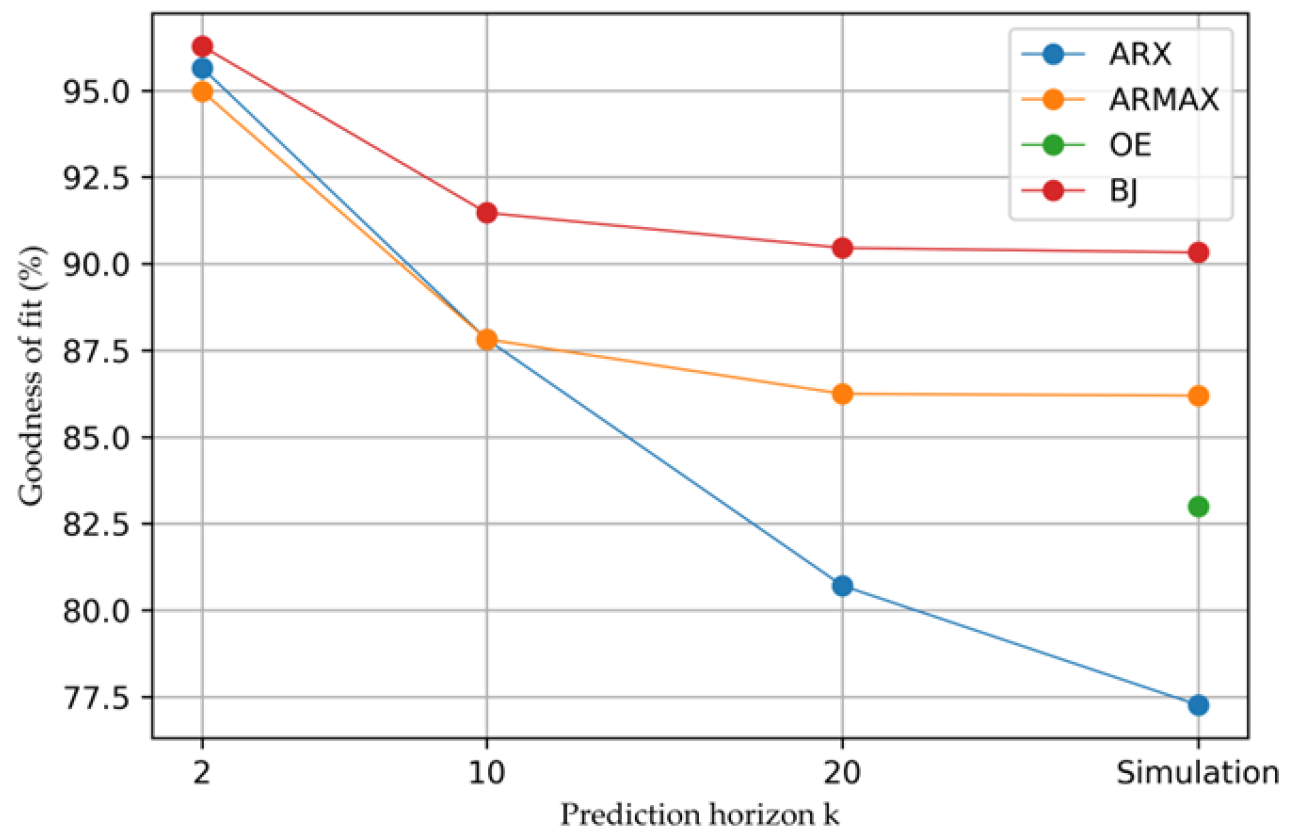
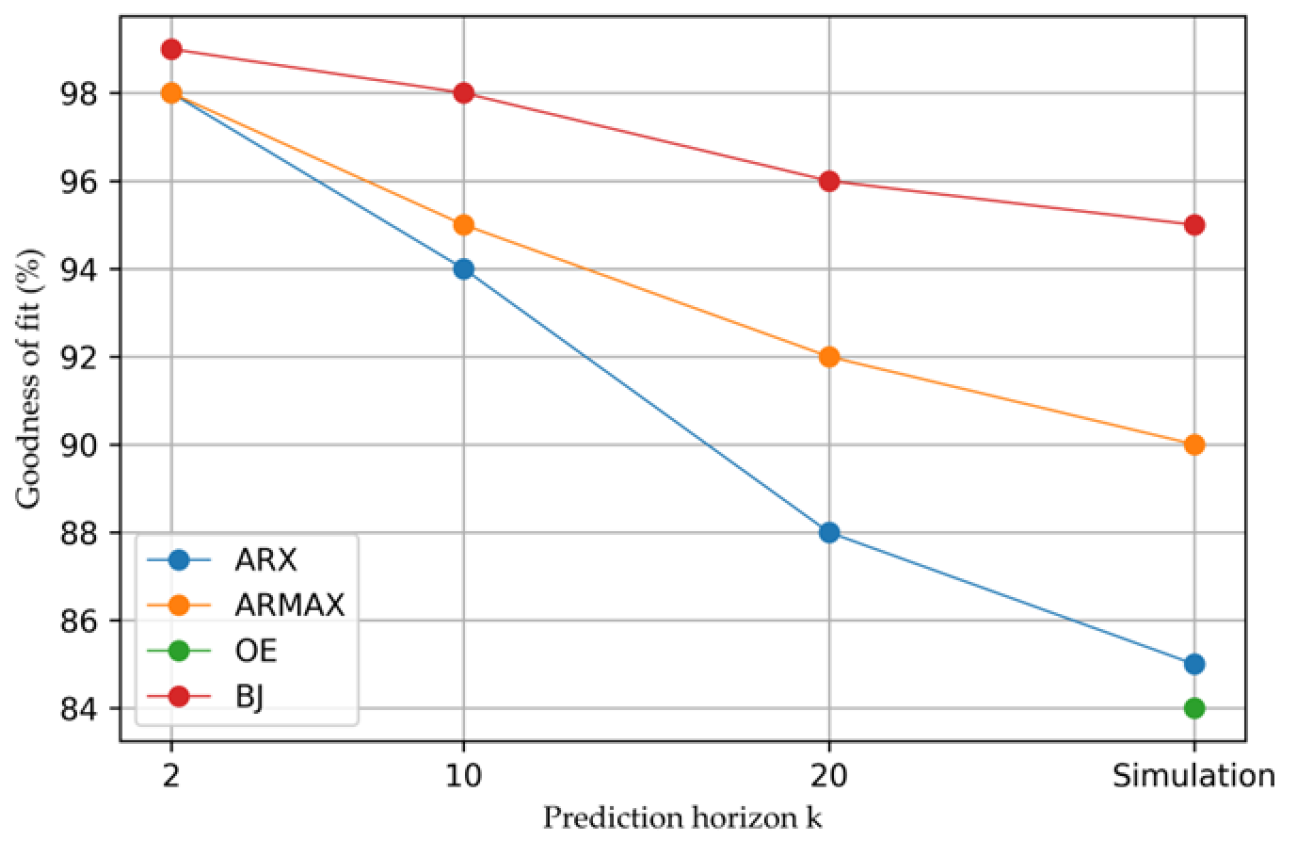
Additionally, we provide G vs. prediction horizon graphs in Figure 23, and in Figure 24 for both scenarios, to make visual interpretation. Due to the fact that the simulation response corresponds to an infinite horizon prediction, it is placed to the far right on the prediction horizon axis of the figures.
From Figure 23, for the first scenario, the following can be concluded: ARX has a better G value than ARMAX for k = 2, while ARMAX has better G values for k = 10 and 20 step-ahead-predictions and simulation. Although the G value of OE for simulation is greater than ARX, it is not a suitable model for the incubators used in practical applications. This is because OE has high deviations between the simulation and actual output, caused by changes in the input signal. BJ has the best G values for all the k-step-ahead predictions, including simulation.
From Figure 24, for the second scenario, the following can be concluded: ARX, ARMAX and BJ have similar G values for k = 2, while ARMAX has better G values than ARX for k = 10 and 20 step-ahead-predictions and simulation. BJ has the best G values for all responses, and the worst G value for simulation belongs to OE.
Residue analysis for both scenarios represents that all the models except OE have a good confidence level. The cross-correlation plots of the ARX, ARMAX and BJ models show that the cross-correlations between the residuals and input are within the confidence region, which is set to 99% for the study.

5. Conclusions

In this study, we propose an approach based on system identification methods for modeling a laboratory incubator by using input–output data. We consider the incubator an LTI SISO system. We apply four model structures, which are ARX, ARMAX, OE and BJ, for modeling the system. The parameters of these models are estimated on the identification datasets obtained in two scenarios by using PEM. The performances of the model structures are evaluated on the verification dataset in terms of mean squared error, mean absolute error and goodness of fit. Additionally, residue analysis including auto-correlation and cross-correlation plots is provided.
The experimental results show that the BJ model achieves the best responses among the models in terms of MSE, MAE and G measures for both scenarios. As mentioned, the BJ model has an over 90% fit percentage for the first scenario and an over 95% fit percentage for the second scenario for all the k-step-ahead predictions including simulation. In addition, residue analysis shows that the BJ model has a remarkable confidence level for both scenarios.
Based on the results of this study, it can be concluded that the BJ model determined in the study can be used as a successful model for laboratory incubators with similar configurations. In addition, it can also be used as a simulation model in the design phase of the control systems of the laboratory incubators.
The future research direction of this study is to use the BJ model in the study as a simulation model for the control system design of the laboratory incubators having wider temperature scales.

Author Contributions

Conceptualization, S.M. and E.Y.; methodology, S.M. and E.Y.; software, S.M. and E.Y.; validation, S.M. and E.Y.; formal analysis, S.M. and E.Y.; investigation, S.M. and E.Y.; resources, S.M. and E.Y.; data curation, S.M. and E.Y.; writing—original draft preparation, S.M. and E.Y.; writing—review and editing, S.M. and E.Y.; visualization, S.M. and E.Y.; supervision, E.Y.; project administration, E.Y.; funding acquisition, E.Y. All authors have read and agreed to the published version of the manuscript.

Funding

This study was supported by The Scientific and Technological Research Council of Turkey (TUBITAK) under project number 118C157, within the scope of the 2244 Industrial Ph.D. Program. Suleyman Mantar takes part in this project as a Ph.D. scholarship student.

Institutional Review Board Statement

Not applicable.

Informed Consent Statement

Not applicable.

Data Availability Statement

The raw data supporting the conclusions of this article will be made available by the authors on request.

Acknowledgments

We would like to thank TUBITAK for its support. The authors would also like to thank EMKO Elektronik A.S. for its support in this project.

Conflicts of Interest

Author Süleyman Mantar was employed by the company Emko Elektronik A.S. The remaining author declares that the research was conducted in the absence of any commercial or financial relationships that could be construed as a potential conflict of interest.

References

  1. Cappuccino, J.G.; Welsh, C.T. Microbiology: A Laboratory Manual; Pearson Education: London, UK, 2016; ISBN 9780134298597. [Google Scholar]
  2. Miller, A.K.; Ghionea, S.; Vongsouvath, M.; Davong, V.; Mayxay, M.; Somoskovi, A.; Newton, P.N.; Bell, D.; Friend, M. A Robust Incubator to Improve Access to Microbiological Culture in Low Resource Environments. J. Med. Devices Trans. ASME 2019, 13, 011007. [Google Scholar] [CrossRef] [PubMed]
  3. Pramuditha, K.A.S.; Hapuarachchi, H.P.; Nanayakkara, N.N.; Senanayaka, P.R.; De Silva, A.C. Drawbacks of Current IVF Incubators and Novel Minimal Embryo Stress Incubator Design. In Proceedings of the 2015 IEEE 10th International Conference on Industrial and Information Systems (ICIIS), Peradeniya, Sri Lanka, 18–20 December 2015; pp. 100–105. [Google Scholar] [CrossRef]
  4. Abbas, A.K.; Leonhardt, S. System Identification of Neonatal Incubator Based on Adaptive ARMAX Technique. In 4th European Conference of the International Federation for Medical and Biological Engineering; Springer: Berlin/Heidelberg, Germany, 2009; Volume 22, pp. 2515–2519. [Google Scholar] [CrossRef]
  5. Ljung, L. Perspectives on System Identification. IFAC Proc. Vol. 2008, 41, 7172–7184. [Google Scholar] [CrossRef]
  6. Kaya, O.; Abedinifar, M.; Feldhaus, D.; Diaz, F.; Ertuğrul, Ş.; Friedrich, B. System Identification and Artificial Intelligent (AI) Modelling of the Molten Salt Electrolysis Process for Prediction of the Anode Effect. Comput. Mater. Sci. 2023, 230, 112527. [Google Scholar] [CrossRef]
  7. Shen, H.; Xu, M.; Guez, A.; Li, A.; Ran, F. An Accurate Sleep Stages Classification Method Based on State Space Model. IEEE Access 2019, 7, 125268–125279. [Google Scholar] [CrossRef]
  8. Beintema, G.I.; Schoukens, M.; Tóth, R. Deep Subspace Encoders for Nonlinear System Identification. Automatica 2023, 156, 111210. [Google Scholar] [CrossRef]
  9. Gedon, D.; Wahlström, N.; Schön, T.B.; Ljung, L. Deep State Space Models for Nonlinear System Identification. IFAC-PapersOnLine 2021, 54, 481–486. [Google Scholar] [CrossRef]
  10. Oymak, S.; Ozay, N. Non-Asymptotic Identification of LTI Systems from a Single Trajectory. In Proceedings of the 2019 American Control Conference (ACC), Philadelphia, PA, USA, 10–12 July 2019; pp. 5655–5661. [Google Scholar] [CrossRef]
  11. Bagherian, D.; Gornet, J.; Bernstein, J.; Ni, Y.L.; Yue, Y.; Meister, M. Fine-Grained System Identification of Nonlinear Neural Circuits. In Proceedings of the 27th ACM SIGKDD Conference on Knowledge Discovery & Data Mining, Singapore, 14–18 August 2021; pp. 14–24. [Google Scholar] [CrossRef]
  12. Moradimaryamnegari, H.; Frego, M.; Peer, A. Model Predictive Control-Based Reinforcement Learning Using Expected Sarsa. IEEE Access 2022, 10, 81177–81191. [Google Scholar] [CrossRef]
  13. Armenise, G.; Vaccari, M.; Di Capaci, R.B.; Pannocchia, G. An Open-Source System Identification Package for Multivariable Processes. In Proceedings of the 2018 UKACC 12th International Conference on Control (CONTROL), Sheffield, UK, 5–7 September 2018; pp. 152–157. [Google Scholar] [CrossRef]
  14. Pillonetto, G.; Ljung, L. Full Bayesian Identification of Linear Dynamic Systems Using Stable Kernels. Proc. Natl. Acad. Sci. USA 2023, 120, e2218197120. [Google Scholar] [CrossRef] [PubMed]
  15. Fotouhi, A.; Auger, D.J.; Propp, K.; Longo, S. Electric Vehicle Battery Parameter Identification and SOC Observability Analysis: NiMH and Li-S Case Studies. IET Power Electron. 2017, 10, 1289–1297. [Google Scholar] [CrossRef]
  16. Gupta, S.; Gupta, R.; Padhee, S. Stability and Weighted Sensitivity Analysis of Robust Controller for Heat Exchanger. Control Theory Technol. 2020, 18, 56–71. [Google Scholar] [CrossRef]
  17. Fatima, S.K.; Abbas, S.M.; Mir, I.; Gul, F.; Mir, S.; Saeed, N.; Alotaibi, A.; Althobaiti, T.; Abualigah, L. Data Driven Model Estimation for Aerial Vehicles: A Perspective Analysis. Processes 2022, 10, 1236. [Google Scholar] [CrossRef]
  18. Bnhamdoon, O.A.A.; Mohamad Hanif, N.H.H.; Akmeliawati, R. Identification of a Quadcopter Autopilot System via Box–Jenkins Structure. Int. J. Dyn. Control 2020, 8, 835–850. [Google Scholar] [CrossRef]
  19. Paschke, F.; Zaiczek, T.; Robenack, K. Identification of Room Temperature Models Using K-Step PEM for Hammerstein Systems. In Proceedings of the 2019 23rd International Conference on System Theory, Control and Computing (ICSTCC), Sinaia, Romania, 9–11 October 2019; pp. 320–325. [Google Scholar] [CrossRef]
  20. DIN EN 60751; Industrial Platinum Resistance Thermometers and Platinum Temperature Sensors (IEC 60751:2022). International Electrotechnical Commission: Geneva, Switzerland, 2022.
  21. Ljung, L. System Identification: Theory for the User; Prentice Hall: Saddle River, NJ, USA, 1999; p. 609. [Google Scholar]
  22. Pillonetto, G.; Dinuzzo, F.; Chen, T.; De Nicolao, G.; Ljung, L. Kernel Methods in System Identification, Machine Learning and Function Estimation: A Survey. Automatica 2014, 50, 657–682. [Google Scholar] [CrossRef]
  23. Söderström, T.; Stoica, P. System Identification; Prentice-Hall International: Saddle River, NJ, USA, 1989. [Google Scholar]
  24. Verhaegen, M.; Verdult, V. Filtering and System Identification: A Least Squares Approach; Cambridge University Press: Cambridge, UK, 2007; pp. 1–405. ISBN 978-0521875127. [Google Scholar]
  25. Mustafaraj, G.; Chen, J.; Lowry, G. Development of Room Temperature and Relative Humidity Linear Parametric Models for an Open Office Using BMS Data. Energy Build. 2010, 42, 348–356. [Google Scholar] [CrossRef]
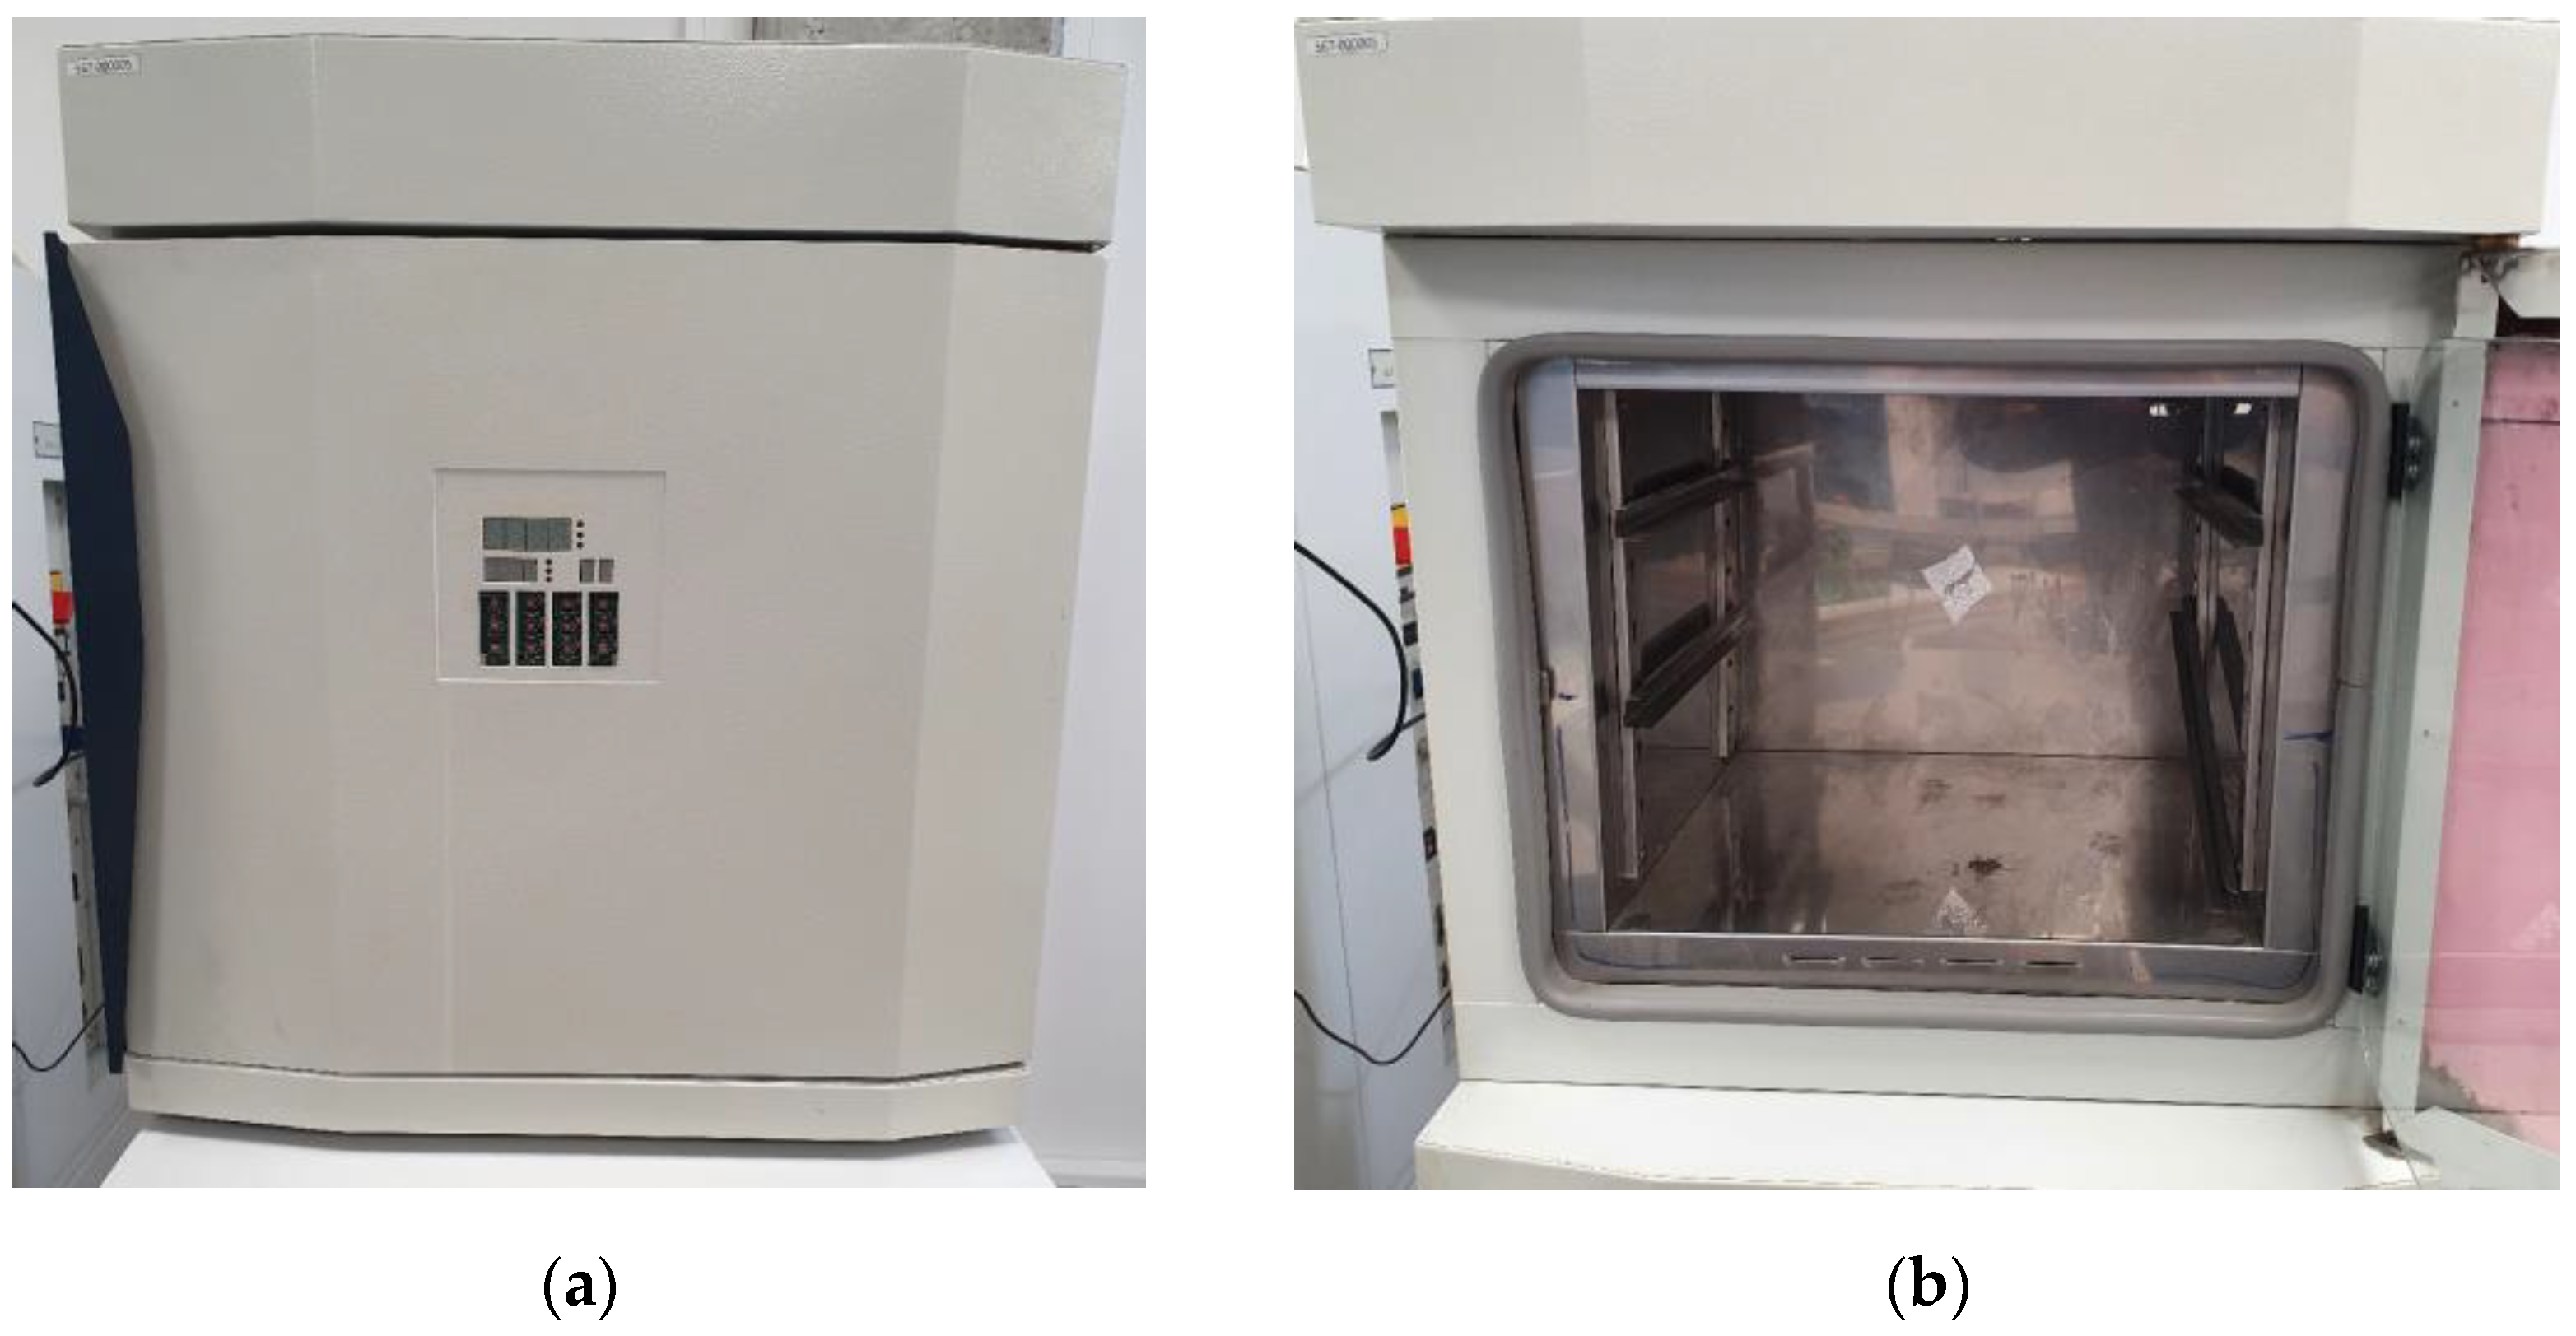
Figure 1. Laboratory incubator used in the study. (a) Front view with the closed door. (b) Interior view of the incubator.
Applsci 14 03466 g001
Figure 2. Data acquisition framework.
Applsci 14 03466 g002
Figure 3. Input–output graphs for step response, PRBS signal and PID tuning process.
Applsci 14 03466 g003
Figure 4. Classical system identification cycle [21].
Applsci 14 03466 g004
Figure 5. LTI system with an additive disturbance signal.
Applsci 14 03466 g005
Figure 6. System overview for estimating the parameter vector ( θ ).
Applsci 14 03466 g006
Figure 7. Comparison of the responses for ARX [2 2] in the first scenario.
Applsci 14 03466 g007
Figure 8. Comparison of the responses for ARX [2 2] in the second scenario.
Applsci 14 03466 g008
Figure 9. Residue correlations for ARX [2 2] in the first scenario.
Applsci 14 03466 g009
Figure 10. Residue correlations for ARX [2 2] in the second scenario.
Applsci 14 03466 g010
Figure 11. Comparison of the responses for ARMAX [2 2 2] in the first scenario.
Applsci 14 03466 g011
Figure 12. Comparison of the responses for ARMAX [2 2 2] in the second scenario.
Applsci 14 03466 g012
Figure 13. Residue correlations for ARMAX [2 2 2] in the first scenario.
Applsci 14 03466 g013
Figure 14. Residue correlations for ARMAX [2 2 2] in the second scenario.
Applsci 14 03466 g014
Figure 15. Comparison of the responses for OE [2 2] in the first scenario.
Applsci 14 03466 g015
Figure 16. Comparison of the responses for OE [2 2] in the second scenario.
Applsci 14 03466 g016
Figure 17. Residue correlations for OE [2 2] in the first scenario.
Applsci 14 03466 g017
Figure 18. Residue correlations for OE [2 2] in the second scenario.
Applsci 14 03466 g018
Figure 19. Comparison of the responses for BJ [2 2 2 2] in the first scenario.
Applsci 14 03466 g019
Figure 20. Comparison of the responses for BJ [2 2 2 2] in the second scenario.
Applsci 14 03466 g020
Figure 21. Residue correlations for BJ [2 2 2 2] in the first scenario.
Applsci 14 03466 g021
Figure 22. Residue correlations for BJ [2 2 2 2] in the second scenario.
Applsci 14 03466 g022
Figure 23. G vs. prediction horizon for the first scenario.
Applsci 14 03466 g023
Figure 24. G vs. prediction horizon for the second scenario.
Applsci 14 03466 g024
Table 1. ARX [2 2] results for the first and the second scenarios.
Validation CriteriaGMSEMAE
StepPRBSStepPRBSStepPRBS
Prediction k: 295.652698.73775.47874 × 10−55.0382 × 10−60.004942160.0016
Prediction k: 1086.110394.10060.000559250.000110050.01752260.0074
Prediction k: 2080.709988.31590.001078670.000431670.02443970.0145
Simulation77.265685.18580.001498260.000693940.02895410.0211
Table 2. ARMAX [2 2 2] results for the first and second scenarios.
Validation CriteriaGMSEMAE
StepPRBSStepPRBSStepPRBS
Prediction k: 294.975598.55647.3182 × 10−56.638 × 10−60.006450410.0020
Prediction k: 1087.821495.23880.0004299467.2225 × 10−50.01675750.0065
Prediction k: 2086.24792.29190.0005482990.000188990.01897460.0105
Simulation86.195790.53960.0005523930.000283340.01916620.0128
Table 3. Output-error [2 2] results for the first and second scenarios.
Validation CriteriaGMSEMAE
StepPRBSStepPRBSStepPRBS
Simulation83.051784.03690.0008569010.000805050.02401220.0235
Table 4. Box–Jenkins [2 2 2 2] results for the first and second scenarios.
Validation CriteriaGMSEMAE
StepPRBSStepPRBSStepPRBS
Prediction k: 296.279999.43354.01182 × 10−59.1998 × 10−70.00412330.0007
Prediction k: 1091.472198.12000.0002108161.0131 × 10−50.01086140.0021
Prediction k: 2090.457796.46820.0002639563.5756 × 10−50.01242880.0040
Simulation90.328895.07710.0002711327.0355 × 10−50.01239170.0074
Table 5. Comparison of the models in the study.
Validation CriteriaGMSEMAE
StepPRBSStepPRBSStepPRBS
ARX [2 2]
Prediction k: 295.652698.73775.47874 × 10−55.0382 × 10−60.004942160.0016
Prediction k: 1086.110394.10060.000559250.000110050.01752260.0074
Prediction k: 2080.709988.31590.001078670.000431670.02443970.0145
Simulation77.265685.18580.001498260.000693940.02895410.0211
ARMAX [2 2 2]
Prediction k: 294.975598.55647.3182 × 10−56.638 × 10−60.006450410.0020
Prediction k: 1087.821495.23880.0004299467.2225 × 10−50.01675750.0065
Prediction k: 2086.24792.29190.0005482990.000188990.01897460.0105
Simulation86.195790.53960.0005523930.000283340.01916620.0128
OE [2 2]
Simulation83.051784.03690.0008569010.000805050.02401220.0235
BJ [2 2 2 2]
Prediction k: 296.2799 *99.43354.01182 × 10−59.1998 × 10−70.00412330.0007
Prediction k: 1091.472198.12000.0002108161.0131 × 10−50.01086140.0021
Prediction k: 2090.457796.46820.0002639563.5756 × 10−50.01242880.0040
Simulation90.328895.07710.0002711327.0355 × 10−50.01239170.0074
* The best values in terms of the three measures among the models are marked in bold font.
Disclaimer/Publisher’s Note: The statements, opinions and data contained in all publications are solely those of the individual author(s) and contributor(s) and not of MDPI and/or the editor(s). MDPI and/or the editor(s) disclaim responsibility for any injury to people or property resulting from any ideas, methods, instructions or products referred to in the content.