Abstract
Small -class gridded ion thrusters are usually tested in a vacuum chamber without the use of a neutralizer, relying on self-neutralization of the ion beam due to interaction with facility walls. Langmuir probe measurements performed immediately downstream of such a thruster reveal values of the plasma potential of several hundreds of volts. If this locally very high potential indeed exists, it would have significant impact on the erosion rate of RIT grids and thus reduce the lifetime of thrusters compared to the generally accepted plasma potential of a few tens of volts. Further measurements performed with a movable Langmuir and emissive probes indicate that the probe mount violates the ability of the ion beam to self-neutralize. This is concluded due to dependence of the measured potential value on the degree of neutralization introduced in the experiment. Particle-in-cell and direct-simulation Monte Carlo simulations of the ion beam corresponding to experimental conditions (ion energy and ion beam current ) are carried out to determine the phenomena responsible for the self-neutralization; mainly, reactions with neutral species such as ionization by electron or ion impact and secondary electron emission (SEE) from the facility walls are compared. Reasonable agreement with measurements is achieved, and SEE is determined to be the primary source of electrons, indicating that facility and measurement disturbance effects majorly influence testing of (non-neutralized) ion beams. Further, limitations of the applicability of probe diagnostics on non-neutralized ion beams are described.
1. Introduction
Certain types of electric propulsion (EP) systems produce thrust by expelling charged particles of one polarity, presumably ions. The locally high positive potential produced by the ion beam results in radial spreading or “blow-up” of the beam downstream, which is expected due to repulsion of the positively charged ions [1]. In the environment of space, the usage of a neutralizer is required to ensure SCC in order to prevent the beam from electrostatic blow-up as well as electric current neutralization in order to avoid electrically charging the satellite. The neutralizer emits charges of opposite polarity (presumably electrons) and performs the required neutralizations. Ground testing in vacuum facilities of many EP systems such as gridded radio frequency ion thrusters (RITs) depends on the class of the thruster. While big -class thrusters are usually operated together with neutralizers, smaller -class thrusters are often operated without neutralizers and rely on the self-neutralization effect of the ion beam due to interaction with the facility walls. Employing a neutralizer (usually a hollow cathode discharge) would introduce additional neutral gas flow comparable to that from the small-size thruster itself and would result in a increased production rate of charge-exchange ions (CEX ions) and thus affect the erosion rate of the thruster grids. It is believed that operation without a neutralizer does not bias the test results regarding the lifetime assessment. Current neutralization in the present study is performed by connecting the thruster-grounded electrode to the vacuum facility itself. However, intrusive diagnostics such as Langmuir probes introduce non-negligible effects in self-compensated ion beams. The present results of Langmuir probe measurements in the plasma plume downstream of the thruster, where a -class RIT was tested, indicate that the behavior of the beam is significantly altered by the measurement devices themselves. In particular, the position of the Langmuir probe (inside or outside the beam) is found to have substantial influence on the measured values of the plasma potential, which is an important quantity as it determines the impact energy of the CEX ions. The measured values of several hundreds of volts considerably deviates from the generally accepted plasma potential of a few tens of volts [2].
The recombination of the electrons and ions on the surface of the probe and probe holder may be the reason for the elevated values of the plasma potential. The few sources of electrons in self-compensated beams are ionization by electron or ion impact and secondary electron emission (SEE) from the facility walls. The volumetric processes, i.e., chemical reactions such as ionization of a neutral gas, are ineffective due to the low density of neutral gas downstream; thus, SEE should be the only source of electrons. By placing the probe inside the beam, it acts as an additional sink of electrons, and thus, the process of SCC is significantly affected. In order for the plasma to stay in a stationary condition, this sink has to be compensated for by an additional source of electrons. As the only relevant source of electrons is the SEE, its rate should be increased. This can be achieved by an increase in the energy of the CEX ions impacting a surface. This energy increase can be provided by elevating the values of the plasma potential that is experimentally observed. In order to investigate the reason for the observed unusual values of the plasma potential, movable Langmuir and emissive probe diagnostics were installed. The setup allows for radial scans of the beam at fixed positions downstream. The results indicate that as soon as the probe enters the ion beam, a jump in the potential on the order of several hundreds of volts takes place.
Electric probes are widely used tools for diagnostics of plasmas. Depending on the conditions occurring in the plasma, different theories of probe operation are required [3]. They are routinely applied for the diagnostics of plasmas produced by EP [4,5] and due to direct electrical contact with the plasma (invasive measurement); they are the method of choice for the determination of electrical parameters such as the floating or plasma potential and electric fields. Measuring electron density and temperature is achieved mostly through Langmuir probes. While the measurement of the floating potential can be performed by this type of measurement technique with high accuracy, difficulties are encountered when determining the plasma potential [6,7]. For this reason, emissive probes are usually employed since they allow for precise determination of [7,8,9]. Another drawback of invasive measurement is the disturbance of the plasma itself. In the theory of classic Langmuir probe measurement, it is assumed that the disturbance is confined to the sheath region, which has a size of several Debye lengths around the probe. It was demonstrated by [10] that, depending on the plasma parameters, the disturbance may have a length scale of the typical relaxation length of the electron energy distribution function. Specifically for EP, a study was carried out by [11] to quantify these probe disturbances for Hall thrusters. Both types of probes were successfully employed by [12,13,14] to analyze the neutralized plasma plume produced by RIT thrusters. However, due to some uncertainties, careful analysis of ion densities [14] and [15] should be performed when using a Langmuir probe. Detailed information on important aspects of carrying out probe measurements in plumes of RIT thrusters can be found in [15] and references therein.
The complex physical phenomena taking place in ion thruster plumes require sophisticated numerical approaches in order to analyze these both temporally and spatially. Widely used methods are particle-in-cell (PIC) simulations, with a cross-section-based collision database for modeling collision, CEX, or ionization events. The neutral gas is usually modeled with the widely used direct-simulation Monte Carlo (DSMC) method proposed by [16], but it is not coupled with PIC simulations. Simpler plasma simulations make use of assuming that, due to their low inertia, electrons may be modeled according to the Boltzmann relation. State-of-the-art simulations include fully kinetic models of electrons within the framework of coupled PIC-DSMC setups. DSMC of xenon in an electric thruster were reported by [17,18], who published results of fully kinetic simulations of a plasma thruster. In terms of ion beam neutralization of ion thrusters, a detailed study was carried out by [19], where different neutralizer arrangements and modeling approaches were compared.
To the best of the authors’ knowledge, no research on probe measurements in non- or self-neutralized ion beams exists in the literature. In the present study, the applicability of probe diagnostics and the degree of its influence on the plasma and ion beams of the plume is investigated. A series of experiments are performed, where radial scans at different positions downstream are made. Moreover, partial neutralization of the beam is achieved by placing a thermionic cathode outside the beam. The value of the potential jump depends on the degree of partial compensation, while other plasma quantities such as the electron density and energy do not.
2. Methodology
2.1. Experimental and Diagnostic Approach
The facility used for carrying out the experiments is a vacuum chamber (R2D2) of UniBwM that is specifically suited for simulating space conditions. A schematic of the test facility is outlined in Figure 1. R2D2 has a main chamber volume of and consists of a test chamber and hatch, which are separated by a pneumatic high-vacuum-isolation gate valve. The test chamber is composed of two segments and has a diameter of about and a total length of about 4 , while the hatch has dimensions of about in diameter and length. The pumping system of R2D2 has three stages. The first level consists of a rotary vane pump followed by a root pump that is used for the first pump down phase. The second level includes a rotary vane pump, a turbo-molecular pump (TMP) for rough pumping and four TMPs. The rotary vane pump provides a rough vacuum for the ac{TMP} and delivers the back rough vacuum pressure for the TMPs. After the first stage reaches the required pressure level, the second pumping stage is activated and then runs continuously during the whole test procedure. This stage reaches a pressure of . Two cryo vacuum panels (powered by a helium compressor) complete the vacuum system (third level). The cryo stage reduces the pressure significantly down to a pressure of without the thruster being in operation. Pressure measurement devices, labeled as vacuum gauge heads (VGHs) in Figure 1, are positioned at roughly half the total downstream distance from the thruster’s exit plane.
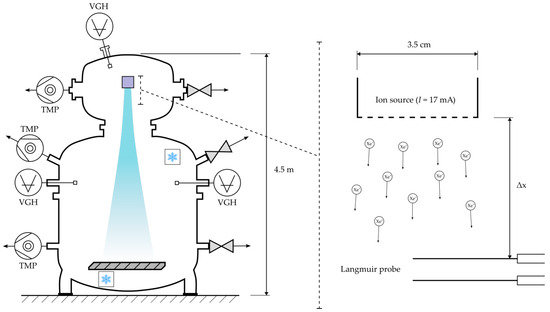
Figure 1.
Detailed layout of the R2D2 facility, showcasing the -class RIT test setup for plasma plume and self-neutralization studies. The schematic highlights the attached pumps and positioning of the Langmuir and emissive probes used for carrying out the measurements downstream of the RIT’s exit plane. The facility walls act as the primary source of the electrons responsible for self-neutralization of the ion beam. They originate through secondary electron emission (SEE) elicited by ion bombardment. Key components, including thruster location, probe alignment and data acquisition systems, are labeled to provide a comprehensive overview of the experimental arrangement.
A -class ion engine (described in detail by [20]) acts as the ion beam source and is installed within the upper hatch. The ion exhaust plume is ejected downstream into the main volume towards a beam target located at the bottom of R2D2. During operation, pressure levels of about 1 × 10⁻⁴ to 2.5 × 10⁻⁴ Pa are maintained throughout the facility. RITs use electrodeless inductive discharge for the generation of plasma, and their design is based on the standard configuration of an inductively coupled plasma source. The thruster is able to operate at thrust levels between 50 μ and 2 while requiring 7 to 75 W of power, respectively.
For spatially resolved probe diagnostics, two translation units are installed inside the vacuum facility, allowing 2D scans of the plasma plume in one plane. The unit for controlling the position in the radial direction has a translation range of 17 cm with positioning accuracy of , while the unit for setting the axial orientation has a range of . The probes are placed with a radial distance of from the RIT3.5 centerline axis, and an axial measuring range of 5 to 90 mm is employed.
The diagnostic measurement itself is carried out with two Langmuir and two emissive probes. The spatial resolution of measurement is performed with a spacing of 10 mm. The relative positions of the probes and the thruster in one chosen radial position is shown in Figure 2. The Langmuir probes are made of mm thick tungsten wire with a length of approx mm. The emissive probes are made of thick tungsten wire formed as a half-loop attached to two copper wires. The copper wires are insulated by glass capillars which are placed in the supporting ceramic tube. The electric connections are realized using a coaxial cable and are shown in Figure 3.
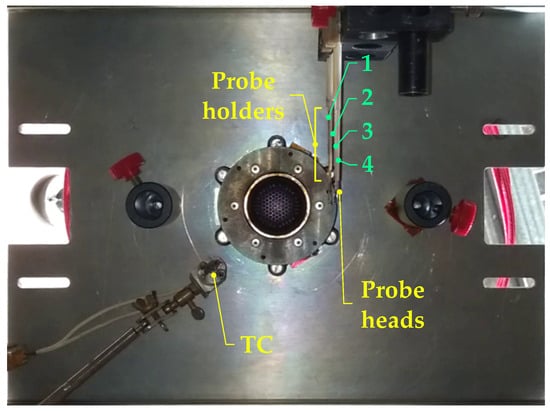
Figure 2.
Bottom view of probe positioning. Four probes are aligned vertically with (1) nearest to and (4) most distant from the thruster. The distance between probes (1) and (4) is 40 mm. The positions of probe holders, probe heads and the fixed thermionic cathode (TC) are indicated by arrows. The translational movement in the horizontal direction is conducted from left to right. The vertical movement is performed in the direction out of the image plane.
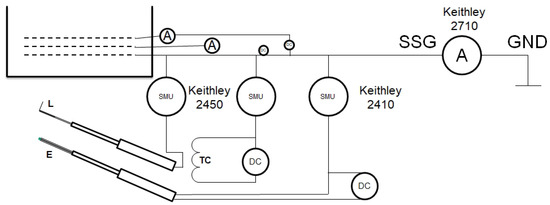
Figure 3.
Schematic representation of the electrical connections and circuitry used in the experiment. Only two of the four installed probes are indicated. The emissive probe (E) is heated by the isolated DC power supply and connected to the SMU. The Langmuir probe (L) is directly connected to the SMU. The fixed thermionic cathode (TC) can be heated by isolated DC power supply and is connected to the SMU. All electrodes are capable of floating operation (no net electric current flowing to the plasma). The thruster is placed on the isolated platform (SSG), which can be connected to the facility ground GND either directly or via a Keithley multimeter. During the measurement, all probes are referenced to the SSG.
The secondary star ground (SSG) was connected to the facility ground via a Kethley 2710 (all Kethley devices from: Tektronix Inc., Beaverton, Oregon, United States) multimeter operating as the ammeter. This setup delivered the value of neutralizing electric current flowing to the thruster platform and was in good agreement with the electric current measured in the first grid, which is equal to the ion beam current, as it is assumed that all electrons from the discharge chamber that are within the vicinity of the ion extraction grid will be absorbed by the positively charged screen grid. All connections of the probes were referenced to the SSG potential. The probe measurements were carried out by Keithley 2410 and Keithley 2450 source measurement devices, which are capable of sourcing 1000 V and 200 V, respectively. The translational positioning of the measurement apparatus was controlled by software written in the LabView 2019 SP1 environment.
2.1.1. Probe Diagnostics
For the determination of specific plasma quantities including , , electron number density and temperature , a combination of Langmuir and emissive probe diagnostics was employed. Langmuir probes are used for the determination of from the ion part of the voltage current characteristics (VCCs), and the floating potential is determined from zero-current condition. The plasma potential is determined as a floating potential of the emissive probe at the limit of high emission [5]. The electron temperature is estimated from the difference between the measured floating and plasma potentials .
In the expected range of at , the Debye length is located in the range of . The ratio of to the Langmuir probe diameter , and thus, the orbital motion limited (OML) theory of the ion current applies to the probe according to [4]. For cylindrical probes, this theory assumes that and . The squared values of the ion current should yield a straight line when plotted against the probe potential. The slope S of such a line is given by
where A, e and denote the probe area, elementary charge and ion mass, respectively. From the experimentally measured slope, can be determined, and the applicability of the OML theory evaluated upon the appearance of the squared ion current values is a straight line. An example of such an evaluation is given in Figure 4. Based on the obtained data, it is manifested that over a wide range of electron densities the squared ion current represents a straight line.
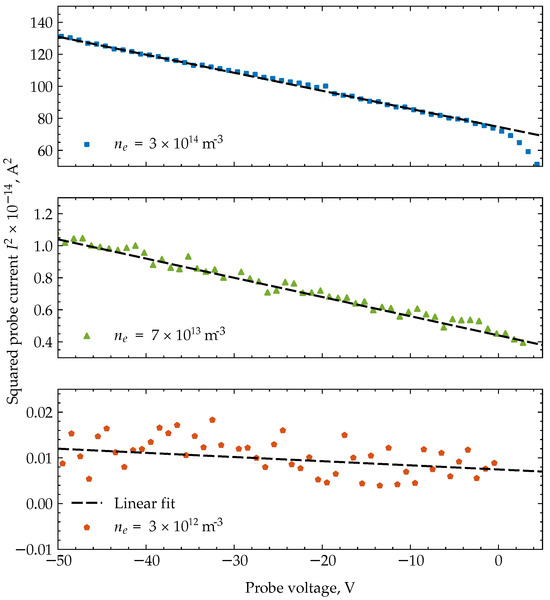
Figure 4.
Graphical representation of electron density () determination using orbital motion limited (OML) theory applied to Langmuir probe data. Each color represents a distinct set of experimental data taken at different radial positions, leading to varying electron densities within the plasma. The dashed black lines provide linear fits to the data. The presence of linear parts in the diagrams illustrates the applicability of the OML, allowing for the accurate determination of .
2.1.2. SSG and Grid Currents
As will be shown in detail in Section 3, the main source of electrons in the self-neutralized ion beams is SEE stemming from the facility walls. The SSG represents part of the facility; thus, it is to be expected that violation of the neutralization by the probes should influence the value of the electric current from the SSG to the facility grounds. The electron and ion flows contribute to the measured electric current with opposite signs. Hence, the electron emission from the SSG’s surface should reduce the value of the measured SSG current. This circumstance is illustrated in Figure 5, where the SSG current together with the currents of the first and second RIT3.5 grids are highlighted.
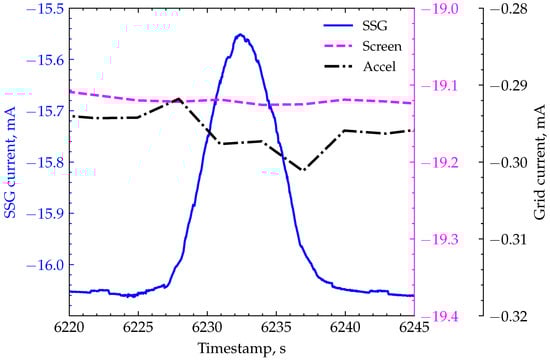
Figure 5.
Example of electric current change during radial probe movement through the ion beam. The blue curve denotes the SSG current, the purple curve is the first (plasma) grid current, and the black curve represents the second (accel) grid current.
The data in Figure 5 are taken during the radial movement of the probes through the beam. Clear dependence of the SSG current on the position of the probes can be observed—the absolute value of the electric current leaving the SSG is smaller (blue curve in Figure 5; the measured negative values appear as a maximum on the diagram). The ion beam current (purple curve in Figure 5), which is equal to the electric current to the first grid, remains unchanged. This observation indicates that crossing of the beam by the probes yields higher electron emission from the SSG. The value of the SSG current is somewhat smaller than the value of the first grid current. This can be attributed to the influence of multiply charged ions present in the RF plasma of the RIT. The ratio of the currents of singly and multiply ionized ion beams for a given acceleration voltage can be estimated as
where and are the corresponding ion densities. The electric current of the multiply charged ions does not leave the SSG because their trajectories do not follow the optimal path of the electrostatic lens system. Applying Equation (2) with the assumption of a 5 content of doubly charged ions results, in our case, in an electric current of mA out of a total of 19 mA extracted from the plasma. This is in good agreement with the measured difference of 3 mA between the SSG and first grid currents in Figure 5.
2.2. Numerical Approach
In order to support the findings obtained from the experiments and diagnostics as well as to improve the understanding of the occurring physical phenomena, numerical modeling of two experimental cases was carried out. The first simulation is concerned with the undisturbed ion beam and subsequent self-neutralization through pseudo SEE at the chamber walls (ions crossing the vacuum chamber boundary condition emit a specific averaged number of electrons (i.e., yield) based on their impact kinetic energy). The second simulation features nearly the same setup, with the only difference being the four measurement probes located inside the ion beam, which produce a disturbance. All simulations are carried out using the open-source code PICLas [21], which employs the higher-order discontinuous Galerkin (HODG) method as the electromagnetic field solver and the DSMC method for modeling particle–particle collisions. A detailed overview of the implemented models and the numerical framework is given in [22,23]. We take advantage of modeling background species in PICLas and perform a preliminary DSMC simulation of the neutral gas only. The resulting cell-wise distribution of velocity, temperature and number density is then interpolated onto the mesh used for the PIC simulations.
2.2.1. Neutral Phase Modeling
The initial DSMC simulation is based on the mathematical framework as proposed by [24] for modeling rarefied flow cases, for which the Kudsen number is
throughout the entire domain. In Equation (3), denotes the mean-free path, is the characteristic length, and is the collision diameter of particle–particle collisions, which is defined as
where d is the center–center distance between two particles. Since xenon is a monatomic gas and the flow regime becomes highly rarefied in the exhaust plume, the widely used variable hard sphere (VHS) model proposed by [16] is utilized. A viscosity coefficient of , reference diameter , temperature exponent and velocity are used for Xe-Xe collisions [24].
A schematic of the domain boundary conditions is shown in Figure 6, with the corresponding numerical boundary conditions for the DSMC simulation outlined in Table 1. Symmetry conditions are utilized in the -plane to reduce the computational cost. The total simulation time is 1 ms to ensure sufficient time-steps for obtaining the averaged final distribution. A constant time-step of s is employed to assure adequate temporal resolution of the particles’ mean collision time. The particle weighting factor is adapted iteratively to ensure that at least five particles are present in each cell when the simulation has reached quasi-steady-state. We devise a fully structured hexahedral mesh consisting of approximately 1 million cells, producing a total of 150 million super-particles located in the simulation domain in quasi-steady-state.
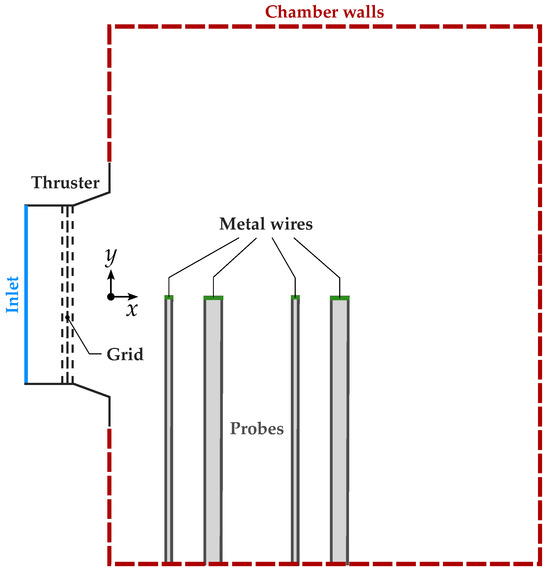
Figure 6.
Schematic representation of the computational domain and applied boundary conditions utilized in the PIC-DSMC simulations for analyzing the self-neutralization of the ion beam. The geometry of the vacuum chamber, including the placement of parts of the RIT discharge chamber, grid and exhaust parts (marked as Thruster), the location and orientation of the probes (metal wires attached to dielectric casings) within the ion beam path, and the configuration of the chamber walls. Boundary conditions are depicted to illustrate the interaction points for ions and electrons with the objects encountered during the experiment, such as inlet and outlet conditions, thruster and probe boundaries, and wall interactions. The schematic specifies the conditions under which particles are introduced, reflected or absorbed, providing a visual guide to the simulation setup supporting the study’s findings on SEE and beam neutralization dynamics.

Table 1.
Numerical boundary conditions for neutral xenon DSMC simulations.
2.2.2. Plasma Modeling
The plasma simulation includes five species and reactions: an overview of each individual species and reaction is given in Figure 7. From the preceding DSMC simulation, the neutral gas background density is used in order to avoid direct collision modeling of charged particles with neutral particles since . However, collisions with the background gas are still considered using a cross-section database, where for each time-step, artificial neutral particles are created from the background gas and paired with other ions, while electron–neutral collisions are modeled with an elastic-cross-section-based collision probability approach (see [26] for details).
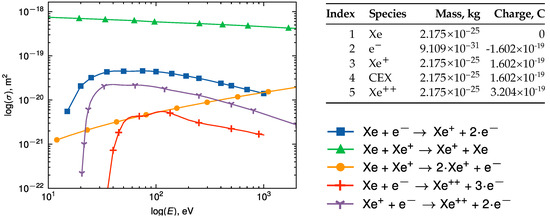
Figure 7.
Overview of species and collision-cross-section-based reactions used in the PIC-DSMC simulations, detailing mass and charge for neutral xenon (Xe), electrons (e−), xenon ions (Xe+ and Xe++), and charge exchange ions (CEX). This table underpins the simulation’s ability to model plasma interactions, including ionization and SEE, which are essential for modeling and understanding ion beam self-neutralization.
The relation between the volumetric and SEE processes of electron production can be estimated based on the data in Figure 7. The values of the cross-sections for collision processes in which electrons are produced (all except of charge exchange (CEX)) are smaller than . Together with the density of neutral atoms of , this yields the minimal mean free path length of the processes m. The probability of such a collision to happen over the path is . The probability to produce an electron inside the vacuum facility in any type of collision listed in Figure 7 is smaller than 0.001. On the other hand, the probability of a 1 keV Xe ion producing an electron in the secondary electron emission (SEE) lies at approximately 0.03 [27]. This estimation shows that the SEE is at least one order of magnitude more efficient than the volumetric collision processes and is the main source of electrons inside the vacuum chamber.
For solving the (static) electric field, a third-order HODG electrostatic Poisson solver is applied, which neglects the temporal evolution of the magnetic field :
In Equation (5), , , and denote the electric field, electric potential, charge density and permittivity , respectively. The deposition of charges is performed by a linear, locally volume-weighted deposition technique. The local mesh size and (fixed) time-step are chosen based on the so-called PIC-CFL condition [26] given by
where and denote the time-step and spatial discretization, respectively.
The numerical boundary conditions for the plasma simulation are shown in Table 2. Note that in the simulation without the probes, the floating probes (i.e., metal wires) and dielectrics (i.e., probe mounts) are omitted. Inlet conditions are derived from the assumption that the fluxes of ions and electrons are equal in the plasma sheath [28]; thus, the plasma potential can be expressed as
where , , e and are the Boltzmann constant, electron temperature, elementary charge and electron mass, respectively. The ion inlet velocity is assumed to be the Bohm velocity given by
with an assumed inlet electron temperature of eV, producing m s−1 and a plasma potential of .
Table 2.
Numerical boundary conditions for plasma PIC-DSMC simulations.
3. Results and Discussion
3.1. Experimental Measurements
3.1.1. Plasma Potential
The measurement of plasma potentials was performed at different axial and radial positions. An auxiliary tungsten filament (thermionic cathode) located in the vacuum chamber within the vicinity of the thruster could be used for partial compensation of the beam current by means of thermionic emission. Two cases were investigated:
- 1.
- Filament is heated and kept floating → uncompensated (UC) beam.
- 2.
- Filament is heated and allowed to source up to 1 mA of electrons, effectively reducing the total electric current emitted by the SSG → partially compensated (PC) beam.
Uncompensated Beam
Radial profiles of the plasma potential determined at three axial positions are shown in Figure 8 (left panel). Axial distances downstream of the thruster’s exit plane ranged from 10 to 95 mm. The typical occurrence of a sudden increase in the plasma potential is observed when the probes enter the ion beam. Measured values outside of the beam are in the range of a few tens of volts, while a sudden jump of several hundred volts occurs when the probe is inside the beam. The voltage depends on the probe’s distance to the thruster: the amplitude of the jump decreases further downstream. The broadening of the radial profiles with increasing distance corresponds to the visually observed ion beam divergence.
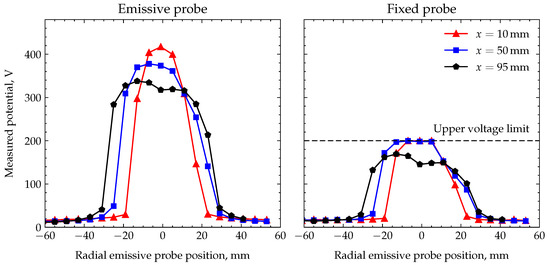
Figure 8.
Radial profile of plasma potential determined by the emissive probe at different axial positions (left). Dependence of measured potential of the fixed tungsten filament during emissive probe movement through the beam (right).
To decide whether the measured profile represents the actual plasma potential or if this is just the result of beam disturbance, an additional measurement was carried out. In the case when the measured profile is the real one, the potential outside of the ion beam should be as low as 10 to 20 V as measured by the probe outside the beam and should not depend on the position of the movable probe. In the opposite case when the measured potential jump is the result of the disturbance, a certain spatial extent should be observable and should mitigate itself in other spatial positions outside of the ion beam. The additional fixed filament placed 5 cm away from the thrusters is used to monitor behavior of the plasma potential during movement of the probes through the beam. Measurement of the floating potentials of the two probes is performed simultaneously. Results of this procedure illustrating the potential of the fixed tungsten probe are shown in Figure 8 (right panel). It can be observed that as long as the emissive probe stays outside of the beam, the potential of the fixed probe is on the magnitude of 10 to 20 V, similar to the values measured at other positions outside of the ion beam. As soon as the movable probes enter the ion beam, the potential of the fixed probe shows a similar jump of several hundreds of volts (the measurement device used for the potential observation of the fixed probe has a limited upper voltage of 200 V).
These results indicate that the high plasma potential values measured by both probes are not the real ones. Thus, the whole plasma neighborhood of the ion beam undergoes a sudden change in its electric potential when the emissive probe enters the beam. This confirms the hypothesis that the additional sink of electrons on the probe surface inside the beam is compensated for by the enhancement of the SEE, which requires a higher potential difference between the plasma and the surface of the vacuum vessel.
The amplitude of the potential jump should depend on the strength of the disturbance. Any object placed in plasma acquires a floating potential defined by the condition of zero electric current. This condition implies that any floating object consumes a constant flux of electrons and ions that recombine on its surface. The amplitude of the disturbance should be proportional to the area of the object. The four probes used in the present study cause a potential jump of approximately 400 . Minimization of the disturbance can be achieved by using a single probe with a small surface area of the holder exposed to the beam. Preliminary tests with a single emissive probe confirm that the value of the potential jump is indeed reduced. The amplitude of the jump still depends on the axial position of the downstream probe insertion and will be investigated in a future study.
Partially Compensated Beam
The comparison of the potential profiles for compensation currents of 0 and 1 mA is shown in Figure 9. A noticeable decrease in the potential jump by 200 V can be observed when 1 mA compensation is employed. This indicates that the beam disturbance is significantly reduced by the presence of electrons that are thermionically emitted by the cathode. Similar behavior is observed for the fixed electrode case, for which the measured values reduce to the range of −10 to 10 V, though in this case, the measured values do not represent the actual plasma potential because a fixed electrode is used as a thermionic emitter of electrons.
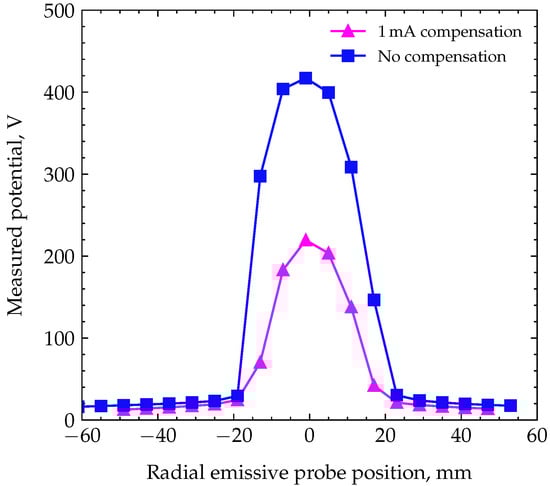
Figure 9.
Comparison of radial plasma potential profiles at mm for noncompensated and partially compensated (1 mA electron source) beams.
3.1.2. Plasma Parameters
The values of electron density profiles measured with the Langmuir probe are shown in Figure 10. The measurements are located within the range of 2 × 10¹² to 2 × 10¹⁵ m−3. Missing data points in the center of the beam arise due to the limited range of the measurement device, which was not able to compensate for the sudden increase in the voltage range. The ionic parts of the VCC could not be collected in these radial positions.
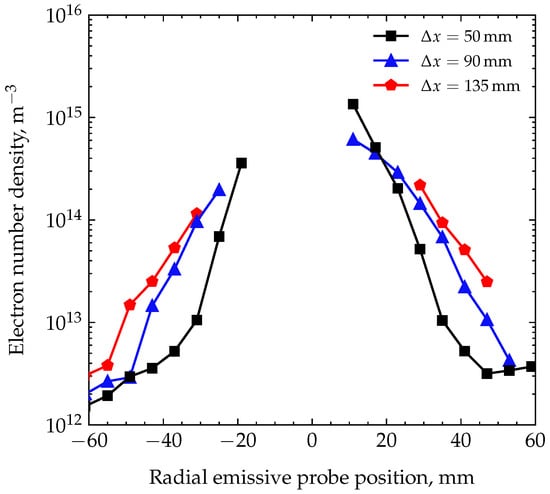
Figure 10.
Radial profiles of electron number density at different axial positions.
The values of to , which were taken in the closest position to the symmetry axis, correspond to the density of the ions estimated from the beam current and energy according to
where R is the beam radius, and u is the velocity of beam ions. For a beam current of 17 mA and energy of 1 keV, a number density of is obtained. Similar broadening of the radial profile with increasing axial distance as in the case of plasma potential is observed. Obtaining the mean electron energy requires additional efforts. For its determination, the information about both the plasma and floating potentials in the same spatial position is needed. The probes in the current setup are placed axially aligned so that two radial scans have to be made for identifying the electron temperature: one with the emissive probe and one with the Langmuir probe, both axially adjusted. Only for selected spatial positions can the measurements be made. Figure 11 highlights the data needed for the determination of the electron energy and its corresponding values at an axial distance of mm.
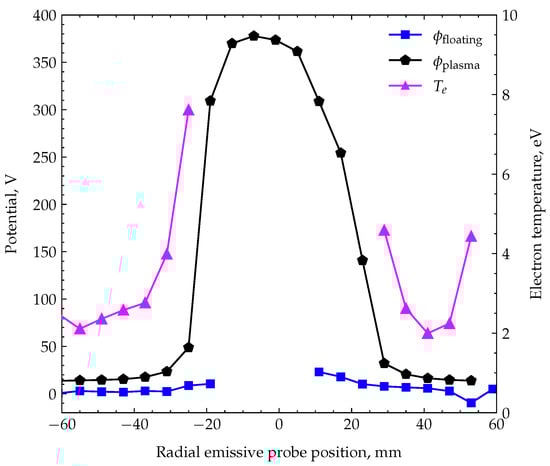
Figure 11.
Comparison of plasma and floating potentials at mm. Electron temperature measurements in partially compensated environment.
The data in Figure 11 reveal that the potential jump has an influence on the determination of the electron temperature. The plasma potential measured with the emissive probe has a broader profile than the floating potential measured with the Langmuir probe. This is due to the fact that between both measurements, the probe holder should be moved 40 mm away from the thruster. The divergence of the ion beam results in a slightly different width of the disturbance introduced by the probe system in the axial positions separated by 40 mm. The electron temperature depends on the absolute value of the plasma and floating potentials, and this slight difference results in severe uncertainty about electron temperature determination inside the beam. Thus, the electron temperature can be reliably determined with our setup only outside of the ion beam. The reliably measured values lie within a range of 1.5 to 5 eV. The measured value of 8 eV at mm is questionable due to the reasons stated above. For the correct determination of inside the ion beam, the plasma and floating potentials should be measured under identical disturbances. One possibility for such measurement lies in using a two-probe arrangement, with the probes entering the beam successively. The second probe enters the beam after the first one has already left it. If the distance between emissive and Langmuir probes is bigger than the beam diameter, then each probe will introduce the same disturbance and the values of plasma and floating potentials can be used for the determination of electron temperature. This measurement lies within the scope of future work.
3.1.3. Partially Compensated Beam Number Densities
The radial profiles for the electron density at a distance of mm taken inside the beam with and without partial compensation are shown in Figure 12. No significant difference can be observed in the diagram. The points inside the beam show remarkably good repeatability, taking into account that the curves were taken on different days. The absence of the plasma density dependence on the compensation degree shows that the quasineutrality of the plume plasma is established automatically. Thermionic compensation can only change the ratio of the beam neutralization by SEE. This manifests in the reduced value of the potential jump during beam disturbance—the SEE has to be increased by a smaller degree due to the presence of a thermionic electron source.
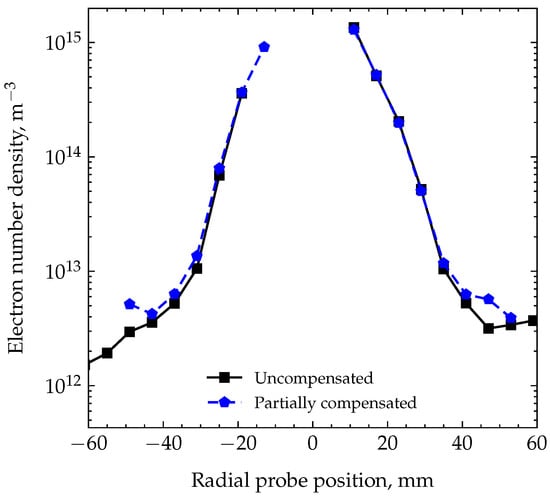
Figure 12.
Comparison of electron density profiles for non-compensated and partially compensated beams at mm.
3.2. SSG Current and Beam Neutralization
The electric current measured between the facility ground and SSG is a good indicator of the degree of disturbance introduced by probes when they enter the ion beam. Without the disturbing probes, the value of SSG current follows the value of the first grid current, as can be seen in Figure 5. The amplitude of the disturbance depends on many factors, such as the size of the disturber (number of probes inserted into the beam), position of the disturber (closer to or further from the thruster) and the heating state of the thermionic cathode (ability to compensate for a certain amount of the electric current).
The quantification of the self-neutralization disturbance by the SSG current is illustrated in Figure 13, where the changes to the SSG current during the radial movement of the probes are shown. The diagram on the left was taken when the first probe was located 25 mm from the thruster, while the diagram on the right was taken when the first probe was located 5 mm from the thruster. The number of probes and the heating power of the thermionic cathodes were the same. The data in the left panel show that the SSG current behaves differently when the partial compensation is switched on or off. While for the completely uncompensated beam, the change in the SSG current is mA, and the partial compensation reduces it almost to zero. However, the data in the right panel indicate that when the disturber is located closer to the thruster, the partially compensated beam still shows a similar change in the SSG current of mA. The situation is more severe when the thermionic cathode is not powered at all. In that case, the current of the SSG can change by as much as 2 mA.
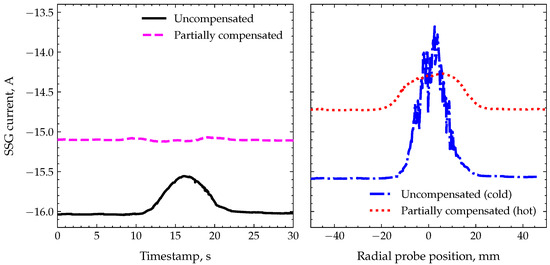
Figure 13.
Comparison of SSG currents in different situations. Left—the first probe is mm from the thruster and has an uncompensated vs. partially compensated beam. Right—the first probe is mm from the thruster and has a partially compensated beam with hot cathode vs. an uncompensated beam with cold cathode.
The situation with the cold thermionic current is very different from that with the hot thermionic cathode, even if they are kept floating. In the former case, the insertion of the probes into the ion beam is accompanied by the appearance of numerous sporadic sparks on the surfaces of the vacuum chamber. In addition, the VCC traces of the probes suffer from sudden jumps in the measured current values. This is not the case when the thermionic cathode is hot, regardless of its sourcing status. A possible explanation could be the limited ability of the measurement device to keep the cathode floating. While the average DC current from the cathode is zero, the rapid changes in current at the micro- or nanosecond scale cannot be compensated for by the device. Thus, the electron cloud of the hot cathode serves as a source of readily available electrons for any sudden changes in the space charge of the ion beam. When the cathode is cold, such changes should be compensated for by the SEE, leading to increased levels of secondary electron emission from the vacuum facility walls, which are occasionally accompanied by surface discharges.
3.3. Numerical Modeling
In this section, results of the neutral gas DSMC and plasma PIC-DSMC simulations are presented. A contour and centerline plot of the neutral gas pressure predicted for the disturbed case is shown in Figure 14.
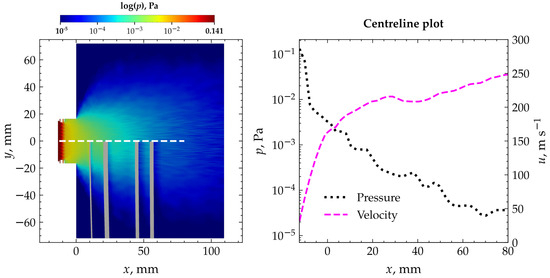
Figure 14.
DSMC results of neutral gas with probes located inside beam. Left—contours of pressure, with centerline indicated by white dashed line. Right—centerline plot of pressure and velocity.
As the neutral propellant exits the discharge chamber, it passes through the outlet channel of the thruster for about 12 mm. The fluid then freely flows into the vacuum chamber, and the pressure drops rapidly while the velocity increases due to gas expansion. At an axial distance of about 100 mm from the thruster, the pressure is only slightly higher than the measured ambient vacuum chamber pressure of about Pa.
The distribution of neutral gas within the domain varied only slightly within the vicinity of the probes. For the disturbed case, a stagnation zone in front of the probes builds up, leading to a small increase in pressure.
In Figure 15, contours of plasma properties are outlined for both the disturbed and undisturbed cases. In general, it is observable that the beam divergence is larger in the disturbed case, which can be seen in the contours of the ion number density. The electron number density indicates more electrons being located between the thruster’s exit region and the first probe. Furthermore, the (scaled to 3.5 × 10⁴ to 5 × 10⁴ m s−1) contours of ion velocity demonstrate that ions lose kinetic energy in front of the probes, hinting at an increase in the electric potential in this region. This premise is confirmed by the contours of potential, which illustrate a significantly higher potential of more than 350 V in the disturbed case compared to a few tens of volts in the undisturbed case.
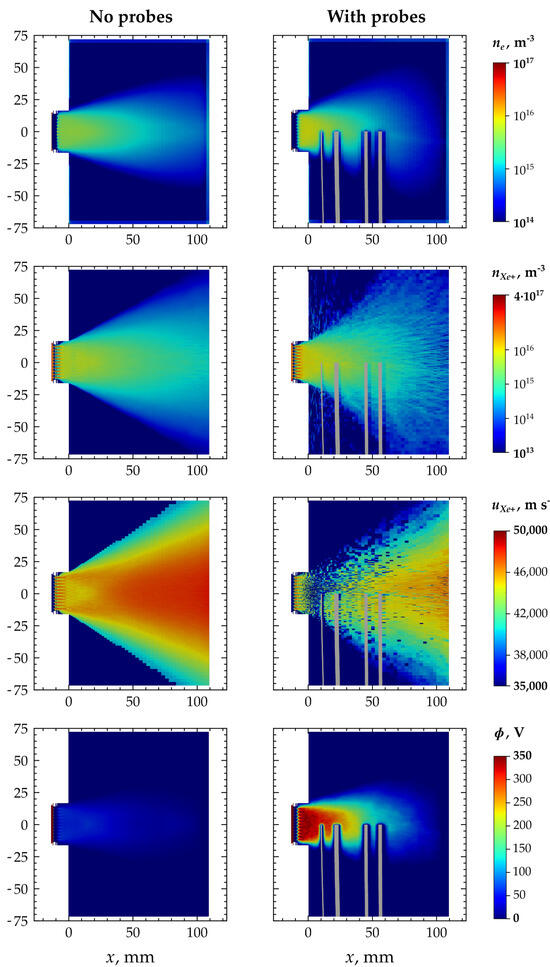
Figure 15.
Comparison of electron and ion number densities, axial ion velocity, and potential predicted from PIC-DSMC simulations for undisturbed and disturbed cases.
The axial centerline plot downstream shown in Figure 16 underlines this finding, proving the drastic growth of plasma potential in the disturbed case and also explaining the decrease in axial ion velocity. Further, this decrease leads to more CEX events and subsequent slow ions, since the collision cross-section increases with decreasing ion velocity (see Figure 7, green graph). These slow ions are accelerated outwards (i.e., radially in ), which is visible in Figure 15 through the granular contours of ion velocity and number density outside the beam.
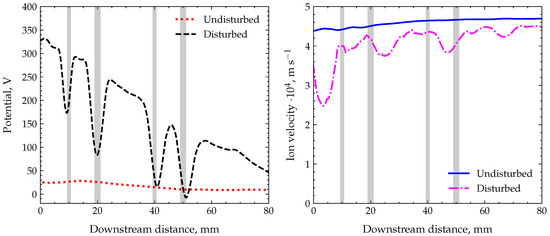
Figure 16.
Left—comparison of downstream potential . Right—comparison of ion velocity . Disturbance of the neutralization process of the ion beam results in a significantly higher potential and slow-down of the ions downstream. The grey-shaded regions indicate the (axial) location of the probes.
Finally, in order to validate the PIC-DSMC simulations, the radial electron number density and electron energy distribution function (EEDF) at an axial distance of mm is compared to the experimental measurements at different -positions. The results are displayed in Figure 17 and reveal that the simulation is able to predict both the radial profile of the electron number density distribution as well as the absolute values of number density (left panel). Examining the right panel, it is evident that there is good agreement when determining the electron temperature from the EEDF predicted by PIC-DSMC at each measurement point.
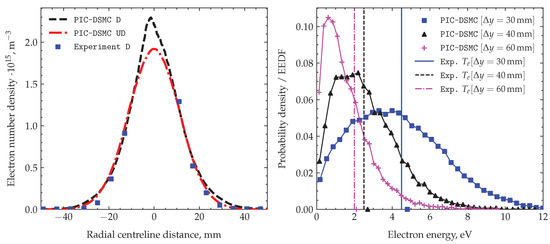
Figure 17.
Left—comparison of electron number density at mm predicted by PIC-DSMC with experimental measurements for the undisturbed and disturbed (i.e., experimental) cases. Right—EEDF at different radial -positions at mm compared with experimental measurements of the electron temperature (denoted by the vertical lines). The markers on the -axis indicate the electron temperature obtained from the PIC-DSMC simulation at the respective locations .
4. Conclusions
The experimental diagnostics of the uncompensated ion beam revealed the strong influence of the probe diagnostics on the value of the plasma potential. The performed analysis indicates that the measured increase can be attributed to violation of ion beam self-compensation. The probe holder introduces an additional sink of electrons, which has to be compensated for by the plasma to remain quasineutral. The electron depletion causes an increase in the plasma potential, which enhances the facility SEE by increasing the energy of the bombarding ions. The new equilibrium is established through elevated values of the plasma potential and an increase in electron flux from the facility walls. As soon as the probes are removed from the ion beam, the previous state is reestablished.
The numerical simulations reproduce the experimentally observed findings and measured values. Calculated values of the electron density and plasma potential show good agreement with the measured values. Additionally, the insight of ion trajectories indicates that elevated values of the plasma potential first slow down the ions, but then, the overall ion energy remains almost unchanged.
These findings indicate that invasive diagnostics should be used with care when investigating ion beams in self-neutralization mode. The elevated values of plasma potential could falsify the lifetime assessment of thrusters due to increased values of the erosion rate. In order to prevent the unwanted effects, invasive diagnostics should be used during short periods of time compared with the total duration of the test campaign. As self-neutralization is used only with small-sized ion thrusters, these implications do not apply to larger systems, where explicit neutralization of the ion beam is usually performed. In general, any other plasma-based electric propulsion system should be free from the effects described in this work if explicit sources of electrons are present. The presented results show the significance of the SEE for ion thruster operation in a vacuum facility. The SEE is a facility effect, which, in general, depends on the size of the facility, distance the beam is allowed to travel, wall material, minimal operational pressure and other factors. So further research is necessary to quantify the impact of the different factors on the described findings. There are non-invasive alternatives for the assessment of some plasma parameters of interest. The electron density and temperature can be determined by optical emission spectroscopy when combined with the appropriate collisional–radiative model. Another option is the Thomson laser scattering technique, though the low electron densities make it difficult to apply. Almost no alternatives to probes exist for the determination of the plasma potential. It would be possible to deduce the plasma potential by integration of the electric field values, which can be determined optically from the Stark broadening of spectroscopic lines. But practically, this technique can only be applied to the case of extremely high electric fields. Still another possibility would be the usage of exotic diagnostics, like deflection of the charged particle beam passing through the plasma. The elevated value of the plasma potential induced by disturbance of the self-neutralized ion beam necessarily leads to an increased erosion rate of the last thruster grid, i.e., the decel grid (based on analytical formulas such as the one derived by [29] and experimental measurements carried out for different materials under xenon ion irraditation, for instance, by [30], the erosion rate on the decel (pit and groove erosion) would increase by more than one order of magnitude considering a potential jump from 20 to 400 V). This would lead to erroneous estimation of the thruster lifetime measured in a ground facility. To avoid this implication, explicit neutralization of the ion beam is recommended also for small-sized ion thrusters. Due to the relatively small electric current of the ion beam, such neutralization could be performed with the help of thermionic cathodes, which would not introduce any additional neutral gas flow to the facility. Another option would be to avoid permanent placement of the objects inside the self-compensated ion beam. The usage of movable probes would still allow the determination of plasma parameters like the electron density and electron temperature without disturbing the overall thruster lifetime assessment. The values of the plasma potential in self-compensated ion beam are not directly measurable with probe diagnostics.
Author Contributions
Conceptualization, R.K.; methodology, R.K. and M.M.; software, M.M.; validation, R.K. and M.M.; formal analysis, R.K. and M.M.; resources, J.S.; data curation, R.K. and M.M.; writing—original draft preparation, R.K. and M.M; writing—review and editing, J.S.; visualization, M.M.; supervision, J.S.; project administration, J.S.; funding acquisition, N.W. and J.S. All authors have read and agreed to the published version of the manuscript.
Funding
This work was financially supported by the European Space Agency [ESA contract no. 4000129121/19/NL/RA].
Institutional Review Board Statement
Not applicable.
Informed Consent Statement
Not applicable.
Data Availability Statement
Raw data were generated at the HSUper large-scale facility. Data supporting the results and findings of this study are available from the corresponding author upon reasonable request. The data are not publicly available due to privacy reasons.
Acknowledgments
The authors gratefully acknowledge Pavel Smirnov for his assistance with conducting the experiments and providing data on grid currents. Computational resources (HPC-cluster HSUper) were provided by the project hpc.bw, funded by dtec.bw—Digitalization and Technology Research Center of the Bundeswehr; dtec.bw is funded by the European Union—NextGenerationEU.
Conflicts of Interest
The authors declare no conflicts of interest.
References
- Riege, H. Neutralization principles for the extraction and transport of ion beams. Nucl. Instruments Methods Phys. Res. Sect. A Accel. Spectrometers Detect. Assoc. Equip. 2000, 451, 394–405. [Google Scholar] [CrossRef]
- Goebel, D.M.; Katz, I. Ion Thruster Accelerator Grids. In Fundamentals of Electric Propulsion; Chapter 5; John Wiley and Sons, Ltd.: Hoboken, NJ, USA, 2008; pp. 189–241. [Google Scholar] [CrossRef]
- Demidov, V.I.; Ratynskaia, S.V.; Rypdal, K. Electric probes for plasmas: The link between theory and instrument. Rev. Sci. Instruments 2002, 73, 3409–3439. [Google Scholar] [CrossRef]
- Lobbia, R.B.; Beal, B.E. Recommended practice for use of Langmuir probes in electric propulsion testing. J. Propuls. Power 2017, 33, 566–581. [Google Scholar] [CrossRef]
- Sheenan, J.P.; Raitses, Y.; Hershkowitz, N.; McDonald, M. Recommended practice for use of emissive probes in electric propulsion testing. J. Propuls. Power 2017, 33, 614–637. [Google Scholar] [CrossRef]
- Godyak, V.A.; Alexandrovich, B.M. Comparative analyses of plasma probe diagnostics techniques. J. Appl. Phys. 2015, 118, 233302. [Google Scholar] [CrossRef]
- Li, P.; Hershkowitz, N.; Wackerbarth, E.; Severn, G. Experimental studies of the difference between plasma potentials measured by Langmuir probes and emissive probes in presheaths. Plasma Sources Sci. Technol. 2020, 29, 025015. [Google Scholar] [CrossRef]
- Kemp, R.F.; Sellen, J.M., Jr. Plasma Potential Measurements by Electron Emissive Probes. Rev. Sci. Instruments 2004, 37, 455–461. [Google Scholar] [CrossRef]
- Smith, J.R.; Hershkowitz, N.; Coakley, P. Inflection-point method of interpreting emissive probe characteristics. Rev. Sci. Instruments 2008, 50, 210–218. [Google Scholar] [CrossRef] [PubMed]
- Brandt, C.; Testrich, H.; Kozakov, R.; Wilke, C. Investigation of the disturbance of a Langmuir probe and its influence on measurement results. Rev. Sci. Instruments 2006, 77, 023504. [Google Scholar] [CrossRef]
- Haas, J.; Spabjers, G.; McFall, K.; Spores, R. An investigation of electrostatic probe perturbations on the operational characteristics of a Hall thruster and on the measurement of local plasma parameters. In Proceedings of the 34th AIAA/ASME/SAE/ASEE Joint Propulsion Conference and Exhibit, Cleveland, OH, USA, 13–15 July 1998. [Google Scholar] [CrossRef]
- Arthur, N.A.; Williams, G.J. Near field probe measurements in the plume of a NEXT ion thruster. In Proceedings of the 36th International Electric Propulsion Conference, Vienna, Austria, 15–20 September 2019; p. 167. [Google Scholar]
- de Boer, P.C.T. Electric probe measurements in the plume of an ion thruster. J. Propuls. Power 1996, 12, 95–104. [Google Scholar] [CrossRef]
- Zhang, Z.; Tang, H.; Ren, J.; Zhang, Z.; Wang, J. Calibrating ion density profile measurements in ion thruster beam plasma. Rev. Sci. Instruments 2016, 87, 113502. [Google Scholar] [CrossRef]
- Zhang, Z.; Tang, H.; Kong, M.; Zhang, Z.; Ren, J. Electron temperature measurement in Maxwellian non-isothermal beam plasma of an ion thruster. Rev. Sci. Instruments 2015, 86, 023506. [Google Scholar] [CrossRef] [PubMed]
- Bird, G.A. The DSMC Method; Version 1.2; CreateSpace: Scotts Valley, CA, USA, 2013. [Google Scholar]
- Boyd, I.D.; Van Gilder, D.B.; Liu, X. Monte Carlo Simulation of Neutral Xenon Flows in Electric Propulsion Devices. J. Propuls. Power 1998, 14, 1009–1015. [Google Scholar] [CrossRef]
- Jambunathan, R.; Levin, D.A. A Self-Consistent Open Boundary Condition for Fully Kinetic Plasma Thruster Plume Simulations. IEEE Trans. Plasma Sci. 2020, 48, 610–630. [Google Scholar] [CrossRef]
- Brieda, L. Development of the DRACO ES-PIC Code and Fully-Kinetic Simulation of Ion Beam Neutralization. Master’s Thesis, Virginia Polytechnic Institute and State University, Blacksburg, VA, USA, 2005. [Google Scholar]
- Feili, D.; Smirnova, M.; Dobkevicius, M.; Perez, A.M.; Lotz, B.; Collingwood, C. Design, construction and testing of a radio frequency mini ion engine according to the propulsion requirements of the next generation graviity mission “NGGM”. In Proceedings of the 34th International Electric Propulsion Conference, Hyogo-Kobe, Japan, 4–10 July 2015; p. 277. [Google Scholar]
- Ortwein, P.; Copplestone, S.; Munz, C.D.; Binder, T.; Mirza, A.; Nizenkov, P.; Pfeiffer, M.; Reschke, W.; Fasoulas, S. Piclas: A Highly Flexible Particle Code for the Simulation of Reactive Plasma Flows. In Proceedings of the 2017 IEEE International Conference on Plasma Science (ICOPS), Atlantic City, NJ, USA, 21–25 May 2017. [Google Scholar] [CrossRef]
- Fasoulas, S.; Munz, C.D.; Pfeiffer, M.; Beyer, J.; Binder, T.; Copplestone, S.; Mirza, A.; Nizenkov, P.; Ortwein, P.; Reschke, W. Combining particle-in-cell and direct simulation Monte Carlo for the simulation of reactive plasma flows. Phys. Fluids 2019, 31, 072006. [Google Scholar] [CrossRef]
- Pfeiffer, M.; Hindenlang, F.; Binder, T.; Copplestone, S.; Munz, C.D.; Fasoulas, S. A particle-in-cell solver based on a high-order hybridizable discontinuous Galerkin spectral element method on unstructured curved meshes. Comput. Methods Appl. Mech. Eng. 2019, 349, 149–166. [Google Scholar] [CrossRef]
- Bird, G. Molecular Gas Dynamics and the Direct Simulation of Gas Flows; Clarendon Press: Oxford, UK, 1994. [Google Scholar]
- Padilla, J.F.; Boyd, I.D. Assessment of Gas-Surface Interaction Models for Computation of Rarefied Hypersonic Flow. J. Thermophys. Heat Transf. 2009, 23, 96–105. [Google Scholar] [CrossRef]
- Institute for Aerodynamics and Gas Dynamics (University of Stuttgart); Institute for Space Systems (University of Stuttgart). PICLas Documentation. User Guide. Available online: https://piclas.readthedocs.io (accessed on 10 November 2023).
- Habl, L.; Rafalskyi, D.; Lafleur, T. Secondary electron emission due to multi-species iodine ion bombardment of different target materials. J. Appl. Phys. 2021, 129, 153302. [Google Scholar] [CrossRef]
- Binder, T. Development and Application of PICLas for Combined Optic-/Plume-Simulation of Ion-Propulsion Systems. Ph.D. Thesis, University of Stuttgart, Stuttgart, Germany, 2019. [Google Scholar] [CrossRef]
- Bohdansky, J. A universal relation for the sputtering yield of monatomic solids at normal ion incidence. Nucl. Instruments Methods Phys. Res. Sect. B Beam Interact. Mater. Atoms 1984, 2, 587–591. [Google Scholar] [CrossRef]
- Tartz, M.; Heyn, T.; Bundesmann, C.; Zimmermann, C.; Neumann, H. Sputter yields of Mo, Ti, W, Al, Ag under xenon ion incidence. Eur. Phys. J. D 2011, 61, 587–592. [Google Scholar] [CrossRef]


Disclaimer/Publisher’s Note: The statements, opinions and data contained in all publications are solely those of the individual author(s) and contributor(s) and not of MDPI and/or the editor(s). MDPI and/or the editor(s) disclaim responsibility for any injury to people or property resulting from any ideas, methods, instructions or products referred to in the content. |
© 2024 by the authors. Licensee MDPI, Basel, Switzerland. This article is an open access article distributed under the terms and conditions of the Creative Commons Attribution (CC BY) license (https://creativecommons.org/licenses/by/4.0/).