Abstract
The scaling of the strength of composite parts with part size is referred to as the size effect. In the presence of notches, stress concentration affects a portion of material that increases with the notch size. Furthermore, in woven composites, the notch and tow size can be comparable, thus demanding a mesoscale approach to properly capture the stress intensification. In this paper, a probabilistic mesoscale method to model the size effect in notched woven composites is presented. First, the stress distribution is estimated with a finite element model, calibrated on experimental Digital Image Correlation data. The FE model simulates the mesoscale heterogeneity of the woven reinforced material and replicates the local stress intensification at the tow level. Then, a three-parameter Weibull-based statistical model is introduced to model the probability of failure from the calculated stress distribution and the volume of the part. An equivalent stress is used to capture the relevant fiber and matrix failure modes and the maximum value within the specimen volume is the random variable of the model. The method is applied to open-hole tension tests of a woven twill carbon fiber–epoxy composite. Two specimen widths and three width-to-diameter ratios, from 3 to 12, are considered. Specimen width produced an observable size effect, whereas the variation of hole size in the range considered did not. The statistical model is found to accurately describe the experimental observations, efficiently replicating an inverse size effect, regardless of hole size, while wider specimens lead to a lower probability of failure.
1. Introduction
The tensile strength of composite materials can exhibit a scaling effect with structure size, whereas it usually decreases with increasing dimensions [1]. This phenomenon is known as the size effect. Failure is triggered by defects in the material; for the same stress level, a larger size implies a higher chance of encountering a large enough flaw to initiate the failure, similarly to other brittle materials.
The Weibull distribution is the most widely used model to describe the strength of brittle materials. This distribution has been successfully applied to model the experimentally observed scaling of composite component strength [1,2]. The ultimate strength of individual carbon fibers also follows a Weibull distribution, as observed in [3,4]. To correlate the single fiber strength (microscopic failure) with the resistance of the fiber tows (mesoscale failure), statistical models for fiber bundles have been proposed. In [5], a hierarchical bundle model is proposed that describes the unidirectional composite strength starting from the Weibull-distributed single fiber strengths. The proposed method uses the weakest-link theory to estimate the property of the macroscopic bundle, attesting to the solidity of the statistical approach to model the strength of composites.
A case of size effect recurrently studied in the literature is that of open-hole tensile strength. Due to its relevance in applications like bolted or riveted fastenings, a circular notch is usually considered. The problem has been studied with a variety of approaches that can be classified as follows:
- Experimental models [6,7,8,9] that model the tensile strength of open-hole specimens with empirical formulations based on the observed failures. Full-field strain analysis was employed in [10,11];
- Numerical models that describe the complexity of the problem, accounting for different damage models describing the interaction of failure modes (e.g., delamination, in-plane cracking) [12,13,14,15,16,17,18,19,20] or advanced finite element methods [21,22];
- Hybrid methods that combine experimental observation with numerical models using, e.g., full-field measurement of the strain field with Digital Image Correlation (DIC) [23];
- Analytical methods that draw the exact stress field around the notch from equilibrium and constitutive equations to estimate the component failure [24].
In this work, experiments and finite element modeling are used as the basis for a statistical approach.
Most existing studies on open-hole strength focused on unidirectional fiber composites; however, woven reinforcements introduce a further layer of complexity in stress analysis. While they can be considered to behave as a homogeneous material at the macroscopic scale, at a scale close to that of their representative volume element (RVE), the material heterogeneity induces stress concentrations that could interact with the notch intensification. This is the case of open-hole notches with a hole diameter in the scale of a few millimeters, such as those drilled for fasteners. Full-field techniques such as DIC can be used to study the heterogeneous strain field at the mesoscale. In [25], the authors proposed a multiscale methodology that made use of image processing to build a finite element model (FEM), which contains material orientation information, and an FEM-Updating (FEMU) scheme, which made use of DIC strain measurement data to extrapolate the tow-level material properties and the full stress field in an open-hole tensile specimen. In most of the literature that has been reviewed, the usually encountered geometrical scaling parameters are either width-to-diameter ratio or thickness (ply scaling). For this study, width and width-to-diameter ratio were selected instead.
Starting from the previously developed DIC-FEMU methodology, which allows the study of constituent materials of a heterogenous composite at the mesoscale level, this work proposes a statistical approach to describe the open-hole notch size effect on the ultimate strength of woven composites. The methodology is applied to specimens with variable hole diameters and widths. An equivalent stress is used to capture the relevant fiber and matrix failure modes, while its maximum value within the specimen volume is the random variable of the model. Model parameters are determined via optimization, by minimizing the error between empirical and model-calculated probabilities of failure.
The remainder of the article is structured as follows: Section 2 describes the mechanical testing, the procedure for the identification of material parameters, the numerical model, the statistical model, and the identification of the relative parameters; Section 3 presents the results of the experiments, of the numerical modeling, and of the statistical model; and finally, in Section 4, conclusions are drawn on the fitness of the numerical and statistical models to describe size effect.
2. Materials and Methods
2.1. Material and Mechanical Testing
The specific material under examination is a carbon fiber-reinforced epoxy prepreg, supplied by Microtex Composite (GG630 T125 12K, 37% resin), consisting of an E3-150 resin matrix and carbon fibers woven in a 2 × 2 twill pattern. An autoclave curing process with a maximum temperature of 135 °C and a maximum pressure of 6 bar was used to produce a laminate with a fiber volume fraction close to 50%. A [0/90/0] stacking sequence yielded an approximately 2 mm cured thickness. Rectangular specimens measuring 250 mm in length and 24 mm in width were machined and drilled with round holes in their center.
Six open-hole notched specimen configurations were considered, combining two different widths with three width-to-diameter ratios. The ASTM D5766 standard for open-hole tensile strength testing [26] suggests a ratio equal to six, which has been taken as the average value in the present study, where the width-to-diameter ratio spans from three to twelve. A summary of the specimen dimensions is provided in Table 1, alongside the specimen labels used in the following research.

Table 1.
Specimen dimensions: length , width , hole diameter , and width-to-diameter ratio .
Quasi-static tensile tests were carried out on an Instron 8001 hydraulic universal testing machine, adopting a procedure derived from the ASTM D3039 standard [27] and a displacement rate of 2 mm/min. Three specimens per configuration were tested. An 8.9 Mpx stereo camera system was used to record the tests, capturing a complete view of the specimens’ free span of 145 mm between the machine grips. To enable DIC, a black-on-white speckle design was airbrushed onto the specimens. Prior to the application of the speckle pattern, images of the unpainted specimens on the testing fixture were captured (Figure 1a) to aid in constructing the FEM, as described later in Section 2.2. The speckle images were analyzed using the VIC 3D 9.1.6 DIC software from Correlated Solution, with an optimal subset size of 31 px and a subset step of 6 px. These parameters have been set following [28], which recommends keeping the step size below one-third of the subset size. DIC was utilized to track the in-plane displacements and strains on the surface of the specimens and the load was recorded with a 100 kN load cell.
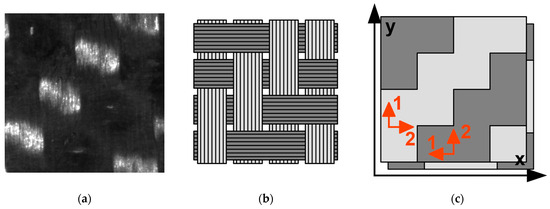
Figure 1.
The 2 × 2 twill fabric unit cell. (a) Detail of the specimen surface captured before testing; (b) schematization of the previous image, showing how the vertical (warp) and horizontal (weft) fiber tows are woven; and (c) further simplification used to build the FEM, with two material orientations (shown in two shades of gray) and two layers of integration points. Global coordinates are shown in black, with y being the tensile loading direction. Local material coordinates are in orange; 1 is the “fiber direction” and 2 is the “matrix direction” [25].
2.2. Numerical Model and Data-Driven Determination of Material Properties
In this section, the characterization of the material response obtained with the tensile test and DIC is presented and how it has been used to calibrate a mesoscale model. Twill carbon fiber fabric is constituted by orthotropic bundles of fibers (tows) interwoven in orthogonal directions, as is visible in an image of a specimen in Figure 1a and represented schematically in Figure 1b. Under mechanical loading, complex stress and strain fields arise in the material due to this heterogeneity. While the surface strain field is readily available via DIC, obtaining the stress field requires further processing of the experimental data. This study made use of a simplified 2D shell finite element model that is able to properly capture the stress, as was developed in [25]. A more concise description of the model is reported in this section.
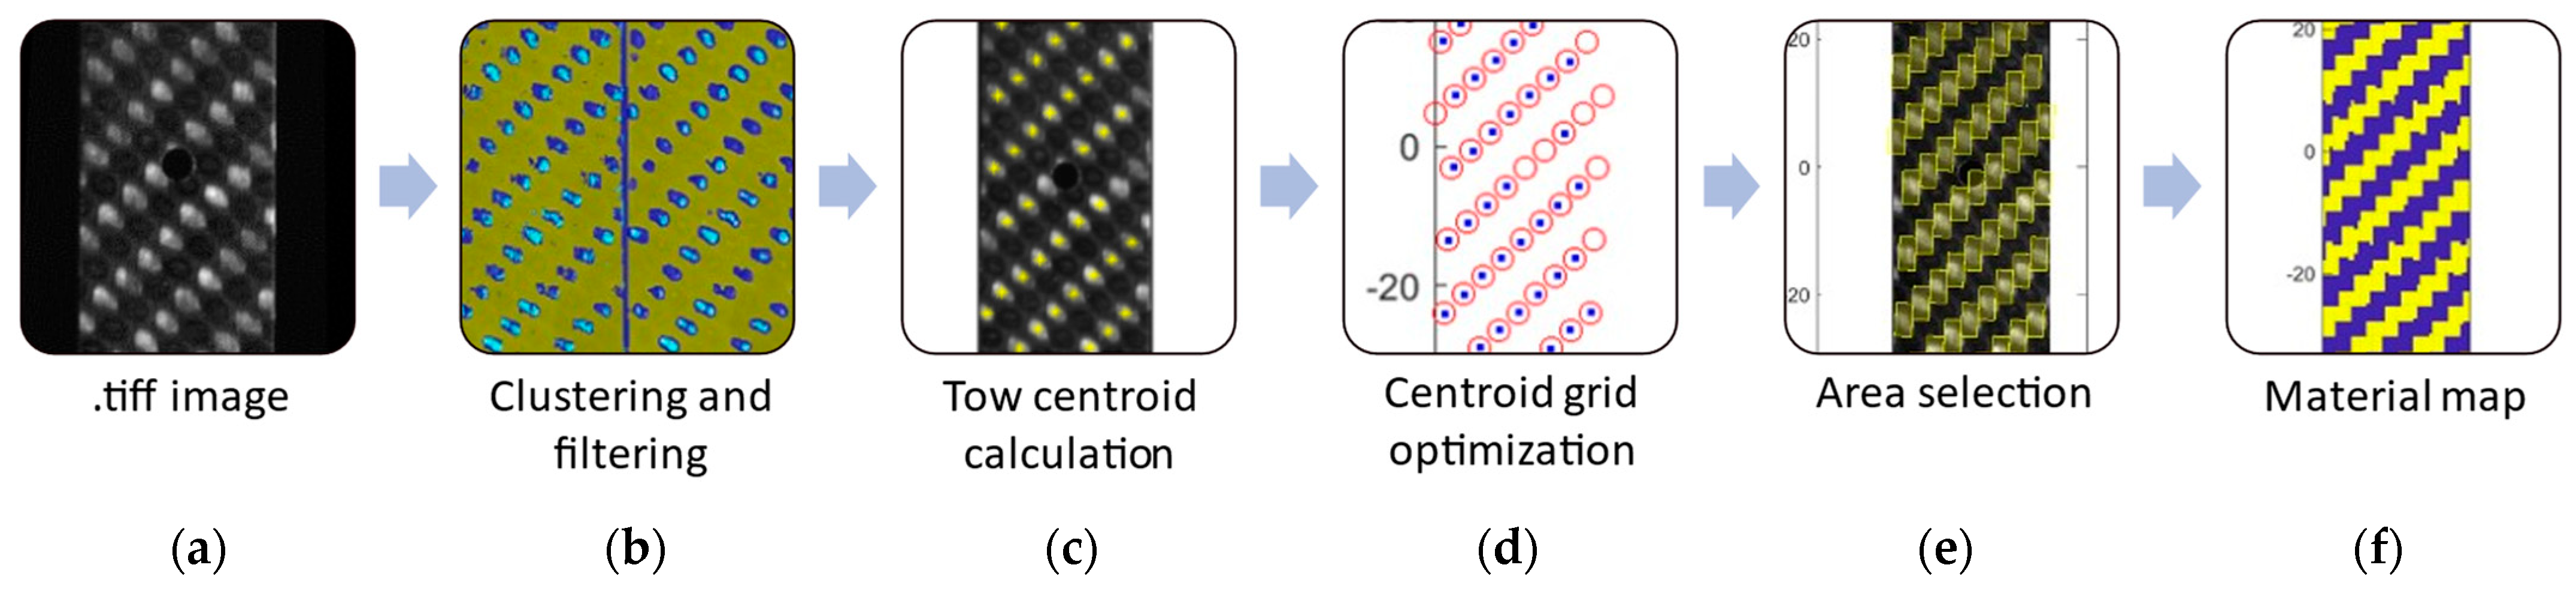
Each open-hole tensile test was reproduced numerically with a finite element model, replicating each specimen’s specific material distribution. The mesoscale heterogeneity is modeled using two orthotropic materials with identical properties and orthogonal orientations (Figure 1c). A map of the fiber orientation on the surface of the specimen is reconstructed, using image processing and positional data from DIC, and the material orientation is assigned to each corresponding element in the FEM with an automated algorithm developed in Python. This mapping process, implemented in MATLAB R2021b, is described in Figure 2. The tows with vertically aligned fibers are visible in the images of unpainted specimens, due to their reflectivity. Their location on the specimen’s surface is identified via a K-means image clustering on the image and also via position data from the calibrated DIC analysis. A map of the material orientation is then built using the known unit cell dimensions of the twill fabric.

Figure 2.
Construction of the specimen material orientation map. (a) Raw .tiff image captured using one of the DIC cameras; (b) by clustering and filtering, the tows with vertically aligned fibers emerging on the specimen surface are identified; (c) the centroid of the tows are calculated; (d) using optimization, an exact grid of points (in red) is fitted to the centroids (in blue); (e) the area belonging to the vertical tows is selected; and (f) map of the material orientation used to assign the material orientation in the FEM [25].
The finite element mesh is automatically generated from the specimen image with the open-source meshing software GMESH v.4.8.4 and parsed to LS-DYNA (https://lsdyna.ansys.com/). The laminate is modeled with a single layer of four-node Belythscko-Tsay shell elements with a number of through-thickness integration points equal to twice the number of layers in the specimen. Each ply in the physical composite specimens is, indeed, represented by two layers of through-thickness integration points, to capture the structure of interlocking tows (Figure 1c).
A mesh convergence study led to the identification of an ideal mesh size of 0.5 mm, corresponding to 10 × 20 elements for each fiber tow. Mesh refinement around the hole gave a minimum mesh size of 0.05 mm. The material model used was orthotropic linear elastic *MAT_002 from LS-Dyna. Boundary conditions are fully constrained at one narrow end of the specimens and are fully constrained, save for free displacement in the loading direction on the other, replicating the conditions at the grips of the hydraulic testing machine.
The elastic properties were determined through an optimization process, which minimized the quadratic difference between the numerical and experimental (DIC) full-field strains under the same load. A plain, unnotched specimen was used for this stage. All the experimental tests were then simulated with a calibrated model up to the failure load, using the identified elastic properties and the heterogeneous material distribution defined with the procedure described previously. The displacements at failure from the numerical model were compared with the experimental results to assess the accuracy of the method.
2.3. Statistical Model
This section contains a description of how the stress states extracted from the calibrated model have been used to study the scale effect on the strength of the single tow through a statistical approach.
2.3.1. The Equivalent Stress
Significant shear stresses arise in the open-hole tensile testing of woven composite materials, due to the stress intensification induced by the presence of the notch. Moreover, differently from homogeneous materials, the local stress field is altered from the heterogeneous material distribution. This results in further local stress concentration. To appropriately consider these two factors in the numerical model, an equivalent stress was introduced for the orthotropic material, which represents the single tow.
This equivalent stress, whose formulation follows the Tsai–Hill failure criterion, has four quadratic terms, considering longitudinal (fiber direction) tensile stress, transverse tensile stress, their interaction, and shear stress. For the -th element, it is defined as follows:
where , , and are, respectively, the fiber-direction tensile, transverse tensile, and shear stress in the -th element; and , , , and are parameters related to the material strength, to be estimated from experimental results.
In the following, the limit value of the equivalent stress of the material is expressed statistically, modeling the scale effect that describes the variation of the material strength with the critical volume (i.e., the volume subjected to critical stress).
2.3.2. The Statistical Size Effect
Modeling the relationship between the material strength and the critical volumes requires knowledge of the stress field in the analyzed structure. Considering the comparable dimensions of the notch and material bundles, the scale effect is, here, modeled at a mesoscopic level, necessitating the determination of the stress field and the critical volume at the mesoscale through the heterogeneous FEM introduced in Section 2.2.
Following and adapting the statistical approach proposed in [29] for modeling the size effect in the fatigue response of components, the maximum equivalent stress in the component is, here, the random variable. Through a linear elastic FEM, the volume of the part—in this case, the specimen—is discretized in sub-volumes characterized by the same equivalent stress, . The larger the equivalent stress, the higher the failure probability of the sub-volume. Furthermore, according to the weakest-link principle, the larger the sub-volume characterized by a specific equivalent stress, the higher the probability of failure. If the equivalent failure stress, , of an individual element follows a Weibull distribution [1], the reliability of a single element is then:
where and are the shape and scale parameters of the Weibull distribution, respectively. The dependence of the element reliability on its volume, , is modeled by expressing the scale parameter as:
where and are two parameters, to be estimated from experimental results.
Considering now a part or component, consisting of elements, its reliability, , according to the weakest-link principle is:
The ratio of each element’s equivalent stress, , to the maximum, , in the entire component will be indicated, in the following, as:
Substituting (2) in (4), applying a logarithmic transformation, and introducing the variable , as per (5), the probability of failure of the part, , becomes:
where and are, respectively, the volume and the equivalent stress ratio in the -th out of elements, in which the component is subdivided; and , , and are three parameters.
2.3.3. Statistical Model Parameter Optimization
The three model parameters, as well as the four parameters for the equivalent stress formulation, are determined from the experimental data using an optimization procedure. First, the experimental maximum equivalent stress within every tested specimen was calculated with Equation (1) from the stress fields computed in the FEM at failure load. Benard’s approximation of the median rank was then used to estimate the empirical cumulative distribution function (CDF), , of these observations:
where is the rank of the observation and is the total number of tests. For the model to correctly represent this distribution, it must hold that the calculated probability of failure, is as close as possible to the empirical, , one. Therefore, in an probability–probability plot, all points should lie on the bisector. The four model parameters were determined by minimizing the ratio of the residual sum of squares and the total sum of squares in such a plot, with the calculated probability of failure as the independent variable and the empirical probability as the dependent variable. The objective function was minimized using the Nelder–Mead simplex algorithm [30], implemented in MATLAB.
3. Results
In this section, the results of the experimental testing, of the numerical modeling, and of the fitting of the proposed statistical scaling law to all the experiments are presented and discussed.
3.1. Experimental and Material Property Identification Results
All specimens experienced brittle failure in a single point along their free span. For notched specimens, the failure surface always passed through the hole. Experimental failure loads and experimental displacements at failure recorded for each specimen are shown in Table 2.
Table 2.
Experimental failure load, experimental failure displacement, FEM failure displacement, and the percentage error between them for each specimen.
The material properties identified in the data-driven optimization process described in Section 2.2 are summed up in Table 3. It is worth noting that, with the material mapping process, the woven composite has been subdivided into its constituent unidirectional fiber bundles at the mesoscale level. Therefore, the mechanical properties reported here belong to this material, not to the woven composite at the macroscopic scale.
Table 3.
Material properties that were identified through optimization and then used in finite element models.
Together with the experimental failure loads, these properties were used in the simulation of each open-hole tensile test. The displacement at failure in the numerical model and its percentage error with the experimental measurement are reported in the last two columns of Table 2. The latter was calculated as the difference between the experimental and numerical displacements, normalized over the experimental displacement. The results show an average absolute error of 3.81%, with a standard deviation of 3.03%.
3.2. Statistical Model
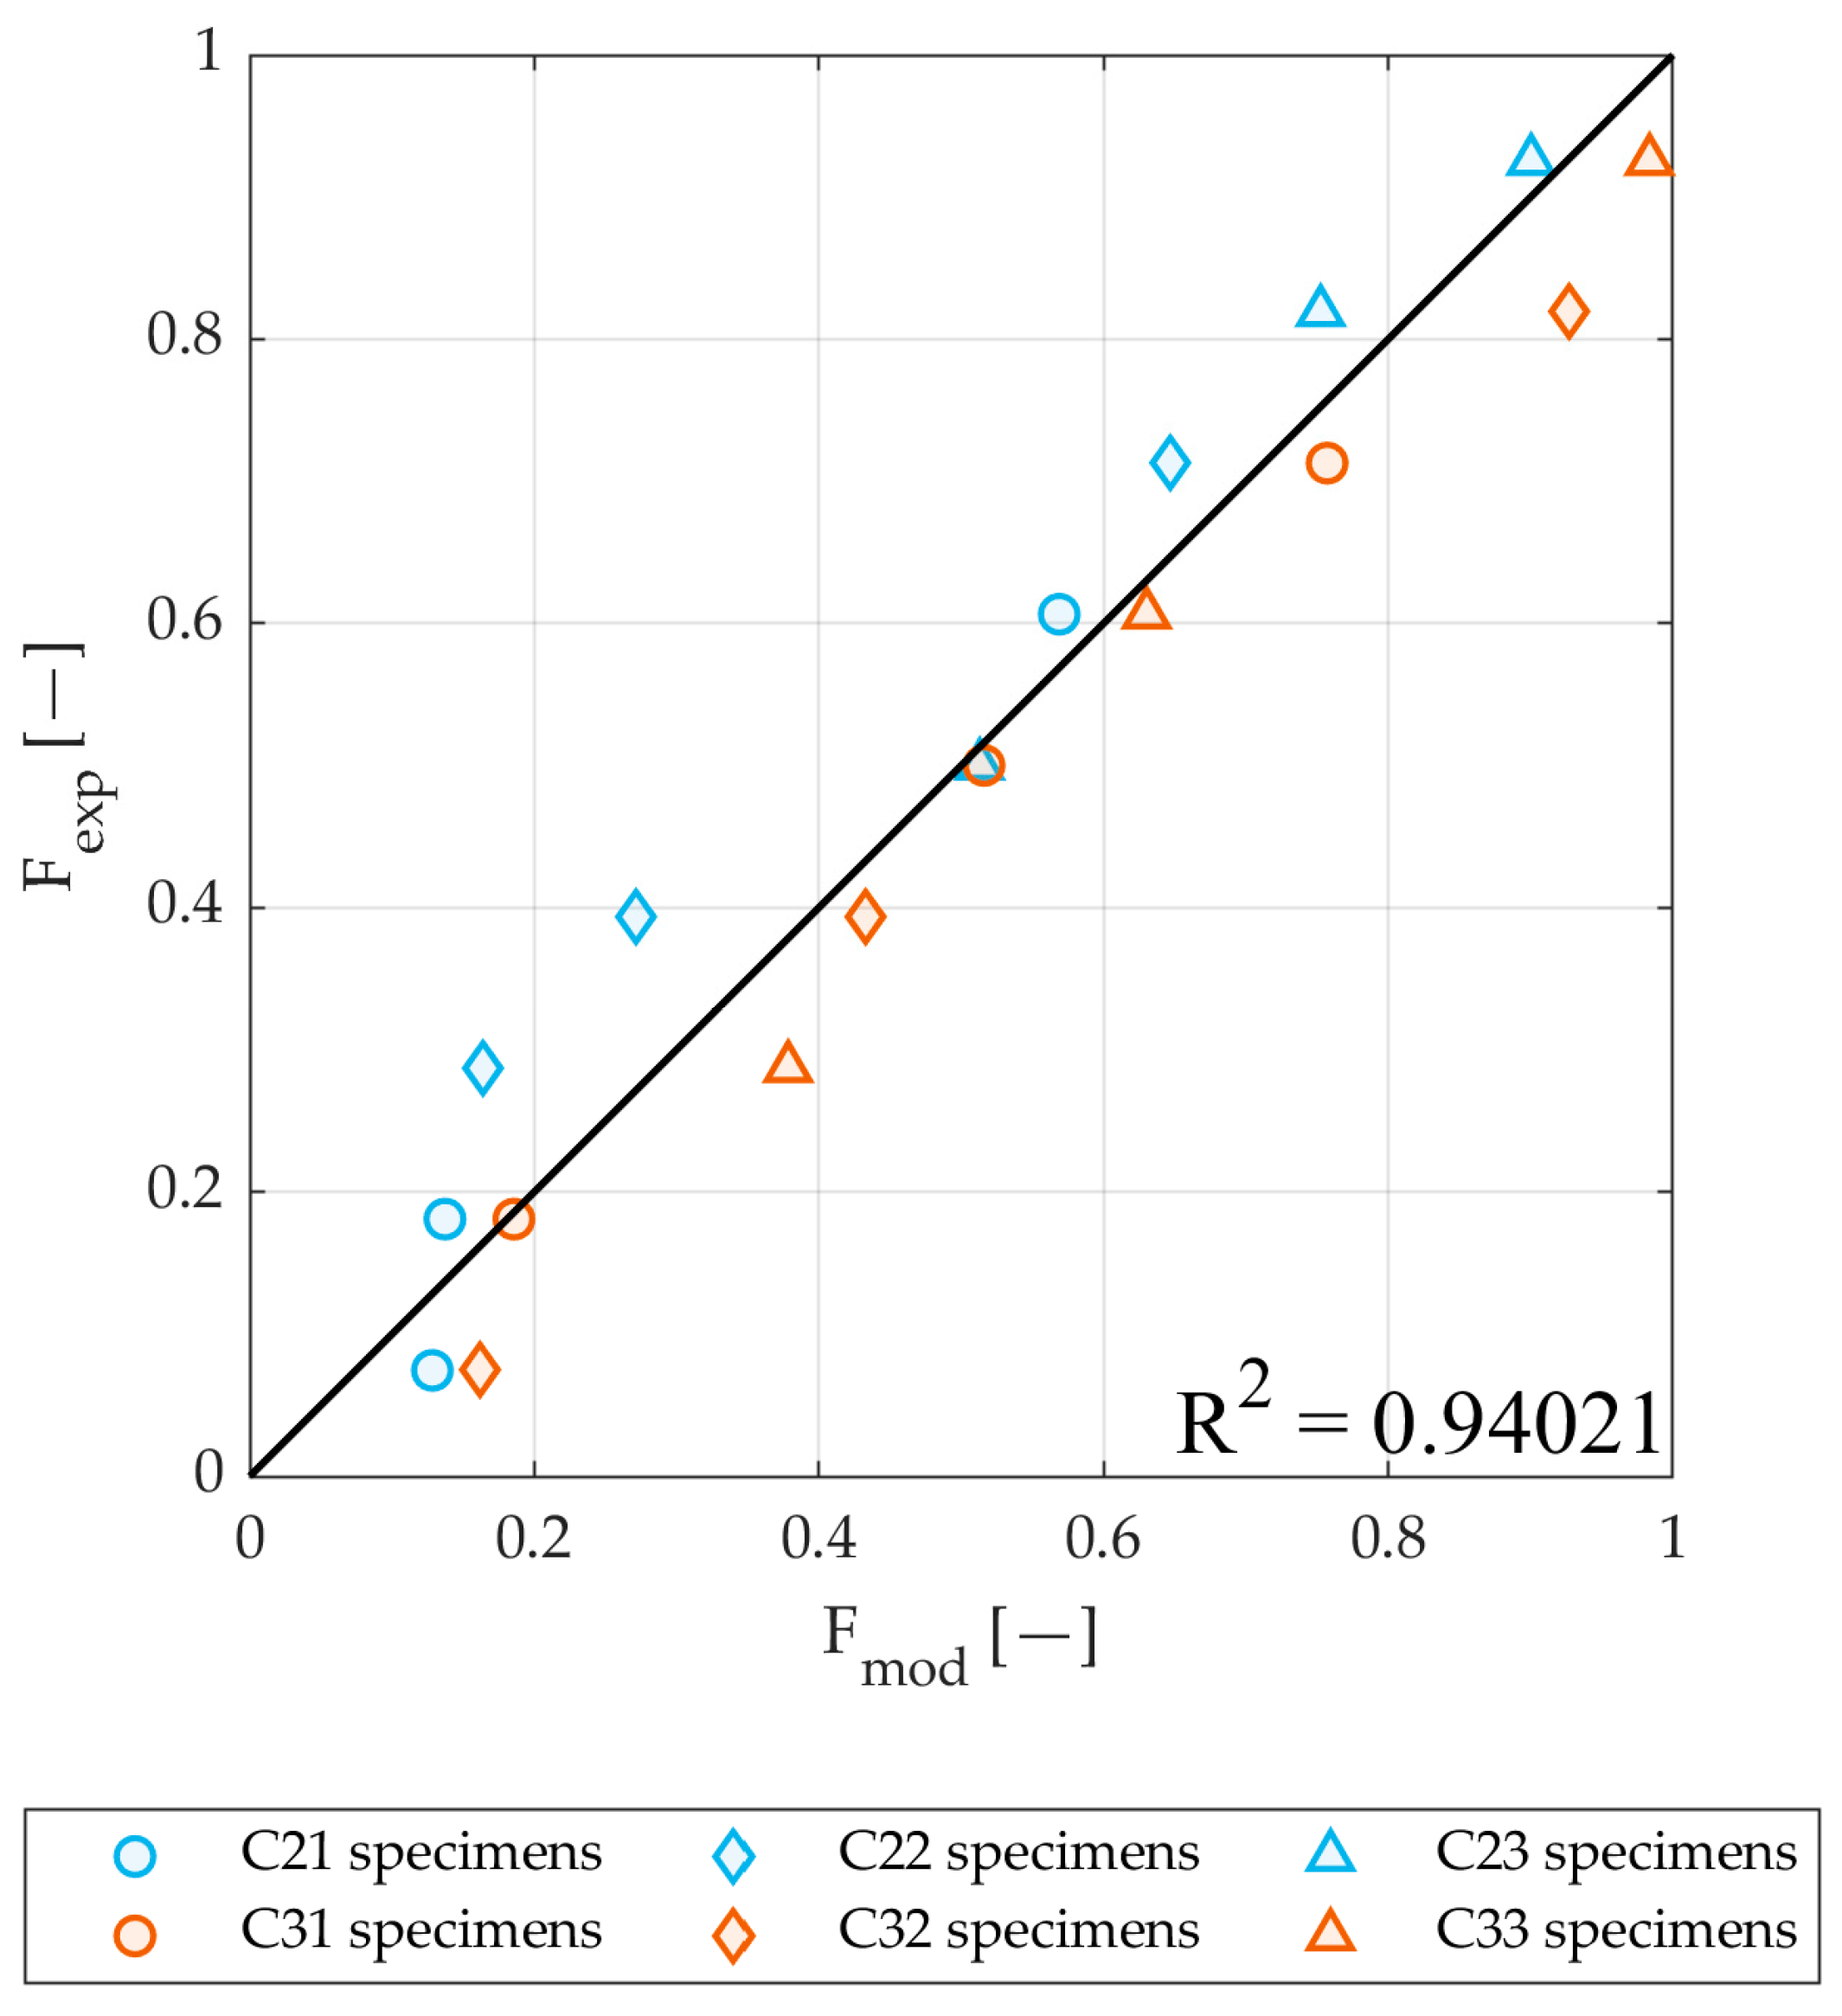
Due to the availability of only three replications per width-to-diameter ratio, the specimens were subdivided in two groups based on their width, which was considered as the scale parameter’s dominating size effect. This assumption was corroborated by the results of the model, as will be noted later. Two separate empirical and model-estimated statistical distributions were, therefore, constructed—one for the 24 mm wide specimens and one for the 36 mm wide ones. A probability–probability plot can be used as a tool to compare the two cumulative distribution functions and assess the goodness of fit of the model to the empirical data. Figure 3 shows the probability–probability plot of the estimated CDF () versus the experimental empirical CDF (), after having optimized the four parameters of the model.
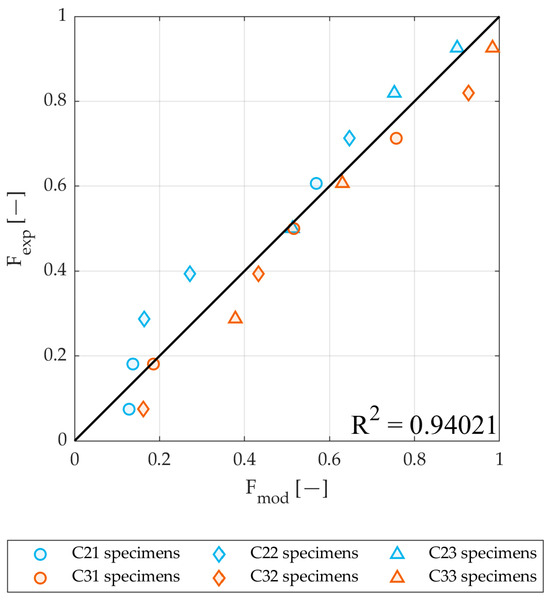
Figure 3.
Probability–probability diagram of the estimated CDF () versus the experimental empirical CDF () for the 24 mm wide (in blue) and 36 mm wide specimens (in orange). The coefficient of determination, , of the least squares fit of the bisector to the points is also shown.
The coefficient of determination of the statistical predictions with the experimental data is , as reported in Figure 3, demonstrating that the calibrated model accurately describes the size effect governing the failure of the notched specimens. All of the data points lie close to the bisector; however, the model tends to slightly overestimate the probability for the narrower specimens and underestimate it for the wider ones. At the cost of additional computational cost and complication, an ever better model fit could potentially be obtained, introducing additional specimen volume-dependent parameters, e.g., the shape parameter .
The model parameters identified with the optimization procedure are listed in the following two tables: the four equivalent stress parameters are listed in Table 4 and the three statistical model parameters are listed in Table 5.
Table 4.
The four equivalent stress parameters estimated from the experimental data.
Table 5.
The three statistical model parameters estimated from the experimental data.
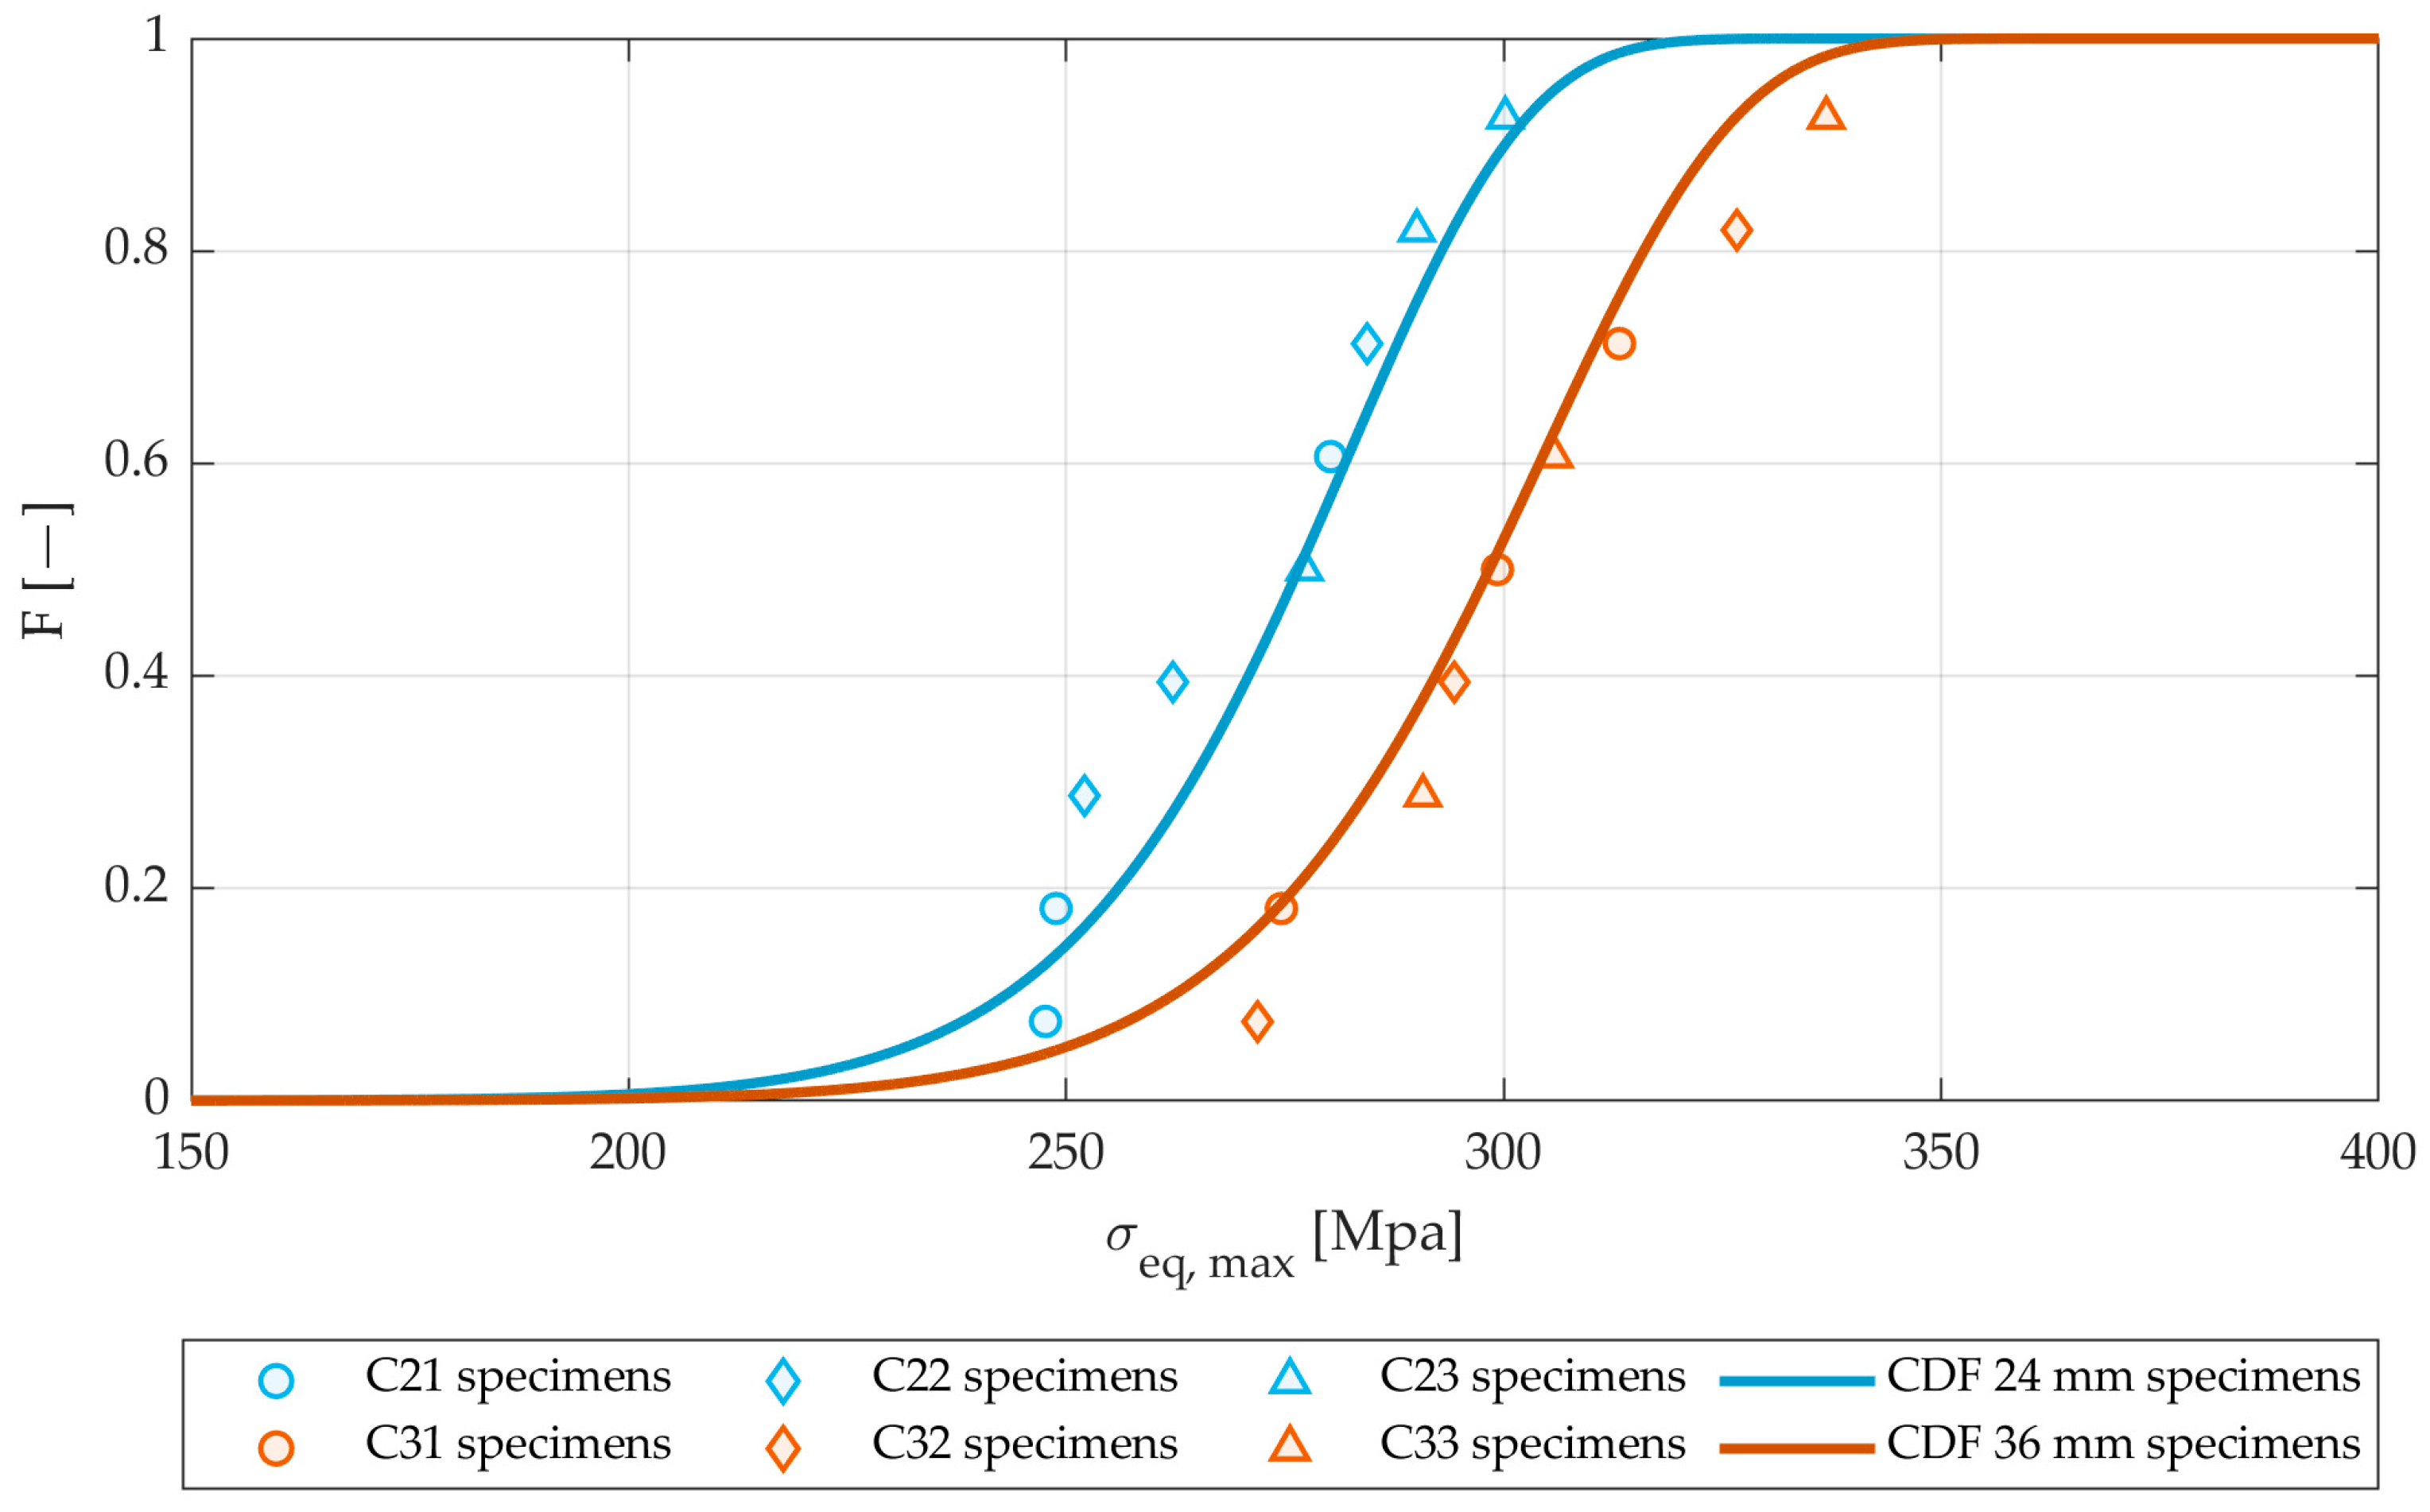
The four parameters in Table 4 govern how the stresses are combined in the equivalent stress formulation. It can be observed how , the coefficient to the fiber-direction stresses , is an order of magnitude smaller than the other terms. This mirrors the ratio between the longitudinal and transverse stresses in the material and indicates that the relative importance of the two in the failure mechanism is similar. The calibrated model provides a CDF for each specimen width, as plotted in Figure 4. An inverse size effect is apparent from the curves. For a given probability of failure, the critical equivalent stress in the wider specimens (w = 36 mm) is lower than the one predicted for the narrower specimens (w = 24 mm). In the authors’ opinion, the size effect observed could stem from a geometrical effect. The highest stresses arising from the concentration around the hole are carried by the tows in the longitudinal direction. For a scaled-up specimen, as in a 36 mm wide versus a 24 mm wide one, the relative size of the tow to the hole decreases. This leads to a lowering in the effective stress concentration factor for the tows around the hole, due to a larger relative radius of the hole compared to tow size. The resulting improved distribution of stresses in the immediate vicinity of the hole enhances the load-bearing capacity of the material. A similar effect occurs for transverse stresses.
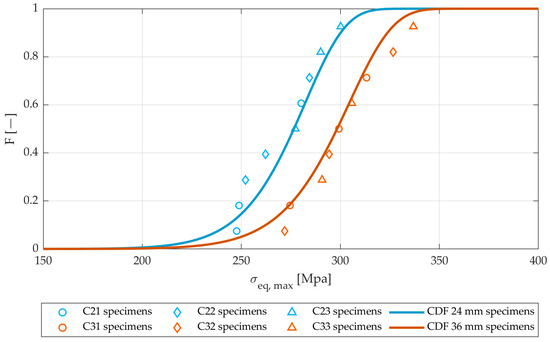
Figure 4.
Model cumulative distribution function of the maximum equivalent stress for the 24 mm and 36 mm specimen types. Experimental observations are shown as individual markers.
The different specimen width-to-hole diameter ratios are indicated in the plot with different markers. The observed distribution of the specimen hole diameters in each group confirms the approach taken, which considers only specimen width as the size effect scaling factor. Hole sizes are mixed up along the curve, suggesting a lesser impact on size effect of width-to-diameter in the range considered. This is especially true for the wider specimens. For example, a C33 specimen, with the largest hole diameter in the width group, has the third lowest equivalent stress, while a C31 specimen, with the smallest hole diameter, shows the third highest equivalent stress.
4. Conclusions
A statistical model has been proposed that describes the mesoscale size effect on the strength of open-hole woven-reinforcement composites under tension, building on methods proposed in previous works by the authors. The statistical model relies on a discretization of the component into sub-volumes, subjected to the same equivalent stress, computed with a mesoscale finite element model built from the local orientation of the woven fiber reinforcement, measured experimentally. An equivalent stress is defined at the material mesoscale, with four quadratic terms, similar to the Tsai–Hill failure criterion. The maximum equivalent stress is the random variable in the model, whose probability is governed by the scale effect. The statistical model calibrated on experimental results of open-hole tensile tests showed a remarkable accuracy in describing the mesoscopic scale effect governing the failure of woven tows. The mesoscale finite element model that accounts for the variation of the stress fields due to the material heterogeneity, and the stress intensification induced by the notch, is a cornerstone of the proposed method. From the mesoscale stress field computed with the finite element model, the statistical model accurately predicts the experimental results with a 94% coefficient of determination. For a given probability of failure, the model predicts a lower critical equivalent stress in wider specimens.
In summary, the proposed method is an efficient tool to predict the component strength accounting for both the material heterogeneity and the scale effect that governs the failure of the carbon fiber tows of the woven composite. It is worth noting that the proposed methodology, while used here to study the circular notch size effect, has the potential to be applied to unnotched specimens, other types of notches, or composites with different types of woven reinforcements, including hybrid ones. Another possible development is the homogenization of the mesoscale model in a homogeneous, macroscale one, to provide a readily applicable design criterion for notched composite parts.
Author Contributions
Conceptualization, D.S.P.; methodology, A.F. and D.S.P.; investigation, A.F.; writing—original draft preparation, A.C., A.F. and C.B.N.; writing—review and editing, D.S.P.; supervision, D.S.P. All authors have read and agreed to the published version of the manuscript.
Funding
This research received no external funding.
Data Availability Statement
The data presented in this study are available on request from the corresponding author.
Conflicts of Interest
The authors declare no conflicts of interest.
References
- Wisnom, M.R. Size Effects in the Testing of Fibre-Composite Materials. Compos. Sci. Technol. 1999, 59, 1937–1957. [Google Scholar] [CrossRef]
- Kumar Singh, K.; Shanmugam, R.; Touhid Alam Ansari, M.; Gaurav, A. Reliability Analysis of Angle Ply Woven GFRP Composite under In-Plane Loading Condition Using Two Parameter Weibull Distribution. Mater. Today Proc. 2023, in press. [CrossRef]
- Marston, C.; Gabbitas, B.; Adams, J.; Nutt, S.; Marshall, P.; Galiotis, C. Failure Characteristics in Carbon/Epoxy Composite Tows. Compos. Part A Appl. Sci. Manuf. 1996, 27, 1183–1194. [Google Scholar] [CrossRef]
- Mesquita, F.; Breite, C.; Lomov, S.V.; Swolfs, Y. In-Situ Synchrotron Computed Tomography Tensile Testing of Composite Specimens to Estimate Fibre Strength Weibull Parameters. Compos. Sci. Technol. 2022, 229, 109710. [Google Scholar] [CrossRef]
- Pimenta, S.; Pinho, S.T. Hierarchical Scaling Law for the Strength of Composite Fibre Bundles. J. Mech. Phys. Solids 2013, 61, 1337–1356. [Google Scholar] [CrossRef]
- Awerbuch, J.; Madhukar, M.S. Notched Strength of Composite Laminates: Predictions and Experiments—A Review. J. Reinf. Plast. Compos. 1985, 4, 3–159. [Google Scholar] [CrossRef]
- Martin, E.; Leguillon, D.; Carrère, N. An Extension of the Point-Stress Criterion Based on a Coupled Stress and Energy Fulfilment: Application to the Prediction of the Open-Hole Tensile Strength of a Composite Plate. In Structural Integrity and Durability of Advanced Composites: Innovative Modelling Methods and Intelligent Design; Elsevier: Amsterdam, The Netherlands, 2015; pp. 425–444. [Google Scholar] [CrossRef]
- Xu, X.; Wisnom, M.R.; Mahadik, Y.; Hallett, S.R. An Experimental Investigation into Size Effects in Quasi-Isotropic Carbon/Epoxy Laminates with Sharp and Blunt Notches. Compos. Sci. Technol. 2014, 100, 220–227. [Google Scholar] [CrossRef]
- Green, B.G.; Wisnom, M.R.; Hallett, S.R. An Experimental Investigation into the Tensile Strength Scaling of Notched Composites. Compos. Part A Appl. Sci. Manuf. 2007, 38, 867–878. [Google Scholar] [CrossRef]
- Pierron, F.; Green, B.G.; Wisnom, M.R. Full-Field Assessment of the Damage Process of Laminated Composite Open-Hole Tensile Specimens. Part I: Methodology. Compos. Part A Appl. Sci. Manuf. 2007, 38, 2307–2320. [Google Scholar] [CrossRef]
- Qin, L.; Zhang, Z.; Feng, Z.; Li, X.; Wang, Y.; Wang, Y.; Miao, H.; He, L.; Gong, X. Full-Field Analysis of Notch Effects of 3D Carbon/Carbon Composites. J. Mater. Sci. 2013, 48, 3454–3460. [Google Scholar] [CrossRef]
- Serra, J.; Bouvet, C.; Karinja Haridas, P.; Ratsifandrihana, L. Numerical Simulations of Combined Size Effects Acting on an Open-Hole Laminated Composite Plate under Tension. J. Compos. Mater. 2022, 57, 213–233. [Google Scholar] [CrossRef]
- Hallett, S.R.; Green, B.G.; Jiang, W.G.; Wisnom, M.R. An Experimental and Numerical Investigation into the Damage Mechanisms in Notched Composites. Compos. Part A Appl. Sci. Manuf. 2009, 40, 613–624. [Google Scholar] [CrossRef]
- Camanho, P.P.; Maimí, P.; Dávila, C.G. Prediction of Size Effects in Notched Laminates Using Continuum Damage Mechanics. Compos. Sci. Technol. 2007, 67, 2715–2727. [Google Scholar] [CrossRef]
- Camanho, P.P.; Erçin, G.H.; Catalanotti, G.; Mahdi, S.; Linde, P. A Finite Fracture Mechanics Model for the Prediction of the Open-Hole Strength of Composite Laminates. Compos. Part A Appl. Sci. Manuf. 2012, 43, 1219–1225. [Google Scholar] [CrossRef]
- Chen, B.Y.; Tay, T.E.; Baiz, P.M.; Pinho, S.T. Numerical Analysis of Size Effects on Open-Hole Tensile Composite Laminates. Compos. Part A Appl. Sci. Manuf. 2013, 47, 52–62. [Google Scholar] [CrossRef]
- Serra, J.; Bouvet, C.; Castanié, B.; Petiot, C. Scaling Effect in Notched Composites: The Discrete Ply Model Approach. Compos. Struct. 2016, 148, 127–143. [Google Scholar] [CrossRef]
- Serra, J.; Bouvet, C.; Castanié, B.; Petiot, C. Experimental and Numerical Analysis of Carbon Fiber Reinforced Polymer Notched Coupons under Tensile Loading. Compos. Struct. 2017, 181, 145–157. [Google Scholar] [CrossRef]
- Zheng, K.; Hu, H.; Cao, D.; Zhong, Y.; Li, S. Experimental and Numerical Studies on the Tensile Behaviors of Thin-Ply and Thick-Ply Open-Hole Laminates. Thin-Walled Struct. 2023, 186, 110649. [Google Scholar] [CrossRef]
- Yu, J.; Pan, Z.; Cai, Q.; Zhang, F.; Wu, Z. Open Hole Tensile Behavior of Plain Woven Carbon/Glass Hybrid Composites. Int. J. Mech. Sci. 2023, 246, 108142. [Google Scholar] [CrossRef]
- Ma, Z.; Chen, J.; Yang, Q.; Li, Z.; Su, X. Progressive Fracture Analysis of the Open-Hole Composite Laminates: Experiment and Simulation. Compos. Struct. 2021, 262, 113628. [Google Scholar] [CrossRef]
- Wysmulski, P. Failure Mechanism of Tensile CFRP Composite Plates with Variable Hole Diameter. Materials 2023, 16, 4714. [Google Scholar] [CrossRef]
- Erçin, G.H.; Camanho, P.P.; Xavier, J.; Catalanotti, G.; Mahdi, S.; Linde, P. Size Effects on the Tensile and Compressive Failure of Notched Composite Laminates. Compos. Struct. 2013, 96, 736–744. [Google Scholar] [CrossRef]
- Nguyen-Hoang, M.; Becker, W. Open Holes in Composite Laminates with Finite Dimensions: Structural Assessment by Analytical Methods. Arch. Appl. Mech. 2022, 92, 1101–1125. [Google Scholar] [CrossRef]
- Ferrarese, A.; Boursier Niutta, C.; Ciampaglia, A.; Ciardiello, R.; Paolino, D.S.; Belingardi, G. Experimental and Numerical Investigation of the Mesoscale Size Effect in Notched Woven Composites. Appl. Sci. 2023, 13, 4300. [Google Scholar] [CrossRef]
- ASTM D5766/D5766M-11(2018); Standard Test Method for Open-Hole Tensile Strength of Polymer Matrix Composite Laminates. Annual Book of ASTM Standards; American Society for Testing and Materials: West Conshohocken, PA, USA, 2011. [CrossRef]
- ASTM D3039/D3039M-17; Standard Test Method for Tensile Properties of Polymer Matrix Composite Materials. Annual Book of ASTM Standards; American Society for Testing and Materials: West Conshohocken, PA, USA, 2011. [CrossRef]
- Schreier, H.; Orteu, J.J.; Sutton, M.A. Practical Considerations for Accurate Measurements with DIC. In Image Correlation for Shape, Motion and Deformation Measurements: Basic Concepts, Theory and Applications; Springer: New York, NY, USA, 2009; ISBN 978-0-387-78746-6. [Google Scholar]
- Invernizzi, S.; Paolino, D.; Montagnoli, F.; Tridello, A.; Carpinteri, A. Comparison between Fractal and Statistical Approaches to Model Size Effects in VHCF. Metals 2022, 12, 1499. [Google Scholar] [CrossRef]
- Nelder, J.A.; Mead, R.A. Simplex Method for Function Minimization. Comput. J. 1965, 7, 308–313. [Google Scholar] [CrossRef]

Disclaimer/Publisher’s Note: The statements, opinions and data contained in all publications are solely those of the individual author(s) and contributor(s) and not of MDPI and/or the editor(s). MDPI and/or the editor(s) disclaim responsibility for any injury to people or property resulting from any ideas, methods, instructions or products referred to in the content. |
© 2024 by the authors. Licensee MDPI, Basel, Switzerland. This article is an open access article distributed under the terms and conditions of the Creative Commons Attribution (CC BY) license (https://creativecommons.org/licenses/by/4.0/).