Abstract
Augmented reality (AR) is rapidly becoming a popular technology for exhibitions. The extended content provided through virtual elements offers a higher level of interactivity and can increase the appeal of the exhibition for younger viewers, in particular. However, AR technology in exhibition settings is typically utilized to extend the effects of exhibits, focusing solely on individual experiences and lacking in shared social interactions. In order to address this limitation, in this study, we used AR technology to construct a participatory exhibition-viewing system in the form of an AR mobile application (app), “Wander Into Our Sea”. This system was developed as a component of the 2022 Greater Taipei Biennial of Contemporary Art exhibition titled “Log Into Our Sea”. The app features two modes: exhibition-viewing mode and message mode. The first embodies passive exhibition-viewing while the second offers channels for active participation. The app has three functions: (1) in exhibition mode, visitors passively view the exhibition content through the AR lens, (2) in message mode, visitors can use the AR lens to leave messages in the 3D space of the exhibition to become part of the exhibit, and (3) during the use of either mode, the app collects data on visitor behavior and uploads it to a cloud to create a research database. The third function allowed us to compare the behaviors of exhibition visitors while they used the two modes. Results revealed that without restricting the ways and sequences in which AR content was viewed, there were no significant differences in the duration of viewing, or the distance covered by visitors between the two modes. However, the paths they took were more concentrated in the exhibition-viewing mode, which indicates that this mode encouraged visitors to view the exhibit in accordance with the AR content. In contrast, in message mode, visitors were encouraged to leave text messages and read those left by others, which created disorganized unpredictable paths. Our study demonstrates an innovative application of AR positioning within an interactive exhibition-viewing system, showcasing a novel way to engage visitors and enrich their experience.
1. Introduction
Various exhibitions currently employ augmented reality (AR) technology primarily to enhance the visitor experience, allowing artworks or exhibits to display dynamic effects and interact with visitors, increasing the overall enjoyment of the exhibition. AR technology can also be utilized to design AR games within specific venues, enabling interactions between exhibits or the environment, providing entertainment and challenges [1]. However, AR technology in exhibitions is usually focused on individual experiences, and its social and interactive aspects are relatively weak [2]. Furthermore, understanding the impact of shared AR functionalities on visitor behavior within exhibition venues is a topic worthy of analysis. Traditional methods of analyzing visitor behavior usually involve additional hardware setups, which, while providing precise information, can be challenging and costly to implement in conjunction with exhibitions [3,4]. Surveys and interviews, on the other hand, often lead to biased behavioral data due to visitors relying on their memories to recall the exhibition experience [5]. Recognizing these challenges, researchers leverage the inherent physical space positioning capabilities of AR. In addition to offering AR content for viewing within the exhibition space, the researchers utilize visitors’ mobile devices as analytical tools.
The approach utilized in this research is rooted in the navAR system, a creation of Lee, Xiao, and Hsu [6]. navAR is an AR navigation application developed with considerations for visitors, content providers, and researchers. This system captures and uploads visitor behavior data to an online database automatically. In a library-based AR book-finding experiment, it was observed that users’ book-finding paths were more straightforward when augmented by AR technology [7]. This same app was gamified for an art exhibition with the intention of controlling crowd flow [8]. Results showed that the gamified AR navigation successfully guided exhibition visitors to follow the designed paths. Notably, both of these applications were designed for passive use. The current paper investigates the influences of an app that enables the visitors of an exhibition to participate by leaving their own marks on the exhibits through AR technology, thereby increasing visitor engagement. How does this active participation differ from passive viewing behavior?
Therefore, to understand the behavioral differences between viewers experiencing exhibitions passively and actively participating through AR technology, our focus was the 2022 Greater Taipei Biennial of Contemporary Art exhibition held at the Yo-Chang Art Museum in Taiwan. In accordance with the exhibition theme “Log Into Our Sea” (Appendix A), we created the exhibit titled “Wander Into Our Sea”. In coordination with curatorial needs, the exhibition rooms introduced and displayed the achievements of five centers belonging to the Yo-Chang Art Museum of the National Taiwan University of Arts. Visitors could use the AR app to explore the exhibit and participate in the exhibition by adding AR text messages to the exhibition space (Appendix B). During the exhibition, utilizing the AR positioning feature, the app collected visitors’ behavior data through their smartphones and uploaded the data to the online database automatically. This approach enabled researchers to analyze behavioral differences between the two modes, providing a reference for future engagements where audiences participate in exhibit content through AR technology. Additionally, it offers a framework for cultivating “interactive sociality” in museums through the social value of AR technology.
The main contribution of this study lies in the creation of an innovative participatory exhibition-viewing system utilizing AR technology, accompanied by a detailed analysis of visitor behavior to explore the impact of different viewing modes on audience interaction and participation. Compared to traditional AR exhibition applications, the innovations of this research include the following:
- Development of a Participatory Exhibition-Viewing System: By developing an AR app that integrates ‘exhibition-viewing mode’ and ‘message mode’, this study introduces a novel interactive mode for exhibition viewing. The system enhances the exhibition experience by providing interactive features that engage viewers more deeply with the content.
- In-Depth Analysis of Visitor Behavior: This research, through the collection and analysis of behavior data from viewers using the AR app, reveals the distinct impacts of the exhibition-viewing mode and message mode on viewer behavior. These findings not only deepen our understanding of the application of AR in exhibitions but also provide valuable data and insights for future research.
This work advances AR applications in cultural exhibitions, presenting a significant shift from individualized experiences to fostering communal engagement.
2. Related Work
In recent years, the application of AR technology in exhibition experiences has been increasingly recognized as an effective tool for enhancing visitor interaction and engagement [9]. While existing research has explored the potential of AR in enhancing individual visitor experiences, there is still a lack of studies on how AR technology can promote participatory experiences among viewers [2]. Additionally, there is a dearth in the current literature on the comparative analysis of how different AR exhibition modes affect visitor behavior.
Although AR technology brings new possibilities to exhibition experiences, challenges remain in terms of audience engagement, AR benefit analysis, and AR positioning technology. Through an in-depth exploration of these key issues, our research not only fills gaps in the existing literature but also provides direction and foundation for future research in the field of AR exhibition experiences. The following will conduct a literature review focusing on audience engagement with exhibits (Section 2.1), AR benefit analysis (Section 2.2), and AR positioning technology (Section 2.3).
2.1. Audience Engagement with Exhibits
The behavior of visitors within a venue is a crucial indicator for its operation and adjustment. Traditionally, exhibition interactions were confined to individual experiences through passive viewing. However, as visitors increasingly engage with venues through technological elements and even participate in exhibit content, their interactive behaviors extend into social realms. Aliakbar Jafar and colleagues emphasize how cultural consumption experiences in museums can foster “interactive sociality” both inside and outside museum spaces. Leveraging this interactive sociality, administrators can significantly enhance the museum’s contemporary societal value and social significance. In the realm of art creation, there’s a noticeable trend toward directly involving the audience in the artwork, transforming individual actions into integral components of the piece [2].
Building on this, researchers have developed systems like DRAMATRIC, which analyze group behavior through sensors and subtly adjust the storyline content based on collected data [10]. Moreover, studies exploring people’s perceptions and expectations regarding the use of Information and Communication Technology (ICT) in museums present a complex picture, integrating ICT usage as a part of the visiting experience [11]. With the ubiquity of mobile devices, researchers are exploring ways to transform personal devices into shared or collaborative tools using social networks, location-based services, or proximity-based connections, turning individual devices into tools for face-to-face interaction [12].
In light of these insights and recognizing the transformative potential of AR technology, this study aims to further elevate the interactive sociality within venues. AR technology and the internet serve as mediums for enhancing sharing and collaboration, allowing visitors to not only engage more deeply with the artworks but also to contribute to the communal narrative of the exhibition. This not only enriches the individual’s experience but also amplifies the venue’s social value, demonstrating AR’s significant role in shaping modern exhibition practices. By incorporating examples of past exhibitions that have utilized AR to enhance visitor engagement, we draw attention to the shift from passive to active interactions, highlighting the unique contributions of our work in promoting a more interactive and participatory exhibition experience.
2.2. AR Benefit Analysis
Several research studies have validated the potential of AR technology, not only in capturing the attention of exhibition attendees but also in fostering educational environments [1]. It is crucial for AR technology to be thoughtfully integrated to align with the exhibition’s objectives. Put differently, visitors should not be so engrossed in the AR effects that they overlook exploring the physical space around them [13]. When the technology becomes the main focus, visitors can become detached from the intended content [14].
Researchers have utilized questionnaire surveys, observation, semi-structured interviews, and video analysis to analyze the benefits of AR [5]. Nevertheless, the initial three methods solely gather data from the user’s viewpoint, posing challenges in conducting an objective analysis of user behavior. Video analysis, on the other hand, enables the examination of user trajectories [15]. Walking directions, trajectories, and distances can also be measured by placing sensors in participants’ pockets [3] or on their shoes [4]. However, these approaches necessitate the installation or positioning of devices, presenting significant inconveniences for research analyses.
In recent times, AR technology has been utilized as a supplementary tool for both users and researchers. For example, Lee et al. [6] created the AR behavior analysis system called navAR to investigate the influence of AR on the book-finding behavior of library users. They collected user behavior data using mobile devices and the internet. With the assistance of this system, it has also been applied in research on art gallery navigation. Lee et al. [8] aimed to understand viewer behavior in “game mode” and “free mode”, and to do so without disrupting the exhibition experience, they designed an experiment where the app was made available for public download. This allowed viewers to choose between the two different viewing modes voluntarily. Viewer behavior data were uploaded to the backend, enabling researchers to analyze differences in audience behaviors. Both of these studies utilized experimental designs, operating in the same space but with different modes.
2.3. AR Positioning
AR positioning techniques have become increasingly diverse in recent years. For instance, Apple’s ARKit and Google’s ARCore technologies negate the use of many of the visual labels previously required for indoor navigation. Even the installation of additional positioning hardware is no longer needed to achieve precise indoor positioning [16]. Due to the gradual advancement of these technologies and the ubiquitous usage of smartphones, AR applications have found extensive application in indoor navigation [17]. In the context of advanced AR applications for indoor environments, the development of AR-assisted UAV path planning and control highlights a novel use of AR for the precise and automated navigation of drones within indoor spaces, enhancing the capabilities of AR in complex settings [18].
However, existing studies on the topic have focused on the user perspective of positioning and navigation services. Scant research has analyzed the benefits of these services or their effect on subsequent behaviors. Thus, the spatial positioning and behavior analysis system developed by Lee et al. [6] was designed to aid researchers in understanding and analyzing visitor paths. During the process of AR platform development, it was found that environmental factors could result in positioning shifts with ARCore and ARKit [19], particularly in poorly lit and poorly textured environments. At Google I/O 2018, Google announced its visual positioning system (VPS) [20], which increases the precision of outdoor positioning using cameras, GPS, and the environmental database of Google Maps. This technology is not adaptable for indoor use [21]. The ARCore Depth API introduced by Google in 2019, however, only needs a single camera lens to create depth, thereby enhancing positioning accuracy in indoor venues and improving virtual–physical integration. Also, in 2019, Google released the Persistent Cloud Anchor, which allows virtual objects to be positioned in the real world and their coordinates stored in a cloud. Different users can then see the same AR objects, which gives AR a sharing function [22]. Fusco and Coughlan (2018) used visual–inertial odometry (VIO) in ARKit and image recognition technology to record user paths indoors, which lays the foundation for developments focused on improving positioning stability. Tsai, Kuwahara, Leiri, and Hishiyama [23] consequently used image recognition and geomagnetic filtering to develop vision-based indoor positioning. PTC launched Area Targets for their Vuforia AR kit in 2020 [24]; this technology uses 3D scans of the surrounding space to establish spatial-point cloud data and allows AR objects to be positioned in the virtual and real space. This makes AR positioning even more accurate and will greatly benefit indoor navigation quality.
3. Methodology
To explore the distinctions between typical exhibition viewing and interactive exhibition participation, we designed an AR exhibition viewing application for the 2022 Greater Taipei Biennial of Contemporary Art titled “Log Into Our Sea”, hosted at the Yo-Chang Art Museum. Our approach encompassed two key components: the development of the AR exhibition viewing system and the design of the experimental framework.
3.1. Establishment of AR Exhibition-Viewing System
To create a natural exhibition-viewing experience for our study participants, we put the developed AR app on the Apple App Store and Google Play. Its primary features include scanning and positioning frames, two user modes, and the uploading of behavioral data to a cloud.
The innovation of our system lies not just in the application of the technology itself but in how these technologies are innovatively integrated into the interactive and participatory experiences of exhibitions. By leveraging AR technology, we offer visitors a novel way to interact, simultaneously investigating how such interactions influence visitor behavior patterns within the exhibition.
Particularly, our AR system utilizes the precise positioning capabilities of the AR Foundation, but our innovation extends beyond this. We further developed two main modes for the system, a passive exhibition-viewing mode and an interactive message mode that allows visitors to leave messages in the 3D space of the exhibition. This application and expansion of existing technology enable deeper interaction with the artworks for visitors, introducing a new method of participation in the cultural exhibition domain. The specifics of these functions are outlined below.
3.1.1. Frame Scanning and Positioning
In this project, frame scanning served two functions: AR positioning and the presentation of exhibition content.
- (1)
- AR positioning
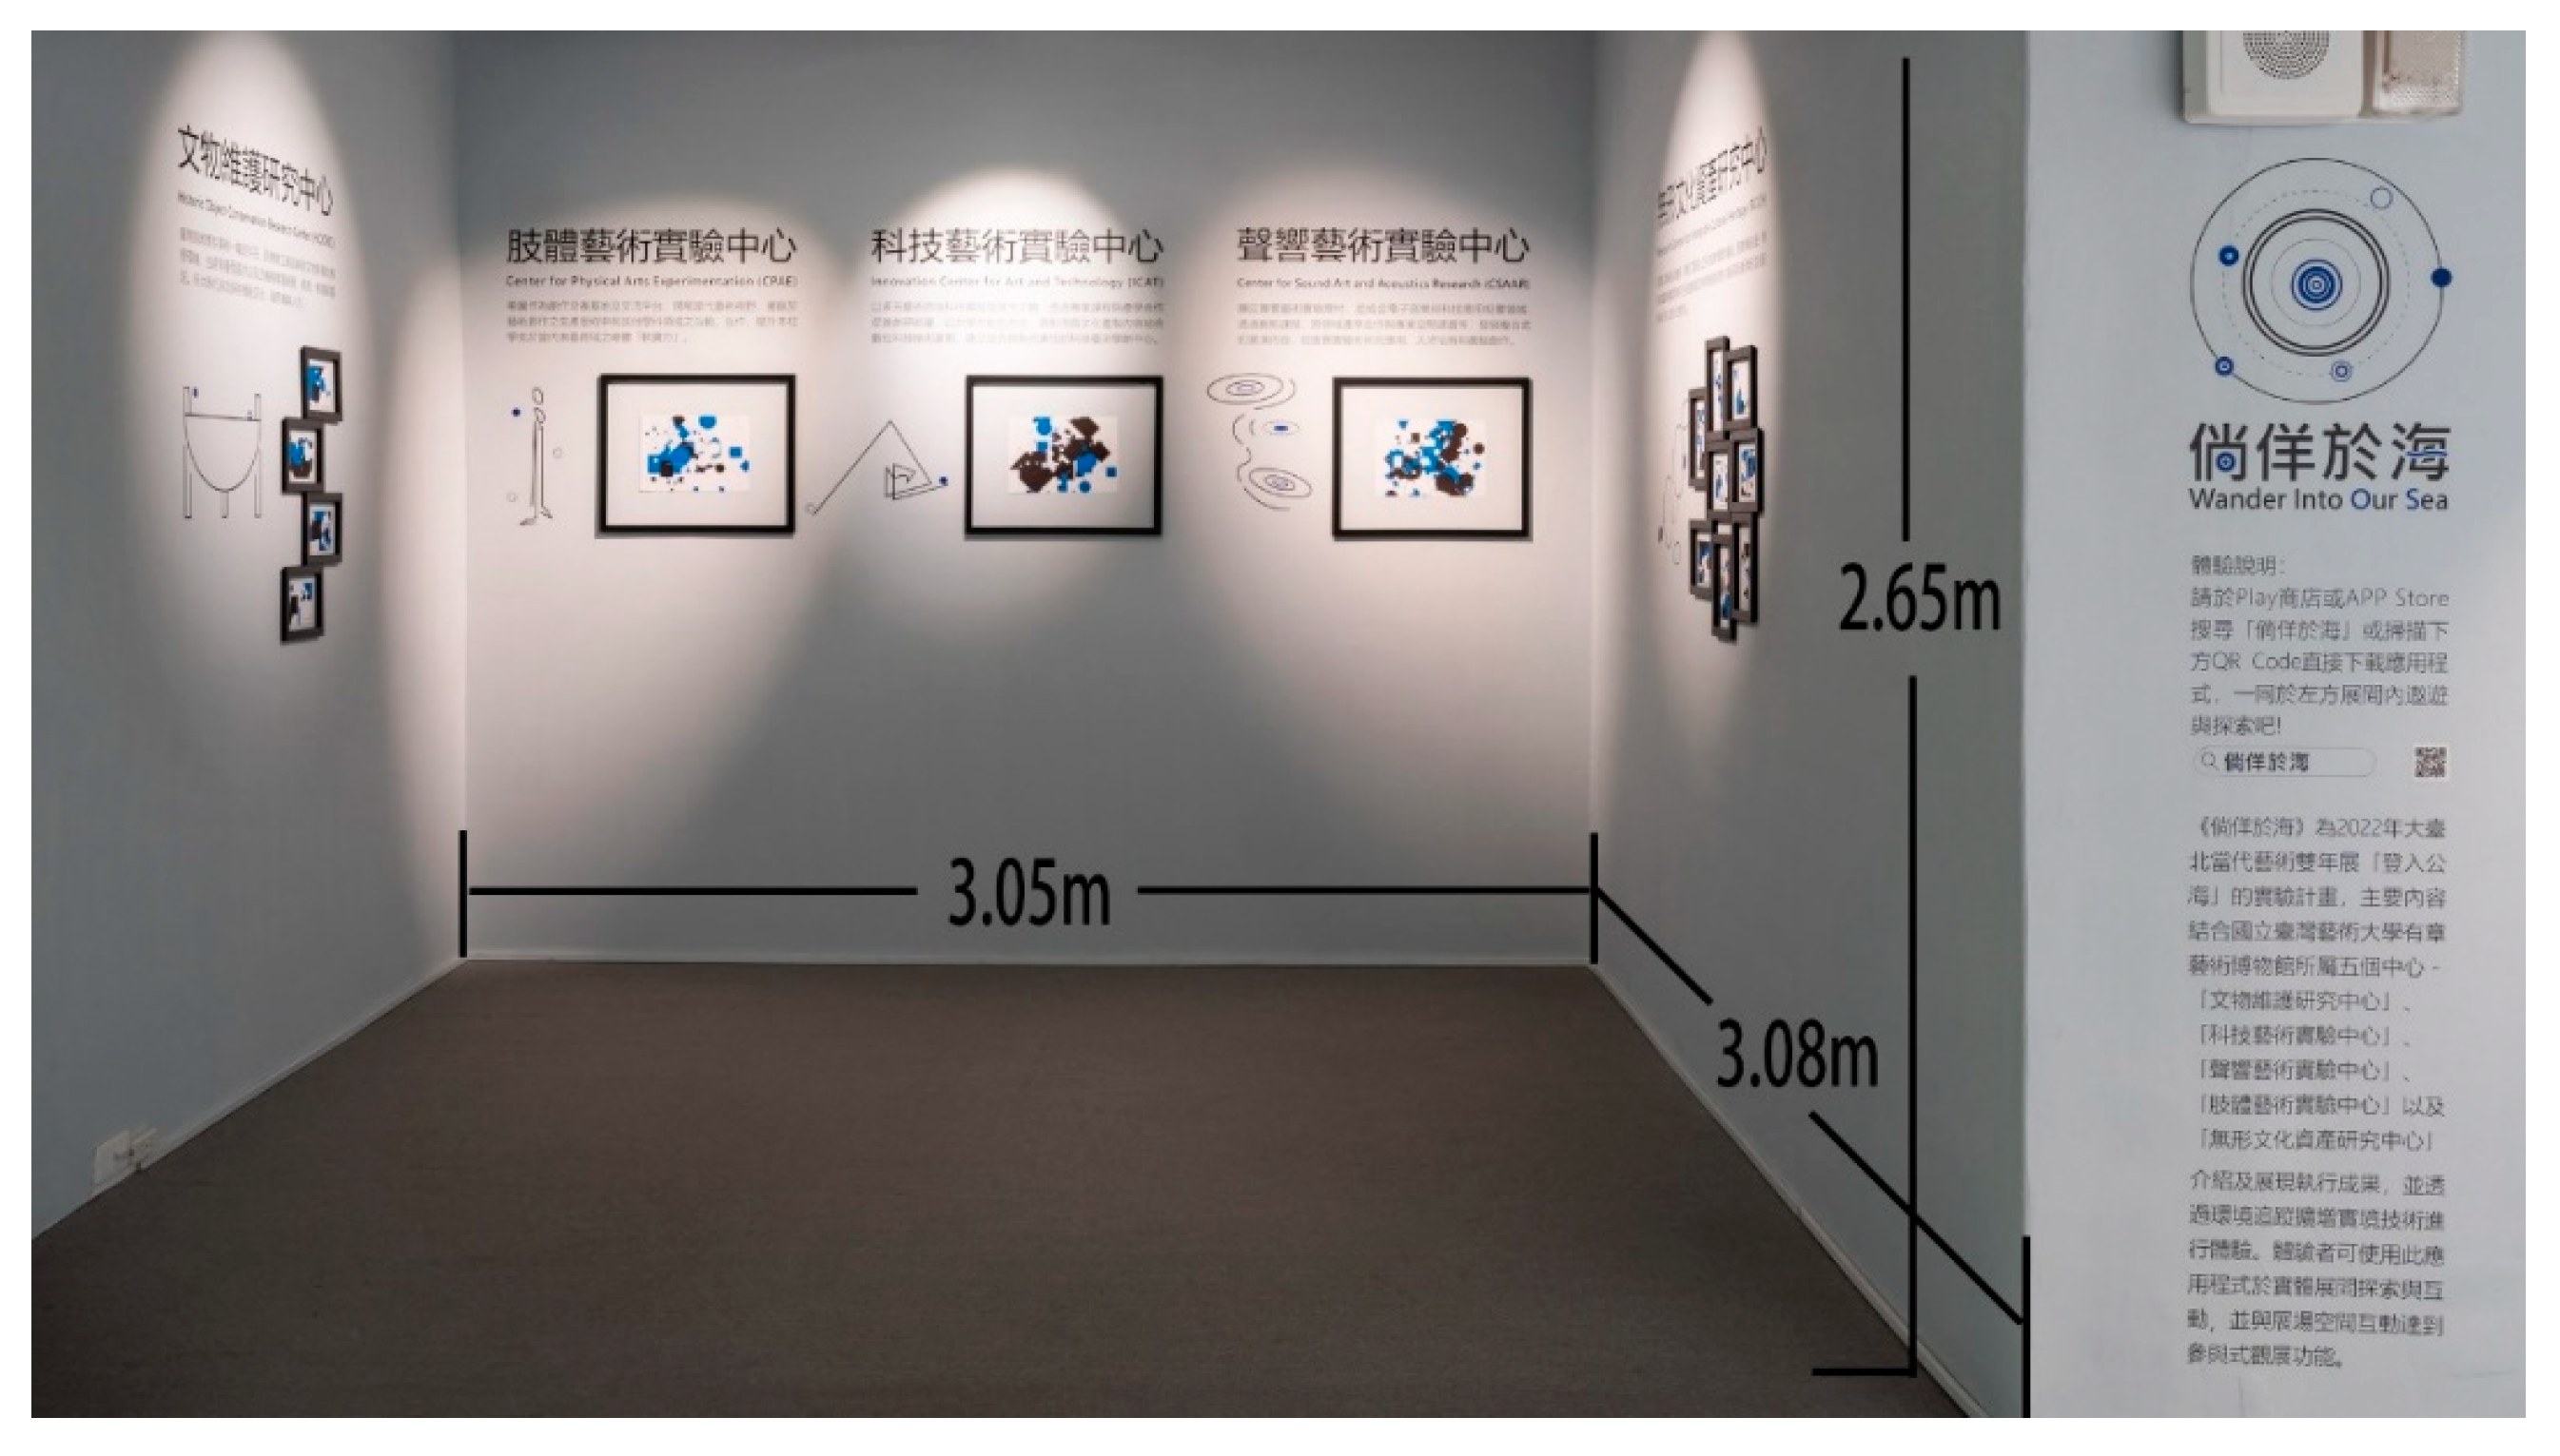
The exhibition space consisted of three walls with the following dimensions (see Figure 1): 3.05 m wide, 3.08 m deep, and 2.65 m high. All of the walls were painted white, which is not conducive to spatial positioning or general AR recognition. We, therefore, had the app prompt the user to scan frames on the first wall to aid with positioning quality (see Figure 2). The recognition images we placed in the frames matched the visual aesthetics of the overall exhibition. There were only simple text introductions of the centers on each physical wall and no other images. This was designed to add a sense of novelty and mystery for the visitors.

Figure 1.
Exhibition space and dimensions.
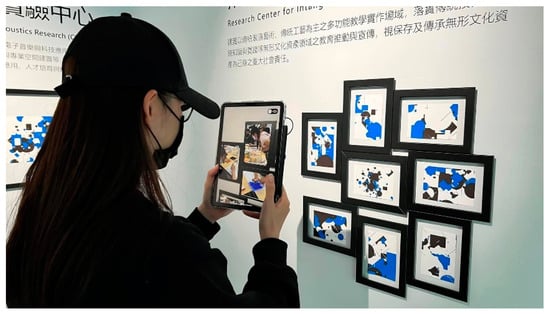
Figure 2.
Frame scanning for positioning.
This was meant to highlight the contrast between traditional exhibition labels and the enriched, interactive digital content provided through our AR application. In conventional settings, visitor engagement with the artwork is often limited to passive reading. Our system transforms this dynamic by offering a more engaging, interactive way to learn about the art, utilizing AR to provide detailed digital overlays that enhance the physical exhibits. This approach not only enriches the visitor experience but also encourages a more active exploration of the exhibition space, demonstrating the added value of integrating AR technology into cultural exhibitions.
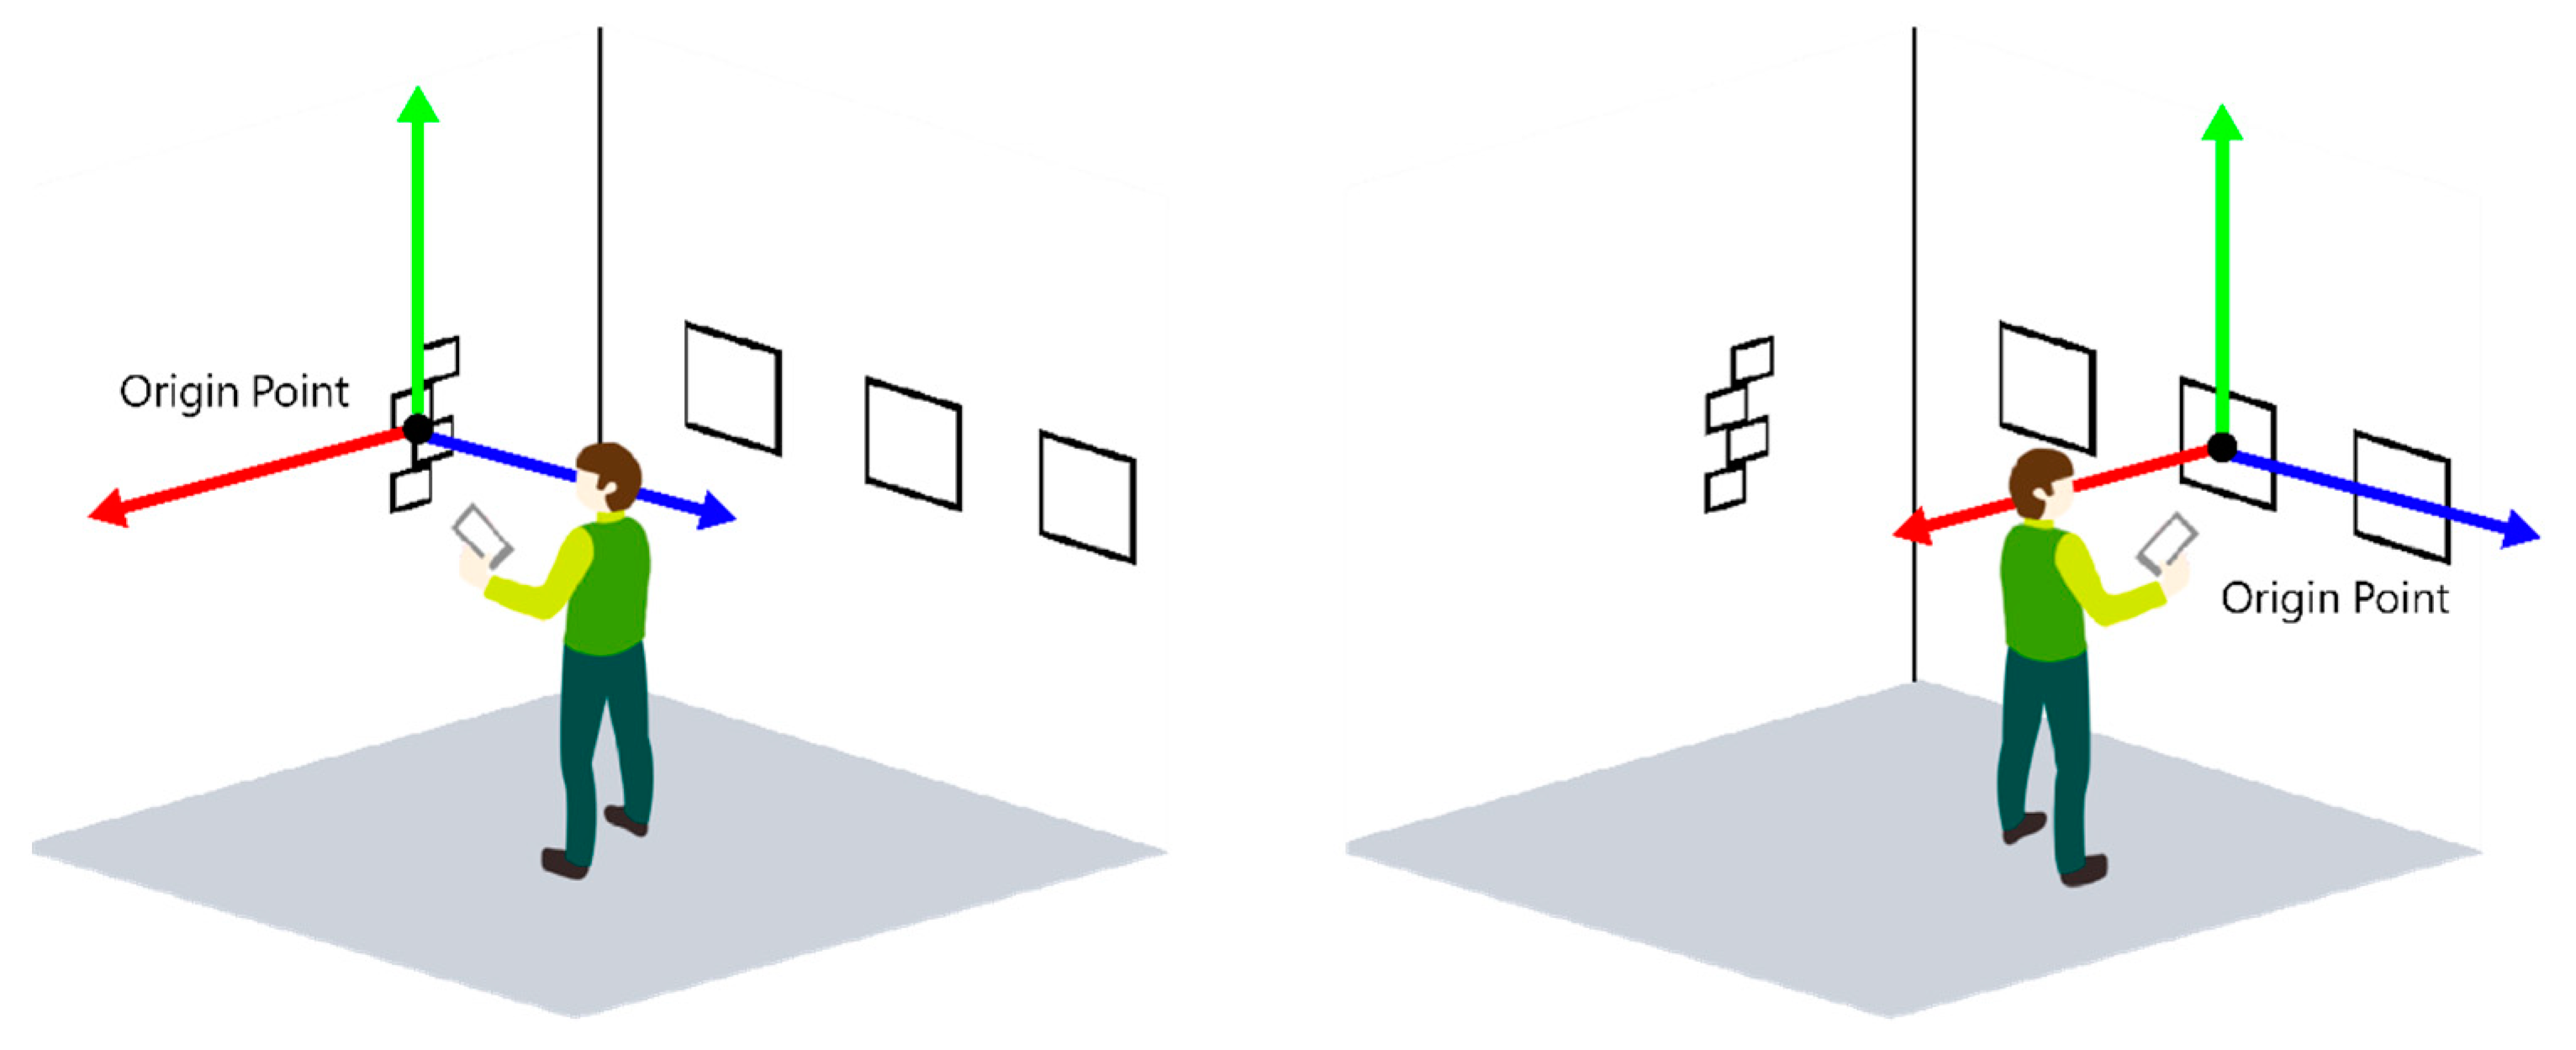
We adopted Unity’s AR Foundation technology, which uses image recognition to perform AR positioning, and the SLAM technology of ARCore 1.38 and ARKit 6 to perform continuous positioning. Users, thus, only had to scan any one of the three walls using their AR lens to construct the entire virtual space, which overlaid photos and videos of the achievements of each center into the frames on the walls. Users could scan the frames on the other walls and the app would maintain the created AR space but place the origin on the newly scanned wall. This seamless recalibration ensured that the AR virtual objects remained in their correct locations (Figure 3).
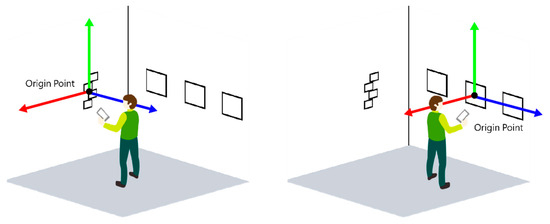
Figure 3.
Schematic of AR image recognition and SLAM technology integration for virtual–physical space positioning.
- (2)
- Presentation of exhibition content
The main purpose of the exhibit was to display the achievements of the following five centers of the Yo-Chang Art Museum of the National Taiwan University of Arts: Research Center for Historic Object Conservation, Innovation Center for Art and Technology, Research Center for Sound Art and Acoustics, Center for Physical Arts Experimentation, and Research Center for Intangible Cultural Heritage. There was a large amount of content to display, so using AR technology allowed us to overcome the physical limitations of the space, as well as to add a sense of mystery to the exhibits. The exhibit’s theme of “Wander Into Our Sea” was also supported by the immersive environment created by the AR technology.
3.1.2. User Modes
To understand the differences between passive and participatory exhibition-viewing behaviors, we created two modes for the AR app. Visitors could download our app onto their mobile devices, and after installing it, freely switch between the exhibition-viewing mode and message mode. Both modes shared the same app, physical space, and AR positioning method. Additionally, neither mode restricted the way or order in which AR content was viewed. In the participatory mode, the messages left by participants were not overlaid onto the exhibition-viewing mode. This was primarily done to enable users to concentrate on the AR content presented in both modes, preventing potential biases in the analysis results due to the participatory mode offering more experiential content to the visitors. The reason for adopting this research approach primarily lies in the ability to compare the differences in exhibition-viewing behaviors within the same space under different AR modes. Comparing different modes in different spaces might not be feasible due to variations in scene size and spatial arrangements.
- (1)
- Exhibition-viewing mode
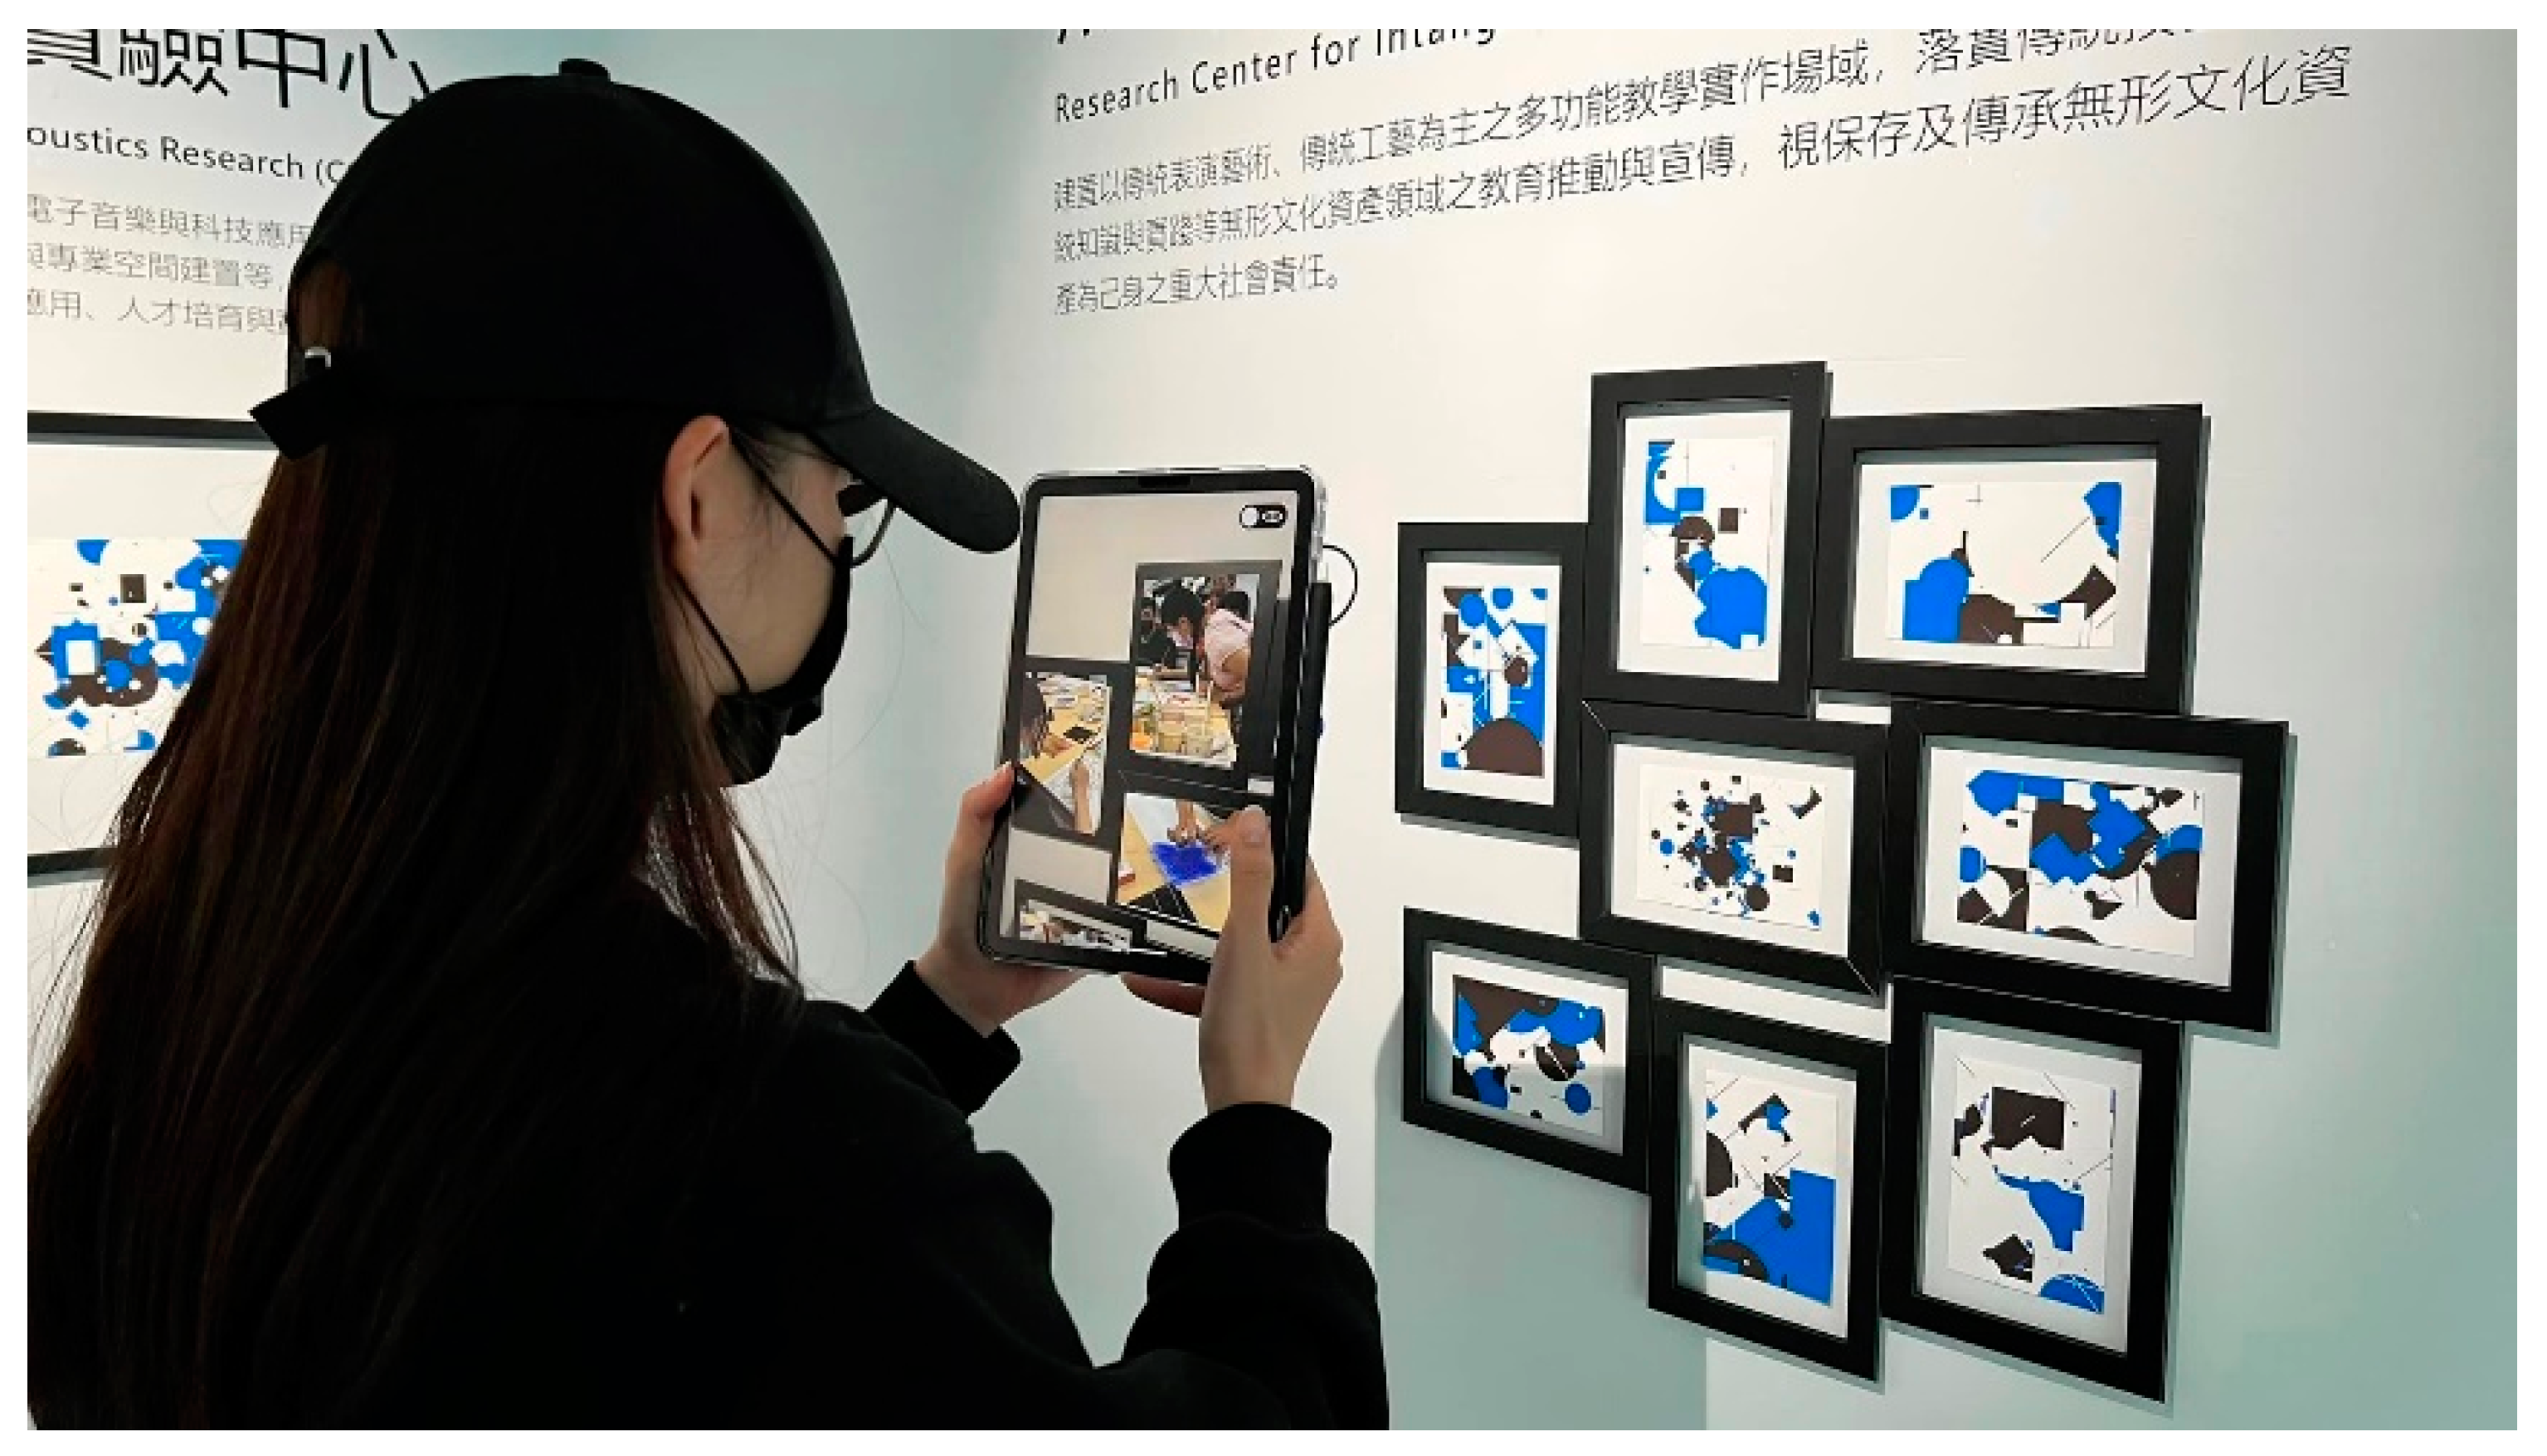
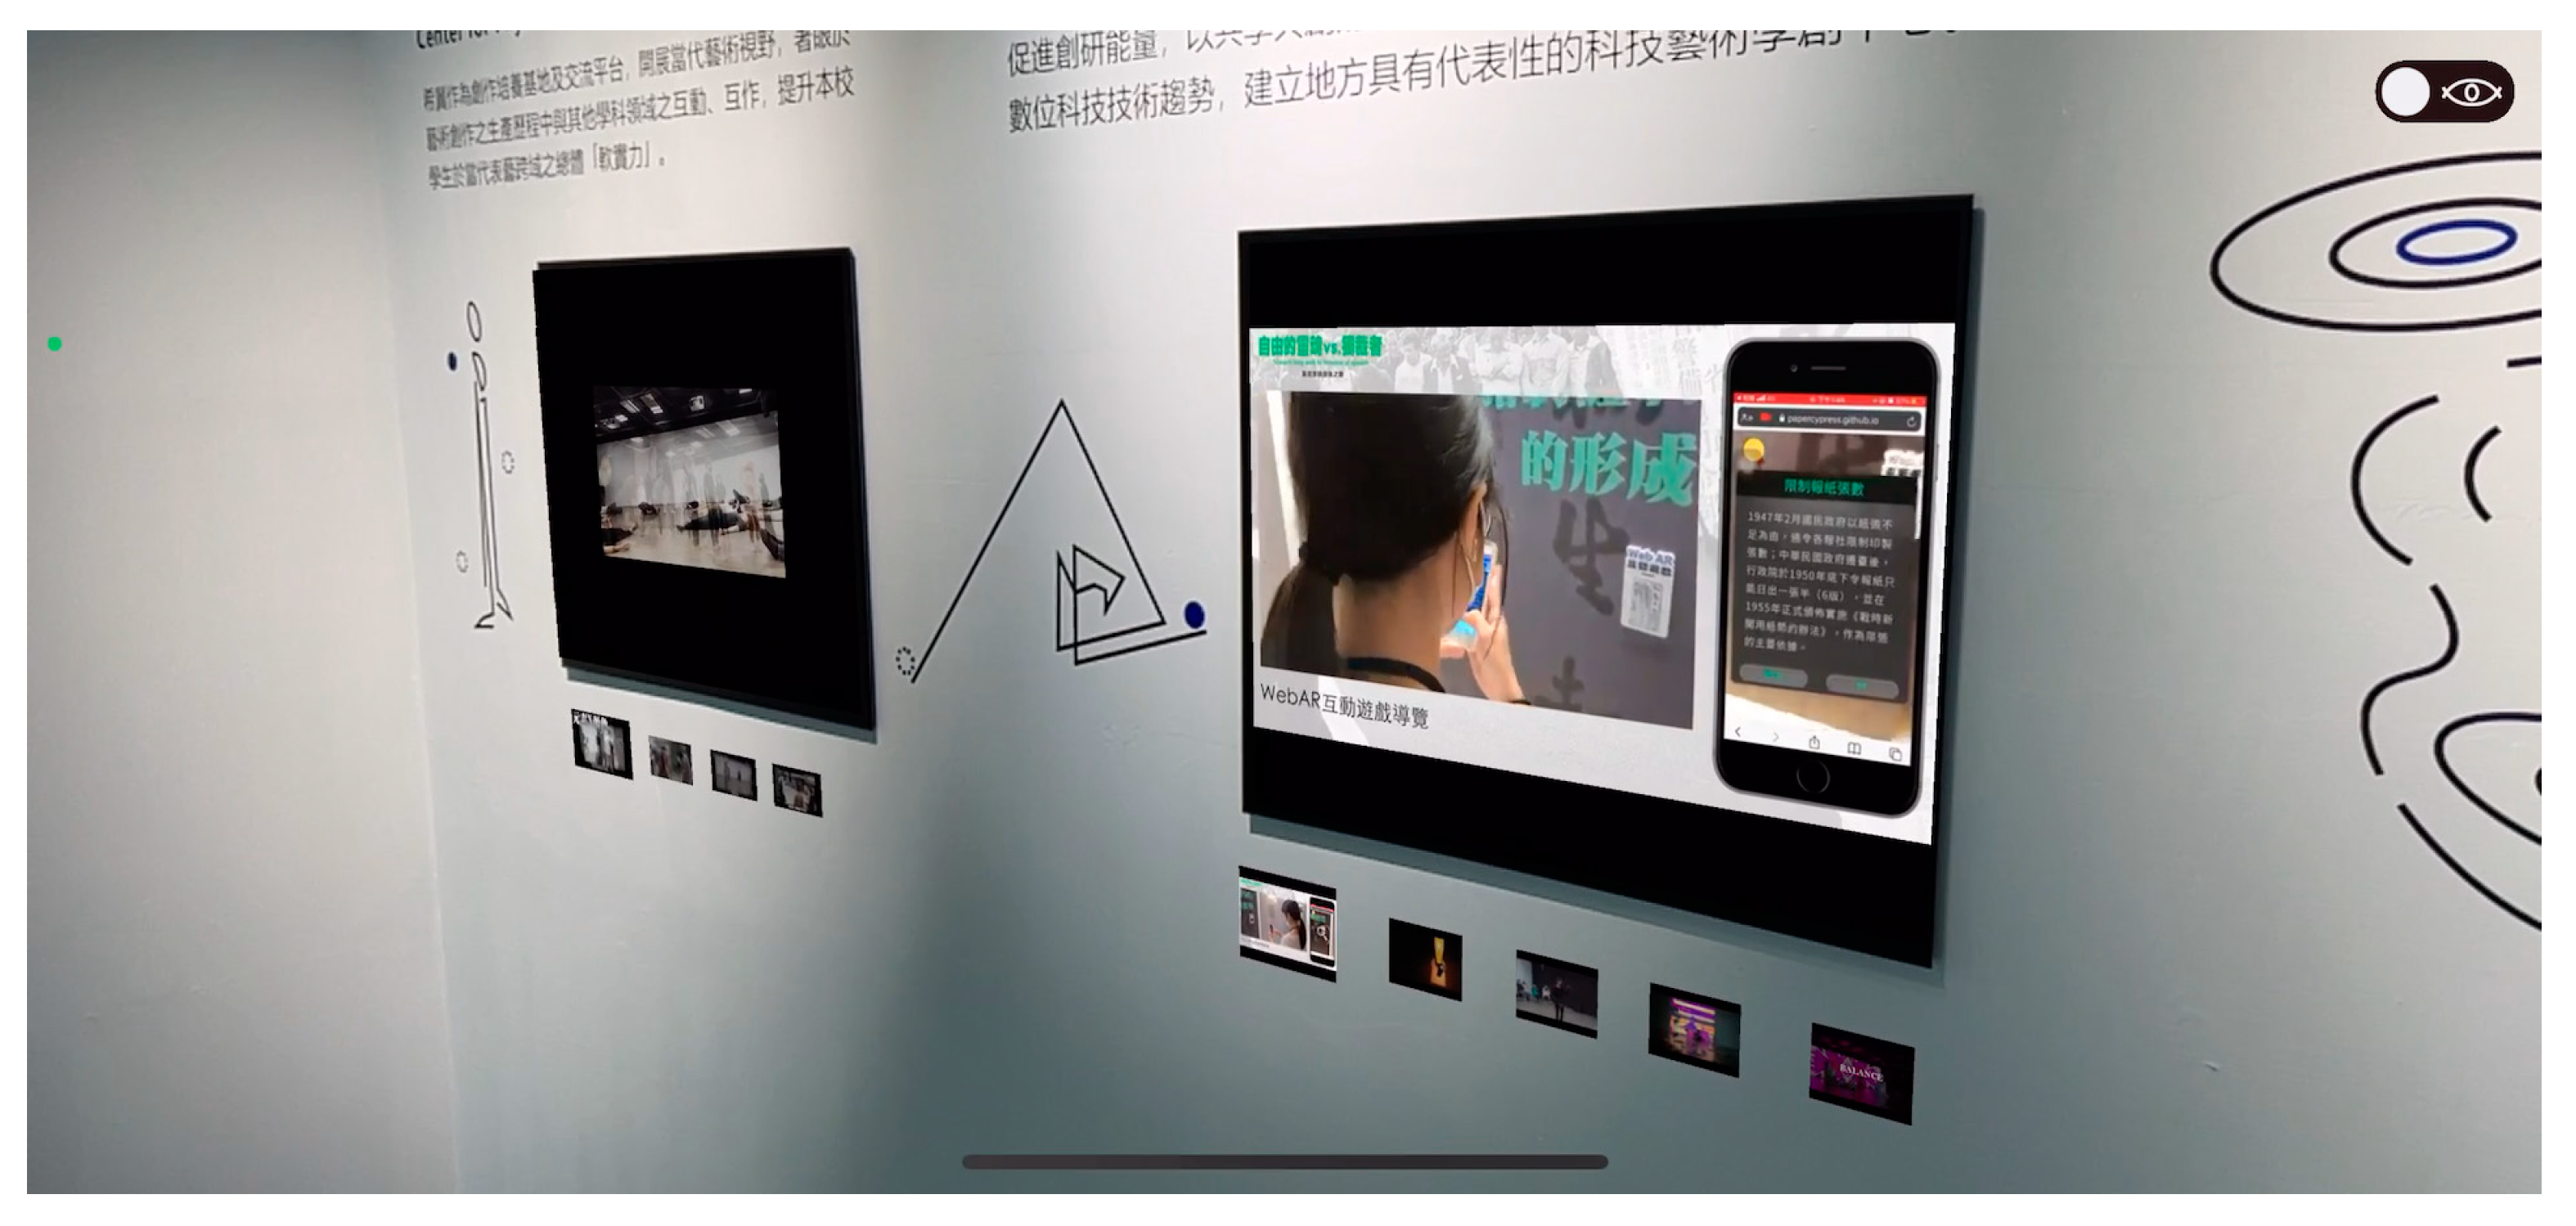
In this mode, visitors scanned the frames hung on the walls using the AR lens to view the exhibition content (in this case, photos and videos of the achievements of each center). The videos were all uploaded to YouTube and streamed to save on storage space. Visitors could also select from among a series of videos, which achieved a simple interactive effect (Figure 4).
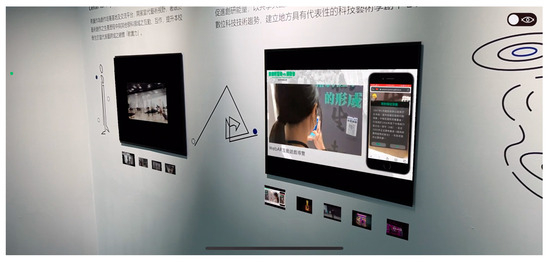
Figure 4.
AR video content positioned within physical frames (The Chinese text displayed in the image are introductions to the two centers.).
- (2)
- Message mode
In message mode, visitors could leave text messages at any location within the exhibition space and see them on the screen of their mobile devices (see Figure 5). These messages were also uploaded to Google Sheets. When visitors used this mode, it would take about 2~3 s for the messages left by previous visitors to load onto their screens. All of the messages were kept until the end of the exhibition, becoming part of the exhibit. Although some messages might have appeared peculiar, such as someone leaving comments like “Hehehe”, “Haha”, “three”, “YA”, “Good morning”, and “Go National Taiwan University of Arts”, which had no particular significance to the exhibit itself, they reflected the diverse and genuine reactions of visitors interacting with the exhibition content through our AR system. This diversity highlights the platform’s ability to inspire a broad range of expressions and interactions from visitors, further emphasizing the potential of AR technology to enhance the exhibition experience and visitor engagement. Aside from achieving the purpose of participatory exhibition viewing, this function allowed visitors to become immersed in a 3D sea of messages.
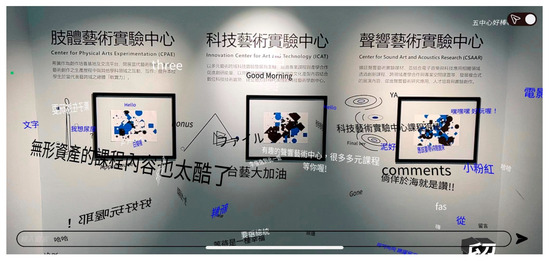
Figure 5.
Messages left by visitors in the exhibition space (The Chinese characters displayed on the wall in the image are introductions to the three centers, while the floating Chinese characters represent messages left by visitors at the exhibition.).
3.1.3. Uploading User Behavior Data to the Cloud
The app asked users for their consent to collect their behavior data. The coordinates of the visitors’ smartphones in the 3D space were collected every three seconds. This information, along with the time, smartphone model, and operating system, was used to calculate the distance between two consecutive three-dimensional coordinates, which, when summed, represented the total distance traveled. The sum of all the timestamps represents the total time spent. These data were synchronized and automatically uploaded to Google Sheets. The system also automatically converted the path coordinates into a 3D path diagram for each visitor to facilitate data interpretation.
3.2. Experimental Design
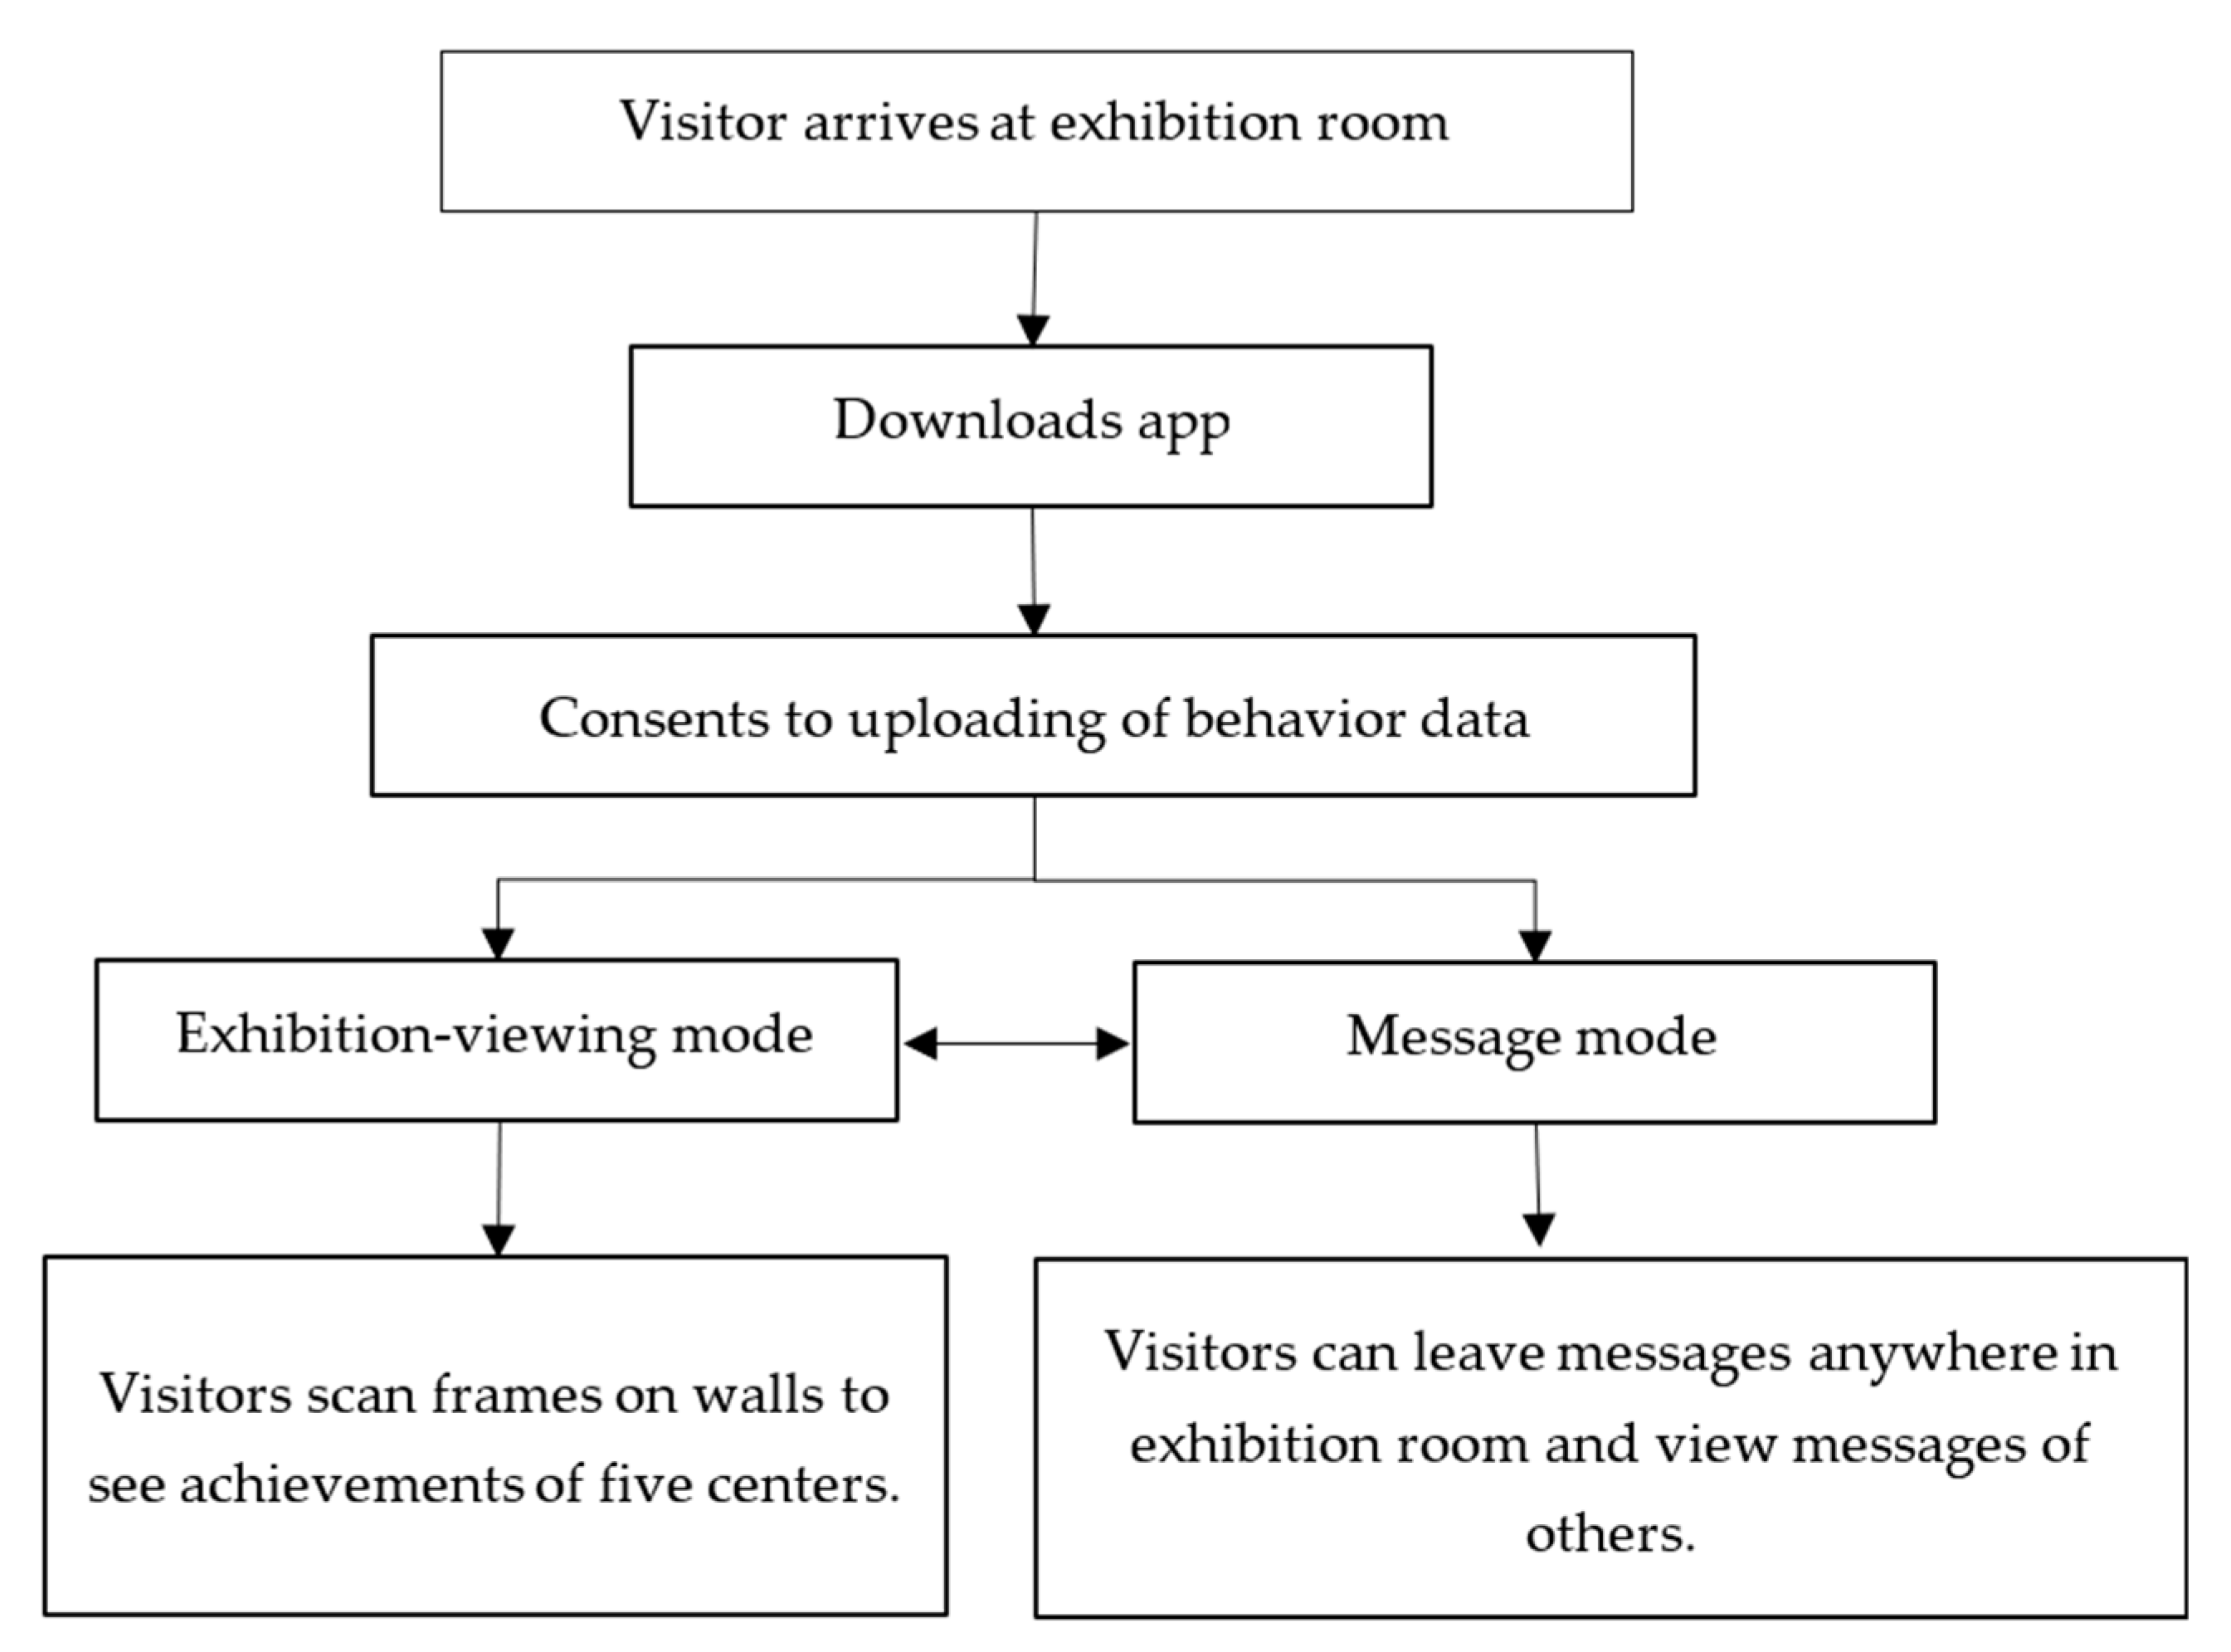
For the sake of convenience, the researchers performed experiments directly in the exhibition space. A within-subjects design was adopted, and the visitors could choose between the exhibition-viewing and message modes. The experiment process is shown in Figure 6. Based on the experiment duration coordinated with the exhibition period (28 October 2022, to 30 December 2022), all the participants who attended the exhibition were from the general public, deciding on their own whether to use the app or not. Consequently, convenience sampling was employed. The participants scanned the QR code on the guide brochure, promotional materials, or the website of the exhibition to download our app and operate it as instructed by the system. No staff members provided any aid. With their consent, the app collected visitors’ coordinates, usage duration, smartphone model, and operating system using anonymous random encoding. Outliers that were significantly deviated due to potential mobile hardware factors or environmental factors causing unstable AR positioning quality were excluded. In the exhibition-viewing mode, out of the 225 data points collected, 93 were identified as outliers. In the message mode, out of the 188 data points collected, 58 were identified as outliers. The final usable samples consisted of 132 visitors in the exhibition-viewing mode and 130 visitors in the message mode. To better understand the differences between the behaviors of visitors using the two modes, we removed samples in which only one mode was used and invalid samples where severe AR positioning shifts occurred due to personal hardware issues or other external factors. This resulted in 61 usable samples, in which 8 participants used Android devices and 53 participants used iOS devices.
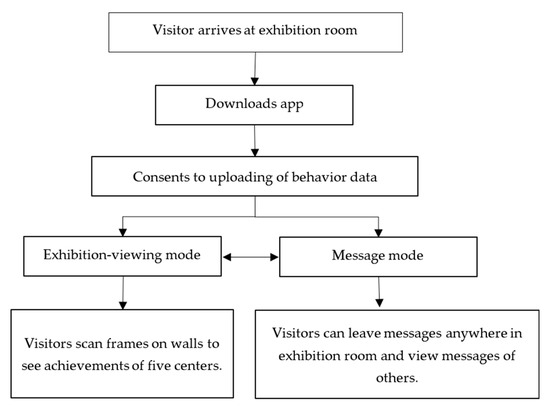
Figure 6.
Experiment process.
3.3. Hypotheses
Building on the exploration of AR technology’s impact on participatory exhibition viewing, the following hypotheses are proposed:
Hypotheses 1 (H1).
The distances and durations covered in the exhibition-viewing and message modes showed significant differences.
Hypotheses 2 (H2).
The movement paths of visitors will show significant differences between the exhibition-viewing mode and message mode.
These hypotheses are designed to explore both the quantitative and qualitative impacts of AR technology on visitor engagement and navigation within the exhibition environment, providing a comprehensive framework for assessing the technology’s effectiveness in facilitating a more interactive and immersive exhibition experience.
4. Data Analysis
Following H1 proposed in Section 3.3, this section will conduct an in-depth analysis of the collected data to assess the impact of different exhibition viewing modes—exhibition-viewing mode and message mode—on visitor behavior. The exhibition-viewing duration (seconds) and distance (meters) data were imported into SPSS for analysis using dependent-sample t-tests. The results presented in Table 1 and Table 2 were based on the hypotheses. During our analysis, we observed significant standard deviations in the data presented in Table 1, indicating a considerable variety in participant behavior. This variability likely stems from the individual reactions to the AR exhibition experience, reflecting the diversity in how people engage with AR technology.

Table 1.
The distance and duration sample statistics.
Table 2.
Summary table of t tests for visitor distances and durations (N = 61).
Despite observing large standard deviations, we also reported small standard errors of the mean (SEM), suggesting that our average value calculations are statistically reliable. A small SEM indicates that, despite differences in individual experiences, our estimation of average behaviors is precise. Therefore, while individual participants’ behaviors show variability, our study results indeed capture a general trend across the participant group.
4.1. Distance Analysis
The test statistic of distance was t(61) = 0.361, p > 0.05. That is, at the α = 0.05 level of significance, the distances covered in exhibition-viewing and message modes showed no significant differences. The “viewing distance” and “message distance” data reflect how far participants were from artworks when viewing or messaging, respectively. The large standard deviations for both “viewing distance” and especially “message distance” indicate a wide variation in participant behavior. This variability might suggest that while some participants chose to interact with, or message about, artworks from closer distances, others did so from much farther away, leading to a wide range of recorded distances.
The large standard deviation in “message distance” could raise questions about data reliability, as it suggests participant behavior varied widely. However, the standard error of the mean helps address these concerns by indicating how far the sample mean (of either “viewing” or “message” distances) is likely to be from the true population mean. Smaller standard errors suggest the sample means are a reliable estimate of the population means, despite the wide variability among individual measurements.
4.2. Duration Analysis
The test statistic of duration was t(61) = 0.286, p > 0.05. That is, at the α = 0.05 level of significance, the durations of use in the exhibition-viewing and message modes showed no significant differences. The mean durations for viewing and messaging activities were 71.895 s and 86.575 s, respectively. This suggests that, on average, participants were more engaged or took longer when it came to leaving messages compared to simply viewing the artworks. The slightly longer duration for messaging could indicate a deeper level of engagement, as participants may have taken additional time to compose their thoughts or interact with the messaging interface. Both activities exhibited significant variability among participants, as indicated by the standard deviations (72.9296 s for viewing and 92.5035 s for messaging). This wide range underscores the personalized nature of the exhibition experience, with some participants choosing to engage more superficially, while others dove deeper into both viewing and messaging.
Despite the broad variability, the small standard errors of the mean (9.3377 s for viewing and 11.8439 s for messaging) highlight the statistical reliability of these averages. This implies that our calculated mean values accurately represent the central tendencies of how participants are spending their time, providing confidence in these figures despite the individual differences.
4.3. Path Analysis
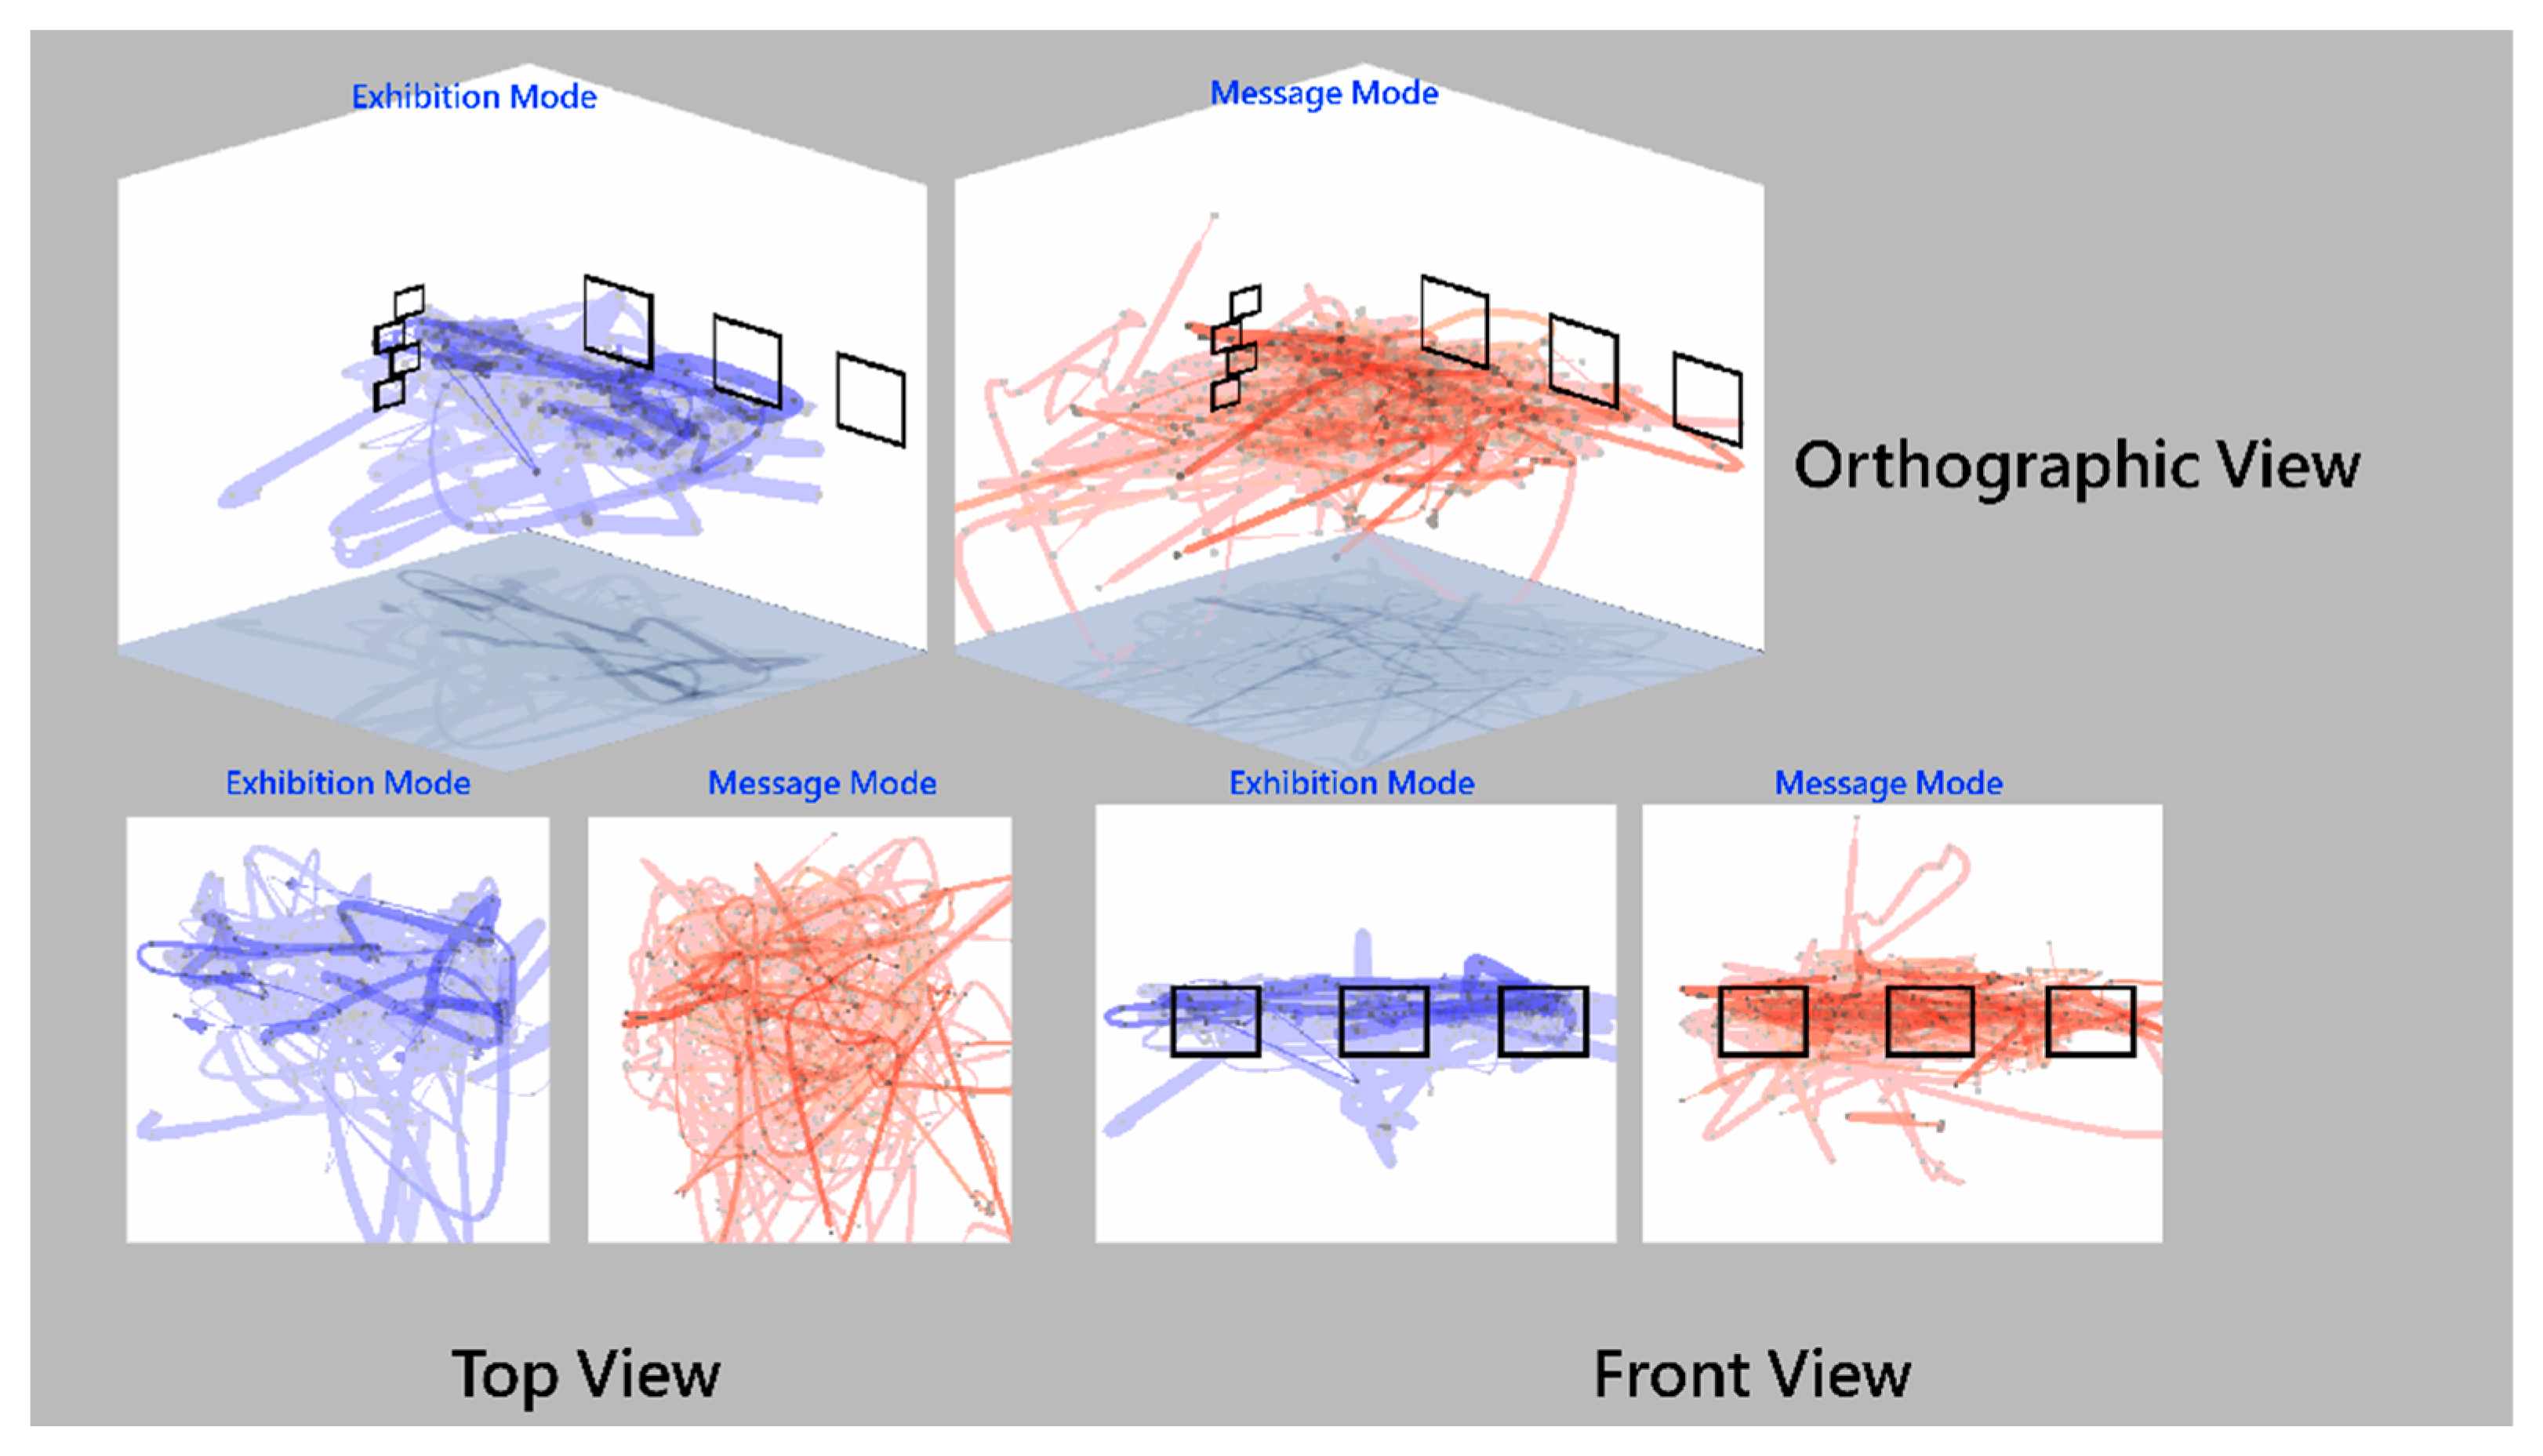
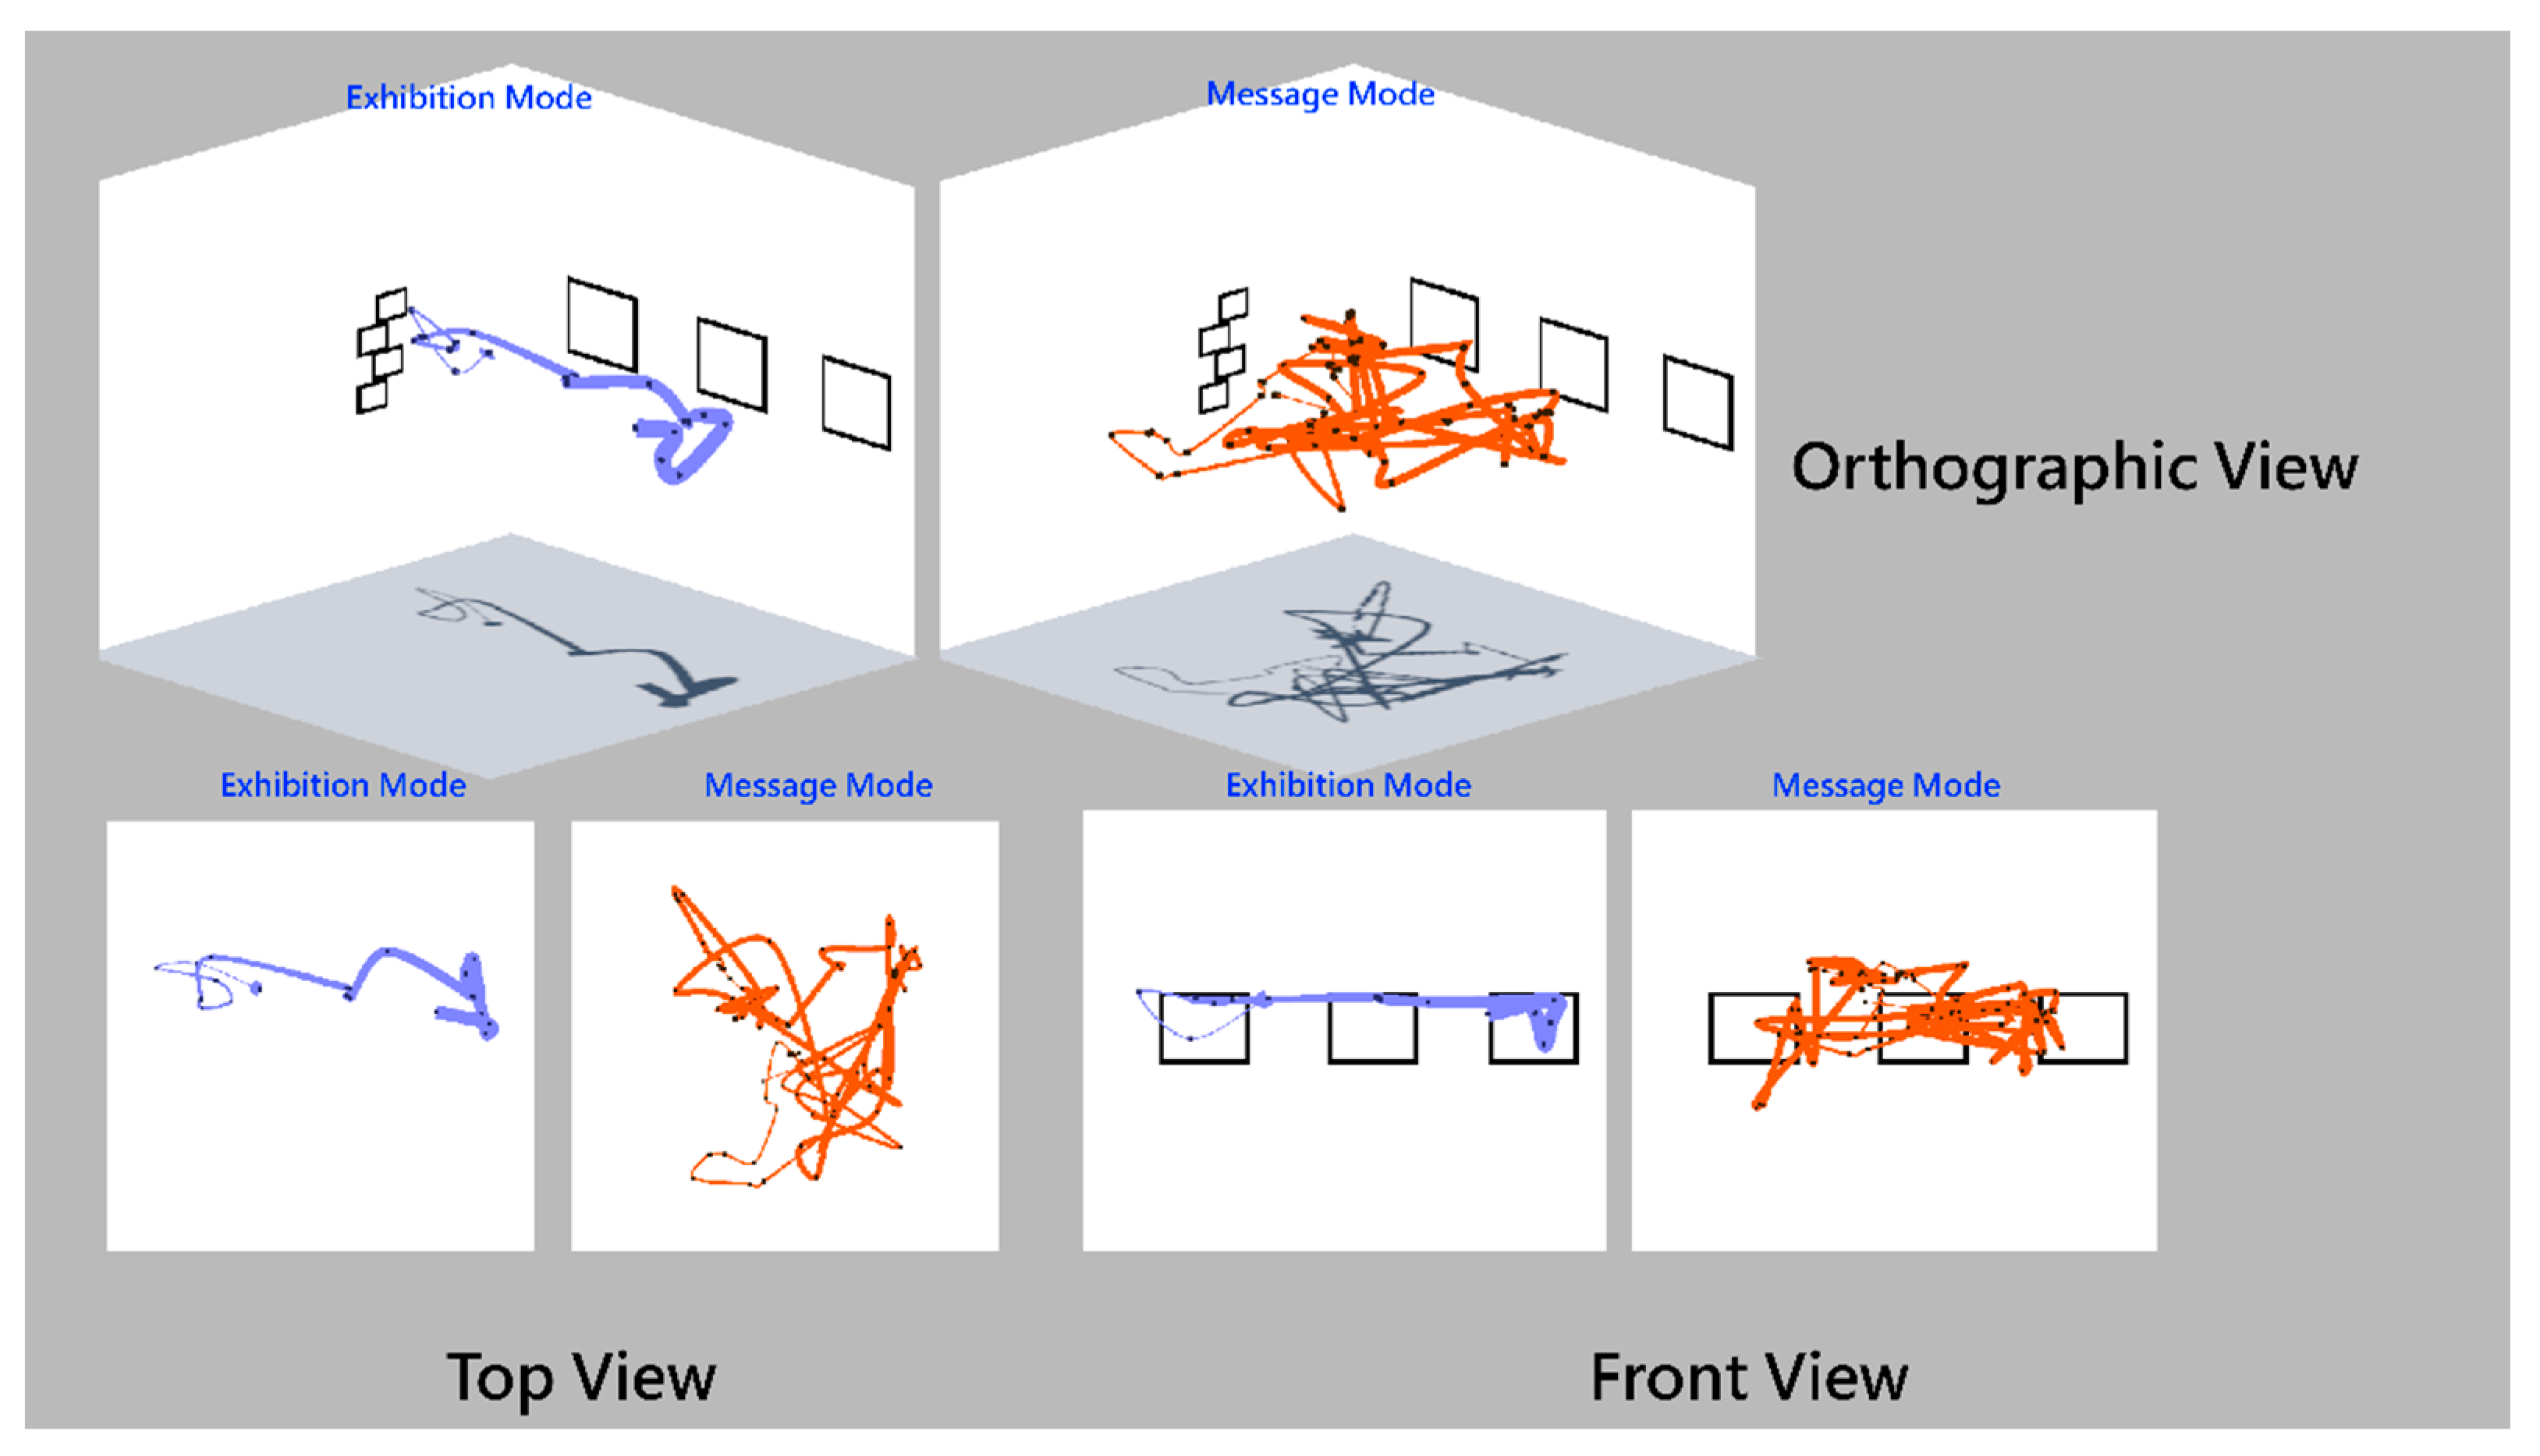
Following H2 proposed in Section 3.3, the path analysis was performed by collecting the 3D coordinates of visitors’ smartphones as they moved within the exhibition space. These coordinates were collected every three seconds and then plotted into three-dimensional path diagrams using a behavior analysis system developed by our team, illustrating the movement trajectory for each user. Additionally, all paths could be compiled into a single path distribution diagram to understand the overall behavior of users during the exhibition. The analysis aimed to visualize the paths taken by visitors, distinguishing between the exhibition-viewing mode and the message mode. We interpreted the movement distributions in these modes through path diagrams to understand the variations in visitor movement behaviors. The colors in Figure 7 represent all visitors’ paths, used to depict the distribution of movement within the exhibition space. The intention was to illustrate the diversity in the routes taken by individuals. The observations carried out from these lines regarding the overlapping densities refer to the observed path densities. We intended to highlight the variations in visitor movement, particularly focusing on areas of high concentration versus those less traveled. The similarity in the shapes and distribution initially observed is indicative of the common routes taken by many visitors, while the distinct outliers represent unique exploratory behaviors. We conducted preliminary tests to assess the accuracy of the AR positioning system, considering the potential variance introduced by the use of different smartphone models and operating systems by visitors. These tests aimed to ensure the reliability of the data collected for path analysis. Points that significantly deviated due to potential errors in AR positioning or hardware inconsistencies were reviewed. Specifically, outliers were identified based on their physical impossibility; any visitor movement paths observed from the path diagrams that were located outside the feasible areas of the exhibition space—places inaccessible to visitors—were considered anomalies and were excluded from the final analysis. The distribution of the paths taken by the visitors shows a wider range for visitors in the message mode. We speculate that this is because in the exhibition-viewing mode, the range of viewing content was set and more concentrated, whereas in the message mode, there were no limitations, and this resulted in a wider range of movement. In the exhibition-viewing mode, the path heights and movement ranges were easier to predict. With the path of one visitor as an example (Figure 8), we can see that there are more nodes in front of the frames, meaning that the visitor stopped in front of the frames for passive AR object viewing. In contrast, the nodes in the message mode were more scattered, showing the visitor was viewing other messages and looking for somewhere to leave a message. As a result, the movement paths were more difficult to predict.

Figure 7.
Path distributions of all visitors (Blue lines represent the paths of visitors in Exhibition mode, while red lines represent the paths of visitors in Message mode.).
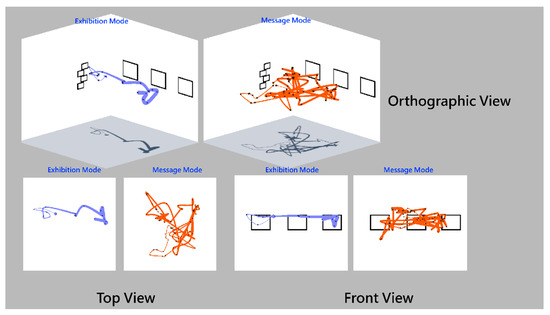
Figure 8.
Paths taken by one visitor (Blue lines represent the paths of visitors in Exhibition mode, while red lines represent the paths of visitors in Message mode.).
5. Discussion
This study aimed to explore the behavioral analysis of audience engagement in both active participation and passive viewing, hence employing the two exhibition-viewing-mode experimental-design methods for analysis. Previous research indicated no significant differences in path and duration between the “game mode” and the “free mode”, with gamification serving a guiding role in regular viewing. Our study extended this experimental design method to analyze behavioral differences between exhibition-viewing and messaging modes.
In the process of benchmarking, we found that, compared to traditional single-AR exhibition methods, our participatory exhibition-viewing system has significant advantages in enhancing audience engagement. Notably, our system not only provides richer interactive elements but also allows audiences to leave their personal marks within the exhibition, which is not achievable with traditional methods.
Analysis results showed that there were no significant differences in viewing duration or path length, whether in passive or active participation modes. This indicates that without restricting the audience’s AR viewing methods and sequences, there are no significant differences in behavior between passive and active participation. However, path analysis revealed that the messaging mode allowed for a much broader range of movement, indicating a higher degree of freedom for the audience during the exhibition experience.
In summary, our study demonstrates that compared to traditional AR exhibition methods, our participatory exhibition-viewing system significantly enhances audience interaction and provides technical convenience. These findings not only provide new insights into the application of AR technology in the field of exhibitions but also lay a foundation for future in-depth research in this area.
In terms of research limitations, this study was designed and conducted based on the actual conditions of the exhibition venue and did not explore the use of point cloud technology for AR positioning in larger venues. Some participants used only one mode due to personal viewing habits, interests, or technical challenges in adapting to the app, leading to the exclusion of such samples. Without specifically arranging for participants to use certain types of mobile devices, and aiming to allow more visitors to experience AR content, it was challenging to ensure optimal AR viewing quality for all due to variances in smartphone hardware, operating system versions, and environmental factors like lighting or obscured recognition targets. This might affect the continued use and promotion of the AR guide system, a limitation not addressed in this study. Given the varied formats of exhibitions, our findings offer insights into other exhibitions and studies employing similar methods but cannot be extrapolated to all forms of AR exhibition-viewing experiences.
6. Conclusions
This study has achieved significant innovations by applying AR technology in the realm of exhibition viewing, particularly in participatory interaction. Through the development of the AR application “Wander Into Our Sea”, we have not only enriched the experience of the 2022 Greater Taipei Biennial of Contemporary Art but also explored the potential of AR technology in enhancing the interactivity of exhibitions. Our findings indicate that despite not limiting the ways and sequences in which AR content was viewed, there was no significant difference in the duration of viewing or distance covered between the exhibition-viewing mode and message mode. This suggests that the introduction of AR technology did not fundamentally alter the basic patterns of audience behavior in exhibitions. However, the more dispersed paths in the message mode demonstrate the higher degree of freedom enjoyed by audiences in participatory experiences, highlighting the importance of participatory AR experiences in enhancing the interaction and engagement within exhibition spaces.
Looking to the future, the potential for AR technology in cultural and educational venues, such as museums and exhibitions, is immense. Our study lays a solid foundation for further exploration in this field. Future work could focus on integrating richer interactive elements, such as audio or tactile feedback, to further enrich the sensory experiences of audiences. Additionally, combining AR technology with emerging technologies like virtual reality (VR) or the Internet of Things (IoT) could open new possibilities for creating more immersive and interactive exhibition experiences. However, we recognize that ensuring optimal AR viewing experiences for all visitors remains a challenge due to variations in smartphone hardware and environmental factors. Future research will need to consider these variables in design to ensure a seamless and inclusive experience for all visitors.
Our study highlights the immense potential of AR technology as a tool in enhancing exhibition participation. It provides a model for future research and development in the field of AR technology, aimed at bringing richer, more interactive, and educational experiences to exhibition visitors.
Author Contributions
Conceptualization, C.-I.L.; methodology, C.-I.L.; software, C.-I.L., B.C. and Y.-H.P.; validation, C.-I.L., B.C. and Y.-H.P.; formal analysis, C.-I.L.; investigation, Y.-H.P.; resources, C.-I.L.; data curation, C.-I.L.; writing—original draft preparation, C.-I.L.; writing—review and editing, C.-I.L.; visualization, Y.-H.P.; supervision, C.-I.L.; project administration, C.-I.L.; funding acquisition, C.-I.L. All authors have read and agreed to the published version of the manuscript.
Funding
This research was funded by the National Science and Technology Council of Taiwan (NTSC), grant number NTSC 111-2410-H-144-006 and NTSC 112-2410-H-144-004.
Institutional Review Board Statement
All subjects gave their informed consent for inclusion before they participated in the study. The study was conducted in accordance with the Declaration of Helsinki, and the protocol was approved by The Research Ethics Committee of National Taiwan University (protocol code: 202205ES129 and date of approval: 1 July 2022).
Informed Consent Statement
Informed consent was obtained from all subjects involved in the study.
Data Availability Statement
Publicly available datasets were analyzed in this study. This data can be found here: https://drive.google.com/drive/folders/1QWFJcCNTjopr-b5xP1Z4nqVNbgBuzXZ8?usp=sharing (accessed on 7 April 2024).
Acknowledgments
This research was supported in part by the National Science and Technology Council of Taiwan, National Taiwan University of Arts, Yo-Chang Art Museum, and NTUA Experimental Game Lab.
Conflicts of Interest
The authors declare no conflicts of interest. The funders had no role in the design of the study; in the collection, analyses, or interpretation of data; in the writing of the manuscript; or in the decision to publish the results.
Appendix A
Official website of the Log Into Our Sea exhibition: https://museum.ntua.edu.tw/c01.asp?kk=3102 (accessed on 10 August 2023).
Appendix B
Video of the process of AR navigation: https://youtu.be/YZ6enXk1ZrE (accessed on 10 August 2023).
References
- Damala, A.; Cubaud, P.; Bationo, A.; Houlier, P.; Marchal, I. Bridging the gap between the digital and the physical: Design and evaluation of a mobile augmented reality guide for the museum visit. In Proceedings of the DIMEA ’08: 3rd International Conference on Digital Interactive Media in Entertainment and Arts, Athens, Greece, 10–12 September 2008; pp. 120–127. [Google Scholar]
- Jafari, A.; Taheri, B.; Lehn, D.v. Cultural consumption, interactive sociality, and the museum. J. Mark. Manag. 2013, 29, 1729–1752. [Google Scholar] [CrossRef]
- Diaz, E.M. Inertial Pocket Navigation System: Unaided 3D Positioning. Sensors 2015, 15, 9156–9178. [Google Scholar] [CrossRef] [PubMed]
- Saponas, T.S.; Lester, J.; Hartung, C.; Kohno, T. Devices That Tell on You: The Nike+iPod Sport Kit; University of Washington: Seattle, WA, USA, 2006. [Google Scholar]
- Dias, M.; Jorge, J.; Carvalho, J.; Santos, P.; Luzio, J. Usability evaluation of tangible user interfaces for augmented reality. In Proceedings of the 2003 IEEE International Augmented Reality Toolkit Workshop, Tokyo, Japan, 7 October 2003. [Google Scholar]
- Lee, C.-I.; Xiao, F.-R.; Hsu, Y.-W. Using Augmented Reality Technology to Construct a Venue Navigation and Spatial Behavior Analysis System. In Proceedings of the 5th International Augmented and Virtual Reality Conference, Munich, Germany, 12–14 June 2019; pp. 161–170. [Google Scholar]
- Lee, C.-I.; Xiao, F.-R.; Hsu, Y.-W. AR Book-Finding Behavior of Users in Library Venue. Appl. Sci. 2020, 10, 7349. [Google Scholar] [CrossRef]
- Lee, C.-I. Benefit Analysis of Gamified Augmented Reality Navigation System. Appl. Sci. 2022, 12, 2969. [Google Scholar] [CrossRef]
- Clark, M.B.A.; Lee, G. A Survey of Augmented Reality. In Foundations and Trends® in Human–Computer Interaction; Now Publishers Inc.: Hanover, MA, USA, 2015; Volume 8, pp. 73–272. [Google Scholar] [CrossRef]
- Callaway, C.; Stock, O.; Dekoven, E. Experiments with Mobile Drama in an Instrumented Museum for Inducing Conversation in Small Groups. ACM Trans. Interact. Intell. Syst. 2014, 4, 1–39. [Google Scholar] [CrossRef]
- Rey, F.B.; Casado-Neira, D. Participation and Technology: Perception and Public Expectations about the Use of ICTs in Museums. Procedia Technol. 2013, 9, 697–704. [Google Scholar] [CrossRef]
- Jarusriboonchai, P.; Lundgren, S.; Olsson, T.; Fischer, J.; Memarovic, N.; Reeves, S.; Woźniak, P.; Torgersson, O. Personal or social?: Designing mobile interactions for co-located interaction. In Proceedings of the 8th Nordic Conference on Human-Computer Interaction, Helsinki, Finland, 26–30 October 2014. [Google Scholar]
- Billinghurs, M.; Belcher, D.; Gupta, A.; Kiyokawa, K. Communication behaviors in colocated collaborative AR interfaces. Int. J. Hum.–Comput. Interact. 2009, 16, 395–423. [Google Scholar] [CrossRef]
- McCall, R.; Wetzel, R.; Löschner, J.; Braun, A.-K. Using presence to evaluate an augmented reality location aware game. Pers. Ubiquitous Comput. 2011, 15, 25–35. [Google Scholar] [CrossRef]
- Drab, S.; Artner, N. Motion Detection as Interaction Technique for Games & Applications on Mobile Devices. In Proceedings of the Interaction Devices (PERMID 2005) Workshop, Munich, Germany, 11 May 2005. [Google Scholar]
- Cervenak, R.; Masek, P. ARKit as indoor positioning system. In Proceedings of the 2019 11th International Congress on Ultra Modern Telecommunications and Control Systems and Workshops (ICUMT), Dublin, Ireland, 28–30 October 2019. [Google Scholar]
- Lu, F.; Zhou, H.; Guo, L.; Chen, J.; Pei, L. An ARCore-Based Augmented Reality Campus Navigation System. Appl. Sci. 2021, 11, 7515. [Google Scholar] [CrossRef]
- Mourtzis, D.; Angelopoulos, J.; Panopoulos, N. Unmanned Aerial Vehicle (UAV) path planning and control assisted by Augmented Reality (AR): The case of indoor drones. Int. J. Prod. Res. 2023, 62, 3361–3382. [Google Scholar] [CrossRef]
- Oufqir, Z.; Abderrahmani, A.E.; Satori, K. ARKit and ARCore in serve to augmented reality. In Proceedings of the 2020 International Conference on Intelligent Systems and Computer Vision (ISCV), Fez, Morocco, 9–11 June 2020. [Google Scholar]
- Rajpurohit, A.M.; Kumar, P.; Singh, D.; Kumar, R.R. A Review on Visual Positioning System. In Proceedings of the Kilby 100: 7th International Joint Conference on Computing Sciences, Phagwara, India, 5 May 2023. [Google Scholar]
- APPIKR LABS. Visual Positioning System: All You Need To Know. Available online: https://www.appikr.com/blog/visual-positioning-system/ (accessed on 4 April 2024).
- Li, A. Google laying the groundwork for ‘persistent’ AR layers over the real world. 9to5Google, 12 September 2019. [Google Scholar]
- Tsai, H.-Y.; Kuwahara, Y.; Ieiri, Y.; Hishiyama, R. Vision-Based Indoor Positioning (VBIP)—An Indoor AR Navigation System with a Virtual Tour Guide. In Proceedings of the 25th International Conference on Collaboration and Technology, Kyoto, Japan, 4–6 September 2019. [Google Scholar]
- Vuforia. Area Targets. Available online: https://library.vuforia.com/features/environments/area-targets.html (accessed on 4 April 2024).

Disclaimer/Publisher’s Note: The statements, opinions and data contained in all publications are solely those of the individual author(s) and contributor(s) and not of MDPI and/or the editor(s). MDPI and/or the editor(s) disclaim responsibility for any injury to people or property resulting from any ideas, methods, instructions or products referred to in the content. |
© 2024 by the authors. Licensee MDPI, Basel, Switzerland. This article is an open access article distributed under the terms and conditions of the Creative Commons Attribution (CC BY) license (https://creativecommons.org/licenses/by/4.0/).