Article

A Method for Measuring Spatial Information of Area Maps Considering the Diversity of Node–Edge and Gestalt Principles

1
Department of Geo-Informatics, Central South University, Changsha 410083, China
2
Key Laboratory of Spatio-Temporal Information and Intelligent Services, Ministry of Natural Resources, Changsha 410083, China
*
Authors to whom correspondence should be addressed.
Appl. Sci. 2024, 14(9), 3764; https://doi.org/10.3390/app14093764
Submission received: 9 April 2024 / Revised: 20 April 2024 / Accepted: 26 April 2024 / Published: 28 April 2024

Abstract

:
Existing methods for measuring the spatial information of area maps fail to take into account the diversity of adjacency relations and the heterogeneity of adjacency distances among area objects, resulting in insufficient measurement information. This article proposes a method for measuring area map information that considers the diversity of the node–edge and Gestalt principles. Firstly, this method utilizes the adjacency relations between the Voronoi diagram of area objects to construct an adjacency graph that characterizes the spatial distribution of area objects in area maps. This adjacency graph serves as the information representation of area maps. Secondly, the method selects four characteristic indicators, namely geometric information, node degree, adjacency distance, and adjacency strength, to represent the diversity of nodes and edges in the graph that affect spatial information. Finally, nodes in the adjacency graph are taken as the basic units, and the spatial information of area maps is comprehensively calculated by integrating the four characteristics that represent spatial information. To verify the validity and rationality of the proposed method, a dataset of continuously simplified area maps and a dataset of artificially simulated degrees of randomness were designed to evaluate the performance of the existing method and the method proposed in this paper. The results indicate that the correlation between the measurement results obtained by the method proposed in this paper and the degree of disorder is as high as 0.94, outperforming the existing representative methods. Additionally, the correlation between the measurement results of this method and the degree of simplification reaches 1, indicating that the variation range of the measured values is more consistent with the cognitive assumptions based on artificial simulations compared to the existing methods. The experimental results show that the method proposed in this paper is an effective metric approach for representing spatial information in area maps.

1. Introduction

The objective measurement of spatial information in maps is an important branch of cartographic theoretical research, which helps map users and cartographers gain a more general understanding of map content, and a more detailed understanding of the richness of map data and the spatial distribution of map information [1,2,3]. The measurement of the spatial information content in maps is a crucial issue for effectively perceiving and understanding map data, playing a fundamental role in cognitive understanding in scientific research related to cartography [4]. The study of spatial information in maps encompasses both qualitative and quantitative research aspects. Qualitative research primarily focuses on evaluating the quality of data, while quantitative research focuses on the amount of information contained in the data. These two aspects represent two dimensions of map data description [5].
The quantitative study of spatial information in maps encompasses various aspects such as the definition, expression, and measurement of information, constituting a comprehensive and systematic research project. Due to the involvement of various disciplinary systems and specific applications in the measurement of semantic information of maps [6,7,8,9], it is currently difficult to establish an effective semantic information measurement system that is suitable for multiple application needs. Therefore, the scope of this study temporarily excludes the measurement of semantic information of maps and focuses instead on spatial information that is commonly considered by the majority of map users. Spatial information in map data refers to the information expressed by the geometric characteristics of map objects and the spatial distribution characteristics among map objects [10]. Based on previous research, this study further defines spatial information in map data as the degree of diversity represented by the geometric characteristics of map objects and the degree of spatial distribution diversity characterized by the diverse spatial distribution characteristics among map objects. The spatial information of maps observable by users is jointly composed of the interaction between these two types of information.
Currently, most research focuses on a specific aspect of spatial information in maps, such as geometric information [11,12,13], spatial distribution information [14,15], and thematic attribute information [8,9]. There is relatively less quantitative research on systematic spatial information in maps [5,16,17]. However, imagining the distribution patterns of map objects while ignoring the geometric shapes of objects requires high-level, abstract, and generalizing abilities. As a result, map users and cartographers typically focus on the overall and systematic aspects of maps. Therefore, a comprehensive measurement of spatial information content in maps is necessary and important. In the current era of the continuous generation, accumulation, and updating of map data, the measurement of spatial information content in maps will greatly reduce the high costs and subjectivity associated with expert experience and manual discrimination, thereby enhancing the utilization efficiency of map data.
Currently, only Li et al. and Liu et al. have proposed systematic methods for the quantitative measurement of spatial information content in maps [16,17]. However, their methods fail to effectively consider the diversity of adjacency relationships and the heterogeneity of distance relationships among area objects, which affect the accuracy and objectivity of the measurement results of map information. Therefore, it is necessary to conduct further research on the systematic measurement of spatial information content in maps and propose a more theoretically comprehensive measurement method.
Based on the above analysis, this paper focuses on area maps as the research target and analyzes the essence of geometric information and spatial distribution information of area objects, as well as the factors that influence the measurement of geometric information, starting from two types of information: geometric information and spatial distribution information. An objective method is proposed to quantitatively measure the spatial information content of area maps, enabling the quantitative expression of spatial information content in area maps. This method provides attribute information on the richness for related cartographic research such as spatial analysis based on maps [18], selection of map data [19], and cartographic generalization [20,21].
The remainder of this paper is organized as follows: Section 2 discusses the related work that is the focus of this study, Section 3 presents the proposed method, Section 4 describes the experimental design and results, Section 5 discusses the findings, and Section 6 concludes the paper.

2. Related Work

In reviewing the existing research achievements, only two scholars, Li and Liu, have proposed comprehensive studies that simultaneously consider the geometric information of area objects and the spatial information of area maps [16,17]. This paper will delve into the two types of spatial information in area maps, elaborate on the relevant existing research work related to this study, and analyze the existing shortcoming in comprehensive measurement methods.

2.1. Geometric Information Content Measurement of Area Objects

The geometric morphological characteristics of area objects are the main source of geometric information. Scholars have proposed a series of algorithms for measuring the geometric morphological information of area objects. In summary, the information content generated by the geometric morphology of area objects is related to the diversity of their geometric morphology. This diversity is determined by the degree of difference among the characteristics that represent the geometric morphology of area objects. The higher the degree of difference, the higher the degree of diversity in geometric morphology.
Some scholars measure the diversity of geometric information by considering the closeness of area objects to related simple shapes, thereby expressing the geometric information content. For example, Liu et al. measured the degree of diversity by considering the closeness of target objects to their convex hulls [17]. Basaraner et al. used the proximity between target objects and its equivalent rectangles as a metric [13]. Parent J et al. (2003) expressed the degree of diversity by considering the closeness of target objects to reference triangles and ellipses [22]. The shortcoming of such methods lies in the lack of a clear standard for the reference shape. The reference shapes for different area objects may vary significantly; therefore, the measure obtained through this comparison lacks a unified standard, resulting in the incomparability of the measured information content. At the same time, map data contains a large number of natural features, which differ significantly from rectangles and convex polygons with rectangular features. Therefore, they are not suitable as reference shapes for natural features. Finally, there are many artificial structures with rectangular or convex polygon features in map data, which will cause the measurement values of such methods to approach zero or be consistent when dealing with artificial structures, leading to a decrease in discrimination power.
Li et al. used the area proportion occupied by area objects on a map as a probability parameter to measure the geometric information content of the object [16]. This method has the advantages of simplicity and efficiency in calculation. However, a significant shortcoming is that it is susceptible to the limitations of the spatial scope of the map. For example, the comparison of spatial information between two maps is only valid within a fixed spatial scope, which restricts the application range of the spatial information content of the map.
The studies expressed geometric information content in the form of a single indicator. However, it is evident that a single indicator often only considers one aspect of geometric information content and fails to take into account more comprehensive characteristics. To address this issue, scholars have considered combining various features that influence the geometric information of area objects to form a multi-parameter measurement model that considers multiple geometric characteristics.
Chen and Sundaram employed two features, namely the global distance entropy of shape contours and the metric of shape randomness, to represent the global information of shapes, while using local angular entropy to characterize the local detail information of shapes [23]. They calculated the complexity of shape contours by decomposing them from global to local perspectives. Su et al. analyzed the overall complexity of shapes from three aspects: the complexity of shape boundaries, the solidity of convex hulls, and shape symmetry, comprehensively calculating the geometric information content of shapes [24].
Chen and Su et al. used a weighted linear combination of multiple parameters to express various indicators of information content. However, in both methods, the weight parameters were determined based on human experience, which increased the subjectivity of the information measurement model [23,24].
Considering the subjectivity and uncertainty of manually determining the weights between features, some scholars have proposed various regression models for measuring geometric information content from a data-driven perspective. For instance, Dai LC et al. considered 17 features such as angular Shannon entropy, mean difference between adjacent angles, length of the longest axis, and solidity of convex hulls when calculating graphical complexity [25]. They employed a regression analysis guided by human experience to construct a multiple linear regression equation for combining multiple features. Although this method considers numerous geometric features and comprehensively characterizes the complexity of area objects, it poses a new challenge. Some scalar features have variable ranges, such as the entropy of side lengths, increment of convex hulls, length of the longest axis, and the number of concave and convex nodes. Normalization based on the range of sample data often leads to information loss.
In summary, there are three major shortcomings in the existing methods for measuring the geometric information of area objects: the lack of a unified standard for calculating feature values, the dependence on subjective experience for determining feature weights during multi-feature combination, and the need for normalization due to inconsistent feature value scales, which can lead to information loss.

2.2. Spatial Distribution Information Content Measurement of Area Map

Spatial distribution information in area maps refers to the information represented by the spatial location, topological relationships, distance relationships, and other characteristics of area objects within the map space [4,26]. Existing methods extract spatial distribution relationships by constructing topological graph structures based on the centroids of area objects [14,15] or spatial adjacency graph structures based on the Voronoi diagram of area objects [16,17]. These graph structures are then used to measure the spatial distribution information of area maps. As area maps encompass both continuous and discrete areal objects, the approach of using Voronoi diagram tessellation to construct spatial adjacency graph structures is more widely applicable.
In existing studies, Li et al. have measured the spatial distribution information of area maps by using the adjacency degree of area objects and the difference in types of adjacent area objects as metrics [16]. Liu et al., on the other hand, have expressed the distance relationship between area objects through the size of their Voronoi diagram areas, and have expressed the spatial distribution relationship using the adjacency degree of area objects [17]. These metrics are then weighted and combined to comprehensively measure the spatial distribution relationship.
Li’s method considers the differences in types of area objects in their distribution patterns. However, in practical applications, there may be instances where all area objects belong to the same type, which limits the applicability of the information measurement model. Furthermore, this measurement model fails to consider the spatial configuration relationships between adjacent area objects and can only provide quantitative statistics, resulting in incomplete information measurement. Finally, Li’s study requires specific regulations on the size of area maps, which restricts the universality of spatial information measurement.
In Liu’s method, the author employs the size of Voronoi diagram areas to represent the distance relationships between area objects. However, there may be heterogeneity in the diagram, where the distance relationships between area objects and their adjacent objects exhibit heterogeneity. The use of a uniform indicator to characterize the distance relationships neglects the diversity of spatial distance relationships among area objects. Secondly, the author constructs Voronoi diagrams by extending the area maps outward by 30%. This approach leads to inconsistencies in the extension range for different map sizes, resulting in significant fluctuations in the Voronoi diagram areas of objects near the map boundaries. This, in turn, affects the stability and consistency of the measurement results.

2.3. Existing Shortcomings

Currently, only Li and Liu have proposed comprehensive measurement schemes for spatial information in area maps. Both scholars adopt a weighted summation approach to integrate geometric information and spatial distribution information, resulting in a comprehensive measurement of spatial information content in area maps. In their methods, due to a lack of systematic analysis of the quantitative relationship between geometric information and spatial distribution information, both models treat these two types of information as equally important. This paper argues that geometric morphological characteristics are the foundation of spatial distribution relationships, and the two types of information should interact with each other in the study of spatial information measurement. However, the weighted summation approach is unable to capture the diversity of this interaction.
In summary, there are three main shortcomings in existing research that urgently need to be addressed:
(1)
The existing methods for measuring the geometric information content of area objects lack a unified calculation standard and rely heavily on manual experience, resulting in high degrees of error and subjectivity in the calculation results.
(2)
The existing methods for measuring spatial distribution information content only consider the richness of spatial adjacency and spatial occupancy information, while failing to effectively consider the spatial morphological relationships, spatial distance relationships, and further spatial arrangement characteristics of area objects.
(3)
There is currently no theoretically feasible solution for comprehensively measuring the geometric information and spatial distribution information of area maps. The current approach of combining weights based on manual experience carries an uncertain degree of subjectivity.

3. Method

In the research on the spatial information measurement of area maps, the spatial scope of the map should be arbitrary, and the design of measurement methods should be influenced and limited by the scope of the map as little as possible, while considering the expression of spatial information as comprehensively as possible. Based on this requirement, the existing measurement methods are currently unable to meet the above needs. Therefore, this paper proposes a method for measuring the spatial information of area maps that considers the diversity of points and edges and Gestalt cognitive principles.

3.1. The Overall Framework of the Proposed Method

The method proposed in this paper first constructs a spatial proximity graph using the convex hull Voronoi diagram of area objects. Secondly, it systematically analyzes the physical meanings of nodes and edges in the spatial proximity graph, as well as the relationship between these physical meanings and spatial distribution information. Four characteristic indicators, including the geometric information content of nodes, node degree, adjacency strength, and adjacency distance, are selected to comprehensively represent the spatial information of area maps. Finally, considering the regular arrangement characteristics of artificial buildings in practical applications, the limited growth theory of visual repetition in cognitive psychology is introduced to eliminate and weaken the redundant information caused by regular arrangement, resulting in a more objective and accurate quantitative expression of spatial information content for area maps. The main research approach is illustrated in Figure 1:

3.2. Diversity of Node

Due to the specialized nature and high cost of abstract cognition, this paper argues that in most practical application scenarios, it is difficult for map users and cartographers to abstract independent spatial distribution information. Instead, spatial information that combines geometric information with spatial distribution information is used. Therefore, the nodes in the spatial adjacency graph will no longer be homogeneous nodes, but heterogeneous nodes with diverse geometric shapes. The diversity of nodes is mainly reflected by the diversity of the geometric characteristics of the nodes themselves and the diversity of their connectivity. As shown in Figure 2. Based on this, this paper selects the geometric information content of the area objects represented by the nodes to express the diversity characteristics of the nodes themselves, which serves as the fundamental and existential information of spatial information.
Regarding the calculation of geometric information content of area objects, Kang et al. proposed a geometric information measurement method for area objects based on the node discrepancy degree [27]. This method adopts circles as reference shapes for the feature extraction of similarity degree, enabling the comparability of feature values. Combined with adaptive weight parameters, it forms a quantitative expression of geometric information for area objects. Through comparisons with nine existing geometric information measurement methods for area objects, its effectiveness and robustness have been demonstrated. Here, this paper cites the research results of Kang et al. and uses the geometric information content calculated with their algorithm as an expression of node diversity. The diversity characteristics of nodes are Geoi:
G e o i = I g e o m e t r i c ,
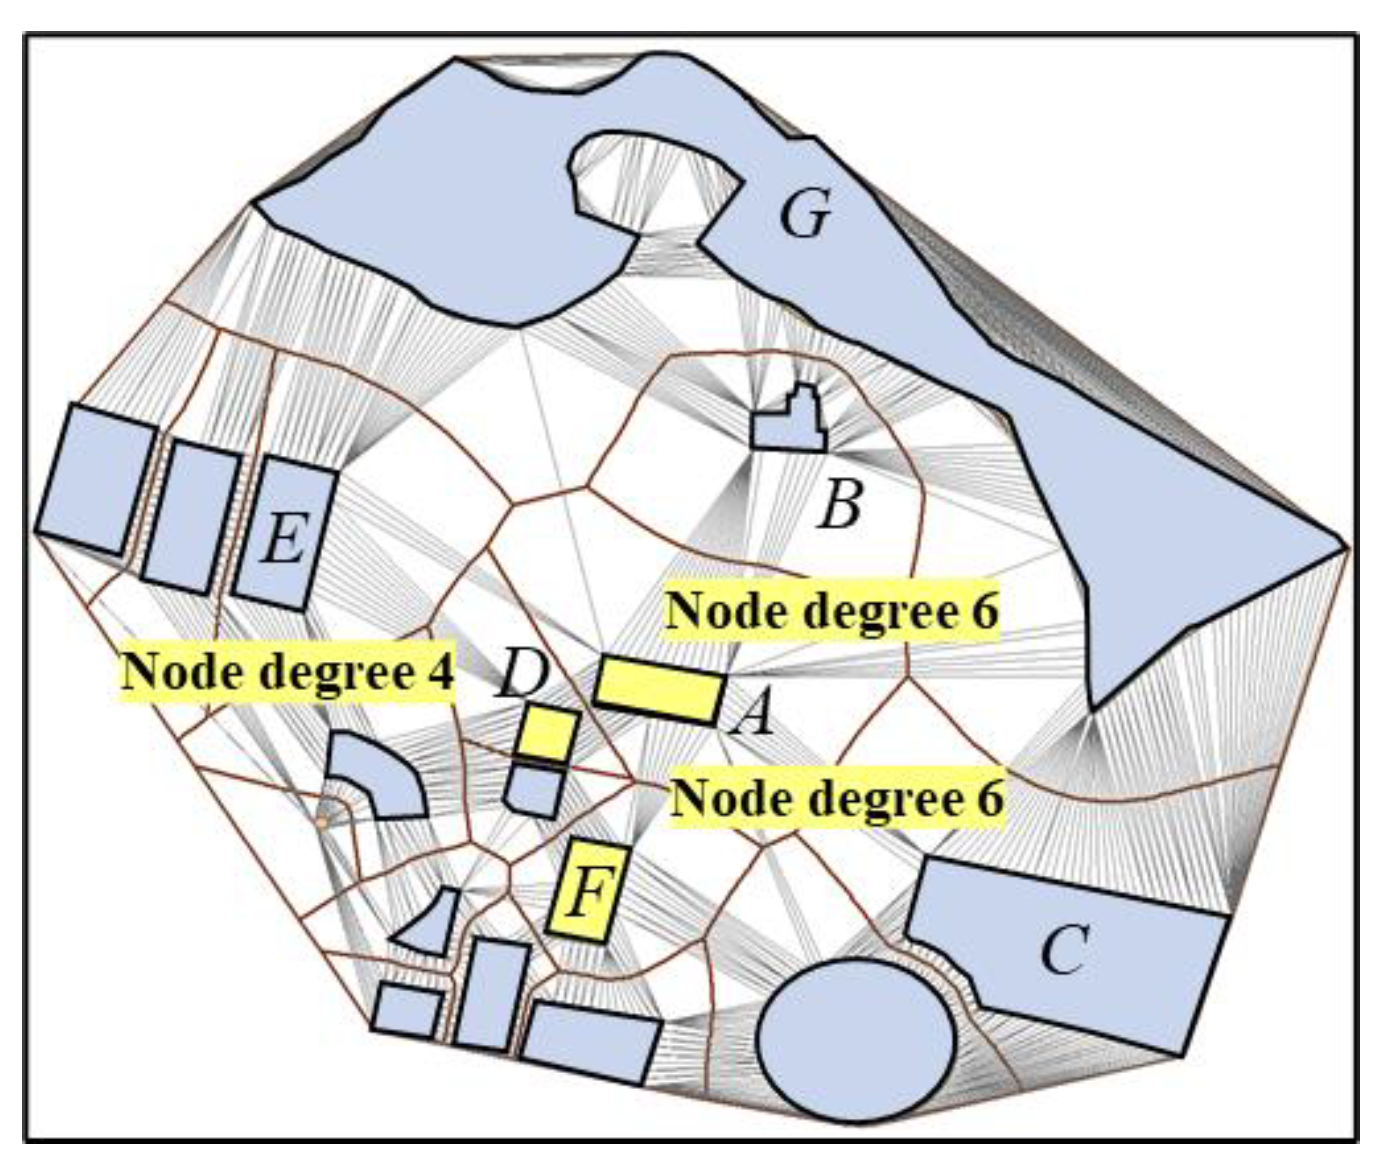
Another diversity feature of nodes is their connectivity diversity. From the perspective of node importance, the higher the node degree of a node in the network structure, the stronger its connectivity and the more important role it plays in characterizing the structure of the network. When such a node is removed, the network structure undergoes significant changes, thus indicating its high importance. On the other hand, isolated nodes often have weak connectivity and removing them has minimal impact on the network structure, resulting in a lower level of importance. Therefore, this paper selects node degree as a feature representing the connectivity diversity of nodes, which is used to analyze the role of the number of adjacent targets in spatial distribution information. The differences in node degrees in the proximity graph of area maps are illustrated in Figure 3: area objects A, D, and F have different node degrees.

3.3. Diversity of Edge

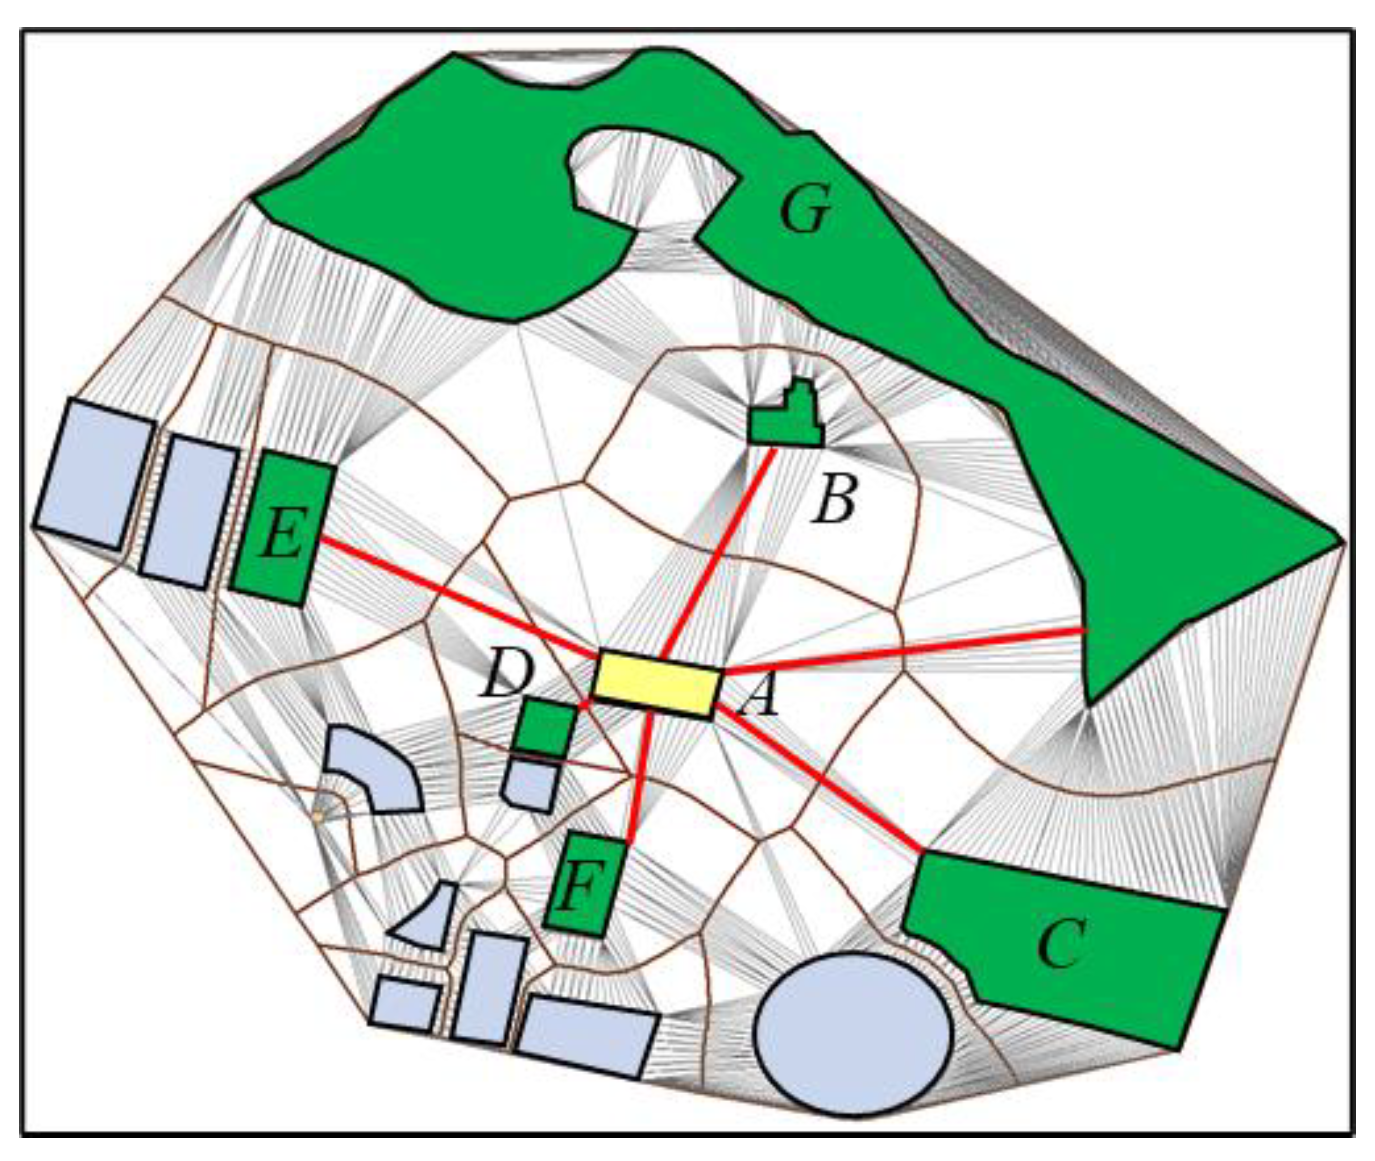
Edges in the adjacency graph structure also exhibit rich diversity, which can be categorized into distance diversity and attribute diversity of edges. The distance diversity of edges is determined by their physical characteristics, namely, the length information they possess. For the research objective of measuring spatial information in maps, the physical meaning of edges represents the spatial distance between area objects represented by nodes. This spatial distance is jointly determined by the geometric characteristics and spatial positional relationships of the area objects. Therefore, considering the diversity of such spatial distances, it is clearly inappropriate to adopt the method of representing the spatial distance between area objects using the distance between the centroid of the area objects. Here, we cite previous definitions of the true visual distance between area objects to measure the distance diversity of edges in the network. The length of an edge is determined by the visual distance between the two area objects represented by its start and end nodes [28]. The visual distance is defined as the average height of the public Delaunay triangular mesh connecting the two area objects, as shown in Figure 4, and it is calculated as follows:
V i s u a l ( A , B ) = ( i = 1 T r i ( A , B ) d i s i ) / T r i ( A , B ) ,
D i s ( B , A   ) =   1 + L o g i s t i c ( H B   / V i s u a l ( A , B ) ) ,
D i s ( A , B   ) =   1 + L o g i s t i c ( H A   / V i s u a l ( A , B ) ) ,
In the above formula: T r i ( A , B ) represents the set of adjacency constraint triangles between objects A and B, T r i ( A , B ) denotes the number of constraint triangles in the set, d i s i is the height of the i th triangle, and HA and HB are the minimum bounding rectangle widths of area objects A and B, respectively.
The diversity of edge distances reflects the spatial proximity between two objects. According to the laws of Gestalt cognitive principles, spatially closer objects are more easily integrated into a whole in visual perception. Therefore, the closer the spatial distance between the area objects, the higher the degree of proximity, thus reducing the cost of visual perception.
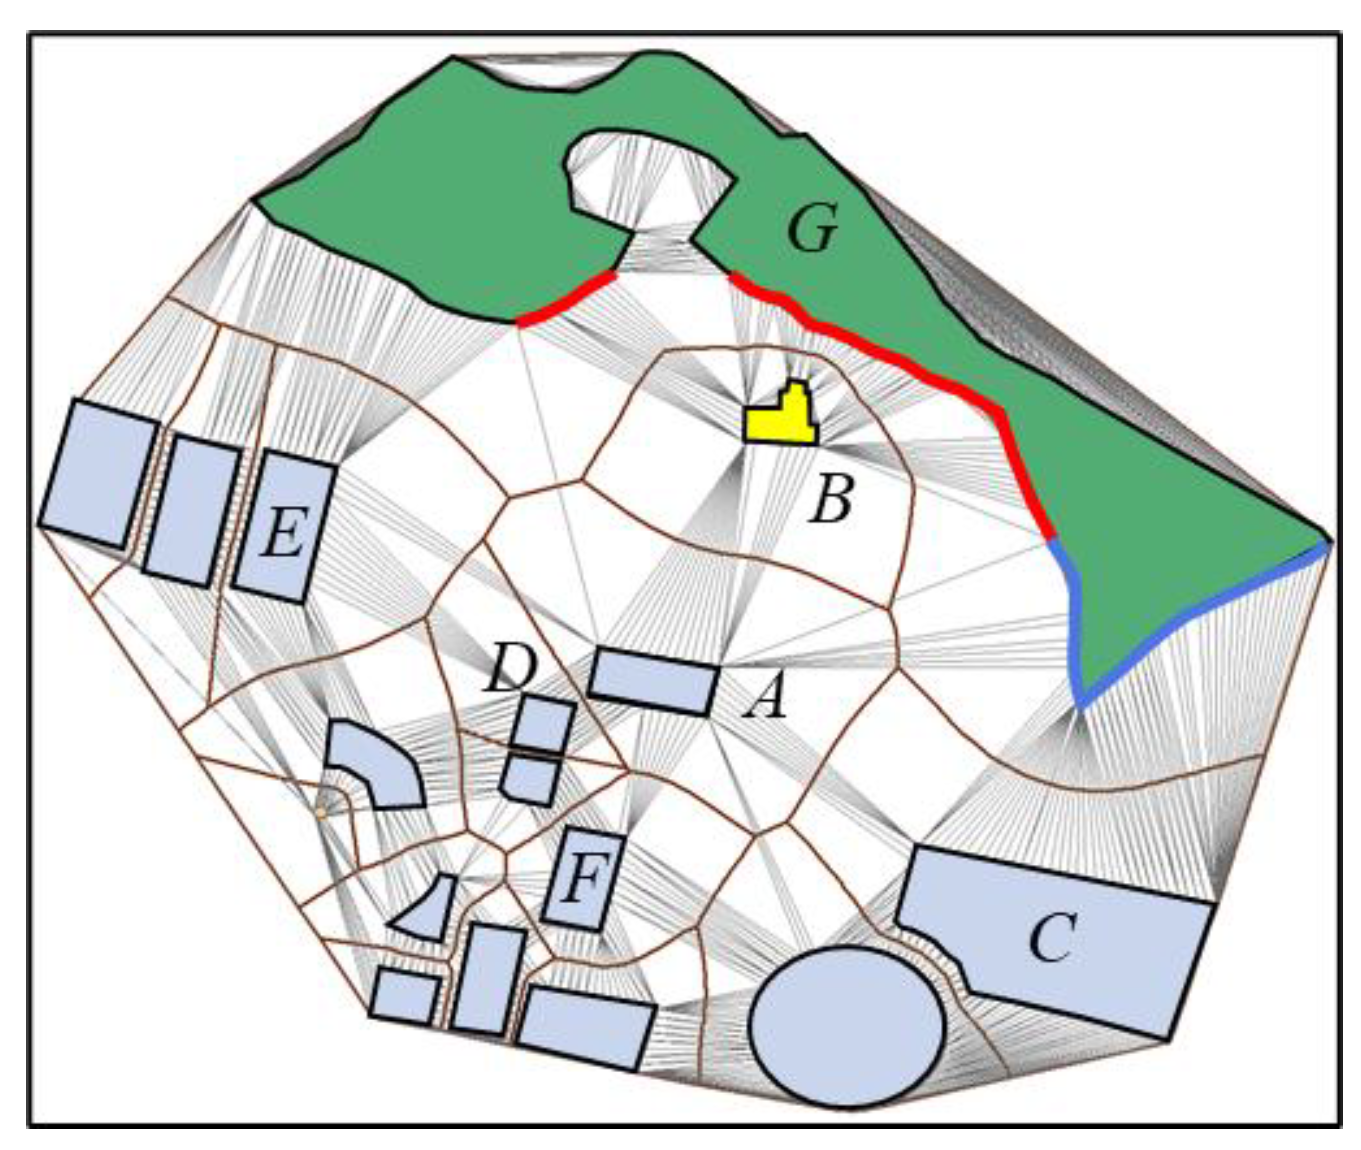
Edges of the same length can vary in their importance and diversity depending on the nodes they connect to, which is defined in this paper as the diversity of adjacency relationships among edges. The physical significance of this diversity stems from the relative positional relationships and geometric morphological characteristics of the area objects represented by the start and end nodes of the edges in the map space. To describe and express this diversity of adjacency relationships, this paper adopts a proportional allocation approach to quantify the degree of diversity in the adjacency relationships among area objects. Specifically, the closeness of different area objects is jointly determined by spatial distance and the proportion of adjacent edges. The length of adjacent edges reflects the importance of neighboring area objects in this adjacency relationship. For example, in Figure 5, most of the adjacency relationships of object A are carried by object F above, while object A is only one of the many adjacent objects of object F. In other words, the same adjacency relationship can have different degrees of importance for different area objects. This degree of diversity is also an important feature of spatial distribution information.
In this paper, the importance of adjacency relationships for different nodes is expressed by the proportion of common edges of area object Voronoi diagrams occupied in their respective Voronoi diagrams, and the diversity of adjacency relationships is characterized by different levels of importance. Therefore, the diversity feature of edge adjacency relationships E d g e i j can be solved using the following formula:
E d g e i j = J o i n t D i s i j P v o r o n o i i ,
where J o i n t D i s i j represents the length of the adjacent edge between the Voronoi diagrams of area objects i and j, P v o r o n o i i represents the perimeter of the Voronoi diagram of areal objects i, and E d g e i j represents the diversity degree of the spatial proximity relationship between area objects i and j.

3.4. Information Decay Based on Gestalt Cognitive Principles

Due to the presence of a large number of artificial buildings in vector data, which exhibit strong distribution patterns and morphological similarities, directly summing up the spatial distribution information of these objects often generates a significant amount of redundant information. The Gestalt cognitive principles indicate that the proximity, similarity, and regularity of spatial objects all influence the outcome of spatial cognition [29,30,31,32]. Furthermore, artificial building objects that possess such characteristics of proximity, similarity, and regularity are also the research targets of spatial clustering, merging operators, and generalization operators [33]. These operators aim to abstract regularly distributed individual element groups into a single entity for cognition or computation, thereby reducing the cost of cognition and processing. Therefore, the measurement of map spatial information should also take this feature into account. To address the above-mentioned spatial distribution characteristics, this paper introduces similarity metrics and visually constrained growth theory to eliminate redundant similarity information in the spatial distribution network structure.
The theory of visually constrained growth of redundant information posits that human eyes do not simply accumulate and recognize repeatedly occurring patterns of information, but instead possess associative learning characteristics [25]. This associative cognition allows for the recognition of spatially similar patterns by associating them, thereby reducing the cost of visual cognition. As shown in the Figure 6, the information represented by the small blue squares along the diagonal of the ink screen is not merely the sum of individual black square information.
In the research of Attneave et al. (1954), it is pointed out that the total entropy of a pattern is the sum of the entropy of non-repeating patterns and the entropy related to repeating patterns [34]. The entropy of repeating patterns is less than the cumulative sum of the entropy of individual repeating patterns. In the study by Dai et al., the relationship between visually repeating redundant information is discussed in detail, and a computational method for visually repeating information is provided [25]:
y = log ( 1 + n ) x ,
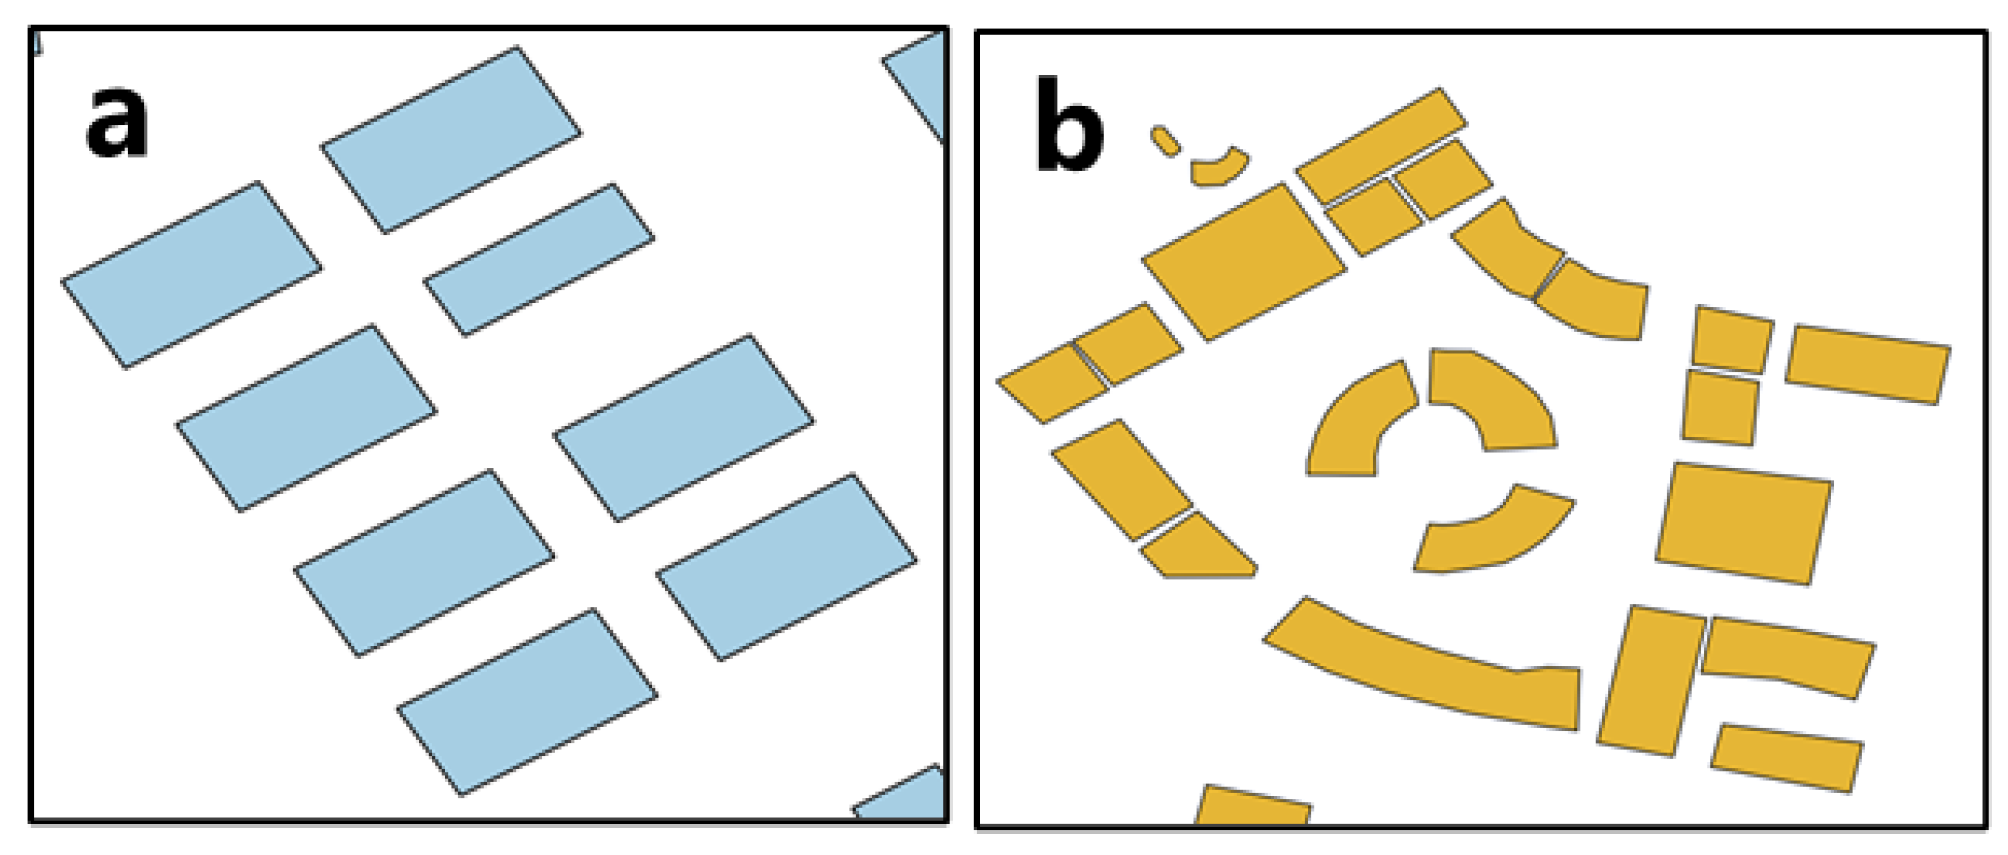
Due to subjective reasons in urban planning and construction, building objects exhibit a regularity in spatial distribution, characterized by similar geometric shapes, appropriate spatial distances, and relatively consistent spatial arrangement directions [35]. When all three conditions are met, area objects often exhibit a regular distribution pattern with distinct characteristics. As shown in Figure 7, the blue buildings on the left side, with similar spatial arrangement directions, geometric shapes, and close spatial distances, are generally easy for map users to summarize and recognize during visual cognition, thus expressing less spatial information. In contrast, the yellow buildings in Figure 7 on the right side exhibit greater spatial distribution information due to inconsistent spatial arrangement directions and geometric shapes. In the field of cartography, more detailed studies have been conducted on such arrangement patterns, such as linear arrangement and spatial clustering patterns based on similarity.
Based on the above analysis, this study integrates Gestalt cognitive principles and the information theory of visually constrained growth to weaken the redundant information of area objects with similar spatial arrangements, aiming to obtain spatial information measurement results that are more aligned with visual cognition. Firstly, this method uses the area object as the basic computational unit and determines the consistency of spatial arrangement directions by calculating the spatial directional similarity between the area object and its first-order neighboring objects in the Voronoi diagram. Secondly, by computing geometric shape similarity, the method further determines whether there is visual repetition between area objects when their directional arrangements are consistent. Finally, through the analysis of visual distances between area objects, the method judges whether the spatial distances between them satisfy holistic cognition, thereby fulfilling the criteria for redundant information. Since people often find it difficult to associate two geographical features that are too far apart in spatial distance, the impact of visual repetition for two area objects with excessively distant spatial distances will be relatively weakened. The specific calculation of information will be detailed in Section 4.2.

3.5. Calculation of Spatial Information Content in Area Maps

The calculation model of spatial information proposed in this paper takes the nodes (area objects) in the spatial adjacency graph as the measurement unit. By integrating the four characteristics of nodes and edges mentioned above, it couples geometric information with spatial distribution information, forming a comprehensive measure of spatial information. These four characteristic values are non-probabilistic parameters that are directly correlated with spatial information. Specifically, the larger the geometric information content of an area object, the higher the spatial information; the higher the node degree, the higher the connectivity information of the node; a greater adjacency strength indicates a closer adjacency between the area object and its current adjacent object, resulting in a higher weight assigned to the adjacency relationship; and a larger spatial distance indicates a greater distance between two objects, which requires separate cognition and is difficult to form an integrated cognition, thus leading to a higher cognitive weight. Therefore, these non-probabilistic parameters do not conform to the measurement principles of the Shannon entropy model [27]. Based on this, this paper selects the Eigenvalue entropy model proposed by Ou et al. and combines it with the above parameters to construct a calculation model of spatial information [36]. The calculation formula is as follows:
S i j = log 2 ( G e o i × E d g e i j + G e o j × E d g e j i ) D i s i j + 1 ,
I = i = 1 N j = 1 M m S i j + S m ( 1 + log 2 ( m ) ) ,
The spatial information of area maps is the sum of the spatial information of all area objects within the map frame. The method proposed in this paper achieves the coupling of geometric information and spatial distribution information by using spatial distribution features as influencing factors acting on geometric information. Since the diversity of nodes has already considered geometric information, the method proposed in this paper is a kind of spatial information that includes geometric information.

4. Results

To validate the effectiveness and accuracy of the proposed method in this paper, two sets of experiments were designed to evaluate the method, and its advantages were demonstrated through a comparison with existing methods.

4.1. Experimental Design and Comparative Methods

4.1.1. Experimental Design

Based on the analysis of factors affecting spatial information, this paper proposes the following hypotheses:
Hypothesis 1. 
The information content of irregularly arranged area maps is greater than that of regularly arranged areal maps.
Hypothesis 2. 
Simplification processing has a mitigating effect on the spatial information of area maps, i.e., as the degree of simplification increases, the spatial information in the map will decrease accordingly.
These two hypotheses are theoretically based on the fundamental principles in spatial analysis, spatial clustering, and cartographic generalization. Based on this, the study designs two sets of experiments to analyze the effectiveness of the proposed method.
The first experiments simulate the change process of spatial distribution from orderly to chaotic by randomly rearranging regularly arranged building objects, aiming to assess the effectiveness of the proposed method in measuring the spatial information of area maps.
The second experiment uses a dataset of natural features that undergo continuous simplification to evaluate the consistency of the proposed method in measuring changes in information content under the condition of area map simplification.

4.1.2. Experimental Parameters

The information content measurement programs for both sets of experiments were written based on the Python 3.8 platform, while the Qgis3.26 software platform was used for viewing and visualizing map data. The computing platform for the experiments was a desktop computer equipped with an Intel Core TM i9-10900 processor and an NVIDIA GeForce RTX 2060 graphics card.
Since regularly arranged area objects are mostly artificial objects with regular right-angle features, the spatial directional similarity of area objects is calculated by using the direction of the long side of the minimum bounding rectangle of the area object as the main direction to compute the directional consistency. The threshold for judging consistency is set to an empirical value of ±5°. Geometric shape similarity is analyzed using Fourier descriptors proposed by Liu, et al. [37]. The constraint parameter for spatial distance is set to the width of the minimum bounding rectangle. When the visual distance between two area objects is greater than the width of the minimum bounding rectangle of the current area object, the experiment determines that the two objects are not adjacent and do not possess an overall redundant perception.

4.1.3. Comparative Methods

Since the method proposed in this paper aims to measure the spatial information of areal maps, two existing comprehensive measurement methods (Li and Liu) are selected as comparison methods [16,17]. Additionally, a measurement method for the topological information of geospatial data is also used for comparison with the experimental results [15]. Detailed information is presented in Table 1 below:

4.2. Experiment 1: Consistency Analysis of Spatial Information Content and the Degree of Disorderly Arrangement of Area objects

A dataset with gradually increasing degrees of disorder in building arrangement is designed to simulate the continuous change process of the spatial distribution of area maps evolving from regularity to irregularity. This is intended to verify the consistency between the proposed spatial information measurement method and the degree of disorder in the arrangement of buildings. As the irregular arrangement of buildings only involves spatial distribution without any changes in geometric information, for the purpose of controlling variables, three spatial distribution information measurement methods were employed as comparative methods in Experiment 1.
The experimental data were selected from real vector data on the OSM platform. Different degrees of the disordered arrangement of area objects were simulated by changing their positions and directions. The design of the simulated data involved gradually increasing the proportion and intensity of disorder to alter the original regular arrangement pattern of the objects. A total of 10 levels of disorder intensity, ranging from a variance of 0.1 to 1.0, were used to create a dataset of 11 area maps, including the original data, with known orders of information content. The experimental setup is shown in Figure 8.
The experimental results are shown in Table 2 and Table 3. Based on the correlation analysis between the measurement results of information content and the degree of disorder, the correlation coefficients between the measured values of the four methods and the degree of disorder are as follows: C1: 0.90; C2: 0.86; C3: −0.70; ours: 0.95. The method proposed in this paper exhibits the best agreement trend in terms of correlation with the degree of disorder. While it is true that methods C1 and C2 also demonstrate strong correlation in the correlation analysis, a comparison of the variation ranges of the information content reveals that the current variation rates of the information content measures for both comparison methods are less than 2%, falling within the range of calculation errors. Consequently, they exhibit insensitivity to the differences in information content variation caused by disordered arrangements. Currently, only the proposed method can effectively distinguish changes in the degree of disorder in the arrangement pattern of areal features.
As can be seen from Table 2 and Table 3, the existing representative methods have not considered the similarity and regular arrangement of building objects. Therefore, they are unable to effectively distinguish the increasing trend of information content caused by the disordered arrangement of spatial objects. However, the proposed method benefits from the introduction of similarity analysis theory and visual repetition limited growth theory, enabling it to effectively identify the degree of disorder in spatial distribution and effectively eliminate redundant information caused by the similarity and regular arrangement of buildings. In the application of crowdsourced vector data with a large number of regularly arranged buildings, our method can effectively improve the accuracy of spatial information measurement. Additionally, the method proposed in this paper breaks through the limitations of map size, enabling the calculation standards of information content to be unified across different map sizes.

4.3. Experiment 2: Consistency Analysis of the Simplification Level of Area Maps and Spatial Information Content

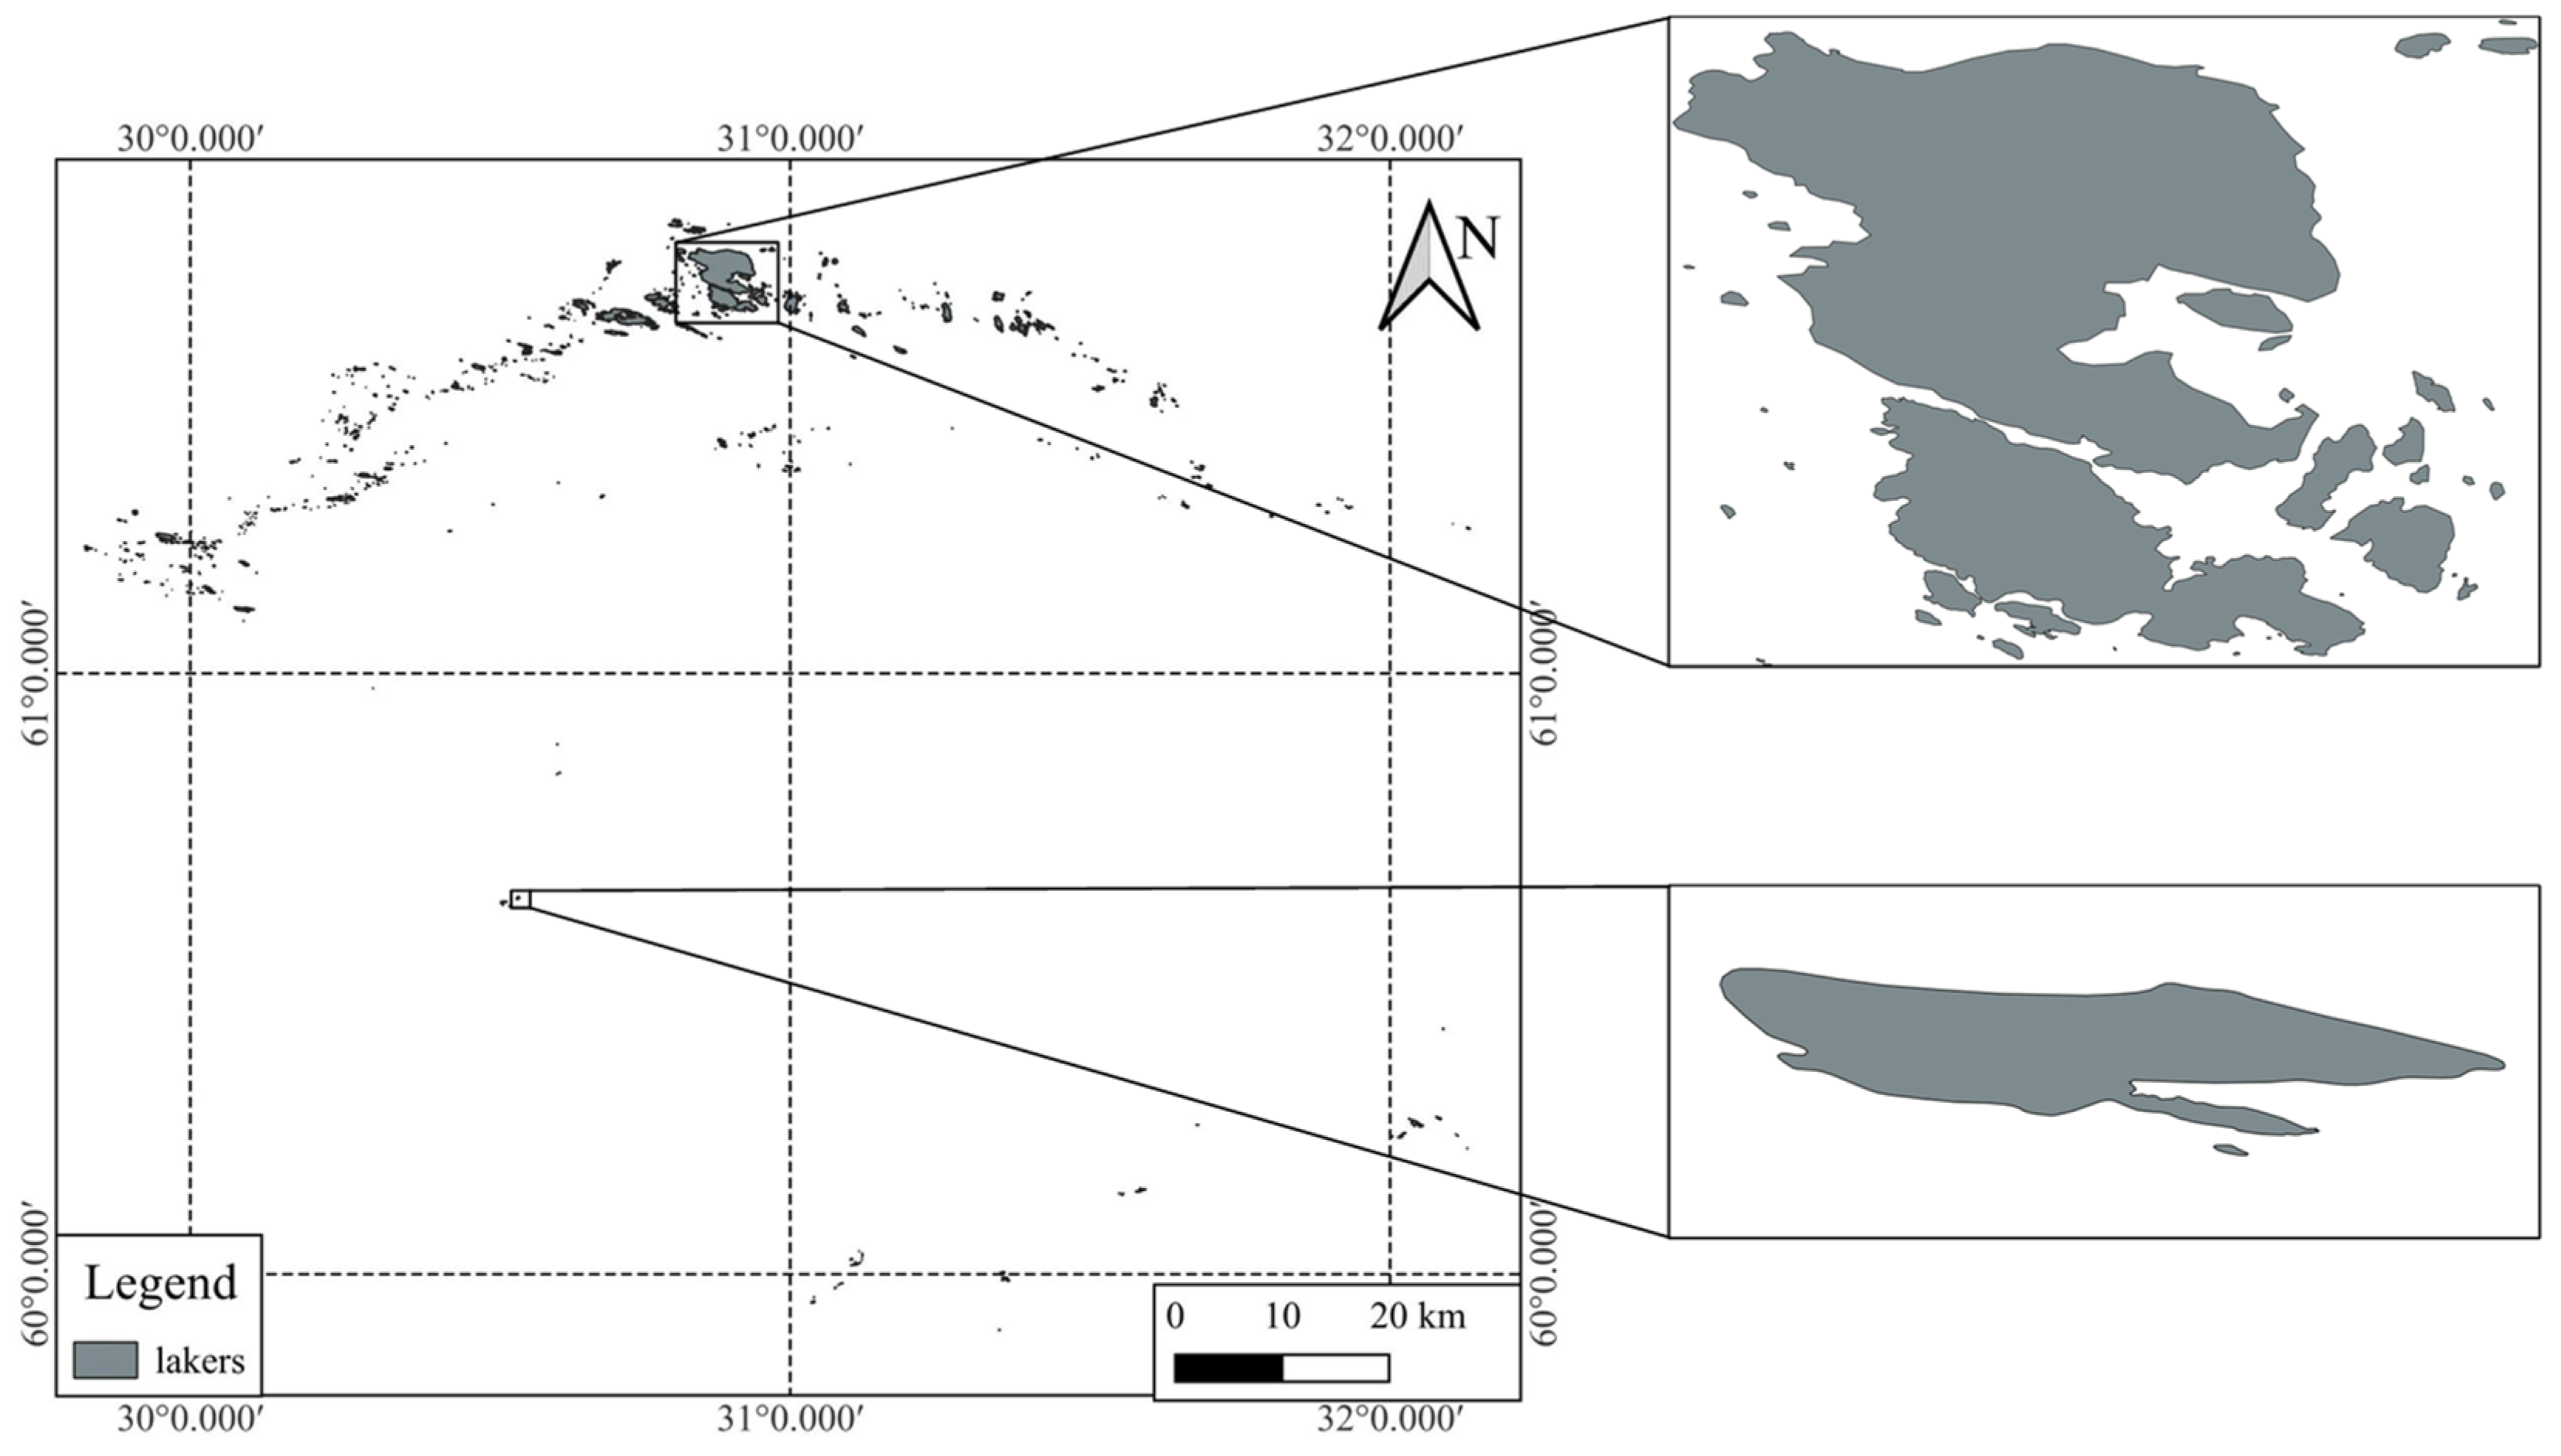
To further validate the impact of geometric information changes on spatial information and evaluate the accuracy and comprehensiveness of the method proposed in this paper, natural feature objects with complex morphological characteristics and irregular arrangements were selected as experimental data. Using simplification operators, a simulation process of the gradual attenuation of information content was achieved, and a simulated dataset with a priori information on changes in information content was designed. Experimental data are shown in Figure 9.
Based on the experimental assumption that simplification processing has a diminishing effect on the spatial information of area maps, i.e., as the degree of simplification increases, the spatial information in the map decreases accordingly, we expect that with the deepening of simplification, the measurement value of spatial information in area maps should gradually decline. Based on this assumption, this paper simulates the reduction and weakening process of spatial information through varying degrees of simplification for lake maps with complex geometric morphological characteristics. Ten consecutive simplification processes were conducted using the “POINT_REMOVE” method in ArcGIS, and the simplification intensity was controlled by adjusting the minimum area tolerance parameter. The parameter range varied from 0.00001 to 0.0001, providing ten intensity levels from low to high. Figure 10 shows the simplification results for two typical area objects. After simplification, the number of points in the lake objects of this layer decreased from 100% of the original layer to 45.5%, thus removing 54.5% of the points.
As shown in Table 4, for the continuous simplification process of area maps, both the proposed method and Liu’s method can identify the attenuation of spatial information, while Li’s method cannot effectively measure the attenuation of spatial geometric information due to the characteristics of Shannon entropy.
However, regarding the measurement of comprehensive spatial information, Liu’s method can also discern the trend of changes in comprehensive information due to the influence of geometric information, as shown in Table 5.
While both methods seemingly reflect information decay due to simplification, the difference lies in the fact that Liu et al.’s method does not express the relationship between the measurement of geometric information and the spatial distribution information. Liu’s method separates the two and requires empirical weighting of different information types, thus increasing uncertainty. For instance, in Liu’s method, there is a tenfold difference between the quantitative values of geometric information and spatial distribution information, and in Li’s method, the difference is even a thousand times. This significant disparity in measurement values lacks a theoretical explanation. Secondly, Liu’s method exhibits almost consistent decay in information content with the deletion of spatial points in the measurement of geometric information, as shown in Table 6. This is due to the high weight assigned to the number of points in the measurement model. However, the goal of simplification is to delete redundant points while preserving the overall information of the object as much as possible. Therefore, when the change in Liu’s method’s measurement value aligns with the deletion of points, it suggests that all points have the same amount of information, which contradicts the original intention and theory of simplification. In contrast, our method’s results indicate that even after deleting 55% of the points, the area map retains approximately 88% of its information. From the perspective of the proportion of information contained in the deleted points, our method better aligns with the original intention and significance of simplification. Therefore, the experimental results support the conclusion that our proposed method outperforms the comparison methods in both qualitative and quantitative measurements.

5. Discussion

By comparing with existing methods, the approach proposed in this paper constructs spatial adjacency relationships using the convex hull Voronoi diagram of area objects, while incorporating visual distance instead of the Voronoi diagram area in the calculation. The method effectively addresses two issues that affect the measurement and application of spatial information:
(1)
The spatial information content in a map is only related to the scale of the spatial distribution structure and is not limited by the map extent;
(2)
There is no need to balance the Voronoi diagram area of objects in the margin of the map by manually extending the map extent, thus reducing the uncertainty of measurement results.
In addition, the method proposed in this paper has four advantages: the comparability of eigenvalues, the consideration of the diversity of spatial distances and adjacency relationships among area objects in area maps, the measurement of information with regular distribution and arrangement, and the coupling of geometric information and spatial distribution information.

5.1. The Comparability of Eigenvalues

The method proposed in this paper only possesses the scalar feature of geometric information content. Node degree, as the number of adjacent objects for areal objects, primarily serves the role of accumulating information content and does not affect the dimension of the eigenvalue. Both the visual distance factor and adjacency strength factor have a value range of [0, 1], essentially serving as a weight factor, and they also do not affect the dimension of the eigenvalue. Therefore, the spatial information content in this paper’s method is a scalar feature value based on geometric information content as the basic unit, with the visual distance factor and adjacency strength factor as weights. Its magnitude is positively correlated with the amount of geometric information content, the size of visual distance factor and adjacency strength factor, and the number of node degrees. Kang’s paper further discusses the advantages of consistency and comparability in the value range of the eigenvalues possessed by the proposed geometric information content measurement method [27]. Consequently, this paper also inherits these advantages. Combined with the construction of the convex hull adjacency graph, the measurement results in this paper are not limited by the map extent, thus ensuring widespread comparability of the measurement values.

5.2. The Consideration of the Diversity of Spatial Distances and Adjacency Relationships

To comprehensively measure spatial information, this paper proposes two indicators: adjacency strength and visual distance factor. Adjacency strength is a distributed thinking approach to measuring the diversity of adjacency relationships. It represents the proportion of the geometric shape of the current area objects used to establish adjacency relationships with neighboring objects. This approach avoids information redundancy caused by the redundant accumulation of geometric information of the current areal object and fully combines geometric morphological features and spatial proximity to measure the diversity of adjacency relationships. Since the value range of the adjacency strength is between [0, 1], it essentially serves as a weight factor without affecting the dimension of the eigenvalue. Visual distance also exhibits relativity, meaning that the same visual distance has different cognitive effects for different neighboring objects. Therefore, visual distance appears as an intensity factor for adjacency relationships. Spatially closer areal objects are more likely to form a holistic cognition, resulting in a smaller visual distance. In contrast, objects with a greater visual distance are more like two independent objects, requiring separate cognition and thus increasing the intensity factor of visual distance. After transformation using the sigmoid function, the value range of visual distance also falls within [0, 1], without affecting the dimension of the eigenvalue. These two indicators effectively balance the spatial adjacency relationship characteristics between areal objects and play a crucial role in enhancing the accuracy and comprehensiveness of spatial information.

5.3. The Measurement of Information with Regular Distribution and Arrangement

Due to the existence of a large number of artificial buildings in real map data, these objects typically exhibit a certain regular spatial distribution pattern due to urban construction and planning. This pattern is crucial information for map users to analyze and cognize, such as in spatial clustering, typification, and merging-related research. Therefore, the measurement of spatial information on maps should fully consider the existence of this regular pattern. In this regard, this paper introduces the theory of limited growth of visually repeated information to analyze and extract area objects with geometric similarity, spatial arrangement consistency, and spatial proximity in area maps. Subsequently, this theory is used to identify regular arrangement patterns and eliminate redundant information in spatial distribution and arrangement based on the theory of the limited growth of visually repeated information in cognitive psychology. The experimental results support the conclusion of this paper; the proposed method can effectively distinguish the degree of chaos in the arrangement of areal objects, making the measurement of spatial information more consistent with human visual cognition.

5.4. The Coupling of Geometric Information and Spatial Distribution Information

The fourth advantage of the method proposed in this paper lies in its ability to couple geometric information with spatial distribution information. In the study of spatial information measurement, geometric information and spatial distribution information have traditionally been treated as two separate types of information for individual measurement, and the quantitative relationship between the two has not been effectively demonstrated or analyzed. Treating them in parallel can lead to issues such as inconsistent dimensions and significant fluctuations in information content, as exemplified by the significant differences in the two types of information observed in Experiment 2 using the method of Li and Liu. Additionally, map users or cartographers typically combine geometric and spatial distribution information to analyze map information, as abstracting spatial structures and distributions among objects on a map is a cognitively costly task. Therefore, the cognition of spatial information on maps should be a coupled and comprehensive process. The method proposed in this paper uses geometric information as the primary information source and couples spatial distribution information into the various weight factors of geometric information. This approach enables the measurement of the diversity of spatial distribution information while maintaining consistent dimensions of the eigenvalues, thus achieving a coupling of the two types of information. By adopting a coupled perspective, this method avoids the uncertainty caused by the unclear quantitative relationship between the two types of information.

6. Conclusions

This study proposes a spatial information measurement method for area maps that considers the diversity of nodes and edges and Gestalt cognitive principles. Firstly, the method uses areal objects in area maps as the basic unit for information measurement and constructs an adjacency graph structure representing the spatial distribution characteristics of area objects by utilizing the Voronoi diagram adjacency relationships as the adjacent edges. This abstraction transforms the spatial information of the area map into a graph structure. Secondly, four types of feature indicators are designed to represent spatial information in the graph structure, measuring the diversity of spatial information. Finally, the graph structure is used as the basic computational unit to integrate the four types of spatial information-representing features to comprehensively calculate the spatial information of the area map. Given the regular arrangement characteristics of real map data, this study introduces Gestalt cognitive principles and the theory of the limited growth of visually repeated information to eliminate redundant information, making the measurement results more consistent with visual perception. Two experiments are designed to test the proposed method, and the results indicate that the method effectively distinguishes the degree of disorder in spatial distribution while demonstrating better discrimination for changes in information compared to existing methods. Additionally, the information measurement values obtained using this method are comparable and unaffected by subjective factors such as dimensions and weights, making it a more efficient method for measuring spatial information in area maps.
Overall, the proposed method is robust, coupling geometric information with spatial distribution information, and effectively accounting for the regularity of area objects. However, the method involves numerous parameter indicators and has a high computational complexity. Future research directions include improving the efficiency of spatial information measurement, reducing computational costs and time, and enabling real-time calculations in response to user interfaces.

Author Contributions

Conceptualization, Q.K. and X.Z.; methodology, Q.K. and D.H.; validation, X.Z. and D.H.; data curation, Q.K.; writing—original draft preparation, Q.K.; funding acquisition, X.Z. All authors have read and agreed to the published version of the manuscript.

Funding

This research was jointly funded by the National Key Technology R&D Program of China under grant No. 2022YFB390420501, National Natural Science Foundation of China (41971360) and the Fundamental Research Funds for the Central Universities of Central South University (1053320211416).

Institutional Review Board Statement

Not applicable.

Informed Consent Statement

Not applicable.

Data Availability Statement

The data presented in this study are available on request from the corresponding author.

Conflicts of Interest

The authors declare no conflicts of interest.

References

  1. Ke, L. Retrospect and Prospect of the Development of Chinese Cartography. Acta Geod. Cartogr. Sin. 2017, 46, 1517–1525. [Google Scholar] [CrossRef]
  2. Li, Z.; Gao, P.; Zhu, X. Information Theory of Cartography: An Information-theoretic Framework for Cartographic Communication. J. Geod. Geoinf. Sci. 2021, 4, 1–16. [Google Scholar] [CrossRef]
  3. Bjørke, J.T. Exploration of Information Theoretic Arguments for the Limited Amount of Information in a Map. Cartogr. Geogr. Inf. Sci. 2012, 39, 88–97. [Google Scholar] [CrossRef]
  4. Li, Z.; Liu, Q.; Gao, P. Entropy-based Cartographic Communication Models: Evolution from Special to General Cartographic Information Theory. Acta Geod. Cartogr. Sin. 2016, 45, 757–767. [Google Scholar] [CrossRef]
  5. Wang, H. Research on Quantity Measurement of Basic Geographic Information in Topographic Database. Liaoning Technical University. 2010. Available online: https://kns.cnki.net/kcms2/article/abstract?v=fsvnL9wA1q0Z03MJjIch-ioV7_lOxyrpPOD3OZxM_u0nBOSnK6rzNgojj1AyLnrDotaycFDEUjpW7GqYyb-h_FkklYDonZO10dbhg2zeBGNzxVzRIp3wTAgpeALC1ccGKSKBPsQbsmDX45-Mp_q05w==&uniplatform=NZKPT&language=CHS (accessed on 15 July 2011).
  6. Li, A.; Chen, Y.; Yao, M.; Wu, S. Quantitative Measurement of Geometrical Information for Sensitive Features in Secret-related Vector Digital Maps. J. Geo-Inf. Sci. 2018, 10, 7–16. [Google Scholar]
  7. Harrie, L.; Stigmar, H. An evaluation of measures for quantifying map information. ISPRS J. Photogramm. Remote Sens. 2010, 65, 266–274. [Google Scholar] [CrossRef]
  8. Wang, S.; Wang, Z.; Du, Q. A measurement method of geometrical information considering multi-level map feature. Sci. Surv. Mapp. 2007, 32, 60–62+194. [Google Scholar]
  9. Zhao, W.; Fei, L. Syntax-based information quantity rule for automatic map generalization. Sci. Surv. Mapp. 2007, 32, 21–23+204. Available online: https://chkd.cbpt.cnki.net/WKE2/WebPublication/paperDigest.aspx?paperID=5beaa2ac-52ca-4974-88ce-d601cded099a (accessed on 20 November 2007).
  10. Liu, H.; Deng, M.; He, Z.; Xu, Z. An Approach to Measuring the Spatial Information Content of an Area Feature. J. Geo-Inf. Sci. 2012, 14, 744–750. [Google Scholar] [CrossRef]
  11. Harrie, L.; Stigmar, H.; Djordjevic, M. Analytical Estimation of Map Readability. Int. J. Geo-Inf. 2015, 4, 418–446. [Google Scholar] [CrossRef]
  12. Dai, L.; Zhang, K.; Zheng, X.S.; Martin, R.R.; Li, Y.; Yu, J. Visual complexity of shapes: A hierarchical perceptual learning model. Vis. Comput. 2022, 38, 419–432. [Google Scholar] [CrossRef]
  13. Basaraner, M.; Cetinkaya, S. Performance of shape indices and classification schemes for characterising perceptual shape complexity of building footprints in GIS. Int. J. Geogr. Inf. Sci. 2017, 31, 1952–1977. [Google Scholar] [CrossRef]
  14. Liu, Y.; Li, W. A New Algorithms of Stroke Generation Considering Geometric and Structural Properties of Road Network. ISPRS Int. J. Geo-Inf. 2019, 8, 304. [Google Scholar] [CrossRef]
  15. He, J.; Zhang, H.; Cao, W.; Lan, T. A new approach for quantifying the topological information considering the compact and heterogeneous structure of map symbols. Sci. Surv. Mapp. 2017, 42, 131–135. Available online: https://chkd.cbpt.cnki.net/WKE2/WebPublication/paperDigest.aspx?paperID=659219f9-2b0a-4000-9d04-0e7334c58d63 (accessed on 20 January 2017).
  16. Li, Z.; Huang, P. Quantitative Measures for Spatial Information of Maps. Int. J. Geogr. Inf. Sci. 2002, 16, 699–709. [Google Scholar] [CrossRef]
  17. Liu, H.; Deng, M.; Fan, Z.; Lu, Q. A Characteristics-based Approach to Measuring Spatial Information Content of the Settlements in a Map. Acta Geod. Cartogr. Sin. 2014, 43, 1092–1098. [Google Scholar] [CrossRef]
  18. Liu, P.; Xiao, T.; Xiao, J.; Ai, T. A multi-scale representation model of polyline based on head/tail breaks. Int. J. Geogr. Inf. Sci. 2020, 34, 2275–2295. [Google Scholar] [CrossRef]
  19. Susan, S.; Kenan, B.; Arzu, Ç. Measured and perceived visual complexity: A comparative study among three online map providers. Cartogr. Geogr. Inf. Sci. 2018, 45, 238–254. [Google Scholar] [CrossRef]
  20. Ai, T.; He, Y.; Du, X. Information Entropy Change in GIS Data Scale Transformation. Geogr. Geo-Inf. Sci. 2015, 31, 7–11. Available online: https://kns.cnki.net/kcms2/article/abstract?v=ttOPOQ75YvLaIvJ-6A6WV2dFIC2LLKmBjujBGXQF_EE5d1f8p4GByjlWfhLd9wf5cpCbcDsHAtch_IHh-FojcvGinDWLEzrSiqOYil8Q17YYykKQaEQkNLEqWSQN46LcHBqbJnZEE7gVy_A-KbAYUA==&uniplatform=NZKPT&language=CHS (accessed on 15 March 2015).
  21. Cheng, M.; Sun, Q.; Xu, L.; Chen, H. Polygon contour similarity and complexity measurement and application in simplification. Acta Geod. Cartogr. Sin. 2019, 48, 489–501. [Google Scholar] [CrossRef]
  22. Parent, J.; Civco, D.; Angel, S. Shape metrics (presentation). In ESRI 2009 User Conference; University of Connecticut: Storrs, CT, USA, 2009. [Google Scholar]
  23. Chen, Y.; Sundaram, H. Estimating Complexity of 2D Shapes. In Proceedings of the 2005 IEEE 7th Workshop on Multimedia Signal Processing, Shanghai, China, 30 October–2 November 2005; Available online: https://ieeexplore.ieee.org/document/4014089 (accessed on 20 November 2006).
  24. Su, H.; Bouridane, A.; Crookes, D. Scale Adaptive Complexity Measure of 2D Shapes. In Proceedings of the 18th International Conference on Pattern Recognition, Hong Kong, China, 20–24 August 2006; Available online: https://ieeexplore.ieee.org/document/1699165 (accessed on 18 September 2006).
  25. Dai, L.; Zhang, J.; Peng, R.; Wang, J.; Yu, J. Computational Evaluation of Logo Shape Complexities. J. Comput.-Aided Des. Comput. Graph. 2017, 29, 1786–1793. Available online: https://www.jcad.cn/cn/article/id/b7917c7f-94d3-44a9-9da4-313a1ae6151d (accessed on 15 October 2017).
  26. Neumann, J. The Topological Information Content of a Map/An Attempt at A Rehabilitation of Information Theory in Cartography. Cartographica 1994, 31, 26–33. Available online: https://kns.cnki.net/kcms2/article/abstract?v=ttOPOQ75YvLS6vqGip2cdHv-kxFdXe0KA2NTtBxZVtv4Q97OXV6zTN2byiWl8uGK_OA66LM6sCtCwm-VpyLZGyOo8pqh2yYgO_L_lEFFDRwWji3JmIcCi6RP0_hS8-dKxeTbi3UxVfg=&uniplatform=NZKPT&language=CHS (accessed on 30 March 1997). [CrossRef]
  27. Kang, Q.; Zhou, X.; Hou, D.; Nawaz, A.; Luo, S.; Zhao, S. A method for measuring geometric information content of area cartographic objects based on discrepancy degree of shape points. Geocarto Int. 2023, 38, 2275685. [Google Scholar] [CrossRef]
  28. Ai, T.; Guo, R. Polygon Cluster Pattern Mining Based on Gestalt Principles. Acta Geod. Cartogr. Sin. 2007, 3, 302–308. Available online: https://kns.cnki.net/kcms2/article/abstract?v=ttOPOQ75YvJ9OA9x7aPm81hcO5GiJfgmnsI7DDKYSny_Klf-9lyx2SyIEXNZYj9JveXT4xS3ShUc_8rlCLqdFxL_ARYPI-Wt2rzTK7qqWnxT3lT33DwOsfYRb2TfqqhPQQA_jO-mz6o=&uniplatform=NZKPT&language=CHS (accessed on 15 August 2007).
  29. Koffka, K. Principles of Gestalt Psychology; Harcourt. Brace: New York, NY, USA, 1935. [Google Scholar]
  30. Graham, L. Gestalt theory in interactive media design. J. Humanit. Soc. Sci. 2008, 2, 571. Available online: https://www.mendeley.com/catalogue/a9fa13bc-41ba-3604-89c2-062cfb003c90/ (accessed on 30 June 2008).
  31. Palmer, S.E. Common region: A new principle of perceptual grouping. Cogn. Psychol. 1992, 24, 436–447. [Google Scholar] [CrossRef]
  32. ROCK. Indirect Perception; MIT Press: London, UK, 1996. [Google Scholar]
  33. Li, Z.; Yan, H.; Ai, T.; Chen, J. Automated building generalization based on urban morphology and Gestalt theory. Int. J. Geogr. Inf. Sci. 2004, 18, 513–534. [Google Scholar] [CrossRef]
  34. Attneave, F. Some informational aspects of visual perception. Psychol. Rev. 1954, 61, 183–193. [Google Scholar] [CrossRef] [PubMed]
  35. Patricios, N.N. Urban design principles of the original neighbourhood concepts. Urban Morphol. 2002, 6, 21–32. [Google Scholar] [CrossRef]
  36. Ou, W.; Yao, X. Measurement of map information content-the general eigenvalue measuring method. Map 1988, 4, 3–7. Available online: https://kns.cnki.net/kcms2/article/abstract?v=ttOPOQ75YvIT1iD0tUMbDfzeRe6c5bJF_NkfK61K2EwMX3C_C7ySRCTHYXip45f0FlHPoKX7M79f4yCBhnpe6zY9IVe8s-V6RrKhCcccUCMezh5fCayVinJ5XAYJ2-finftnyO-QKPw=&uniplatform=NZKPT&language=CHS (accessed on 30 December 1988).
  37. Liu, P.; Li, X.; Liu, W.; Ai, T. Fourier-based multi-scale representation and progressive transmission of cartographic curves on the internet. Cartogr. Geogr. Inf. Sci. 2016, 43, 454–468. [Google Scholar] [CrossRef]
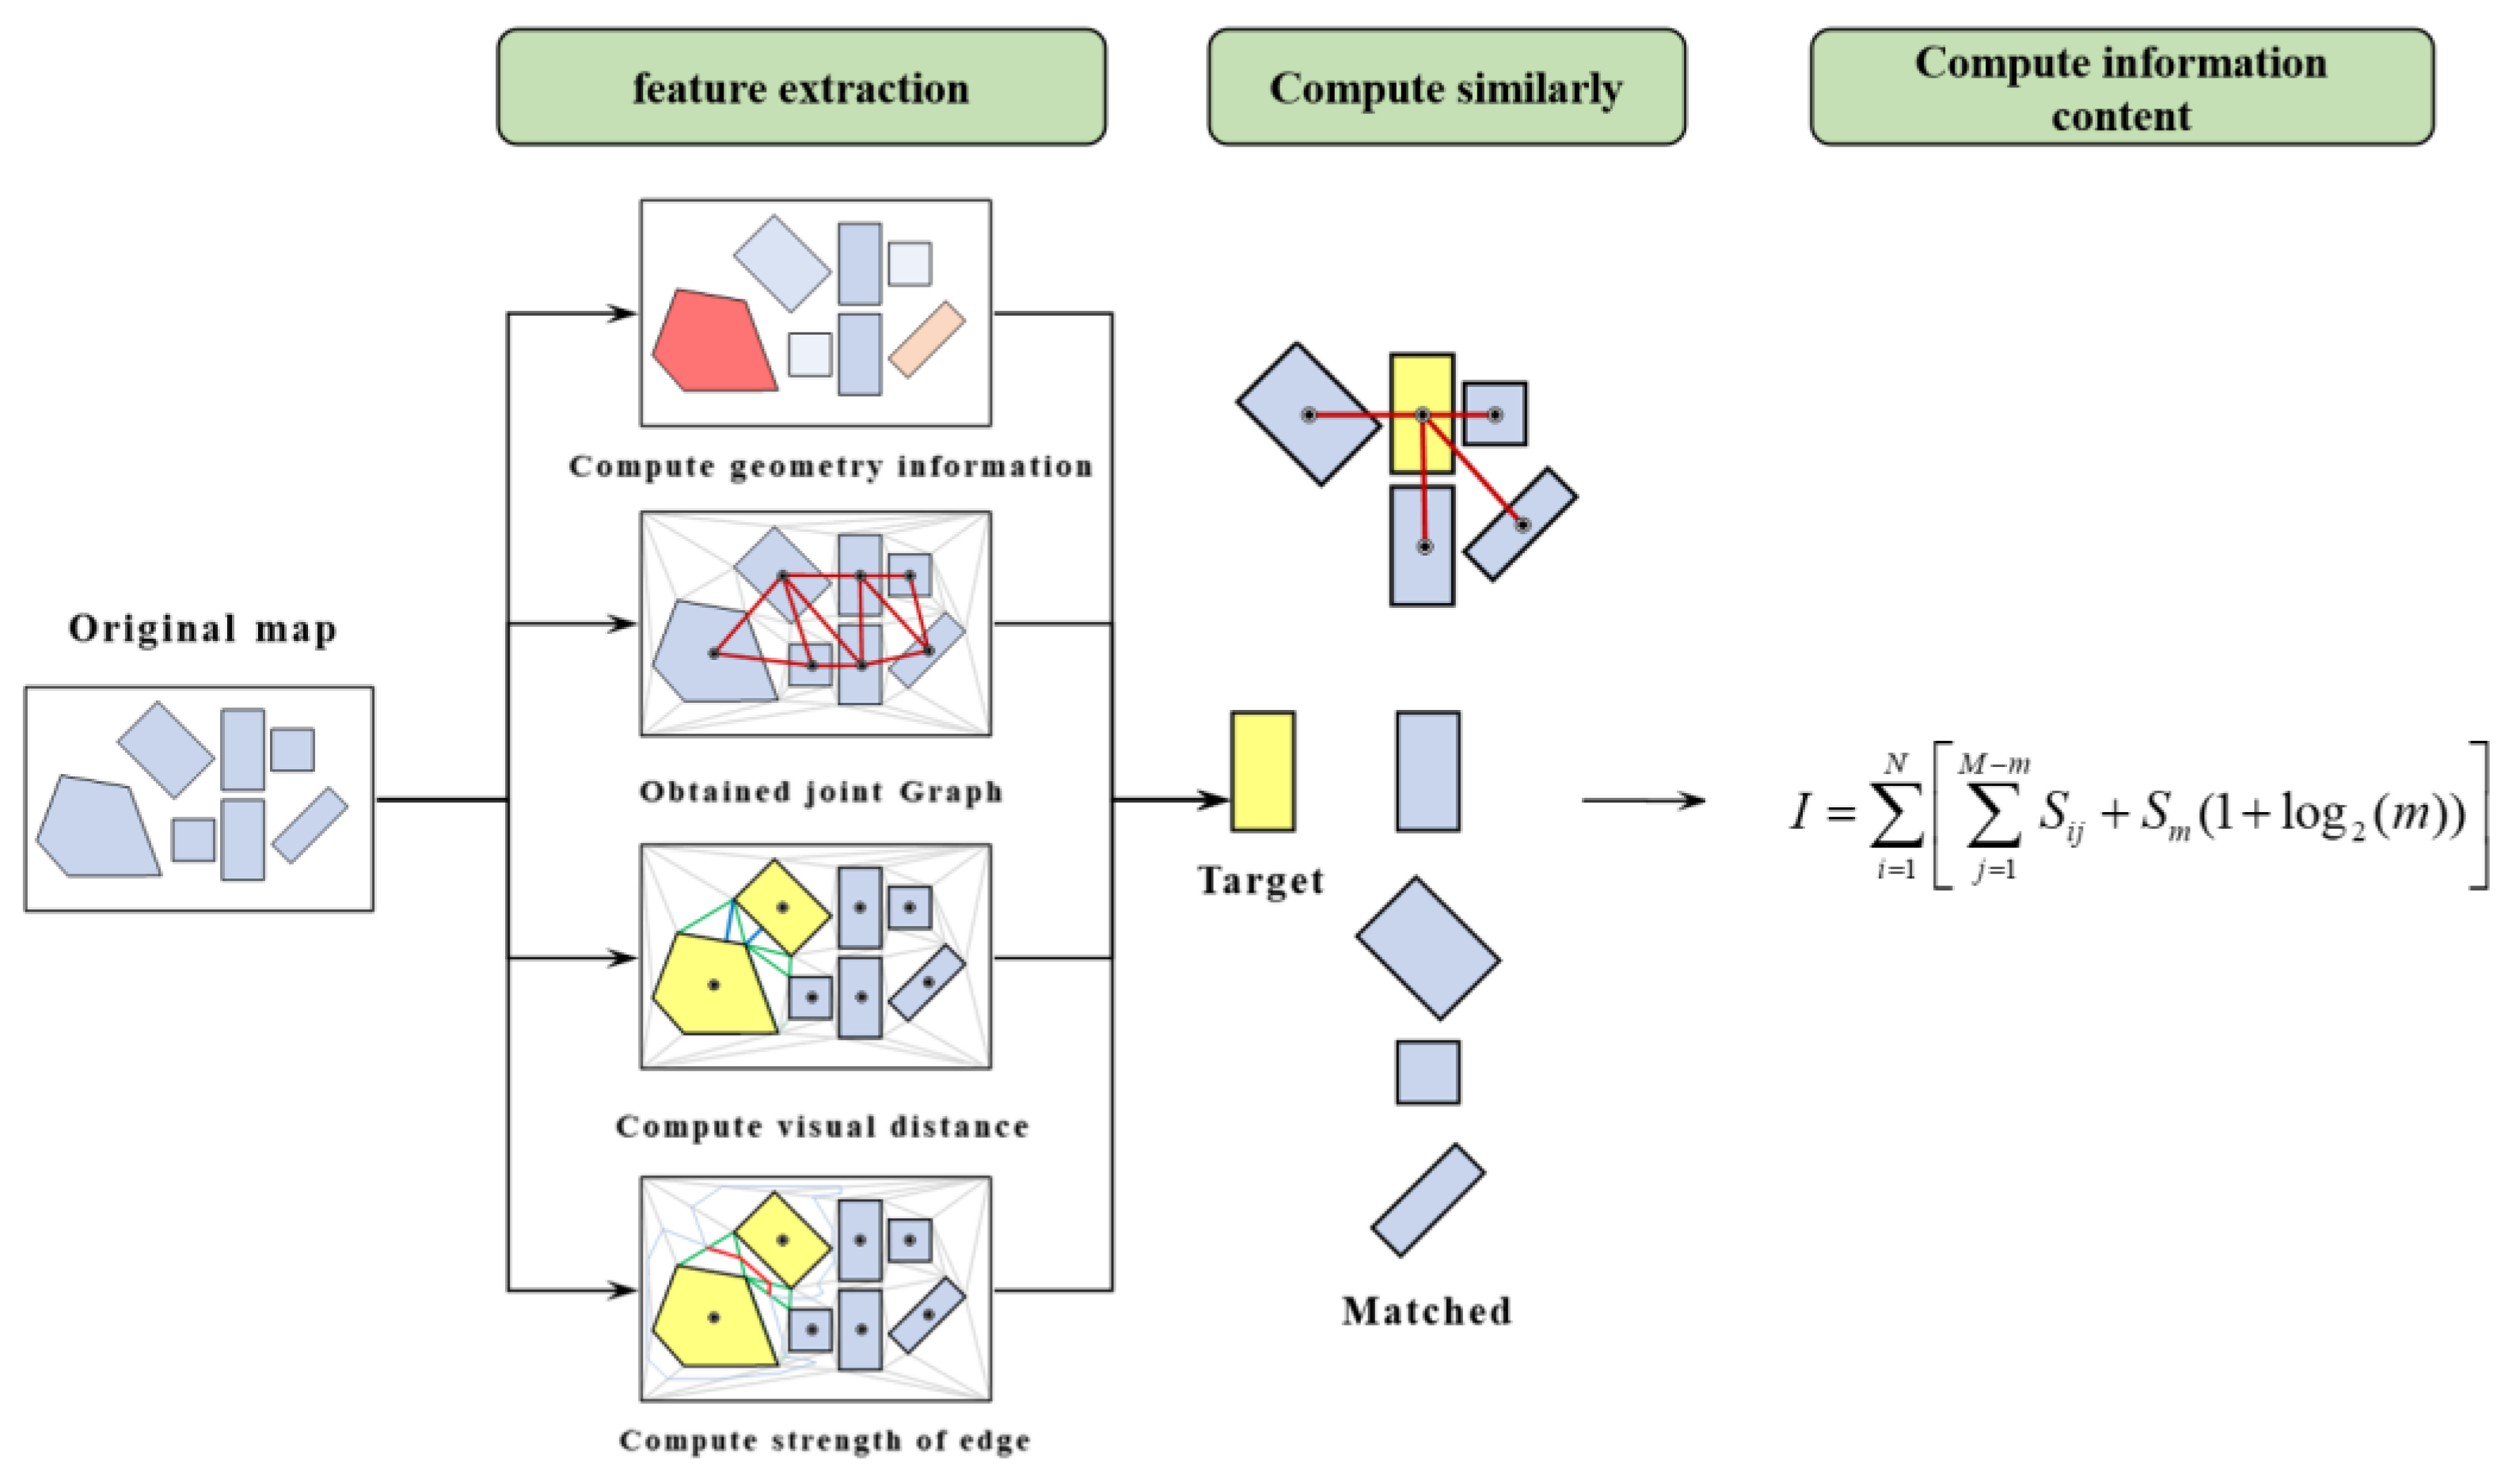
Figure 1. The overall framework of the method proposed in this paper.
Applsci 14 03764 g001
Figure 2. Schematic diagram of area objects with different geometric information content (A–G represent different area targets, the redder the color, the greater the geometric information; the bluer the color, the smaller the geometric information).
Applsci 14 03764 g002
Figure 3. Schematic diagram of connectivity diversity for different area objects. (A–G represent different area targets).
Applsci 14 03764 g003
Figure 4. Schematic diagram of visual distance between area objects. (A–G represent different area targets).
Applsci 14 03764 g004
Figure 5. Schematic diagram of diverse adjacency relationship characteristics of area objects. (A–G represent different area targets).
Applsci 14 03764 g005
Figure 6. Schematic diagram of visual repetition patterns.
Applsci 14 03764 g006
Figure 7. Schematic diagram of spatial distribution of artificial objects ((a) regular arrangement of similar area objects results in less spatial distribution information; (b) irregular arrangement of dissimilar area objects results in greater spatial distribution information).
Applsci 14 03764 g007
Figure 8. Simulated dataset of disordered arrangements of building objects.
Applsci 14 03764 g008
Figure 9. Area maps of natural objects with complex morphological characteristics.
Applsci 14 03764 g009
Figure 10. Schematic diagram of typical areal objects under continuous simplification conditions.
Applsci 14 03764 g010
Table 1. Comparative methods.
MethodCalculation FormulaDescription
Li’s methods for spatial distribution information C 1 = N c o n n e c t M Nconnect” represents the node degree; M represents the total number of connecting edges in a map.
Li’s methods for spatial geometric information I 1 = i = 1 N s i S log 2 s i S si represents the area of the ith object in the map space; S represents the total area of the map; and N represents the number of objects.
Liu’s methods for spatial distribution information C 2 = i = 1 N log 2 ( d i d a v e + 1 ) + log 2 ( V i V a v e V a v e + 1 ) di” represents the node degree; “Vi” represents the area of Voronoi diagram; N represents the total number of objects.
Liu’s methods for spatial geometric information I 2 = i = 1 N j = 1 M log 2 ( H c + 1 ) + log 2 ( H e + 1 ) Hc and He: the ratio of area and the number of edges between convex hull and area object, respectively.
He’s methods C 3 = i = 1 N log 2 ( c i + 1 ) + log 2 ( H i + 1 ) ci” represents the node degree; “Hi” represents the heterogeneity indicators of nodes.
Table 2. The measurement values of information content under different levels of disorder.
RankConnectiveC1C2C3Our Method
0536014802231.644422.57011309.227
1536414812230.939420.0261348.485
2536214782230.087425.09081409.523
3536214852231.759416.12311471.457
4536014922233.074411.85331543.956
5535814922233.3425.23871546.369
6535414992233.493405.16321594.553
7535015012233.887398.52231611.594
8535414982234.167407.96211619.731
9535414982233.201402.35841621.168
10535814982236.101411.77991629.375
Table 3. Statistical analysis of information content measurement results.
AttributeConnectiveC1C2C3Our Method
Corrcoef−0.72390.90140.868−0.70930.9453
Max_Value536415012236.1425.231629.37
Min_Value535014782230.08398.521309.22
Mean_Value535714912232.87413.331518.67
Variation amplitude14236.0226.71320.15
Variation Rate0.2%1.5%0.2%6.4%21%
Table 4. The measurement values of information content under different levels of simplification.
Simplify LevelC1I1C2I2Ours
02969.611.8330854474.118523.91123039.437
12957.2411.855784473.693459.582043008.314
22979.0481.8647834482.657408.665563001.555
32992.9581.8777724491.52374.946212965.198
42991.2721.8765974481.844340.932342905.929
52998.3511.8669264473.554319.914442868.867
63006.7351.8658574487.512297.978112825.236
72996.3691.865284478.236277.434542774.394
83004.5621.8645454493.601258.3272724.662
93003.7371.8634354482.578242.938312696.903
Table 5. Normalized measurement values of spatial information content under different levels of simplification.
Simplify LevelLi’s TotalLiu’s TotalOurs
00.98764911
10.9835460.9870440.9897602
20.9907970.978650.9875365
30.9954250.9736770.9755749
40.9948640.9649350.9560748
50.9972140.9590720.9438812
610.9574750.9295262
70.9965540.9515090.9127985
80.9992770.950760.8964363
90.9990030.9454760.8873033
Table 6. Normalized measurement values of geometric information content under different levels of simplification.
Simplify LevelLi’s Geo (I1)Liu’s Geo (I2)Ours
00.97620211
10.9882880.8772140.9897602
20.9930830.7800280.9875365
310.7156670.9755749
40.9993740.6507450.9560748
50.9942240.6106270.9438812
60.9936550.5687570.9295262
70.9933470.5295450.9127985
80.9929560.4930740.8964363
90.9923650.4637010.8873033
Disclaimer/Publisher’s Note: The statements, opinions and data contained in all publications are solely those of the individual author(s) and contributor(s) and not of MDPI and/or the editor(s). MDPI and/or the editor(s) disclaim responsibility for any injury to people or property resulting from any ideas, methods, instructions or products referred to in the content.