Analysis of Traffic Organisation in the Kiss-and-Fly Zone of Kraków Airport: Eye-Tracking Study
Abstract
1. Introduction
2. Prior Related Works
2.1. Kiss-and-Fly Zone as a Research Object
2.2. Eye-Tracking Technique and Road Signage
3. Field Study
3.1. Analysed Areas
3.2. Equipment and Participants
- Group I—came to the airport for the first time during the study (3 males and 4 females);
- Group II—had been there only once before the study or in the last few years have used the airport more than once (10 males and 3 females);
- Group III—visited the airport often because of their work (3 males).
3.3. Assessment of Road Signs
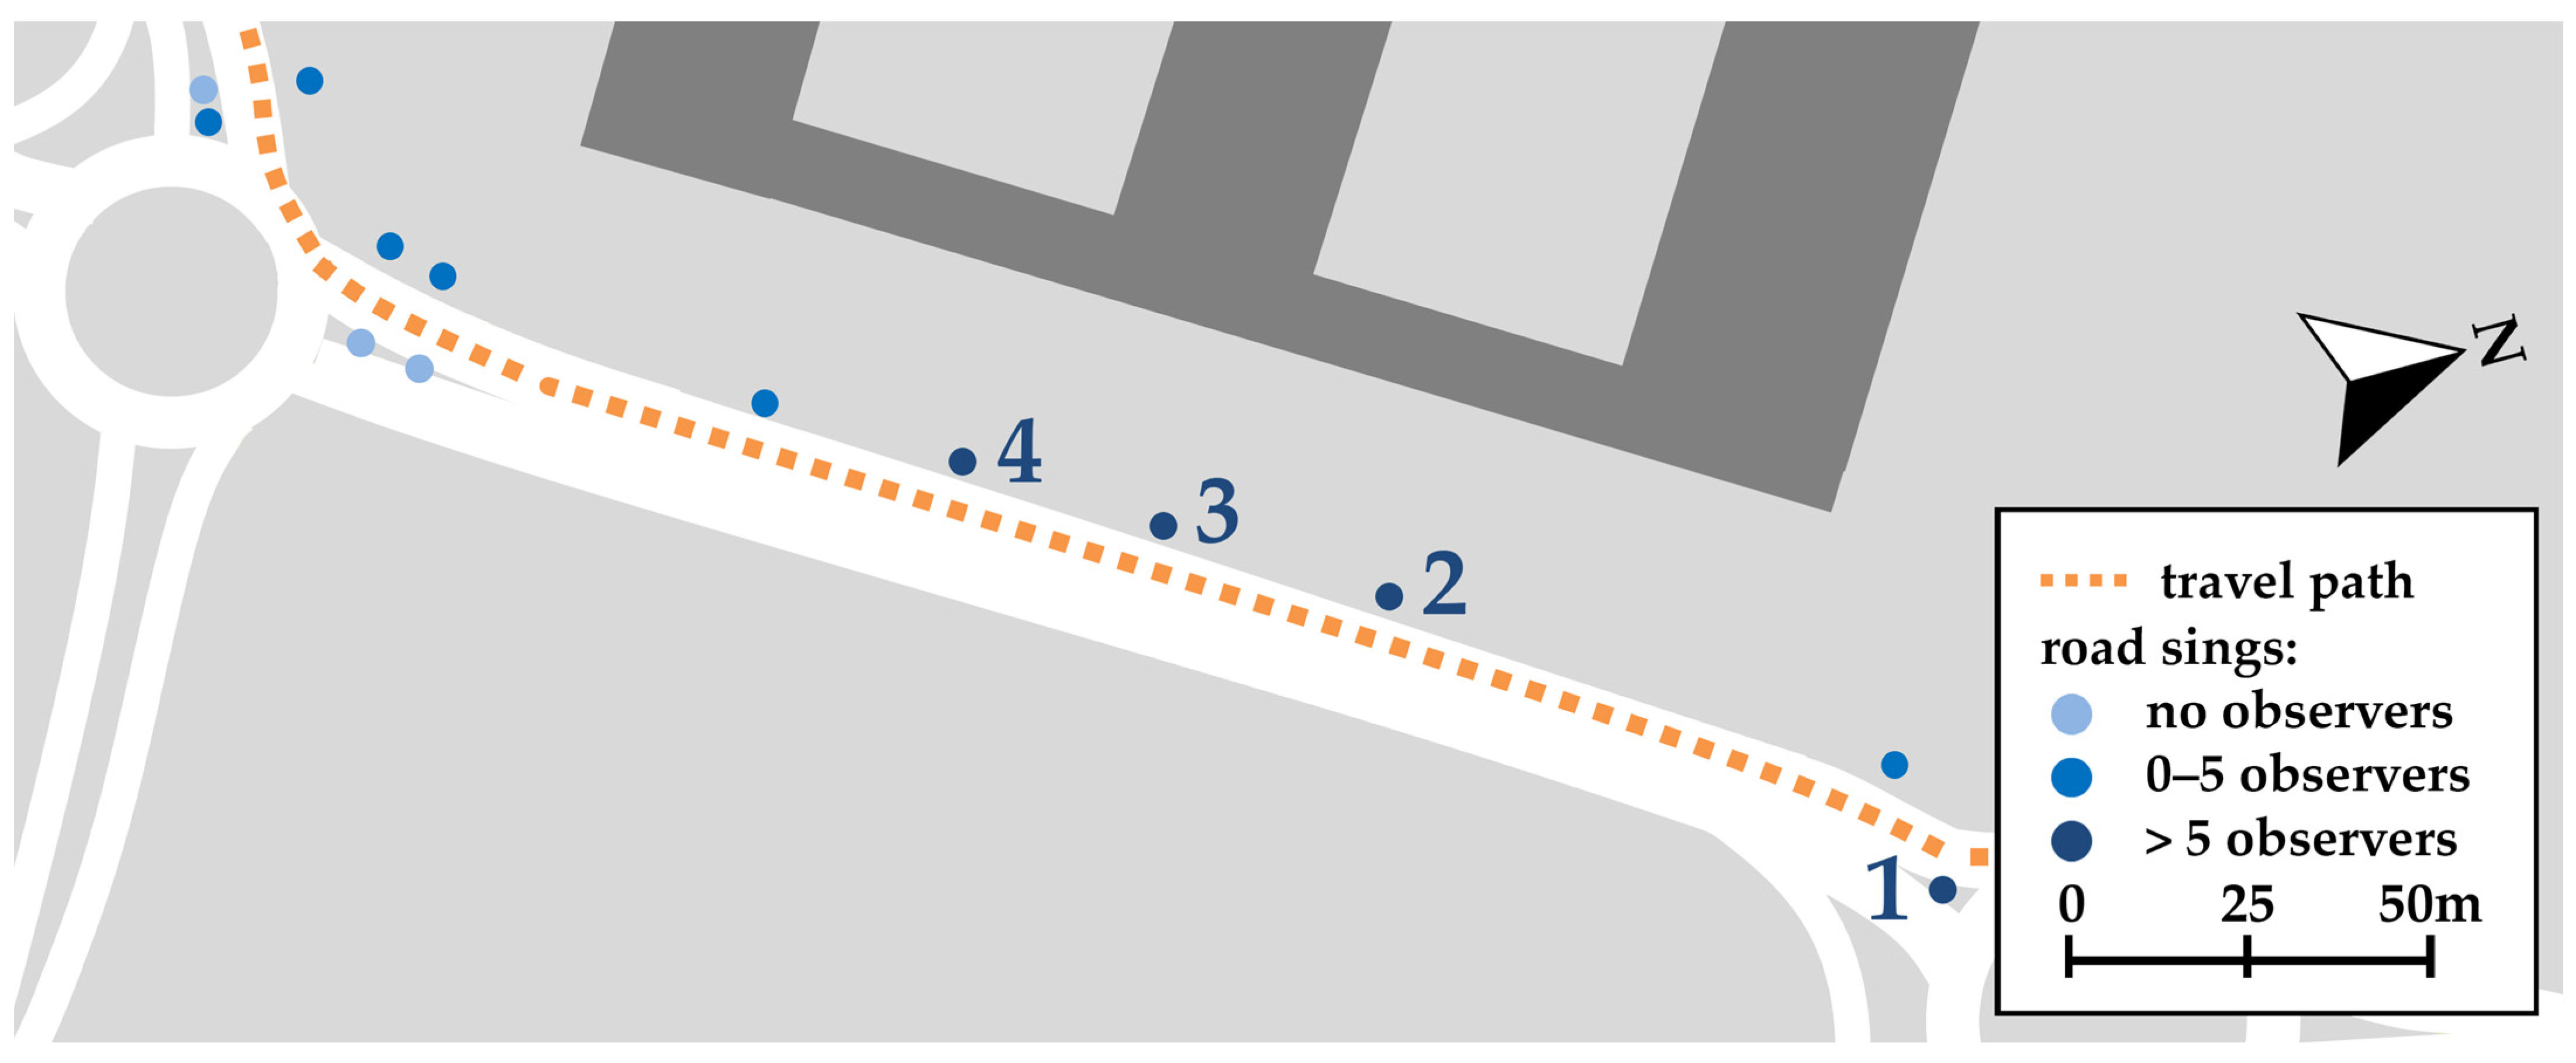
4. Overview of Road Signs Perception
4.1. Approach to Airport Surface Access
4.2. K&F Zone
5. Confusion Points of K&F Zone of Kraków Airport
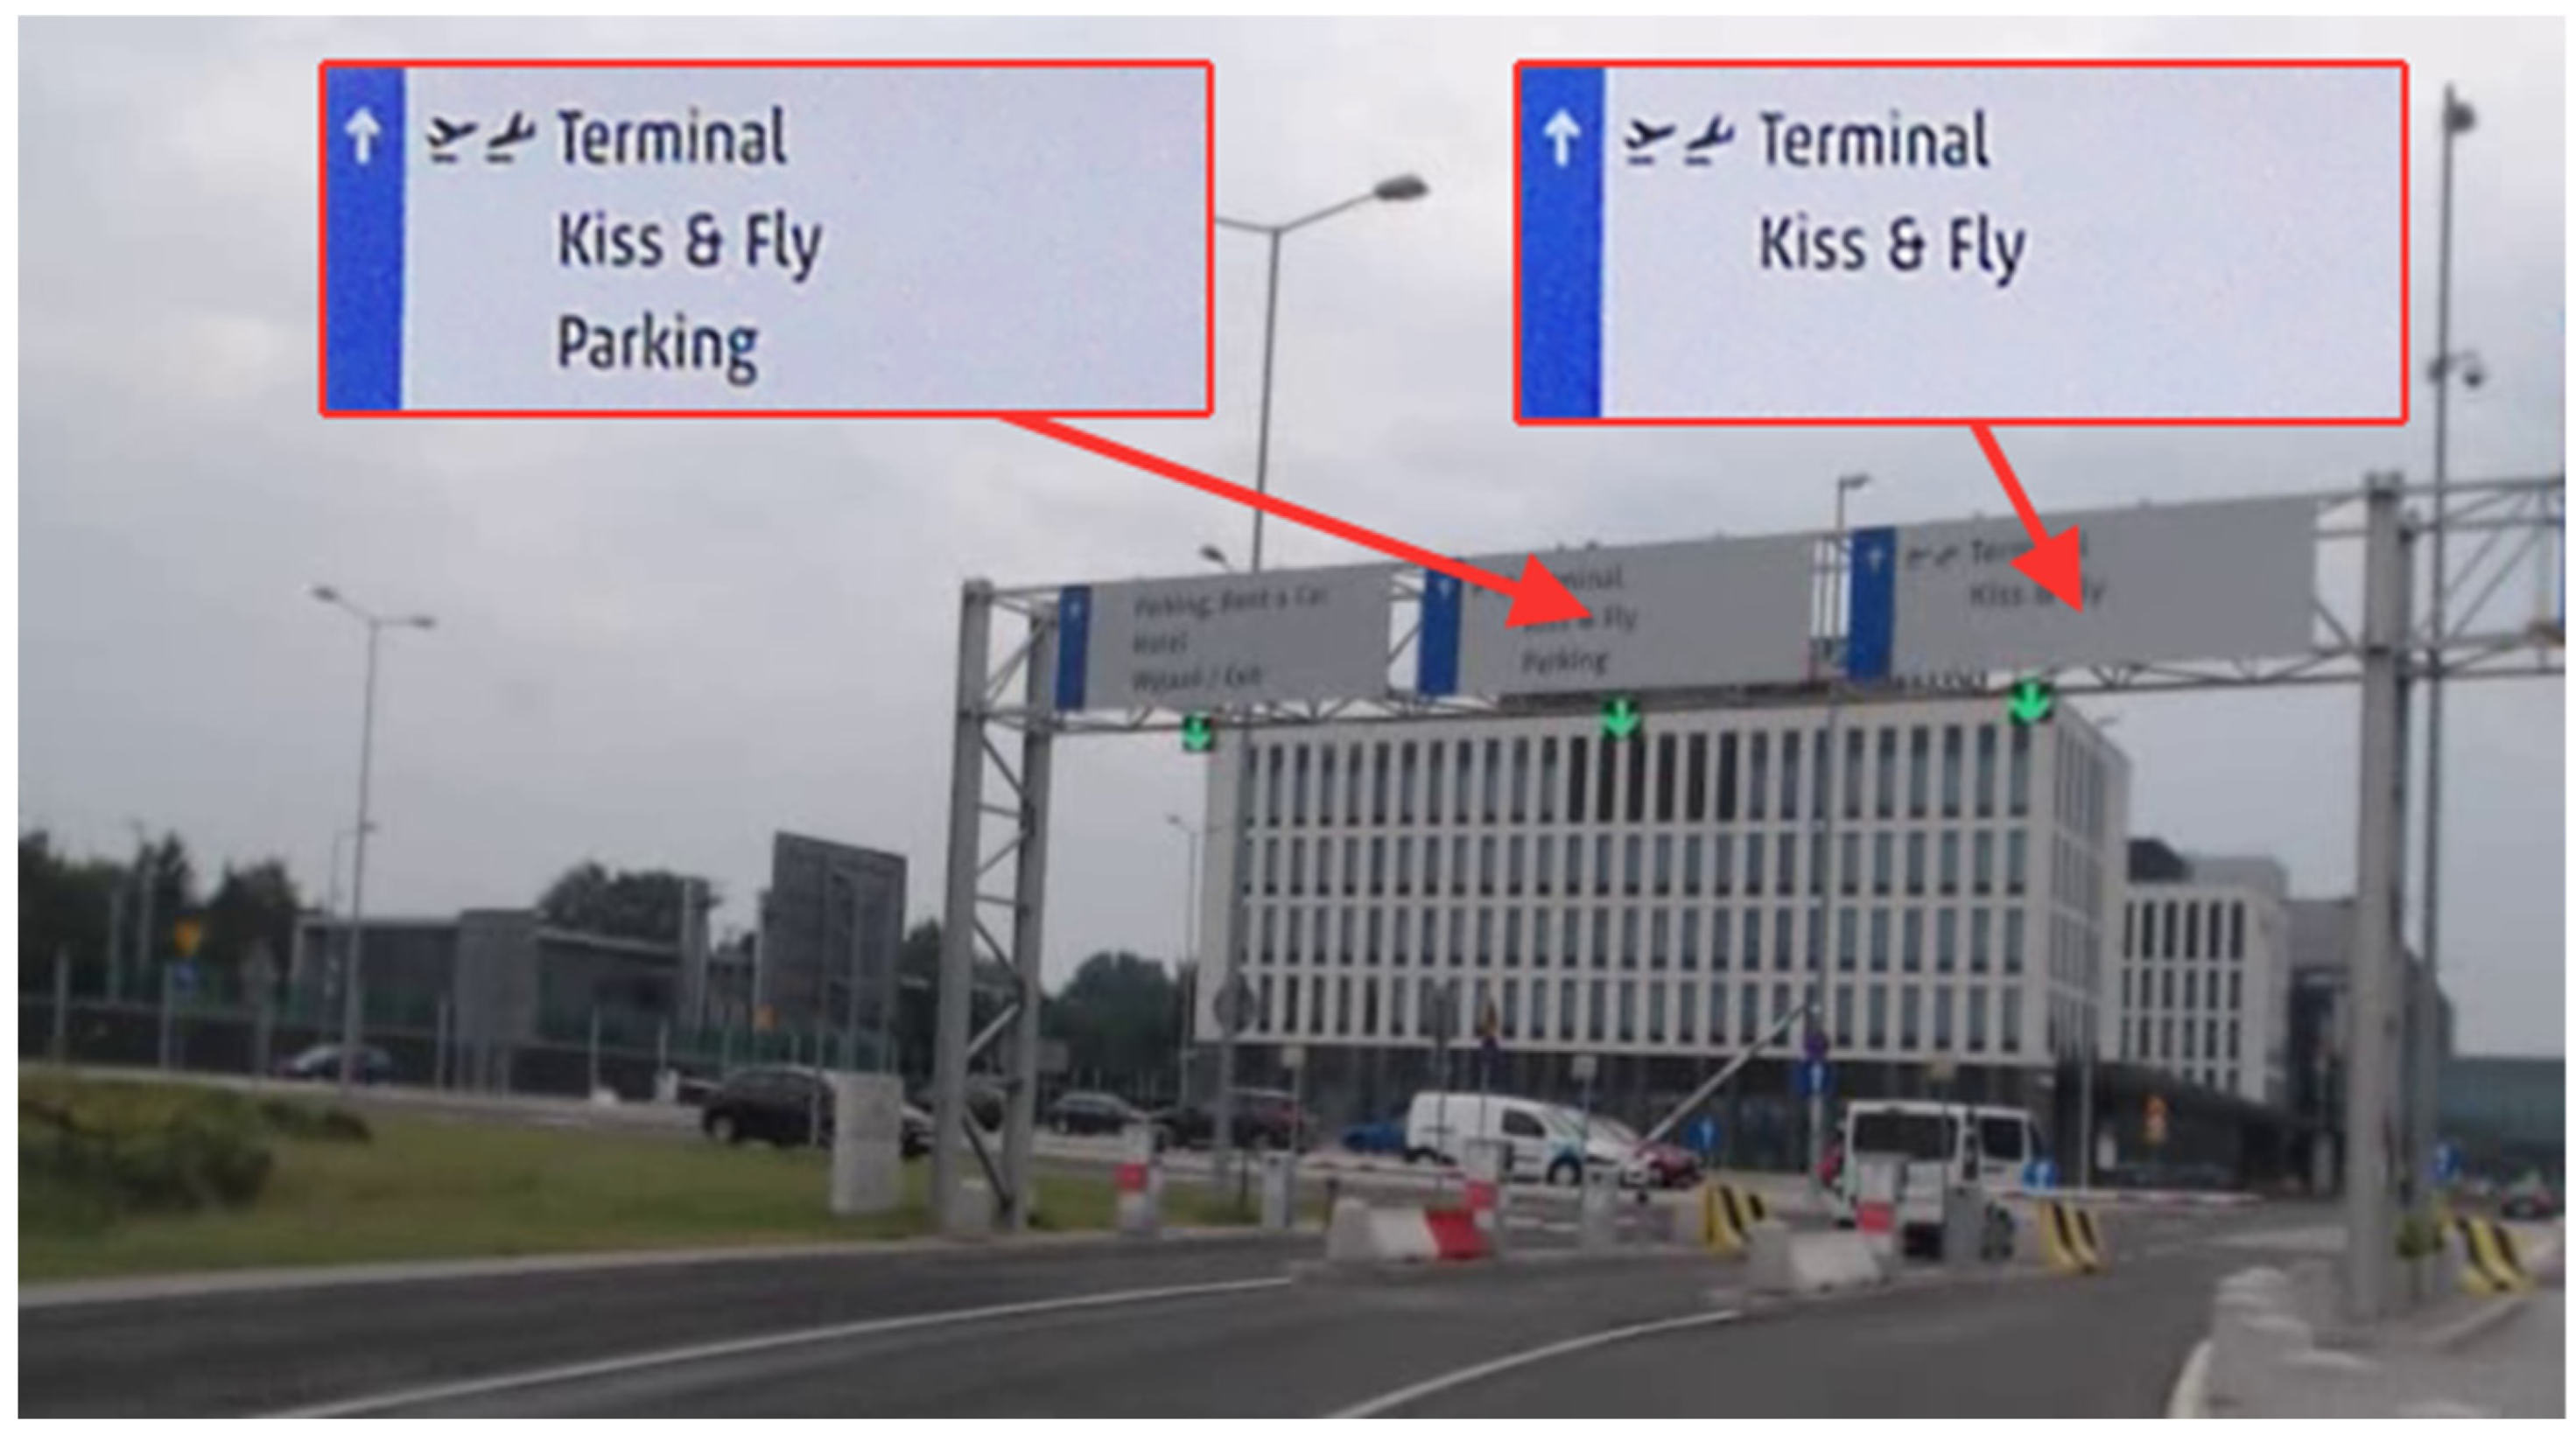
5.1. Entrance to the K&F Zone
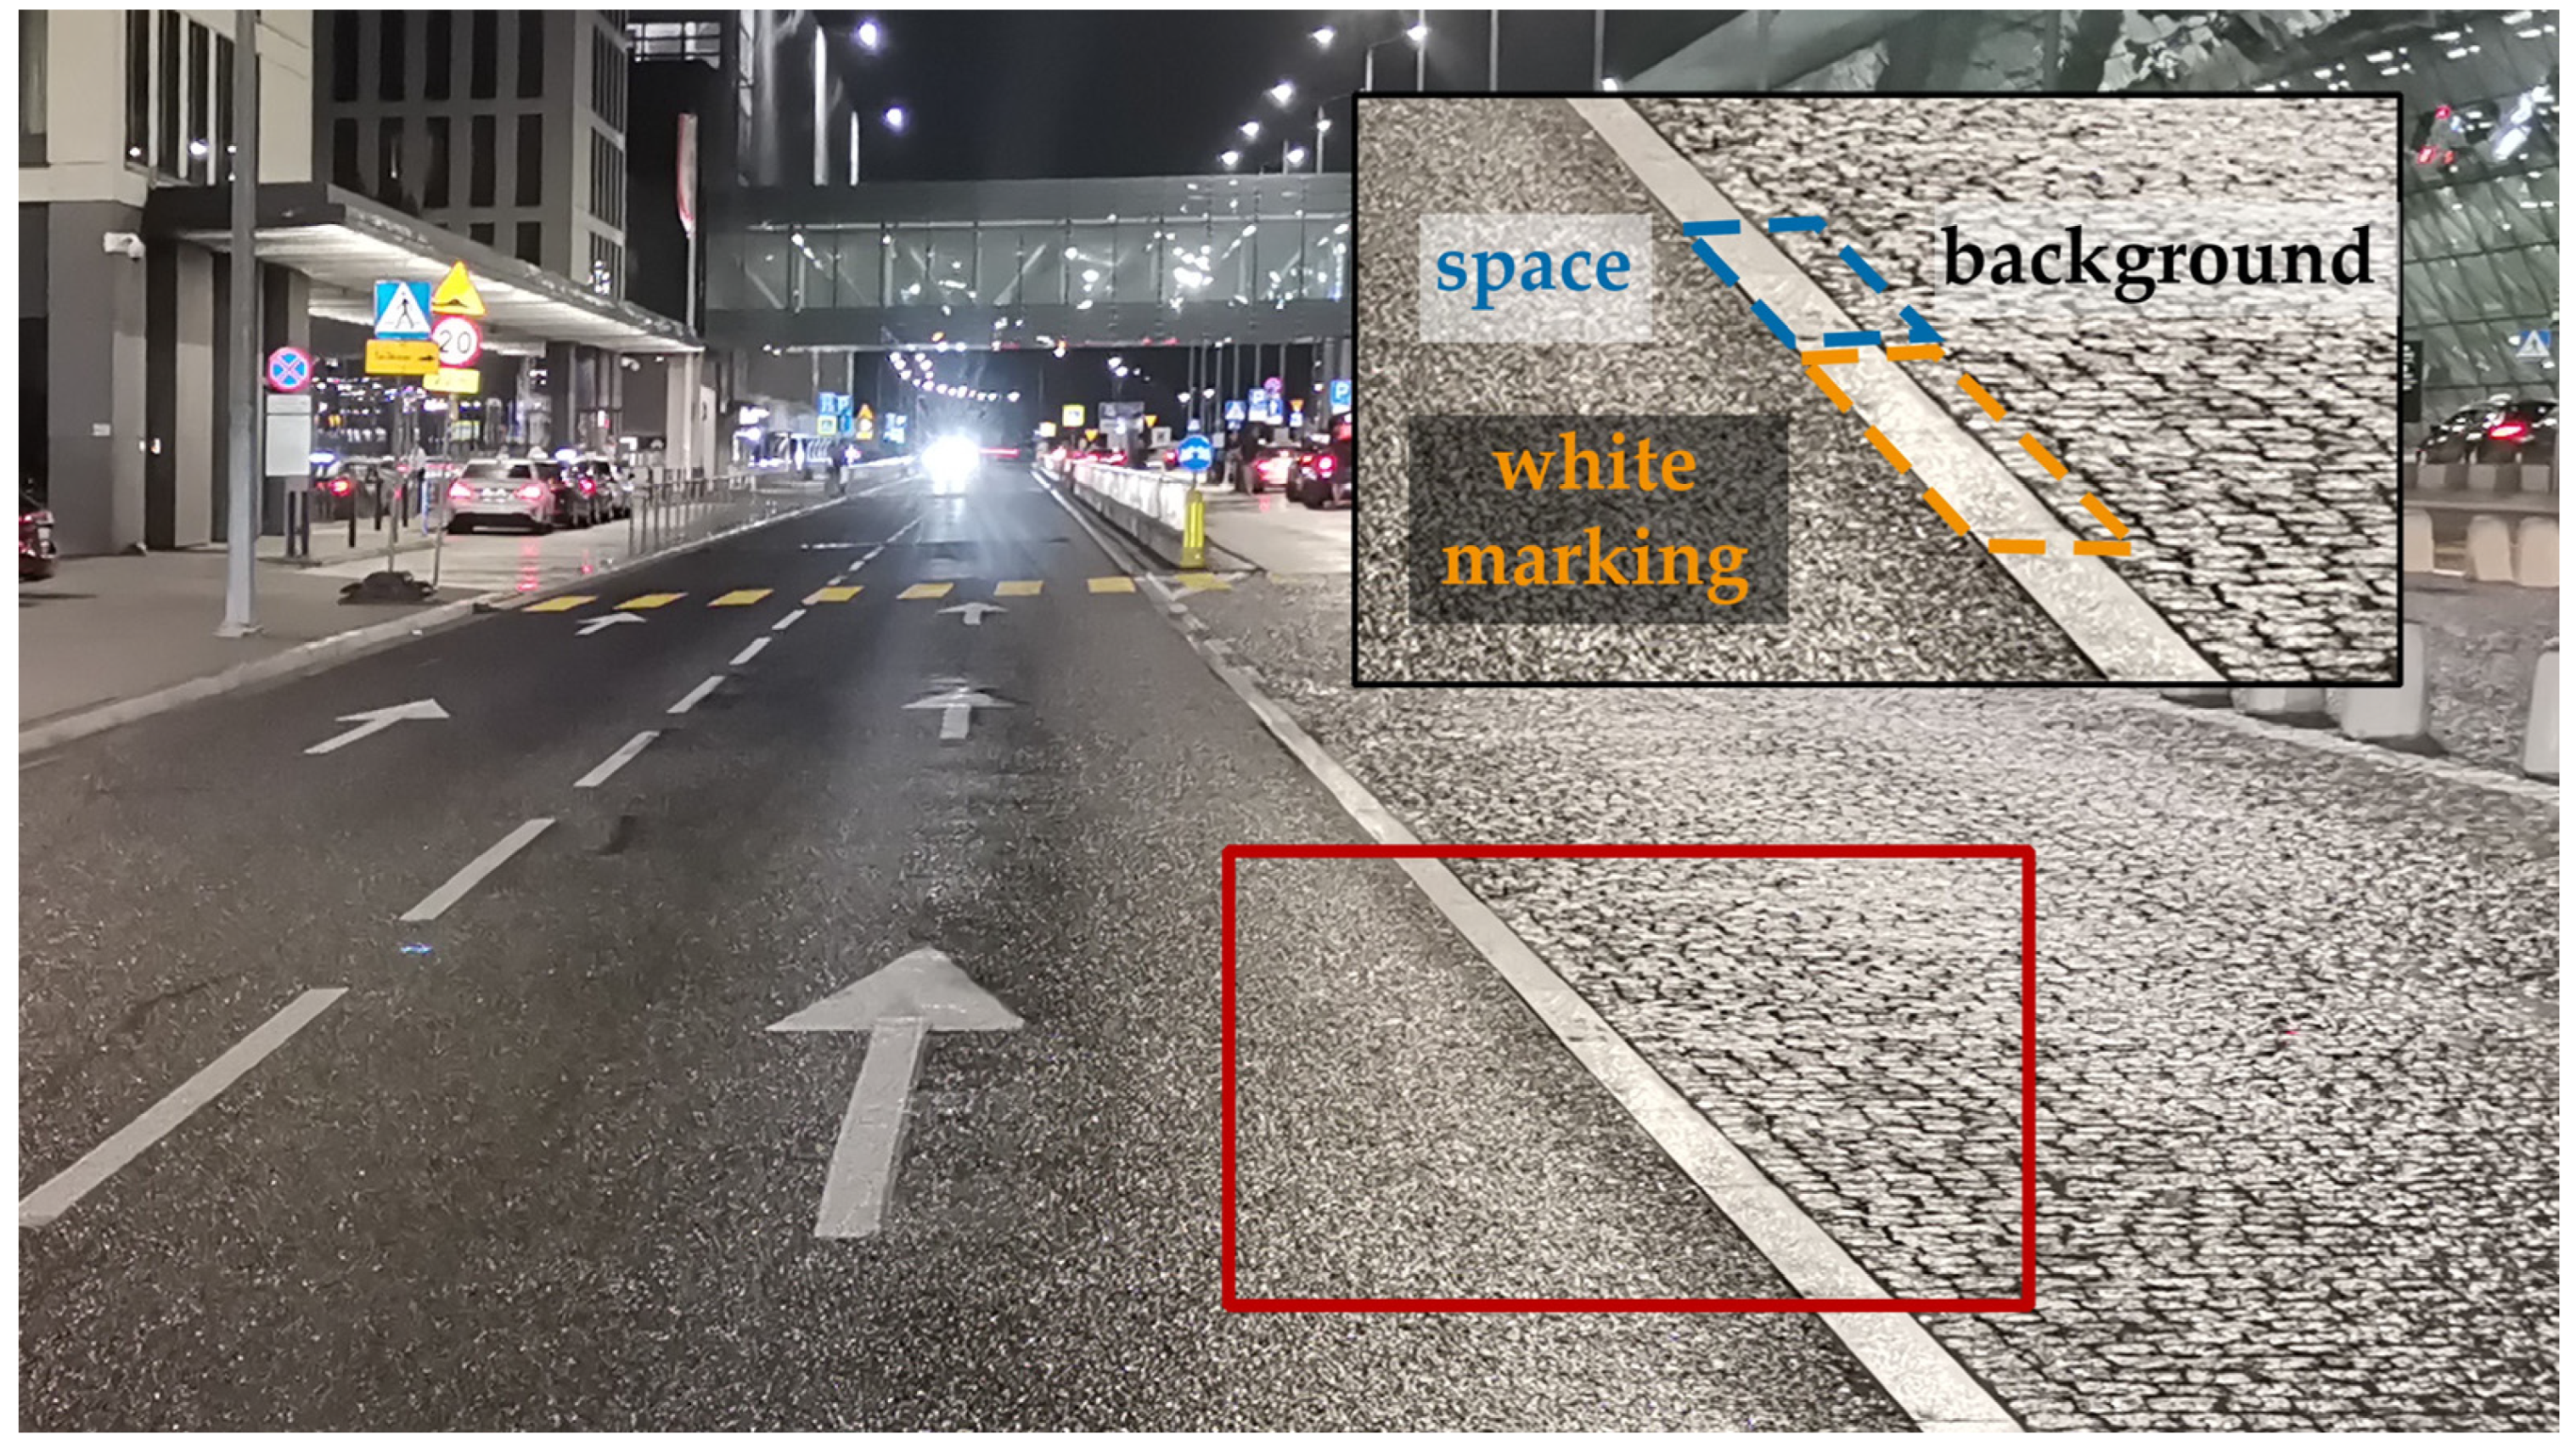
5.2. K&F Zone Itself
5.3. Exit from the K&F Zone
6. Conclusions
Author Contributions
Funding
Institutional Review Board Statement
Informed Consent Statement
Data Availability Statement
Acknowledgments
Conflicts of Interest
References
- Polyzos, S.; Tsiotas, D. The Contribution of transport infrastructures to the economic and regional development. Theor. Empir. Res. Urban Manag. 2020, 15, 5–23. [Google Scholar]
- Smolnik, P. Infrastruktura drogowa w Polsce w latach 2010–2014. TTS Tech. Transp. Szyn. 2015, 22, 2113–2118. [Google Scholar]
- Szczepański, M.; Grzyl, B. Technical and economic analysis of the implementation of selected variants of road investment. Buildings 2020, 10, 97. [Google Scholar] [CrossRef]
- Rockwell, T.H. Eye movement analysis of visual information acquisition in driving: An overview. In Proceedings of the 6th Australian Road Research Board (ARRB) Conference, Canberra, Australia, 14–18 August 1972. [Google Scholar]
- Mourant, R.R.; Rockwell, T.H. Mapping Eye-Movement Patterns to the Visual Scene in Driving: An Exploratory Study. Hum. Factors 1970, 12, 81–87. [Google Scholar] [CrossRef] [PubMed]
- Taylor, T.; Pradhan, A.K.; Divekar, G.; Romoser, M.; Muttart, J.; Gomez, R.; Pollatsek, A.; Fisher, D.L. The view from the road: The contribution of on-road glance-monitoring technologies to understanding driver behaviour. Accid. Anal. Prev. 2013, 58, 175–186. [Google Scholar] [CrossRef] [PubMed]
- Mantuano, A.; Bernardi, S.; Rupi, F. Cyclist Gaze Behavior in Urban Space: An Eye-Tracking Experiment on the Bicycle Network of Bologna. Case Stud. Transp. Policy 2017, 5, 408–416. [Google Scholar] [CrossRef]
- Liao, H.; Dong, W.; Huang, H.; Gartner, G.; Liu, H. Inferring User Tasks in Pedestrian Navigation from Eye Movement Data in Real-World Environments. Int. J. Geogr. Inf. Sci. 2019, 33, 739–763. [Google Scholar] [CrossRef]
- Pashkevich, A.; Bairamov, E.; Burghardt, T.E.; Sucha, M. Finding the Way at Kraków Główny Railway Station: A Detail of Confusion Points in Eye Tracker Experiment. In Reliability and Statistics in Transportation and Communication, RelStat 2019, Lecture Notes in Networks and Systems; Kabashkin, I., Yatskiv, I., Prentkovskis, O., Eds.; Springer: Cham, Switzerland, 2020; Volume 117, pp. 187–196. [Google Scholar] [CrossRef]
- Budd, T.; Ryley, T.; Ison, S. Airport ground access and private car use: A segmentation analysis. J. Transp. Geogr. 2014, 36, 106–115. [Google Scholar] [CrossRef]
- Janic, M. Analyzing, modelling, and assessing the performances of land use by airports. Int. J. Sustain. Transp. 2016, 10, 683–702. [Google Scholar] [CrossRef]
- Duda, U.; Starowicz, W. Strefy krótkiego postoju kiss and ride. Transp. Miej. I Reg. = Urban Reg. Transp. 2014, 12, 18–24. (In Polish) [Google Scholar]
- Marsden, G.R.; Kamal, P.; Muir, H. Kiss and Fly—A study of the impacts at a UK regional airport. In Proceedings of the 38th Annual Universities’ Transport Studies Group Conference, University College Dublin, Dublin, Ireland, 4–7 January 2006. [Google Scholar]
- Akar, G. Ground access to airports, case study: Port Columbus International Airport. J. Air Transp. Manag. 2013, 30, 25–31. [Google Scholar] [CrossRef]
- Duda, U. Przegląd stosowanego w wybranych krajach oznakowania stref kiss and ride. Transp. Miej. I Reg. = Urban Reg. Transp. 2015, 1, 3–8. (In Polish) [Google Scholar]
- Budd, T.; Ison, S.; Ryley, T. Airport surface access in the UK: A management perspective. Res. Transp. Bus. Manag. 2011, 1, 109–117. [Google Scholar] [CrossRef]
- Miyoshi, C.; Mason, K.J. The damage cost of carbon dioxide emissions produced by passengers on airport surface access: The case of Manchester Airport. J. Transp. Geogr. 2013, 28, 137–143. [Google Scholar] [CrossRef]
- Horonjeff, R.; McKelvey, F.; Sproule, W.; Young, S. Planning and Design of Airports, 5th ed.; The McGraw-Hill Companies, Inc.: New York, NY, USA, 2010; pp. 383–461. [Google Scholar]
- Tsamboulas, D.A.; Nikoleris, A. Passengers’ willingness to pay for airport ground access time savings. Transp. Res. Part A Policy Pract. 2008, 42, 1274–1282. [Google Scholar] [CrossRef]
- Hong, K.M.; Baek, B.R.; Kim, H.M. Impact Analysis of Transportation Network by The Installation of Kiss & Ride Zone. Int. J. Highw. Eng. 2013, 15, 145–156. [Google Scholar] [CrossRef]
- Gasz, K. Marking and use of Kiss & Ride car parks. Transp. Overv. Przegląd Komun. 2020, 1, 14–30. [Google Scholar] [CrossRef]
- Lee, J.D. Fifty years of driving safety research. Hum. Factors J. Hum. Factors Ergon. Soc. 2008, 50, 521–528. [Google Scholar] [CrossRef] [PubMed]
- Babić, D.; Babić, D.; Fiolic, M.; Ferko, M. Road Markings and Signs in Road Safety. Encyclopedia 2022, 2, 1738–1752. [Google Scholar] [CrossRef]
- Shinar, D.; Dewar, R.E.; Summala, H.; Zakowska, L. Traffic sign symbol comprehension: A cross-cultural study. Ergonomics 2003, 46, 1549–1565. [Google Scholar] [CrossRef]
- Ben-Bassat, T.; Shinar, D. The effect of context and drivers’ age on highway traffic signs comprehension. Transp. Res. Part F Traffic Psychol. Behav. 2015, 33, 117–127. [Google Scholar] [CrossRef]
- Liu, B.; Sun, L.; Rong, J. Driver’s visual cognition behaviors of traffic signs based on eye movement parameters. J. Transp. Syst. Eng. Inf. Technol. 2011, 11, 22–27. [Google Scholar] [CrossRef]
- Siswandari, Y.; Xiong, S. Eye movements and brain oscillations to symbolic safety signs with different comprehensibility. J. Physiol. Anthropol. 2015, 34, 42. [Google Scholar] [CrossRef] [PubMed]
- Tejero, P.; Insa, B.; Roca, J. Increasing the default interletter spacing of words can help drivers to read traffic signs at longer distances. Accid. Anal. Prev. 2018, 117, 298–303. [Google Scholar] [CrossRef] [PubMed]
- Babić, D.; Dijanić, H.; Jakob, L.; Babić, D.; Garcia-Garzon, E. Driver eye movements in relation to unfamiliar traffic signs: An eye tracking study. Appl. Ergon. 2020, 89, 103191. [Google Scholar] [CrossRef] [PubMed]
- Costa, A.T.; Figueira, A.C.; Larocca, A.P.C. An eye-tracking study of the effects of dimensions of speed limit traffic signs on a mountain highway on drivers’ perception. Transp. Res. Part F Psychol. Behav. 2022, 87, 42–53. [Google Scholar] [CrossRef]
- Costa, M.; Simone, A.; Vignali, V.; Lantieri, C.; Bucchi, A.; Dondi, G. Looking behavior for vertical road signs. Transp. Res. Part F Traffic Psychol. Behav. 2014, 23, 147–155. [Google Scholar] [CrossRef]
- Costa, M.; Bonetti, L.; Vignali, V.; Lantieri, C.; Simone, A. The role of peripheral vision in vertical road sign identification and discrimination. Ergonomics 2018, 61, 1619–1634. [Google Scholar] [CrossRef]
- Vignali, V.; Bichicchi, A.; Simone, A.; Lantieri, C.; Dondi, G.; Costa, M. Road sign vision and driver behaviour in work zones. Transp. Res. Part F Traffic Psychol. Behav. 2019, 60, 474–484. [Google Scholar] [CrossRef]
- Babić, D.; Fiolić, M.; Babić, D.; Gates, T. Road Markings and Their Impact on Driver Behaviour and Road Safety: A Systematic Review of Current Findings. J. Adv. Transp. 2020, 2020, 7843743. [Google Scholar] [CrossRef]
- Pashkevich, A.; Burghardt, T.E.; Kubek, D. Drivers’ gazes at horizontal road markings ahead of intersections. In Proceedings of the International Conference on Traffic and Transport Engineering (ICTTE 2018), Belgrade, Serbia, 27–28 September 2018. [Google Scholar]
- Pashkevich, A.; Burghardt, T.E.; Shubenkova, K.; Makarova, I. Analysis of Drivers’ Eye Movements to Observe Horizontal Road Markings Ahead of Intersections. In Vision Zero for Sustainable Road Safety in Baltic Sea Region. VISZERO 2018; Varhelyi, A., Žuraulis, V., Prentkovskis, O., Eds.; Lecture Notes in Intelligent Transportation and Infrastructure; Springer: Cham, Switzerland, 2020; pp. 1–10. [Google Scholar] [CrossRef]
- Meldrum, J.F. Automobile Driver Eye Position. SAE Trans. 1966, 74, 599–609. [Google Scholar]
- Hammond, D.C.; Roe, R.W. Driver Head and Eye Positions. SAE Trans. 1972, 81, 786–800. [Google Scholar]
- Sun, X.; Wandelt, S.; Fricke, H.; Rosenow, J. The Impact of COVID-19 on Air Transportation Network in the United States, Europe, and China. Sustainability 2021, 13, 9656. [Google Scholar] [CrossRef]
- Tolcha, T.D. The state of Africa’s air transport market amid COVID-19, and forecasts for recovery. J. Air Transp. Manag. 2023, 108, 102380. [Google Scholar] [CrossRef] [PubMed]
- Pashkevich, A.; Bartusiak, J.; Burghardt, T.E.; Šucha, M. Naturalistic Driving Study: Methodological Aspects and Exemplary Analysis of a Long Roadwork Zone. In Research Methods in Modern Urban Transportation Systems and Networks; Macioszek, E., Sierpiński, G., Eds.; Lecture Notes in Networks and Systems; Springer: Cham, Switzerland, 2021; pp. 165–183. [Google Scholar] [CrossRef]
- Pashkevich, A.; Burghardt, T.E.; Krawiec, A.; Piegza, A.; Żakowska, L. Phantomatic road works in Poland: A view from a dashboard cam. Transp. Telecommun. 2023, 24, 385–396. [Google Scholar] [CrossRef]
- Brémond, R. Visual performance models in road lighting: A historical perspective. LEUKOS 2020, 17, 212–241. [Google Scholar] [CrossRef]
- Burghardt, T.E.; Pashkevich, A. Contrast Ratio of Road Markings in Poland—Evaluation for Machine Vision Applications Based on Naturalistic Driving Study. In Advances in Road Infrastructure and Mobility. IRF 2021; Akhnoukh, A., Kaloush, K., Elabyad, M., Halleman, B., Erian, N., Enmon, S., II, Henry, C., Eds.; Sustainable Civil Infrastructures; Springer: Cham, Switzerland, 2022; pp. 676–690. [Google Scholar] [CrossRef]
- Burghardt, T.E.; Pashkevich, A. Camera contrast ratio of road markings at dual carriageway roads. Transp. Res. Procedia 2023, 72, 2286–2293. [Google Scholar] [CrossRef]
- Theeuwes, J.; Godthelp, H. Self-explaining roads. Saf. Sci. 1995, 19, 217–225. [Google Scholar] [CrossRef]
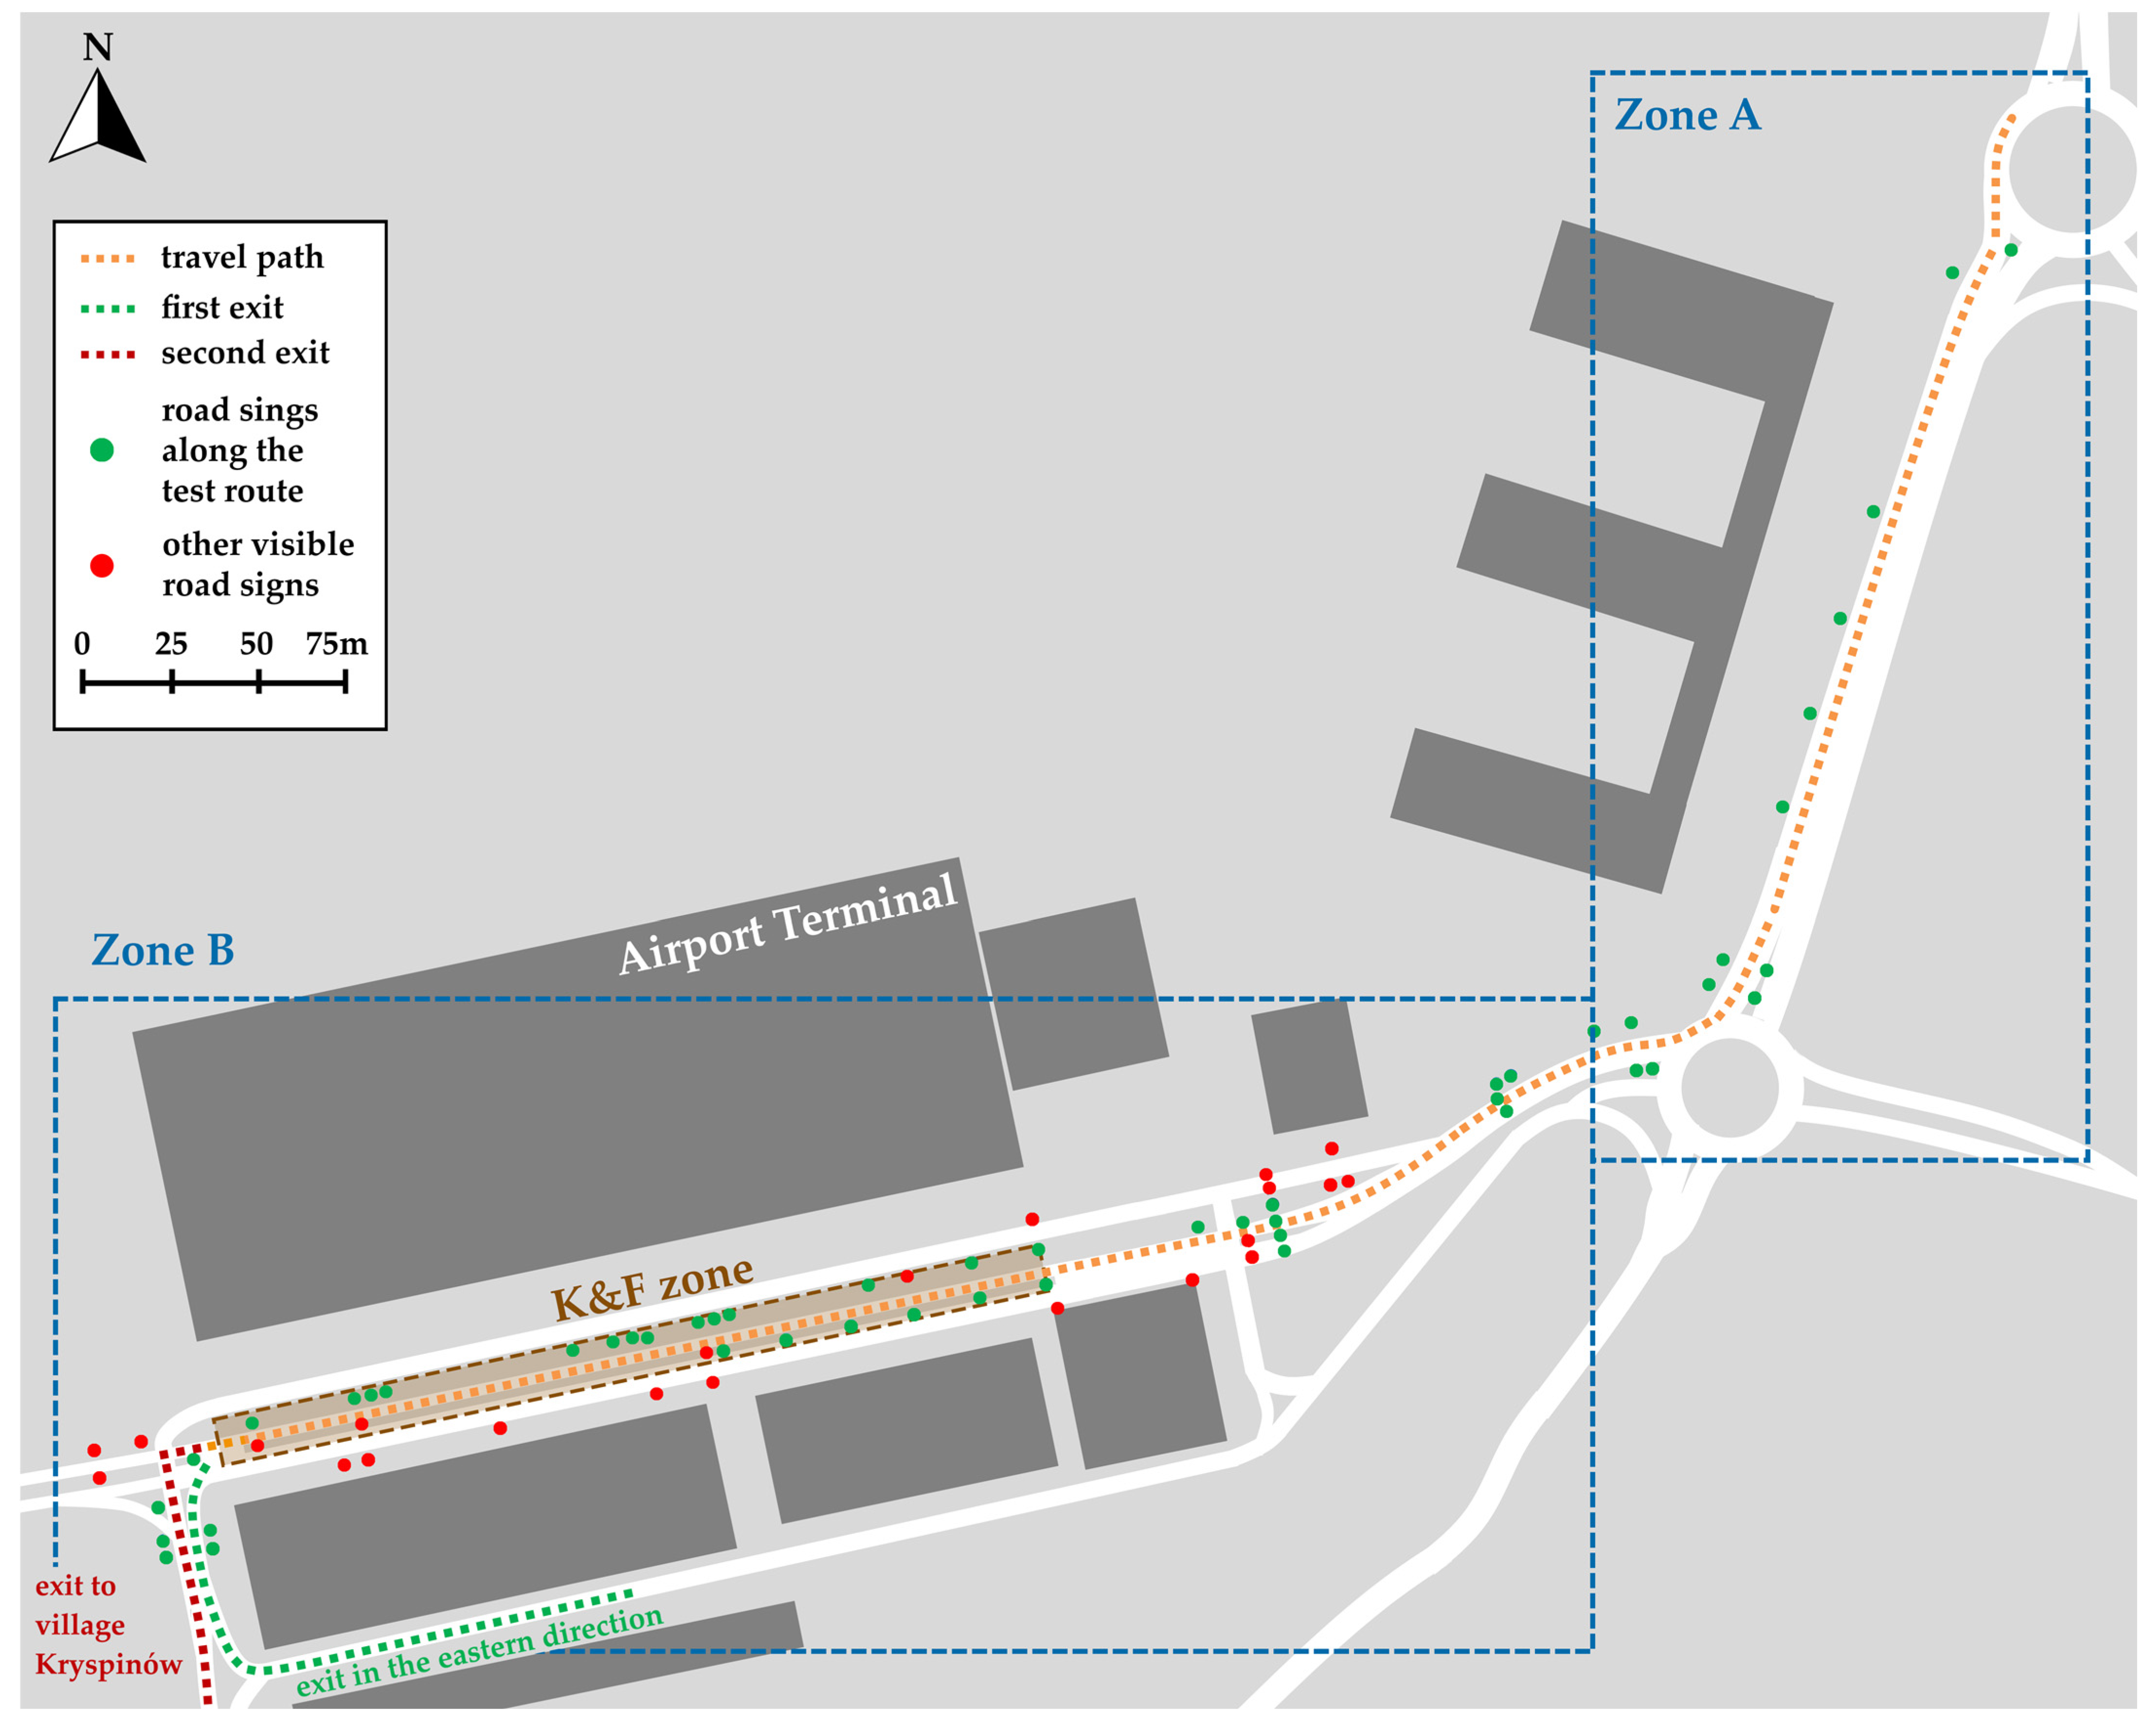



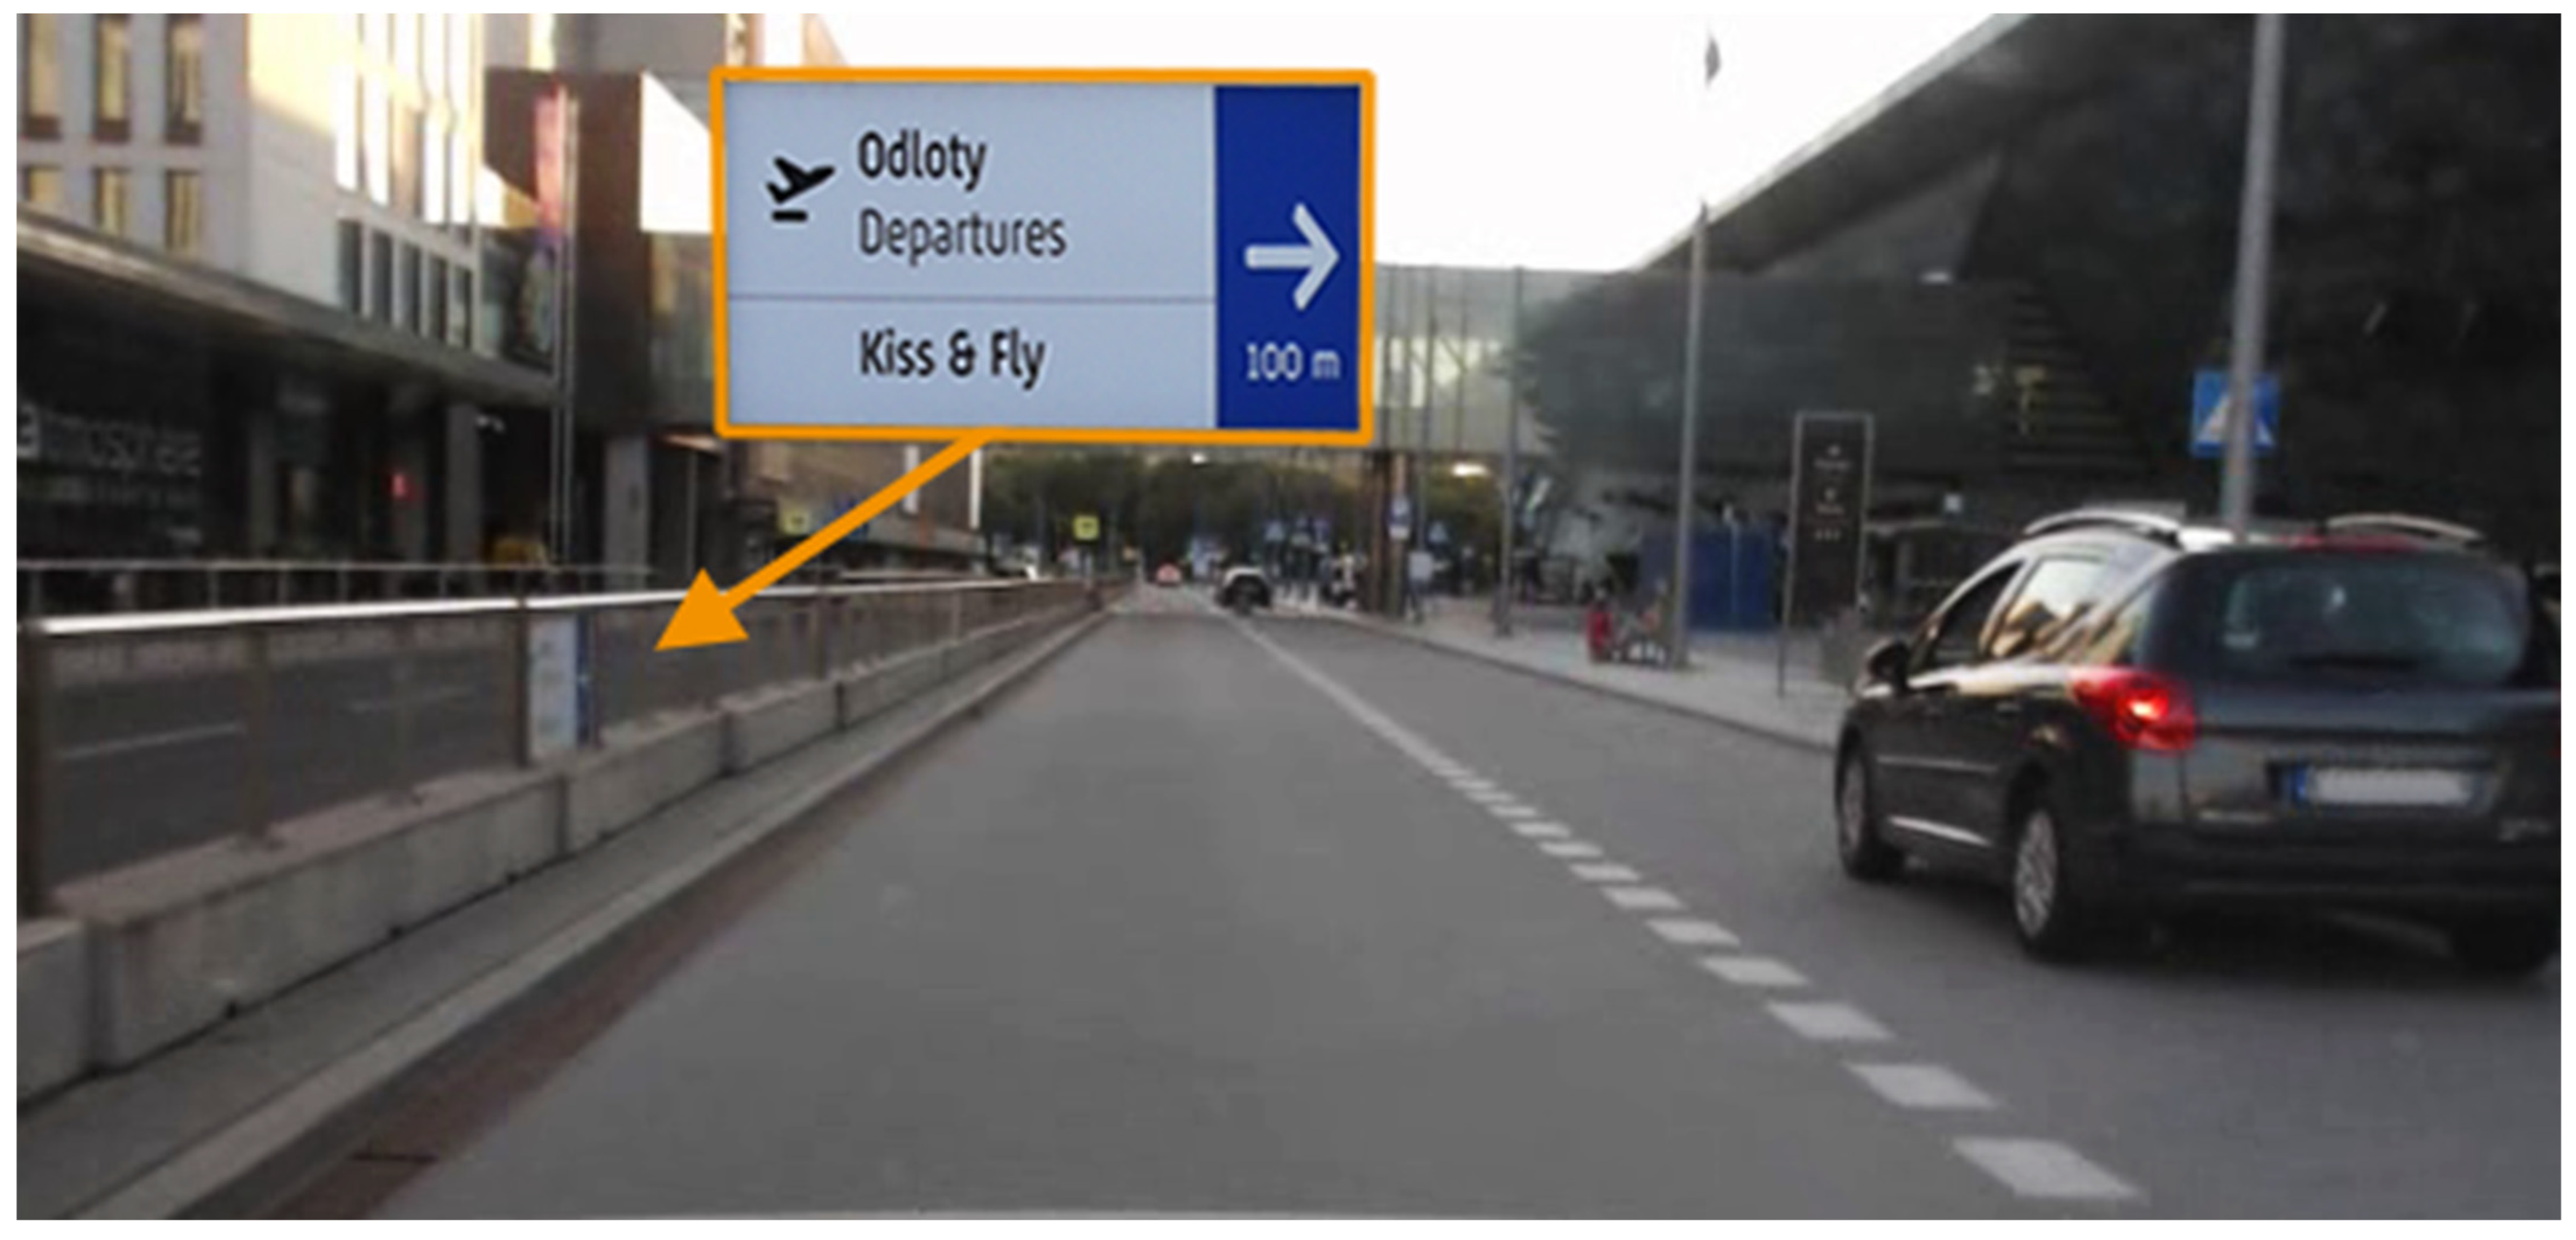
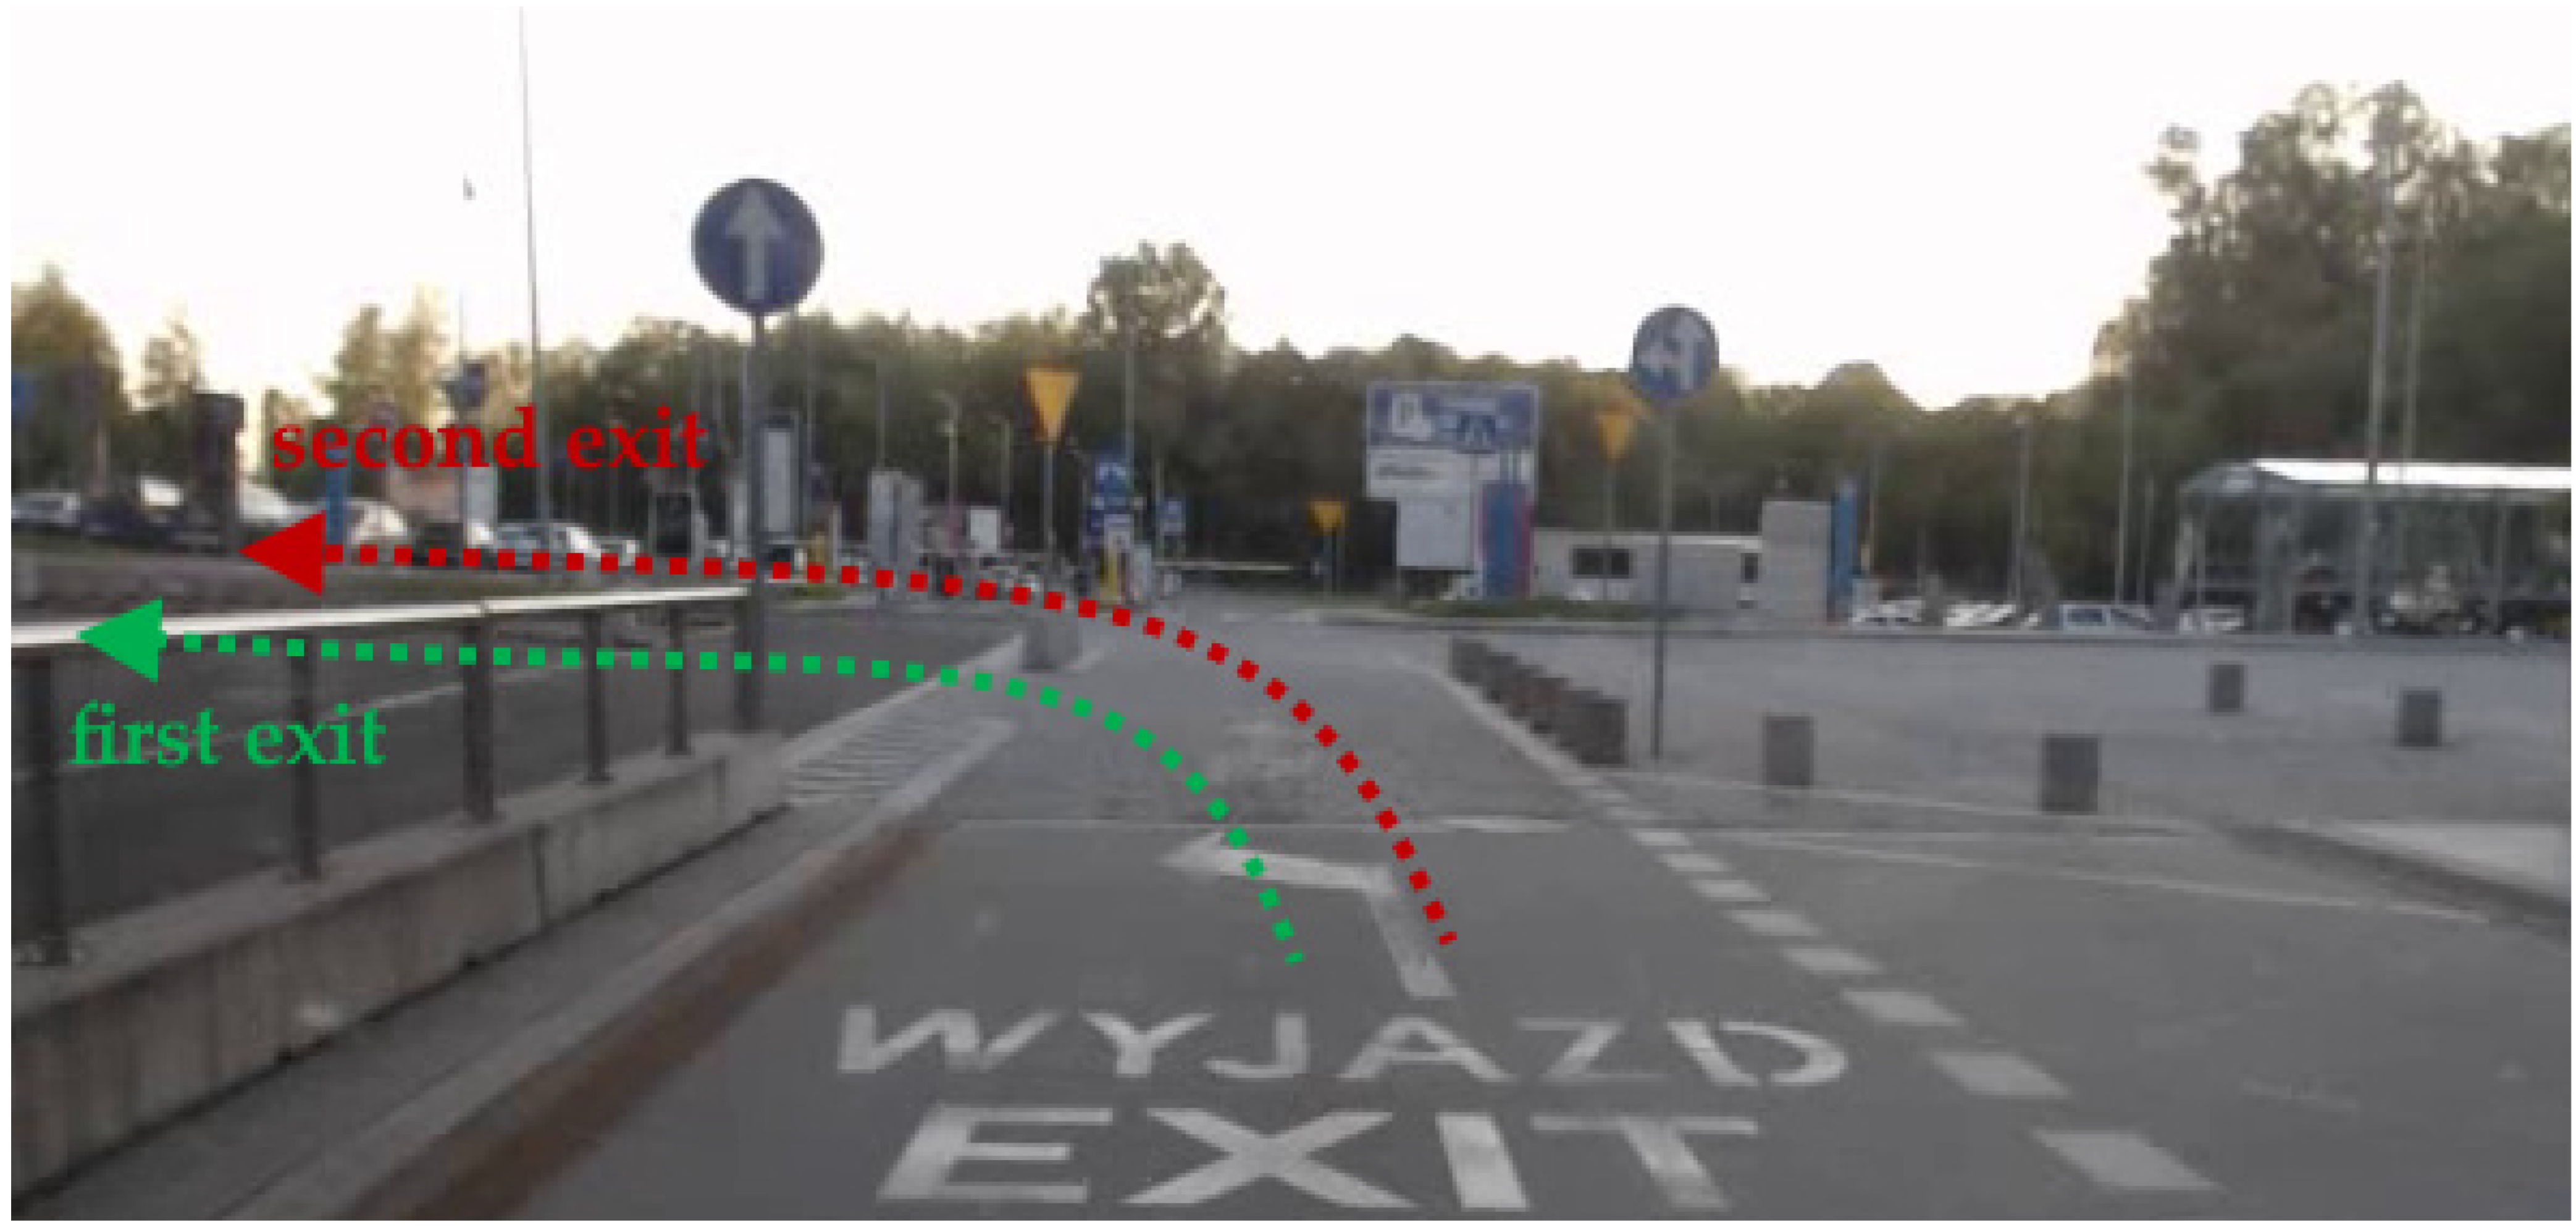
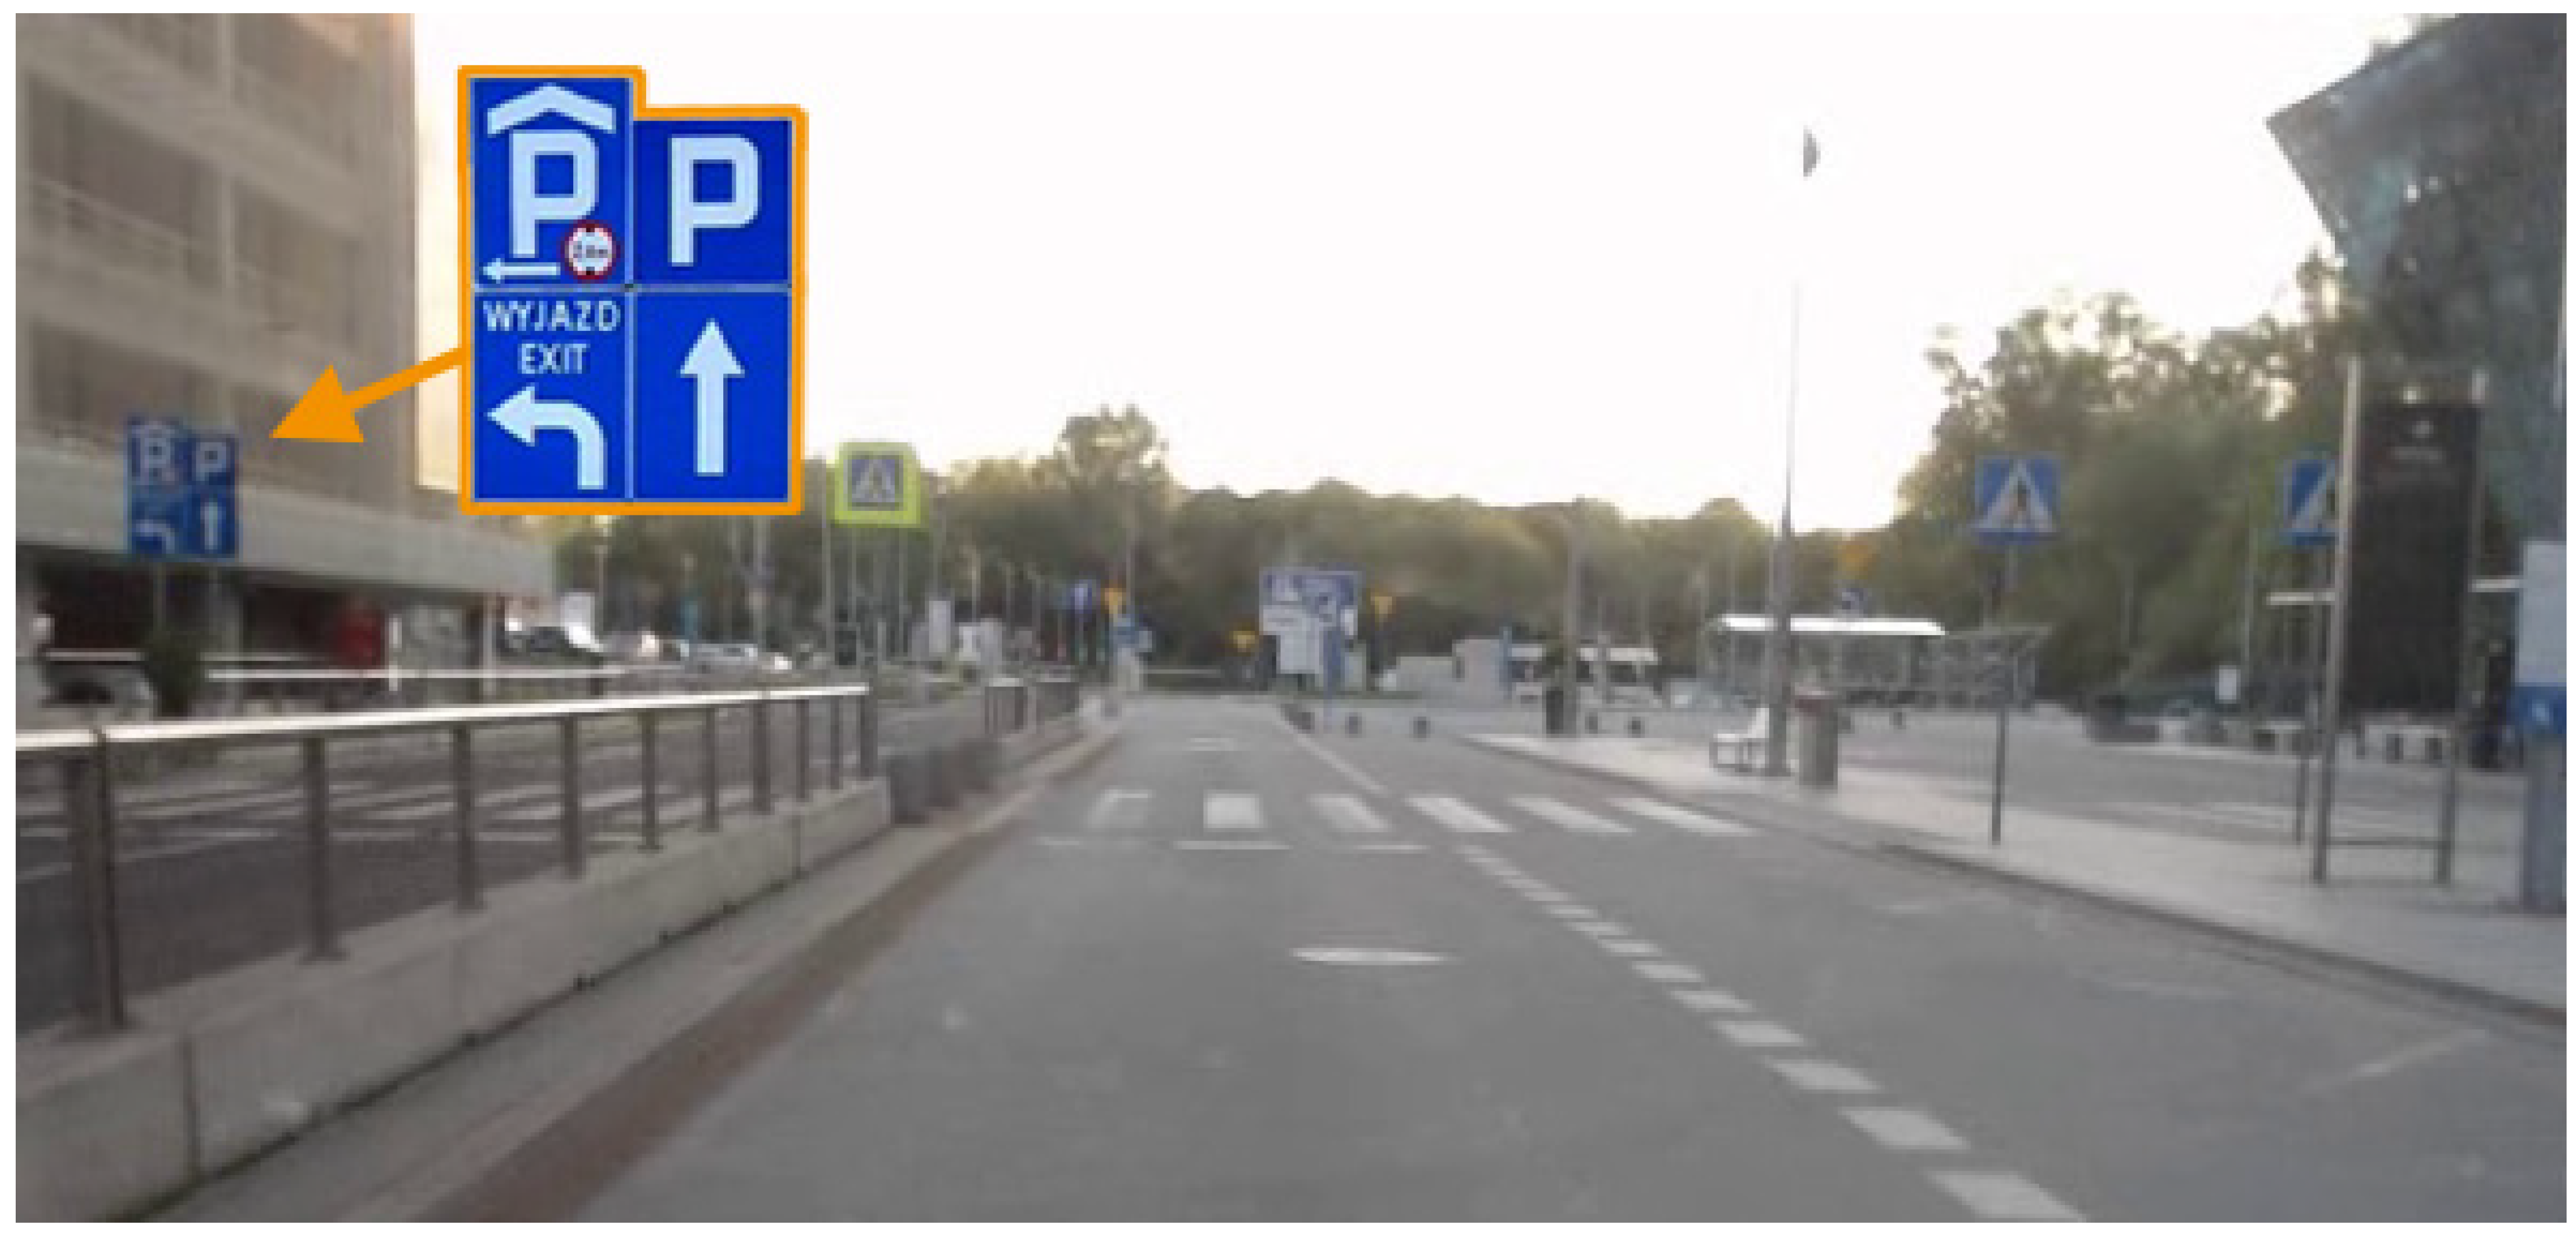
| Rating | Correctness | Visibility | Quality of Sign Face |
|---|---|---|---|
| 3 | Appropriate | Good, no obstructions | Good, clearly legible |
| 2 | Counterintuitive, information unclear, unnecessary, redundant | Poorly positioned, possibility of not noticing, crooked or spaced inappropriately | Adequate, not affecting overall visibility or legibility, but road sign requires replacement |
| 1 | Erroneous or inappropriate, confusing | Positioned incorrectly, could become hard to notice (partially obscured or without contrasting background), confirmation sign on left side positioned improperly | Damaged, poor quality, faded |
| 0 | Missing road sign when required | Obscured or invisible | Missing road sign when required |
| Zone | A | B |
|---|---|---|
| Number of all road signs | 13 | 37 |
| Average rating (all signs) | 2.97 | 2.58 |
| Correctness | 3.00 | 2.35 |
| Visibility | 2.92 | 2.38 |
| Quality | 3.00 | 3.00 |
| Group | All Drivers | Group I | Group II | Group III |
|---|---|---|---|---|
| Number of observed signs per person: average (range) | 10 (3–23) | 14 (7–23) | 8 (3–23) | 8 (5–10) |
| Number of observations per person: average (range) | 17 (4–50) | 27 (13–50) | 13 (4–33) | 10 (7–15) |
| Route difficulty (a) (standard deviation) | 4.1 (0.7) | 4.1 (0.9) | 4.0 (0.7) | 4.0 (0.0) |
| Sign Picture | Sign Number | Observers (Percentage) | Observations (per Observer) | Observation Distance [m] Average (Range) | Observation Time [s] Average (Range) |
|---|---|---|---|---|---|
 | 1 | 10 (43%) | 20 (2.0) | 22 (14–35) | 0.34 (0.08–0.96) |
 | 2 | 6 (26%) | 8 (1.3) | 40 (20–72) | 0.55 (0.12–1.26) |
 | 3 | 20 (87%) | 66 (3.3) | 37 (2–125) | 0.43 (0.08–1.76) |
 | 4 | 13 (57%) | 16 (1.2) | 24 (5–59) | 0.41 (0.18–1.48) |
| All other road signs (six signs) | 8 (35%) | 18 (2.3) | 22 (6–53) | 0.25 (0.10–0.58) | |
| Sign Picture | Sign Number | Observers (Percentage) | Observations (per Observer) | Observation Distance [m] Average (Range) | Observation Time [s] Average (Range) |
|---|---|---|---|---|---|
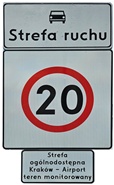 | 5 | 6 (26%) | 8 (1.3) | 19 (10–34) | 0.19 (0.08–0.40) |
 | 6 | 6 (26%) | 8 (1.3) | 60 (26–106) | 0.27 (0.08–0.94) |
 | 7 | 13 (57%) | 29 (2.2) | 39 (3–113) | 0.44 (0.14–1.88) |
 | 8 | 11 (48%) | 19 (1.7) | 35 (9–80) | 0.54 (0.08–1.88) |
 | 9 | 8 (35%) | 8 (1.0) | 67 (18–113) | 1.28 (0.18–4.10) |
 | 10 | 13 (57%) | 27 (2.1) | 30 (10–67) | 0.38 (0.08–1.26) |
 | 11 (a) | 13 (57%) | 21 (1.6) | 23 (5–56) | 0.35 (0.08–0.94) |
 | 12 | 7 (30%) | 9 (1.3) | 55 (26–89) | 0.47 (0.12–1.00) |
| All other road signs (33 signs) | 21 (91%) | 110 (5.2) | 28 (2–93) | 0.38 (0.08–2.56) | |
| Group | All Drivers | Group I | Group II | Group III | ||||
|---|---|---|---|---|---|---|---|---|
| Weather Condition | Cloudy | Glare | Cloudy | Glare | Cloudy | Glare | Cloudy | Glare |
| Left edge line | 0.7 | 1.3 | 1.3 | 1.0 | 0.6 | 1.5 | 0.0 | 2.0 |
| Right edge line | 0.2 | 0.8 | 0.8 | 1.7 | 0.0 | 0.0 | 0.0 | 0.0 |
| Arrows | 2.3 | 1.7 | 2.5 | 1.3 | 2.1 | 0.5 | 3.0 | 5.0 |
Disclaimer/Publisher’s Note: The statements, opinions and data contained in all publications are solely those of the individual author(s) and contributor(s) and not of MDPI and/or the editor(s). MDPI and/or the editor(s) disclaim responsibility for any injury to people or property resulting from any ideas, methods, instructions or products referred to in the content. |
© 2024 by the authors. Licensee MDPI, Basel, Switzerland. This article is an open access article distributed under the terms and conditions of the Creative Commons Attribution (CC BY) license (https://creativecommons.org/licenses/by/4.0/).
Share and Cite
Pashkevich, A.; Piegza, A.; Krawiec, A.; Bylica, A.; Sucha, M. Analysis of Traffic Organisation in the Kiss-and-Fly Zone of Kraków Airport: Eye-Tracking Study. Appl. Sci. 2024, 14, 3868. https://doi.org/10.3390/app14093868
Pashkevich A, Piegza A, Krawiec A, Bylica A, Sucha M. Analysis of Traffic Organisation in the Kiss-and-Fly Zone of Kraków Airport: Eye-Tracking Study. Applied Sciences. 2024; 14(9):3868. https://doi.org/10.3390/app14093868
Chicago/Turabian StylePashkevich, Anton, Adrian Piegza, Antoni Krawiec, Arkadiusz Bylica, and Matus Sucha. 2024. "Analysis of Traffic Organisation in the Kiss-and-Fly Zone of Kraków Airport: Eye-Tracking Study" Applied Sciences 14, no. 9: 3868. https://doi.org/10.3390/app14093868
APA StylePashkevich, A., Piegza, A., Krawiec, A., Bylica, A., & Sucha, M. (2024). Analysis of Traffic Organisation in the Kiss-and-Fly Zone of Kraków Airport: Eye-Tracking Study. Applied Sciences, 14(9), 3868. https://doi.org/10.3390/app14093868


