Abstract
The resilience of machine learning models for anxiety detection through wearable technology was explored. The effectiveness of feature-based and end-to-end machine learning models for anxiety detection was evaluated under varying conditions of Gaussian noise. By adding synthetic Gaussian noise to a well-known open access affective states dataset collected with commercially available wearable devices (WESAD), a performance baseline was established using the original dataset. This was followed by an examination of the impact of noise on model accuracy to better understand model performance (F1-score and Accuracy) changes as a function of noise. The results of the analysis revealed that with the increase in noise, the performance of feature-based models dropped from a high of 90% F1-score and 92% accuracy to 65% and 70%, respectively; while end-to-end models showed a decrease from an 85% F1-score and 87% accuracy to below 60% and 65%, respectively. This indicated a proportional decline in performance across both feature-based and end-to-end models as noise levels increased, challenging initial assumptions about model resilience. This analysis highlights the need for more robust algorithms capable of maintaining accuracy in noisy, real-world environments and emphasizes the importance of considering environmental factors in the development of wearable anxiety detection systems.
1. Introduction
Anxiety disorders are among the most common mental health issues globally [1,2,3,4]. Anxiety detection using physiological signals, such as electrodermal activity (EDA), heart rate variability (HRV), and accelerometer (ACC) data [5,6,7,8], from wearable sensors has shown promise. Recent advances in wearable technology allow for stretchable sensors and interfaces that conform to human motion and may allow for real-time monitoring and evaluation of biomarkers that promote pro-active health management [9,10,11,12,13]. Recent work has demonstrated the utility of machine learning (ML) and artificial intelligence on wearable sensor data for use in mental health detection and monitoring [14,15,16]. However, most of these studies have not explicitly examined the effect of confounding factors, such as noise, on the detection of anxiety using ML. Studying noise is essential for several reasons. First, it allows for a more accurate simulation of real-world conditions, as noise is an inherent part of data collected through wearable technology. Understanding the effect of noise on data helps in creating models that are resilient and reflective of real-life scenarios. Second, studying noise aids in enhancing the robustness of ML algorithms. By analyzing how noise influences data and model performance, researchers can develop algorithms that maintain high accuracy levels, even in suboptimal conditions. Last, a thorough analysis of noise contributes to the reduction of potential errors, leading to more reliable and trustworthy applications of ML.
Stress and anxiety are closely intertwined. Stress is typically characterized as an adverse stimulus [17]. According to Spielberger’s Trait-State anxiety theory, anxiety is bifurcated into state and trait anxiety [17,18,19]. State anxiety represents a temporary, transient emotional response to stress, marked by increased sympathetic nervous system activity. In contrast, trait anxiety denotes an individual’s inherent tendency to experience state anxiety under stress. This study primarily focused on state anxiety, hereafter referred to as ’anxiety’, especially in the context of detection methodologies. The distinction between anxiety and stress in this study hinges on the use of standardized methods for evaluating or inducing it; the former is considered anxiety, while the latter is categorized as stress.
The pervasive impact of anxiety on long-term health and job performance underscores the urgency for developing effective anxiety detection tools [20,21,22,23]. These tools could significantly enhance accessibility to diagnosis and treatment and serve as valuable resources for mental health professionals. Anxiety’s detrimental effects extend to increased cardiovascular disease risks, weakened immune responses, and reduced performance efficiency [24,25,26,27]. The prevalence of anxiety is alarmingly high, with significant portions of the world populations affected, contributing to substantial economic losses [1,2,3,4]. This prevalence is juxtaposed against the stark reality of inadequate mental health services, highlighting a critical area of need.
The limitations of traditional anxiety monitoring methods, such as self-reported questionnaires, necessitate more dynamic and quantitative measures [28]. These measures should be capable of capturing real-time changes across various contexts [29,30]. The focus has shifted towards understanding the autonomic nervous system’s role in anxiety, leading to the development of diverse tools for anxiety assessment. These tools range from cardiac activity analysis using HRV to innovative non-contact telemetry methods [31,32]. Peripheral biophysiological measures, including electromyography (EMG) [33], respiration patterns (RESPs) [34], and EDA [35], offer additional insights into anxiety states. Behavioral measures have also emerged as crucial tools in detecting anxiety, utilizing physical and interactive markers to reveal cognitive and affective states related to anxiety [30].
Various methods have been employed in laboratory settings to induce anxiety, each tailored to specific research objectives. These methods range from tasks like the Trier Social Stress Test [36], evoking emotions through experienced stimuli [37], to physiological manipulations like the Cold Pressor Test [38]. The choice of method is contingent upon the research question, whether it is examining anxiety’s effects on cognitive performance or other aspects of behavioral performance.
The primary objective of this study was to rigorously evaluate the effectiveness and accuracy of ML and deep learning (DL) models to detect anxiety under various levels of noise. Specifically, the study sought to understand the extent to which these models can maintain accuracy in identifying and classifying anxiety-related patterns amidst noise interference. Furthermore, this research aimed to explore the potential benefits of employing deep learning end-to-end models in improving the robustness of anxiety detection systems against noisy conditions. To this end, this study utilized the Wearable Stress and Affect Detection (WESAD) dataset [8], a publicly available resource, as the basis for experimentation. This dataset was augmented with synthetic noise to simulate real-world noisy environments, thereby providing a platform to assess model performance as a function of noise interference. In pursuit of replicating and benchmarking against the state-of-the-art, this study adhered closely to established literature [5,8,39] in terms of filtering parameters, data processing techniques, and methodologies for feature selection and extraction. This approach ensured that the findings were grounded in current best practices [40,41,42,43], allowing for a meaningful contribution to the field of anxiety detection.
2. Materials and Methods
An open-source feature-based and end-to-end machine learning framework was established for preprocessing, feature extraction (for feature-based models), model creation, noise addition, and training and testing, using state-of-the-art approaches (Figure 1). Custom Python (version 3.8) code was used to perform all the work mentioned here.
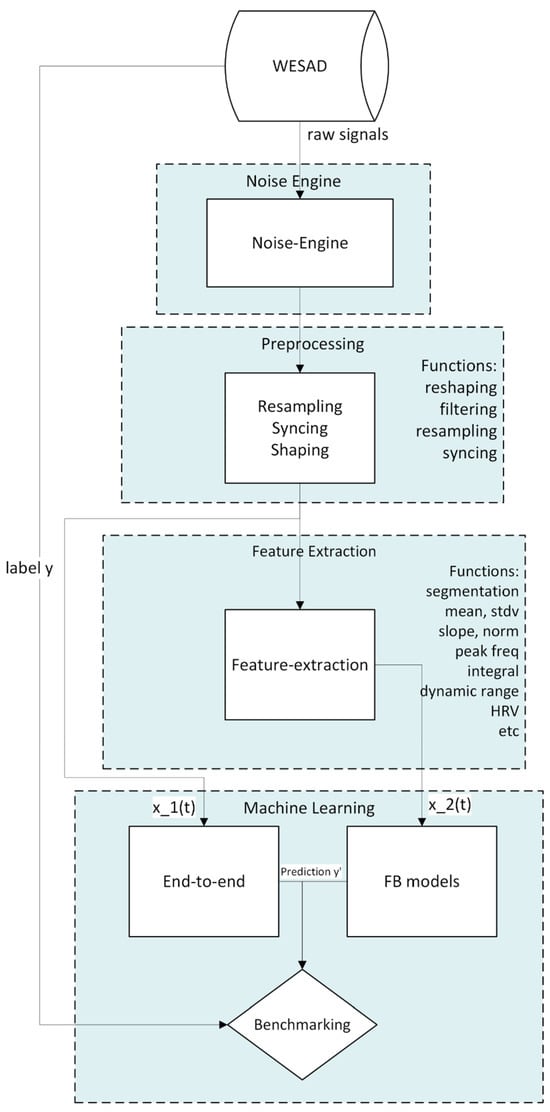
Figure 1.
Flowchart outlining pipeline for processing and analyzing wearable sensor data, from raw data collection through preprocessing, feature extraction, and machine learning.
2.1. Overview of WESAD Dataset
The WESAD dataset [8] was used as a basis for anxiety detection with physiological signals and introduction of synthetic noise. The study involved 15 participants, with a gender distribution of 20% female, and use of two wearable devices. The RespiBAN Professional (PLUX Wireless Biosignal S.A., Lisbon, Portugal) was used to record ECG, EDA, EMG, RESP, TEMP, and 3-axis ACC at 700 Hz. The E4 Wristband (Empatica, Inc., Boston, MA, USA) was used to record blood volume pulse (BVP), EDA, skin temperature (TEMP), and ACC at varying sampling rates.
The study’s protocol included baseline (53%), amusement (17%), and stress (30%) conditions. Participant self-reports after each condition provided the ground truth, incorporating scales like Positive and Negative Affect Schedule (PANAS) [44], State-Trait Anxiety Inventory (STAI) [45], and Short Stress State Questionnaire (SSSQ) [46]. The baseline condition involved participants spending the first 20 min with sensors, engaging in neutral activities like reading magazines, to establish a neutral affective state. For amusement, they watched a mix of humorous and neutral video clips, selected from the affective film library of Samson et al. [47]. The anxious state was induced using the Trier Social Stress Test [36]. Meditation and recovery periods were interspersed between conditions to neutralize the participants’ affective state. The protocol varied to minimize order effects. Participants’ self-reports after each condition, using scales from PANAS, STAI, and SSSQ, provided ground truth anxiety data.
2.2. Data Preprocessing
In preparing the data for ML analysis, particular attention was paid to the selection and treatment of input modalities. In this study, some modalities were dropped to reduce the number of inputs to the models, aiming to reduce redundancy and improve model performance. The preprocessing steps included normalization, feature extraction, and the handling of missing data, which were crucial for preparing the dataset for effective machine learning analysis.
The preprocessing stage was crucial in preparing the raw sensor data for analysis and modeling. The first step involved defining the sampling rates for various sensors, such as the ACC, BVP, and EDA. This ensured that the data from different sensors were properly aligned and synchronized. One step that differed in our preprocessing implementation, compared to Schmidt et al., was that the raw signals were preprocessed without converting raw signals from raw values into their respective units. For example, EDA from the RespiBAN was provided in voltage and conversion was required to obtain siemens (S) units.
For feature-based models, EDA and ACC signals were filtered using a lowpass Butterworth filter with cut-off frequencies of 5 Hz and 13 Hz, respectively. For ECG peak detection, the Automatic Multiscale-based Peak Detection (AMPD) algorithm was based on [48].
The preprocessing steps for E2E models differed from those for FB models. The steps applied to the signals for E2E models were winsorization, filtering, downsampling, and min-max normalization. For the winsorization, 3–97% was used to remove extreme values. A Butterworth low-pass filter with a 10 Hz cutoff was applied. Signals were then downsampled to reduce dimensionality and decrease the number of learning parameters, which helped reduce computational resource consumption. Finally, signals were normalized using a min-max normalization function. To prepare the data for temporal modeling, 60 s sliding windows were created for each signal with a 30 s stride length, based on initial testing.
2.3. Feature Extraction
For FB models, feature extraction was used to reduce the initial set of 92 features from the seven biophysiological signal modalities (Table 1) to a reduced feature set that excluded less relevant features. This feature selection process aimed to identify the most informative and discriminative variables that could effectively predict anxiety levels.

Table 1.
Features from each physiological signal.
First, after the features were calculated for each of the modalities, a Spearman correlation matrix was computed to understand the relationship between the features and label. A heatmap of the correlation matrix was then created to help with quick visualization of the results (Figure 2). Based on the correlation analysis, important features were selected and prioritized for model training. Second, the selection criteria involved setting a threshold for correlation coefficients. This step aimed to streamline the analysis and focus on the most impactful variables. This was carried out in a two-step process. The first was to look at the features of the same modality that were too closely correlated with each other. Features of the same signal with correlation higher than 0.95 were eliminated, where the feature with a higher correlation to anxiety was kept. The second step was looking at the feature correlation with anxiety label and eliminating the ones with less than 0.00009. This reduced the feature space from 92 features down to 54.
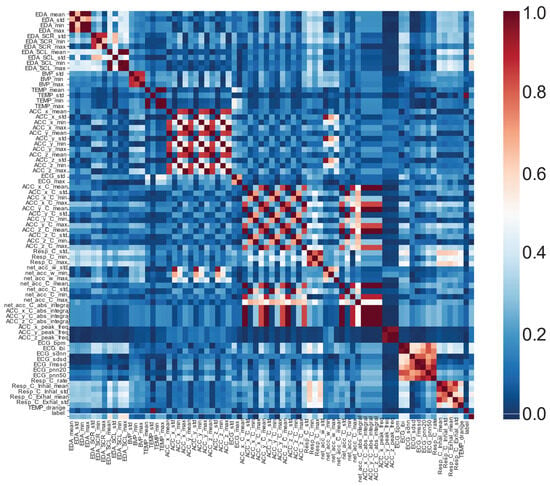
Figure 2.
Spearman correlation between all features, including labels. Features of some modalities were too closely correlated with each other to warrant inclusion. For example, for EDA features, EDA mean, min, and max are almost identical, unlike EDA std. In that case, only one of the three features was kept.
2.4. ML Models
For our implementation, we combined the traditional feature-based approaches as well as the state-of-the-art end-to-end models in this study. Seven feature-based models were examined. Following the literature and Schmidt’s [8] choice for feature-based models, we included Decision Tree (DT), Random Forest (RF), Adaboost (AB), Linear Discriminant Analysis (LDA), and k-nearest neighbor (kNN). Support Vector Machine (SVM) was included as it is one of the most commonly used algorithms in the literature. XGBoost (XGB) was also added as an improvement over existing implementation of boosting algorithms, such as Adaboost, as it has been shown to perform better [49]. All the feature-based models were created using scikit-learn 1.2.1 ML library [50].
We used the same ten E2E models utilized by Dziezyc et al. [39] (Table 2). Although these models do not require feature engineering, they are computationally intensive and require significantly longer to train and store, compared to classical FB models.

Table 2.
Summary of deep learning architectures.
The training was performed on the three classes contained in WESAD (baseline, amusement, stress), aiming to provide the models with a comprehensive understanding of the data’s nuances. This approach enriches the model’s capability to discern subtle differences, enhancing its performance when simplified to a binary classification of non-anxious (baseline + amusement) versus anxious for testing [51,52,53,54]. A five-fold cross-validation method was utilized. The dataset was randomly divided into equal five test sets. For each of the test sets, the rest of the data were split into training and validation set. For each of the architectures, five-fold cross validation and five training iterations were performed. Performance metrics were then averaged and reported. Finally, the preprocessed data were split into training and testing sets using an 80/20 ratio using scikit-learn’s train_test_split function, where the 80% of the WESAD dataset was used to create the training set that was used to train the machine learning models, while 20% of the WESAD dataset was used to create the testing set was used to evaluate the models’ performance on unseen data.
2.5. Simulating Real-World Data Using Noise
This study explored the application of synthesized noise to the WESAD dataset. This approach aimed to enhance the robustness and applicability of machine learning models by evaluating their performance under simulated conditions that reflect the complexity of real-world scenarios.
Recognizing the ubiquity and impact of environmental noise on data quality, the decision was made to employ Gaussian noise as the primary method for this simulation. The Gaussian noise model was chosen for its ability to represent a wide range of common noise types encountered in everyday settings, thereby ensuring that the generated synthetic dataset possessed a realistic degree of variability and complexity.
We implemented a Gaussian noise function to generate noise. To not introduce bias to our models, we used a zero average Gaussian function with a fixed standard deviation. We ran the models for the following ten pre-defined values, signal to noise ratio (SNRs) = {0.001, 0.01, 0.05, 0.1, 0.15, 0.2, 0.3, 0.4, 0.5, 0.6}, so as to reproduce the range of SNRs seen in prior real-world wearable data [55]. For a given SNR, the standard deviation, σ, was provided by Equation (1):
where E(S) is the expectation of signal S. Thus, the modified Gaussian noise WESAD value for a given signal S can be expressed as given by Equation (2):
where is the Gaussian function.
For each SNR, noise was added to the WESAD dataset, generating a noisy set, SNRi. Each SNR value was generated five times, to reduce results variance for each of the SNRs. This resulted in 100 datasets, all of which were then tested on the feature-based models. Because of the significant limitations associated with running the large end-to-end models (high computation time and cost), the results of the feature-based models were analyzed to assess if the number of datasets could be reduced. Results will be discussed in the following section, but based on the feature-based model results, the SNRs for end-to-end models were reduced to only four cases, SNRs = {0.01, 0.1, 0.15, 0.4}.
2.6. Feature and Modality Analysis
To determine the most effective features and modalities for anxiety detection in environments with variable noise levels, we evaluated the performance of individual features and modalities to determine their contribution under different noise conditions. This involved an examination of feature importance scores, using the mean decrease in impurity (MDI) for DT and gain for XGBoost, derived from feature-based models to pinpoint which modalities captured the most relevant information. Subsequently, the analysis identified which features and modalities maintained their discriminative power even in the presence of high noise levels, suggesting their suitability for real-world applications. Additionally, we investigated how the distribution of feature values changed with varying noise levels, which provided insights into the stability and robustness of each feature, helping to identify those less sensitive to noise-induced variations.
2.7. Comparative Model Analysis
This section evaluated both feature-based and end-to-end models under various noise conditions to determine which approach was more suitable for deployment in noisy, real-world environments. The performance of each model was rigorously tested across a spectrum of simulated noise conditions, with metrics such as accuracy, precision, recall, and F1-score calculated to assess efficacy. The comparative analysis highlighted models that not only performed well across different noise levels but also demonstrated significant resilience to environmental disturbances. Based on these findings, specific models were recommended for practical application in anxiety detection systems, paving the way for robust, real-world deployments.
3. Results
As a benchmark, the results of feature-based and end-to-end ML models were evaluated on the original, unaltered WESAD dataset. For reference, using feature-based models, Schmidt et al. detected anxiety with an F1-score of 0.91 and an accuracy of 0.92 for binary classification (stress vs. non-stress) using all modalities with the LDA model [8]. Using end-to-end models, Dziezyc et al. detected anxiety with an F1-score of 0.73 and an accuracy of 0.79 using the FCN architecture [39]. For context, a random guess would yield a 0.50 accuracy and 0.48 F1-score, while a weighted guess would result in 0.30 accuracy and 0.42 F1-score.
3.1. Feature-Based Models
For feature-based models, XGB and DT performed the best with an accuracy of 0.99 and F1-score 0.99 for both models (Table 3). After evaluating the feature-based model performance results, features were explored for each of the models to determine importance of features (Figure 3), as well as importance of modalities. As can be seen in Table 4, the Skin Conductance Level (SCL) max feature from EDA was the feature of the highest importance for six of the seven models. This result led to EDA being defined as the most important modality for anxiety detection, and more specifically SCL max. The second most important feature was BVP max and ranked number 2. In Table 4, the columns categorize and quantify the contributions of different physiological signals and their specific features to the model’s performance.

Table 3.
Feature-based model accuracies.
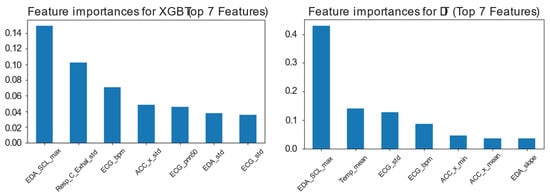
Figure 3.
Feature importance for top seven features for two highest performing feature-based models: (Left) Using gain for XGB and (Right) using mean decrease in impurity (MDI) for DT.

Table 4.
Feature importance for self-learned feature-based models on the WESAD dataset.
The weighted average is a crucial metric, calculated by squaring each feature’s importance score and dividing this total by the sum of the top seven feature importance scores, expressed as given by Equation (3):
where represents the ith feature importance value listed in Table 4 for a given modality, and represents the total number of feature importance scores listed in Table 4. This method emphasizes the impact of more influential features by assigning greater weight to higher scores, providing a nuanced view of how each feature impacts the model’s ability to detect anxiety. This table format effectively showcases which physiological measurements are most impactful under varying conditions, highlighting the features that consistently influence anxiety detection outcomes.
3.2. End-to-End Models
Results for the end-to-end models are shown in Table 5. The performance of models was consistent with that observed in Dziezyc et al. [39]. The top performing models were found to be FCN and ResNet. The performance for end-to-end models was reported as an average between all five-fold cases, which was reported as average accuracy and average F1-score (Table 5). We also examined the maximum performance of each architecture and present the accuracy for that case (Table 5).

Table 5.
End-to-end model performance results.
3.3. Feature-Based Models with Gaussian Noise
Feature-based models have demonstrated a robust ability to detect anxiety in controlled settings, leveraging well-defined physiological signals and engineered features for effective performance assessment.
The influence of signal-to-noise ratio on the performance of feature-based models reveals a nuanced impact on their ability to discern stress-related patterns. As SNR decreases, indicating higher noise levels, there was a gradual reduction in model accuracy (Figure 4). Although XGB and DT upheld their superior performance observed when using the original WESAD dataset, the AB model showed a notable decline in efficacy under higher noise conditions, diverging from the other feature-based models. This variation in performance can be expected due to the different ways feature-based models process and interpret data. For instance, models like XGB are designed to handle various types of data irregularities and have mechanisms that can effectively deal with noise to some extent. In contrast, models such as AB might be more sensitive to noise, particularly if the noise disrupts the patterns they rely on for decision-making. Consequently, as the SNR decreases, it is expected that the performance of models would vary, reflecting their individual capacities to filter out noise and maintain accuracy.
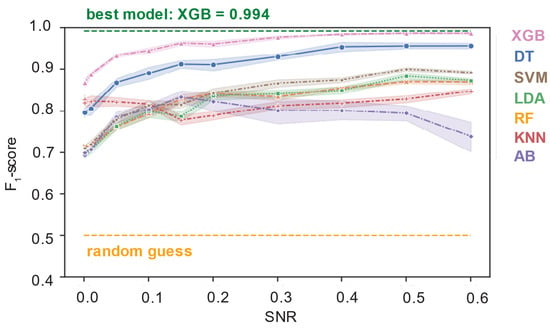
Figure 4.
F1-score performance (mean lines with 5% CI) of feature-based models across various signal-to-noise (SNR) levels.
This trend underscores the importance of optimizing noise handling capabilities within feature-based models to ensure their effectiveness in real-world applications where noise variability is common. With noise, performance degraded proportionally with increasing noise (smaller SNR value). These results were consistent for all models, except for AB. Another finding was that XGB outperformed DT and maintained the performance advantage across the range of SNR tested, solidifying its position as the best performing model across conditions tested.
With respect to feature importance, it was observed that feature importance ranking was also relatively consistent across SNR. For example, looking at the feature importance ranking for XGB across different SNR in Figure 5, EDASCL_mean continued to be the top feature across all SNR.
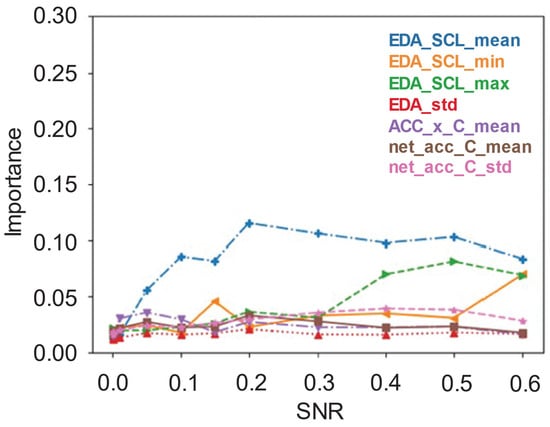
Figure 5.
Feature importance of the top seven features for the XGB model, using gain, across various signal-to-noise ratios (SNR).
Violin plots (Figure 6) offer a visual exploration of the FB models’ performance distribution across the full range SNR (0.001 to 0.6), illustrating the variability and robustness of each model amidst varying noise conditions. These plots combine the features of box plots and density plots, showing not only the median of the F1 scores but also the density and spread of scores around the median. This visual analysis is particularly insightful as it highlights the more consistent performance of some models, such as KNN, regardless of the noise level, given the narrower distribution. Conversely, models exhibiting wider distributions imply greater variability in performance, which could indicate less reliability in noisy conditions.
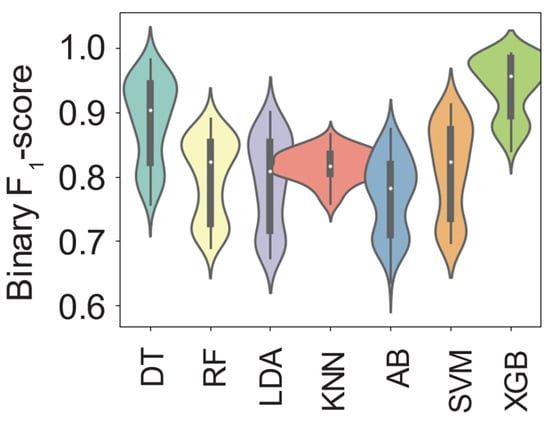
Figure 6.
Violin plot of mean F1-score performances for feature-based models aggregated across the full range of signal-to-noise ratios from 0.001 to 0.6.
3.4. End-to-End Models with Gaussian Noise
With the noisy dataset, performance of all end-to-end models significantly degraded (Figure 7, Table 6). FCN and ResNet achieved mean F1-scores of 0.75 (standard deviation, 0.24) and 0.74 (0.22). Noteworthy changes were that ResNet outperformed FCN in the SNR = 0.4 case, but was overtaken again at higher noise levels (lower SNR) (Figure 6). At higher noise levels, all models underperform random guess for the binary case (i.e., F1-score of 0.5).
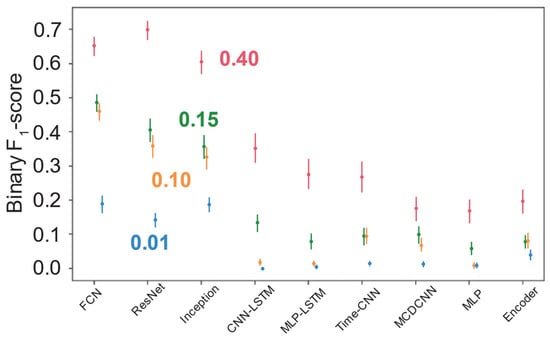
Figure 7.
F1-score performance (mean lines with 5% CI) of end-to-end models at signal-to-noise ratios (SNR) ranging from 0.01 (in blue) to 0.40 (in red).

Table 6.
F1-score performance results of end-to-end models with different levels of noise.
Moreover, looking at Figure 8 provides some insights into the how the top 5% percentile paints a clearer picture of performance as a function of noise. Both MLP variants failed to perform better than a random guess below SNR of 0.1. Another interesting behavior was that ResNet, above 0.1, maintained a specific level even with a significant increase of noise. The two best performing models maintained their edge over random guess. ResNet broke down at SNR 0.01, while FCN maintained its edge over random guess.
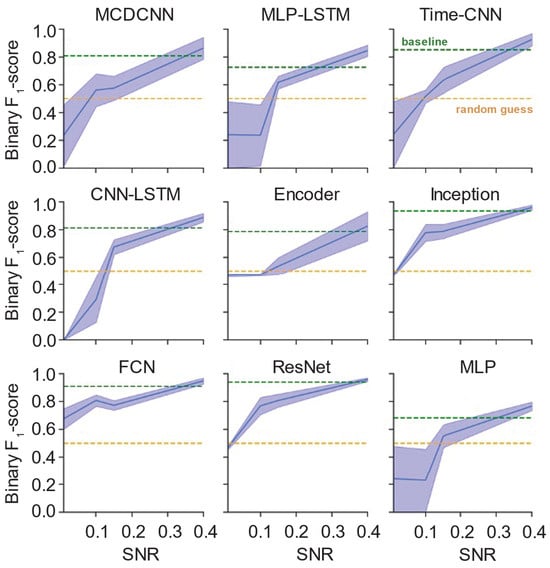
Figure 8.
F1-score of top 5% performing iterations of end-to-end models (midline with 95–100% range) across various noise levels.
4. Discussion
This study provides an analysis of the resilience of both feature-based and end-to-end models to noise, revealing significant performance disparities. Feature-based models, particularly XGB, demonstrated superior robustness across all noise conditions, maintaining higher accuracy levels compared to end-to-end models. This finding supports our initial hypothesis that some models would exhibit enhanced resistance to noise, highlighting the effectiveness of feature-based models in noisy real-world scenarios.
In comparison to state-of-the-art results, where the average accuracy for detection of anxiety has been found to be 0.82 (95% CI = 0.71–0.89) [56], feature-based models such as DT and XGB, with a 0.99 accuracy as seen in Table 3, outperformed this range of performance in baseline measures. In addition, end-to-end models such as FCN, ResNet, Time-CNN, MCDCNN, and MLP-LSTM, with an average baseline performance from 0.72–0.79 accuracy as seen in Table 5, were comparable with current state-of-the-art [56].
All feature-based models performed consistently across different SNR samples, yielding a uniform distribution across the samples, except for AB. Even though KNN was not the highest performer, it maintained a consistent performance level, which may have been due to potential underfitting, as further optimization of KNN has been shown to improve performance [57]. Finally, even though XGB and DT performed closely, the performance distribution for XGB was tighter than that of DT, solidifying it as the best choice under the given conditions.
EDA appeared to be the most important modality, with EDAscl max being the most important feature. Even though EDA was the most important modality, it may be of concern, since skin conductance can easily be disrupted in the presence of physical activity or sweat-inducing warm weather. BVP can be used as a supplementary signal to support model detection in the case where EDA quality is reduced.
For end-to-end models, while it may be surprising to see that non-recurrent models outperformed recurrent models, the relatively short-time frame associated with anxiety may be captured well enough with the convolution layer of the CNN models, such that it was able to preserve some contextual information from the recent past, providing an equivalence to the memory cell in RNN networks. Conversely, end-to-end models exhibited a significant reduction in performance with the introduction of noise, with FCN outperforming other models under these conditions yet still falling short of the robustness displayed by feature-based models. ResNet, while initially performing well, saw a decline in effectiveness at lower SNR levels, underscoring the limitations of end-to-end models in handling noisy data.
The consistency of dominant features in maintaining their predictive power, even in noisy environments, was evident across both model types. This consistency challenges the expectation that end-to-end models would inherently handle noise better due to their capacity to learn complex patterns directly from raw data. The proportional performance decline of end-to-end models with increased noise necessitates a re-evaluation of their advantages over feature-based models in noisy settings.
These observations underscore the importance of feature engineering and model selection in developing robust anxiety detection systems for real-world applications. They prompt further investigation into the fundamental characteristics of machine learning models and the nature of the data they process, shifting focus towards a deeper understanding of how different models and features interact with environmental noise. As we advance our research, exploring these dynamics will be crucial for enhancing the reliability and efficacy of wearable technology in monitoring anxiety in diverse and challenging conditions.
Building on the findings of this study, several avenues for future research have been identified. These areas not only promise to extend the knowledge base but also aim to address the challenges and limitations encountered in the current study. Future work should focus on expanding the types of noise used, so as to better mimic non-physiologic artifacts; include additional advances in signal processing to remove non-physiologic signals; and validate in new real-world datasets to help validate the generalizability of the findings and the robustness of the models across diverse populations and environments. By addressing these areas, future research can significantly advance the field of anxiety detection using wearable technology, leading to more effective, user-friendly, and widely applicable solutions.
5. Conclusions
In conclusion, this research contributes to the field of anxiety detection using wearable technology by offering a nuanced understanding of how environmental noise impacts model performance. By demonstrating the resilience of some feature-based models to noise and robustness of specific features even with noisy data, this study paves the way for future studies to delve deeper into the dynamics of noise and model robustness, ultimately leading to the development of more effective and reliable anxiety detection systems. As wearable technology continues to evolve, the insights gained from this study will be invaluable in guiding the creation of solutions that are not only technologically advanced but also resilient in the face of real-world challenges.
Author Contributions
Conceptualization, A.A., J.C., R.S., E.T.H.-W., and M.E.H.; methodology, A.A.; software, A.A.; validation, A.A.; formal analysis, A.A.; resources, A.A.; data curation, A.A.; writing—original draft preparation, A.A., J.C., R.S., E.T.H.-W., and M.E.H.; writing—review and editing, A.A., J.C., R.S., E.T.H.-W., and M.E.H.; visualization, A.A.; supervision, E.T.H.-W., and M.E.H.; project administration, M.E.H.; funding acquisition, J.C., R.S., E.T.H.-W., and M.E.H. All authors have read and agreed to the published version of the manuscript.
Funding
This research was funded by the Jump ARCHES endowment through the Health Care Engineering Systems Center and partly supported by the ACCESS MATCH program made possible by the U.S. National Science Foundation.
Institutional Review Board Statement
Not applicable as this research was focused on ML/DL software development applied to a publicly available dataset.
Informed Consent Statement
Not applicable.
Data Availability Statement
Publicly available data at: https://github.com/WJMatthew/WESAD accessed on 30 March 2023.
Acknowledgments
We thank members of the Human Dynamics and Control Lab that contributed to the development of the data analysis pipeline.
Conflicts of Interest
The authors declare no conflicts of interest. The funders had no role in the design of the study; in the collection, analyses, or interpretation of data; in the writing of the manuscript; or in the decision to publish the results.
References
- Correction Collins, P.Y.; Patel, V.; Joestl, S.S.; March, D.; Insel, T.R.; Daar, A.S.; Bordin, I.A.; Costello, E.J.; Durkin, M.; Fairburn, C.; et al. Grand Challenges in Global Mental Health. Nature 2011, 475, 27–30. [Google Scholar] [CrossRef] [PubMed]
- Kessler, R.C.; Avenevoli, S.; Costello, E.J.; Green, J.G.; Gruber, M.J.; Heeringa, S.; Merikangas, K.R.; Pennell, B.E.; Sampson, N.A.; Zaslavsky, A.M. Design and Field Procedures in the US National Comorbidity Survey Replication Adolescent Supplement (NCS-A). Int. J. Methods Psychiatr. Res. 2009, 18, 69–83. [Google Scholar] [CrossRef] [PubMed]
- Canals, J.; Voltas, N.; Hernández-Martínez, C.; Cosi, S.; Arija, V. Prevalence of DSM-5 Anxiety Disorders, Comorbidity, and Persistence of Symptoms in Spanish Early Adolescents. Eur. Child. Adolesc. Psychiatry 2019, 28, 131–143. [Google Scholar] [CrossRef] [PubMed]
- Wittchen, H.U.; Jacobi, F.; Rehm, J.; Gustavsson, A.; Svensson, M.; Jönsson, B.; Olesen, J.; Allgulander, C.; Alonso, J.; Faravelli, C.; et al. The Size and Burden of Mental Disorders and Other Disorders of the Brain in Europe 2010. Eur. Neuropsychopharmacol. 2011, 21, 655–679. [Google Scholar] [CrossRef]
- Healey, J.A.; Picard, R.W. Detecting Stress during Real-World Driving Tasks Using Physiological Sensors. IEEE Trans. Intell. Transp. Syst. 2005, 6, 156–166. [Google Scholar] [CrossRef]
- Elgendi, M.; Galli, V.; Ahmadizadeh, C.; Menon, C. Dataset of Psychological Scales and Physiological Signals Collected for Anxiety Assessment Using a Portable Device. Data 2022, 7, 132. [Google Scholar] [CrossRef]
- Haouij, N.E.; Poggi, J.M.; Sevestre-Ghalila, S.; Ghozi, R.; Jadane, M. AffectiveROAD System and Database to Assess Driver’s Attention. In Proceedings of the ACM Symposium on Applied Computing, New York, NY, USA, 9–13 April 2018; pp. 800–803. [Google Scholar] [CrossRef]
- Schmidt, P.; Reiss, A.; Duerichen, R.; Laerhoven, K. Van Introducing WeSAD, a Multimodal Dataset for Wearable Stress and Affect Detection. In Proceedings of the ICMI 2018—Proceedings of the 2018 International Conference on Multimodal Interaction, Boulder, CO, USA, 16–20 October 2018; pp. 400–408. [Google Scholar] [CrossRef]
- Feng, T.; Ling, D.; Li, C.; Zheng, W.; Zhang, S.; Li, C.; Emel’yanov, A.; Pozdnyakov, A.S.; Lu, L.; Mao, Y. Stretchable On-Skin Touchless Screen Sensor Enabled by Ionic Hydrogel. Nano Res. 2024, 17, 4462–4470. [Google Scholar] [CrossRef]
- Li, J.; Carlos, C.; Zhou, H.; Sui, J.; Wang, Y.; Silva-Pedraza, Z.; Yang, F.; Dong, Y.; Zhang, Z.; Hacker, T.A.; et al. Stretchable Piezoelectric Biocrystal Thin Films. Nat. Commun. 2023, 14, 6562. [Google Scholar] [CrossRef]
- Kulkarni, M.B.; Rajagopal, S.; Prieto-Simón, B.; Pogue, B.W. Recent Advances in Smart Wearable Sensors for Continuous Human Health Monitoring. Talanta 2024, 272, 125817. [Google Scholar] [CrossRef]
- Kazanskiy, N.L.; Khonina, S.N.; Butt, M.A. A Review on Flexible Wearables-Recent Developments in Non-Invasive Continuous Health Monitoring. Sens. Actuators A Phys. 2024, 366, 114993. [Google Scholar] [CrossRef]
- Garg, M.; Parihar, A.; Rahman, M.S. Advanced and Personalized Healthcare through Integrated Wearable Sensors (Versatile). Mater. Adv. 2024, 5, 432–452. [Google Scholar] [CrossRef]
- Razavi, M.; Ziyadidegan, S.; Mahmoudzadeh, A.; Kazeminasab, S.; Baharlouei, E.; Janfaza, V.; Jahromi, R.; Sasangohar, F. Machine Learning, Deep Learning, and Data Preprocessing Techniques for Detecting, Predicting, and Monitoring Stress and Stress-Related Mental Disorders: Scoping Review. JMIR Ment. Health 2024, 11, e53714. [Google Scholar] [CrossRef] [PubMed]
- Wang, W.; Chen, J.; Hu, Y.; Liu, H.; Chen, J.; Gadekallu, T.R.; Garg, L.; Guizani, M.; Hu, X. Integration of Artificial Intelligence and Wearable Internet of Things for Mental Health Detection. Int. J. Cogn. Comput. Eng. 2024, 5, 307–315. [Google Scholar] [CrossRef]
- Gomes, N.; Pato, M.; Lourenco, A.R.; Datia, N. A Survey on Wearable Sensors for Mental Health Monitoring. Sensors 2023, 23, 1330. [Google Scholar] [CrossRef]
- Spielberger, C.D. Theory and Research on Anxiety; Spielberger, C.D., Ed.; Academic Press Inc.: Oxford, UK, 1966; ISBN 9781483258362. [Google Scholar]
- Spielberger, C.D. Notes and Comments Trait-State Anxiety and Motor Behavior. J. Mot. Behav. 1971, 3, 265–279. [Google Scholar] [CrossRef]
- Hackfort, D.; Spielberger, C.D. Sport-Related Anxiety: Current Trends in Theory and Research; Academic Press Inc.: Cambridge, MA, USA, 2021; ISBN 9781317705987. [Google Scholar]
- Thomas, C.R.; Holzer, C.E. The Continuing Shortage of Child and Adolescent Psychiatrists. J. Am. Acad. Child. Adolesc. Psychiatry 2006, 45, 1023–1031. [Google Scholar] [CrossRef]
- Thomas, K.C.; Ellis, A.R.; Konrad, T.R.; Holzer, C.E.; Morrissey, J.P. County-Level Estimates of Mental Health Professional Shortage in the United States. Psychiatr. Serv. 2009, 60, 1323–1328. [Google Scholar] [CrossRef]
- Kim, W.J. Child and Adolescent Psychiatry Workforce: A Critical Shortage and National Challenge. Acad. Psychiatry 2003, 27, 277–282. [Google Scholar] [CrossRef]
- Satiani, A.; Niedermier, J.; Satiani, B.; Svendsen, D.P. Projected Workforce of Psychiatrists in the United States: A Population Analysis. Psychiatr. Serv. 2018, 69, 710–713. [Google Scholar] [CrossRef]
- Segerstrom, S.C.; Miller, G.E. Psychological Stress and the Human Immune System: A Meta-Analytic Study of 30 Years of Inquiry. Psychol. Bull. 2004, 130, 601–630. [Google Scholar] [CrossRef]
- Vrijkotte, T.G.M.; Van Doornen, L.J.P.; De Geus, E.J.C. Effects of Work Stress on Ambulatory Blood Pressure, Heart Rate, and Heart Rate Variability. Hypertension 2000, 35, 880–886. [Google Scholar] [CrossRef] [PubMed]
- Celano, C.M.; Daunis, D.J.; Lokko, H.N.; Campbell, K.A.; Huffman, J.C. Anxiety Disorders and Cardiovascular Disease. Curr. Psychiatry Rep. 2016, 18, 101. [Google Scholar] [CrossRef] [PubMed]
- Wilson, G.F. An Analysis of Mental Workload in Pilots During Flight Using Multiple Psychophysiological Measures. Int. J. Aviat. Psychol. 2002, 12, 3–18. [Google Scholar] [CrossRef]
- Althubaiti, A. Information Bias in Health Research: Definition, Pitfalls, and Adjustment Methods. J. Multidiscip. Healthc. 2016, 9, 211–217. [Google Scholar] [CrossRef]
- Julian, L.J. Measures of Anxiety. Arthritis Care 2011, 63, 1–11. [Google Scholar] [CrossRef]
- Shiffman, S.; Stone, A.A.; Hufford, M.R. Ecological Momentary Assessment. Annu. Rev. Clin. Psychol. 2008, 4, 1–32. [Google Scholar] [CrossRef]
- Glick, G.; Braunwald, E. Relative Roles of the Sympathetic and Parasympathetic Nervous Systems in the Reflex Control of Heart Rate. Circ. Res. 1965, 16, 363–375. [Google Scholar] [CrossRef]
- Steptoe, A.; Marmot, M. Impaired Cardiovascular Recovery Following Stress Predicts 3-Year Increases in Blood Pressure. J. Hypertens. 2005, 23, 529–536. [Google Scholar] [CrossRef]
- Lundberg, U.; Kadefors, R.; Melin, B.; Palmerud, G.; Hassmén, P.; Engström, M.; Elfsberg Dohns, I. Psychophysiological Stress and Emg Activity of the Trapezius Muscle. Int. J. Behav. Med. 1994, 1, 354–370. [Google Scholar] [CrossRef]
- Waxenbaum, J.A.; Varacallo, M. Anatomy, Autonomic Nervous System. In StatPearls [Internet]; StatPearls Publishing: Treasure Island, FL, USA, 2024. Available online: https://pubmed.ncbi.nlm.nih.gov/30969667/ (accessed on 24 December 2024).
- Critchley, H.D. Study of the Stress Response: Role of Anxiety, Cortisol and DHEAs. Neuroscientist 2002, 8, 132–142. [Google Scholar] [CrossRef]
- Kirschbaum, C.; Pirke, K.M.; Hellhammer, D.H. The “Trier Social Stress Test”—A Tool for Investigating Psychobiological Stress Responses in a Laboratory Setting. Neuropsychobiology 1993, 28, 76–81. [Google Scholar] [CrossRef] [PubMed]
- Koelstra, S.; Muhl, C.; Soleymani, M.; Lee, J.S.; Yazdani, A.; Ebrahimi, T.; Pun, T.; Nijholt, A.; Patras, I. DEAP: A Database for Emotion Analysis; Using Physiological Signals. IEEE Trans. Affect. Comput. 2012, 3, 18–31. [Google Scholar] [CrossRef]
- Lovallo, W. The Cold Pressor Test and Autonomic Function: A Review and Integration. Psychophysiology 1975, 12, 268–282. [Google Scholar] [CrossRef] [PubMed]
- Dziezyc, M.; Gjoreski, M.; Kazienko, P.; Saganowski, S.; Gams, M. Can We Ditch Feature Engineering? End-to-End Deep Learning for Affect Recognition from Physiological Sensor Data. Sensors 2020, 20, 6535. [Google Scholar] [CrossRef]
- Ancillon, L.; Elgendi, M.; Menon, C. Machine Learning for Anxiety Detection Using Biosignals: A Review. Diagnostics 2022, 12, 1794. [Google Scholar] [CrossRef]
- Giannakakis, G.; Grigoriadis, D.; Giannakaki, K.; Simantiraki, O.; Roniotis, A.; Tsiknakis, M. Review on Psychological Stress Detection Using Biosignals. IEEE Trans. Affect. Comput. 2022, 13, 440–460. [Google Scholar] [CrossRef]
- Kreibig, S.D. Autonomic Nervous System Activity in Emotion: A Review. Biol. Psychol. 2010, 84, 394–421. [Google Scholar] [CrossRef]
- Shatte, A.B.R.; Hutchinson, D.M.; Teague, S.J. Machine Learning in Mental Health: A Scoping Review of Methods and Applications. Psychol. Med. 2019, 49, 1426–1448. [Google Scholar] [CrossRef]
- Watson, D.; Clark, L.A.; Tellegen, A. Development and Validation of Brief Measures of Positive and Negative Affect: The PANAS Scales. J. Pers. Soc. Psychol. 1988, 54, 1063–1070. [Google Scholar] [CrossRef]
- Spielberger, C.D.; Gonzalez-Reigosa, F.; Martinez-Urrutia, A.; Natalicio, L.F.S.; Natalicio, D.S. The State-Trait Anxiety Inventory. Rev. Interam. De Psicol. /Interam. J. Psychol. 1971, 5, 3–4. [Google Scholar] [CrossRef]
- Helton, W.S. Validation of a Short Stress State Questionnaire. In Proceedings of the Human Factors and Ergonomics Society Annual Meeting; Sage Publications: Los Angeles, CA, USA, 2004; Volume 48, pp. 1238–1242. [Google Scholar] [CrossRef]
- Samson, A.C.; Kreibig, S.D.; Soderstrom, B.; Wade, A.A.; Gross, J.J. Eliciting Positive, Negative and Mixed Emotional States: A Film Library for Affective Scientists. Cogn. Emot. 2016, 30, 827–856. [Google Scholar] [CrossRef] [PubMed]
- Scholkmann, F.; Boss, J.; Wolf, M. An Efficient Algorithm for Automatic Peak Detection in Noisy Periodic and Quasi-Periodic Signals. Algorithms 2012, 5, 588–603. [Google Scholar] [CrossRef]
- Chen, T.; Guestrin, C. XGBoost. In Proceedings of the 22nd ACM SIGKDD International Conference on Knowledge Discovery and Data Mining, San Francisco, CA, USA, 13–17 August 2016; ACM: New York, NY, USA, 2016; pp. 785–794. [Google Scholar]
- Pedregosa, F.; Varoquaux, G.; Gramfort, A.; Michel, V.; Thirion, B.; Grisel, O.; Blondel, M.; Prettenhofer, P.; Weiss, R.; Dubourg, V.; et al. Scikit-Learn: Machine Learning in Python. J. Mach. Learn. Res. 2011, 12, 2825–2830. [Google Scholar]
- Bengio, Y.; Courville, A.; Vincent, P. Representation Learning: A Review and New Perspectives. IEEE Trans. Pattern Anal. Mach. Intell. 2013, 35, 1798–1828. [Google Scholar] [CrossRef]
- Ou, G.; Murphey, Y.L. Multi-Class Pattern Classification Using Neural Networks. Pattern Recognit. 2007, 40, 4–18. [Google Scholar] [CrossRef]
- Rifkin, R.; Klautau, A. In Defense of One-vs-All Classification. J. Mach. Learn. Res. 2004, 5, 101–141. [Google Scholar]
- Hsu, C.-W.; Lin, C.-J. A Comparison of Methods for Multiclass Support Vector Machines. IEEE Trans. Neural Netw. 2002, 13, 415–425. [Google Scholar] [CrossRef]
- Zaman, M.S.; Morshed, B.I. Estimating Reliability of Signal Quality of Physiological Data from Data Statistics Itself for Real-Time Wearables. In Proceedings of the 2020 42nd Annual International Conference of the IEEE Engineering in Medicine & Biology Society (EMBC), Montreal, QC, Canada, 20–24 July 2020; pp. 5967–5970. [Google Scholar]
- Abd-Alrazaq, A.; AlSaad, R.; Harfouche, M.; Aziz, S.; Ahmed, A.; Damseh, R.; Sheikh, J. Wearable Artificial Intelligence for Detecting Anxiety: Systematic Review and Meta-Analysis. J. Med. Internet Res. 2023, 25, e48754. [Google Scholar] [CrossRef]
- Zhang, S.; Li, X.; Zong, M.; Zhu, X.; Wang, R. Efficient KNN Classification with Different Numbers of Nearest Neighbors. IEEE Trans. Neural Netw. Learn. Syst. 2017, 29, 1774–1785. [Google Scholar] [CrossRef]
Disclaimer/Publisher’s Note: The statements, opinions and data contained in all publications are solely those of the individual author(s) and contributor(s) and not of MDPI and/or the editor(s). MDPI and/or the editor(s) disclaim responsibility for any injury to people or property resulting from any ideas, methods, instructions or products referred to in the content. |
© 2024 by the authors. Licensee MDPI, Basel, Switzerland. This article is an open access article distributed under the terms and conditions of the Creative Commons Attribution (CC BY) license (https://creativecommons.org/licenses/by/4.0/).