Article

The Role of Technical Car Features in Managing and Promoting New Peer-to-Peer Car-Sharing Systems: Insights from Potential Users and Strategic Implications for Service Providers

1
Department of Road Transport, Faculty of Transport and Aviation Engineering, Silesian University of Technology, 8 Krasińskiego Street, 40-019 Katowice, Poland
2
Department of Power Engineering and Turbomachinery, Faculty of Energy and Environmental Engineering, Silesian University of Technology, 18 Konarskiego Street, 44-100 Gliwice, Poland
3
Institute of Logistics and Transportation, Technical University of Kosice, 14 Park Komenskeho, 042 00 Kosice, Slovakia
4
Energy Innovation Centre, Warwick Manufacturing Group, University of Warwick, Gibbet Hill Road, Coventry, West Midlands CV4 7AL, UK
*
Authors to whom correspondence should be addressed.
Appl. Sci. 2025, 15(2), 658; https://doi.org/10.3390/app15020658
Submission received: 15 October 2024 / Revised: 5 December 2024 / Accepted: 9 January 2025 / Published: 11 January 2025
(This article belongs to the Section Green Sustainable Science and Technology)

Abstract

:
Peer-to-peer car-sharing systems are an evolving branch of urban mobility, aligning with global trends focused on sustainable development and reducing congestion in cities. A research gap has been identified concerning the specific vehicle attributes that would encourage the public to potentially use these services. Addressing this gap, and in the context of launching a new peer-to-peer car-sharing service in Katowice, Poland, this article investigates the technical features influencing the choice of vehicles in peer-to-peer car-sharing systems, particularly from the perspective of individuals who currently do not use such platforms. The study employs Social Network Analysis (SNA) to examine the interrelationships between vehicle attributes. The analysis reveals that key factors influencing users’ decisions include fuel/energy consumption, safety features, and technological advancement, with a particular emphasis on driver assistance systems, including autonomous driving capabilities. The network structure, characterized by a relatively low density (0.2536) and a short average path length (1.872), suggests that a few central vehicle features dominate user decisions, and improvements in these key areas can quickly propagate through the decision-making process, enhancing overall user satisfaction. To validate the findings, a Gradient Boosting Regression (GBR) analysis was conducted, confirming the significance of the key factors identified by the SNA, such as fuel efficiency, battery capacity, and safety systems, thus strengthening the reliability of the results. This study underscores the growing importance of sustainability and technological innovation in the automotive industry, particularly in the context of the sharing economy. It suggests that car-sharing platforms and vehicle manufacturers should prioritize these features to meet user expectations and preferences. These findings provide valuable insights for the strategic and operational management of peer-to-peer car-sharing services, emphasizing the importance of targeted vehicle selection and user-centered innovations to improve platform performance and scalability.

1. Introduction

Car-sharing services, wherein vehicles are rented through mobile applications for brief periods, have been established as common systems experienced in both implementation and maintenance within the transportation services market. Through systematic evaluation, these systems have evolved into numerous operational variants, enabling users to rent cars according to a range of business or functional models. Furthermore, as these services have expanded, they have encompassed an increasingly diverse array of user groups. The offerings encompass systems provided by organized enterprises or startups catered to individual consumers (B2C—Business-to-Consumer car sharing) or business clients (B2B—Business-to-Business car sharing), which are recognized as the predominant forms of car sharing [1,2,3]. Additionally, it is pertinent to acknowledge another variant of car-sharing systems, namely, peer-to-peer services. In this model, individuals lease their personal vehicles to others for brief durations, typically via an online platform or mobile application [4]. Participants in this service model have the capability to access nearby and cost-effective vehicles and are charged solely for the duration of their use. The typical operation of peer-to-peer car sharing includes the following steps [5]:
(1)
Listing: Vehicle owners register their automobiles on the peer-to-peer car-sharing platform, providing details such as the make, model, location, availability, and rental rates.
(2)
Search and Book: Prospective renters search for available vehicles on the platform, applying filters such as location, vehicle type, price, and availability. Upon locating a suitable vehicle, they can book it for a designated period.
(3)
Key Exchange or Remote Access: Key exchange may occur directly between the owner and the renter, or some platforms may offer remote access solutions, enabling renters to unlock and start the vehicle using a smartphone.
(4)
Rental Period: Renters utilize the car for a predetermined period, incurring fees based on the duration and distance traveled.
(5)
Return: Upon the completion of the rental period, the renter returns the vehicle to the owner, whereupon both parties may provide feedback or ratings on the platform based on their experiences.
Unlike in traditional minute- or kilometer-based car sharing, vehicles in peer-to-peer services are typically rented for extended durations, such as hours or days, aligning these services more closely with conventional car rental models [6].
Peer-to-peer car-sharing services have evolved gradually. The period from 2010 to 2012 marks the inception of these services, beginning in the American market. It was during this time that the first peer-to-peer car-sharing platforms were established; for instance, RelayRides was launched in the United States in 2010, followed by Getaround in 2011, one of the pioneers of the peer-to-peer car-sharing model. Subsequently, these services expanded into the European market. In 2012, the Tamyca platform was launched in Germany, and the company Drivy (originally known as Voiturelib) began operations in France. Between 2013 and 2015, companies established in 2012 experienced growth, and many new entrants emerged in the markets of Germany, the Netherlands, France, and Great Britain, alongside numerous rebranding efforts, such as the transformation of RelayRides into Turo. From 2016 to 2018, significant technological advancements were made, and services expanded into new markets. From 2019 to the present, there has been a notable effort by companies to integrate with traditional mobility services, aiming to incorporate them into the framework of Mobility as a Service (MaaS), as well as the implementation of legal regulations that define the operation of services in various countries.
Despite varying societal acceptance and actual usage, car-sharing services are identified as alternatives to current individual motorization. As representatives of new mobility services, they have a real potential to meet the requirements for sustainable development and to mitigate the negative environmental impacts of transportation [7,8,9]. For this reason, car-sharing services are extensively studied by researchers worldwide. However, while issues related to classic business-to-consumer car sharing are frequently addressed, peer-to-peer services are described as less popular [10].
Analyzing the literature on peer-to-peer car sharing services, several leading related topics can be found, for example, aspects related to research on the diversity of business models for peer-to-peer car sharing, motivational factors and barriers for both customers and service providers, users’ behaviors and motivations, vehicle balancing issues such as station locations and vehicle movement strategies, and the economic aspects of peer-to-peer car-sharing functioning. Research shows that peer-to-peer car sharing encounters a range of challenges, including legal issues related to insurance, liability, and local regulations [1]. Furthermore, it is indicated that a key aspect in the development of peer-to-peer car sharing is the need to build trust among users, develop appropriate technology and infrastructure, and demonstrating the real impact of peer-to-peer car sharing on reducing car usage costs, such as in relation to the costs of car ownership [2,3].
From an ecological perspective, it is emphasized that peer-to-peer car sharing can effectively reduce carbon emissions compared to private car ownership [11]. It is also noted that the peer-to-peer car-sharing model has a smaller carbon footprint than the business-to-consumer model, making it more sustainable from an environmental perspective. Additionally, policymakers should implement strategies to mitigate rebound effects and ensure that car sharing contributes positively to sustainability goals [11]. Regarding the effective reduction in GHG emissions, peer-to-peer car sharing in Amsterdam effectively reduces Greenhouse Gas (GHG) emissions by decreasing the number of privately owned vehicles in use and promoting the sharing of more energy-efficient vehicles [4]. It has also been noted that peer-to-peer car sharing fosters behavioral shifts in mobility, with users often choosing to car share for trips where public transportation is less convenient, thus complementing the existing transport system rather than competing with it.
Another area of research involves investigations into changes in the mobility behavior of potential peer-to-peer car-sharing users, building trust through algorithmic reputation systems, and the motivational factors that encourage participation, including economic benefits and access to better or different cars. Analyses indicate that peer-to-peer car sharing leads to a reduction in the use of personal vehicles by owners who participate in the car-sharing network. Vehicle owners who engage in peer-to-peer car sharing are more likely to use alternative modes of transportation such as public transit, biking, or walking. Participation in peer-to-peer car sharing influences vehicle owners to alter their travel behaviors, opting for more environmentally friendly or cost-effective travel options when possible. Peer-to-peer car sharing reduces the overall mileage accumulated on personal vehicles, as owners lend out their cars to others instead of using them exclusively themselves [12]. Furthermore, algorithm-based reputation systems are effective in building trust among users of peer-to-peer car-sharing platforms [13]. Individuals participate in peer-to-peer car sharing for a variety of reasons, including economic benefits, environmental concerns, and social motivations [14].
Research has also examined motivations to use peer-to-peer car-sharing services, indicating that cost savings and the potential to earn income from underutilized assets are significant motivators for many users to engage in peer-to-peer car sharing [14]. Additionally, a desire to reduce personal carbon footprints motivates some participants, reflecting a commitment to environmental sustainability [14]. For some, the social aspects of sharing with others in the community and fostering a sense of collective responsibility are key drivers [14]. Peer-to-peer car sharing increases the utilization rates of personal vehicles, reducing the need for manufacturing new vehicles and thereby decreasing the overall environmental footprint. Peer-to-peer car sharing can significantly reduce the demand for parking spaces in urban areas, as fewer individuals need to own private vehicles, thus freeing up urban space for other uses and decreasing urban sprawl [14].
Peer-to-peer car sharing encourages lower rates of vehicle ownership, which can lead to fewer cars on the road and, consequently, reduced traffic congestion and air pollution [4]. By enabling vehicle owners to rent out their vehicles, P2P car sharing provides economic benefits to car owners while fostering a community-based sharing economy that can enhance social interactions and trust within communities [4]. Moreover, it has been highlighted that peer-to-peer car sharing can contribute to the realization of sustainable development goals. Among other things, it is emphasized that P2P car sharing encourages users to shift from owning personal vehicles to participating in a sharing economy, which can lead to lower individual vehicle usage and, consequently, fewer emissions [15,16,17]. Analyzing P2P car sharing from a lifecycle perspective reveals benefits such as reduced demand for vehicle production and associated resources, leading to further reductions in greenhouse gas emissions [17]. It is also noted that peer-to-peer car sharing significantly increases the utilization rates of privately owned vehicles, reducing the need for additional cars and thereby contributing to less traffic and parking congestion [18]. By facilitating the sharing of personal vehicles among multiple users, P2P car sharing can lead to notable reductions in carbon emissions per user, supporting broader environmental sustainability goals [18]. The adoption of P2P car sharing fosters a cultural and behavioral shift toward the sharing economy, reducing reliance on personal vehicle ownership and promoting more sustainable urban transport habits [18].
Another area is linked to analyses of profitability and quality under demand uncertainty, attempts to optimize these systems using mathematical models accounting for demand fluctuations and the diversity of user preferences, and economic studies on how sharing affects consumption and ownership, exploring intentions to participate in peer-to-peer car sharing from a “provider–user” perspective and highlighting motivations and barriers for users and service providers that influence their participation decisions. It is emphasized that P2P car-sharing systems can optimize profitability while maintaining high service quality, even under conditions of demand uncertainty [19]. The importance of understanding user behavior and network effects to improve service effectiveness is also noted [20]. Important factors include trust, perceived benefits, and the social and environmental impacts of sharing [21]. Additionally, the need for user-centered design practices that focus on usability, accessibility, and satisfaction to foster higher adoption rates is highlighted [22].
The final identified area in the literature involves assessments of the perception of peer-to-peer car-sharing systems in terms of vehicle owners’ attitudes and values toward car-sharing and vehicle technology, public perception, and characteristics of the peer-to-peer car-sharing market. This addresses challenges such as safety concerns and privacy that may hinder the adoption of this model among certain user groups, as well as analyses of people’s willingness to rent their vehicles to others through peer-to-peer car-sharing platforms for additional earnings. These studies emphasize the broader acceptance and optimization of P2P car sharing, with a focus on adapting to technological advancements, improving public perceptions, and ensuring trust and security within the system. Each of these areas is critical for the successful expansion and sustainability of P2P car-sharing services [23,24,25].
Synthesizing the existing literature on P2P car sharing, it is evident that this model offers substantial environmental, social, and economic benefits while presenting challenges that require strategic approaches for optimization. Ecologically, P2P car sharing significantly reduces greenhouse gas emissions by promoting higher utilization rates of existing vehicles, limiting the production of new cars, and encouraging shifts toward alternative transportation methods such as public transit, cycling, or walking. Economically, it allows users to reduce costs and generate income from underutilized vehicles while socially fostering a sense of community and shared responsibility.
Operational research highlights the importance of maintaining high service quality and profitability, even in the face of demand uncertainty, and underscores the need for trust-building mechanisms, such as algorithm-based reputation systems, to ensure user confidence. Despite these insights, the literature reveals an evident gap in exploring P2P car-sharing systems in contexts like that of Katowice, a city in central–southern Poland undergoing post-mining transformation. The unique challenges and opportunities in such transitioning urban environments remain underexplored.
Building on this, while the indicated research topics cover a broad range of issues, no studies have been identified that focus on the compliance of vehicles available for rental in peer-to-peer car-sharing systems from a technical perspective. These issues are particularly important and require consideration because when choosing a car-sharing service, the vehicle and its attributes play a key role in the decision to rent, which is emphasized by research carried out for classic forms of car-sharing services [1,26,27,28]. For example, research by Turoń [26] has shown that regular B2C car-sharing users prefer larger vehicles from classes C and D. These cars offer more space, better usability, and comfort, which are important for users who need a vehicle for different types of trips. The results of this study suggest that the size and type of vehicle are crucial factors in deciding to rent shared cars [26]. On the other hand, Chen et al. [27] indicate that car quality also strongly influences user satisfaction. They stated that several recent failures in car sharing operations have been due to poor car quality [27]. What is more, a study by Kim, Rasouli, and Timmermans [28] indicated that technological features and overall vehicle comfort are key factors influencing car-sharing user satisfaction. The authors noted that navigation systems, connectivity options, and a comfortable interior significantly affect users’ rental decisions [28].
While there are no specific studies that examine vehicle attributes in peer-to-peer car-sharing systems, related research on traditional car rental services and consumer vehicle purchasing behaviors provides valuable insights. A study by Lane and Potter [29] on consumer preferences in car purchasing shows that buyers tend to favor vehicles with high fuel efficiency, advanced safety systems, and modern technological features, all of which play an important role in their decision-making process. These findings suggest that vehicle attributes are likely to be similarly significant in peer-to-peer car sharing, as users seek vehicles that meet their expectations for quality and convenience, regardless of the rental duration. Therefore, even though direct research on this topic is lacking, the trends observed in related sectors indicate that the importance of vehicle attributes in peer-to-peer car sharing should not be underestimated.
Both from the users’ and platform operators’ perspectives, it is crucial to offer a fleet that meets user expectations, thereby allowing operators to generate revenue without incurring additional costs. Recognizing this research gap, this article presents research results on the preferences of potential users of peer-to-peer car-sharing systems for short-term rental vehicles. The study aimed to understand the preferences of individuals who do not currently use short-term car rental services and was conducted in the city of Katowice, Poland. The selection of this city was not arbitrary; since 1 December 2023, paid parking zones have been introduced in the city to encourage travelers to adopt alternative forms of mobility. As the range of new mobility services expands, efforts are currently underway to launch a peer-to-peer car-sharing platform, in connection with which this research was conducted.
The importance of technical vehicle features in peer-to-peer car sharing is further supported by the observation that consumers in other related markets, such as traditional car rentals and vehicle purchases, increasingly prioritize advanced technological features and vehicle quality. Research by Fujita et al. [30] on consumer behavior in vehicle purchasing shows that customers are more likely to choose vehicles with strong brand reputations, advanced technology, and high comfort levels. These preferences apply not only to vehicle purchases but also to short-term rentals, where renters expect similar qualities in the cars they select. In a competitive market, peer-to-peer platforms that cater to these preferences by offering well-maintained, technologically advanced vehicles are more likely to retain users and achieve long-term success.
Management and marketing in peer-to-peer car sharing are crucial for the proper functioning of these services, yet studies focusing on car features in this context have not been conducted. Effective management and marketing strategies ensure that the services are tailored to meet the evolving needs of users and remain competitive in the market. The importance of these strategies stems from their role in addressing user expectations and market dynamics, which are pivotal in fostering service adoption and user retention. Understanding and implementing the right mix of car features based on thorough research can significantly enhance user satisfaction and differentiate a service in a crowded marketplace. Furthermore, strategic management and marketing can help identify and respond to changes in consumer behavior, technological advancements, and regulatory developments. These efforts are not only about maintaining relevance but also about driving innovation within the industry, making peer-to-peer car sharing a more attractive and sustainable option. As such, the lack of focused studies on car features within this context represents a missed opportunity to optimize these services for better performance and increased user engagement.
The article is organized into five section. The first section provides an overview of peer-to-peer car sharing, discussing its developmental history and market trends. It also identifies research gaps concerning the analysis of this type of service. The second section outlines the research methodology employed. The third section details the research findings and the validation of the SNA method by using Gradient Boosting Regression (GBR), which are further discussed in the fourth section. Finally, the fifth section offers a summary and conclusions derived from the research, along with the practical implications of the findings.

2. Methods

Understanding the factors that influence the selection of vehicles in peer-to-peer car sharing is crucial for users, as various features and properties of the vehicles can significantly impact the decision to utilize the service, as well as travel comfort, safety, and overall satisfaction. In this context, employing Social Network Analysis (SNA) enhances the understanding of which vehicle aspects are critical when selecting a car from peer-to-peer car-sharing services.
The aim of this study was to employ the SNA methodology to identify key features influencing users’ preferences for vehicles available in peer-to-peer car sharing and to analyze the patterns of relationships among these features. By examining the network structure of relationships between various car features and their impact on user choices, it is possible to gain a deeper understanding of the dynamics of this service model. This will develop knowledge about the factors that determine the choice of a car in peer-to-peer car sharing, which may have significant implications for adapting vehicle offerings to the needs and preferences of users and improving the quality of experiences related to using this form of service. The choice of the Social Network Analysis (SNA) method in this research is justified by the specific goals, which require a deeper understanding of the patterns and relationships between the various factors that influence users’ car selection decisions in a peer-to-peer car-sharing system. SNA facilitates the analysis of the network structure of relationships between vehicle features and their impacts on user choice, which is difficult to achieve using simple statistical methods [31]. Simple statistical methods, such as regression analysis or correlation tests, although useful, can only provide a linear view of the relationships between variables [31]. In the context of this study, where it is crucial to understand the complex interrelationships between various vehicle characteristics (such as comfort, safety, fuel consumption, technology availability, etc.) and user preferences, SNA offers a richer perspective. SNA enables the identification and analysis of relationship patterns that are key to understanding what combinations of vehicle features are most desired by users, which in turn can influence their willingness to use the service. For example, SNA can be used to examine how the centrality or mediation of specific features in the network affects the overall attractiveness of a car in a car-sharing system. This approach also allows for the discovery of potential preference clusters, which may suggest the existence of specific market segments of users who prefer specific types of vehicles. This enables the adaptation of the vehicle offer to different expectations, which may contribute to increasing the efficiency and attractiveness of the services offered, especially with respect to a new service operator on the market.
From a theoretical scientific perspective, Social Network Analysis (SNA) is distinguished by its ability to visualize and quantify the relationships and flows between different nodes or actors within a network. This methodology is rooted in the fields of sociology and anthropology but has been widely adopted in various other disciplines, including business, economics, and information technology, to explore the dynamics within complex systems. SNA provides tools for mapping and measuring the strength of relationships and interactions among various elements within a network, which can reveal hidden patterns, central influencers, and clusters or communities within the data. This capability makes SNA particularly valuable for research that seeks to decode complex relational data that cannot be sufficiently described through traditional statistical methods.
Furthermore, SNA’s theoretical underpinnings are based on the premise that relationships hold critical information about the structure and function of a system. In the context of peer-to-peer car sharing, this perspective shifts the focus from the attributes of individual vehicles to the interdependencies and influences they exert within the broader service ecosystem. By employing SNA, researchers can identify which features or combinations thereof act as pivotal points in influencing user decisions and behaviors. The application of SNA thus extends beyond mere descriptive analysis to providing strategic insights that can guide decision-making and policy formulations in car-sharing systems. This methodological approach not only enhances our understanding of user preferences and behaviors but also contributes to more informed and effective service design and marketing strategies.
SNA provides insights that other statistical methods cannot by focusing on the relationships and network structures rather than solely on the attributes of the data entities. Unlike traditional statistical methods, which often assume independence among observations, SNA acknowledges and analyzes interdependencies. This allows researchers to understand influence, diffusion, and connectivity within a network. The primary advantages of SNA include its ability to identify influential factors within a network, uncover subgroups or communities with similar preferences or behaviors, and understand the relational dynamics that traditional analytics might overlook. These capabilities are especially beneficial in contexts like car sharing, where understanding the complex network of user preferences and vehicle features can lead to more targeted and effective strategies.
The next subsection presents the SNA method in detail from a formal perspective.

2.1. Social Network Analysis Methodology

The Social Network Analysis (SNA) method is an interdisciplinary research technique that focuses on analyzing the structure, dynamics, and functioning of social networks by examining the relationships between individuals within these networks [26]. SNA facilitates the analysis of social relationships and structures using networks and graph theory [31,32]. The application of the SNA method can be divided into five main steps. The first step is to define the purpose of the investigation, understand the network structure being analyzed by mapping connection patterns, identifying key nodes or connections, analyzing flows within the network, and identifying clusters or modules [32]. The second step involves collecting and preparing data. Depending on the case study, the data may originate from existing datasets, surveys, interviews, or expert research. After collecting the data, the next step is to analyze them [33]. Various types of IT tools are commonly used for analysis, including Python with NetworkX, the R programming language with the SNA package, or Gephi for network analysis and visualization [34,35,36,37]. Analyses are performed on network measures, which include the following [34,35,36,37]:
  • Degree—The number of edges connected to a given vertex. In directed networks, we distinguish between the input degree (number of input edges) and the output degree (number of output edges).
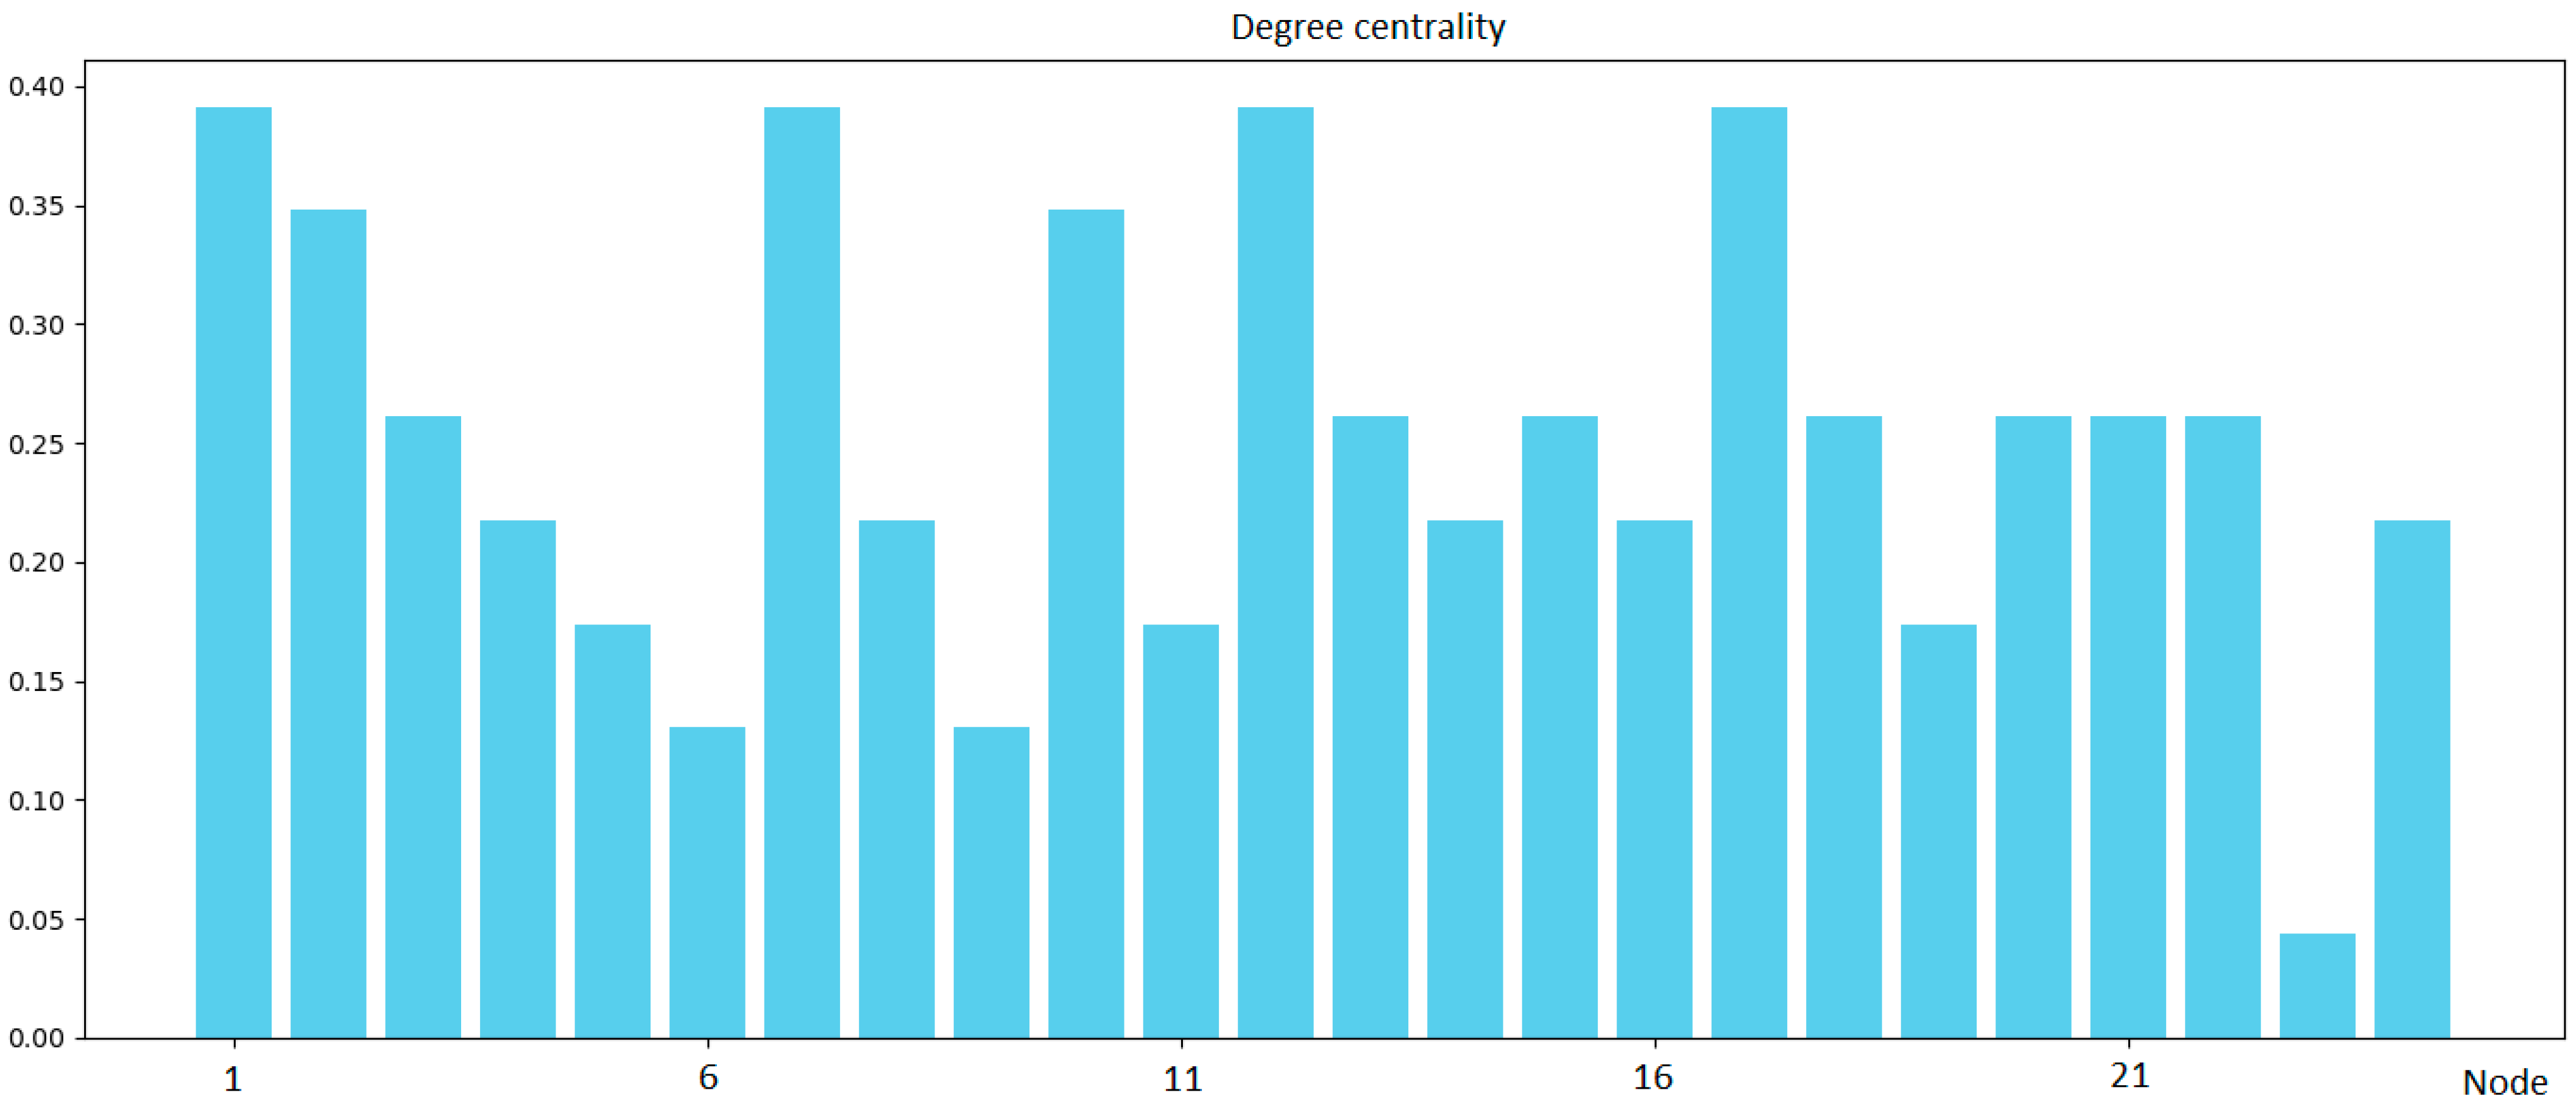
  • Centrality Degree C D v —This measures the number of direct connections (edges) a node has with other nodes in the network. In directed networks, a distinction can be made between input and output degree centrality. The degree centrality highlights the activity of a node in the network through the number of its direct connections. It is expressed by Formula (1):
    C D v = d e g ( v ) N 1
    where
    • deg(v)—Node degree;
    • N—Number of vertices.
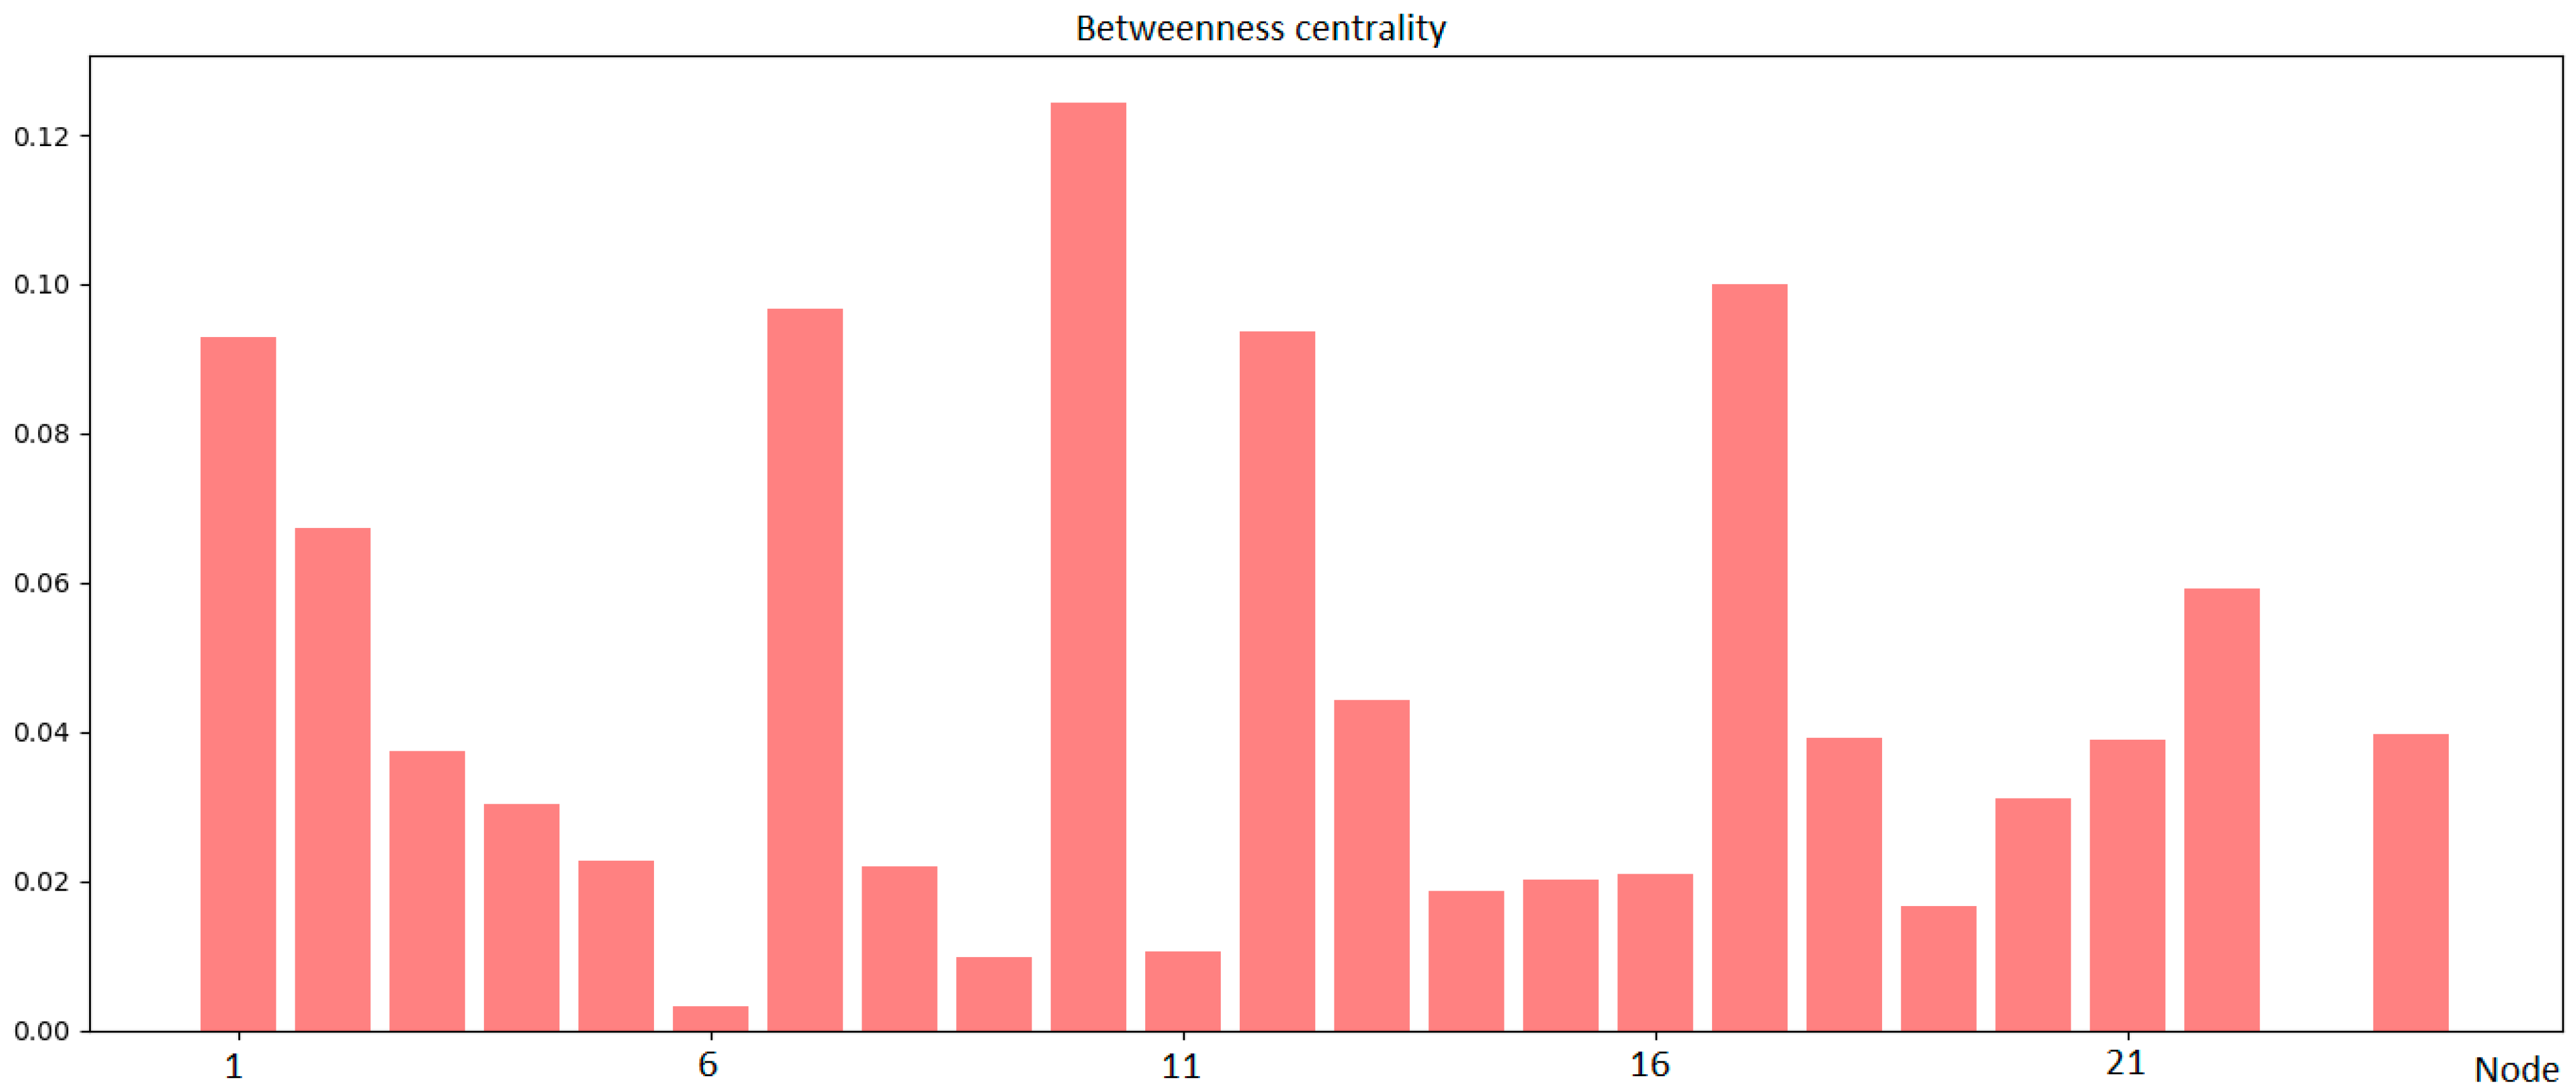
  • Betweenness Centrality C B v —This measures how often a node appears on the shortest paths between pairs of other nodes in the network. A high value of betweenness centrality indicates that the node act as a “bridge” or intermediary in the flow of information or resources in the network, which may indicate control over what flows in the network and how. It is expressed by Formula (2):
    C B v =   s , t   ϵ V σ s t ( v ) σ s t
    where
    • σ s t represents the total number of shortest paths between vertices s and t, while σ s t ( v ) denotes the number of those paths that pass through vertex v .
  • Closeness Centrality C C v This quantifies how near a node is to all other nodes in the network, considering the shortest path distances. It is calculated as the reciprocal of the total length of the shortest paths from the given node to every other node. A high closeness centrality suggests that a node can reach others in the network, which may be beneficial for the speed of information flow. It is expressed by Formula (3):
    C C v = 1 s , t   ϵ V d ( v , t )
    where
    • d ( v , t ) —Length of the shortest path from v to t.
  • Density—A measure that determines how close a network is to a fully connected network (where every node is connected to every other node). The network density provides the proportion of the number of actual connections (edges) in the network to the number of possible connections. It is determined by Formula (4):
    D = 2 L N ( N 1 )
    where
    • L—Number of edges.
  • Average Path Length—A measure that determines how close, on average, each node is to every other node in the network. It indicates the average number of steps (edges) needed to move from one node to another if the journey always takes the shortest possible path. It is determined by Formula (5):
    l g = 1 N ( N 1 )   i j   d v i ,   v j
The penultimate step involves interpreting the results obtained. This analysis is based on three main elements [34,35]:
(a)
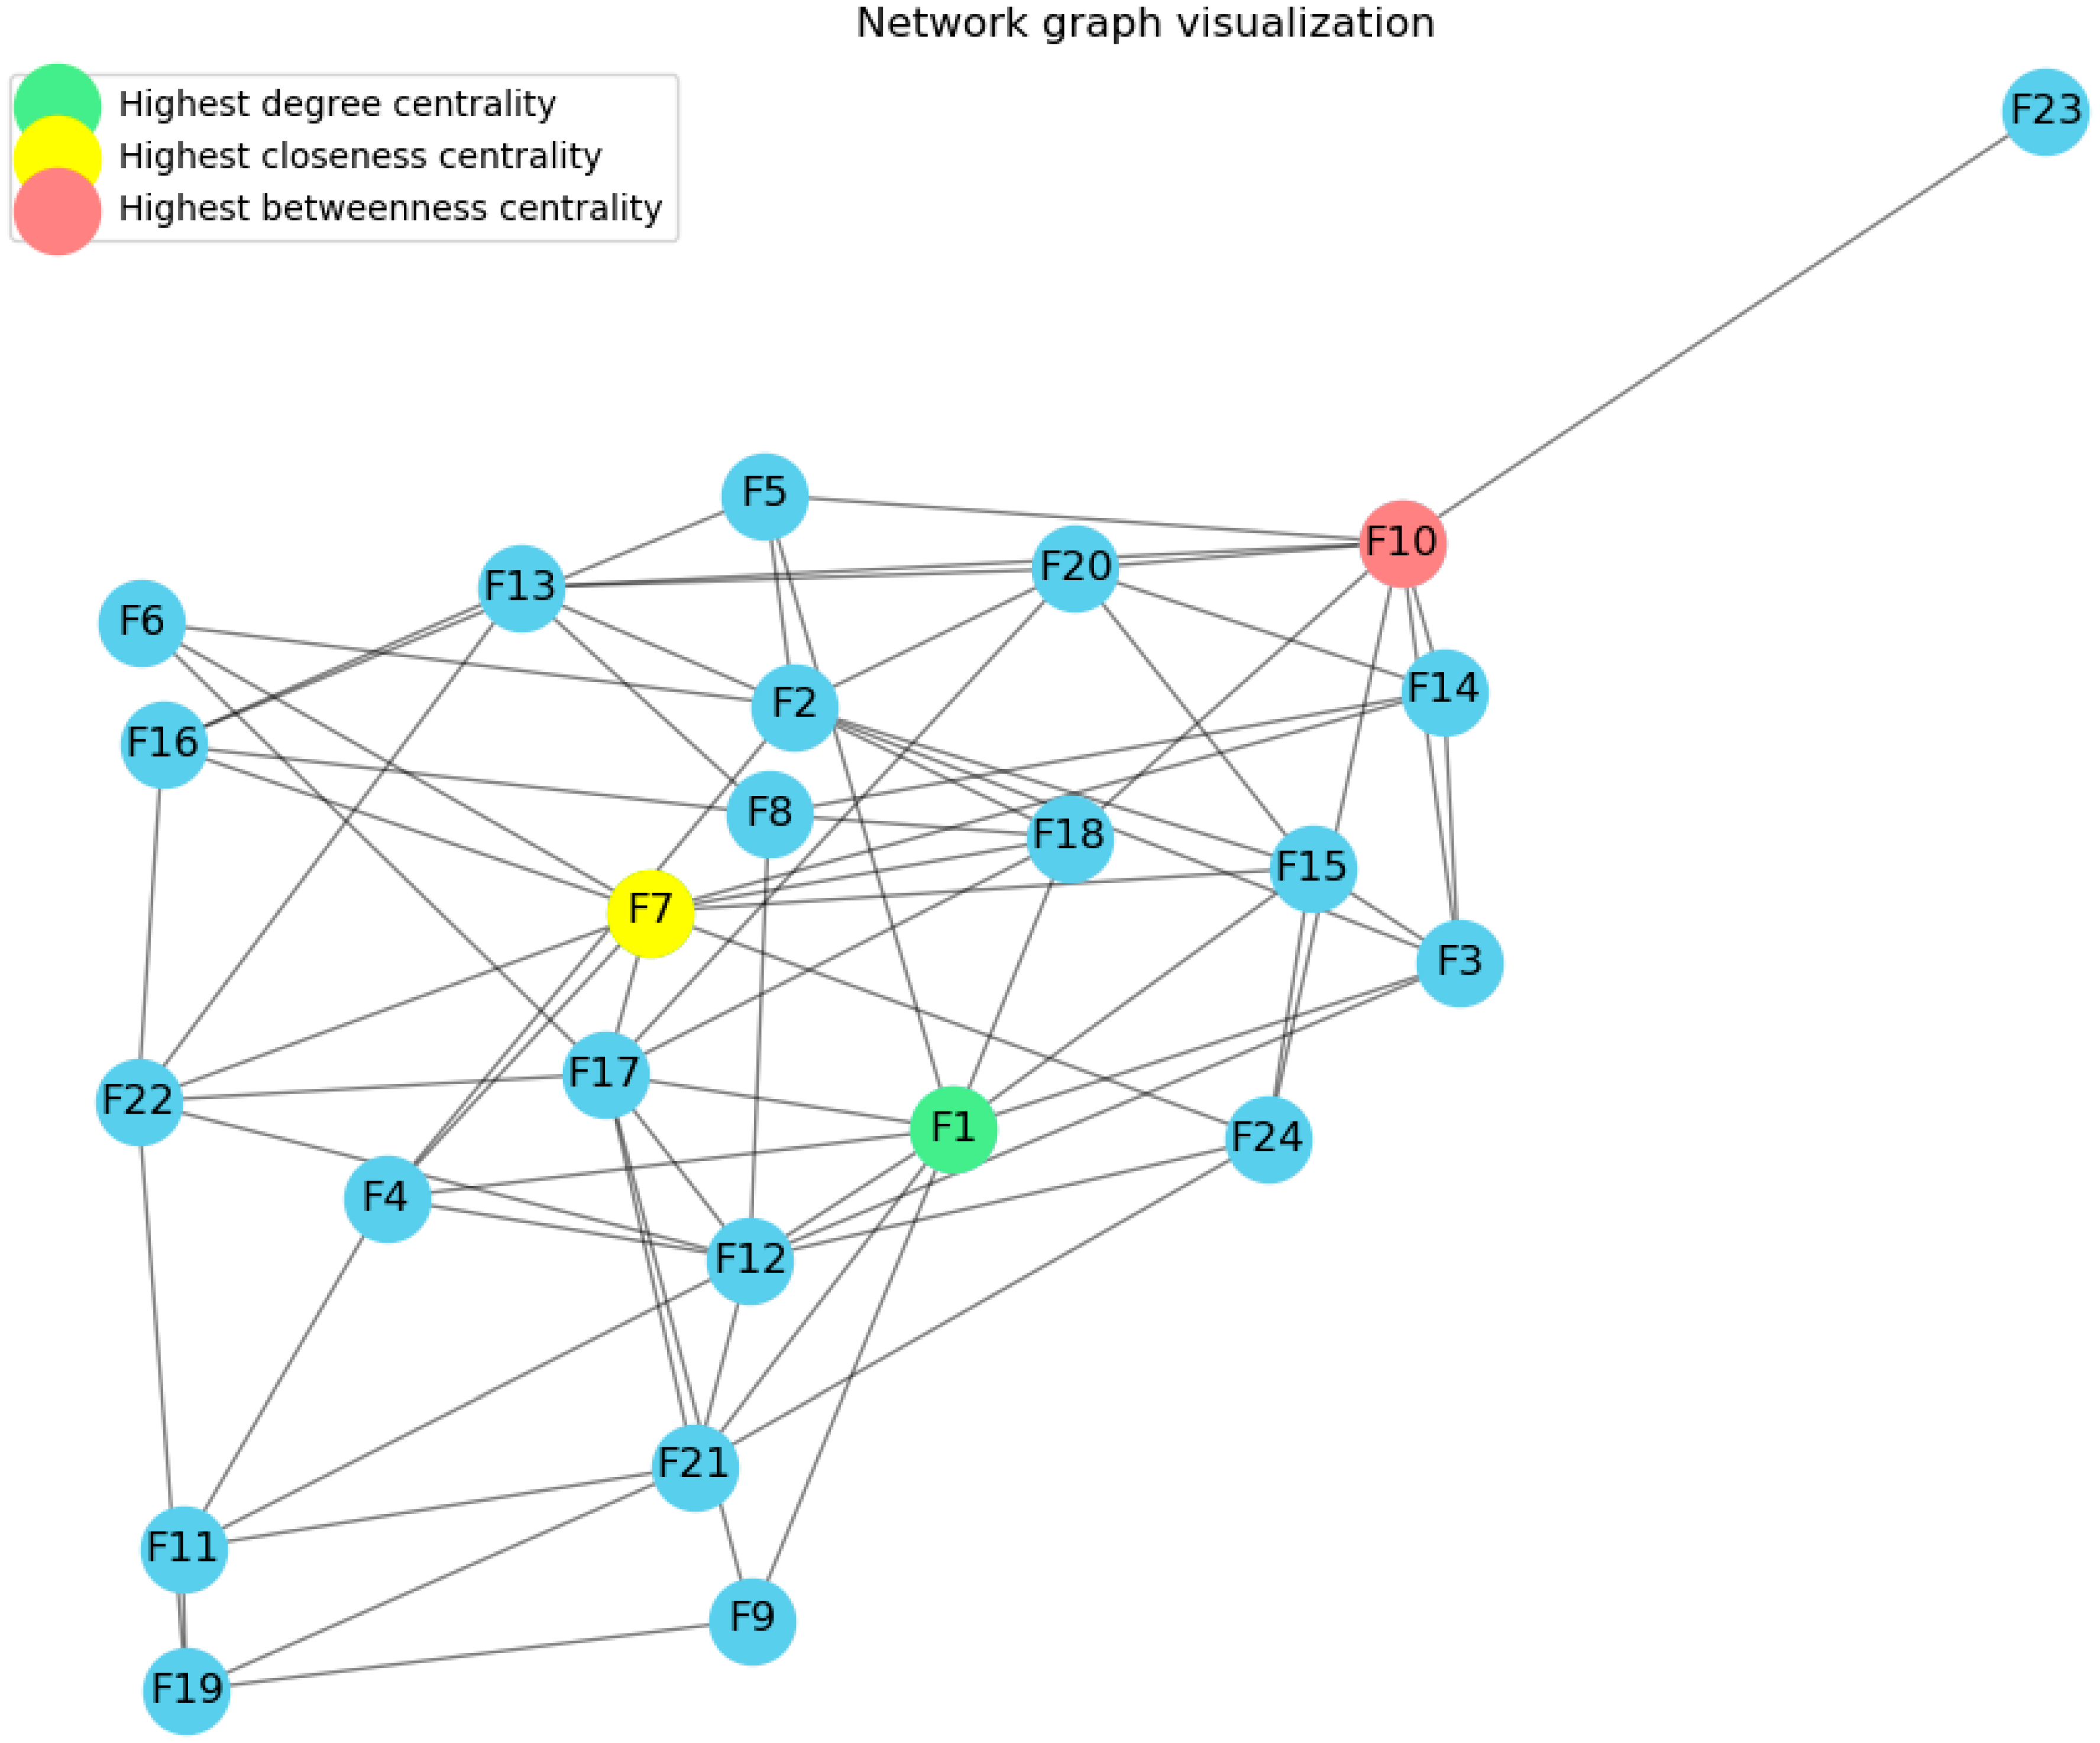
Visualization: A graphical representation of the network can enhance understanding of its structure and key components.
(b)
Analysis of key nodes and connections: This involves understanding their roles and impacts on the network’s operation.
(c)
Substructure analysis: This examines how subgroups within the network are interconnected and how they function.
The final step of the method is to draw appropriate conclusions and outline possible implementations of the findings, considering the importance of planning and optimization for a given service. This includes improving the network by identifying weak points or optimizing flows, understanding how network disturbances can pose threats to its functioning, and devising strategies for managing these disturbances. It also involves focusing on development and innovation by designing more effective network structures based on the results obtained [35,36,37,38,39]. Thanks to its utilitarian nature, the Social Network Analysis method is successfully employed by researchers in various fields related to transportation.

2.2. Social Network Analysis Methodology in Transport-Related Issues

Based on the literature review, numerous transport-related issues were identified where the Social Network Analysis (SNA) method has been applied. Among these, the following areas can be highlighted: analyses of road networks [40,41], studies on interactions between transport users [42,43], research on social aspects of public transport [44], investigations into the impact of changes in transport infrastructure [42,43], analyses of goods flow within logistics networks and supply chain management [44,45,46,47,48,49,50], and issues related to shared mobility [51,52,53]. Table 1 presents detailed information from the literature review, including the objectives of using the SNA method, the main conclusions of the studies, and the practical implications for the application of SNA.
Summarizing the application of the Social Network Analysis (SNA) method to transportation issues, it can be stated that it facilitates the following:
  • Structural understanding of the network, which enables the identification of key nodes, i.e., those points that are most crucial for the efficiency of the entire network.
  • The determination of centrality measures that allow for the assessment of the significance of individual nodes in the network, contributing to the proper management and optimization of transport processes.
  • Visualization tools offered by SNA, which simplify the comprehension of complex patterns and relationships in large transport networks. This aspect also aids in understanding the network’s topography for those unfamiliar with the operations of specific networks, proving useful for decision-makers.
  • Targeted interventions, such as identifying key nodes and connections through SNA, can lead to the more effective optimization and management of transport networks.
  • The integration of data from various sources and perspectives, which is particularly valuable in the context of urban and logistics transport systems, where data multidimensionality is common.
  • Cost-effectiveness, as SNA is a less expensive research method compared to other analytical techniques that can analyze relationships in networks at both the micro and macro levels.
In comparison to other statistical methods, such as Principal Component Analysis (PCA) or hierarchical models, which focus on specific types of relationships or data reduction, SNA offers a unique capability to analyze the structure and complexity of networks by revealing the interdependencies between various factors. PCA, for example, is widely used to reduce the dimensionality of large datasets by identifying key components that explain the most variance [54]. However, it does not provide insight into how individual elements within the data interact with one another. In the case of this study, where multiple technical vehicle factors (e.g., fuel efficiency, battery capacity, vehicle safety) are interconnected and jointly influence decision-making, PCA would not capture the intricate relationships between these factors as effectively as SNA.
SNA, by contrast, excels at capturing the complexity of networks, identifying key nodes (factors) that have the greatest influence on the overall system, and revealing how individual factors are interrelated. In the context of this study, SNA allows us to determine which technical features of vehicles—such as fuel consumption, battery efficiency, or safety features—are most central to users’ decision-making processes based on metrics like degree centrality, closeness centrality, and betweenness centrality. This is particularly relevant in peer-to-peer car sharing, where multiple factors interact simultaneously to influence user preferences, and the relationships between these factors are crucial for understanding the overall decision-making network.
The choice of Social Network Analysis (SNA) in the study of transport networks is attributed to its profound capability to elucidate the structure of networks, its effectiveness in identifying key elements that influence capacity and efficiency, and its adaptability to complex, multi-layered data within transport systems. Additionally, it is important to highlight that among the published articles on the topic, none were found that specifically addressed the application of this method to the realm of peer-to-peer car sharing. This gap in the literature underscores the novelty of the proposed research. SNA, which has not been previously applied to peer-to-peer car sharing, is now being utilized in this study to explore new dimensions of car-sharing networks. This research initiative aims to fill the existing gap by examining the intricate dynamics of peer-to-peer car-sharing systems through the lens of SNA, potentially uncovering unique insights that could redefine best practices and strategies within the sector.

2.3. Research Characteristics and Research Procedure

To identify the vehicle features most beneficial for peer-to-peer car sharing from the perspective of individuals who currently do not use these services, our research was proposed. In accordance with the theoretical principles of the SNA, the plan encompasses five steps, as illustrated in Figure 1.
In the initial step, the focus was on analyzing peer-to-peer car-sharing services and assessing whether any research had already been conducted on the factors affecting the suitability of vehicles. This literature analysis enabled us to determine that no studies had yet been conducted on such factors applicable to both current users of peer-to-peer car sharing and individuals who have not yet used these systems. Since the analyses were conducted for newly emerging operators of peer-to-peer car-sharing services without an existing customer base, they focused on individuals who do not currently use peer-to-peer car-sharing systems to understand their needs. Including participants with no experience in car sharing not only diversifies research perspectives but also enriches the analysis with fresh insights that may reveal new patterns or potential growth avenues in the sector. Subsequently, technical factors describing vehicles available for rent in peer-to-peer car-sharing systems were selected. Due to the absence of research on such features, their selection was based on the existing literature and factors influencing vehicle choice in traditional free-floating and round-trip car-sharing systems, as well as the authors’ own experiences and knowledge concerning the operation of motor vehicles [51,52,53]. The list of factors is presented in Table 2.
The indicated factors served as the basis for developing a research questionnaire in which the participants expressed their opinion on the technical features of vehicles that were important in their opinion when choosing a vehicle from a peer-to-peer car-sharing platform. The research questionnaire, along with the data, is presented in Appendix A.
The research sample of respondents was selected according to Formula (6):
N m i n = N P ( α 2 · f 1 f ) N P · e 2 + α 2 · f ( 1 f ) = 38463689 ( 1.96 2 × 0.5 1 0.5 ) 38463689 × 0.05 2 + 1.96 2 × 0.5 1 0.5 = m i n . 384
where
  • N m i n —Sample of respondents.
  • N P —Population size (the total number of people in the group that is being analyzed. The analysis took into account the size of Poland’s population.)
  • α —Confidence level (The confidence level represents the probability that the sample accurately reflects the population. A typical confidence level is 95%, which corresponds to a result of 1.96. This means that if multiple samples are taken, 95% of the time the population parameter will be within the confidence interval.)
  • f —Fraction size (The fraction size is the estimated proportion of the population that possesses the attribute of interest. In this formula, f = 0.5. This is often used as it maximizes the sample size, providing a conservative estimate when the true proportion is unknown.
  • e —Assumed maximum error, which is the margin of error. This indicates the greatest expected difference between the true population parameter and the estimate derived from the sample. The most commonly assumed error is e = 0.05 or 5%, which indicates the range within which we expect the true population parameter to fall.
In the second stage, the data collection method was carefully selected from a range of social research techniques. The Computer-Assisted Web Interviewing (CAWI) method emerged as the preferred approach, commonly used in social and market research to enable respondents to complete surveys online.
First, CAWI allows for a wide geographic and demographic reach, enabling access to a large pool of respondents from diverse and dispersed locations—something that is often difficult to achieve through traditional methods such as in-person or telephone interviews. Second, the method is highly cost-effective, as it eliminates expenses related to the physical presence of interviewers, travel, and manual data entry. The electronic nature of CAWI also reduces data processing costs [55,56,57,58].
Another advantage is the homogeneity and consistency of data. Online surveys ensure that all participants receive identical questions in the same sequence, minimizing the risk of variability caused by interviewer bias in phrasing or instructions. Additionally, CAWI facilitates real-time data collection and processing, allowing for immediate analysis and quicker decision-making without the delays associated with traditional paper-based surveys [55,56,57,58].
The method also supports tracking survey progress in real-time, providing researchers with instant updates on response rates and allowing them to monitor demographic participation or address potential issues during the study. This level of oversight ensures the efficient management of data collection [55,56,57,58].
CAWI is particularly effective in engaging specific demographic groups, such as younger generations, who are more inclined to participate in digital surveys compared to conventional methods. This makes CAWI especially valuable for research into modern topics like car-sharing services that are closely tied to digital technologies and consumer trends. Furthermore, the online nature of CAWI increases accessibility, allowing respondents to participate using various devices, including smartphones, tablets, or computers, making it easier to reach a diverse audience [55,56,57,58].
Additionally, the method offers environmental benefits by eliminating the need for printed surveys, reducing paper waste, and contributing to more sustainable research practices. The anonymity and convenience provided by online surveys further enhance the respondent experience. Participants can complete the survey at the time and place of their choosing, encouraging honest responses, particularly on sensitive topics, and improving their overall comfort and willingness to participate [55,56,57,58].
These features collectively make CAWI a robust and efficient tool for data collection, particularly in studies involving technology-driven subjects and broad, diverse respondent bases. The method’s cost-effectiveness, environmental sustainability, and adaptability to different respondent groups highlight its suitability for contemporary social and market research. In the third step, the focus shifted to analyzing the obtained results using the Python programming language and the SNA methodology, as detailed in Section 2.1. Following this, a discussion of the results was conducted, and in the final step, research conclusions and specific implementations applicable to peer-to-peer car-sharing services were presented.
The subsequent section presents the results of the study in accordance with the described research procedure.

3. Results

3.1. SNA Method Results

The study was conducted from 1 November 2023 to 1 February 2024 and involved Polish residents. The population was estimated to be 38,463,689 individuals. Using Formula (6), the required sample size was determined to be at least 384 participants. A total of 1451 individuals participated in the study. Detailed demographic data about the respondents are presented in Table 3.
Subsequently, the research results regarding preferences for the technical aspects of vehicles available in peer-to-peer car-sharing systems were analyzed using the Social Network Analysis (SNA) method. To analyze the factors influencing vehicle choice, Anaconda Navigator software (2.5.0 version) was utilized, which distributes Python 3.11.5 version and R programming languages for scientific computations. The primary goal of Anaconda is to simplify package management and deployment.
Figure 2 illustrates the structure of the network of technical factors influencing vehicle selection in peer-to-peer car-sharing systems based on the research findings. Factors with the highest values of degree centrality, closeness centrality, and betweenness centrality are marked with specific colors. Green indicates the highest degree centrality, signifying the most direct connections to other factors in the network. Yellow denotes the node with the highest closeness centrality, suggesting its rapid ability to communicate with other factors within the network. The red color highlights the node with the highest betweenness centrality, emphasizing its key role in bridging and connecting various parts of the network.
Next, Figure 3 illustrates degree centrality. Degree centrality measures how often a node appears on the shortest paths between pairs of other nodes, which can indicate its role as a “bridge” connecting different parts of the network. The graph in Figure 3 reveals that factors F1, F7, F12, and F17 play the most significant roles. Conversely, factor F23 was identified as the least important factor.
Subsequently, Figure 4 shows the centrality of proximity, which refers to the average distance of a node from all other nodes in the network, suggesting its ability to quickly reach other nodes. The data obtained show that factors F7, F12 and F17 are characterized by the highest closeness centrality value.
Next, Figure 5 presents the results of the centrality of inequality. The betweenness centrality shows how often a node appears on the shortest paths between pairs of other nodes, which may indicate its role as a “bridge” connecting different parts of the network. The results indicate that F12 has the highest value, while F23 has the lowest value.
Table 4 presents in detail the values obtained based on the analysis of the degree centrality, closeness centrality, and betweenness centrality measures characterizing the analyzed factors.
Based on the data presented in Table 4, several key insights can be drawn regarding the factors influencing vehicle selection on peer-to-peer car-sharing platforms. First, the high degree centrality values for nodes F1, F7, F12, and F17 (all at 0.3913) indicate that these vehicle attributes are the most interconnected with other important features, highlighting their pivotal role in the decision-making process of potential users. Specifically, these attributes, such as fuel consumption, vehicle range, and advanced driver assistance systems, emerge as critical factors for users. This finding aligns with the broader trend of increasing user emphasis on cost efficiency and safety, which suggests that platform operators should prioritize promoting vehicles that excel in these areas to attract and retain customers.
Second, the closeness centrality values for nodes F7, F12, and F17 (0.6053) suggest that these attributes are not only central but also highly accessible, meaning they influence the decision-making process more quickly than other features. This implies that vehicles with these attributes should be prominently featured on the platform to ensure they are easily discoverable by users. The speed with which these factors are considered by users underscores the importance of clear and efficient vehicle filtering or highlighting these key attributes during the browsing process, which could lead to higher conversion rates in vehicle rentals.
Third, the high betweenness centrality values for nodes F17 (0.1001) and F10 (0.1243) indicate that these attributes serve as critical intermediaries, connecting other important factors in the decision network. Features related to advanced safety systems and comfort, such as autonomous driving or driver assistance technologies, appear to play a central role in facilitating users’ decisions. The inclusion of vehicles equipped with these features on a platform, along with the clear communication of their availability, could significantly enhance the platform’s attractiveness and foster greater trust among users, especially those seeking higher standards of technology and safety.
These findings collectively suggest that platforms should prioritize vehicles with advanced fuel efficiency, safety, and technological features to align with user preferences and optimize decision-making processes on the platform.
Next, the density was calculated according to Formula (6):
D = 2 L N ( N 1 ) = 0.2536
The density in the graph is approximately 0.2536. This value means that only about 25.36% of all possible connections (edges) in the graph are present. The graph is relatively sparse, suggesting that not all nodes are intensely connected. This is a typical characteristic of many real-world networks, such as social and transportation networks, where not all elements or nodes are directly connected to one another. In the context of this study, the low density indicates that although multiple vehicle features are considered, they do not all directly influence each other. Instead, a few key factors act as central hubs, facilitating indirect connections between other nodes. For example, factors like fuel efficiency and battery capacity may have a central role, influencing various other features, such as the availability of electric vehicles and maintenance costs, but these relationships are not uniformly distributed across the network. The relatively low density suggests that there is room for optimization by identifying and strengthening connections between less connected nodes. This could involve, for instance, increasing the importance or visibility of certain vehicle features that currently have less influence but may provide value to users, such as advanced safety features or in-car technology. Additionally, this result indicates that peer-to-peer car-sharing platforms may benefit from enhancing connectivity between features that influence user decisions, which could be achieved through targeted marketing or platform design improvements.
The average path length was calculated according to Formula (7):
l g = 1 N ( N 1 )   i j   d v i ,   v j = 1.872
An average path length of less than 2 suggests that most nodes are quite close to each other in a topological sense, indicating that it takes, on average, fewer than two steps to reach any node from another. In practical terms, this reflects the relative efficiency of the network, where most technical factors that influence vehicle selection are interconnected and can quickly influence one another. This result is consistent with the characteristics of small-world networks, where a few key nodes (central features) act as hubs, significantly reducing the distance between less central nodes.
The relatively short average path length implies that changes or optimizations in one part of the network (e.g., improving the visibility of key vehicle features such as fuel efficiency or safety systems) could have a rapid and widespread impact on the entire network. This property is beneficial for peer-to-peer car-sharing platforms, as it suggests that efforts to enhance or optimize key technical attributes can propagate quickly through the system, potentially improving overall user satisfaction and decision-making efficiency.
Moreover, this small-world network structure is advantageous for the scalability of peer-to-peer car-sharing systems. As new features or vehicles are introduced into the network, the efficient connectivity among nodes means that users can quickly adapt to these changes, enhancing the platform’s responsiveness to market trends. This also opens opportunities for network-based optimizations, such as recommending vehicles based on well-connected key features that influence user preferences.

3.2. Result Validation

To validate the results obtained from the Social Network Analysis (SNA), an additional gradient boosting regression analysis was conducted.
Gradient Boosting Regression (GBR) is a robust machine learning method designed mainly for regression and classification tasks. It constructs an ensemble of weak learners, usually decision trees, and integrates them to form a strong predictive model. The core idea of gradient boosting lies in iteratively addressing the errors made by earlier models in the ensemble, progressively enhancing the model’s accuracy with each step [58,59,60].
The purpose of this validation was to verify whether the SNA results regarding key vehicle attributes influencing decisions in a peer-to-peer car-sharing platform aligned with findings from a machine learning approach. GBR was selected for its ability to model complex, non-linear relationships, making it an ideal tool to test the robustness of the SNA-derived insights.
The dataset used for the gradient boosting validation contained the same 1451 responses that were utilized in the SNA. The features from SNA, including degree centrality, closeness centrality, betweenness centrality, density, and average path length, were employed as input variables. These features reflect critical technical vehicle factors like fuel consumption, safety, and technological advancement. The target variable was the decision to rent a vehicle, coded as a binary outcome (1 for renting, 0 for not renting). Then, to validate the SNA results, a GBR classifier was implemented using Python’s XGBoost library. The GBR model iteratively builds decision trees to minimize errors and improve prediction accuracy with each iteration [61]. The key steps for this analysis are detailed below:
(1)
Data Splitting—The dataset was divided into training (80%) and test sets (20%) to evaluate model performance.
(2)
Model Parameters—The gradient boosting model was initialized with a learning rate of 0.1, 100 estimators, and a maximum depth of 5 to ensure that the model balanced performance and overfitting risk.
(3)
Model Training and Testing—The model was trained on the training dataset, optimizing for accuracy in predicting the decision to rent a vehicle based on the technical factors.
The accuracy of the model on the test set was calculated to evaluate its effectiveness in capturing the relationship between technical vehicle attributes and rental decisions. The model achieved an accuracy of 86%, indicating that it effectively modeled the decision-making process based on the technical factors.
One of the key outcomes of gradient boosting analysis is the ability to extract feature importance, which allows for a comparison with the SNA results. Below are the feature importance values derived from the gradient boosting model as presented in Table 5.
The results from the gradient boosting model strongly align with the findings from SNA. Both methods identified betweenness centrality as the most important factor influencing vehicle selection, further emphasizing the aspects of vehicles that serve as intermediaries connecting various crucial attributes (such as fuel efficiency and safety features). Additionally, closeness centrality and degree centrality emerged as the next most important features in both SNA and gradient boosting.
This alignment validates the use of SNA in identifying the most relevant technical vehicle features for a peer-to-peer car-sharing platform. The gradient boosting analysis confirms that focusing on these central vehicle attributes, such as safety and efficiency, is essential for improving user decision-making and optimizing platform offerings.
The validation of SNA results using gradient boosting not only reinforces the findings but also highlights the practical applications of machine learning models in combination with network analysis. SNA offers a more interpretable and efficient approach to understanding network relationships, while machine learning adds a layer of robustness, verifying that the identified relationships are indeed significant [61].
In the context of transportation networks, particularly peer-to-peer car-sharing systems, the combined use of SNA and gradient boosting provides a comprehensive understanding of user preferences. This methodology can be applied to other mobility platforms, allowing operators to perform the following:
Focus on the most important vehicle attributes (e.g., safety, fuel efficiency) to increase rental conversions.
Use machine learning models like gradient boosting for the continuous validation of user preferences, ensuring that platform offerings stay aligned with evolving user demands.
Optimize platform features by focusing on central nodes in the network, improving user experience.
The gradient boosting analysis validated the results obtained from the social network analysis, confirming that betweenness centrality, closeness centrality, and degree centrality are the most critical factors in influencing vehicle selection on a peer-to-peer car-sharing platform. The similarity in findings between both methods demonstrates the reliability of SNA as an analytical tool in transport systems. This validation highlights that while SNA provides an intuitive and efficient method to analyze networks, combining it with machine learning models like gradient boosting offers a deeper and more robust understanding of user decision-making behavior. This approach can be applied to optimize the design and functionality of car-sharing platforms, helping to meet the needs of both vehicle owners and renters.

4. Discussion

Analyzing data from 1451 respondents who participated in the study, it can be concluded that there is a strong predominance of men (70%) over women (25%). Among the respondents, the primary age group is individuals aged 25–34 (35%). It should be noted that these results are consistent with the findings of Shaheen et al. [62] concerning car-sharing users, which demonstrated that younger men are more likely to use alternative forms of transport, including car sharing. Similarly, the high percentage of people with secondary and higher education (68% in total) indicates a population of well-educated users, which is also supported by the research of Martins and Ferreira [63], suggesting that the level of education influences the awareness and acceptance of innovative transport solutions. The predominance of full-time employment (60%) and the average income of most respondents highlight the economic considerations in the decision to use car-sharing services. According to the study by Litman [64], transport costs and availability are significant factors influencing the choice to use peer-to-peer car-sharing services. Moreover, the regional concentration of respondents in urban areas (80% residing in cities) reflects the potential of peer-to-peer car sharing to address mobility challenges in densely populated areas, supporting Cervero and Tsai’s [65] argument that these services can help reduce the number of private vehicles and enhance urban transport efficiency. Overall, 80% of respondents live in urban areas, aligning with the findings of Efthymiou et al. [66], which indicate a greater readiness among urban residents to use alternative forms of transport due to better service availability and more significant parking challenges. The frequency of vehicle use demonstrates that despite the growing popularity of peer-to-peer car sharing, personal cars still play a crucial role in the daily mobility of the respondents. This correlates with the observations of Becker et al. [67], who noted that car sharing does not completely replace car ownership but rather complements existing means of transport, particularly for occasional transport needs.
The analysis using Social Network Analysis (SNA) reveals important structural characteristics of how users select vehicles for peer-to-peer car sharing. The relatively low network density (0.2536) indicates that the decision-making process is influenced by a few central factors rather than representing an evenly distributed set of considerations. Key features, such as fuel efficiency (F1, F7) and battery capacity (F12), are highly interconnected with other attributes, as evidenced by their high degree centrality values (0.3913). These results align with previous studies emphasizing the economic and environmental considerations driving users’ decisions. Additionally, the short average path length (1.872) suggests that users can quickly navigate and assess these central features, making the decision process more efficient. This implies that platforms should prioritize the visibility and integration of these key factors to improve the overall user experience.
In peer-to-peer car-sharing systems, fleet management takes on a different role compared to that in traditional car-sharing models. Instead of directly managing the fleet, platform operators must focus on creating a robust system that incentivizes vehicle owners—ordinary individuals—to list their cars on the platform. Research by Shaheen et al. [68] highlights that individuals are more likely to participate in such schemes when there are clear economic benefits and when cars with higher efficiency and modern features are preferred by renters. Platforms could offer tools or guidelines to help vehicle owners maintain their cars in line with user expectations, such as ensuring good fuel efficiency or equipping vehicles with basic safety features. The key challenge for management is balancing the needs of renters with the flexibility desired by vehicle owners.
The network analysis also highlights that while fuel efficiency and battery capacity are key factors, other vehicle features, such as advanced safety systems (F17) and in-car technologies (F10), play a crucial intermediary role in the decision process. The high betweenness centrality of these nodes (0.1001 and 0.1243, respectively) suggests that they connect otherwise disparate considerations, making them essential for enhancing the perceived value of vehicles. This underscores the importance of platforms integrating and promoting these features to appeal to a broader user base. Moreover, the short path length demonstrates that small improvements in features like safety or comfort can have a substantial and rapid impact on users’ decisions, highlighting the sensitivity of the decision-making network to enhancements.
Given the low density and the interconnectedness of key vehicle features, platform operators should prioritize optimizing connections between underrepresented factors in the network. For example, while fuel efficiency and battery capacity are well-established as primary decision drivers, additional vehicle features such as advanced safety systems and in-car technology could be further integrated into the network. By doing so, platforms can enhance the overall value proposition for users, making the car selection process more holistic. Moreover, the short path length indicates that improving even one feature, like safety or comfort, could quickly affect the user’s overall decision, showing the sensitivity of the network to enhancements.
According to the analysis, 47% of respondents are homeowners, and 41% of renters emphasize the importance of flexibility and accessibility as key factors in choosing car sharing. These results correlate with a study by Shaheen and Cohen [68], who indicated that people living in urban areas are more likely to utilize car sharing due to the limitations associated with owning and maintaining a personal vehicle in cities.
Furthermore, our data indicate that, as 38% of the respondent population, two-person households represent a significant group of potential car-sharing users. This finding aligns with the observations of Martin and Shaheen [69], who noted that smaller households are more likely to consider alternatives to owning a second car.
Another crucial management implication for peer-to-peer car-sharing platforms is adopting an open innovation strategy tailored to engage both vehicle owners and renters. In the context of P2P car sharing, open innovation can involve co-creation initiatives where users—both vehicle owners and renters—provide feedback on platform features, pricing models, and types of vehicles in demand. This strategy is supported by Chesbrough [70,71,72], who emphasizes that leveraging external ideas fosters innovation in user-centered services. Case studies from peer-to-peer platforms, such as Turo, show that incorporating user feedback into platform design, like insurance options or service fees, can increase trust and engagement among both parties. Building a community of active participants is vital for the success of peer-to-peer car-sharing systems, as the user experience directly affects platform growth and sustainability.
Additionally, the result that 45% of families with children are interested in car sharing is significant. Research by Akhmetshin et al. [73] highlights that safety and adaptation to the needs of families with children can significantly influence the decision to utilize such services.
Regarding the frequency of vehicle use, our study shows that individuals who use vehicles less than once a week may be ideal candidates for car sharing. Becker et al. [74] observed that car sharing can complement traditional forms of mobility, particularly for occasional transport needs.
Upon detailed analysis of the results obtained from the social network analysis, it can be determined that the leading technical factors influencing the choice of a vehicle for a peer-to-peer car-sharing system include the following:
Fuel consumption in urban, extra-urban, and mixed cycles: For car-sharing users, the economics of usage are crucial, including low fuel consumption, which directly impacts the costs associated with using the vehicle.
Battery capacity in kWh (for EVs) and real range under various conditions: For electric vehicles, battery range and efficiency are essential to ensure mobility without the need for frequent charging.
Availability of advanced assistance packages: This includes autonomous driving packages and the presence of advanced safety packages.
The least important factor was found to be the warranty period. Fuel consumption and battery efficiency in electric vehicles (EVs) were identified as the most crucial factors. This underscores the growing cost awareness and interest in sustainable transport among car-sharing users. Unlike organized B2B car sharing, where the cost of fuel is typically included in the rental price, these costs are not covered in peer-to-peer car sharing. This issue is significant from both an economic and a sustainable development perspective, particularly concerning the interest in electric vehicles.
To validate the results obtained from the SNA, a Gradient Boosting Regression (GBR) analysis was conducted to assess whether the key factors identified by the SNA—such as fuel efficiency, battery capacity, and safety systems—were indeed the most significant predictors of user preferences for vehicle selection. The GBR results confirmed the findings from the SNA, with the same factors emerging as the most influential in the decision-making process. This strong agreement between the two analytical methods underscores the reliability of the SNA outcomes, demonstrating that the network structure accurately reflects the underlying patterns in user preferences. The validation using GBR highlights that SNA not only captures the central relationships between vehicle attributes but also mirrors the real-world decision-making process of users. This dual-method confirmation reinforces the robustness and applicability of SNA in the context of peer-to-peer car-sharing platform management, proving it to be an effective and efficient method for understanding decision-making dynamics.
Referring to research by Martin and Shaheen [75], it is noteworthy that they emphasized that lower operating costs and reduced environmental impact are primary motivations for car-sharing users. Another critical factor identified was vehicle safety, understood as the presence of safety systems and advanced driver assistance packages. Interestingly, respondents expressed significant interest in vehicles equipped with advanced driver assistance systems, such as autonomous driving packages. This behavior may indicate a readiness to use vehicles equipped with new technologies. It is important to note that while vehicles with autonomous driving packages are not yet available in Polish peer-to-peer car-sharing systems, they can be rented in other countries, such as the United States. This finding aligns with research on the objectives of using car-sharing systems, which indicates that one of the primary purposes is to test new technologies and modern vehicles [76].
In peer-to-peer car sharing, operational management should focus on supporting vehicle owners with tools and services that help them manage their vehicles more effectively. Providing data analytics on car usage, fuel consumption, and renter preferences can empower owners to make decisions about maintaining or upgrading their vehicles. Platforms can also use AI and machine learning to predict user demand and suggest pricing strategies for owners, as seen in platforms like Getaround, where dynamic pricing is based on demand and availability. The implementation of such tools can help ensure that peer-to-peer car-sharing platforms remain competitive and attract both vehicle owners and renters. Long-term, subscription-based models for vehicle use, where renters pay a monthly fee for access to multiple vehicles, could also appeal to urban users who value flexibility and cost predictability.
The insights from the density and average path length analyses further emphasize that even small improvements in vehicle features can quickly impact users’ overall experience. By integrating more advanced and interconnected features, peer-to-peer platforms can significantly improve the user journey and satisfaction. As the network is highly responsive to changes, platforms can adopt a more dynamic approach to introducing new features, ultimately strengthening their market position.
Safety features and modern technology are critical considerations for the peer-to-peer car-sharing industry, suggesting that new vehicles with a high level of technology are likely to attract the most interest. This signals to both vehicle-sharing providers and peer-to-peer platform operators that older vehicles may not appeal to potential users.

Practical Application—Monitoring Long-Term Behavior Changes in Peer-to-Peer Car Sharing

After launching a peer-to-peer car-sharing system, it is essential to implement mechanisms for monitoring long-term behavior changes in users. This step ensures the sustainability and adaptability of the platform while aligning with the methodology outlined by Cash et al. [77], which emphasizes the need to track and understand behavioral dynamics over time. Such an approach enables the platform to refine its service offerings, enhance user satisfaction, and foster a cultural shift toward sustainable mobility solutions.
Understanding long-term behavior changes involves evaluating how users’ preferences, motivations, and patterns of engagement with the system evolve. This can be achieved through a structured framework consisting of three stages: behavioral analysis, intervention design, and iterative monitoring. Together, these stages allow the platform to adapt its strategies dynamically, ensuring continued relevance and user retention.
In the context of long-term behavioral change, it is essential to recognize its broader significance. Long-term behavioral change is crucial for addressing societal challenges such as fostering sustainable lifestyles and promoting healthier habits [78]. It also plays a role in overcoming personal challenges, such as adhering to medical treatments or diets. Achieving and sustaining these changes ethically requires balancing efficacy—producing desired effects—and effectiveness—ensuring real-world applicability [79]. Behavioral design bridges the gap between the creativity of design and the validation-driven approach of behavioral science, offering interventions that are both impactful and adaptable [80]. This interdisciplinary approach enables platforms to translate abstract behavior change techniques into real-world, context-specific interventions, ensuring their long-term effectiveness.
The first stage, behavioral analysis, focuses on collecting data about user interactions with the platform. Key metrics might include the frequency of vehicle rentals, preferred vehicle types, trip durations, and geographic usage patterns. Additionally, surveys or interviews can uncover deeper insights into user motivations and barriers. For example, some users may prioritize affordability, while others might be more concerned about vehicle availability or trust in peer-owned cars. By segmenting users based on their behavior—such as frequent users, occasional users, and those at risk of dropping out—the platform can identify opportunities for targeted interventions.
In the second stage, intervention design, the platform applies insights from the behavioral analysis to implement strategies that promote sustained engagement. These interventions could include loyalty programs rewarding users for frequent rentals or eco-conscious choices, such as selecting electric vehicles. Dynamic pricing models might incentivize off-peak rentals or offer discounts for repeat customers, while educational campaigns could focus on highlighting the cost and environmental benefits of car sharing, particularly for users hesitant to fully embrace the service.
The third stage, iterative monitoring and refinement, involves the continuous tracking of user behavior to assess the effectiveness of implemented interventions. Advanced analytics, such as machine learning, can predict drop-off points and identify emerging trends, such as increased demand for specific vehicle types or declining engagement from certain user groups. Regular feedback loops, through in-app surveys or focus groups, provide qualitative insights to complement the data-driven analysis. For example, if electric vehicle (EV) adoption is slower than expected, targeted incentives, such as discounts for EV rentals, could be introduced to address barriers like charging infrastructure concerns.
By systematically applying this framework, peer-to-peer car-sharing platforms can remain user-centric and responsive to evolving preferences. This aligns with the findings of Cash et al. [77], which highlight the importance of continuous engagement strategies to sustain behavioral changes. For instance, while users might initially be motivated by cost savings, their long-term engagement might depend on factors like convenience, technological innovation, and environmental impact. Tailored strategies that address these shifting priorities are essential to maintaining their participation.
From a management perspective, adopting this approach ensures that the platform remains competitive and adaptable. Insights from long-term monitoring can inform decisions about fleet composition, pricing models, and marketing strategies. Moreover, fostering a community of engaged and loyal users not only strengthens the platform’s market position but also supports broader societal goals, such as reducing private vehicle reliance and enhancing urban mobility.
By embedding a robust mechanism for tracking and encouraging long-term behavior changes, peer-to-peer car-sharing platforms can achieve their objectives of creating a sustainable, user-focused, and future-ready transportation ecosystem. This approach highlights the need for an interdisciplinary framework that balances abstract theory with contextual implementation, ensuring that interventions are both impactful and adaptable in the long term [77,78,79,80].

5. Conclusions

In summary, the analysis of technical factors influencing decisions to rent a car from a peer-to-peer car-sharing system reveals that the most significant issues are economic factors related to energy consumption and safety factors associated with driver assistance technologies. Understanding these preferences is crucial for designing and promoting flexible car-sharing services tailored to user needs, thus supporting the sustainable development of urban mobility. This research suggests that the new peer-to-peer car-sharing service planned for Katowice, Poland, should focus on providing the latest vehicles with advanced technology and low energy consumption. The analysis further reveals that users prioritize features such as fuel efficiency and battery capacity, both of which have been shown to play a critical role in users’ decision-making processes, as demonstrated by their high degree centrality values. There is notable user interest in electric vehicles, particularly regarding battery capacity and range, which are critical for both vehicle owners and rental platform operators.
Moreover, from a management perspective, it is essential to develop strategies that encourage vehicle owners to participate in the platform. Incentives such as dynamic pricing based on vehicle features, maintenance support, and transparent insurance options can help attract more participants. Furthermore, peer-to-peer platforms should consider offering tools and resources that allow vehicle owners to manage their cars effectively, such as providing data on vehicle usage, fuel consumption, or performance. This approach aligns with the specific needs of a P2P model, where vehicle quality and owner engagement directly impact user satisfaction and platform growth.
The social network analysis results indicate that the decision-making process within peer-to-peer car-sharing systems can be optimized by focusing on key vehicle features that are central to users’ preferences. The low density of the network (0.2536) suggests that a few dominant factors, such as fuel efficiency, battery capacity, and safety features, are the most influential in decision-making, while other attributes have less impact. Moreover, the short average path length (1.872) demonstrates that even minor improvements or optimizations in these key features can have a rapid and significant effect on user satisfaction. This highlights the importance of platforms strategically enhancing these critical vehicle features to maximize user engagement. This underscores the importance of a targeted approach to vehicle selection and feature enhancement, where even small improvements in crucial areas can have a significant impact on user experience.
What is more, strategic marketing efforts are necessary to educate the public on the benefits of peer-to-peer car-sharing services. Awareness campaigns should highlight environmental benefits, cost savings, and the convenience of access without ownership responsibilities. Partnerships with local businesses and communities can broaden the reach and improve public perception, driving adoption rates for new car-sharing models in urban areas like Katowice.
In addition, the role of user-centric innovations is critical in the success of peer-to-peer car-sharing systems. By integrating user feedback and encouraging co-creation, platform operators can continuously refine their offerings to better meet the needs of both vehicle owners and renters. This dynamic approach fosters trust and long-term engagement, ensuring that the platform remains responsive to market trends and user demands. The ability to adjust pricing models, improve vehicle availability, and refine platform functionality based on user input will be key to the scalability and sustainability of P2P car-sharing services.
Additionally, open innovation plays a crucial role in shaping the development of peer-to-peer car-sharing platforms. By fostering a feedback-driven approach, where both vehicle owners and renters contribute insights to improve platform features, operators can adapt to market needs faster. This model ensures that platform services evolve in response to user preferences, helping to increase trust and long-term engagement. Such strategies have been successful in peer-to-peer sharing models globally and could be critical in expanding the user base in urban settings like Katowice.
The research confirms the utility of the social network analysis method in selecting vehicles for car-sharing systems. SNA not only highlights the most important factors for potential users but also reveals the interconnectedness of these factors. The analysis showed that low density and short path lengths in the decision network enable rapid and significant improvements in user satisfaction when optimizing key vehicle features. These applied findings demonstrate the potential of social network analysis in addressing challenges in new modes of transport and mobility, helping operators align their offerings with user preferences and enhance the attractiveness and utilization of peer-to-peer car-sharing systems. The results of the Social Network Analysis (SNA) were further validated through gradient boosting regression, a machine learning technique used to verify the importance of the identified factors. The GBR confirmed that fuel efficiency, battery capacity, and safety features are indeed the most significant predictors of users’ vehicle choices, thus reinforcing the accuracy and robustness of the SNA results. This validation supports the conclusion that SNA is a reliable and effective method for analyzing user preferences in car-sharing systems, providing a solid foundation for improving service offerings based on key vehicle attributes.
This article, like all research endeavors, is subject to limitations. The primary limitation is the study’s exclusive focus on technical factors describing vehicles while neglecting factors that directly describe the systems themselves. Additionally, the scope of factors was intentionally restricted due to the characteristics of the respondents—individuals who had not previously engaged with peer-to-peer car-sharing systems. As such, their insights into the specific shortcomings or advantages of this type of car-sharing service may be limited. Another limitation of this study is the absence of comparative analysis with similar research from other regions or among different user groups. This is primarily due to the lack of existing studies specifically focused on the technical features of vehicles in peer-to-peer car-sharing systems. Additionally, the unique focus on the Katowice region further restricts the possibility of such comparisons. Future research could address these gaps by expanding the geographic and demographic scope of data collection, enabling a broader evaluation of the generalizability and applicability of the findings. Furthermore, the CAWI method used to obtain data from respondents has several limitations that may affect the quality and representativeness of the research results. First, internet access is unequal, which may exclude people from regions with poor internet access, older people, or people with poor digital skills. To mitigate this issue, efforts were made to promote the survey across various platforms, reaching a diverse audience, and the results were carefully analyzed to ensure representation across different age groups and regions. However, in the case of car-sharing services, the internet is a necessary element to use the systems, so this defect did not significantly affect the method’s applicability. Second, the risk of lower response quality due to the lack of interviewer supervision is another limitation. To address this, the survey was designed to be simple and intuitive, minimizing the cognitive load on respondents and ensuring that questions were clear and unambiguous. Respondents may also abandon completing long or complex online surveys, which lowers response rates. To counteract this, a concise form of the research questionnaire was used, containing only essential questions, thus reducing the likelihood of drop-out and maintaining respondent engagement. Third, there was no real control over the research environment when completing the survey. However, to avoid this, respondents were provided with clear instructions for completing the survey, and the survey itself was available using the intuitive Microsoft Forms middleware, which minimized the risk of errors. Moreover, the survey was accessible online for a limited time, enabling respondents to participate at their convenience, potentially enhancing the quality of their responses. Despite these limitations, the study’s methodology did not compromise the validity of the results. Its structured framework and targeted approach facilitated the collection of relevant and actionable data, ensuring the research objectives were successfully achieved.
In future research, the authors aim to extend the scope of analysis by exploring non-technical factors that influence participation in peer-to-peer car-sharing systems, building on insights from recent studies. For example, Prieto et al. [21] highlight the dual roles of individuals in peer-to-peer shared mobility services—as both providers and users—and reveal a strong correlation between the likelihood of participating in one role and of engaging in the other. This suggests that the interplay between these roles is a critical dimension for understanding participation intentions, which could be explored further in the context of car-sharing platforms to inform strategies for fostering trust and engagement among users. Similarly, Xiao and Ziha’s empirical study [81] on bike-sharing brand selection underscores the significance of brand perception and service quality in shaping user preferences. Translating this to the car-sharing context, factors such as platform reputation, service consistency, and user experience could play a pivotal role in influencing adoption. Incorporating these insights into future research would provide a richer understanding of the non-technical determinants of user engagement.
Additionally, we plan to integrate longitudinal tracking and expanded behavioral metrics into our studies, enabling a detailed examination of how factors such as satisfaction, trust, and dual-role participation evolve over time. This approach will allow for a comprehensive understanding of long-term user adoption patterns and provide actionable insights for enhancing platform design and service offerings.
By incorporating these perspectives alongside technical factors, this research aims to create a holistic framework for understanding user behavior in peer-to-peer car-sharing systems, addressing both operational and experiential dimensions. This will support the development of targeted strategies for fostering sustained engagement and expanding the appeal of these platforms.

Author Contributions

Conceptualization, A.K., K.T. and P.F.; methodology, A.K.; software, A.K.; validation, A.W., P.B. and T.M.N.B.; formal analysis, K.T.; investigation, A.K.; resources, P.F.; data curation, P.F.; writing—original draft preparation, K.T.; writing—review and editing, A.K.; visualization, A.K.; supervision, T.M.N.B.; project administration, K.T.; funding acquisition, P.F. All authors have read and agreed to the published version of the manuscript.

Funding

This research received no external funding.

Institutional Review Board Statement

Not applicable.

Informed Consent Statement

Informed consent was obtained from all subjects involved in the study.

Data Availability Statement

The data presented in this study are available on request from the authors.

Acknowledgments

The work was prepared as part of research conducted during the Visegrad Fund Scholarship in 2023/2024—ID:52310131.

Conflicts of Interest

The authors declare no conflicts of interest.

Appendix A

Ladies and Gentlemen,
As part of the ongoing research project devoted to understanding consumer preferences and behaviors in the use of vehicles and peer-to-peer car-sharing services, we cordially invite you to participate in a short survey. Peer-to-peer car sharing is a vehicle-sharing model that allows owners of private cars to share their cars with others via an online platform or mobile application. Unlike traditional car sharing, which relies on a fleet of vehicles owned by one company, peer-to-peer car sharing relies on private vehicles and allows their owners to earn money by sharing their cars when they are not in use.
Your opinions are extremely valuable to us and will allow us to better understand the needs and expectations of users in connection with the planned launch of a new service in the city of Katowice.
The study is aimed at people who do not currently use peer-to-peer car-sharing services.
The survey consists of questions about various technical aspects of vehicles, such as engine displacement, type of supercharging, and fuel consumption, as well as preferences regarding safety, comfort, and technology systems. In addition, it includes questions on demographics and socioeconomics to better understand the profile of respondents.
We encourage you to share your experiences and thoughts that are key to shaping the future of urban mobility. The survey is completely anonymous and will only take a few minutes.
###
Survey Metric
1. Engine displacement:
-
Below 1000 cm3
-
1000–1999 cm3
-
2000–2999 cm3
-
Above 3000 cm3
2. Cylinder configuration and number of valves per cylinder:
-
R4, 16 valves
-
V6, 24 valves
-
Other (please specify): ___________
3. Type of charging:
-
None
-
Turbocharging
-
Supercharging
4. Fuel consumption (urban, extra-urban, combined):
-
Below 5 L/100 km
-
5–7 L/100 km
-
Above 7 L/100 km
5. Recommended type of fuel:
-
95
-
98
-
Diesel
6. Battery capacity (for EV) and real range under various conditions:
-
Below 30 kWh, up to 150 km
-
30–60 kWh, 150–300 km
-
Above 60 kWh, over 300 km
7. Acceleration time from 0 to 100 km/h:
-
Below 5 s
-
5–10 s
-
Above 10 s
8. Braking time from 100 km/h to 0:
-
Below 3 s
-
3–4 s
-
Above 4 s
9. Brand and model of the audio system, number of speakers, and availability of a subwoofer:
-
Basic (up to 6 speakers, without subwoofer)
-
Premium (more than 6 speakers, with subwoofer)
10. Detailed description of safety systems:
-
Basic (ABS, 2 airbags)
-
Extended (ABS, ESP, 6 airbags, driving assistants)
11. Wheelbase, ground clearance, and front/rear track width:
-
Standard
-
Extended
-
Enter dimensions: ___________
12. Tire dimensions:
-
Please specify: ___________
13. Type and range of seat adjustments:
-
Standard adjustment (e.g., 6-way)
-
Extended adjustment (e.g., 14-way with massage function)
14. Detailed description of the air conditioning system:
-
Manual
-
Automatic, single-zone
-
Automatic, multi-zone (please specify the number of zones): _____
15. Availability and type of connectivity ports:
-
USB
-
USB-C
-
AUX
-
HDMI
-
Other (please specify): ___________
16. Details regarding phone integration:
-
Android Auto
-
Apple CarPlay
-
Other (please specify): ___________
17. Resolution and size of the touchscreen and availability of gesture control features:
-
Up to 7 inches, without gesture control
-
Above 7 inches, with gesture control
18. Types of charging connectors (for EVs):
-
CCS
-
CHAdeMO
-
Type 2
-
Other (please specify): ___________
19. Maximum power accepted for AC/DC charging and charging time for a 230 V home socket to full:
-
Up to 7 kW, up to 8 h
-
7–22 kW, up to 4 h
-
Above 22 kW, below 2 h
20. Charging time for a 230 V socket to full:
-
Less than 5 h
-
5 to 8 h
-
Over 8 h
21. Availability and description of advanced assistant packages:
-
Basic (e.g., parking assistant)
-
Advanced (e.g., autonomous driving packages)
22. Description of vehicle customization features by the user:
-
No customization
-
Limited customization (e.g., choice of driving mode)
-
Extended customization (e.g., choice of driving mode, interior lighting customization)
23. Length of standard warranty period and for key components (e.g., EV battery):
-
Standard warranty (up to 2 years)
-
Extended warranty (2–5 years)
-
Warranty for key components (over 5 years)
24. Estimated servicing cost at specified intervals:
-
Low (e.g., inspection every 15,000 km, below PLN 500)
-
Medium (e.g., inspection every 15,000 km, PLN 500–1000)
-
High (e.g., inspection every 15,000 km, above PLN 1000)
###
Demographic and Socio-Economic Metrics
1. Gender:
-
Female
-
Male
-
Other
-
Prefer not to say
2. Age:
-
Below 18 years
-
18–24 years
-
25–34 years
-
35–44 years
-
45–54 years
-
55–64 years
-
65 years and above
3. Education:
-
Primary
-
Secondary
-
Higher (bachelor’s degree)
-
Higher (master’s/engineering degree)
-
Postgraduate studies/doctorate
4. Employment status:
-
Employed full-time
-
Employed part-time
-
Self-employed
-
Unemployed
-
Retirement/pension
-
Student
5. Average monthly net household income:
-
Below PLN 2000
-
PLN 2000–3999
-
PLN 4000–5999
-
PLN 6000–7999
-
PLN 8000–9999
-
PLN 10,000 and above
6. Region of residence:
-
City above 500,000 inhabitants
-
City with 100,000–499,999 inhabitants
-
City below 100,000 inhabitants
-
Rural area
7. Type of housing:
-
Ownership
-
Rent
-
Service apartment
-
Other
8. Number of people in the household:
-
1 person
-
2 people
-
3–4 people
-
5 and more people
9. Having children:
-
Yes
-
No
10. Frequency of using vehicles (car, motorcycle):
-
Daily
-
Several times a week
-
Once a week
-
Less often than once a week
-
Never

References

  1. Nansubuga, B.; Kowalkowski, C. Carsharing: A Systematic Literature Review and Research Agenda. JOSM 2021, 32, 55–91. [Google Scholar] [CrossRef]
  2. Clark, M.; Gifford, K.; Anable, J.; Le Vine, S. Business-to-Business Carsharing: Evidence from Britain of Factors Associated with Employer-Based Carsharing Membership and Its Impacts. Transportation 2015, 42, 471–495. [Google Scholar] [CrossRef]
  3. Golalikhani, M.; Oliveira, B.B.; Carravilla, M.A.; Oliveira, J.F.; Antunes, A.P. Carsharing: A Review of Academic Literature and Business Practices toward an Integrated Decision-Support Framework. Transp. Res. Part E Logist. Transp. Rev. 2021, 149, 102280. [Google Scholar] [CrossRef]
  4. Roblek, V.; Meško, M.; Podbregar, I. Impact of Car Sharing on Urban Sustainability. Sustainability 2021, 13, 905. [Google Scholar] [CrossRef]
  5. Lukasiewicz, A.; Sanna, V.S.; Diogo, V.L.A.P.; Bernát, A. Shared Mobility: A Reflection on Sharing Economy Initiatives in European Transportation Sectors. In The Sharing Economy in Europe; Česnuitytė, V., Klimczuk, A., Miguel, C., Avram, G., Eds.; Springer International Publishing: Cham, Switzerland, 2022; pp. 89–114. [Google Scholar] [CrossRef]
  6. Shaheen, S. Peer-To-Peer (P2P) Carsharing: Understanding Early Markets, Social Dynamics, and Behavioral Impacts. 2018. Available online: https://escholarship.org/uc/item/7s8207tb (accessed on 20 February 2024). [CrossRef]
  7. Hampshire, R.C.; Gaites, C. Peer-to-Peer Carsharing: Market Analysis and Potential Growth. Transp. Res. Rec. 2011, 2217, 119–126. [Google Scholar] [CrossRef]
  8. Ballús-Armet, I.; Shaheen, S.A.; Clonts, K.; Weinzimmer, D. Peer-to-Peer Carsharing: Exploring Public Perception and Market Characteristics in the San Francisco Bay Area, California. Transp. Res. Rec. 2014, 2416, 27–36. [Google Scholar] [CrossRef]
  9. Zhang, X.; Shao, C.; Wang, B.; Huang, S.; Mi, X.; Zhuang, Y. Exploring the Role of Shared Mobility in Alleviating Private Car Dependence and On-Road Carbon Emissions in the Context of COVID-19. Front. Environ. Sci. 2022, 10, 931763. [Google Scholar] [CrossRef]
  10. Münzel, K.; Boon, W.; Frenken, K.; Blomme, J.; Van Der Linden, D. Explaining Carsharing Supply across Western European Cities. Int. J. Sustain. Transp. 2020, 14, 243–254. [Google Scholar] [CrossRef]
  11. Vélez, A.M.A. Economic Impacts, Carbon Footprint and Rebound Effects of Car Sharing: Scenario Analysis Assessing Business-to-Consumer and Peer-to-Peer Car Sharing. Sustain. Prod. Consum. 2023, 35, 238–249. [Google Scholar] [CrossRef]
  12. Dill, J.; McNeil, N.; Howland, S. Effects of Peer-to-Peer Carsharing on Vehicle Owners’ Travel Behavior. Transp. Res. Part C Emerg. Technol. 2019, 101, 70–78. [Google Scholar] [CrossRef]
  13. Neifer, T.; Bossauer, P.; Pakusch, C.; Boehm, L.; Lawo, D. Trust-Building in Peer-to-Peer Carsharing: Design Case Study for Algorithm-Based Reputation Systems. Comput. Support. Coop. Work. 2023, 63, 137–171. [Google Scholar] [CrossRef]
  14. Wilhelms, M.-P.; Henkel, S.; Merfeld, K. You Are What You Share: Understanding Participation Motives in Peer-to-Peer Carsharing. In Disrupting Mobility; Meyer, G., Shaheen, S., Eds.; Lecture Notes in Mobility; Springer International Publishing: Cham, Switzerland, 2017; pp. 105–119. [Google Scholar] [CrossRef]
  15. Arbeláez Vélez, A.M.; Plepys, A. Car Sharing as a Strategy to Address GHG Emissions in the Transport System: Evaluation of Effects of Car Sharing in Amsterdam. Sustainability 2021, 13, 2418. [Google Scholar] [CrossRef]
  16. Meelen, T.; Münzel, K. The Uphill Struggles of Carsharing in the Netherlands. Proc. Natl. Acad. Sci. USA 2023, 120, e2206197120. [Google Scholar] [CrossRef]
  17. Amatuni, L.; Ottelin, J.; Steubing, B.; Mogollón, J.M. Does Car Sharing Reduce Greenhouse Gas Emissions? Assessing the Modal Shift and Lifetime Shift Rebound Effects from a Life Cycle Perspective. J. Clean. Prod. 2020, 266, 121869. [Google Scholar] [CrossRef]
  18. Nijland, H.; Van Meerkerk, J. Mobility and Environmental Impacts of Car Sharing in the Netherlands. Environ. Innov. Soc. Transit. 2017, 23, 84–91. [Google Scholar] [CrossRef]
  19. Lu, M.; Chen, Z.; Shen, S. Optimizing the profitability and quality of service in carshare systems under demand uncertainty. Manuf. Serv. Oper. Manag. 2018, 20, 162–180. [Google Scholar] [CrossRef]
  20. Benjaafar, S.; Kong, G.; Li, X. Modeling and Analysis of Collaborative Consumption in Peer-to-Peer Car Sharing. Sigmetrics Perform. Eval. Rev. 2015, 43, 87–90. [Google Scholar] [CrossRef]
  21. Prieto, M.; Stan, V.; Baltas, G. New Insights in Peer-to-Peer Carsharing and Ridesharing Participation Intentions: Evidence from the “Provider-User” Perspective. J. Retail. Consum. Serv. 2022, 64, 102795. [Google Scholar] [CrossRef]
  22. Lewis, A.; Simmons, M. P2P Carsharing Service Design: Informing User Experience Development. Master’s Thesis, School of Engineering, Blekinge Institute of Technology, Karlskrona, Sweden, 2012. Available online: https://www.diva-portal.org/smash/get/diva2:830309/FULLTEXT01.pdf (accessed on 10 February 2024).
  23. Olaru, D.; Greaves, S.; Leighton, C.; Smith, B.; Arnold, T. Peer-to-Peer (P2P) Carsharing and Driverless Vehicles: Attitudes and Values of Vehicle Owners. Transp. Res. Part A Policy Pract. 2021, 151, 180–194. [Google Scholar] [CrossRef]
  24. Shaheen, S.; Martin, E.; Hoffman-Stapleton, M. Shared Mobility and Urban Form Impacts: A Case Study of Peer-to-Peer (P2P) Carsharing in the US. J. Urban Des. 2021, 26, 141–158. [Google Scholar] [CrossRef]
  25. Barbour, N.; Zhang, Y.; Mannering, F. Individuals’ Willingness to Rent Their Personal Vehicle to Others: An Exploratory Assessment of Peer-to-Peer Carsharing. Transp. Res. Interdiscip. Perspect. 2020, 5, 100138. [Google Scholar] [CrossRef]
  26. Turoń, K. Multi-Criteria Decision Analysis during Selection of Vehicles for Car-Sharing Services—Regular Users’ Expectations. Energies 2022, 15, 7277. [Google Scholar] [CrossRef]
  27. Chen, M.; Sun, Y.; Waygood, E.O.D.; Yu, J.; Zhu, K. User Characteristics and Service Satisfaction of Car Sharing Systems: Evidence from Hangzhou, China. PLoS ONE 2022, 17, e0263476. [Google Scholar] [CrossRef]
  28. Kim, J.; Rasouli, S.; Timmermans, H. Satisfaction and Uncertainty in Car-Sharing Decisions: An Integration of Hybrid Choice and Random Regret-Based Models. Transp. Res. Part A Policy Pract. 2017, 95, 13–33. [Google Scholar] [CrossRef]
  29. Lane, B.; Potter, S. The Adoption of Cleaner Vehicles in the UK: Exploring the Consumer Attitude–Action Gap. J. Clean. Prod. 2007, 15, 1085–1092. [Google Scholar] [CrossRef]
  30. Fujita, K.S.; Yang, H.-C.; Taylor, M.; Jackman, D. Green Light on Buying a Car: How Consumer Decision-Making Interacts with Environmental Attributes in the New Vehicle Purchase Process. Transp. Res. Rec. J. Transp. Res. Board 2022, 2676, 743–762. [Google Scholar] [CrossRef]
  31. Scott, J. What Is Social Network Analysis? Bloomsbury Academic: London, UK, 2012. [Google Scholar] [CrossRef]
  32. Butts, C.T. Social Network Analysis: A Methodological Introduction. Asian J. Soc. Psychol. 2008, 11, 13–41. [Google Scholar] [CrossRef]
  33. Haythornthwaite, C. Social Network Analysis: An Approach and Technique for the Study of Information Exchange. Libr. Inf. Sci. Res. 1996, 18, 323–342. [Google Scholar] [CrossRef]
  34. Tabassum, S.; Pereira, F.S.F.; Fernandes, S.; Gama, J. Social Network Analysis: An Overview. WIREs Data Min. Knowl. 2018, 8, e1256. [Google Scholar] [CrossRef]
  35. O’Malley, A.J.; Marsden, P.V. The Analysis of Social Networks. Health Serv. Outcomes Res. Methodol. 2008, 8, 222–269. [Google Scholar] [CrossRef] [PubMed]
  36. Surya Gunawan, T.; Aleah Jehan Abdullah, N.; Kartiwi, M.; Ihsanto, E. Social Network Analysis Using Python Data Mining. In Proceedings of the 2020 8th International Conference on Cyber and IT Service Management (CITSM), Pangkal, Indonesia, 23–24 October 2020; IEEE: Pangkal Pinang, Indonesia, 2020; pp. 1–6. [Google Scholar] [CrossRef]
  37. Maddumage, C.; Dhanushika, M.P. R Programming for Social Network Analysis—A Review. In Proceedings of the 2018 3rd International Conference on Information Technology Research (ICITR), Moratuwa, Sri Lanka, 5–7 December 2018; pp. 1–5. [Google Scholar] [CrossRef]
  38. Yustiawan, Y.; Maharani, W.; Gozali, A.A. Degree Centrality for Social Network with Opsahl Method. Procedia Comput. Sci. 2015, 59, 419–426. [Google Scholar] [CrossRef]
  39. Zhang, J.; Luo, Y. Degree Centrality, Betweenness Centrality, and Closeness Centrality in Social Network. In Proceedings of the 2017 2nd International Conference on Modelling, Simulation and Applied Mathematics (MSAM2017), Bangkok, Thailand, 26–27 March 2017; Atlantis Press: Bankog, Thailand, 2017. [Google Scholar] [CrossRef]
  40. Radha, D.; Kavikuil, K.; Keerthi, R. Centrality Measures to Analyze Transport Network for Congestion Free Shipment. In Proceedings of the 2017 2nd International Conference on Computational Systems and Information Technology for Sustainable Solution (CSITSS), Bengaluru, India, 21–23 December 2017; IEEE: Bengaluru, India, 2017; pp. 1–5. [Google Scholar] [CrossRef]
  41. Kuşkapan, E.; Yasin Çodur, M.; Tortum, A.; Tesoriere, G.; Campisi, T. Urban Road Transport Network Analysis: Machine Learning and Social Network Approaches. Komunikácie 2022, 24, A232–A245. [Google Scholar] [CrossRef]
  42. El-adaway, I.H.; Abotaleb, I.S.; Vechan, E. Social Network Analysis Approach for Improved Transportation Planning. J. Infrastruct. Syst. 2017, 23, 05016004. [Google Scholar] [CrossRef]
  43. Jeon, J.W.; Wang, Y.; Yeo, G.T. SNA Approach for Analyzing the Research Trend of International Port Competition. Asian J. Shipp. Logist. 2016, 32, 165–172. [Google Scholar] [CrossRef]
  44. Kowald, M.; Axhausen, K.W. Transport Planning and Social Network Analysis: An Introduction; ETH Zurich: Cham, Switzerland, 2015; p. 230. [Google Scholar] [CrossRef]
  45. Ruiz, T.; Mars, L.; Arroyo, R.; Serna, A. Social Networks, Big Data and Transport Planning. Transp. Res. Procedia 2016, 18, 446–452. [Google Scholar] [CrossRef]
  46. Vechan, E.; El-Adaway, I.; Hassan, M. Dynamic Social Network Analysis for Infrastructure Transportation Systems. In Proceedings of the Construction Research Congress 2014, Atlanta, GA, USA, 19–21 May 2014; American Society of Civil Engineers: Atlanta, GA, USA, 2014; pp. 1179–1188. [Google Scholar] [CrossRef]
  47. Flores Romero, M.E.; Morales Agiss, I.O.; Sosa Compean, L.B. Analysis Of The Road Network Structures Based on Street Connectivity. Contexto 2020, 14, 7. [Google Scholar] [CrossRef]
  48. Han, Y.; Caldwell, N.D.; Ghadge, A. Social Network Analysis in Operations and Supply Chain Management: A Review and Revised Research Agenda. IJOPM 2020, 40, 1153–1176. [Google Scholar] [CrossRef]
  49. Rodríguez Rodríguez, R.; Leon, R.D. Social Network Analysis and Supply Chain Management. Int. J. Prod. Manag. Eng. 2016, 4, 35. [Google Scholar] [CrossRef]
  50. Carter, C.R.; Ellram, L.M.; Tate, W. The Use Of Social Network Analysis In Logistics Research. J. Bus. Logist. 2007, 28, 137–168. [Google Scholar] [CrossRef]
  51. Turoń, K.; Kubik, A.; Łazarz Bogusław, B.; Czech, P.; Stanik, Z. Car-Sharing in the Context of Car Operation. IOP Conf. Ser. Mater. Sci. Eng. 2018, 421, 032027. [Google Scholar] [CrossRef]
  52. Turoń, K. Selection of Car Models with a Classic and Alternative Drive to the Car-Sharing Services from the System’s Rare Users Perspective. Energies 2022, 15, 6876. [Google Scholar] [CrossRef]
  53. Turoń, K. Carsharing Vehicle Fleet Selection from the Frequent User’s Point of View. Energies 2022, 15, 6166. [Google Scholar] [CrossRef]
  54. Jolliffe, I.T.; Cadima, J. Principal Component Analysis: A Review and Recent Developments. Philos. Trans. R. Soc. A 2016, 374, 20150202. [Google Scholar] [CrossRef] [PubMed]
  55. Fiorello, D.; Martino, A.; Zani, L.; Christidis, P.; Navajas-Cawood, E. Mobility Data across the EU 28 Member States: Results from an Extensive CAWI Survey. Transp. Res. Procedia 2016, 14, 1104–1113. [Google Scholar] [CrossRef]
  56. Majchrowicz, B. Factors Influencing Decision Making on Donating Organs for Transplantation in the Opinion of the Respondents—Study Using the CAWI Method. J. Educ. Health Sport. 2022, 13, 183–189. [Google Scholar] [CrossRef]
  57. Tomaselli, V.; Battiato, S.; Ortis, A.; Cantone, G.G.; Urso, S.; Polosa, R. Methods, Developments, and Technological Innovations for Population Surveys. Soc. Sci. Comput. Rev. 2022, 40, 994–1013. [Google Scholar] [CrossRef]
  58. Natekin, A.; Knoll, A. Gradient Boosting Machines, a Tutorial. Front. Neurorobot. 2013, 7, 21. [Google Scholar] [CrossRef]
  59. Guillen, M.D.; Aparicio, J.; Esteve, M. Gradient Tree Boosting and the Estimation of Production Frontiers. Expert Syst. Appl. 2023, 214, 119134. [Google Scholar] [CrossRef]
  60. Zhang, Y.; Haghani, A. A Gradient Boosting Method to Improve Travel Time Prediction. Transp. Res. Part C Emerg. Technol. 2015, 58, 308–324. [Google Scholar] [CrossRef]
  61. Newman, M. The Structure and Dynamics of Networks; Princeton Studies in Complexity Series; Princeton University Press: Princeton, NJ, USA, 2006. [Google Scholar]
  62. Shaheen, S.; Cohen, A.; Chung, M.S. North American carsharing: 10-year retrospective. Transp. Res. Rec. 2012, 2319, 35–44. [Google Scholar] [CrossRef]
  63. Martins, A.; Ferreira, L. The driving forces behind carsharing adoption: A study on mobility behavior changes. Transp. Policy 2015, 37, 72–82. [Google Scholar]
  64. Litman, T. Evaluating Carsharing Benefits. Transp. Res. Rec. 2020, 1702, 31–35. [Google Scholar] [CrossRef]
  65. Cervero, R.; Tsai, Y. City CarShare in San Francisco, California: Second-Year Travel Demand and Car Ownership Impacts. Transp. Res. Rec. 2017, 1992, 117–127. [Google Scholar] [CrossRef]
  66. Efthymiou, D.; Antoniou, C.; Waddell, P. Factors affecting the adoption of vehicle sharing systems by young drivers. Transp. Policy 2013, 29, 64–73. [Google Scholar] [CrossRef]
  67. Becker, H.; Ciari, F.; Axhausen, K.W. Measuring the car ownership im-pact of free-floating car-sharing—A case study in Basel, Switzerland. Transp. Policy 2017, 53, 66–73. [Google Scholar] [CrossRef]
  68. Shaheen, S.A.; Cohen, A.P. Carsharing and Personal Vehicle Services: Worldwide Market Developments and Emerging Trends. Int. J. Sustain. Transp. 2013, 7, 5–34. [Google Scholar] [CrossRef]
  69. Martin, E.W.; Shaheen, S.A. Greenhouse Gas Emission Impacts of Carsharing in North America. IEEE Trans. Intell. Transp. Syst. 2011, 12, 1074–1086. [Google Scholar] [CrossRef]
  70. Chesbrough, H. Open Innovation: The New Imperative for Creating and Profiting from Technology, Nachdr; Harvard Business School Press: Boston, MA, USA, 2011. [Google Scholar]
  71. Yun, J.J.; Zhao, X.; Jeong, E.; Ahn, H.; Park, K. Micro open innovation dynamics under inter-rationality. Technol. Forecast. Soc. Chang. 2024, 201, 123263. [Google Scholar] [CrossRef]
  72. Yun, J.H.J.; Zhao, X.; Del Gaudio, G.; Corte, V.D.; Sadoi, Y. Leveraging business model innovation through the dynamics of open innovation: A multi-country investigation in the restaurant industry. Eur. J. Innov. Manag. 2023. [Google Scholar] [CrossRef]
  73. Akhmetshin, E.; Morozov, I.; Pavlyuk, A.; Yumashev, A.; Yumasheva, N.; Gubarkov, S. Motivation of Personnel in an Innovative Business Climate. ERSJ 2018, 21, 352–361. [Google Scholar] [CrossRef]
  74. The Influence of the Car Sharing Market on the Development of Ground Transport in Metropolitan Cities. Available online: https://um.ase.ro/no142/1.pdf (accessed on 21 April 2024).
  75. Martin, E.; Shaheen, S. The Impact of Carsharing on Household Vehicle Ownership. Available online: https://www.accessmagazine.org/wp-content/uploads/sites/7/2016/01/access38_carsharing_ownership.pdf (accessed on 7 March 2024).
  76. Kubik, A.; Turoń, K.; Folęga, P.; Chen, F. CO2 emissions—evidence from internal combustion and electric engine vehicles from car-sharing systems. Energies 2023, 16, 2185. [Google Scholar] [CrossRef]
  77. Cash, P.; Wrobel, A.; Maier, A.; Hansen, J.P. Understanding Long-Term Behaviour Change Techniques: A Mixed Methods Study. J. Eng. Des. 2023, 34, 383–410. [Google Scholar] [CrossRef]
  78. Michie, S.; Atkins, L.; West, R. The Behaviour Change Wheel: A Guide to Designing Interventions; Silverback Publishing: London, UK, 2015. [Google Scholar]
  79. Kwasnicka, D.; Dombrowski, S.U.; White, M.; Sniehotta, F. Theoretical Explanations for Maintenance of Behaviour Change: A Systematic Review of Behaviour Theories. Health Psychol. Rev. 2016, 10, 277–296. [Google Scholar] [CrossRef] [PubMed]
  80. Hagger, M.S.; Weed, M. DEBATE: Do Interventions Based on Behavioral Theory Work in the Real World? Int. J. Behav. Nutr. Phys. Act. 2019, 16, 36. [Google Scholar] [CrossRef] [PubMed]
  81. Xiao, G.; Wang, Z. Empirical Study on Bikesharing Brand Selection in China in the Post-Sharing Era. Sustainability 2020, 12, 3125. [Google Scholar] [CrossRef]
Figure 1. Research procedure.
Applsci 15 00658 g001
Figure 2. Technical factors influencing the choice of vehicles for peer-to-peer car-sharing systems.
Applsci 15 00658 g002
Figure 3. Degree centrality of the analyzed factors.
Applsci 15 00658 g003
Figure 4. Closeness centrality of the analyzed factors.
Applsci 15 00658 g004
Figure 5. Betweenness centrality of the analyzed factors.
Applsci 15 00658 g005
Table 1. Summary of the literature review on the application of the SNA method in transport issues.
ReferenceResearch AreaTitle of the ArticlePurpose of SNA ApplicationMain Findings Regarding SNASNA Application Conclusions
[40]Road network analysesCentrality Measures to Analyze Transport Network for Congestion Free ShipmentApplication of the SNA method to assess transport networks in the context of reducing congestion and improving the efficiency of shipments. The authors examine various measures of centrality in transportation networks to identify key nodes and routes that are critical to traffic flow and may be potential congestion points.The main conclusion of this article is that centrality measures, crucial in SNA, can be used effectively to identify the most important nodes and routes in the transportation network. This provides a better understanding of where congestion can potentially occur. By identifying these key points, transportation network management can be more targeted, which can help reduce downtime and increase shipment efficiency.The SNA method has proven useful in designing more optimal and less congested transport networks.
[41]Road network analysesUrban Road Transport Network Analysis: Machine Learning and Social Network ApproachesUsing SNA to predict traffic patterns and to identify key arteries and nodes in the road network that may affect the effectiveness and efficiency of urban transport.The use of SNA allows for a deeper analysis and better understanding of urban traffic dynamics and also indicates that SNA used in combination with machine learning helps to identify key segments of the road network that have the greatest impact on efficiency and capacity.The SNA method is an effective tool to identify key nodes and connections in urban transport networks, which can help with traffic planning and optimization.
[42]Research on interactions between transport usersSocial Network Analysis Approach for Improved Transportation PlanningApplication of the SNA method to the study of transport networks in order to improve transport planning.The article uses various measures of SNA centrality in the transport context for the quick identification of the most important intersections in transport networks. The use of SNA makes it possible to understand the structure of the network to effectively manage resources and traffic flow.1. The authors point out that transport analysis tools are often expensive, time consuming, and data intensive, which makes SNA, as a fast and inexpensive method, beneficial for initial analyses of transport networks.
2. SNA is recognized as an effective and innovative tool in transportation analysis that can help decision-makers focus on critical areas in more detailed analyses.
3. The SNA method was chosen for its ability to identify important patterns and relationships in transport networks, which is crucial in infrastructure planning and management.
4. The effectiveness of the method indicates that SNA allows for a more strategic approach to planning, considering structural dependencies and prioritization in the network.
[43]Research on interactions between transport usersSNA Approach to Analyzing the Research Trend of International Port CompetitionUsing SNA to study trends in international port competition.Thanks to the use of the SNA method, research on port competition was analyzed, indicating that trends were transferred at the global level. This allowed researchers to better understand trends in port competition research from an academic point of view.1. The SNA has proven to be effective in mapping and analyzing complex patterns of cooperation and competition between ports, providing a deeper understanding of the research space and influential actors.
2. The use of SNA allows for the understanding and analysis of complex networks in the transport context and highlights the versatility and effectiveness of SNA as an analytical tool.
[44]Research on social aspects of public transportTransport Planning and Social Network Analysis: An IntroductionThe authors discuss how SNA approaches can be used to better understand the dynamics and patterns in transportation networks. The article explores the interactions between personal social networks and transportation choices, analyzing how social networks influence travelers’ behavior and vice versa.The SNA method can help identify and understand social influences on transportation decisions. By understanding these relationships, transportation planners can better design transportation systems that are more in line with natural patterns of social movement and communication between people.SNA is a tool that supports planning and understanding the topography of networks and the relationships between them, facilitating decision-making processes.
[45]Research on social aspects of public transportSocial Networks, Big Data and Transport PlanningThe aim of the study was to integrate SNA analysis with big data in the context of transport planning. The authors explored how the combination of these two disciplines can lead to a better understanding and management of transport networks, particularly in terms of predicting traffic patterns and optimizing services.The paper concludes that the combination of SNA and big data offers new opportunities for transportation planners, enabling a more precise and dynamic approach to the management and planning of transport infrastructure. The use of big data enables a more accurate analysis of networks and user behavior, which in turn translates into more effective and efficient transport systems.The SNA method works well for the precise analysis of both large and small amounts of data.
[46]Research on the impact of changes in transport infrastructureDynamic Social Network Analysis for Infrastructure Transportation SystemsThe article focuses on the application of SNA to the study and modeling of infrastructure transport systems. SNA allows for the analysis of changes in networks and flow patterns over time, which is crucial for understanding and predicting changes in the use of transport systems.The paper presents methods for identifying key nodes and connections in transport infrastructure that have a significant impact on the efficiency and reliability of the system. The dynamic aspects of SNA could help to understand how interventions or changes in one network segment can affect the entire system.The paper indicates the value of the application of SNA to the study of network dynamics. The method can be used to model transport networks.
[47]Research on the impact of changes in transport infrastructureAnalysis of The Road Network Structures Based On Street ConnectivityIt examines the structures of road networks by analyzing their street connections. Traffic analysis is an important aspect of urban planning that affects the accessibility, capacity, and overall efficiency of road networks.The article demonstrates how different connection configurations affect traffic and accessibility in different urban areas. The authors were also able to identify patterns of street connections that are the most conducive to addressing flow congestion and other transport problems.The paper emphasizes the importance of SNA in the context of transport systems, highlighting network dynamics and the specific topology of street connections as key factors influencing the design and management of transport infrastructure.
[48]Analysis of the flow of goods in logistics networksSocial network analysis in Operations and Supply Chain Management: A Review and Revised Research AgendaLiterature review on the use of SNA in operations and supply chain management.The study demonstrates the possibility of using the SNA method to study various aspects of supply chains, such as cooperation, information flow, and the impact of individual actors on the efficiency of the supply chain.The findings highlight the potential of SNA as a tool to uncover new patterns and dependencies in supply chains that may be overlooked by more traditional analysis methods.
[49]Analysis of the flow of goods in logistics networksSocial Network Analysis and Supply Chain ManagementThe use of SNA in supply chain management to determine how the relationships between different actors in the supply chain affect overall performance and effectiveness.SNA can help to better understand the complexity and dynamics of supply chains by analyzing network interactions between companies. The use of SNA can contribute to better risk management, the optimization of flows in the chain, and improved cooperation between participants.Practical applications of the SNA method to the field of operations research are shown.
[50]Analysis of the flow of goods in logistics networksThe Use Of Social Network Analysis In Logistics ResearchThe article introduces social network theory and Social Network Analysis (SNA) as tools that have the potential to be used in logistics and supply chain management research. The authors begin by providing a general overview of the theory of social networks and SNA and then move on to discuss the specific application of SNA in logistics.The study examines how formal and informal structures and influences within an organization affect the development and effectiveness of reporting systems. Through the use of SNA, the authors were able to identify key relationships and points of influence that are relevant for the success of logistics system implementation.The use of SNA for logistics research opens up new perspectives for understanding and optimizing processes in this field, especially in the context of resource and safety management.
[51]Shared mobility researchElectric Shared Mobility Services during the Pandemic: Modeling Aspects of TransportationIn this study, SNA was used to analyze the impact of COVID-19 on the shared electric mobility industry. The method made it possible to identify the key factors influencing the functioning of this industry during the pandemic by analyzing the network of relationships between different stakeholders (such as service providers, users, and regulators).The study highlighted the need to update business and operating models in response to the pandemic, as well as the importance of sustainable transport management. SNA helped to elucidate how the changes in user behavior and new regulations have impacted the industry, which is crucial for future transport modeling and policy-making.SNA is a valuable tool for analyzing and understanding complex relationship networks in the shared mobility industry. Thanks to SNA, it is possible to better understand the macro-impact (pandemic, regulations) of factors on the functioning and development of services.
[52]Shared mobility researchA Holistic Approach to Electric Shared Mobility Systems Development—Modelling and Optimization AspectsIn this study, SNA was used to identify drivers and inhibitors of the development of shared electric mobility services. Expert research was carried out and combined with the SNA to understand the relationships and impact of selected stakeholders on the EV market as a whole. This study was aimed at understanding how different actors affect the growth or recession of services.Results highlighted the need for a non-standard approach to modeling and optimizing electric mobility services. The SNA has proven to be crucial in understanding the complexity and dynamics of the market, allowing for the creation of more effective models and recommendations for service providers and local mobility managers.SNA offers deep insights into the structures and dynamics of the shared mobility sector, which are essential to respond effectively to the rapidly changing external environment and internal market conditions. It allows researchers to analyze micro-factors related to the functioning of enterprises.
Table 2. List of factors characterizing vehicles included in the analysis.
Factor
(Car Feature)
Factor Description
F1Battery capacity in kWh (for electric vehicle) and real range in various conditions
F2Cylinder configuration (e.g., R4, V6) and number of valves per cylinder
F3Type of charging (turbocharging, compressor)
F4Acceleration time from 0 to 100 km/h
F5Type of recommended fuel (95, 98, diesel)
F6Engine displacement (cm3)
F7Fuel consumption in urban, extra-urban, and mixed cycles
F8Braking time from 100 to 0km/h
F9Brand and model of audio system, number of speakers, availability of subwoofer
F10Touch screen resolution and size, availability of gesture control functions
F11Wheelbase, ground clearance, front/rear track width
F12Presence of advanced safety systems (e.g., types of driving assistance available)
F13Type and range of seat adjustments (e.g., 14-way driver’s seat adjustment with massage function)
F14Air conditioning (e.g., four-zone automatic air conditioning with individual settings for each passenger)
F15Availability and type of communication ports (USB, USB-C, AUX, HDMI)
F16Compatibility with a smartphone (compatible with various versions of Android/iOS)
F17Availability of advanced assistance packages (e.g., autonomous driving packages)
F18Types of charging connectors (e.g., CCS, CHAdeMO, Type 2)
F19Maximum power assumed for AC/DC charging
F20Full charging time from a 230 V socket
F21Tire dimensions
F22Description of the vehicle personalization functions for the user (e.g., selection of driving mode, personalization of interior lighting)
F23Length of the standard warranty period and warranty period for key components (e.g., EV battery)
F24Estimated cost of servicing at specific intervals (e.g., inspection every 15,000 km)
Table 3. Sociodemographic data of respondents.
CategoryDetails
GenderMale: 1016 (70%)
Female: 363 (25%)
Other: 44 (3%)
Prefer not to say: 29 (2%)
Age distribution<18: 29 (2%)
18–24: 218 (15%)
25–34: 508 (35%)
35–44: 363 (25%)
45–54: 174 (12%)
55–64: 116 (8%)
65+: 44 (3%)
Education levelPrimary: 73 (5%)
Secondary: 726 (50%)
Bachelor: 363 (25%)
Master/engineering: 261 (18%)
Postgraduate/doctorate: 29 (2%)
Employment statusEmployed full-time: 871 (60%)
Other: 580 (40%)
Average monthly net household incomeBelow PLN 2000: 130 (9%)
PLN 2000–3999: 609 (42%)
PLN 4000–5999: 421 (29%)
PLN 6000–7999: 218 (15%)
PLN 8000–9999: 44 (3%)
PLN 10,000 and above: 29 (2%)
Region of residenceCity above 500,000 inhabitants: 232 (16%)
City with 100,000–499,999 inhabitants: 509 (35%)
City below 100,000 inhabitants: 421 (29%)
Rural area: 289 (20%)
Type of housingOwnership: 682 (47%)
Rent: 595 (41%)
Service apartment: 102 (7%)
Other: 72 (5%)
Number of people in the household1 person: 348 (24%)
2 people: 552 (38%)
3–4 people: 450 (31%)
5 and more people: 101 (7%)
Having childrenYes: 652 (45%)
No: 799 (55%)
Frequency of using vehicles (car, motorcycle)Daily: 333 (23%)
Several times a week: 465 (32%)
Once a week: 261 (18%)
Less often than once a week: 276 (19%)
Never: 116 (8%)
Table 4. A summary of values obtained based on social network analysis.
NodeDegree CentralityCloseness CentralityBetweenness Centrality
F10.39130.58970.0929
F20.34780.54760.0672
F30.26090.54760.0375
F40.21740.52270.0302
F50.17390.52270.0228
F60.13040.46940.0031
F70.39130.60530.0968
F80.21740.50000.0220
F90.13040.44230.0097
F100.34780.53490.1243
F110.17390.43400.0105
F120.39130.60530.0936
F130.26090.52270.0443
F140.21740.51110.0186
F150.26090.52270.0202
F160.21740.50000.0211
F170.39130.60530.1001
F180.26090.54760.0392
F190.17390.42590.0166
F200.26090.54760.0310
F210.26090.51110.0390
F220.26090.56100.0591
F230.04350.35380.0000
F240.21740.54760.0396
Table 5. A gradient boosting model.
FeatureImportance [%]
Betweenness centrality38.12
Closeness centrality21.45
Degree centrality15.37
Density12.91
Average path length12.15
Disclaimer/Publisher’s Note: The statements, opinions and data contained in all publications are solely those of the individual author(s) and contributor(s) and not of MDPI and/or the editor(s). MDPI and/or the editor(s) disclaim responsibility for any injury to people or property resulting from any ideas, methods, instructions or products referred to in the content.

