Featured Application
The hydrogenated safflower oil-based biocomposites are specifically suited for use in biodegradable packaging materials, offering an eco-friendly solution to reduce plastic waste. Additionally, they can be applied in lightweight automotive components, such as interior panels, where durability and sustainability are critical. Their customizable properties also make them ideal for green building materials, including insulation panels.
Abstract
The growing demand for sustainable and environmentally friendly materials has highlighted the need for innovative alternatives to traditional plastics and composites. This study explores the development of polyurethane-based biocomposites synthesized using hydrogenated safflower oil (HSO), hydrogen gas, and a nickel catalyst. Safflower oil was hydrogenated via a catalytic hydrogenation mechanism, transforming carbon–carbon double bonds into saturated fatty acids. The process, optimized using response surface methodology (RSM), was conducted at 225 °C, 8 atmospheres, and 6 h, achieving a yield of 67%. Hydrogenation improved the physical and chemical properties of the biocomposites. Biocomposites were synthesized by combining HSO with methylene diphenyl diisocyanate (MDI) as a crosslinker. Optimal performance was observed at 2.5% HSO content, enhancing material properties. However, higher HSO content negatively affected biocomposite density and hardness, and surface morphology analyses revealed that increased HSO content led to irregular pore structures. These findings underscore the balance required in material composition to achieve optimal performance. This study presents a novel approach to producing hydrogenation-modified HSO-based biocomposites, providing an eco-friendly and sustainable alternative for industries such as packaging, construction, and automotive applications. The advancements contribute to reducing environmental impact and enhancing the performance of renewable material technologies.
1. Introduction
The global demand for sustainability and the use of environmentally friendly materials has prompted significant research efforts aimed at the development of biocomposites derived from renewable resources. In this context, vegetable oils emerge as promising candidates for the synthesis of biocomposite matrices due to their chemically adaptable properties, biological renewability, and wide availability [1,2,3]. It is noteworthy that the high unsaturated fatty acid content of vegetable oils enables the optimization of properties such as oxidative stability, mechanical strength, and thermal resistance, thereby creating a diverse range of applications across various industrial sectors [4]. The enhancement of these properties, as well as chemical modification processes, such as hydrogenation, is of critical importance. Hydrogenation is an important chemical process that improves the thermal and oxidative resistance of vegetable oils by saturating carbon–carbon double bonds [5].
In recent years, there has been a notable increase in interest in the use of vegetable oils as matrix materials for biocomposite production. Of particular note is the use of catalytic hydrogenation in this process. The saturation of unsaturated carbon–carbon double bonds in triglycerides with hydrogen gas facilitates the transformation of oils into materials with suitable properties for biocomposite applications. The literature indicates that nickel and activated carbon-supported catalysts are widely used in hydrogenation processes, significantly improving the oxidative stability and mechanical strength of oils [6]. As an example, the hydrogenation of vegetable oils, such as sunflower oil, using activated carbon-supported nickel catalysts has resulted in the production of matrix materials suitable for biocomposite applications [7]. Furthermore, single-step hydrogenation processes offer notable advantages in terms of energy efficiency and environmental sustainability for biofuel and biocomposite production. Hydrogenation processes utilizing palladium and nickel nanoparticles have been highlighted as efficient and environmentally compatible alternatives [8].
The synthesis of biocomposites entails the reinforcement of modified vegetable oil-based polymer matrices with natural fibers or nanoparticles, and these materials are receiving increasing attention in the context of environmental sustainability. These materials offer notable advantages over traditional petroleum-based polymers due to their low cost, biodegradability, and reduced environmental impact [9,10]. For example, the incorporation of waste vegetable oils into biocomposites not only mitigates environmental waste but also makes a valuable contribution to the sustainable development of materials [11]. Nevertheless, the current body of research on the optimization of modification methods employed in these processes remains limited, and the necessity for more efficient production strategies persists [12].
The incorporation of hydrogen into oil modification procedures is regarded as a promising approach to augment the production capacity of biocomposites. For instance, hydrogen-assisted combustion processes, as utilized in the production of biodiesel, can also be employed to enhance the performance of biocomposites [13]. The treatment of low-cost oils, such as waste vegetable oil and wheat germ oil, with hydrogen-enriched processes not only minimizes environmental impact but also induces a series of chemical changes that improve mechanical properties and oxidative resistance [14]. These innovative approaches contribute to the enhanced effectiveness of biocomposites in terms of energy density, durability, and sustainability.
The production of biocomposites using vegetable oils modified with hydrogen gas represents a rapidly growing research area at the intersection of polymer chemistry, materials science, and green chemistry [15]. The synthesis of biocomposite matrices through catalytic hydrogenation is facilitated by the incorporation of innovative additives, which result in superior thermal and mechanical properties [16]. It is of paramount importance to optimize the production parameters in order to enhance the performance of biocomposites. The application of statistical optimization tools, particularly the RSM, offers considerable benefits in the context of biocomposite production processes [17]. RSM provides a systematic methodology for the design of experiments, facilitating the analysis of complex interactions between process parameters and the identification of optimal conditions. This method ensures not only time and cost efficiency but also reliability in maximizing the mechanical and thermal properties of biocomposites [18]. As an example, the hydrogenation conditions of the oils employed in biocomposite production (such as temperature, pressure, and catalyst concentration) have been optimized using RSM, resulting in notable improvements in material properties [19].
One of the most significant contributions of RSM in production processes is the reduction in inefficiencies associated with traditional trial-and-error approaches. This not only facilitates more rapid and precise outcomes but also directly supports environmental and economic sustainability objectives [20,21,22]. Within the framework of green chemistry principles, optimizing biocomposite production processes is a critical step in the development of environmentally friendly materials. The hydrogenation of vegetable oils using hydrogen gas and nickel catalysts represents a pivotal process in both the food and chemical industries [23,24]. This process is primarily employed for the conversion of liquid oils into solid fats and is often preferred as a means of preventing or reducing the formation of trans-fatty acids. The hydrogenation process optimizes the physical and chemical properties of oils by replacing unsaturated carbon–carbon double bonds with saturated bonds, thereby enhancing the stability of the oils [25].
The hydrogenation process is typically conducted in a reactor utilizing metal catalysts, such as nickel. The use of nickel catalysts facilitates the addition of hydrogen to unsaturated fatty acids, thereby reducing the energy requirements of the process. Nickel is recognized as an effective catalyst for the hydrogenation of oils under high-temperature and high-pressure conditions. It actively facilitates the addition of hydrogen atoms on the surface of oil molecules, thereby achieving the desired chemical transformation [26]. However, depending on the reaction conditions, the formation of undesirable by-products such as trans-isomers is possible during this process. Considering the adverse health effects of trans-fatty acids, careful optimization of the hydrogenation process is of paramount importance. The appropriate calibration of variables such as temperature, pressure, and reaction time is of paramount importance for the improvement of product quality and the reduction in adverse side effects. The most prevalent utilization of hydrogenated vegetable oils is in food products, including margarine and cooking oils. These oils not only exhibit greater stability during cooking but also improve flavor and texture. Additionally, hydrogenated oils are used to extend the shelf life of food products, as saturated fats are generally more resistant to oxidation.
The environmental impacts and economic dimensions of hydrogenation must also be considered. The generation of hydrogen can be enhanced through the utilization of renewable energy sources, thereby facilitating a more sustainable process. Furthermore, the advancement of hydrogenation techniques is in accordance with the increasing demand for products that are both healthier and more natural. This approach can yield beneficial results for both consumer health and environmental sustainability [27].
The utilization of hydrogenated vegetable oils as a biocomposite matrix material offers considerable potential for the advancement of sustainable and environmentally benign materials. A review of the existing literature reveals a paucity of studies examining the use of hydrogenation-modified vegetable oils in biocomposite matrices. Furthermore, previous research has identified limitations in the optimization of vegetable oils in biocomposites. Safflower oil was selected for its elevated content of unsaturated fatty acids, which augment its chemical reactivity and thermal stability. Its abundance and renewability align with principles of green chemistry, while its consistent quality ensures reproducibility in experiments. Furthermore, safflower oil offers a cost-effective alternative to other oils with analogous properties, rendering it a pragmatic choice for research and potential industrial applications. In particular, there is a paucity of studies examining the impact of the hydrogenation process on the mechanical and thermal properties of biocomposites. This study’s originality lies in its utilization of hydrogenation-modified vegetable oils as a biocomposite matrix material and its contribution to the literature through the optimization of HSO and MDI combinations using RSM. RSM enables the analysis of parameter interactions, thus facilitating the identification of optimal conditions with a reduced number of trials. This approach allows biocomposites to achieve the optimal physical and chemical properties. Moreover, in this study, HSO was crosslinked with MDI to produce polyurethane-based biocomposites, and the mechanical, thermal, and chemical properties of these materials were subjected to comprehensive characterization.
This study is structured as follows: Section 2 outlines the materials and methods, de-tailing the hydrogenation processes, catalyst preparation, and experimental design employed in synthesizing biocomposites. Section 3 presents the results, highlighting the mechanical, thermal, and chemical characterization of the polyurethane-based biocomposites. Finally, Section 4 discusses these findings in the context of sustainability, green chemistry principles, and industrial applications.
2. Experimental Design and Methodology
2.1. Material Selection and Characteristics
The primary raw material selected for the catalytic hydrogenation process was high-purity (98.5%) commercial safflower oil, chosen for its high unsaturated fatty acid content, which enhances its chemical reactivity and thermal stability. Additionally, safflower oil’s abundance, renewability, and consistent quality make it a reliable and reproducible choice, aligning with the principles of sustainability and green chemistry. The chemical purity of this oil allows for the precise execution of the hydrogenation process, which serves as the foundation for biocomposite production. The hydrogenation process was conducted using 99% pure hydrogen gas, which was supplied from a gas cylinder and regulated with a precision pressure regulator. The pressure regulator enables the precise regulation of the hydrogen flow rate and pressure, thereby maintaining the desired reaction conditions. This results in an enhanced efficiency of the hydrogenation process while ensuring consistent chemical modifications in the safflower oil. The reaction process was conducted with a nickel catalyst (99% purity, Sigma-Aldrich, St. Louis, MO, USA) in accordance with the established protocol. The nickel catalyst was selected based on its efficacy in converting unsaturated fatty acids in safflower oil into saturated compounds. Commercial polyether polyol (CPP) and MDI were procured from Puryap Company, and the selection of these materials was based on their ability to meet the experimental requirements, including chemical purity, homogeneity, and reactivity. The high purity and chemical consistency of the materials ensured the reliability and reproducibility of the experimental results, allowing for an accurate evaluation of the role of modified safflower oil in biocomposite production. This represents a crucial stage in the enhancement of the physical and chemical attributes of biocomposite matrices. MDI reacts with CPP to form a mechanically robust and flexible crosslinked polymer network, while exhibiting chemical compatibility with safflower oil. This dual compatibility provides a robust basis for evaluating the efficacy and contribution of HSO in biocomposite production. To comprehensively examine the performance of safflower oil in comparison to CPP in the biocomposite matrix, optimization studies were conducted as part of the experimental process. Safflower oil offers a renewable and environmentally friendly alternative that preserves the mechanical strength and processability advantages afforded by CPP. This underscores the potential applicability of safflower oil as a substitute for CPP in biocomposite production. To ensure a fair comparison, the experimental conditions for both components were maintained at a constant level.
2.2. The Preferred Method in Experimental Studies
In this study, a total of 1 kg of safflower oil was placed into a 2.5 L borosilicate glass reactor, which was equipped with a magnetic stirrer and a reflux condenser. The reactor, illustrated in Figure 1, was designed to ensure homogeneous mixing and prevent the loss of volatile components that may occur during the reaction. Following the introduction of the safflower oil to the reactor, 0.1% (1 g) of nickel catalyst was added, based on the mass of the oil. The nickel catalyst was selected for its ability to facilitate the conversion of carbon–carbon double bonds into saturated fatty acids. The hydrogenation process was conducted by supplying hydrogen gas to the reactor at a constant flow rate of 200 mL/min. The hydrogen gas flow was regulated by a precise pressure regulator in order to maintain stable conditions throughout the course of the reaction. The hydrogenation process was conducted at a temperature of 225 °C and a pressure of 8 atm, resulting in a yield of 67%. To ensure the effective blending of the safflower oil, nickel catalyst, and hydrogen gas within the reactor, continuous stirring was maintained for a period of six hours. Subsequent to the conclusion of the reaction, the HSO was subjected to a series of post-reaction processes, including washing, neutralization, and purification [7,28]. The objective of the washing process was to eliminate any residual, unreacted materials and soluble impurities. Neutralization was employed to ensure the elimination of any acidic or basic components that had been formed during the course of the reaction. The purification process ensured that the oil met the requisite quality standards for use in biocomposite production. In this study, specific quantities of HSO and CPP were blended in a uniform manner, and MDI was employed as a crosslinking agent to fabricate standard molds. Subsequently, the samples were subjected to a 24 h curing period following the completion of the gelation and foaming reactions. Subsequently, the physical and chemical characterization of the resulting polyurethane-based biocomposites reinforced with HSO was conducted.
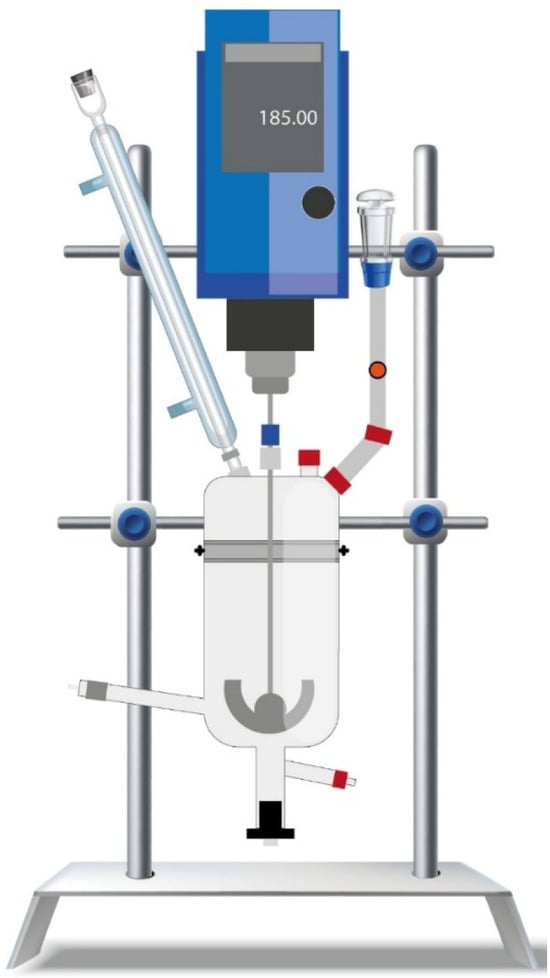
Figure 1.
Borosilicate glass reactor schematic.
2.3. Characterization Processes
In accordance with the methodology delineated in Section 2.2, the resultant biocomposites were subjected to a battery of physical and chemical tests to assess pivotal performance parameters, including mechanical strength, thermal stability, and chemical compatibility. These tests are fundamental to the evaluation of the mechanical durability, thermal stability, and other pertinent properties of the biocomposites, which are essential for determining their suitability for a range of applications.
In this study, the ratios of HSO, CPP, and MDI were identified through a comprehensive literature review, which underscores their substantial contributions to the mechanical and thermal properties of polyurethane biocomposites [29,30,31]. RSM was employed for the purposes of experimental design. RSM is the preferred method for multi-factor experimental analyses, as it allows for the determination of the effects of independent variables and the optimization of processes. As previously indicated in the Introduction, this methodology is of great significance in the development of biocomposite materials. Moreover, a more precise methodology within the RSM framework, namely the Central Composite Design (CCD), was employed to systematically evaluate the effects of HSO, CPP, and MDI on material properties. A second-order polynomial model was fitted to the data, including linear, quadratic, and interaction terms. The model’s robustness was assessed using ANOVA, R2, and lack-of-fit tests. Validation was performed by comparing predicted values with experimental results, confirming the model’s reliability and applicability [32]. The essential details of the pivotal parameters utilized in the experimental process are presented in Table 1.

Table 1.
Experimental study plan for biocomposite production.
The volumetric densities of the specimens were calculated based on mass and volume measurements. For this purpose, the specimens were prepared in molds with dimensions of 20 × 10 × 100 mm3. Weight measurements were conducted using an analytical balance with a precision of 0.0001 g. The dimensions of the specimens were measured with a precise digital caliper and used for volume calculations.
Tensile tests were performed to determine the mechanical properties of the biocomposite specimens. The specimens were prepared according to the ASTM D638-22 standard and had a gauge length of 30 mm and a cross-sectional area of 5 × 5 mm2 [33]. The tests were conducted at room temperature with a loading rate of 1 mm/min using a UTEST Universal Tensile Testing Machine with a 1 kN capacity.
The hardness properties of the specimens were determined using the Shore A hardness test. Measurements were conducted in accordance with the ASTM D2240-15 standard [34]. In the hardness tests, disk-shaped specimens with a diameter of 50 mm and a thickness of at least 10 mm were used. For each specimen, measurements were taken at five different points on the surface, and the average of these measurements was calculated to determine the final hardness value.
To determine the thermal properties of the biocomposite specimens, thermal conductivity tests were conducted. The tests were performed according to the ASTM D5334-14 standard using the Thermtest TLS-100 (Veddige, Sweden) device [35]. The specimens were prepared in cylindrical shapes with a diameter of 50 mm and a height of 100 mm, and a hole with a diameter of 2.5 mm and a depth of 50 mm was drilled in the center of each specimen. During the course of the measurements, the device probe was inserted into the aforementioned hole, and the thermal conductivity values were recorded directly by the device in question. Three measurements were taken for each specimen, and the resulting values were averaged.
In order to ascertain the dielectric properties of the specimens, measurements of the dielectric constant and loss factor were undertaken. The measurements were conducted using a Fytronix device at a frequency of 1 kHz in accordance with the ASTM D150-20 standard [36]. The tests were conducted using disk-shaped specimens with a diameter of 20 mm and a thickness of 1 mm. Prior to commencing the measurement, the surfaces of the specimens were meticulously cleaned, and the device probe was carefully positioned in optimal contact with the specimens. The mean value was calculated from three measurements taken for each specimen in order to determine the dielectric constant. This approach was designed to guarantee the repeatability and precision of the measurement outcomes.
In this study, Fourier Transform Infrared (FT-IR) spectroscopy was used to analyze the chemical compositions of the biocomposite specimens. The FT-IR spectra were obtained using a Shimadzu QATR-S spectrophotometer in the range of 400–4000 cm−1 in attenuated total reflection (ATR) mode. For each specimen, 32 scans were performed at a spectral resolution of 4 cm−1 [37]. The measurements were conducted at room temperature, with air employed as the reference to adjust the spectra. These analyses enabled the identification of characteristic functional groups in the chemical structures of the biocomposites. To examine the surface properties, a Dcorn-brand digital microscope was used. The specimens were observed under the microscope at 250× magnification to analyze surface morphology in detail. The optical microscope was used to evaluate the surface homogeneity, roughness, and structural deformations of the composites.
3. Results and Discussion
3.1. Bulk Density Results
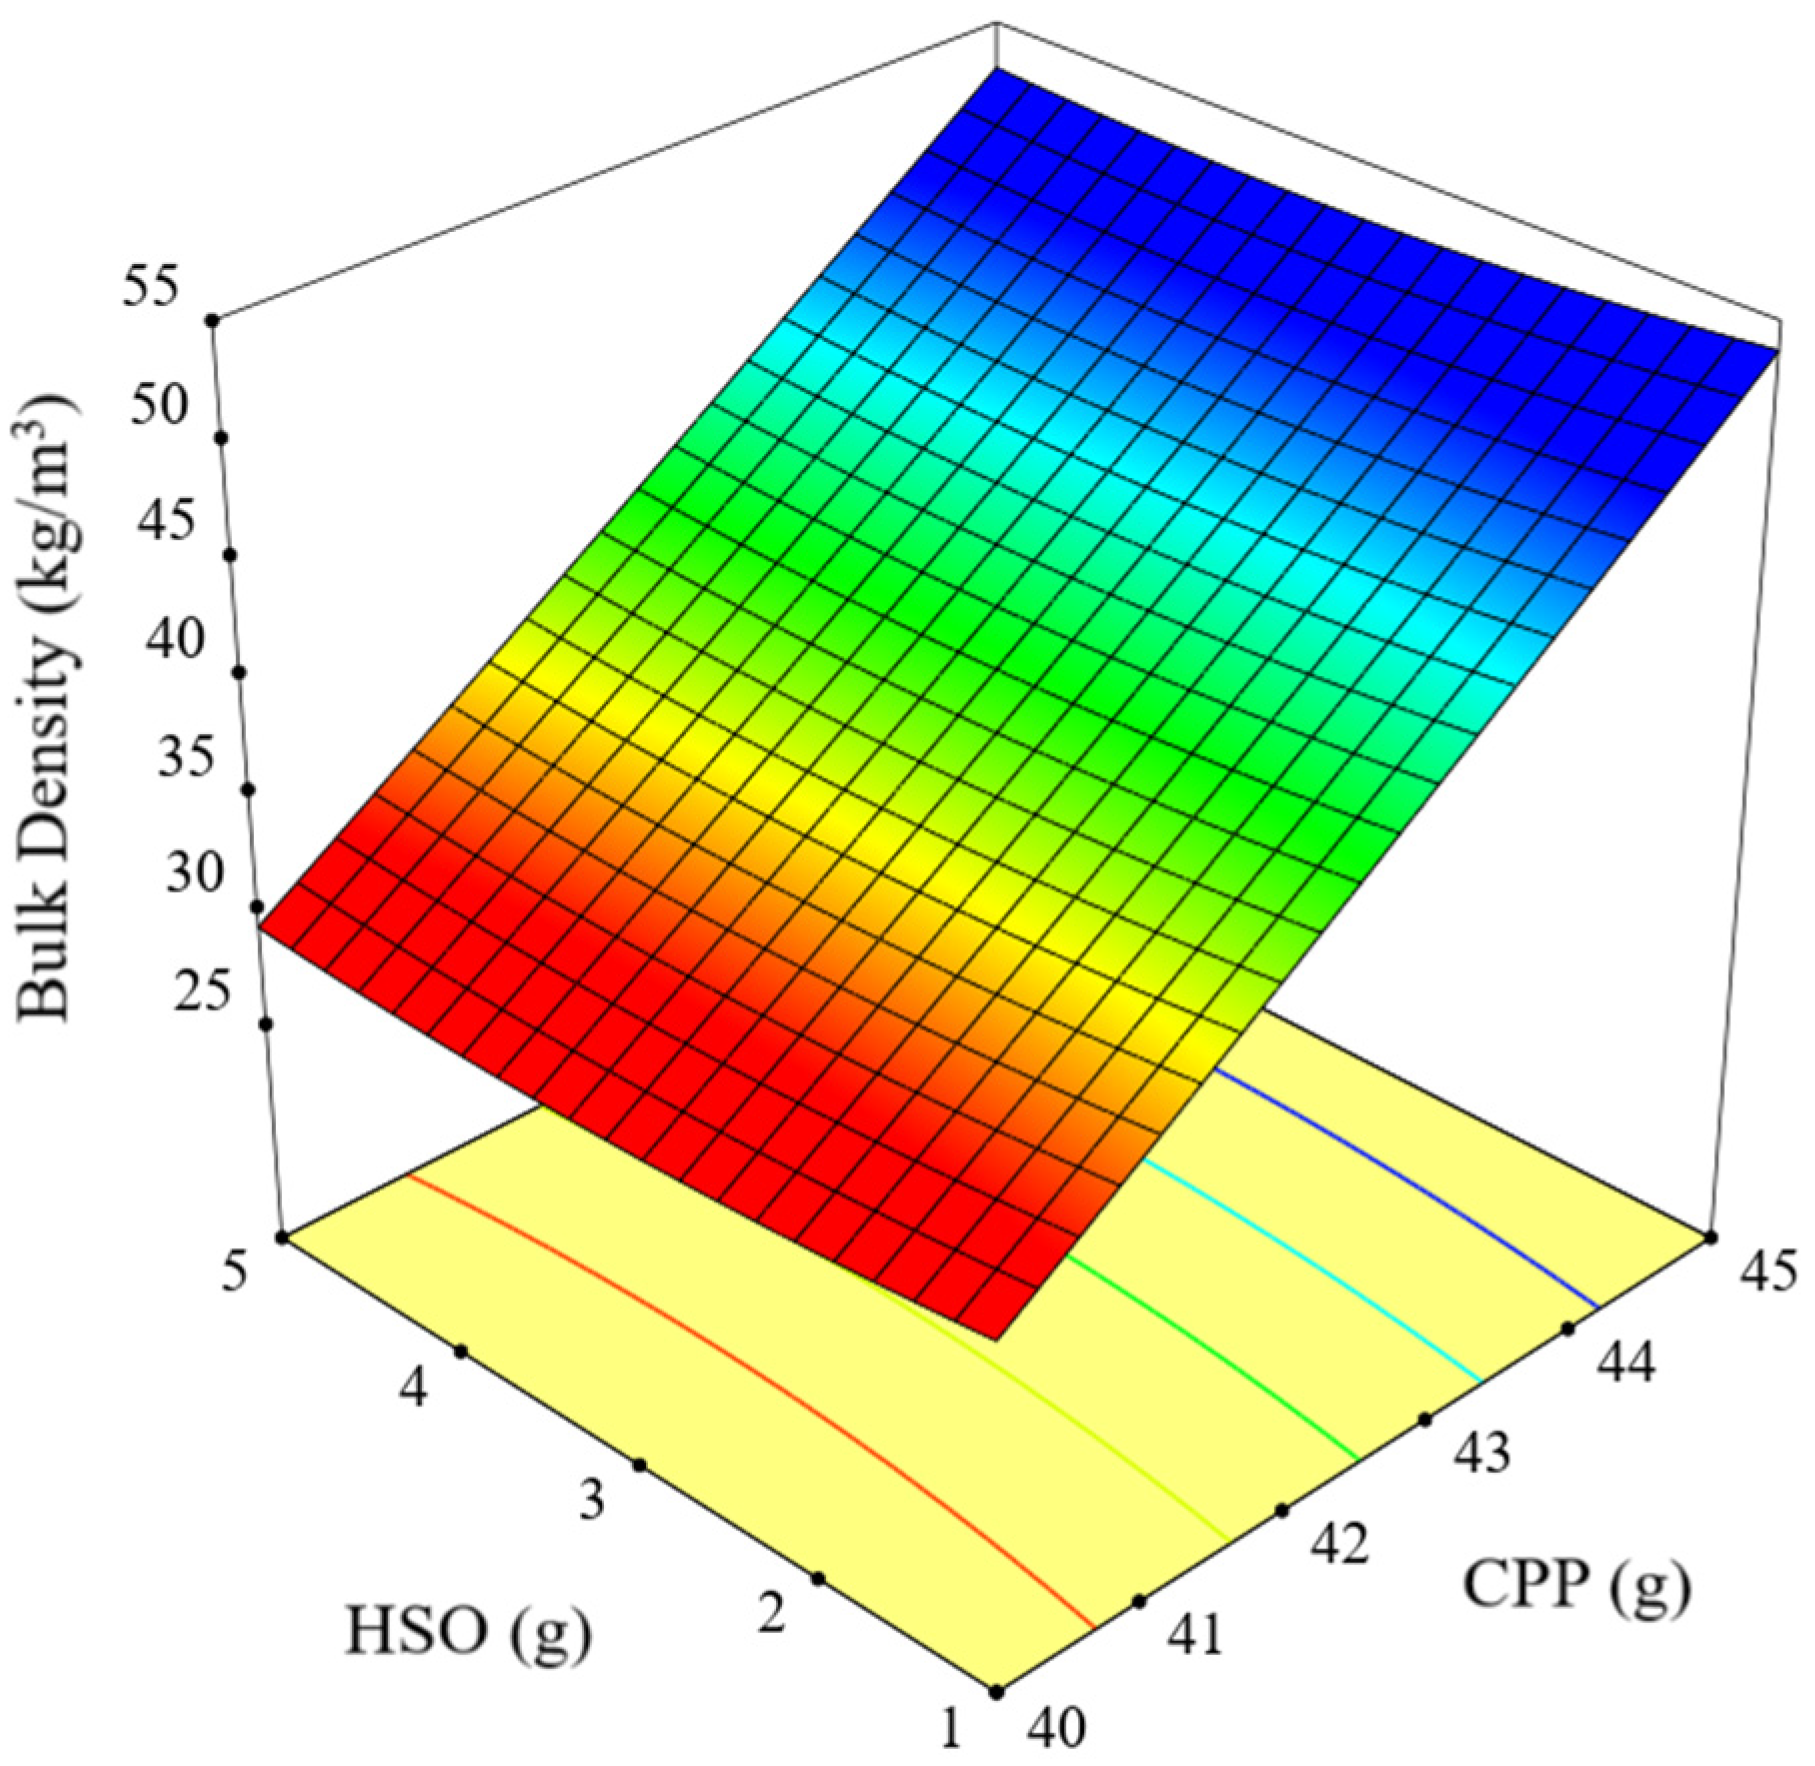
Figure 2 demonstrates that an increase in CPP content significantly improves the bulk density of the polyurethane-based composite. The steepness of the surface slope and the sharpness of the color transitions representing density increments are particularly pronounced along the CPP axis. Conversely, the impact of elevated HSO levels on the composite’s density remains limited. In comparison, changes in density are less pronounced along the HSO axis, with a lower slope and more subtle color transitions. This indicates that CPP exerts a more pronounced effect on the density of the polyurethane matrix, whereas HSO exerts a less significant influence in this regard. It is evident that the optimization of CPP is a more critical factor in achieving the targeted density, despite the simultaneous increase in HSO and CPP, which leads to an increase in density. Equation (1) presents the quadratic model proposed by the RSM design for bulk density.
Bulk density = −194.75781 + 2.62429 × CPP − 1.3851 × HSO + 1.61529 ×
MDI + 1.04303 × 10⁻¹⁴ × CPP × HSO + 6.32478 × 10⁻¹⁵ × CPP × MDI + 7.25341 ×
10−15 × HSO × MDI + 0.024731 × (CPP)2 + 0.198331 × (HSO)2 + 0.005423 × (MDI)2
MDI + 1.04303 × 10⁻¹⁴ × CPP × HSO + 6.32478 × 10⁻¹⁵ × CPP × MDI + 7.25341 ×
10−15 × HSO × MDI + 0.024731 × (CPP)2 + 0.198331 × (HSO)2 + 0.005423 × (MDI)2

Figure 2.
Effects of CPP and HSO content on bulk density change.
Table 2 assesses the significance of the factors CPP (A), HSO (B), and MDI (C), along with their interaction and quadratic effects, on the model throughout the biocomposite production process. The total variance explained by the model (968.60) indicates that the model is highly statistically significant (p < 0.0001). This result demonstrates that the model is an accurate representation of the dataset and can be relied upon for further analysis. Upon examination of the individual effects of the factors, it is evident that CPP (A), HSO (B), and MDI (C) all exert a pronounced and statistically significant influence on the model (p < 0.0001). It is noteworthy that the effect of the CPP (A) factor is the most dominant, with a high F-value of 27,379.65. This finding highlights the crucial role of CPP in influencing the characteristics of biocomposites. However, the binary interactions (AB, AC, BC) were found to be insignificant for the model (p = 1.0000). This indicates that there is no synergistic interaction among the factors. In consideration of these findings, it can be concluded that the combined effects of these factors do not result in greater changes than their individual effects. Among the quadratic effects, only B2 (the square of HSO) has a significant impact (p < 0.0001), while the other quadratic effects (A2 and C2) are not significant (p > 0.05). The model’s exceedingly low error rate (residual SS = 0.1742) and the absence of significance in the “Lack of Fit” test (Pure Error = 0, p > 0.05) demonstrate that the model accurately represents the data and provides reliable results.
Table 2.
ANOVA analysis for bulk density of the biocomposites.
3.2. Shore A Hardness Results
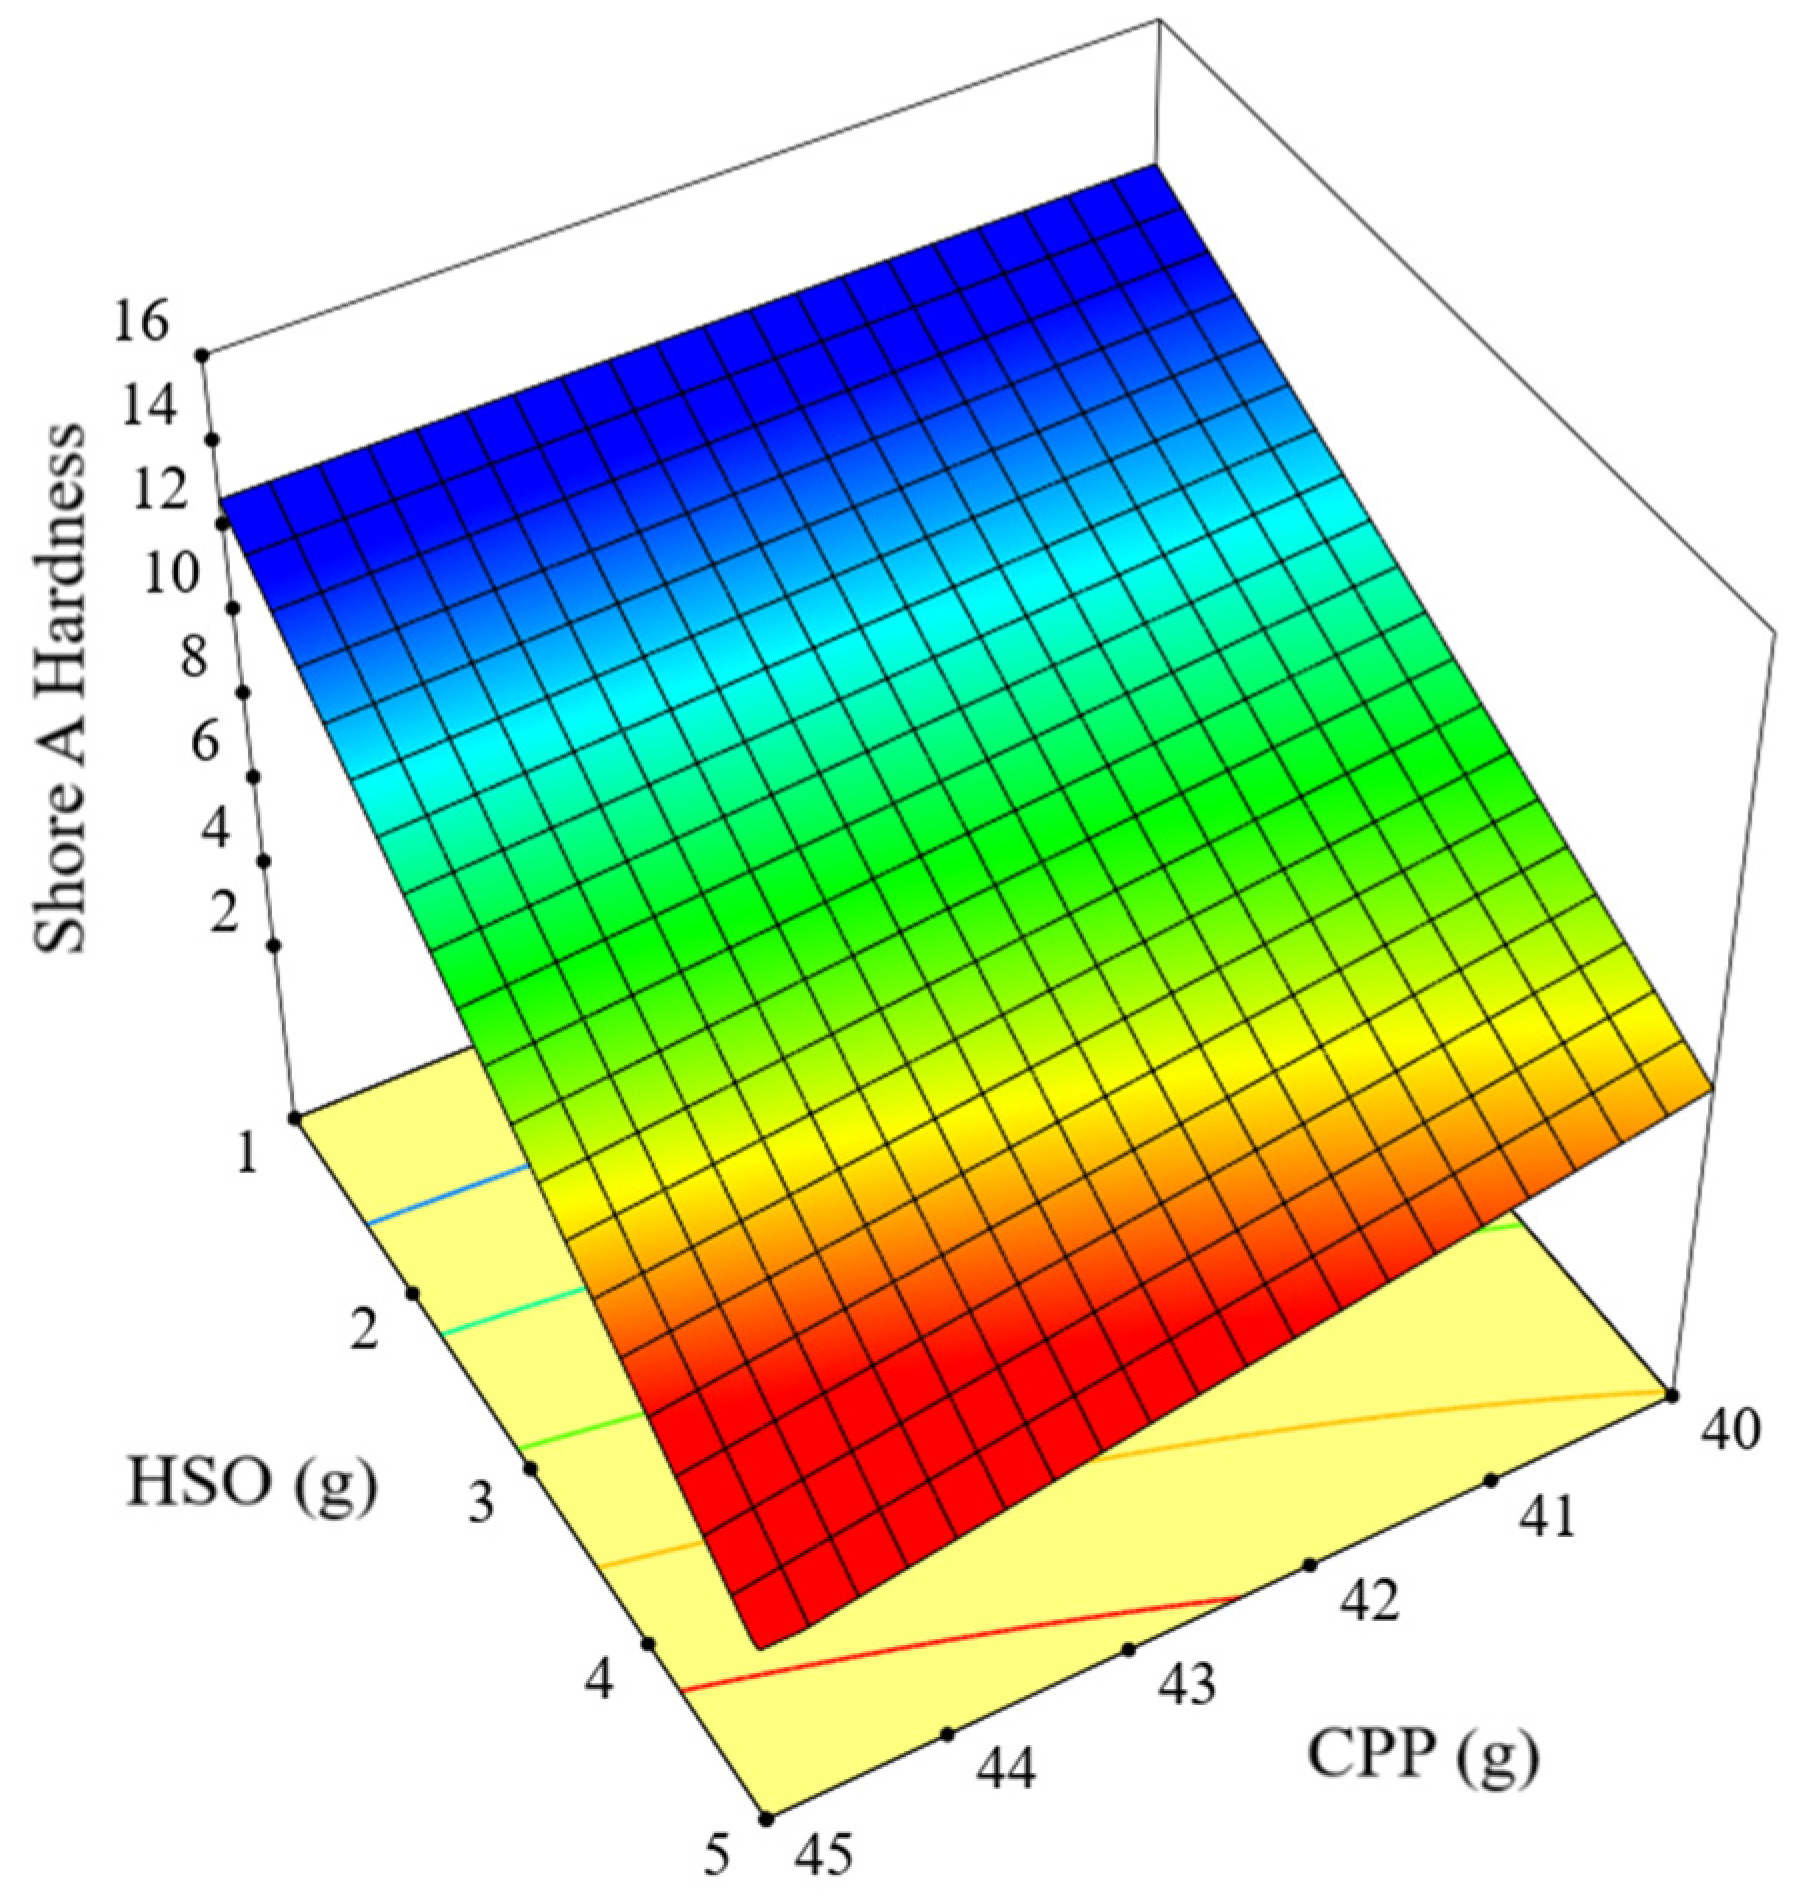
Figure 3 illustrates the impact of CPP and HSO quantities on the Shore A hardness of the polyurethane-based composite. An increase in the quantity of CPP is observed to have a discernible impact on the hardness values. The pronounced increase in the hardness curve and the abrupt color transitions along the CPP axis clearly demonstrate the significant influence of CPP on hardness. Conversely, an increase in the quantity of HSO has been observed to exert a diminishing influence on the Shore A hardness of the composite.

Figure 3.
Effect of CPP and HSO amounts on Shore A hardness of polyurethane based-composite.
This observed trend in the graph can be attributed to the interaction of HSO with the polymer matrix, which results in a softer structure. Upon examination of the Shore A hardness values depicted in the graph, it is evident that the highest hardness values are attained with high CPP and low HSO combinations. These findings indicate that precise adjustment of the CPP and HSO ratios is essential for optimizing the hardness values of the composite. Equation (2) presents the quadratic model proposed by the RSM design for Shore A hardness.
Shore A hardness = −370.34663 + 8.81107 × CPP + 4.22309 × HSO + 8.57187
× MDI − 0.183333 × CPP × HSO − 0.195833 × CPP × MDI + 0.029167 × HSO × MDI
× MDI − 0.183333 × CPP × HSO − 0.195833 × CPP × MDI + 0.029167 × HSO × MDI
The results of the ANOVA are presented in Table 3 and show that the model is statistically significant with a p-value of less than 0.0001. The model accounts for a substantial amount of the total variance as indicated by a model sum of squares (SS) of 172.22 compared to a residual SS of 1.02. Upon further examination, the individual effects of CPP (A), HSO (B), and MDI (C) were all found to be significant (p < 0.05). Among these, HSO (B) emerges as the most dominant parameter, contributing the largest proportion of variance with an F-value of 1564.44. In addition, the interactions between factors AB (CPP and HSO) and AC (CPP and MDI) are statistically significant (p < 0.05), indicating that these combinations influence the model when acting together. However, the BC interaction (HSO and MDI) is not statistically significant (p = 0.4559) and has a negligible effect on the model. The reliability of the model is further supported by its low error rate (residual SS = 1.02) and the non-significant lack-of-fit test (p > 0.05), indicating that the model accurately represents the experimental data. In conclusion, the analysis highlights HSO (B) as the most influential factor and underscores the importance of considering specific interactions, such as AB and AC, to achieve accurate predictions.
Table 3.
ANOVA analysis for Shore A hardness of biocomposite.
3.3. Thermal Conductivity Results
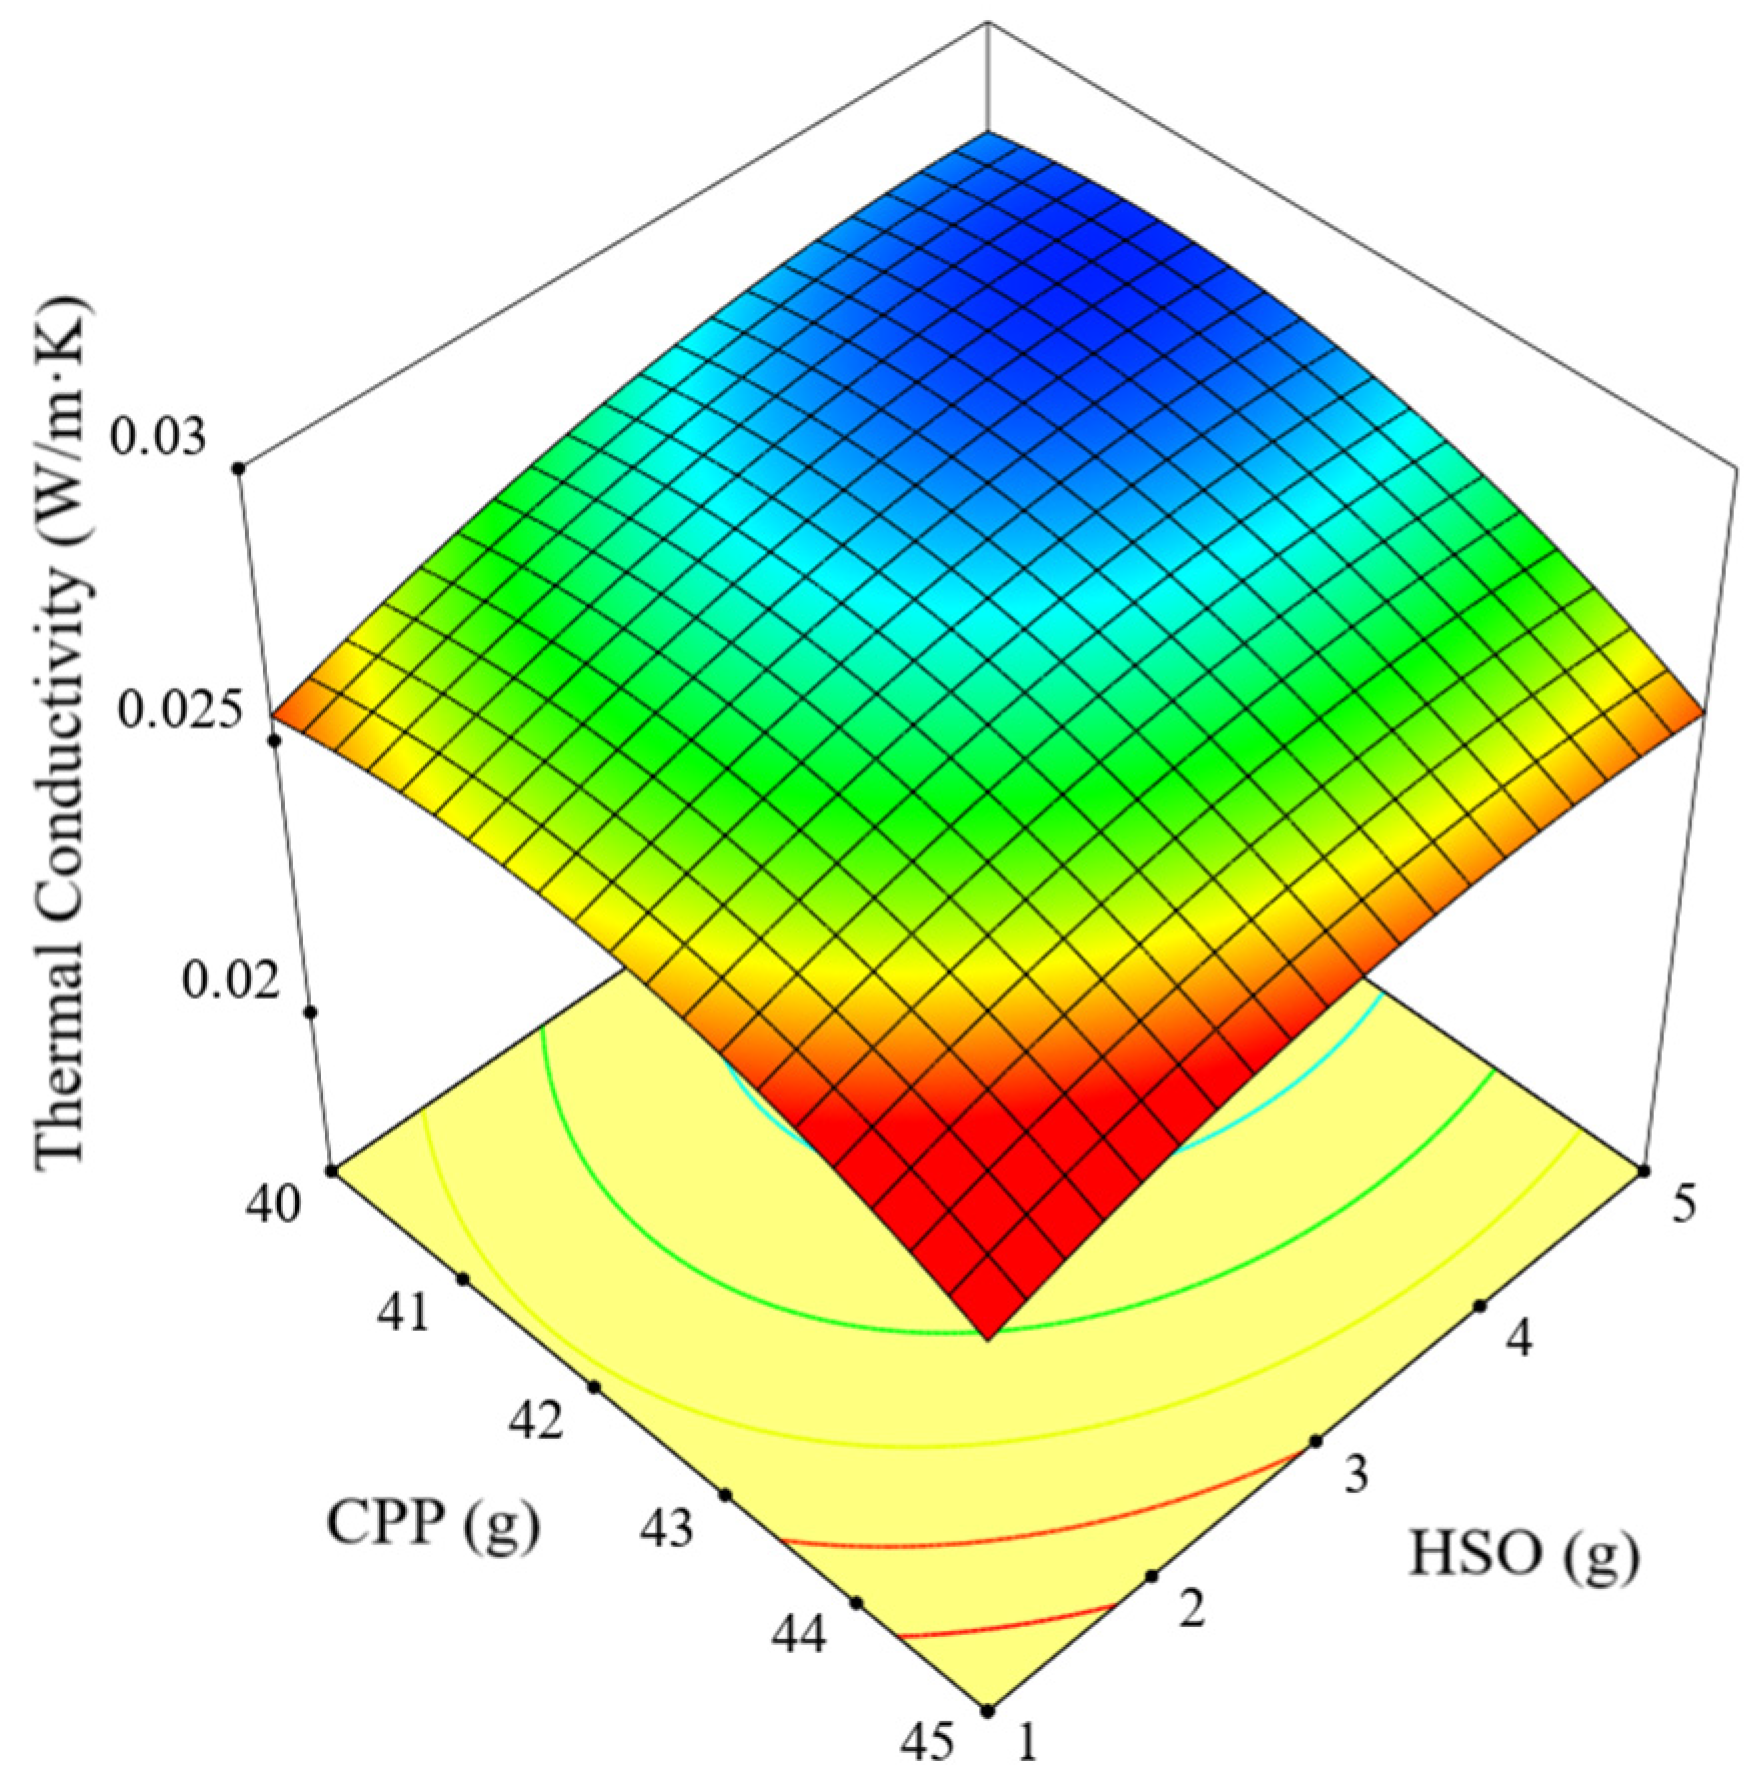
Figure 4 depicts the impact of CPP and HSO quantities on the thermal conductivity coefficient of polyurethane-based composites. An increase in the amount of HSO has been observed to enhance the thermal conductivity coefficient. The thermal conductivity values depicted in the graph range between approximately 0.02 W/m·K and 0.03 W/m·K, with the lowest conductivity values observed when CPP levels are high. It is evident that the thermal conductivity coefficient of the composites can be optimized by controlling the CPP and HSO components. These findings underscore the necessity of employing both components at optimal ratios in industrial applications that necessitate energy efficiency and heat management. Equation (3) presents the quadratic model proposed by the RSM design for thermal conductivity.
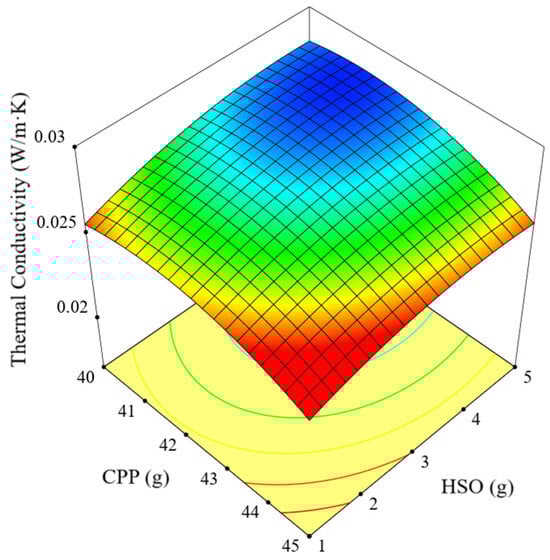
Figure 4.
Effect of CPP and HSO content on the thermal conductivity coefficient.
Table 4 illustrates that the model is highly significant overall (p < 0.0001) and effectively explains a considerable proportion of the variance (model SS = 0.0000; residual SS = 1.071 × 10⁻⁷). Upon examination of the individual effects of the factors, it was found that the CPP (A), HSO (B), and MDI (C) variables exerted a markedly strong and significant influence on the model (p < 0.0001). It is noteworthy that C (MDI) (F = 1045.51) and B (HSO) (F = 878.53) emerge as the most dominant factors with the highest F-values, thereby underscoring their critical role in biocomposite production. Among the binary interactions, the AC interaction is found to be significant (p < 0.0001), whereas the AB (p = 0.0561) and BC (p = 0.1301) interactions are observed to be insignificant. This suggests that specific factors exert a considerable influence on the model when they are combined, whereas other interactions do not result in significant alterations to the model’s behavior. Moreover, the quadratic effects (A2, B2, C2) are found to be highly significant (p < 0.0001), emphasizing the importance of nonlinear effects in the model.
Thermal conductivity = −0.642249 + 0.020431 × CPP + 0.004527 × HSO +
0.010259 × MDI − 0.000044 × CPP × HSO − 0.000117 × CPP × MDI − 0.000025
×HSO × MDI − 0.000183 × (CPP)2 − 0.000175 × (HSO)2 − 0.000054 × (MDI)2
0.010259 × MDI − 0.000044 × CPP × HSO − 0.000117 × CPP × MDI − 0.000025
×HSO × MDI − 0.000183 × (CPP)2 − 0.000175 × (HSO)2 − 0.000054 × (MDI)2
Table 4.
ANOVA analysis for thermal conductivity of the biocomposite.
The model’s low error rate (residual SS = 1.071 × 10⁻⁷) and the non-significant “Lack of Fit” test (p > 0.05) demonstrate that the model represents the data accurately and provides reliable results. In conclusion, Table 4 highlights the critical roles of CPP, HSO, and MDI factors in biocomposite production. This underscores the necessity of exercising caution and precision when controlling these factors to achieve the optimal thermal conductivity properties.
3.4. Dielectric Constant Results
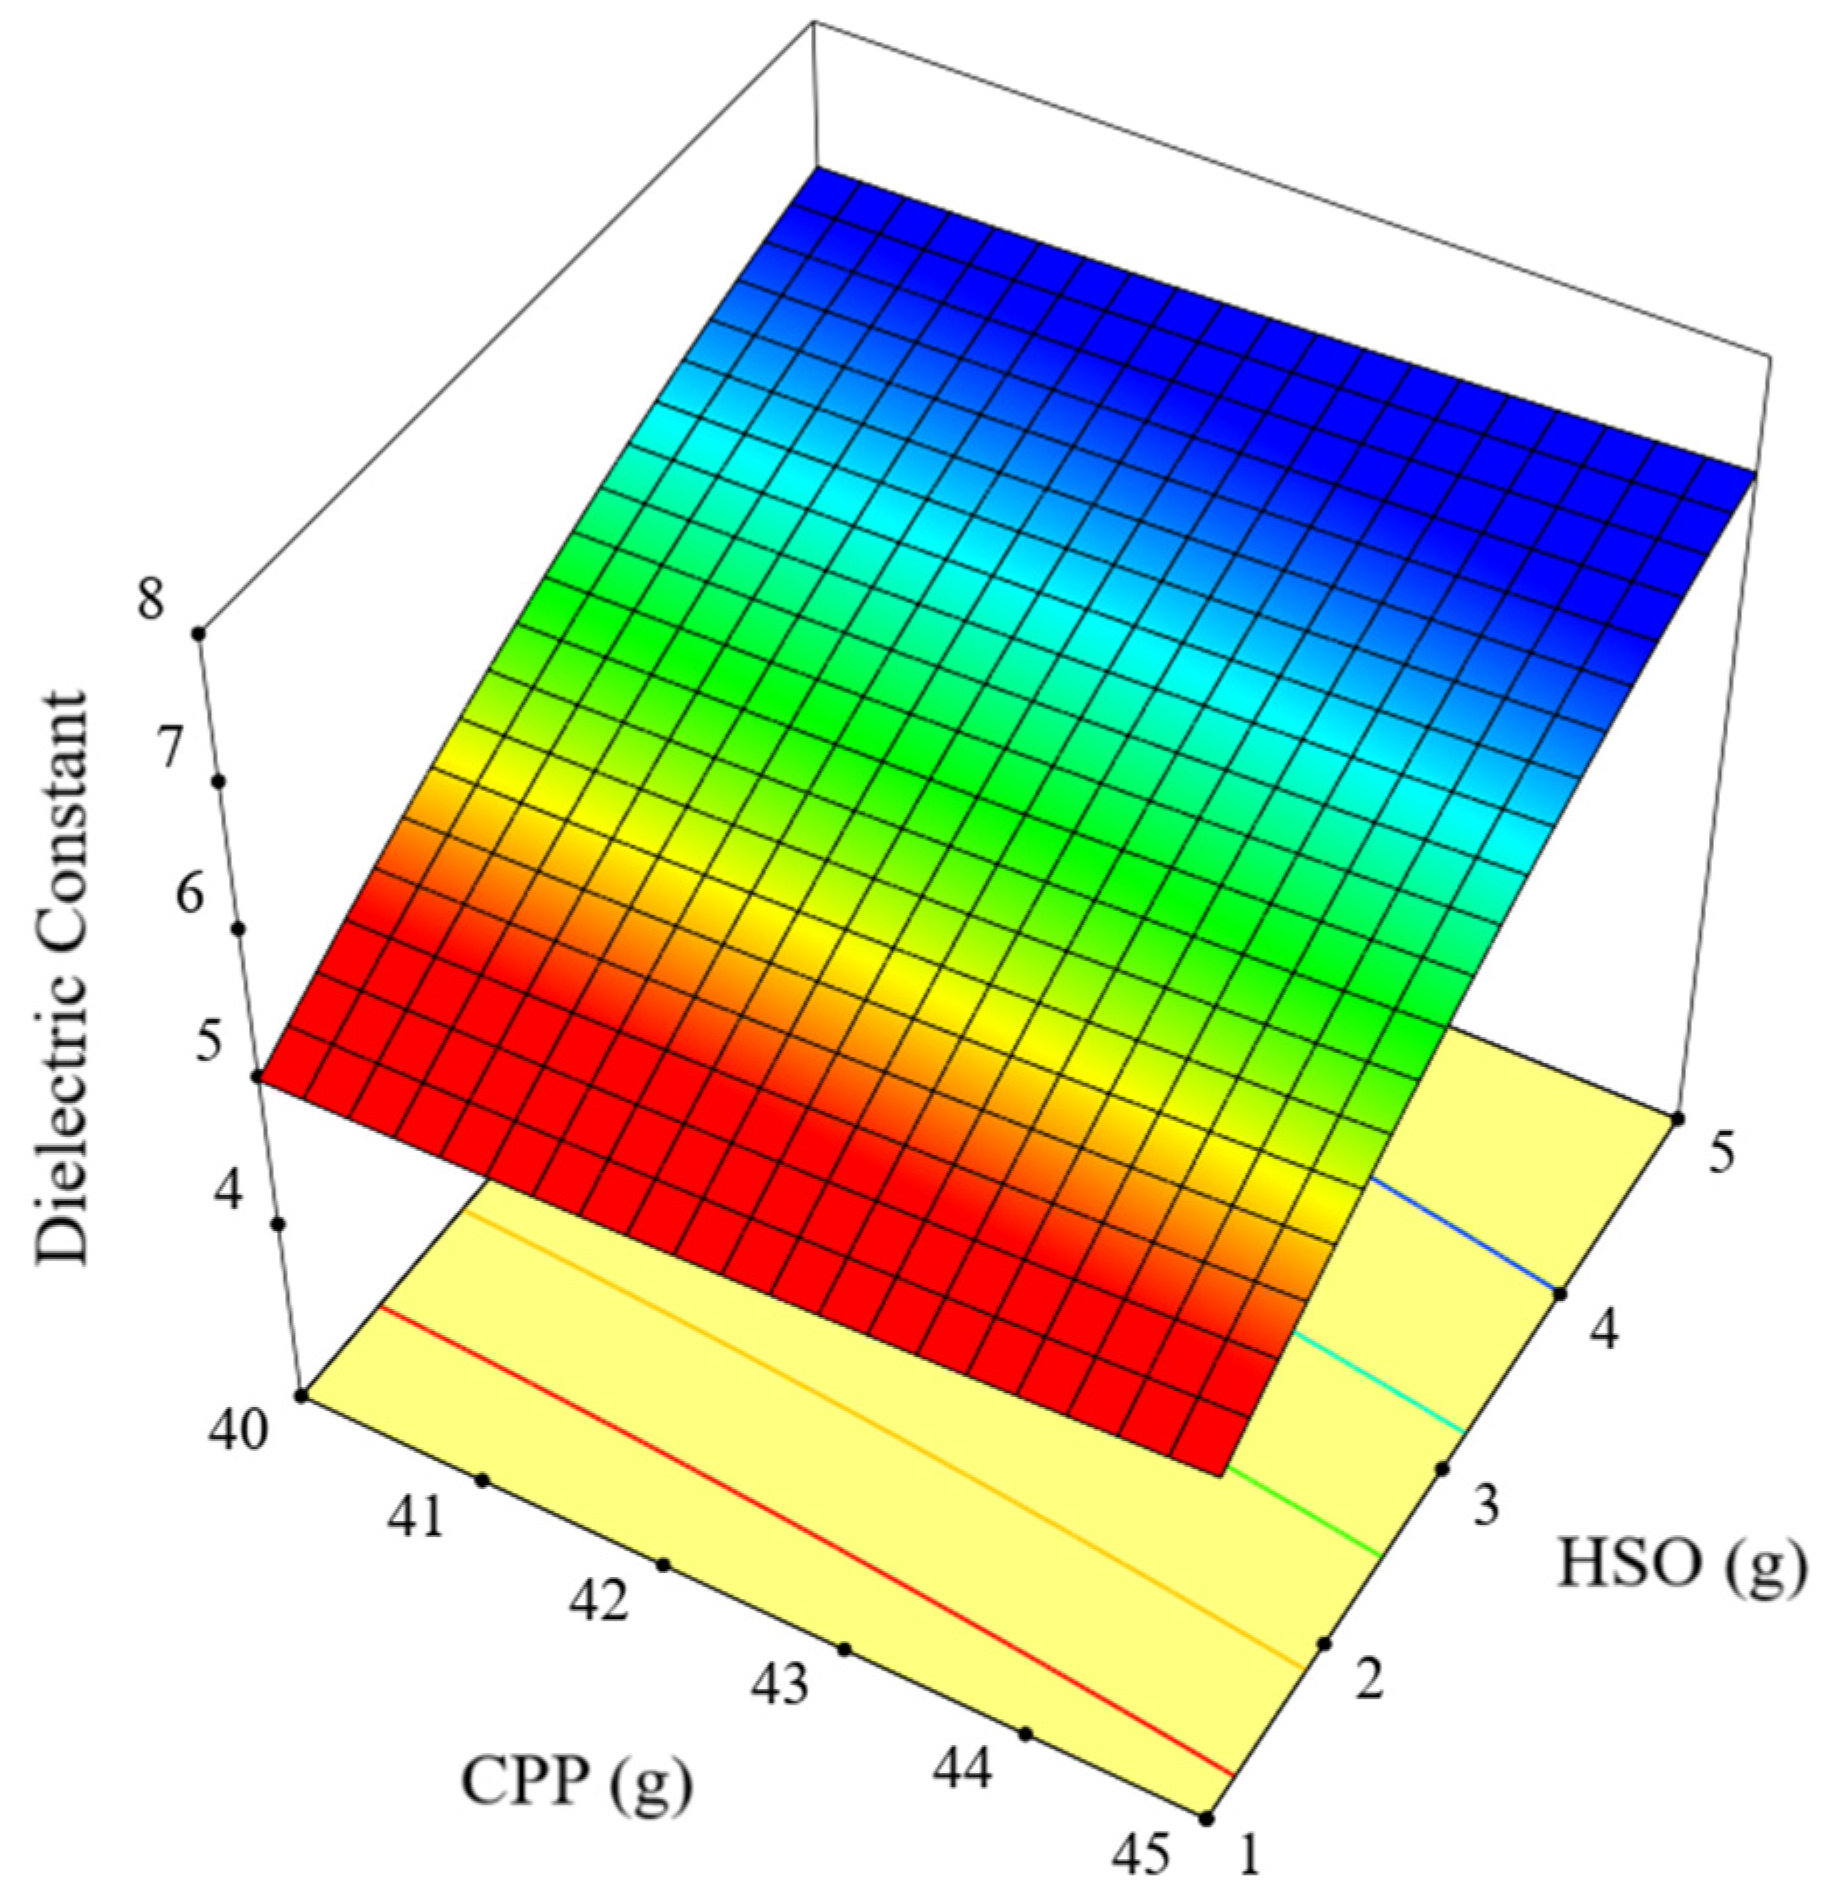
As illustrated in Figure 5, an increase in the HSO content is accompanied by a corresponding rise in the dielectric constant. The polar nature of HSO facilitates enhanced dipole interactions within the composite, which consequently elevates the dielectric constant. Conversely, an increase in CPP content has the effect of reducing the dielectric constant due to the low polarity of this substance. The incorporation of CPP into the composite material results in a notable decline in the overall dielectric properties. These findings highlight the importance of precise adjustment of the HSO and CPP ratios to achieve optimal dielectric properties. Equation (4) presents the quadratic model proposed by the RSM design for the dielectric constant.
Dielectric constant = +11.98270 − 0.304265 × CPP + 0.868628 × HSO − 0.09787 ×
MDI − 0.000556 × CPP × HSO − 0.000417 × CPP × MDI − 0.000417 × HSO ×
MDI + 0.004309 × (CPP)2 − 0.054091 × (HSO)2 + 0.00135 × (MDI)2
MDI − 0.000556 × CPP × HSO − 0.000417 × CPP × MDI − 0.000417 × HSO ×
MDI + 0.004309 × (CPP)2 − 0.054091 × (HSO)2 + 0.00135 × (MDI)2
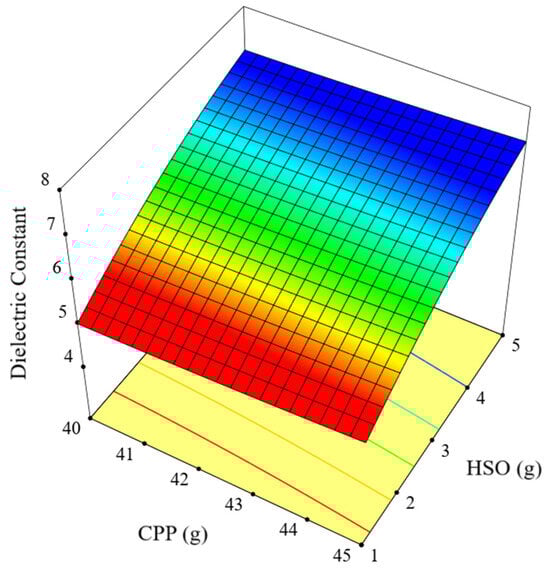
Figure 5.
Effect of HSO and CPP content on the dielectric constant.
As evidenced by the ANOVA results presented in Table 5, the model is highly significant overall and successfully explains a substantial proportion of the variance (p < 0.0001). The effect of the HSO (B) factor on the model is particularly strong and significant (F = 1302.97, p < 0.0001), thereby underscoring the dominant influence of HSO on dielectric properties. Additionally, the CPP (A) factor yields a statistically significant effect (F = 7.53, p = 0.0287), though its impact is markedly less pronounced in comparison to that of HSO. In contrast, the MDI (C) factor does not demonstrate a statistically significant effect on the model (p = 0.8429). The binary interactions (AB, AC, BC) were found to be insignificant (p > 0.05), indicating the absence of synergistic or antagonistic interactions among the factors. However, only the B2 term (the quadratic effect of HSO) is significant, thereby underscoring the importance of nonlinear effects of HSO. The model’s low error rate (residual SS = 0.0507) and the non-significant “Lack of Fit” test (p > 0.05) serve to reinforce the model’s reliability. Therefore, it can be concluded that HSO is the most dominant factor influencing the dielectric constant, while the effects of other factors are more limited.
Table 5.
ANOVA results for the effects of HSO, CPP, and MDI on dielectric properties.
3.5. Tensile Strength
As illustrated in Figure 6, the correlation between HSO content and the mechanical properties of biocomposites demonstrates that an elevation in HSO content is associated with a reduction in tensile strength and a notable enhancement in strain values. This suggests that while the material displays increased elasticity, its strength is simultaneously diminished. The saturation of carbon–carbon double bonds by HSO results in the formation of more flexible structures within the matrix, which consequently weakens the material’s overall strength. Conversely, an increase in CPP content has been observed to result in a corresponding increase in crosslinking density, which in turn enhances the tensile strength of the biocomposite. It is therefore evident that an optimal balance between HSO and CPP is crucial to achieve biocomposites that offer both flexibility and adequate mechanical strength. Equations (5) and (6) present the quadratic models proposed by the RSM design for tensile strength and strain, respectively.
Tensile strength = +4.73091 − 0.289826 × CPP − 0.219456 × HSO + 0.031227
× MDI − 5.32743 × 10 − 16 × CPP × HSO − 1.90719 × 10 − 16 × CPP × MDI − 4.60682
× 10 − 16 × HSO × MDI + 0.003603 × (CPP)2 + 0.021203 × (HSO)2 + 0.000327 × (MDI)2
× MDI − 5.32743 × 10 − 16 × CPP × HSO − 1.90719 × 10 − 16 × CPP × MDI − 4.60682
× 10 − 16 × HSO × MDI + 0.003603 × (CPP)2 + 0.021203 × (HSO)2 + 0.000327 × (MDI)2
Strain = +12261.55041 − 613.48711 × CPP + 455.31565 × HSO − 7.06459 × MDI
− 10.74444 × CPP × HSO − 0.10 × CPP × MDI − 0.10 × HSO × MDI + 7.83029 ×
(CPP)2 + 8.96629 × (HSO)2 + 0.140081 × (MDI)2
− 10.74444 × CPP × HSO − 0.10 × CPP × MDI − 0.10 × HSO × MDI + 7.83029 ×
(CPP)2 + 8.96629 × (HSO)2 + 0.140081 × (MDI)2
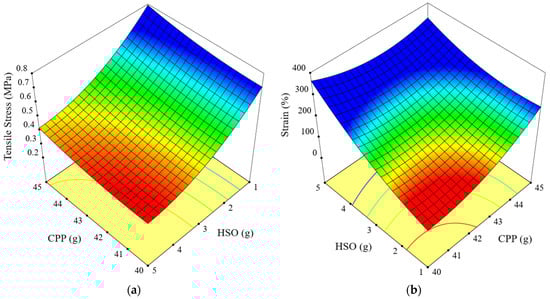
Figure 6.
Effect of HSO and CPP content on the (a) tensile strength and (b) strain %.
As evidenced in Table 6, the results of the ANOVA clearly demonstrate the impact of various factors on tensile strength and strain parameters. With regard to tensile strength, the HSO (B) factor is identified as exerting the most significant effect (F = 397.53, p < 0.0001), followed by the MDI (C) factor, which also demonstrates a notable impact (F = 233.35, p < 0.0001). Nevertheless, the impact of the CPP (A) factor is relatively constrained (F = 8.30, p = 0.0236). The effects of binary interactions (AB, AC, BC) are not statistically significant, indicating that the factors independently influence tensile strength. With regard to strain, the ANOVA analysis once more identifies HSO (B) as the predominant factor (F = 2330.70, p < 0.0001). The CPP (A) factor also plays a significant role (F = 660.96, p < 0.0001), whereas the MDI (C) factor is found to have no significant effect (F = 1.86, p = 0.2150). It is noteworthy that the AB interaction has a significant impact on strain (F = 233.60, p < 0.0001). Furthermore, the quadratic effects of both HSO (B2) and CPP (A2) are highly significant (F = 214.25, p < 0.0001 and F = 163.40, p < 0.0001, respectively), indicating that the impacts of these factors on the biocomposite’s properties are nonlinear and complex. In contrast, the quadratic effect of MDI (C2) is not statistically significant (F = 0.3189, p = 0.5899). In conclusion, the HSO (B) factor is identified as the most influential factor in both models, significantly impacting the mechanical properties of biocomposites. The CPP (A) factor also plays a pivotal role in determining tensile strength and strain, whereas the contribution of the MDI (C) factor is comparatively limited. The effects of binary interactions and the quadratic term of the C factor are found to be negligible. These findings underscore the necessity of meticulous optimization of the HSO and CPP ratios during biocomposite production, as these factors exert pronounced and intricate influences on their mechanical properties.
Table 6.
ANOVA analysis of tensile strength and strain for the biocomposite.
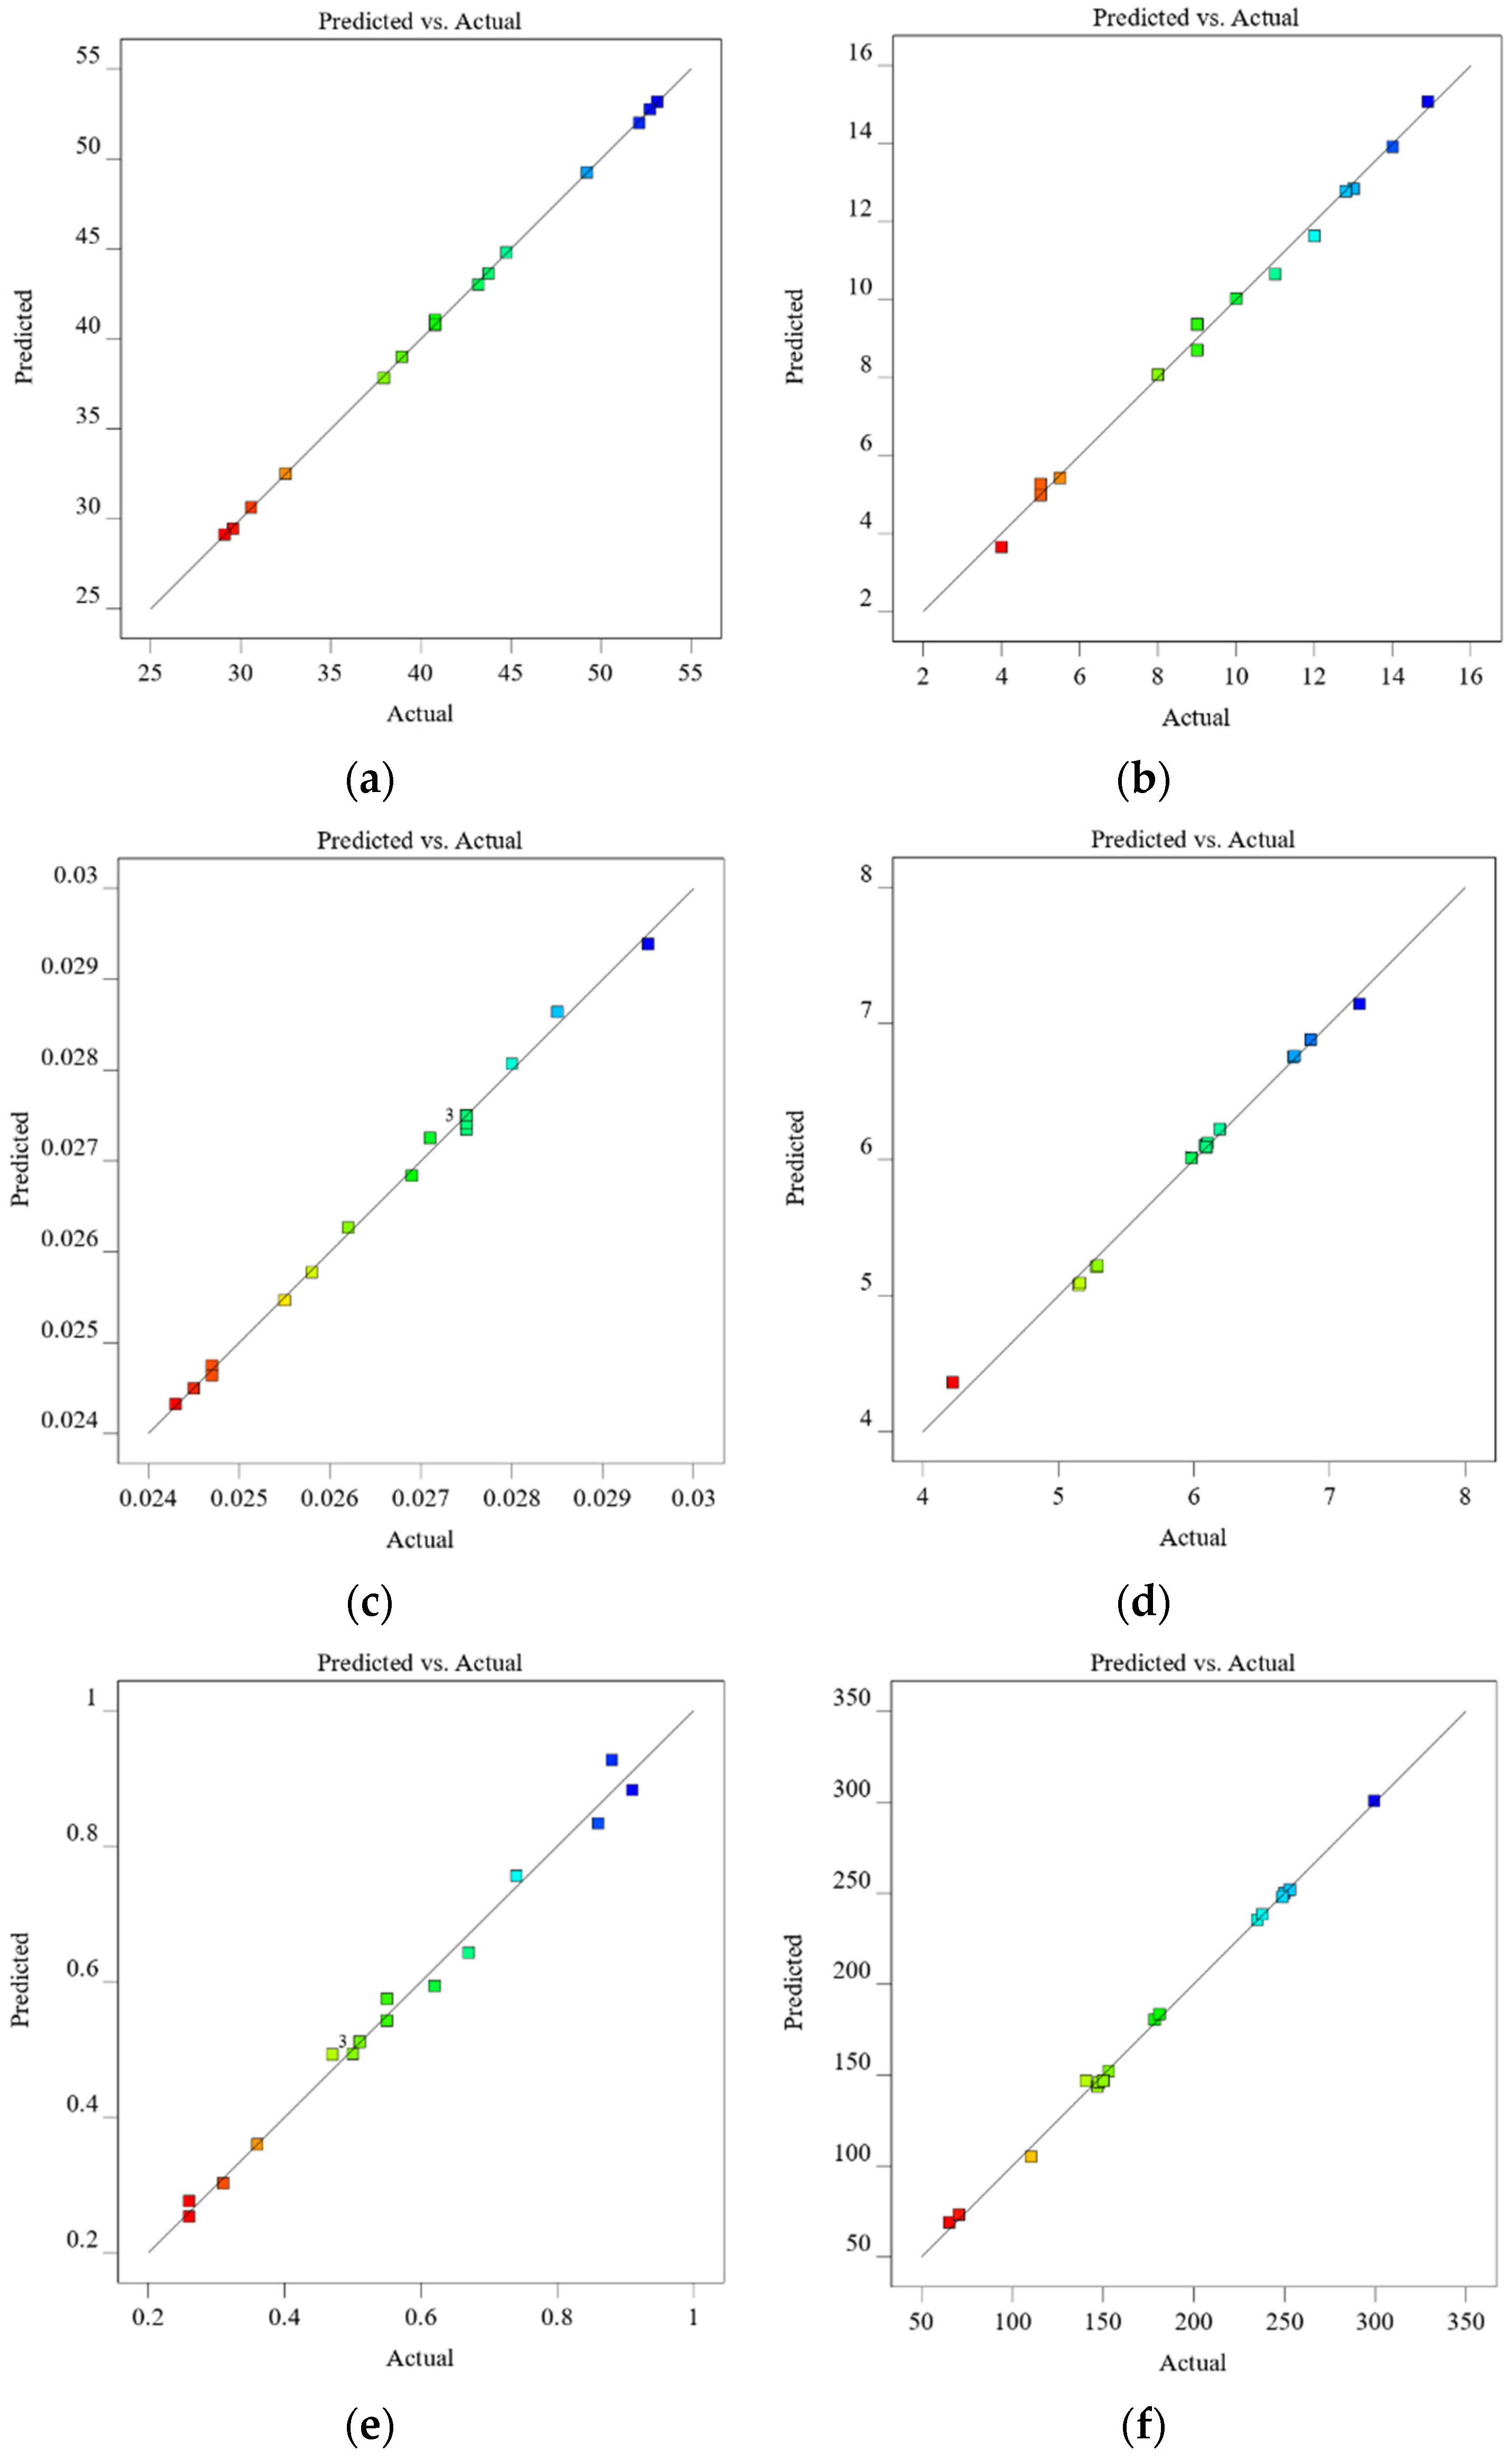
The correlation between the experimental data and the values predicted by the RSM model is illustrated in Figure 7. In all subplots, the alignment of the data points along the first diagonal (45° inclined) line indicates a high degree of correlation between the experimental results and the model’s predicted values. This evidence substantiates the assertion that the RSM model offers consistent and reliable predictions for all analyzed material properties.
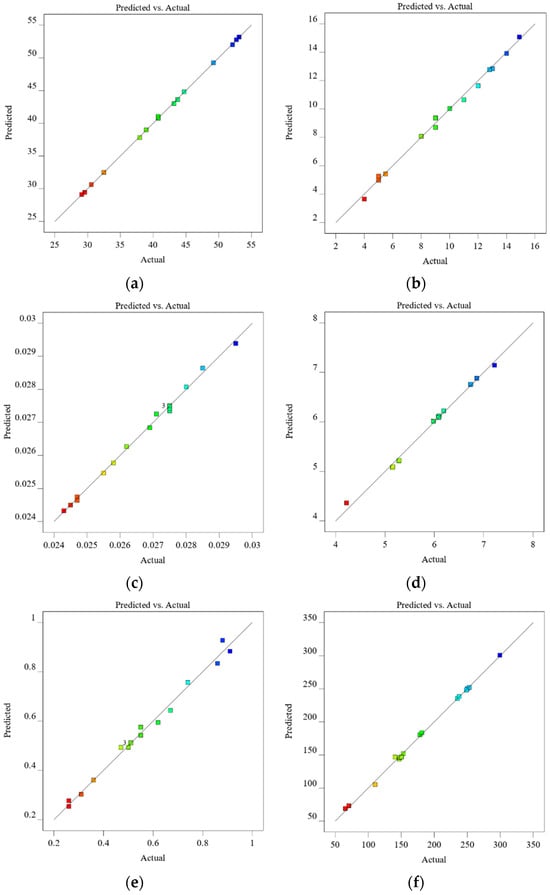
Figure 7.
Comparison of experimental data with RSM model values for (a) bulk density, (b) Shore A hardness, (c) thermal conductivity, (d) dielectric constant, (e) tensile strength and (f) strain.
The statistical analysis results presented in Table 7 demonstrate a high degree of correlation between the experimental data and the values predicted by the RSM model. For all material properties, the coefficient of determination (R2) ranges between 0.9896 and 0.9998, while the adjusted R2 and predicted R2 values are similarly high, thereby confirming the accuracy and reliability of the model. The low standard deviation and coefficient of variation (C.V. %) indicate that the model is both consistent and stable. It is noteworthy that the error rates for bulk density and thermal conductivity are exceptionally low, which serves to illustrate the precision of the model with respect to these properties. Moreover, the elevated adequate precision values indicate a robust signal-to-noise ratio, substantiating the model’s capacity to generate dependable projections. In conclusion, the results demonstrate that the model accurately represents the experimental data and exhibits high predictive performance.
Table 7.
Statistical evaluation of experimental data and RSM model predictions.
3.6. FT-IR Spectra Results
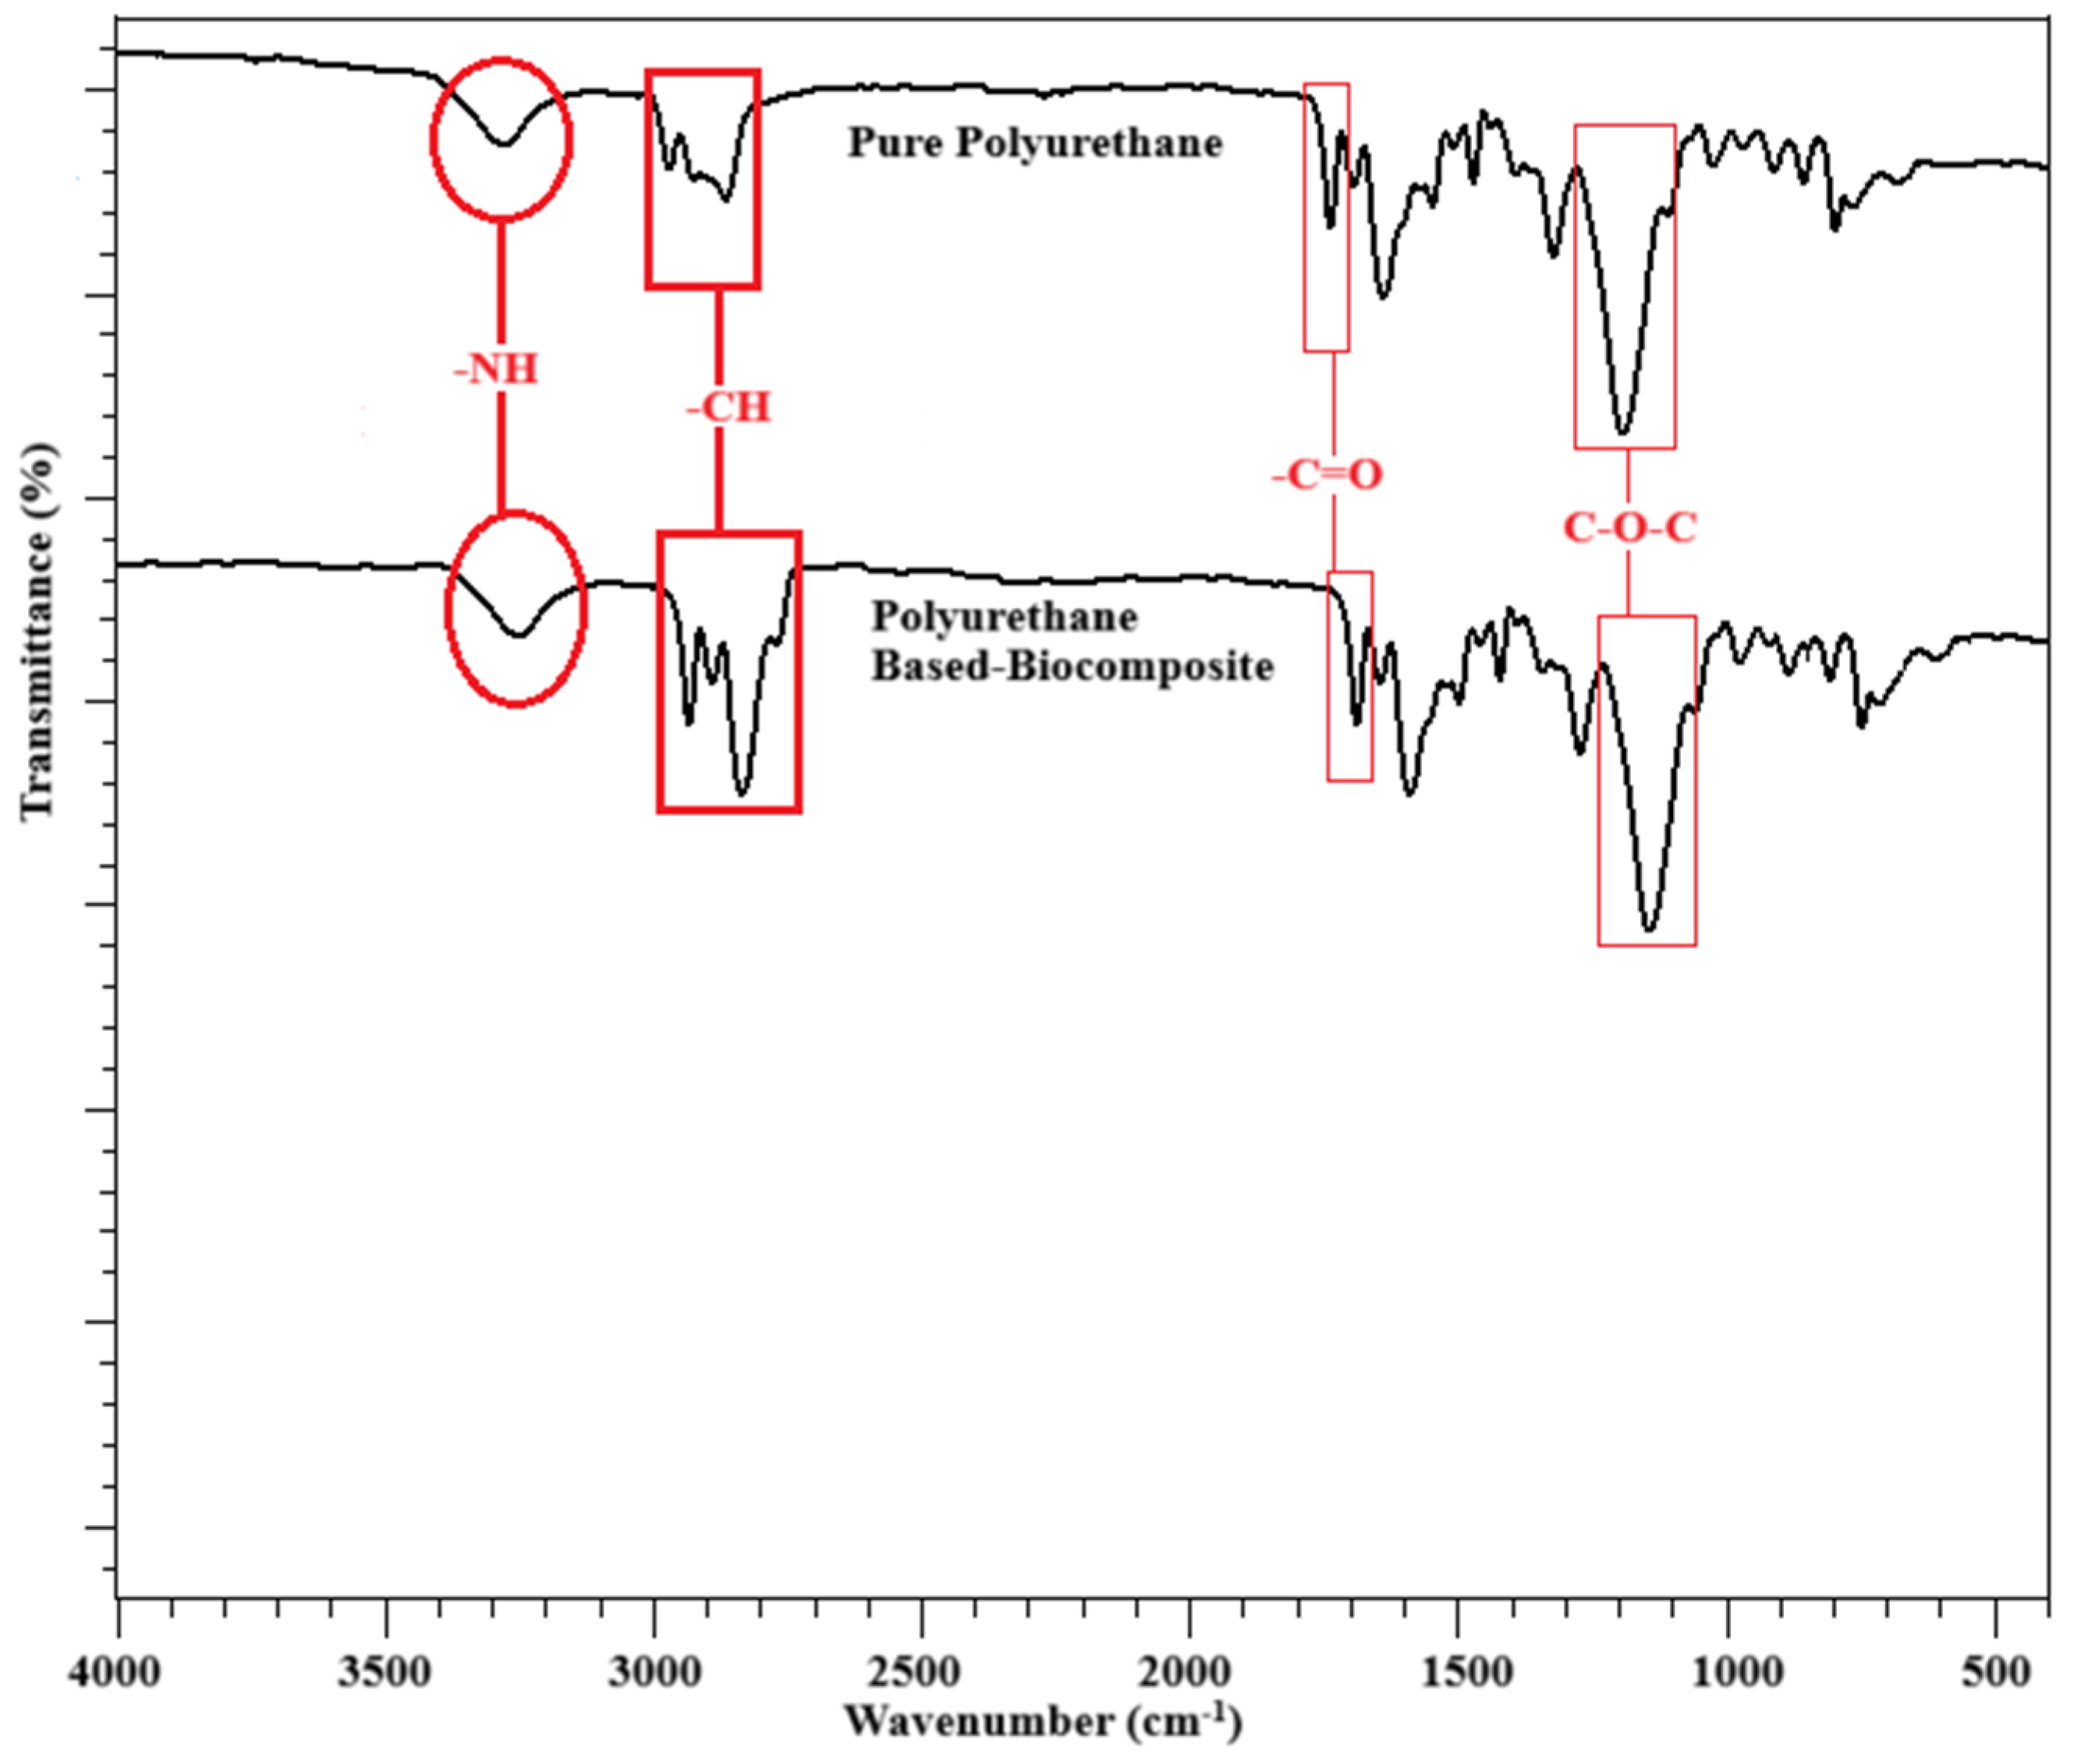
The FT-IR spectra of polyurethane and polyurethane-based biocomposites provide valuable information about their chemical structures and functional group interactions. Figure 8 shows the FTIR spectra of pure (without additive) and 2.5 wt.% HSO-reinforced polyurethane-based biocomposites. In the provided spectra, both pure polyurethane and the biocomposite exhibit characteristic peaks that correspond to various functional groups. The broad peak observed in the 3250–3450 cm−1 range represents N–H stretching vibration, confirming the presence of urethane bonds (NH–COO). This peak also indicates hydrogen bonding interactions between hard segments in the polyurethane structure. Additionally, the peaks around 2850–3000 cm−1 correspond to–CH group stretching vibrations from the alkyl groups present in the polymer backbone. These peaks are essential for identifying the core components involved in the polyurethane matrix. Further analysis of the spectra shows a strong peak around 1700–1720 cm−1, attributed to C=O stretching vibrations from the urethane carbonyl groups. This peak serves as a primary indicator of urethane bond formation. In the spectra, the intensity of the carbonyl stretching peak can change depending on the interaction between hard segments (C=O groups) and hydrogen-bonded N–H groups, which influences the mechanical properties and thermal stability of the material. In addition, the C–O–C stretching vibrations in the range of 1100–1150 cm−1, corresponding to the ether linkages from the polyol segments, are more pronounced in the spectra, suggesting modifications due to the incorporation of reinforcing agents. In polyurethane, the disappearance of isocyanate and hydroxyl group peaks indicates that the chemical reaction is proceeding efficiently. The absence of isocyanate peaks at wavelengths of 2250–2270 cm−1 and a decrease in hydroxyl group absorbance around 3300–3600 cm−1 confirm that the polymerization process is complete. This is an important indicator of successful synthesis and high reaction efficiency in polyurethane production.
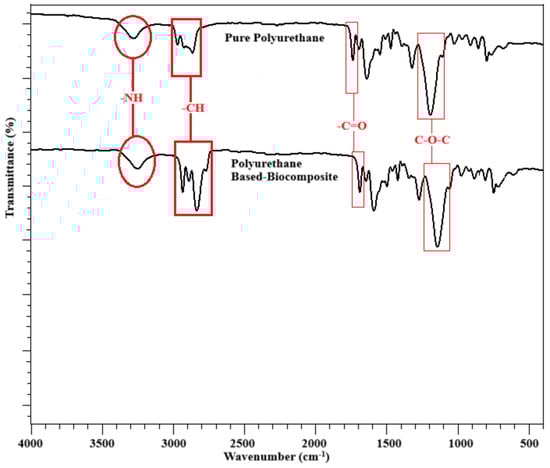
Figure 8.
FT-IR spectra of pure and HSO-reinforced polyurethane based-biocomposites.
3.7. Microscopic Images
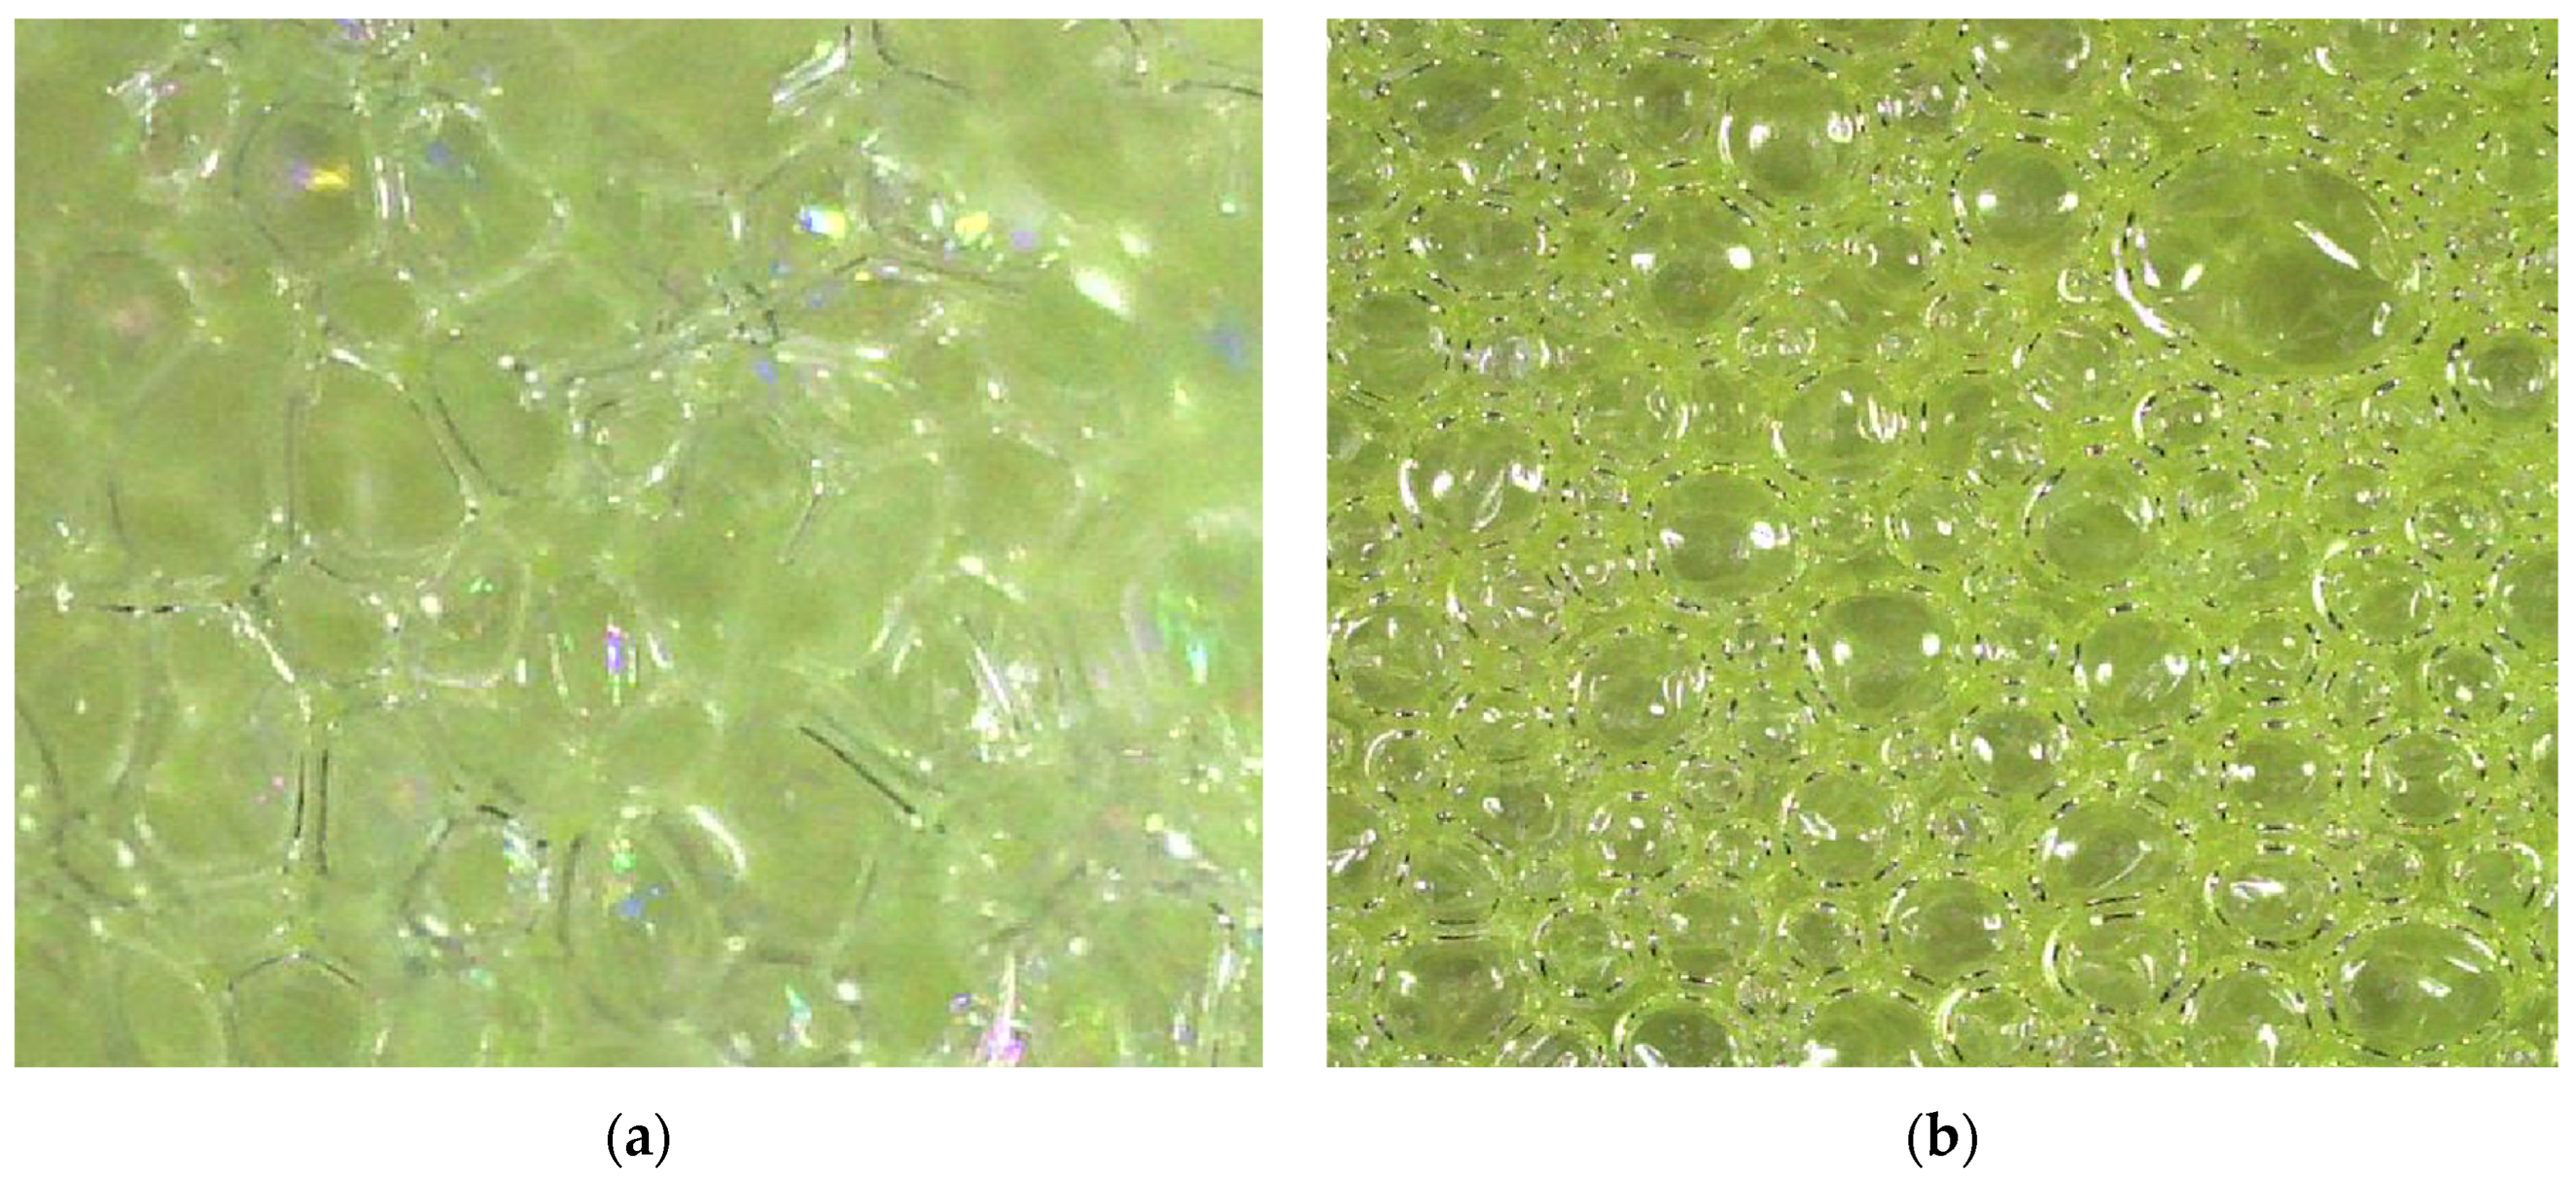
The microscopic images of pure polyurethane typically display a homogeneous structure, wherein the configuration of the hard and soft segments determines the polymer’s morphology. At the microscopic scale, this often manifests as a uniform distribution. In pure polyurethane structures, phase separation may occur, whereby microdomains comprising a high concentration of hard segments and amorphous regions formed by soft segments are readily discernible. This phase separation is of great consequence for the material’s mechanical properties, frequently manifesting as irregular textures under microscopic examination. Moreover, the morphology may vary depending on the production process and the degree of crosslinking, exhibiting a range from a smooth surface structure to a slightly rough texture (Figure 9a). In polyurethane composites reinforced with HSO, microscopic images demonstrate a more intricate morphology, shaped by the integration and distribution of the reinforcement material within the matrix. The incorporation of natural oil-based components, such as HSO, frequently results in the formation of a heterogeneous structure. Microscopic examination may reveal contrast variations within the matrix resulting from phase separation of the oil or clustering of filler particles. If the oil is well dispersed, the images will display a more uniform structure. In contrast, inadequate dispersion may result in the formation of irregular voids or clusters (Figure 9b). Moreover, the quality of the bond between the oil and the matrix has a significant impact on the interfacial properties, which can be observed in microscopic images. These interfacial features are of pivotal importance in determining the mechanical performance of the material. The integration of the reinforcement within the composite material is of great consequence, as it determines the strength and durability of the composite. Conversely, a lack of bonding can result in structural weaknesses.
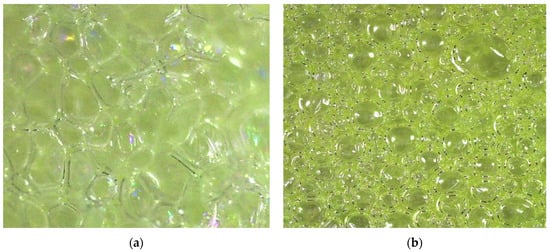
Figure 9.
Microscope images of (a) pure polyurethane and (b) HSO-reinforced biocomposite.
4. Discussion
This study examines the effects of CPP, HSO, and MDI contents on the material properties of polyurethane-based biocomposite materials in great detail. The findings indicated that each of these factors exerts a considerable and robust influence on the physical, mechanical, thermal, and dielectric properties of the biocomposites.
Initially, it was determined that CPP exerts a predominant influence on material properties, including density and hardness. An increase in CPP content resulted in a notable enhancement in the density and Shore A hardness of the biocomposites, whereas the impact of HSO on these properties was comparatively less pronounced. CPP was identified as a critical component in the optimization of material hardness through an increase in density. Conversely, the rise in HSO concentration had a restricted impact on density but demonstrated a declining effect on Shore A hardness. This was attributed to the formation of a more flexible structure within the polyurethane matrix.
Thermal conductivity analyses demonstrated that HSO is the primary factor responsible for enhancing thermal conductivity. However, an increase in CPP content resulted in a reduction in the conductivity coefficient, thereby offering a suitable design parameter for applications that require energy efficiency. These findings underscore the necessity for meticulous regulation of the CPP and HSO ratios to achieve optimal thermal performance in biocomposites.
With regard to dielectric properties, it was observed that the polar structure of HSO increased the dielectric constant, whereas CPP, due to its low polarity, decreased this property. These findings suggest that a balance between the HSO and CPP ratios is necessary to achieve optimal dielectric properties.
With regard to the mechanical properties, particularly tensile strength and strain, it was observed that an increase in HSO content resulted in enhanced elasticity but a reduction in strength. Conversely, an increase in CPP content was observed to enhance tensile strength, thereby improving the mechanical performance of the material. However, it was recognized that the CPP and HSO ratios must be meticulously optimized in order to achieve optimal mechanical properties.
The results of the ANOVA indicated that the CPP, HSO, and MDI factors had a significant effect on the majority of properties, and the models used demonstrated a high degree of fit to the dataset. In particular, both linear and second-order effects of CPP and HSO were found to exert a significant influence on the properties of the biocomposites. Nevertheless, the potential for synergistic interactions between the factors was found to be limited.
In conclusion, the findings of this study indicate that the careful control of CPP and HSO ratios during the production of polyurethane-based biocomposites is a crucial factor in achieving optimal material properties. The findings of this study enhance the applicability of biocomposites in industrial applications that require optimization of energy efficiency, mechanical performance, and dielectric properties. Further research should concentrate on the effects of additional additives at varying ratios in order to enhance the performance of biocomposite materials.
Author Contributions
Conceptualization and methodology, E.A.; data curation, resources, formal analysis, validation, and original draft preparation, C.Y.; software, visualization, writing—review and editing, and project administration, C.K. All authors have read and agreed to the published version of the manuscript.
Funding
This research was funded by [Fırat University, Scientific Research Projects Supporting Unit] grant number [MF.24.120] And The APC was funded by [Fırat University, Scientific Research Projects Supporting Unit].
Data Availability Statement
The data presented in this study are available on request from the corresponding author.
Acknowledgments
We would like to express our gratitude to Fırat University for their invaluable support throughout the study.
Conflicts of Interest
The authors declare no conflicts of interest.
References
- Sharma, B.K.; Adhvaryu, A.; Liu, Z.; Erhan, S.Z. Chemical modification of vegetable oils for lubricant applications. J. Am. Oil Chem. Soc. 2006, 83, 129–136. [Google Scholar] [CrossRef]
- Kamarudin, S.H.; Abdullah, L.C.; Aung, M.M.; Ratnam, C.T.; Jusoh @ Talib, E.R. A study of mechanical and morphological properties of PLA based biocomposites prepared with EJO vegetable oil based plasticiser and kenaf fibres. Mater. Res. Express 2018, 5, 85314. [Google Scholar] [CrossRef]
- Dinu, R.; Bejenari, I.; Volf, I.; Mija, A. Vegetable Oil-Based Resins Reinforced with Spruce Bark Powder and with Its Hydrochar Lignocellulosic Biomass. Appl. Sci. 2021, 11, 10649. [Google Scholar] [CrossRef]
- Veldsink, J.W.; Bouma, M.J.; Schöön, N.H.; Beenackers, A.A.C.M. Heterogeneous Hydrogenation of Vegetable Oils: A Literature Review. Catal. Rev. 1997, 39, 253–318. [Google Scholar] [CrossRef]
- Troncoso, F.D.; Tonetto, G.M. Highly stable platinum monolith catalyst for the hydrogenation of vegetable oil. Chem. Eng. Process.—Process Intensif. 2022, 170, 108669. [Google Scholar] [CrossRef]
- Wang, W.; Duong-Viet, C.; Truong-Phuoc, L.; Nhut, J.-M.; Vidal, L.; Pham-Huu, C. Activated carbon supported nickel catalyst for selective CO2 hydrogenation to synthetic methane under contactless induction heating. Catal. Today 2023, 418, 114073. [Google Scholar] [CrossRef]
- Toshtay, K. Liquid-phase hydrogenation of sunflower oil over platinum and nickel catalysts: Effects on activity and stereoselectivity. Results Eng. 2024, 21, 101970. [Google Scholar] [CrossRef]
- Fiore, A.M.; Romanazzi, G.; Leonelli, C.; Mastrorilli, P.; Dell’Anna, M.M. Partial Hydrogenation of Soybean and Waste Cooking Oil Biodiesel over Recyclable-Polymer-Supported Pd and Ni Nanoparticles. Catalysts 2022, 12, 506. [Google Scholar] [CrossRef]
- Gondim, F.F.; Rodrigues, J.G.; Aguiar, V.O.; de Fátima Vieira Marques, M.; Monteiro, S.N. Biocomposites of Cellulose Isolated from Coffee Processing By-Products and Incorporation in Poly(Butylene Adipate-Co-Terephthalate) (PBAT) Matrix: An Overview. Polymers 2024, 16, 314. [Google Scholar] [CrossRef]
- Karmakar, G.; Ghosh, P.; Kohli, K.; Sharma, B.K.; Erhan, S.Z. Chemicals from Vegetable Oils, Fatty Derivatives, and Plant Biomass. In Innovative Uses of Agricultural Products and Byproducts; ACS Symposium Series; American Chemical Society: Washington, DA, USA, 2020; Volume 1347, p. 1. ISBN 9780841237155. [Google Scholar] [CrossRef]
- Chieng, B.W.; Chieng, B.W.; Ibrahim, N.A.; Ibrahim, N.A.; Loo, Y.Y. Bioplasitcizer Epoxidized Vegetable Oils–Based Poly(Lactic Acid) Blends and Nanocomposites. In Handbook of Composites from Renewable Materials; John Wiley & Sons: Hoboken, NJ, USA, 2017; pp. 205–231. ISBN 9781119441632. [Google Scholar] [CrossRef]
- Uppar, R.; Dinesha, P.; Kumar, S. A critical review on vegetable oil-based bio-lubricants: Preparation, characterization, and challenges. Environ. Dev. Sustain. 2023, 25, 9011–9046. [Google Scholar] [CrossRef]
- Estevez, R.; López-Tenllado, F.J.; Montes, V.; Romero, A.A.; Bautista, F.M.; Luna, D. Characterization of Several 2-Ethylhexyl Nitrates with Vegetable Oil (Castor or Sunflower Oil) Blends in Triple Blends with Diesel, Working as Advanced Biofuels in C.I. Diesel Engines. Appl. Sci. 2024, 14, 11968. [Google Scholar] [CrossRef]
- Nibin, M.; Varuvel, E.G.; JS, F.J.; Vikneswaran, M. Evaluation of wheat germ oil biofuel in diesel engine with hydrogen, bioethanol dual fuel and fuel ionization strategies. Int. J. Hydrogen Energy 2024, 59, 889–902. [Google Scholar] [CrossRef]
- Viar, N.; Requies, J.M.; Agirre, I.; Iriondo, A.; García-Sancho, C.; Arias, P.L. HMF hydrogenolysis over carbon-supported Ni–Cu catalysts to produce hydrogenated biofuels. Energy 2022, 255, 124437. [Google Scholar] [CrossRef]
- He, Y.; Liu, R.; Yellezuome, D.; Peng, W.; Tabatabaei, M. Upgrading of biomass-derived bio-oil via catalytic hydrogenation with Rh and Pd catalysts. Renew. Energy 2022, 184, 487–497. [Google Scholar] [CrossRef]
- Al-kahtani, M.S.M.; Zhu, H.; Ibrahim, Y.E.; Haruna, S.I.; Al-qahtani, S.S.M. Study on the Mechanical Properties of Polyurethane-Cement Mortar Containing Nanosilica: RSM and Machine Learning Approach. Appl. Sci. 2023, 13, 13348. [Google Scholar] [CrossRef]
- Aydoğmuş, E.; Arslanoğlu, H.; Dağ, M. Production of waste polyethylene terephthalate reinforced biocomposite with RSM design and evaluation of thermophysical properties by ANN. J. Build. Eng. 2021, 44, 103337. [Google Scholar] [CrossRef]
- Veza, I.; Spraggon, M.; Fattah, I.M.R.; Idris, M. Response surface methodology (RSM) for optimizing engine performance and emissions fueled with biofuel: Review of RSM for sustainability energy transition. Results Eng. 2023, 18, 101213. [Google Scholar] [CrossRef]
- Abioye, K.J.; Harun, N.Y.; Arshad, U.; Sufian, S.; Yusuf, M.; Jagaba, A.H.; Ighalo, J.O.; Al-Kahtani, A.A.; Kamyab, H.; Kumar, A.; et al. Response surface methodology and artificial neural network modelling of palm oil decanter cake and alum sludge co-gasification for syngas (CO+H2) production. Int. J. Hydrogen Energy 2024, 84, 200–214. [Google Scholar] [CrossRef]
- Saelee, M.; Sivamaruthi, B.S.; Tansrisook, C.; Duangsri, S.; Chaiyasut, K.; Kesika, P.; Peerajan, S.; Chaiyasut, C. Response Surface Methodological Approach for Optimizing Theobroma cacao L. Oil Extraction. Appl. Sci. 2022, 12, 5482. [Google Scholar] [CrossRef]
- Kim, I.; Ha, J.-H.; Jeong, Y. Optimization of Extraction Conditions for Antioxidant Activity of Acer tegmentosum Using Response Surface Methodology. Appl. Sci. 2021, 11, 1134. [Google Scholar] [CrossRef]
- Gabrovska, M.; Nikolova, D.; Radonjić, V.; Karashanova, D.; Baeva, A.; Parvanova-Mancheva, T.; Tzvetkov, P.; Petrova, E.; Zarkova, G.; Krstić, J. Structure Engineering of Ni/SiO2 Vegetable Oil Hydrogenation Catalyst via CeO2. Int. J. Mol. Sci. 2024, 25, 7585. [Google Scholar] [CrossRef]
- Spiekermann, M.L.; Seidensticker, T. Catalytic processes for the selective hydrogenation of fats and oils: Reevaluating a mature technology for feedstock diversification. Catal. Sci. Technol. 2024, 14, 4390–4419. [Google Scholar] [CrossRef]
- Karabulut, I.; Kayahan, M.; Yaprak, S. Determination of changes in some physical and chemical properties of soybean oil during hydrogenation. Food Chem. 2003, 81, 453–456. [Google Scholar] [CrossRef]
- Li, M.; Fu, J.; Xing, S.; Yang, L.; Zhang, X.; Lv, P.; Wang, Z.; Yuan, Z. A novel catalyst with variable active sites for the direct hydrogenation of waste oils into jet fuel. Appl. Catal. B Environ. 2020, 260, 118114. [Google Scholar] [CrossRef]
- Shin, H.-W.; Hwang, J.-H.; Kim, E.-A.; Hong, T.-W. Evaluation of Hydrogenation Kinetics and Life Cycle Assessment on Mg2NiHx–CaO Composites. Materials 2021, 14, 2848. [Google Scholar] [CrossRef]
- Patterson, H.B.W. Chapter 8—Hydrogenation Methods; List, G.R., King, J.W.B.T.-H., Second, E., Eds.; AOCS Press: Hoboken, NJ, USA, 2011; pp. 189–278. ISBN 978-1-893997-93-6. [Google Scholar] [CrossRef]
- Dağ, M.; Aydoğmuş, E.; Yalçin, Z.G.; Arslanoğlu, H. Diatomite reinforced modified safflower oil-based epoxy biocomposite production: Optimization with RSM and assessment of outcomes by ANN. Mater. Today Commun. 2023, 35, 106327. [Google Scholar] [CrossRef]
- Gu, R.; Sain, M. Biobased Polyurethanes. In Handbook of Green Materials; Materials and Energy; World Scientific: Singapore, 2013; Volume 5, pp. 77–87. ISBN 978-981-4566-45-2. [Google Scholar] [CrossRef]
- Brzeska, J.; Piotrowska-Kirschling, A. A Brief Introduction to the Polyurethanes According to the Principles of Green Chemistry. Processes 2021, 9, 1929. [Google Scholar] [CrossRef]
- Adedeji, J.A.; Tetteh, E.K.; Amo-Duodu, G.; Armah, E.K.; Rathilal, S.; Chetty, M. Central Composite Design Optimisation of Banana Peels/Magnetite for Anaerobic Biogas Production from Wastewater. Appl. Sci. 2022, 12, 12037. [Google Scholar] [CrossRef]
- ASTM D638-22; Standard Test Method for Tensile Properties of Plastics. ASTM International: West Conshohocken, PA, USA, 2022.
- ASTM D2240-15; Standard Test Method for Rubber Property—Durometer Hardness. ASTM International: West Conshohocken, PA, USA, 2015.
- ASTM D5334-14; Standard Test Method for Determination of Thermal Conductivity of Soil and Soft Rock by Thermal Needle Probe Procedure. ASTM International: West Conshohocken, PA, USA, 2014.
- ASTM D150-20; Standard Test Method for AC Loss Characteristics and Permittivity (Dielectric Constant) of Solid Electrical Insulation. ASTM International: West Conshohocken, PA, USA, 2020.
- Afzal, G.; Rasool, T. Green synthesis of graphene oxide from invasive plant species (Nymphaeaceae) for enhancing cement paste microstructure and compressive strength. Bioresour. Technol. Rep. 2024, 28, 102005. [Google Scholar] [CrossRef]


Disclaimer/Publisher’s Note: The statements, opinions and data contained in all publications are solely those of the individual author(s) and contributor(s) and not of MDPI and/or the editor(s). MDPI and/or the editor(s) disclaim responsibility for any injury to people or property resulting from any ideas, methods, instructions or products referred to in the content. |
© 2025 by the authors. Licensee MDPI, Basel, Switzerland. This article is an open access article distributed under the terms and conditions of the Creative Commons Attribution (CC BY) license (https://creativecommons.org/licenses/by/4.0/).