Article

Relationship Between Isometric Mid-Thigh Pull Force, Sprint Acceleration Mechanics and Performance in National-Level Track and Field Athletes

School of Physical Education & Sport Science, National & Kapodistrian University of Athens, 17237 Athens, Greece
*
Author to whom correspondence should be addressed.
Appl. Sci. 2025, 15(3), 1089; https://doi.org/10.3390/app15031089
Submission received: 10 December 2024 / Revised: 14 January 2025 / Accepted: 20 January 2025 / Published: 22 January 2025
(This article belongs to the Special Issue Innovative Technologies for and Approaches to Sports Performance)

Abstract

:
This study aimed to examine the relationships between isometric mid-thigh pull maximal force (IMTPF), sprint mechanics, and performance. Fifteen national-level track and field athletes (sprinters and hurdlers) performed three maximal-effort isometric mid-thigh pulls on a force plate and two 30 m sprints. The IMTPF, the sprint mechanical variables (theoretical maximum horizontal force (F0), velocity (v0), and power (Pmax)), as well as the sprint performance data at 5 m distance intervals, were collected. Pearson’s product–moment correlation analysis revealed large linear associations between IMTPF and v0 (r = 0.65, R2 = 0.42, p = 0.009), as well as negative linear relationships between IMTPF and sprint times of 15 m (r = −0.53, R2 = 0.28, p = 0.043), 20 m (r = −0.55, R2 = 0.30, p = 0.033), 25 m (r = −0.57, R2 = 0.33, p = 0.025), and 30 m (r = −0.60, R2 = 0.36, p = 0.019). The F0, Pmax, and sprint times to 5 m and 10 m were not significantly correlated with the IMTPF (p < 0.05). The study results highlight that during the late acceleration phase (>15 m), the capacity to generate horizontal force at high running velocities is related to the ability to develop maximal force during isometric contractions.

1. Introduction

Sprinting is a maximal speed cyclic locomotion mode and is a critical physical factor of performance in many individual and team sports. Sprinting performance can be divided into three primary phases, as follows: acceleration, maximum velocity and deceleration [1]. A successful acceleration phase is dependent on the ability to generate and apply high horizontally oriented forces into the ground, during the support phase, at various velocities [2]. The acceleration phase can in turn be segregated into early, middle, and late subsections [3,4]. The early acceleration phase corresponds to 1–3 steps, the middle phase to 5–15 steps, and the late phase to 16–28 steps, based on the average height of the athletes’ center of gravity during the support phase of the step cycle [3]. The early phase is mechanically characterized by long contact times, enabling the generation of a high level of horizontal force applied at low running velocity. The middle phase, or transition phase, is characterized by a reduction in contact times, resulting in a notable decrease in horizontal force production. The late acceleration phase is characterized by shorter contact times, compared to the previous phases, enabling the production of a lower level of horizontal force applied at a considerably higher running velocity [2]. It is known that during the acceleration phase, an athlete’s expression of strength demonstrates notable variations. For instance, lower limb power assessed through squat jumps and countermovement jumps exhibits a significant association with the early acceleration phase. In contrast, reactive strength evaluated via repeated ankle jumps shows a significant correlation with the late acceleration phase [5]. The overall capacity to generate horizontal force during sprint acceleration motion is effectively characterized by the sprint mechanical profile [6,7], which has been widely used to identify the mechanical capabilities of the neuromuscular system that underpins sprint acceleration performance [8,9,10,11]. The variables that define the sprint mechanical profile include the theoretical maximum horizontal force (F0), which represents the initial push exerted by the athlete onto the ground during sprint acceleration; the theoretical maximum horizontal velocity (v0), which denotes the maximum velocity the athlete could theoretically achieve if mechanical resistances to movement were absent, and also reflects the ability to produce horizontal force at high running velocities; and the theoretical maximum horizontal power (Pmax), which represents the peak combination of force and velocity attained during sprint acceleration [12].
A sprinter’s maximal force production and capacity to rapidly express forces are essential factors contributing to their efficiency in the acceleration phases [13]. Multi-joint isometric assessments such as the isometric mid-thigh pull (IMTP) are commonly used to evaluate the maximum force produced and the force–time capabilities of athletes [14]. Peak force is the most common and reliable measure obtained during IMTP [15], as it reflects maximal strength during an isometric voluntary contraction [16]. The maximum force produced by the lower limbs occurs after 300 ms [17]. Several studies have examined the relationship between IMTP peak force (IMTPF) and sprinting performance. Specifically, Mason et al. [18] showed a large association between IMTPF and the maximum running velocity phase (r = 0.57) in professional soccer players. Additionally, Thomas et al. [19] found a strong negative relationship between IMTPF and sprint times of 5 m (r = −0.57) and 20 m (r = −0.69) in male collegiate soccer and rugby athletes. In addition, Townsend et al. [20] found a strong negative correlation between IMTPF and 0–5 m, 0–10 m, 0–15 m, and 0–20 m sprint acceleration performances (r = −0.62, r = −0.67, r = −0.70, r = −0.69, respectively) in professional male and female basketball players. Moreover, Brady et al. [15] found large negative associations between IMTPF and 0–5 m, 10–20 m, and 0–30 m sprint performances (r = −0.63, r = −0.53, r = −0.60, correspondingly) in high-level male sprinters. On the other hand, West et al. [21] reported no significant relationships between IMTPF and sprinting performance in collegiate rugby league players. In contrast, authors observed a weak inverse relationship (r = −0.37) between IMTPF normalized to body mass with 10 m sprint time. Similarly, Scanlan et al. [22] reported moderate correlations between IMTP normalized peak force and 5 m (r = −0.44) and 10 m sprint time (r = −0.45) in male adolescent basketball players. Furthermore, Wang et al. [23] observed no significant correlations between IMTPF and sprint times of 5 m and 10 m in collegiate rugby union players. Finally, another study indicated a lack of correlations between IMTPF and sprint acceleration performance from 0 to 40 m-distance intervals in national- and international-level sprinters [24]. The observed differences in the relationships between IMTPF and acceleration performance may be attributed to the fact that the IMTP primarily assesses the ability to generate force in the vertical direction. However, this may have limited relevance for team sport athletes, who are trained to execute movements in the horizontal, frontal, and transverse planes. Additionally, variations in factors such as contact time, running distance, running posture, surface type, and footwear may also contribute to these differences.
In contrast with the availability of studies documenting the relationships between isometric strength and sprinting performance, few have investigated their relationships with sprint mechanical properties. Townsend et al. [20] found large relationships between IMTPF and average values of force, velocity, and power from 5 to 20 m of sprinting performance (r = 0.48–0.69, 0.50–0.70, and 0.62–0.73, respectively) in basketball players. Moreover, Healy et al. [24] reported a significant relationship between IMTPF and Pmax (r = 0.61) in male sprinters. Nevertheless, the authors indicated an absence of correlation between maximal strength assessments and sprint mechanical characteristics in female sprinters. It remains uncertain whether the ability of elite sprinters to generate and apply horizontal force and power during the specific phases of sprint acceleration is linked to their ability to produce isometric maximal force, as evaluated by the IMTP.
Further observations are warranted to define the relationship of IMTPF assessments in the specific acceleration phases with their underlying mechanical variables. In particular, incorporating mechanical characteristics into the analysis of sprint performance could provide valuable insights for coaches and practitioners, enhancing their understanding of the lower limbs’ maximal force capacities and their relevance to sprint acceleration phases. Therefore, this study aimed to examine the relationships between IMTPF, sprint acceleration performance, and its underpinning mechanical properties in national-level track and field athletes during the competitive period of the season. It was hypothesized that the IMTPF would be related to the sprint acceleration performance and its underpinning mechanical properties.

2. Materials and Methods

2.1. Participants

Fifteen national-level track and field athletes, eight males (mean ± standard deviation (SD): age 26.0 ± 3.4 years; weight 73.2 ± 5.4 kg; stature 1.80 ± 0.06 m) and seven females (age 23.0 ± 3.4 years; weight 59.5 ± 8.4 kg; stature 1.68 ± 0.10 m), volunteered for the present study. The participants were briefed on the study protocol before providing written consent. The protocol was approved by the institution’s Research Ethics Committee, in alignment with the Declaration of Helsinki II. Among the males were four 100 m sprinters, two 200 m sprinters, one 400 m sprinter, and one 110 m hurdler. Among the females, there were five 100 m sprinters and two 100 m hurdlers. All participants were free of physical limitations and musculoskeletal injuries that could compromise testing. Participants were asked to refrain from resistance training at least 24 h before testing procedures. The testing facilities were maintained under consistent environmental conditions, specifically a temperature of 25 °C and a humidity level of 52%.

2.2. Procedures

Participants were involved in two separate testing sessions within the same week. During these sessions, anthropometric measurements, including stature and body mass, were measured. The first session involved the assessment of IMTPF, while 30 m sprint measures were completed in the second session. Before the first testing session, participants visited the laboratory to gain familiarization with the IMTPF assessment protocol.

2.3. Isometric Mid-Thigh Pull

Participants completed a general warm-up, consisting of 3 min of cycling and 10 repetitions of squats, lunges, and glute-bridges. Subsequently, an isometric-specific warm-up was conducted, comprising a 5 s of IMTP bout at a self-directed position at 50%, a 3 s bout at 75%, and a 3 s bout at 90% of maximal effort with 1 min rest between each bout [15]. After the warm-up, participants performed 3 maximal-effort isometric pulls separated by 3 min of recovery. The IMTP was performed with a custom-designed power rack that allows fixation of the steel bar height, with the participants standing on an 80 × 80 cm force plate (WP800, Applied Measurements Ltd. Co., Aldermaston, UK, operating at 1000 Hz). At the start of each trial, participants were positioned in the second-pull phase of the clean, with knee angles set at 141° ± 4° and hip angles set at 138° ± 2° [15]. These angles were verified prior to each trial using a hand-held goniometer. To standardize grip strength, participants utilized lifting straps, and both grip width and foot positioning were standardized across participants [25]. Participants were instructed to maintain a low, steady baseline force at the beginning of each trial in order to avoid precontraction [16] and then directed to exert maximal pulling force for a period of 4 s, initiated by a countdown of “3, 2, 1, Go!” [14]. The duration of the collection period for each trial was established at 12 s, with a baseline measurement obtained during the 3 s countdown preceding the initiation of the pull [15]. Verbal encouragement was provided during each trial. Data from the force plate were collected at a sampling rate of 1000 Hz (Kyowa sensor interface PCD-320A, Chofu, Japan). The signal was then processed using a fourth-order, zero-lag Butterworth low-pass digital filter with a cutoff frequency of 20 Hz. From the force-time data, the highest force value achieved during the 4 s best trial, minus the participant’s body weight in Newtons, was reported as the IMTPF. The contraction onset threshold was established based on five Standard Deviations (SD) above participant’s body weight [26]. The reliability of the IMTP test to measure the maximal force has been examined previously and provided a very high intraclass correlation coefficient (ICC) (ranging from 0.92 to 0.99 with coefficients of variation (CV) >5%) [27].

2.4. 30 m Sprint Test

After their usual warm-up routine, lasting ~30 min, participants performed 2 maximal linear 30 m sprints from a three-point starting position on an indoor track, with a 5 min recovery period between sprints. The temporal data for each sprint were collected using a high-speed camera (Casio EX-F1, Tokyo, Japan, operating at a frequency of 300 Hz). The high-speed camera was mounted on a tripod, positioned perpendicular to the direction of running, and located 10 m from the runway at the midpoint of the sprinting distance (i.e., 15 m). Six poles were positioned at intervals along the 30 m distance to delineate the 5 m split times. The poles were placed at adjusted positions to correct video parallax errors [28]. The onset of the sprint was delineated as the initial propulsive movement of the rear leg emerging from the three-point starting position [29]. The sprint spatiotemporal characteristics in intervals of 5 m were determined from the modeled velocity–time data using Quintic Biomechanics software v31 (Quintic Consultancy Ltd., Birmingham, UK) [30]. The variables of the sprint mechanical profile were determined according to Samozino’s method [6,7]. The Samozino method represents a macroscopic biomechanical model validated for estimating the external horizontal force produced during sprinting. This estimation is achieved by employing an inverse dynamic approach that utilizes the velocity of the center of mass. Specifically, a mono-exponential function is applied to the raw velocity–time data through a custom spreadsheet, wherein a least-squares regression fitting procedure is implemented. This methodology facilitates the calculation of the athlete’s center-of-mass acceleration in the horizontal direction by analyzing the changes in running speed over time. Furthermore, the net horizontal anteroposterior ground reaction forces are assessed by considering the athlete’s body mass and the effects of aerodynamic friction. The theorical maximal horizontal force and velocity (F0 and v0) were extrapolated from the linear force (F) and (v) relationship by determining the intercepts on the F and v axes, respectively, from the linear regressions. By multiplying the horizontal F and v values for each support phase, the Pmax, normalized to body mass, in the forward direction is derived. It is calculated using the formula P m a x = F 0 . v 0 4 [6,7].

2.5. Statistical Analysis

Data are expressed as means ± SD. The normality of distribution (Shapiro–Wilks test and Q–Q plot analysis) was checked before analyses. The best trial based on IMTPF and 30 m sprint time was selected for analysis. Relationships between IMTPF, sprint acceleration performance (time to 5 m, 10 m, 15 m, 20 m, 25 m, and 30 m) and underlying mechanical properties (F0, v0, and Pmax) were analyzed using Pearson product–moment correlation coefficients (r), which were conducted through SPSS software (version 28.0, IBM Corp., Armonk, NY, USA). To assess the relative strength of the relationship, the scale modified by Hopkins et al. [31] was used—trivial (<0.1), small (r = 0.1–0.3), moderate (0.3–0.49), large (0.5–0.69), very large (0.7–0.89) and nearly perfect (>0.9). The criterion for statistical significance was considered as p ≤ 0.05.

3. Results

Descriptive statistics and qualitative interpretations of the Pearson’s correlation between IMTP assessment, sprint mechanical variables, and performance are presented in Table 1. The intraclass correlation coefficient (ICC) between IMTPF and 30 m sprinting performance trials was very high (0.97 and 0.99, respectively).
Pearson’s product-moment correlation analysis revealed large linear associations between IMTPF and v0 (r = 0.65, R2 = 0.42, p = 0.009) (Figure 1). In addition, IMTPF demonstrated large negative linear relationships with sprint times to 15 m (r = −0.53, R2 = 0.28, p = 0.043), 20 m (r = −0.55, R2 = 0.30, p = 0.033), 25 m (r = −0.57, R2 = 0.33, p = 0.025), and 30 m (r = −0.60, R2 = 0.36, p = 0.036) (Figure 2). The F0, Pmax, and sprint times to 5 m and 10 m were not significantly related to IMTPF (r = 0.20, R2 = 0.04, p = 0.474; r = 0.44, R2 = 0.19, p = 0.102; r = −0.38, R2 = 0.14, p = 0.169; r = −0.50, R2 = 0.25, p = 0.057, respectively). However, a trend of relationship between IMTPF and time to 10 m (r = −0.50, p = 0.057) was noted.

4. Discussion

The purpose of this study was to explore the relationship between IMTPF, sprint mechanics, and linear acceleration performance. Our main findings revealed large correlations between IMTPF and v0, and moderate to large relationships between IMTPF and sprint times from 15 to 30 m distance intervals, thus supporting the initial hypothesis.
The relationship between IMTPF and the v0 indicates that the maximal vertical force capacity of lower limbs, assessed during isometric contractions, is correlated with the sprint-running maximal velocity capability of the athlete, as well as with the capacity to generate horizontal force at high running velocities, particularly during the late acceleration phase. Furthermore, the observed inverse relationships between IMTPF and sprint acceleration performance further suggest that the capacity to generate peak vertical force may be compromised toward the late acceleration phase (>15 m). Associations between IMTPF and late acceleration performance have previously been reported [15,19,20,21]. In contrast, the variables that represent the early acceleration phase (F0, time to 5 m and 10 m) were not significantly related to IMTPF. The latter may be attributed by the differences in the orientation of the force vector during the early and late acceleration phases. Specifically, the early and late acceleration phases differ in the generation and application of horizontal and vertical forces. During the early acceleration phase, the primary focus is on generating high amounts of horizontal force to overcome inertia and propel the body forward. In this phase, only the horizontal component of the total force contributes to the forward displacement of the body mass, meaning the vertical component does not contribute to forward acceleration, though it remains essential for stabilizing the body to keep moving forward [32]. Additionally, the early phase is mechanically characterized by the activation of the knee and hip extensor muscles, in conjunction with the calf muscles, to generate propulsion during the support phase of the step cycle. Moreover, the larger contact time allows for a longer duration of force application, approximately 200 ms, compared to 100 ms during the maximum velocity phase. Conversely, the late acceleration phase is mechanically characterized by an increase in both step length and frequency, accompanied by a continuous rise in running velocity. This higher speed is associated with a reduction in ground contact time, leading to significant changes in kinetic patterns. During this phase, the relative proportion of horizontal to vertical force decreases, and the orientation of the force vector becomes increasingly vertical [2,32]. Kinematically, this transition in force direction could be explained by the decrease in forward trunk lean as velocity increases, ultimately culminating in an almost upright posture [33,34]. These findings are not in line with previous studies that reported relationships between isometric strength and initial sprint performance in male athletes [15,19,20]. However, it is important to note the methodological differences between the current study and the research conducted by Townsend et al. In the aforementioned study, basketball players were allowed to self-select their hip and knee angles in order to assume the second pull weightlifting position [20]. Furthermore, the contact time during the support phase of the step cycle is higher in basketball players compared to sprinters, allowing additional time to develop force. Additionally, Thomas et al. [19] and Brady et al. [15] reported significant relationships only in male athletes. Brady et al. showed that when males and females are analyzed collectively, the sex differences in upper-extremity strength exhibited during isometric pulling may influence the outcomes of the analyses [15,35]. Specifically, females typically exhibit lower upper-body strength than males while pulling (53% of male values) due to physiological factors such as muscle mass [36].
In addition, the study results reveal no significant associations between IMTPF and Pmax. The above indicates that the isometric strength is not related to the maximal power-output capacity of the lower limbs in the horizontal direction during sprint acceleration. This result is not consistent with previous studies that indicated a significant relation of IMTPF and Pmax with average horizontal power [20,24]. However, it is essential to note that there were distinct differences in the underlying mechanical characteristics that influenced sprint performance throughout specific phases of the training year [37]. Specifically, the variables constituting the sprint mechanical profile may be more compromised in relation to the force component of the force–velocity relationship during the preparation training phase, as opposed to the competitive training phase [37,38]. In the current study, all testing procedures were performed during the competitive training period, where the variables of the sprint mechanical profile exhibit a stronger correlation with maximal sprint velocity [37]. The above may also explain the absence of a significant association between isometric strength, F0 and the early sprint acceleration performance. Finally, it should be noted that Pmax is the product of force and velocity, and is calculated as Pmax = F0 × v0/4 [12]. Therefore, the absence of a significant correlation for the F0 may be attributed to the lack of association between Pmax and IMTPF.
The observed magnitude of the correlations between maximal isometric force, sprint mechanical characteristics, and performance suggests that isometric and dynamic strength represent distinct yet complementary neuromuscular domains. While isometric strength primarily reflects an individual’s capacity to generate force without joint movement, dynamic strength in sprinting encompasses a broader range of factors that influence movement and performance. This distinction highlights that maximal isometric force alone may not fully explain sprinting performance, particularly during acceleration phases, where dynamic neuromuscular factors are crucial in enhancing performance. Beyond maximal isometric force, several other key factors influence sprint acceleration phases. These factors include variation in intramuscular and intermuscular motor unit recruitment, which can vary depending on the joint angle and the direction in which force is applied [17]. Another factor is musculoskeletal stiffness, which plays a pivotal role in sprinting performance, as it affects the ability to transfer force effectively between the muscles and the ground. In addition, the stretch-shortening cycle allows for the storage and release of elastic energy that enhances force production and overall movement efficiency in sprinting. Finally, the mechanical efficiency of force application allows the transmission of the generated force into the ground to propel one in the forward direction during sprinting [2,17,32,39,40,41]. Together, these factors contribute to a complex interplay of neuromuscular and mechanical components that affect sprinting acceleration, highlighting that sprint performance cannot be solely predicted by isometric strength, but rather is related to a combination of dynamic and neuromechanical factors that operate across multiple domains. The results of this study emphasize that during the late acceleration phase (>15 m), the capacity to develop force at high running speeds is related to the ability to generate maximal force during isometric contractions. Future research involving the IMTP force–time characteristics may be worthwhile in determining the crucial factors associated with the mechanics underpinning the specific phases of sprint acceleration.

Limitations

The study has several limitations that should be acknowledged. The small sample size (N = 15) may limit the generalizability of the findings and reduce statistical power. Additionally, due to the sample size, the analysis could not differentiate between sexes, which may affect the interpretation of relationships involving upper-extremity strength. However, it is important to note that the participants in this study were high-level track and field athletes competing at the international level, and the data collection occurred during the competitive phase of the season, a period for which there is limited research focused on elite athletes.

5. Conclusions

The results of this study highlight that isometric peak force, assessed via IMTP, is related to the ability to develop horizontal force at high running velocities, as well as to late acceleration performance in national-level track and field athletes, during the competitive training period. Coaches and practitioners might consider implementing the IMTP assessment to evaluate the lower limbs’ maximal force capacities that relate to sprint acceleration phases and their underlying mechanical characteristics. By incorporating IMTP testing into regular athletic evaluations, particularly in the context of elite athletes, coaches can better understand an athlete’s neuromuscular strengths and weaknesses, allowing for more tailored training interventions.

Author Contributions

Writing—original draft, I.S.; data curation, I.S. and M.Z.; writing—review and editing, G.G.A., G.T., C.T. and G.P.P.; supervision, G.P.P. All authors have read and agreed to the published version of the manuscript.

Funding

This research received no external funding.

Institutional Review Board Statement

The study was conducted in accordance with the Declaration of Helsinki, and approved by the Ethics Committee of National and Kapodistrian University of Athens (protocol code 1204/15-07-2020).

Informed Consent Statement

Informed consent was obtained from all subjects involved in the study.

Data Availability Statement

The raw data supporting the conclusions of this article will be made available by the authors on request.

Acknowledgments

Authors would like to thank all the participants who performed voluntarily and enthusiastically their best effort during testing procedures.

Conflicts of Interest

The authors declare no conflicts of interest.

References

  1. Mero, A.; Komi, P.V.; Gregor, R.J. Biomechanics of Sprint Running. A Review. Sports Med. 1992, 13, 376–392. [Google Scholar] [CrossRef]
  2. Morin, J.-B.; Bourdin, M.; Edouard, P.; Peyrot, N.; Samozino, P.; Lacour, J.-R. Mechanical Determinants of 100-m Sprint Running Performance. Eur. J. Appl. Physiol. 2012, 112, 3921–3930. [Google Scholar] [CrossRef] [PubMed]
  3. Nagahara, R.; Matsubayashi, T.; Matsuo, A.; Zushi, K. Kinematics of Transition during Human Accelerated Sprinting. Biol. Open 2014, 3, 689–699. [Google Scholar] [CrossRef]
  4. Jiménez-Reyes, P.; van den Tillaar, R.; Castaño-Zambudio, A.; Gleadhill, S.; Nagahara, R. Understanding Sprint Phase-Specific Training Stimuli: A Cluster Analysis Approach to Overload Conditions. Front. Sports Act Living 2024, 6, 1510379. [Google Scholar] [CrossRef] [PubMed]
  5. Nagahara, R.; Naito, H.; Miyashiro, K.; Morin, J.B.; Zushi, K. Traditional and Ankle-Specific Vertical Jumps as Strength-Power Indicators for Maximal Sprint Acceleration. J. Sports Med. Phys. Fitness 2014, 54, 691–699. [Google Scholar] [PubMed]
  6. Samozino, P.; Rabita, G.; Dorel, S.; Slawinski, J.; Peyrot, N.; Saez de Villarreal, E.; Morin, J.-B. A Simple Method for Measuring Power, Force, Velocity Properties, and Mechanical Effectiveness in Sprint Running. Scand. J. Med. Sci. Sports 2016, 26, 648–658. [Google Scholar] [CrossRef]
  7. Morin, J.-B.; Samozino, P.; Murata, M.; Cross, M.R.; Nagahara, R. A Simple Method for Computing Sprint Acceleration Kinetics from Running Velocity Data: Replication Study with Improved Design. J. Biomech. 2019, 94, 82–87. [Google Scholar] [CrossRef] [PubMed]
  8. Stavridis, I.; Ekizos, A.; Zisi, M.; Agilara, G.-O.; Tsolakis, C.; Terzis, G.; Paradisis, G. The Effects of Heavy Resisted Sled Pulling on Sprint Mechanics and Spatiotemporal Parameters. J. Strength Cond. Res. 2023, 37, 2346–2353. [Google Scholar] [CrossRef] [PubMed]
  9. Lahti, J.; Jiménez-Reyes, P.; Cross, M.R.; Samozino, P.; Chassaing, P.; Simond-Cote, B.; Ahtiainen, J.; Morin, J.-B. Individual Sprint Force-Velocity Profile Adaptations to In-Season Assisted and Resisted Velocity-Based Training in Professional Rugby. Sports 2020, 8, 74. [Google Scholar] [CrossRef]
  10. Haugen, T.A.; Breitschädel, F.; Seiler, S. Sprint Mechanical Variables in Elite Athletes: Are Force-Velocity Profiles Sport Specific or Individual? PLoS ONE 2019, 14, e0215551. [Google Scholar] [CrossRef]
  11. Petridis, L.; Pálinkás, G.; Tróznai, Z.; Béres, B.; Utczás, K. Determining Strength Training Needs Using the Force-Velocity Profile of Elite Female Handball and Volleyball Players. Int. J. Sports Sci. Coach. 2021, 16, 123–130. [Google Scholar] [CrossRef]
  12. Morin, J.-B.; Samozino, P. Interpreting Power-Force-Velocity Profiles for Individualized and Specific Training. Int. J. Sports Physiol. Perform. 2016, 11, 267–272. [Google Scholar] [CrossRef]
  13. Slawinski, J.; Bonnefoy, A.; Levêque, J.-M.; Ontanon, G.; Riquet, A.; Dumas, R.; Chèze, L. Kinematic and Kinetic Comparisons of Elite and Well-Trained Sprinters during Sprint Start. J. Strength Cond. Res. 2010, 24, 896–905. [Google Scholar] [CrossRef] [PubMed]
  14. McGuigan, M. Testing and Evaluation of Strength and Power; Routledge: New York, NY, USA, 2019; ISBN 978-0-42-902818-2. [Google Scholar]
  15. Brady, C.J.; Harrison, A.J.; Flanagan, E.P.; Haff, G.G.; Comyns, T.M. The Relationship Between Isometric Strength and Sprint Acceleration in Sprinters. Int. J. Sports Physiol. Perform. 2020, 15, 38–45. [Google Scholar] [CrossRef]
  16. Maffiuletti, N.A.; Aagaard, P.; Blazevich, A.J.; Folland, J.; Tillin, N.; Duchateau, J. Rate of Force Development: Physiological and Methodological Considerations. Eur. J. Appl. Physiol. 2016, 116, 1091–1116. [Google Scholar] [CrossRef] [PubMed]
  17. Aagaard, P.; Simonsen, E.B.; Andersen, J.L.; Magnusson, P.; Dyhre-Poulsen, P. Increased Rate of Force Development and Neural Drive of Human Skeletal Muscle Following Resistance Training. J. Appl. Physiol. 2002, 93, 1318–1326. [Google Scholar] [CrossRef] [PubMed]
  18. Mason, L.; Kirkland, A.; Steele, J.; Wright, J. The Relationship between Isometric Mid-Thigh Pull Variables and Athletic Performance Measures: Empirical Study of English Professional Soccer Players and Meta-Analysis of Extant Literature. J. Sports Med. Phys. Fitness 2021, 61, 645–655. [Google Scholar] [CrossRef] [PubMed]
  19. Thomas, C.; Comfort, P.; Chiang, C.-Y.; Jones, P.A. Relationship between Isometric Mid-Thigh Pull Variables and Sprint and Change of Direction Performance in Collegiate Athletes. J. Trainol. 2015, 4, 6–10. [Google Scholar] [CrossRef] [PubMed]
  20. Townsend, J.R.; Bender, D.; Vantrease, W.C.; Hudy, J.; Huet, K.; Williamson, C.; Bechke, E.; Serafini, P.R.; Mangine, G.T. Isometric Midthigh Pull Performance Is Associated With Athletic Performance and Sprinting Kinetics in Division I Men and Women’s Basketball Players. J. Strength Cond. Res. 2019, 33, 2665–2673. [Google Scholar] [CrossRef]
  21. West, D.J.; Owen, N.J.; Jones, M.R.; Bracken, R.M.; Cook, C.J.; Cunningham, D.J.; Shearer, D.A.; Finn, C.V.; Newton, R.U.; Crewther, B.T.; et al. Relationships between Force-Time Characteristics of the Isometric Midthigh Pull and Dynamic Performance in Professional Rugby League Players. J. Strength Cond. Res. 2011, 25, 3070–3075. [Google Scholar] [CrossRef]
  22. Scanlan, A.T.; Wen, N.; Guy, J.H.; Elsworthy, N.; Lastella, M.; Pyne, D.B.; Conte, D.; Dalbo, V.J. The Isometric Midthigh Pull in Basketball: An Effective Predictor of Sprint and Jump Performance in Male, Adolescent Players. Int. J. Sports Physiol. Perform. 2020, 15, 409–415. [Google Scholar] [CrossRef] [PubMed]
  23. Wang, R.; Hoffman, J.R.; Tanigawa, S.; Miramonti, A.A.; La Monica, M.B.; Beyer, K.S.; Church, D.D.; Fukuda, D.H.; Stout, J.R. Isometric Mid-Thigh Pull Correlates With Strength, Sprint, and Agility Performance in Collegiate Rugby Union Players. J. Strength Cond. Res. 2016, 30, 3051–3056. [Google Scholar] [CrossRef] [PubMed]
  24. Healy, R.; Smyth, C.; Kenny, I.C.; Harrison, A.J. Influence of Reactive and Maximum Strength Indicators on Sprint Performance. J. Strength Cond. Res. 2019, 33, 3039–3048. [Google Scholar] [CrossRef]
  25. Comfort, P.; Dos’Santos, T.; Beckham, G.K.; Stone, M.H.; Guppy, S.N.; Haff, G.G. Standardization and Methodological Considerations for the Isometric Midthigh Pull. Strength Cond. J. 2019, 41, 57–79. [Google Scholar] [CrossRef]
  26. DosʼSantos, T.; Jones, P.A.; Comfort, P.; Thomas, C. Effect of Different Onset Thresholds on Isometric Midthigh Pull Force-Time Variables. J. Strength Cond. Res. 2017, 31, 3463–3473. [Google Scholar] [CrossRef]
  27. Brady, C.J.; Harrison, A.J.; Comyns, T.M. A Review of the Reliability of Biomechanical Variables Produced during the Isometric Mid-Thigh Pull and Isometric Squat and the Reporting of Normative Data. Sports Biomech. 2020, 19, 1–25. [Google Scholar] [CrossRef]
  28. Romero-Franco, N.; Jiménez-Reyes, P.; Castaño-Zambudio, A.; Capelo-Ramírez, F.; Rodríguez-Juan, J.J.; González-Hernández, J.; Toscano-Bendala, F.J.; Cuadrado-Peñafiel, V.; Balsalobre-Fernández, C. Sprint Performance and Mechanical Outputs Computed with an IPhone App: Comparison with Existing Reference Methods. Eur. J. Sport Sci. 2017, 17, 386–392. [Google Scholar] [CrossRef] [PubMed]
  29. Economou, T.; Stavridis, I.; Zisi, M.; Fragkoulis, E.; Olanemi-Agilara, G.; Paradisis, G. Sprint Mechanical and Kinematic Characteristics of National Female Track and Field Champions and Lower-Level Competitors. J. Phys. Educ. Sport 2021, 21, 3227–3235. [Google Scholar] [CrossRef]
  30. Stavridis, I.; Economou, T.; Walker, J.; Bissas, A.; Tsopanidou, A.; Paradisis, G. Sprint Mechanical Characteristics of Sub-Elite and Recreational Sprinters. J. Phys. Educ. Sport 2022, 22, 1126–1133. [Google Scholar] [CrossRef]
  31. Hopkins, W.G.; Marshall, S.W.; Batterham, A.M.; Hanin, J. Progressive Statistics for Studies in Sports Medicine and Exercise Science. Med. Sci. Sports Exerc. 2009, 41, 3–13. [Google Scholar] [CrossRef] [PubMed]
  32. Morin, J.-B.; Edouard, P.; Samozino, P. Technical Ability of Force Application as a Determinant Factor of Sprint Performance. Med. Sci. Sports Exerc. 2011, 43, 1680–1688. [Google Scholar] [CrossRef] [PubMed]
  33. Kugler, F.; Janshen, L. Body Position Determines Propulsive Forces in Accelerated Running. J. Biomech. 2010, 43, 343–348. [Google Scholar] [CrossRef] [PubMed]
  34. von Lieres Und Wilkau, H.C.; Irwin, G.; Bezodis, N.E.; Simpson, S.; Bezodis, I.N. Phase Analysis in Maximal Sprinting: An Investigation of Step-to-Step Technical Changes between the Initial Acceleration, Transition and Maximal Velocity Phases. Sports Biomech. 2020, 19, 141–156. [Google Scholar] [CrossRef]
  35. Prados-Barbero, F.J.; Sánchez-Romero, E.A.; Cuenca-Zaldívar, J.N.; Selva-Sarzo, F. Differences in Movement Patterns Related to Anterior Cruciate Ligament Injury Risk in Elite Judokas According to Sex: A Cross-Sectional Clinical Approach Study. Electron. J. Gen. Med. 2024, 21, em574. [Google Scholar] [CrossRef]
  36. Fuster, V.; Jerez, A.; Ortega, A. Anthropometry and Strength Relationship: Male-Female Differences. Anthropol. Anz. 1998, 56, 49–56. [Google Scholar] [CrossRef] [PubMed]
  37. Hicks, D.S.; Drummond, C.; Williams, K.J.; van den Tillaar, R. Exploratory Analysis of Sprint Force-Velocity Characteristics, Kinematics and Performance across a Periodized Training Year: A Case Study of Two National Level Sprint Athletes. Int. J. Environ. Res. Public Health 2022, 19, 15404. [Google Scholar] [CrossRef]
  38. Jiménez-Reyes, P.; Garcia-Ramos, A.; Párraga-Montilla, J.A.; Morcillo-Losa, J.A.; Cuadrado-Peñafiel, V.; Castaño-Zambudio, A.; Samozino, P.; Morin, J.-B. Seasonal Changes in the Sprint Acceleration Force-Velocity Profile of Elite Male Soccer Players. J. Strength Cond. Res. 2022, 36, 70–74. [Google Scholar] [CrossRef]
  39. James, L.P.; Weakley, J.; Comfort, P.; Huynh, M. The Relationship Between Isometric and Dynamic Strength Following Resistance Training: A Systematic Review, Meta-Analysis, and Level of Agreement. Int. J. Sports Physiol. Perform. 2023, 19, 2–12. [Google Scholar] [CrossRef] [PubMed]
  40. Martín Pérez, S.E.; Martín Pérez, I.M.; León Ramírez, P.; Rodríguez-Pastrana Trujillo, A.J.; Cabrera Cabrera, E.; Sánchez Romero, E.A.; Sosa Reina, M.D.; Alonso Pérez, J.L.; Villafañe, J.H.; Fernández Carnero, J. Immediate Effects of Isometric versus Isotonic Exercise on Pain Sensitivity and Motor Performance of Ankle Plantiflexor Muscles. Sci. J. Sport Perform. 2022, 2, 105–118. [Google Scholar] [CrossRef]
  41. Benítez-Martínez, J.C.; García-Haba, B.; Fernández-Carnero, S.; Pecos-Martin, D.; Sanchez Romero, E.A.; Selva-Sarzo, F.; Cuenca-Zaldívar, J.N. Effectiveness of Transcutaneous Neuromodulation on Abductor Muscles Electrical Activity in Subjects with Chronic Low Back Pain: A Randomized, Controlled, Crossover Clinical Trial. J. Pain Res. 2023, 16, 2553–2566. [Google Scholar] [CrossRef]
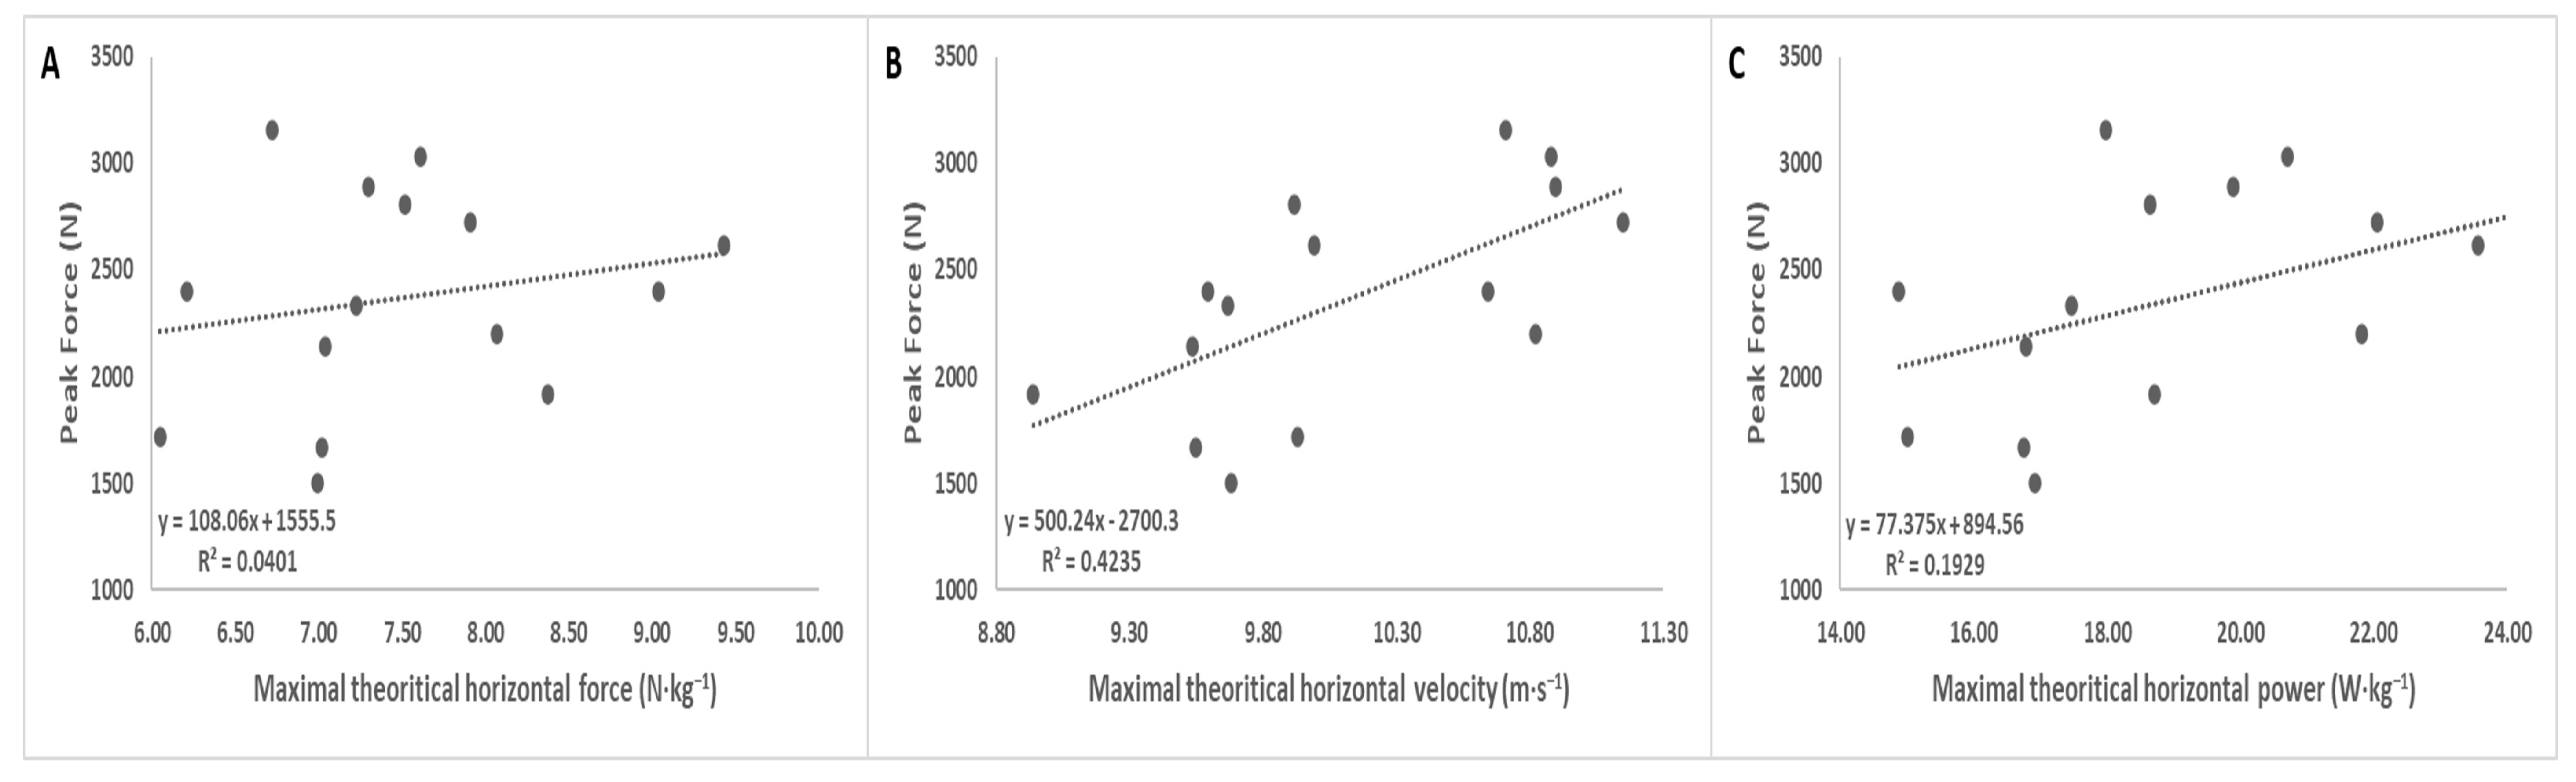
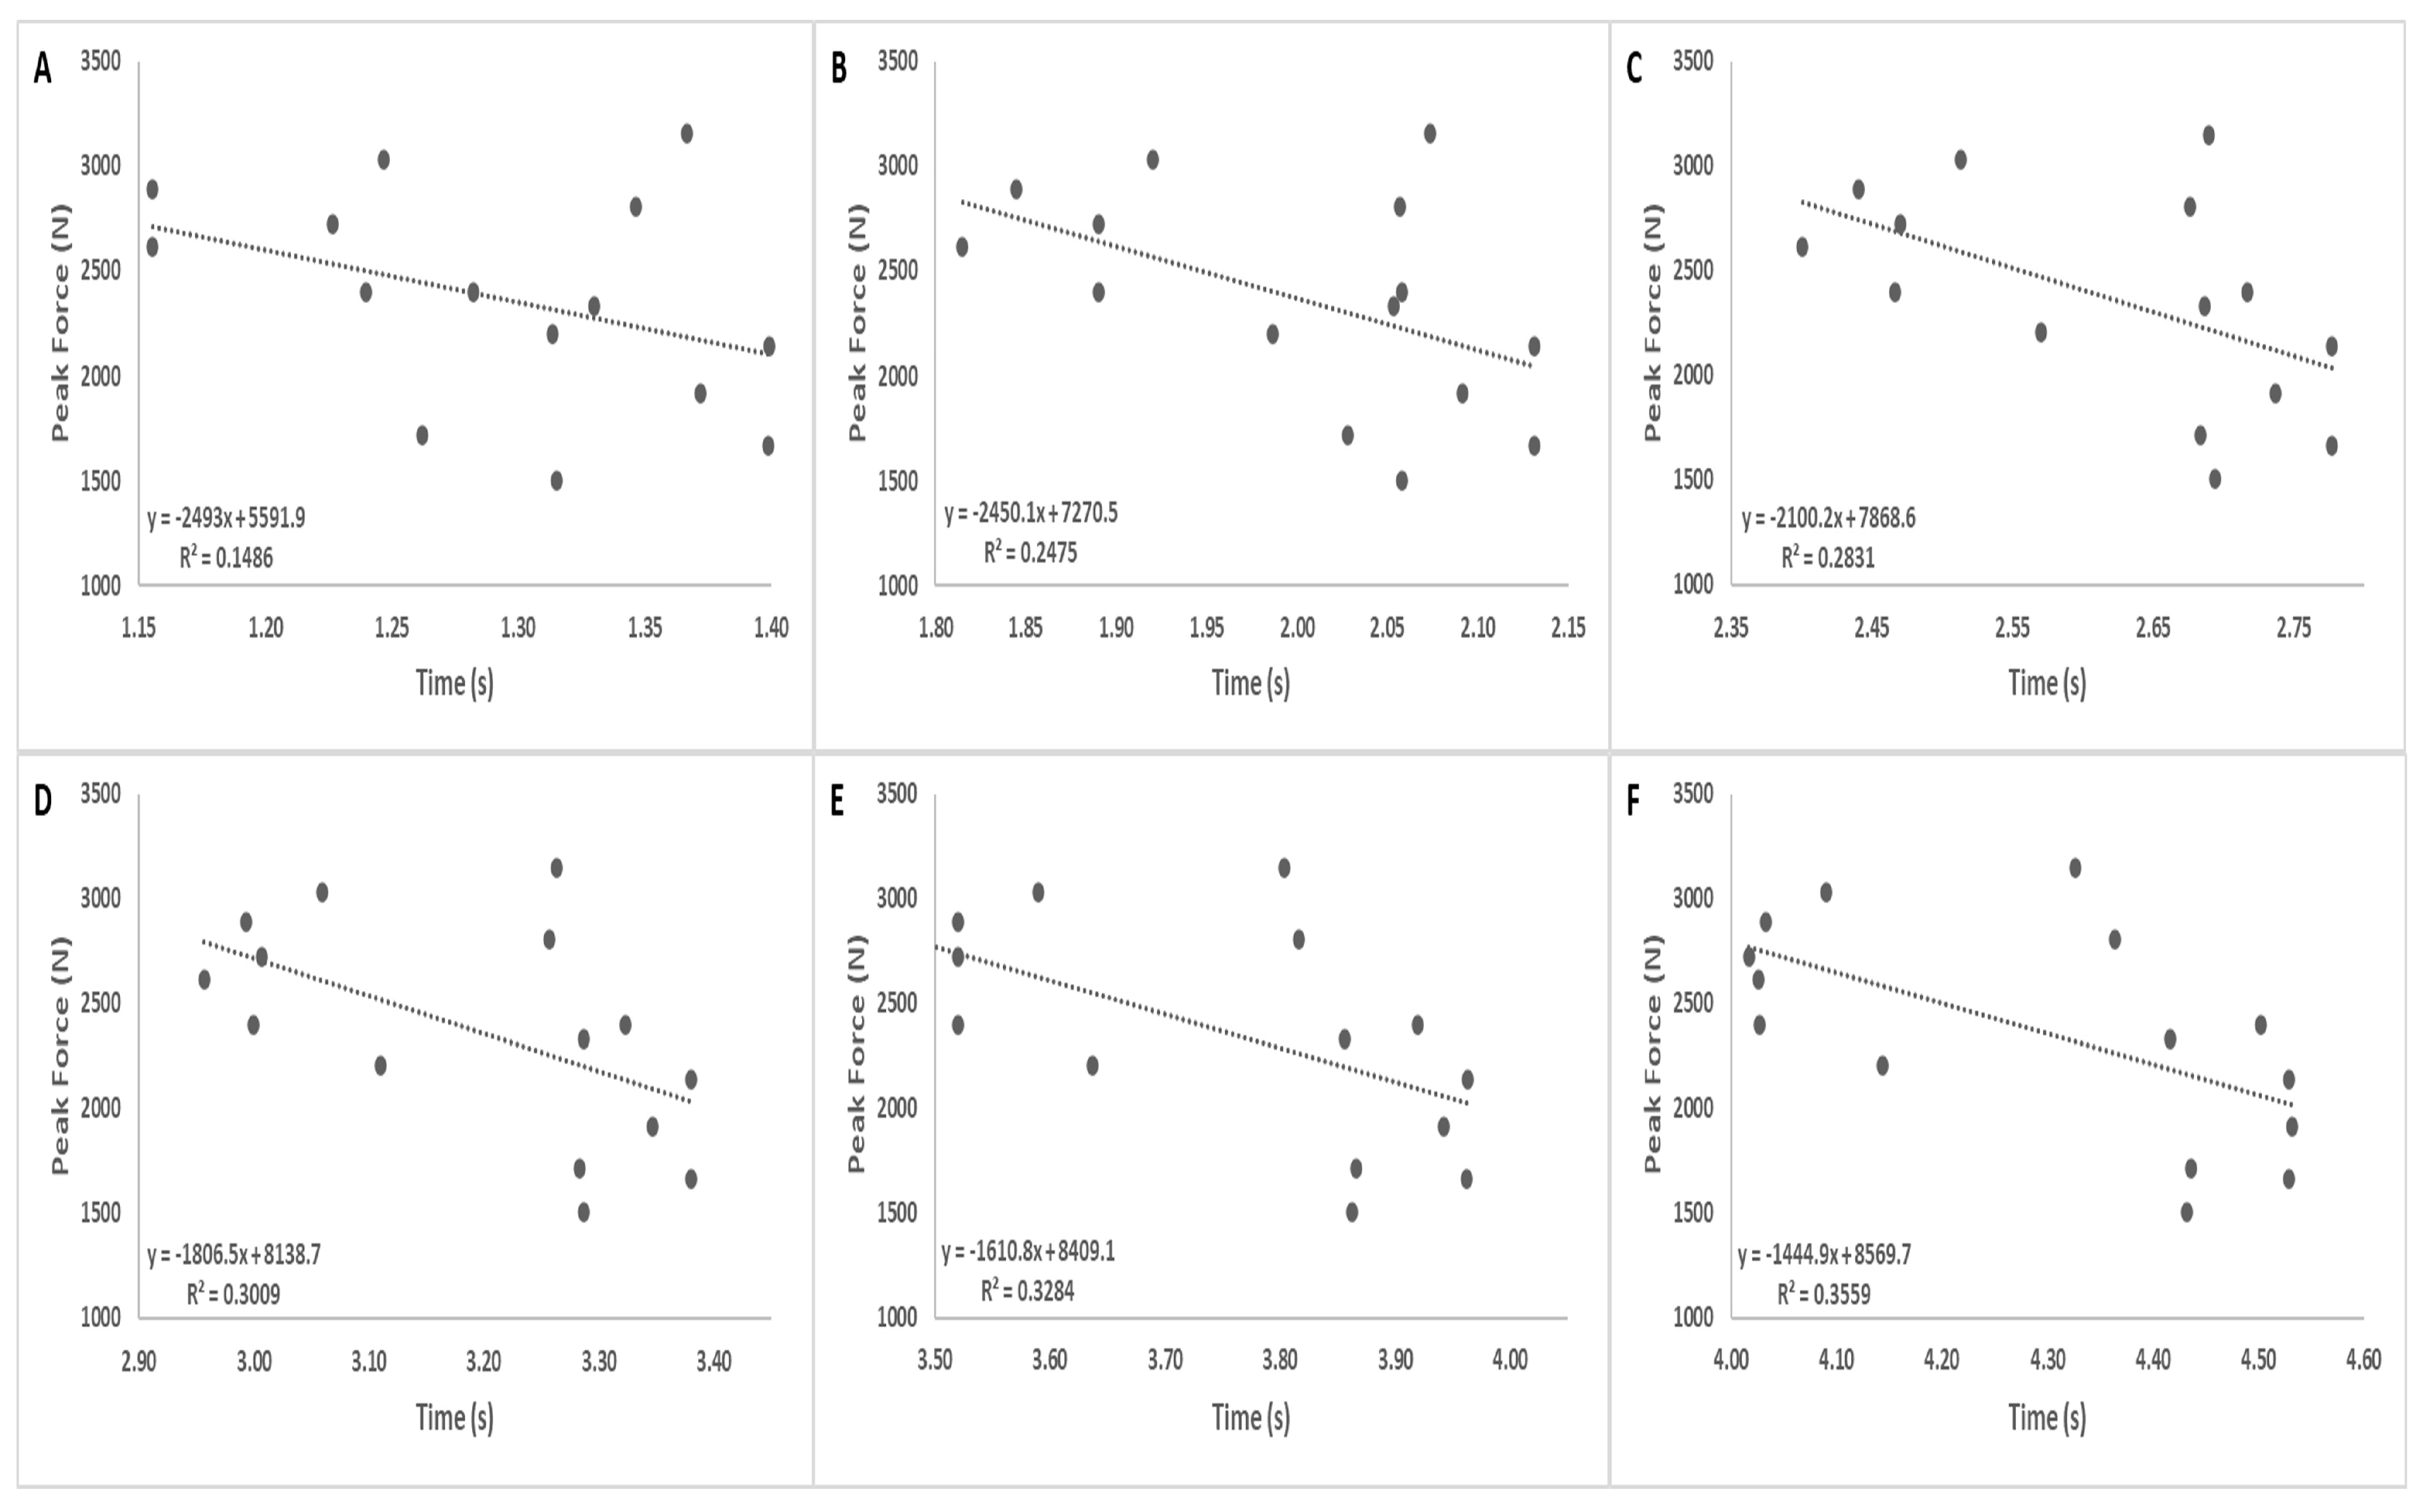
Figure 1. Linear relationships and coefficient of determination (R2) between isometric mid-thigh pull maximal force and F0 (A), v0 (B), and Pmax (C).
Applsci 15 01089 g001
Figure 2. Linear relationships and coefficient of determination (R2) between isometric mid-thigh pull maximal force and time to 5 m (A), time to 10 m (B), time to 15 m (C), time to 20 m (D), time to 25 m (E), and time to 30 m (F).
Applsci 15 01089 g002
Table 1. Means ± SD, 95% Confidence Intervals (CI), Pearson’s correlations, and qualitative interpretations of the Pearson’s correlation coefficients of IMTP assessment, sprint mechanical profile, and sprint acceleration performance variables.
VariablesMean (SD)95% CIRelationship with IMTPF (r)ES
IMTPF (N)2366 ± 5112082–2648
F0 (N∙kg−1)7.50 ± 0.956.98–8.020.20 (−0.35 to 0.65)Small
v0 (m∙s−1)10.13 ± 0.669.76–10.500.65 ** (0.21 to 0.87)Large
Pmax (W∙kg−1)19.02 ± 2.9017.41–20.620.44 (−0.09 to 0.78)Moderate
Time to 5 m (s)1.30 ± 0.081.25–1.34−0.38 (−0.74 to 0.17)Moderate
Time to 10 m (s)2.00 ± 0.101.94–2.06−0.50 (−0.81 to 0.01)Large
Time to 15 m (s)2.62 ± 0.132.55–2.69−0.53 * (−0.82 to −0.21)Large
Time to 20 m (s)3.20 ± 0.163.11–3.28−0.55 * (−0.83 to −0.06)Large
Time to 25 m (s)3.75 ± 0.183.65–3.85−0.57 * (−0.84 to −0.09)Large
Time to 30 m (s)4.29 ± 0.214.18–4.41−0.60 * (−0.85 to −0.12)Large
IMTPF = isometric mid-thigh pull peak force; 95% CI = 95% confidence intervals; ES = effect size; r = Pearson’s correlation coefficients; F0 = theoretical maximal horizontal force; v0 = theoretical maximal horizontal velocity; Pmax = theoretical maximal horizontal power. * = p ≤ 0.05; ** = p ≤ 0.01.
Disclaimer/Publisher’s Note: The statements, opinions and data contained in all publications are solely those of the individual author(s) and contributor(s) and not of MDPI and/or the editor(s). MDPI and/or the editor(s) disclaim responsibility for any injury to people or property resulting from any ideas, methods, instructions or products referred to in the content.

