Abstract
In the connected and autonomous vehicle (CAV) environment, vehicles with different levels of automation are being deployed on public roads. Most research focuses on traffic flow simulation for a single vehicle type, while there are few studies on the interactions of mixed traffic involving CAVs, autonomous vehicles (AVs), and human-driven vehicles (HDVs). To fill this gap, this study investigates the traffic performance of heterogeneous traffic on multi-lane ring roads and highways with on-ramps. Leveraging the Python and SUMO simulation platform, the JAD strategy is introduced to optimize the dynamic interactions within heterogeneous traffic flow. Various scenarios with different proportions of CAVs, AVs, and HDVs were simulated to assess their impact on traffic efficiency, dynamics, safety, and environmental factors. The findings indicate that traffic efficiency, stability, and environmental impact improve as the share of HDVs declines and the proportion of CAVs and AVs rises. In scenarios with more HDVs, the improvements are minimal. Traffic safety gradually improves as the proportion of CAVs and AVs increases, with significant improvements observed when CAVs account for 40% of vehicles on ring roads and 50% on highways. This study advances the understanding of complex interactions in mixed traffic scenarios and their implications for traffic management.
1. Introduction
The escalating traffic congestion on the road network has led to extensive negative impacts on society, including time and productivity loss, increased air pollution, and decreased safety [1]. With the rapid development and cross-sector integration of industries such as transportation, automatic control, artificial intelligence, and communication, connected and autonomous vehicle (CAV) technology provides a new approach to alleviating traffic congestion and improving traffic performance [2,3].
According to the level of vehicle automation, automated vehicles are categorized into six levels: no automation (Level 0), driver assistance (Level 1), partial automation (Level 2), conditional automation (Level 3), high automation (Level 4), and full automation (Level 5) [4,5]. Taking into account the level of autonomy and connectivity of vehicles, they can be classified as human-driven vehicles (HDVs), connected human-driven vehicles (CHVs), autonomous vehicles (AVs), and CAVs [6,7]. Specifically, these vehicles can be described as follows: (1) HDVs are traditional motor vehicles that are controlled and operated by human drivers; (2) CHVs are traditional vehicles operated by humans, equipped with advanced communication technologies, and their driving behavior aligns with that of manually driven vehicles; (3) AVs are advanced transportation devices that utilize advanced sensing technology, artificial intelligence, and autonomous decision-making systems to drive without human operation; (4) CAVs can utilize vehicle-to-infrastructure (V2I) communication technology to perceive their surroundings in real-time and coordinate the sensing and sharing of travel information through vehicle-to-vehicle (V2V) communication technology [8].
The vehicle driving modes are steadily transitioning from manual driving to assisted driving, autonomous driving, human-vehicle hybrid driving, and even advanced self-driving. Therefore, mixed traffic flow has emerged as a hot topic due to the increasing development and implementation of intelligent transportation systems (ITSs). It involves efficiently managing and coordinating the traffic flow to enhance the efficiency, safety, and sustainability of the transportation system. In recent years, connected and autonomous vehicles have provided a new approach to alleviating traffic congestion. The jam-absorption driving (JAD) strategy [9,10] is a technique utilized in vehicle automation and autonomous driving to mitigate the impact of traffic jams. The core principle of JAD is to reduce congestion by dynamically adjusting the headway between individual vehicles.
This study introduces the JAD strategy to optimize traffic flow by regulating vehicles’ longitudinal behaviors (such as acceleration and deceleration) and lateral behaviors (such as lane change). Specifically, the JAD strategy utilizes perception data (e.g., road environment and the state of preceding vehicles) and vehicles’ dynamic information (e.g., speed, acceleration, and position) to adjust driving trajectories and speed variations. This approach focuses on exploring the interactions of heterogeneous traffic flow, including cars and trucks equipped with CAVs, AVs, and HDVs, on multi-lane ring roads and highways.
The remainder of this paper is organized as follows. The next section provides a brief review of related work. Section 3 establishes the overall simulation framework. Section 4 details the JAD strategy, the car-following (CF) model, and the lane-change model used in mixed traffic flow. It also explores the process of generating heterogeneous traffic flow and specifies surrogate safety measures in the simulation experiments. In Section 5, experimental scenarios are set up for the circular road and highway with different proportions of mixed traffic flow, and the results evaluating the performance of mixed traffic are presented. Section 6 presents the conclusions and some topics for future research.
2. Literature Review
A considerable amount of research and investigation has been carried out on mixed traffic flow [11,12]. These studies include the analysis of interactions among various types of vehicles, the development and validation of traffic flow models, the implementation of multi-lane and/or different scenarios, and the optimization of traffic management strategies to improve traffic performance [13,14,15]. In the case of fully or partially automated vehicles coexisting with manual vehicles, the proposed optimized control strategy can achieve maximum throughput of traffic flow by minimizing (or even preventing) congestion [16].
In the mixed traffic flow where CAVs coexist with HDVs, a hyperbolic system based on partial differential equations has been proposed to capture the macroscopic traffic flow dynamics [17]. A cellular automata model-based traffic system was proposed to investigate the characteristics of mixed traffic modes involving both autonomous and human-driven vehicles [18]. In this model, human drivers can use information from several preceding vehicles to guide their vehicle’s motion, while autonomous vehicles consider communication ranges between vehicles and iterative interaction information. In the mixed traffic flow of connected, autonomous, and human-driven vehicles, a second-order macroscopic model was developed to reconstruct the backward propagation speed of disturbances based on the dynamic headway of the vehicles [19]. This research utilized a data-driven optimization method to model the driving behavior of CAVs in mixed traffic and explored the impact of CAVs on overall traffic performance [20]. A traffic control system for signalized intersections based on deep reinforcement learning was proposed to enhance the operational efficiency and safety of CAVs and HDVs while minimizing the impact of HDVs’ driving behaviors [21]. This study explored the necessity for a comprehensive connected and automated vehicle simulation environment to simulate vehicle behavior, taking into account the influence of surrounding objects on machine perception and signal propagation [22]. This research analyzed the effects of the coexistence of conditionally automated vehicles (CADVs) and human drivers on the stability of mixed traffic flow [23]. The results showed that the switch control from CADVs to human drivers greatly increased the instability of mixed traffic flow. To improve the safety and efficiency of dynamic interaction merging zones with multiple CAVs, a method known as graph with multi-head attention and deep reinforcement learning (GMA-DRL) has been proposed [24]. The findings showed that the proposed method is superior to the existing cooperative control models in headway distance, average speed, and acceleration, thereby improving traffic safety and efficiency. By modifying the four factors of traffic flow, truck proportion, cooperative adaptive cruise control (CACC) market penetration rate, and CACC platoon size, this study analyzed the impact of these factors on the characteristics of mixed traffic flow composed of HDVs and heterogeneous CACC platoons in highway merging zones [25]. To minimize disruptions from incorrect driver actions and avoid unnecessary platoon operations, a framework that integrates driving state recognition, platoon control, and risk assessment has been suggested. The findings demonstrated that the proposed method significantly enhanced the stability and safety of the multi-platoon system [26]. The current state and future outlook of the CACC system are summarized based on communication, driver characteristics, and control [27]. To assess the safety and mobility of CACC, a simulation platform for urban scenarios has been proposed to capture the interactions between HDVs and CAVs [28].
A new set of lane-changing regulations has been implemented to model multi-lane heterogeneous traffic that includes human-driven vehicles, automated vehicles, and communicating automated vehicles [29]. The influence of AVs on efficiency and safety was evaluated through average speed, throughput, and inverse time-to-collision (ITTC) in the case of mixed traffic and AV-only lanes [30]. A cooperative mandatory platoon lane change (CMPLC) strategy has been proposed for dedicated lanes (DLs) and general-purpose lanes (GPLs) in mixed traffic involving both CAVs and HDVs. The results demonstrated that the proposed strategy achieved higher lane change success rates and shorter execution times under different traffic demands, platoon sizes, and starting positions [31]. To enhance traffic efficiency in bottleneck zones involving mandatory lane changes, this study introduced a collision risk mitigation strategy using a multi-agent deep reinforcement learning framework. This approach took into account vehicle spacing and coordinated lane changes in a CAV environment to effectively alleviate traffic congestion [32]. To enhance traffic capacity, minimize delays, and smooth traffic flow, a multiclass multi-lane Cell Transmission Model (CTM) has been developed to simulate the traffic dynamics of mixed CAVs and HDVs [33].
A reservation-based cooperative eco-driving model (RCEM) has been developed to improve the CAV trajectories and management of intersection controls in situations with isolated intersections and different market penetration rates of CAVs [34]. A dynamic programming method and a mixed-integer linear programming (MILP) formulation have been proposed to optimize intersection management for mixed traffic flow that includes both CAVs and HDVs [35]. In a typical isolated ring with mixed traffic conditions, simulations were carried out with various configurations of CAV platoon [36]. The findings showed that increasing the maximum platoon size and platoon willingness can significantly enhance throughput and reduce delay times. Additionally, a heterogeneous platoon was better than a homogeneous platoon under different scenarios. Within the cooperative, connected, and automated Mobility (CCAM) framework, a simulation was conducted to study the coexistence of connected and automated vehicles and human-driven cars at a roundabout [37]. To investigate how cooperative and autonomous communication vehicles with platoon capabilities can prevent stop-and-go waves in urban environments, experimental simulations were carried out in SUMO (Simulation of Urban MObility) [38]. A ramp merging strategy based on game theory has been proposed to address the optimal merging coordination of CAVs under mixed traffic conditions [39]. The experiment, considering different penetration rates and congestion levels, was simulated on the Unity-SUMO integrated platform. The open-source platooning simulator PERMIT based on SUMO [40,41,42] and its extension Plexe were designed to simulate platooning maneuvers in mixed traffic situations involving both autonomous and non-autonomous vehicles [43].
Existing research mainly concentrates on traffic flow simulation for individual vehicle types, while there are relatively few studies on the interactions of multiple vehicle types in complex mixed traffic flow. To assess the impact of heterogeneous traffic flow on traffic efficiency, dynamics, safety, and environment, different penetration rates were considered on both the multi-lane ring road and highway. The mixed traffic consists of cars and trucks equipped with CAVs, AVs, and HDVs. All experiments utilized an integrated SUMO and Python simulation platform to model driving behaviors and dynamic interactions in mixed traffic flow. This is essential for understanding actual traffic dynamics, optimizing traffic management strategies, enhancing road safety, and advancing the development of ITS.
3. Simulation Framework
A simulation featuring mixed traffic flow with HDVs, AVs, and CAVs, and incorporating two vehicle types (cars and trucks), has been established to analyze traffic performance. The developed simulation framework is illustrated in Figure 1. All experiments are conducted on a computer set up with Python 3.8 and SUMO 1.19 to simulate and capture the characteristics of heterogeneous traffic flow.
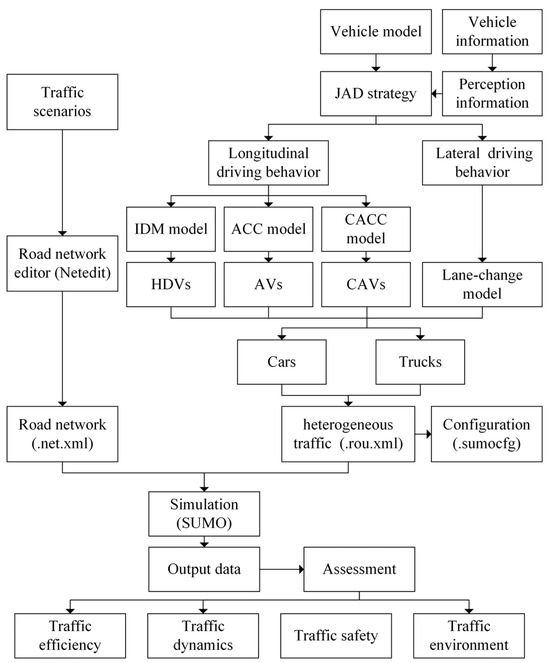
Figure 1.
Overview of the simulation framework.
The simulation framework consists of the following steps. Firstly, various traffic scenarios (multi-lane ring road and highway) are generated using the visual road network editor (Netedit). Secondly, the vehicle model is employed to characterize the physical and dynamic properties of various vehicle types, such as passenger cars and trucks, ensuring that the vehicular behavior in the simulation accurately mirrors real-world conditions. The JAD strategy functions as the primary decision-making module, governing the longitudinal (acceleration, deceleration) and lateral (lane-changing) movements of vehicles. It does so by leveraging perception information, including road environment information and the status of the leading vehicle, alongside vehicle-specific parameters such as speed, acceleration, and current position. Through its control over these driving behaviors, the JAD strategy shapes vehicle trajectories and speed fluctuations, thereby exerting a significant impact on the overall traffic flow dynamics. Thirdly, the longitudinal and lateral driving behaviors of vehicles are described by the car-following model and the lane-changing model, respectively. In mixed traffic flow, different car-following models are commonly employed to accurately simulate the driving behaviors of different vehicle types. Specifically, the intelligent driver model (IDM) model, adaptive cruise control (ACC) model, and CACC model are used to capture the driving behaviors of HDVs, AVs, and CAVs, respectively. By integrating the IDM, ACC, and CACC models, this study can more thoroughly simulate the complex interactions between cars and trucks equipped with HDVs, AVs, and CAVs in mixed traffic, thereby analyzing and optimizing the dynamic characteristics and operational efficiency of the traffic flow. Subsequently, traffic simulations are carried out in SUMO using the vehicle configuration files, route files, and heterogeneous traffic flow files. Finally, to assess the traffic efficiency, dynamics, safety, and environment of heterogeneous traffic flow, a detailed analysis of the simulation output data is conducted. This is of practical significance for alleviating traffic congestion, reducing traffic accidents, ensuring traffic safety and efficiency, and improving the development of ITSs.
4. System Description
The system description section is composed of several critical components that establish a robust framework for analyzing heterogeneous traffic flow. These include the JAD strategy, which governs both longitudinal (e.g., acceleration and deceleration) and lateral (e.g., lane-changing) behaviors to enhance traffic performance; the car-following model, which quantitatively describes longitudinal interactions between vehicles and their effects on traffic dynamics; and the heterogeneous traffic flow generation, which describes the process of simulating traffic involving multiple vehicle types in complex mixed traffic scenarios. Furthermore, the lane-changing model is utilized to simulate lateral vehicle maneuvers under diverse traffic conditions, providing insights into dynamic interactions. Finally, the surrogate safety measures (SSMs) [44] are incorporated to systematically evaluate safety across varying traffic scenarios. Together, these components form a comprehensive framework for exploring the efficiency, safety, and dynamic properties of heterogeneous traffic systems.
4.1. JAD Strategy
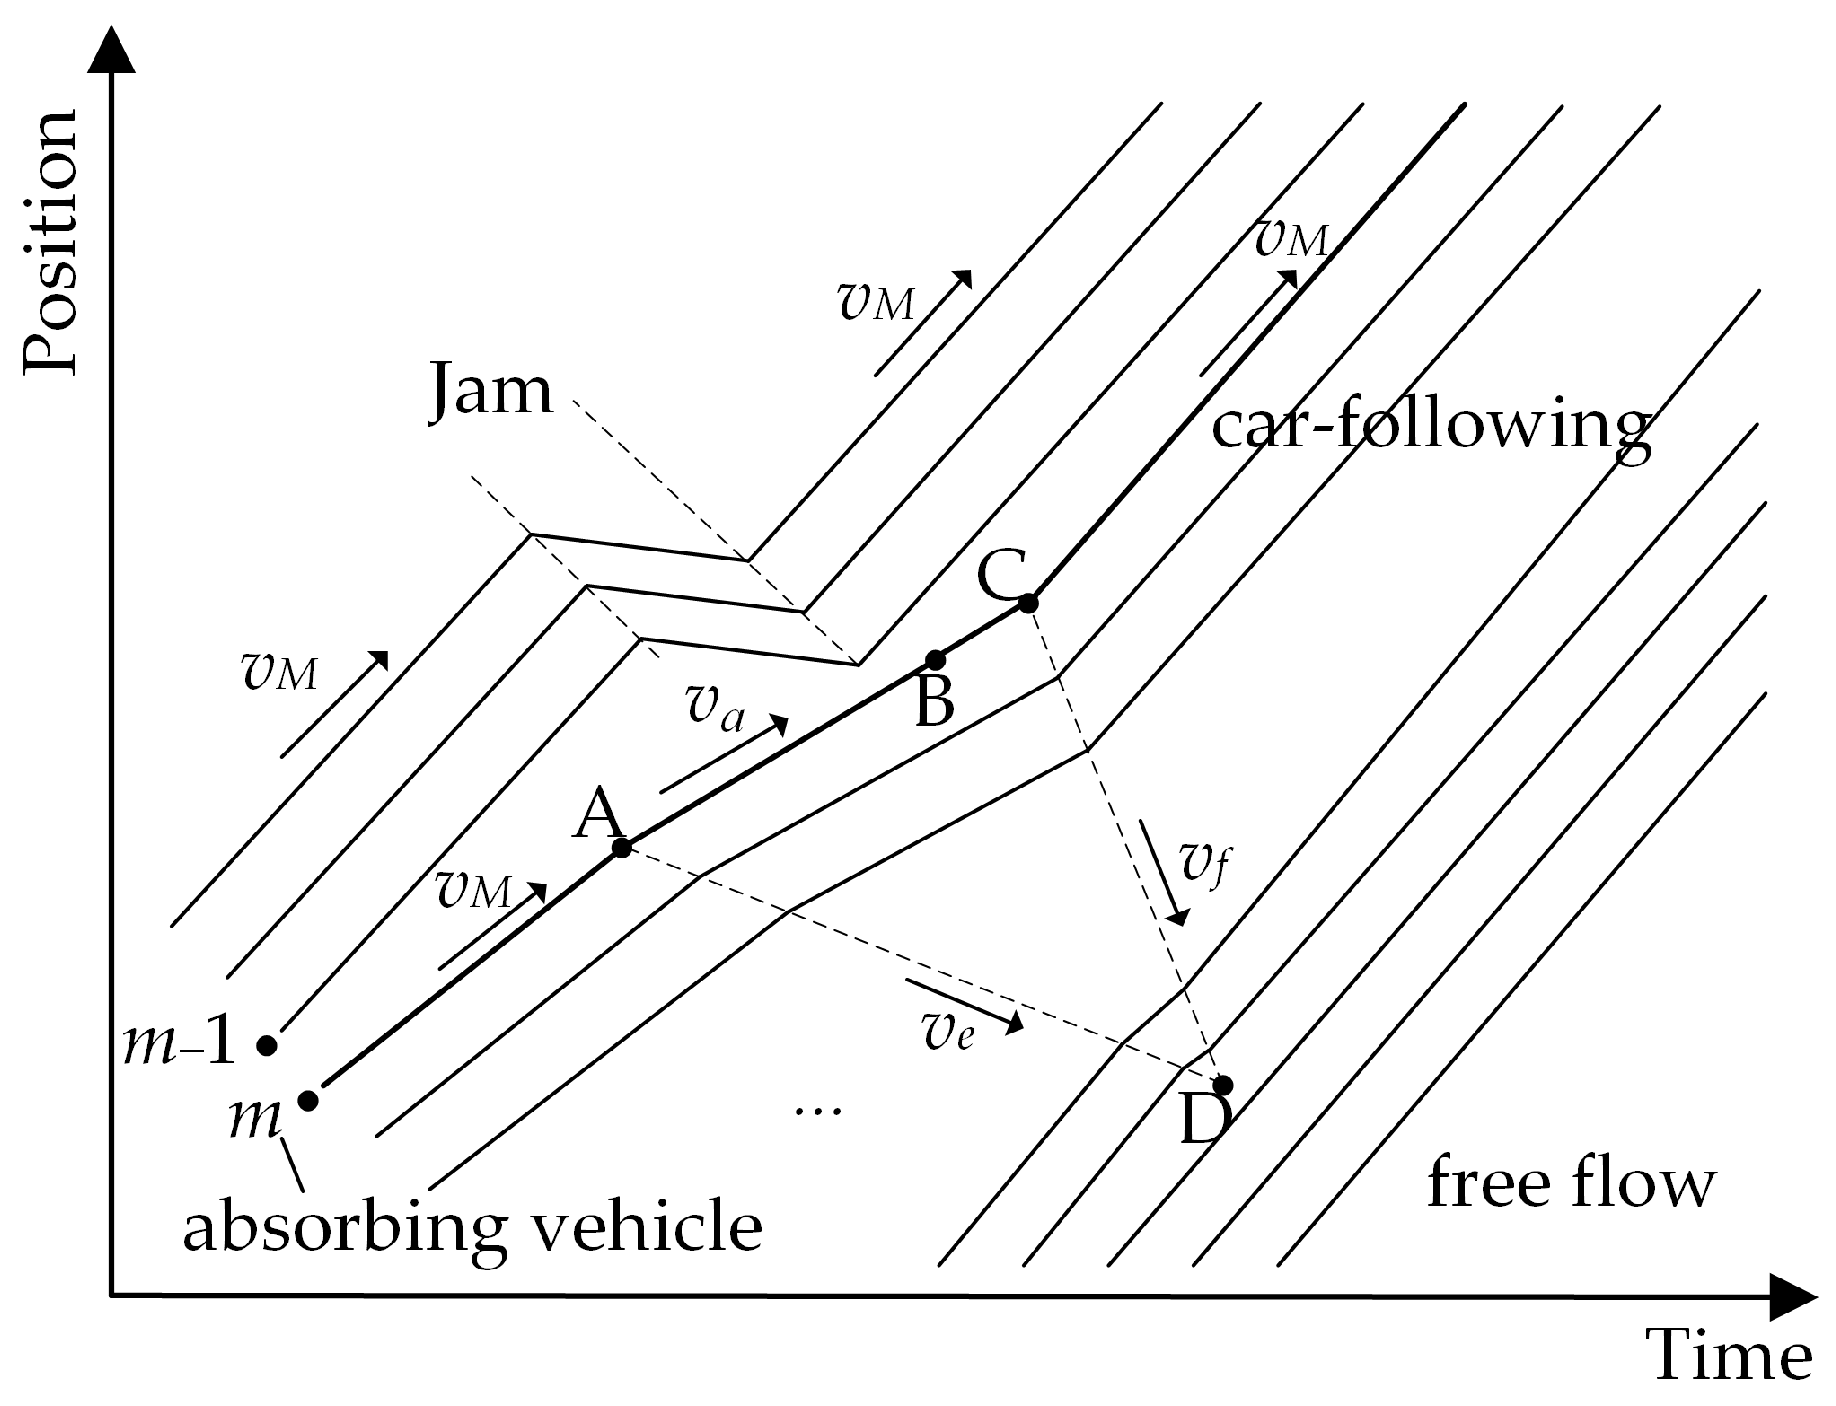
The JAD strategy consists of two main actions: “slow-in” and “fast-out.” The “slow-in” action is aimed at preventing the driver from being caught in a traffic jam by reducing speed and increasing the headway in advance, thereby helping to dissipate the congestion. Following this, the “fast-out” action involves quickly accelerating and reducing the time gap with the vehicle ahead, in order to clear the jam. This strategy also takes into account the “frustration effect” [45], which suggests that increasing time delays after traffic jams can exacerbate congestion. The schematic diagram is shown in Figure 2. The core of this strategy is to use specific vehicles to guide traffic flow. When a traffic wave is detected, the absorbing vehicle reduces its speed to a predefined value (the absorption speed) to prevent the wave from propagating upstream. Subsequently, the absorbing vehicle accelerates back to its original speed, thereby restoring the flow to its normal state.

Figure 2.
The schematic diagram of the JAD strategy.
4.2. Car-Following Models in SUMO
A microscopic traffic model simulates the behavior and interactions of individual vehicles, capturing the dynamic characteristics of traffic flow. It considers factors such as driver decisions, vehicle acceleration and deceleration, headway distance, lane changes, and traffic signals, aiming to improve traffic management capabilities and predict road conditions more effectively. These detailed simulations allow micro-traffic models to provide comprehensive analysis and effective solutions for traffic congestion, safety, and network efficiency. In SUMO, the CACC model, ACC model, and IDM are utilized to simulate the dynamic traffic flow of CAVs, AVs, and HDVs, respectively.
4.2.1. Human-Driving Model
In microscopic traffic flow, the IDM [46] is used to simulate the CF behavior of HDVs. The IDM is a nonlinear model that incorporates factors such as the relative speed between vehicles, the relative distance, and the maximum acceleration. The combination of these factors constitutes the calculation of nonlinear acceleration. These nonlinear terms make the model better aligned with the real traffic conditions, enabling it to more accurately capture the complex interactions between vehicles and the nonlinear dynamic characteristics of traffic flow. The model consists of two components: the acceleration equation for vehicles in free flow and the deceleration equation to prevent rear-end collisions. The expression is as follows:
where and represent the speed and position of the n-th car at time t, respectively. is relative speed, l represents the length of the vehicle, and b denote the maximum comfortable acceleration and comfortable deceleration; is the minimum spacing, and T denotes desired time headway.
4.2.2. ACC Vehicle Model
The ACC vehicle model is an advanced driver assistance system that employs radar and camera sensors to continuously monitor the traffic and road conditions ahead. By automatically controlling the vehicle’s speed, the ACC system ensures a safe distance from the car in front, minimizing driver fatigue and improving driving safety. Therefore, the ACC vehicle model is described as follows:
where s is the vehicle spacing, and are the control gain, is the desired time headway. According to the previous literature [47], the control gain and were set to 0.23 s−2 and 0.07 s−1, respectively. Accordingly, in SUMO, the model parameters and correspond to gapControlGainSpace (the control gain determining the rate of positioning deviation) and gapControlGainSpeed (the control gain determining the rate of speed deviation), respectively.
4.2.3. CACC Vehicle Model
CAVs are capable of accurately sensing their environment via V2I communication technology and can synchronize perception and share driving information through V2V communication technology. With V2V communication technology, CACC vehicles can obtain operating status data between vehicles and automatically adjust the distance between them based on the position and speed of the vehicle ahead. This helps to reduce traffic congestion, improve road usage efficiency, and prevent rear-end collisions and other potential hazards. Therefore, the CACC vehicle model is as follows:
where is the speed of the vehicle at the time , and are control gains, denotes the error term between the actual spacing and the desired spacing of the preceding and following vehicles. is the headway between vehicles, and is the desired time headway. The first-order Taylor expansion of Equations (4) and (5) yields the following acceleration equation:
Based on the calibration of CACC vehicle data using real vehicles by the California Partners for Advanced Transportation Technology (PATH) team at UC Berkeley [48], these parameters were assigned the following values: = 0.45 s−1, = 0.25 s−1. In SUMO, the parameters and are represented by gapControlGainGap (the control gain determining the rate of positioning deviation) and gapControlGainGapDot (the control gain determining the rate of the positioning deviation derivative), respectively.
4.3. Heterogeneous Traffic Flow Generation
In SUMO, to simulate and analyze various types of traffic flow and their interactions, it is essential to define the characteristics of different vehicle and pedestrian types, including speed, acceleration, and driving behavior, and to model their dynamic behavior in urban road networks. The JAD strategy acts as the pivotal decision-making module within the system, dynamically modifying driving behavior based on vehicle and environmental information. These characteristics can be specified through detailed configuration files, which include vehicle types (e.g., cars, buses, trucks, bicycles) and pedestrian types (e.g., adults, children, elderly). Each type has specific parameters such as maximum speed, acceleration, deceleration, length, width, and car-following models (e.g., IDM, ACC, CACC). Additionally, vehicle communication capabilities can be configured to simulate vehicle-to-vehicle (V2V) and vehicle-to-infrastructure (V2I) interactions. Based on these configurations, SUMO can simulate complex traffic scenarios to explore the characteristics of mixed traffic flow, the causes and mitigation of traffic congestion, the impact of autonomous driving technologies, and the potential of ITSs. This supports traffic planning and management effectively.
To generate a heterogeneous traffic flow for the road networks, several steps are required. First, the vehicle types must be defined in a .xml file using the <vType> tag, which includes attributes such as ID, vehicle model properties, lane-change model properties, parameters of various vehicle models, vehicle color, and penetration rates. Next, the traffic flow of different vehicle types is defined using the <flow> tag in another .xml file, which includes start and end time, the vehicle types, departure lane, departure speed, and the vehicle paths. Finally, these defined vehicle types and traffic flow files, along with the road networks file, need to be incorporated into a configuration file (.sumocfg). Therefore, by utilizing the vehicle parameter configuration file, the path file, and the heterogeneous traffic flow file (including multiple vehicle types, the distribution ratios of the vehicle types, and lane-change models), it is possible to model heterogeneous traffic flow with different penetration rates.
4.4. Lane-Change Model
In SUMO, the LC2013 [49] is a sophisticated lane-changing model designed to simulate vehicle lane-changing behavior in both urban and highway settings. This model performs comprehensive safety checks, evaluating the safe distances and speed differences between vehicles to ensure the safety of lane changes. It uses an intention-driven mechanism, considering the driver’s lane-changing intentions in various traffic conditions and the attractiveness of the target lane. The model features a detailed decision-making process, calculating the benefits of lane changes, such as achieving higher speed or smoother traffic flow, and only initiates lane changes when specific conditions are met. In addition, the model simulates the lane-changing execution, gradually transitioning to the target lane while continuously monitoring surrounding vehicles to ensure the process is safe and effective. In this study, the LC2013 lane-changing model was employed, which explicitly identifies four distinct lane-changing motivations:
1. Strategic change: Mainly concerns the decision a driver is making over a longer horizon. This change generally takes place within the context of the driver’s overall path planning, including the selection of destinations and routes. For lane change, strategic lane changes involve a driver considering factors such as destination, traffic conditions, and preferred speed while planning the route to determine whether to enter or exit a specific lane.
2. Cooperative change: Refers to the driver coordinating and communicating with other road users to facilitate safe lane changes. The driver might interact with other vehicles, such as waiting for other vehicles to yield or adjusting speed to smoothly complete the lane change.
3. Tactical change: Involves making decisions within a short time and spatial range. The driver makes quick lane changes based on current traffic conditions and temporary needs (e.g., slowing down of the vehicle ahead or the appearance of an obstacle) to optimize driving conditions or avoid potential hazards.
4. Obligatory change: Refers to the driver changing lanes in compliance with traffic regulations and sign instructions (e.g., merge signs, speed limit signs, or other traffic signal). For example, in some cases, certain lanes may be designated as dedicated lanes, and drivers must follow these rules to make lane changes safely and legally.
This study models the dynamic maneuvers and driving behaviors of a heterogeneous traffic flow consisting of cars and trucks equipped with CAVs, AVs, and HDVs. Lane change is an important vehicle maneuver that can better simulate and predict traffic flow by coordinating operations with surrounding vehicles, thereby improving the efficiency and safety of traffic management.
4.5. Surrogate Safety Measures
To assess the traffic performance of heterogeneous flow, it is necessary to calculate the number of risks of collision. In microscopic simulation, SSMs can measure traffic conflicts by identifying and reducing risks before accidents happen. In this study, SSMs are represented using two safety indicators: time to collision (TTC) and deceleration rate to avoid a crash (DRAC). TTC refers to the time required for two consecutive vehicles to be at risk of a rear-end collision in the case of car-following and lane-changing. Thus, it can be expressed by the following formula:
where l represents the length of the vehicle. DRAC is a measure that quantifies the rate at which a vehicle must decelerate to avoid a collision with another vehicle or object in its path. Higher DRAC values indicate more severe and urgent braking is needed, reflecting a higher risk of collision. It can be described as below:
According to the previous literature [50], the threshold values for DRAC were commonly set at 3.4 m/s2 and 3.35 m/s2.
5. Numerical Simulation
5.1. Experimental Design
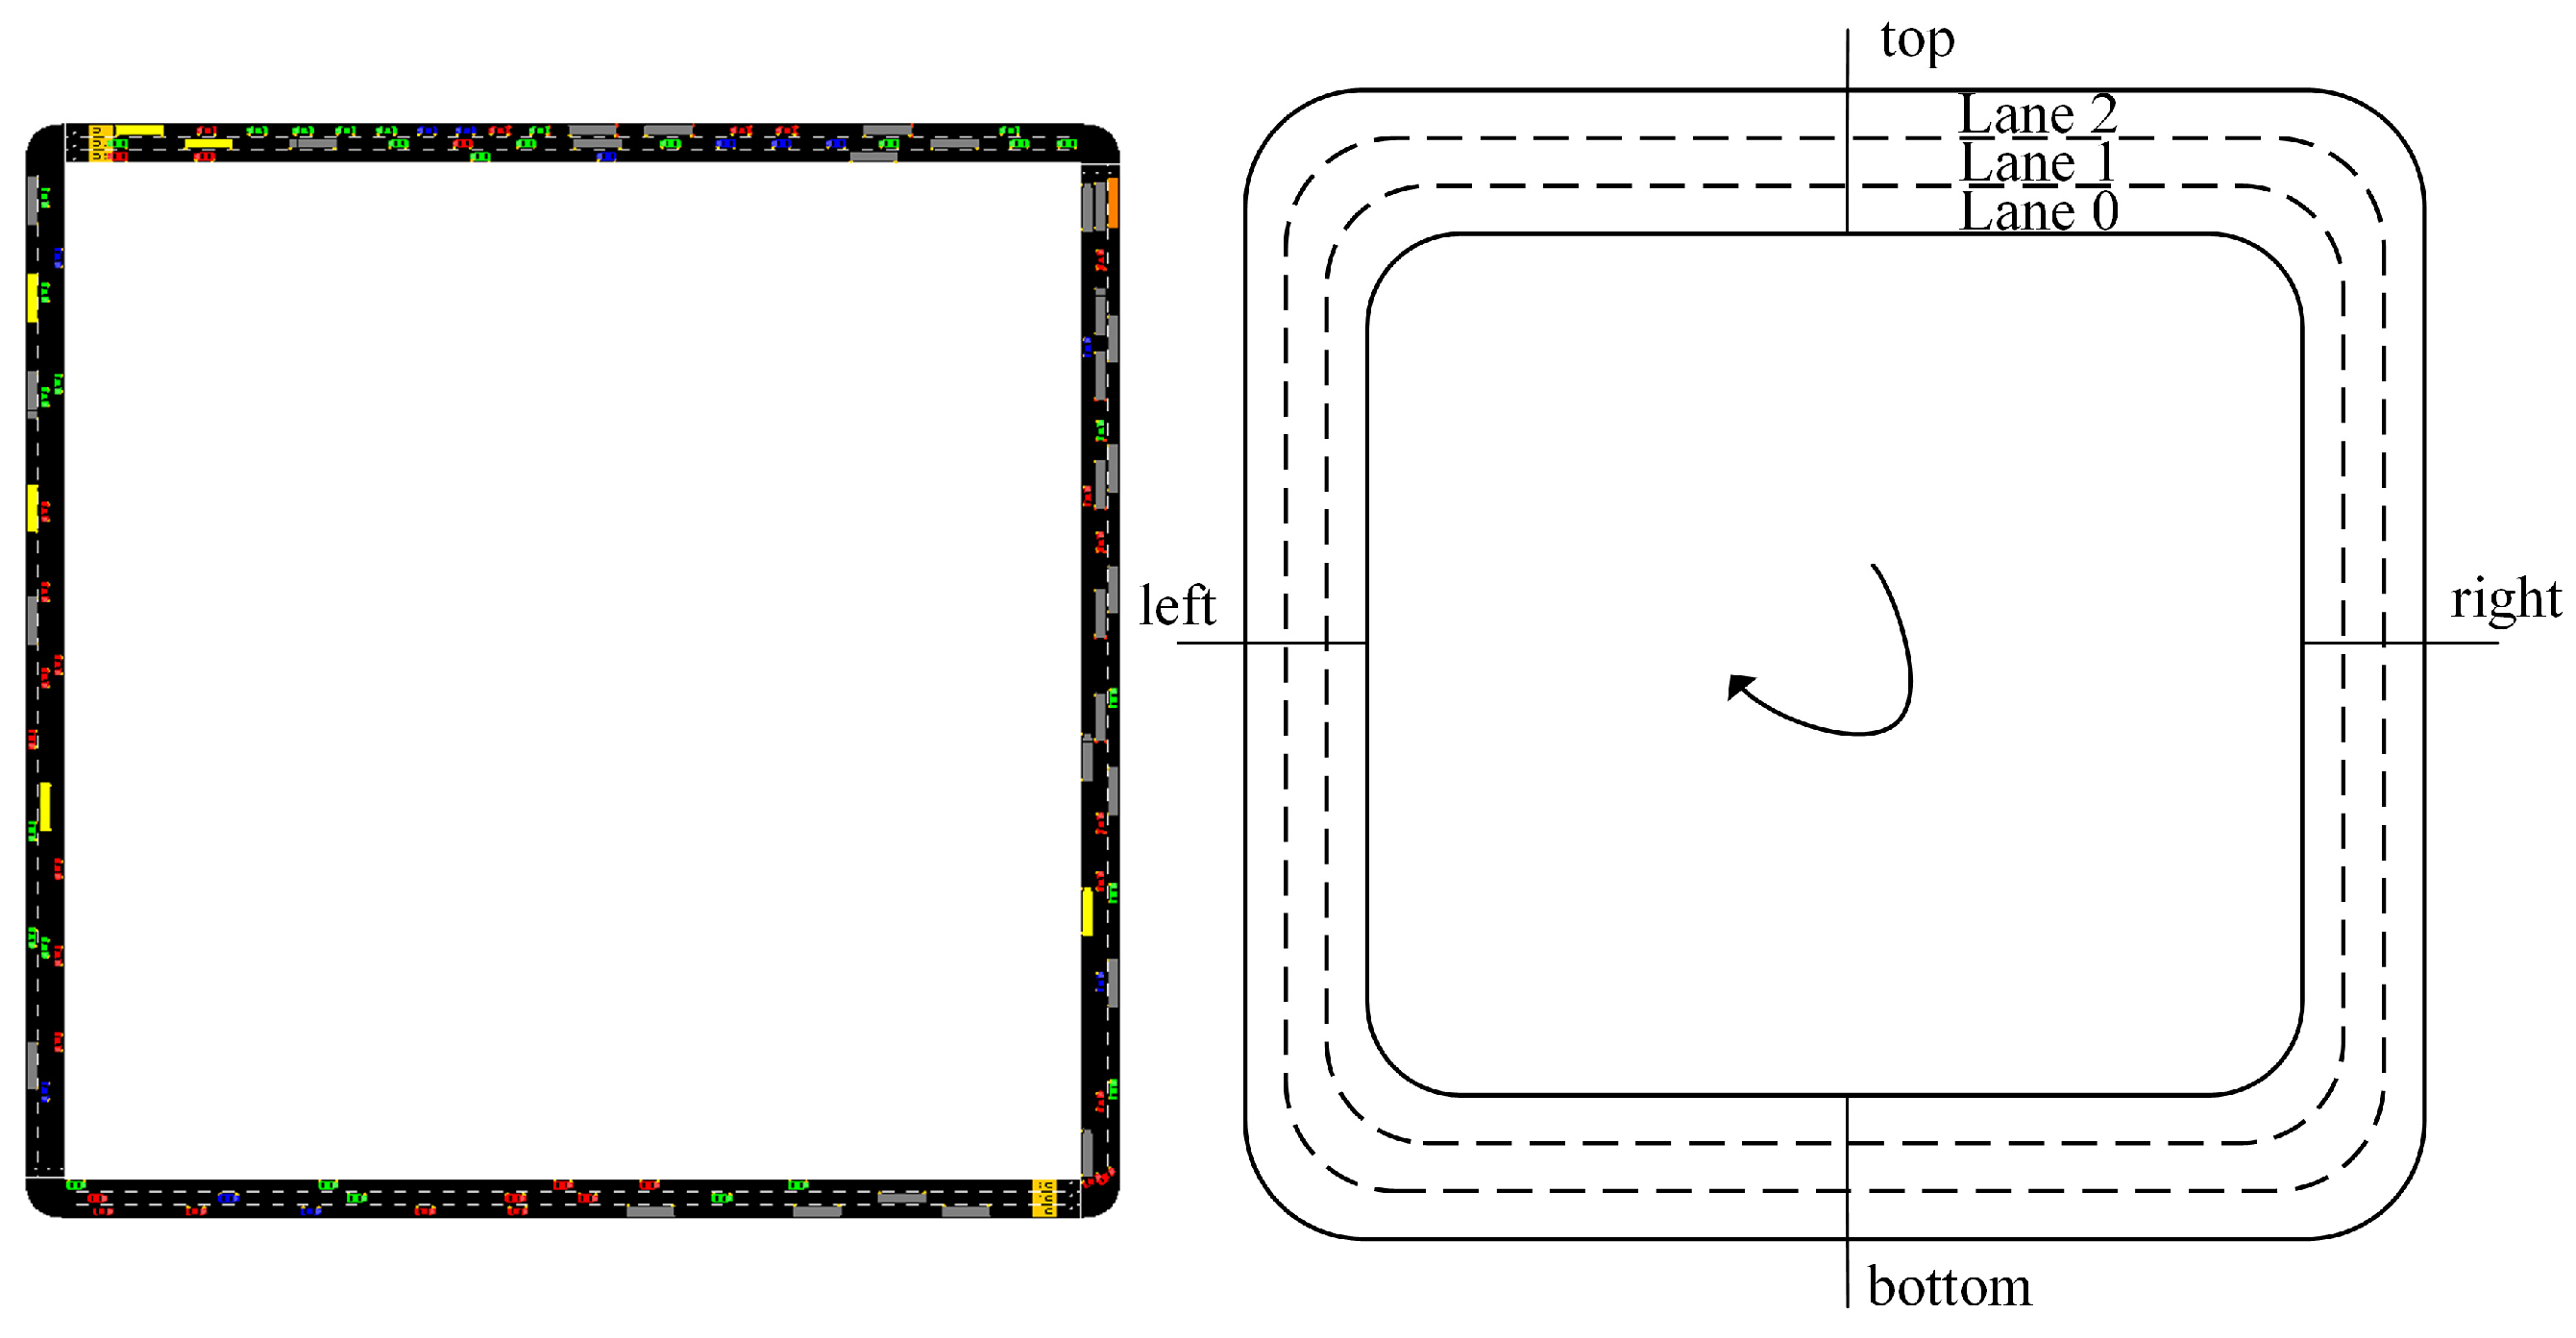
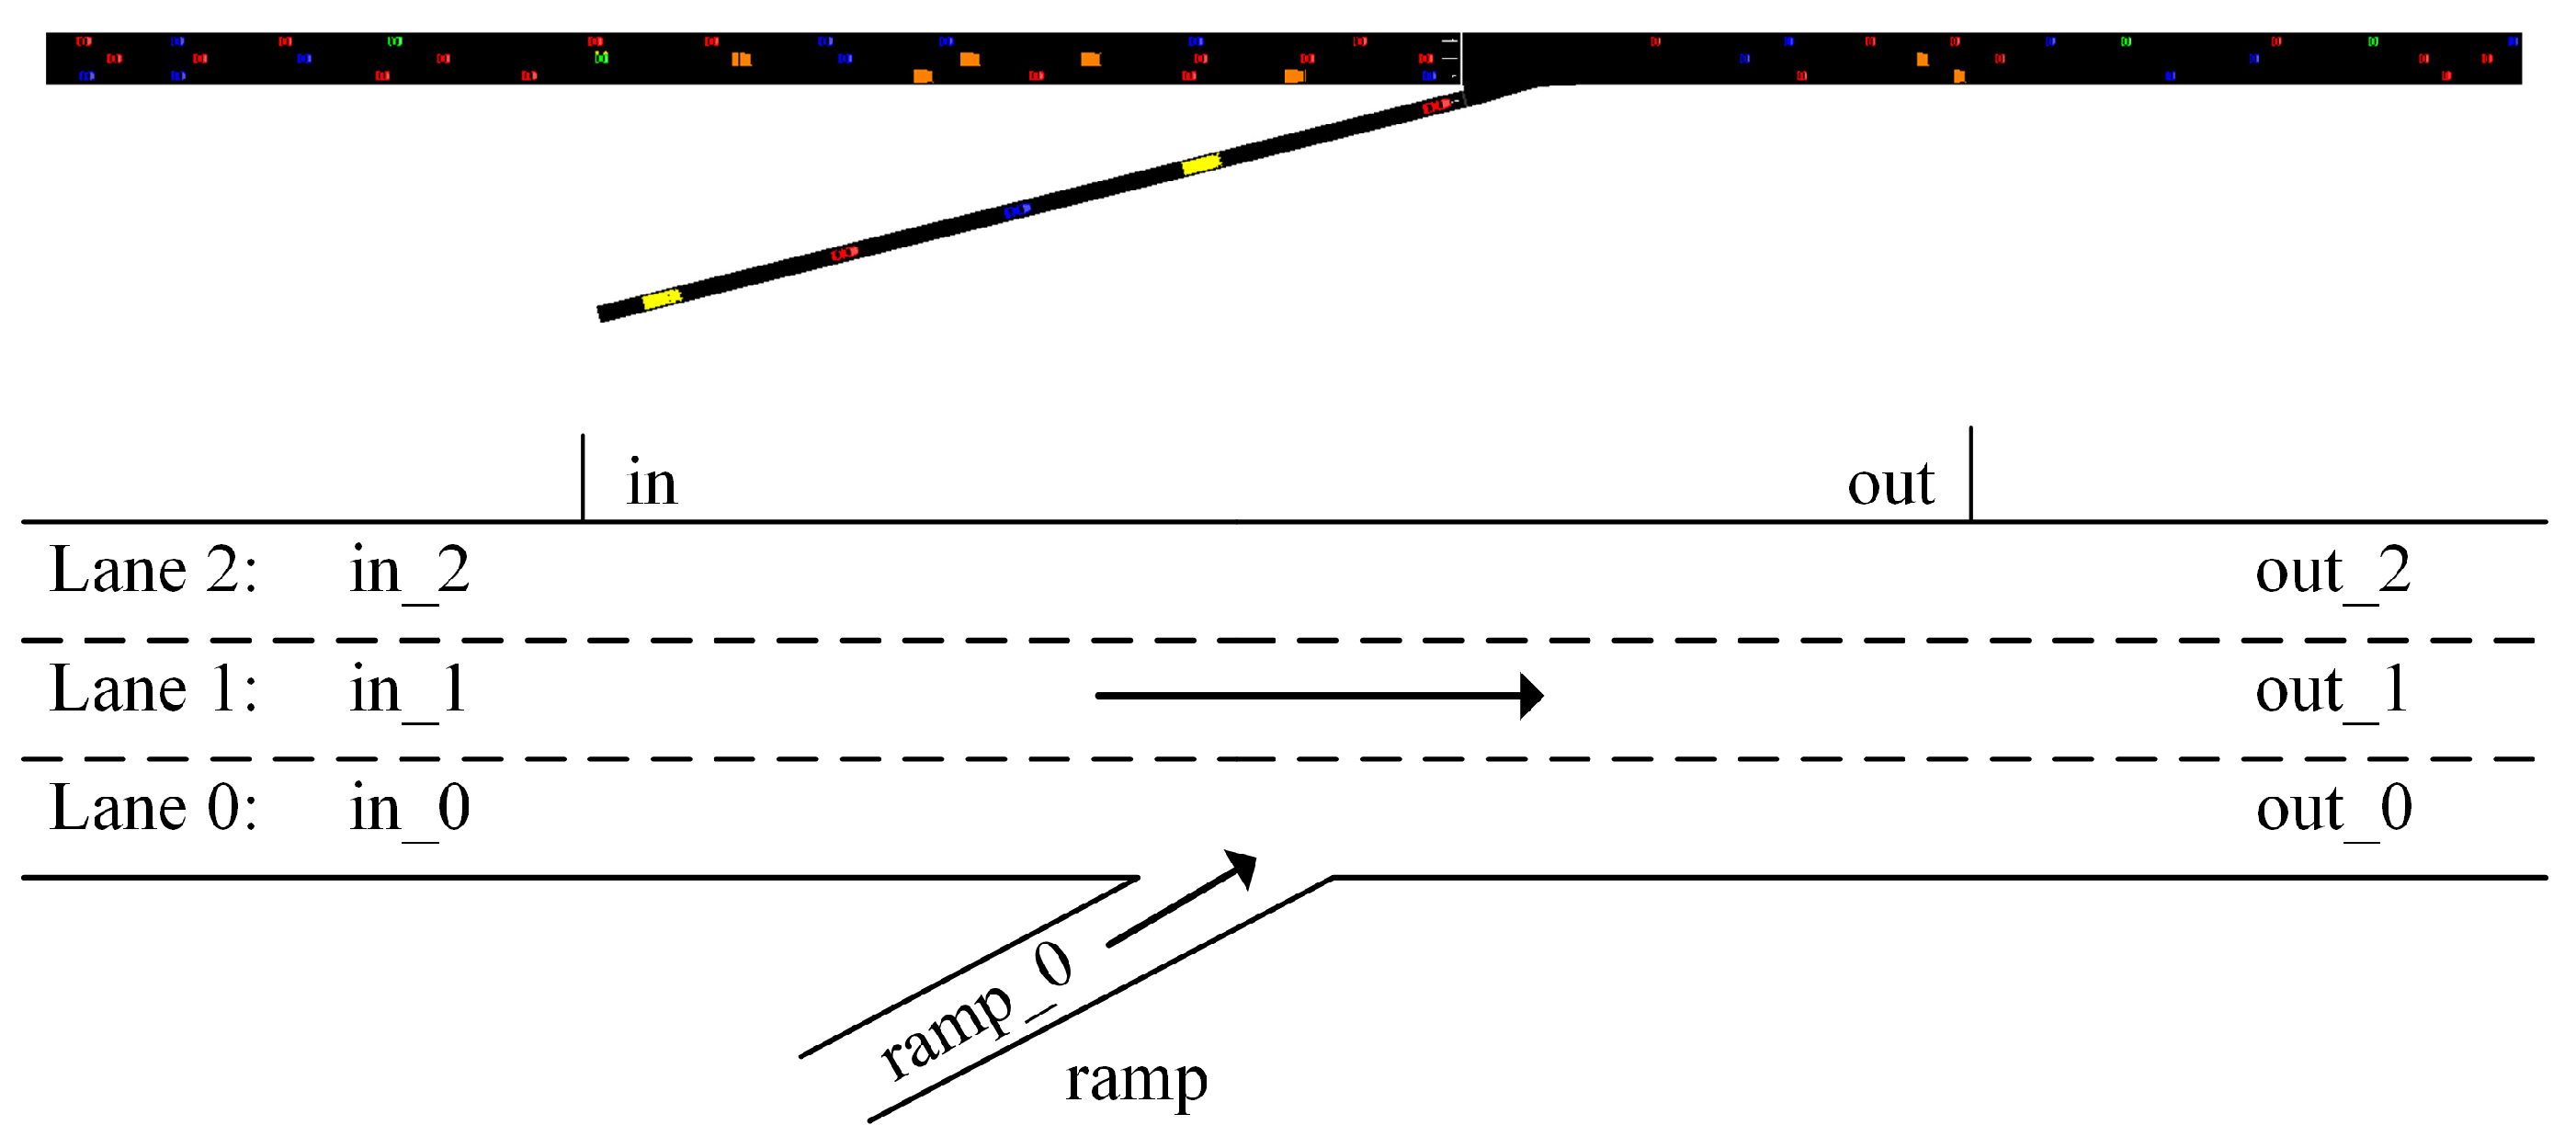
To evaluate traffic efficiency, dynamics, safety, and environment in mixed traffic flow consisting of CAVs, AVs, and HDVs for both cars and trucks, all experiments were carried out on the circular road and highway. The simulation road networks consist of a 1 km three-lane ring road and highway with an on-ramp, as illustrated in Figure 3 and Figure 4. Based on the driving behaviors of different vehicle types, these types can be categorized as connected and autonomous cars, connected and autonomous trucks, autonomous cars, autonomous trucks, human-driven cars, and human-driven trucks. In these experiments, these vehicles were represented in red, orange, blue, yellow, green, and gray, respectively. The network configuration is detailed in Table 1. The proportion of cars to trucks on the roads is usually affected by various factors such as location, traffic flow, time of day, and the use of a specific road segment. In general, passenger vehicles constitute the majority of vehicles on the roads, with trucks accounting for a smaller share. In the simulation experiment with a total traffic load of 2500 vehicles, the ratio of cars to trucks is 7:3. The traffic load is randomly generated based on the Python script, and each simulation step lasts 0.1 s. Considering the penetration rates of various vehicle types, all experiments are carried out using a simulation platform that integrates Python and SUMO to evaluate the traffic performance of heterogeneous traffic. To account for the randomness of mixed traffic flow, each experimental scenario was conducted 10 times, and the average of these runs was taken as the result.
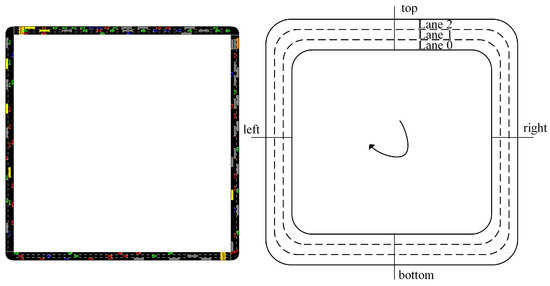
Figure 3.
The schematic diagram of the ring road.
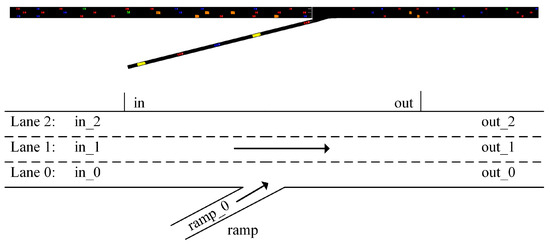
Figure 4.
The schematic diagram of the highway.

Table 1.
The network set-up for the ring road and freeway.
In a traffic condition where HDVs, AVs, and CAVs coexist, CF models based on IDM, ACC, and CACC were utilized to simulate and analyze the driving behavior of the mixed traffic. These models are employed to describe the dynamic interactions and responses of various vehicle types in complex traffic situations, with their parameters derived from the literature [51,52] as in Table 2. The vehicle types for cars and trucks are labeled as “passenger” and “truck,” respectively. For manually driven vehicles, taking into account the potential imperfections in real-world driving, such as fatigue, distraction, or slow reactions, driving errors are introduced through a driver state device within the car-following model and lane-changing model to more accurately simulate driver behavior. In these experiments, the settings for all parameters were taken from the literature [53] as in Table 3.
Table 2.
Parameters of the IDM for cars and trucks.
Table 3.
Parameters of the driver state device for HDVs.
The proportion of vehicles with different levels of automation is a variable that evolves with technological progress and time and is closely related to policies, infrastructure, technological maturity, and public acceptance in different countries and regions. According to the previous literature [54], the parameter values for the ACC and CACC car-following models for cars and trucks in the experiment are presented in Table 4.
Table 4.
Parameters of the ACC and CACC for cars and trucks.
Table 5 shows different proportions of AVs, CAVs, and HDVs in mixed traffic scenarios on the road networks. The experimental scenarios for the road network consist of Scenario 1, 2, and 3, and the baseline, which are represented by blue, orange, yellow, and green, respectively.
Table 5.
Experimental scenarios on the road networks.
5.2. Results and Discussion
Key performance indicators (KPIs) are introduced to explore the impact of heterogeneous traffic flow on traffic efficiency, safety, dynamics, and the environment for vehicles with different levels of automation, penetration rates, and road networks. In this simulation experiment, the KPIs employed to assess these traffic performance factors are presented in Table 6.
Table 6.
Evaluation parameters for the experimental simulation.
5.2.1. Impacts on Traffic Efficiency
To measure the traffic efficiency of various road networks, the average speed and the distribution of travel time were explored for different mixed traffic scenarios with varying proportions of CAVs, AVs, and HDVs.
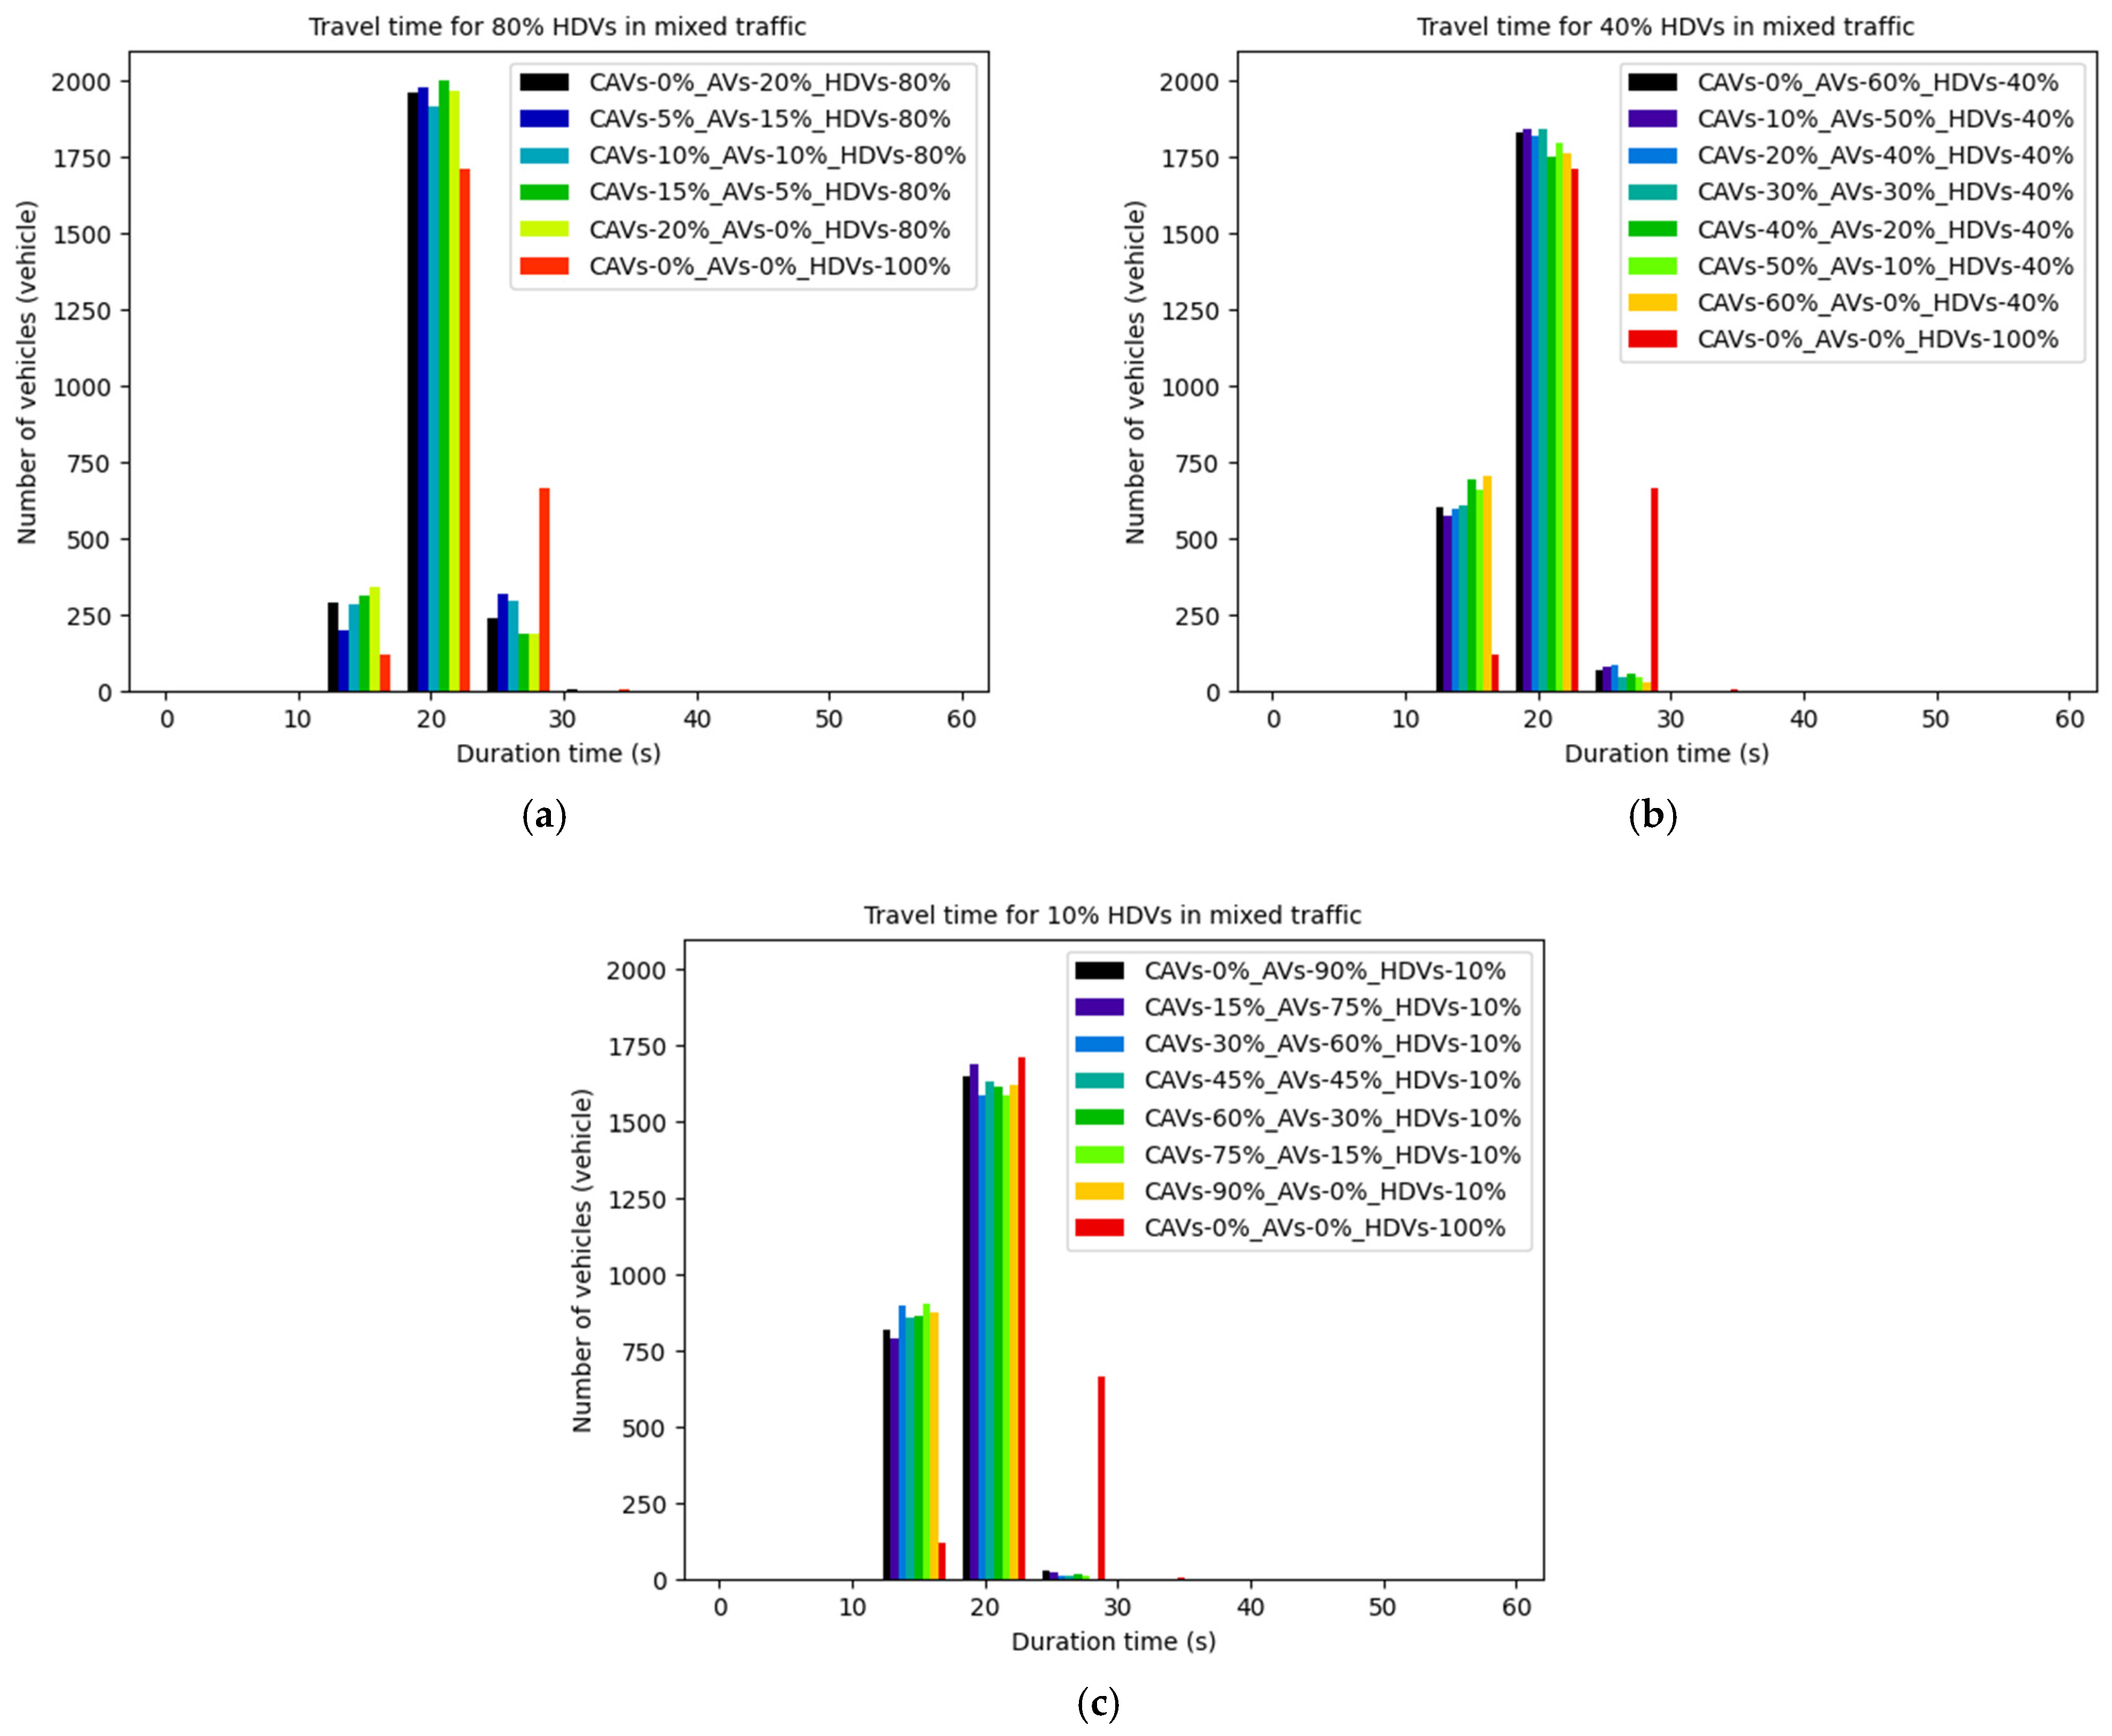
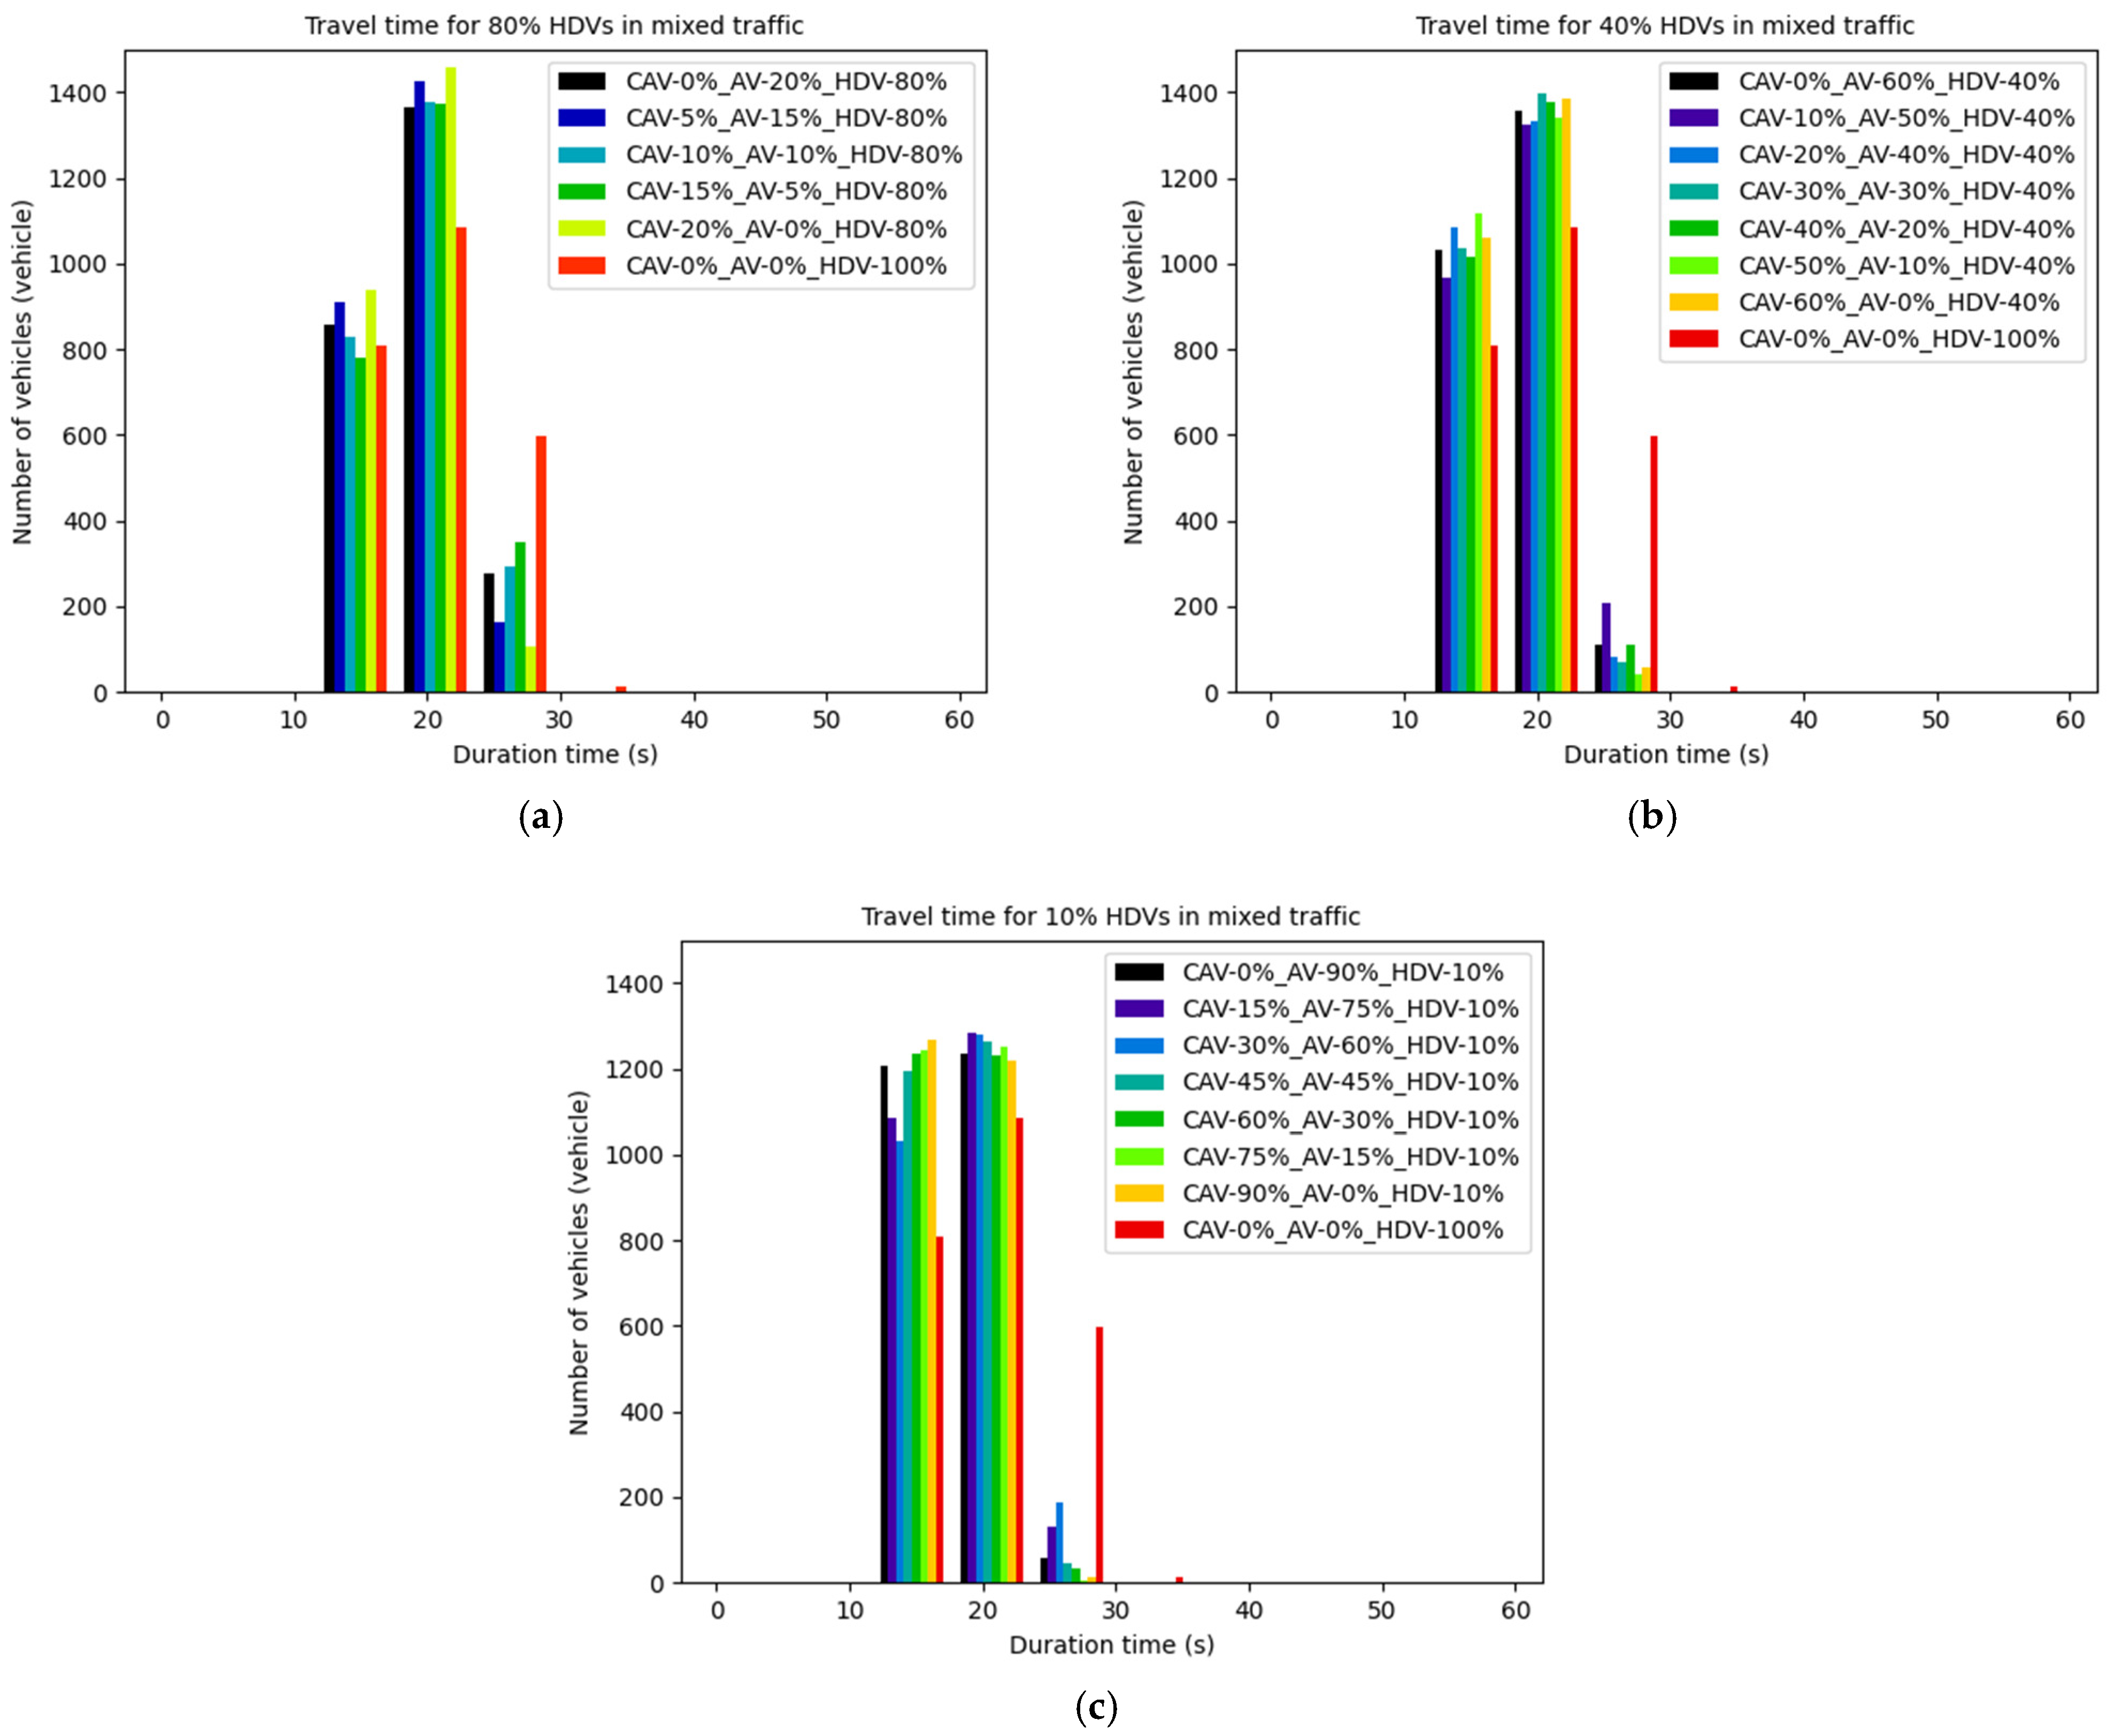
Figure 5 illustrates the distribution of travel time in mixed traffic with different proportions of HDVs (80%, 40%, and 10%) on the ring road. The baseline scenario (100% HDVs) showed a broader range of travel time, suggesting greater variability and potential congestion or delay. It can be seen from Figure 5a that the travel time in mixed traffic was primarily clustered between 20 s and 25 s in Scenario 1 (80% HDVs), and the travel time decreased slightly as the proportion of CAVs increased (e.g., 15% and 20%). In addition, a higher percentage of CAVs seemed to slightly shift the travel time distribution towards shorter duration, suggesting minor improvements in traffic efficiency in mixed traffic. In Figure 5b, the peak number of vehicles was spread between 20 s and 25 s when the percentage of HDVs was reduced to 40%. Compared to Scenario 1 (80% HDVs), the introduction of CAVs and AVs can significantly shorten the duration. In Figure 5c, the travel time was generally lower and more tightly clustered, with most durations falling between 15 s and 25 s. The combinations with higher percentages of CAVs and AVs showed the most significant improvement, with travel time shifting even further left, indicating faster and more consistent travel time.
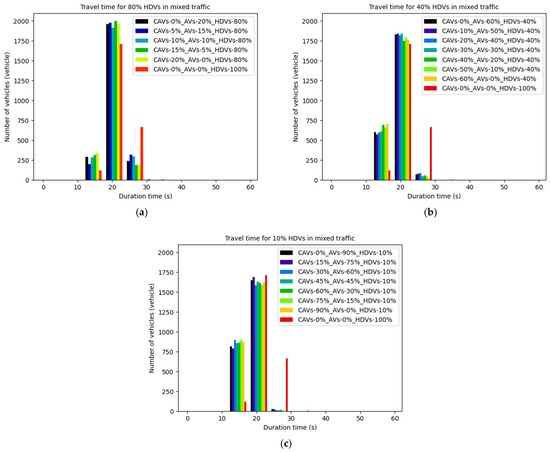
Figure 5.
The distribution of travel time for different proportions of mixed traffic on the ring road. (a) The travel time for 80% of HDVs (Scenario 1); (b) The travel time for 40% of HDVs (Scenario 2); (c) The travel time for 10% of HDVs (Scenario 3).
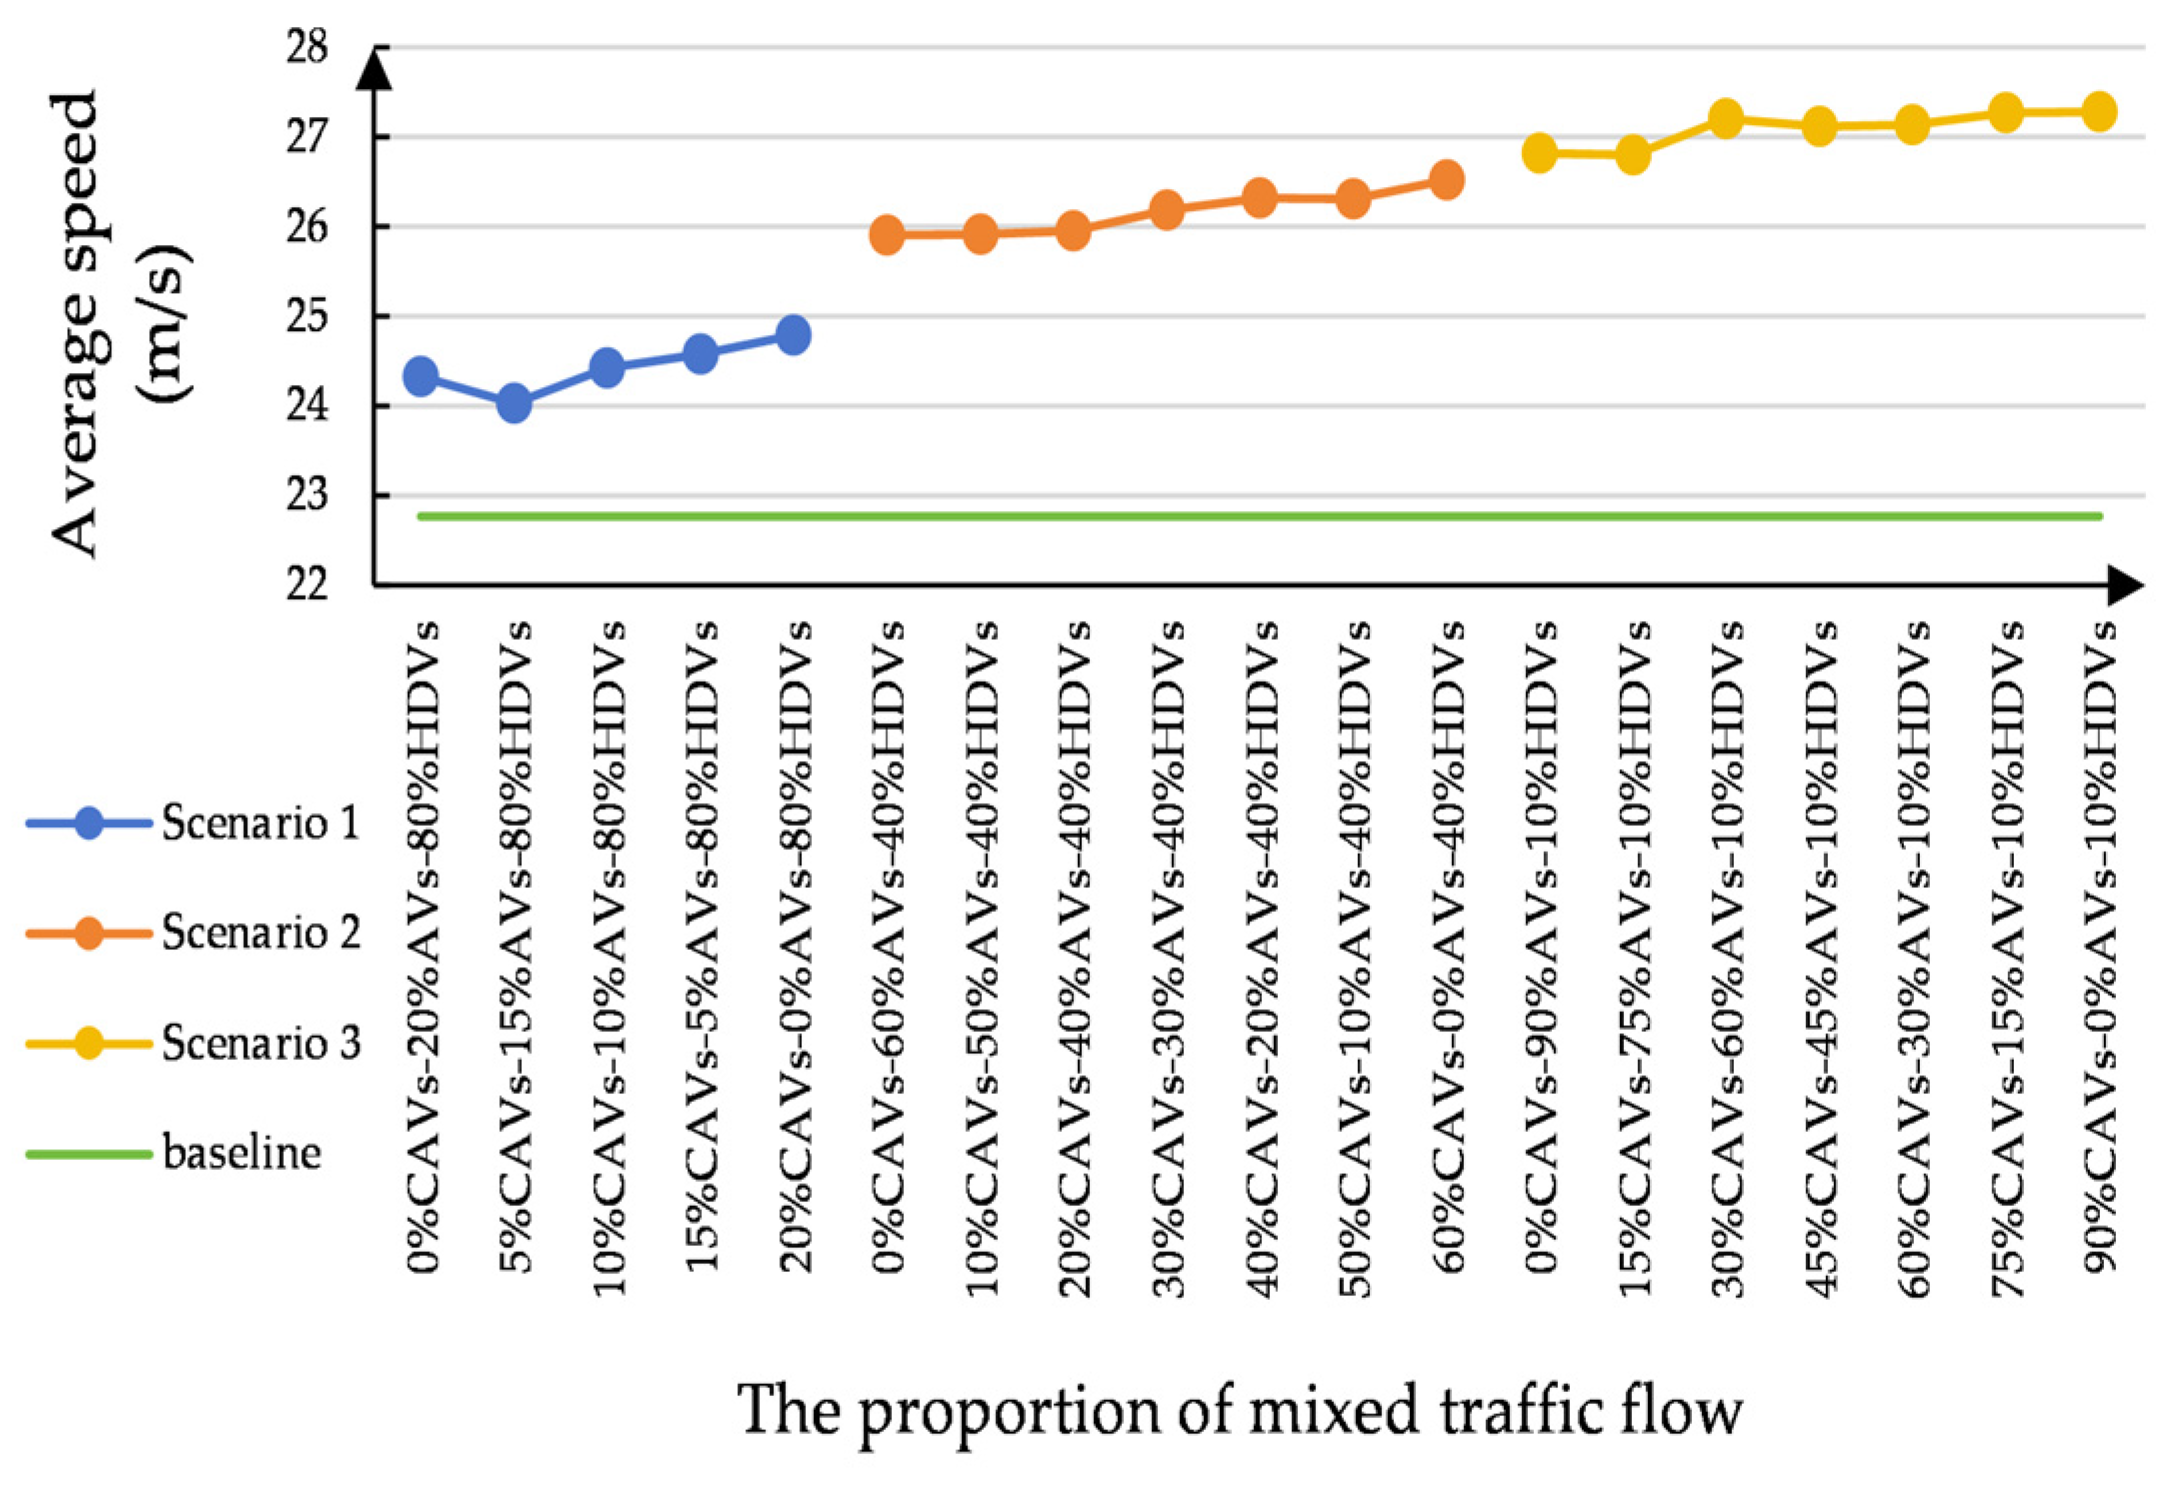
The line chart of the average speed of mixed traffic flow with different proportions on the ring road is shown in Figure 6.

Figure 6.
The average speed for different proportions of mixed traffic on the ring road.
It can be observed that when the proportion of HDVs was high, the average speed of the mixed traffic flow was relatively low. This is because the introduction of CAVs and AVs largely offset the negative impact of HDVs on the traffic flow. As the percentage of HDVs dropped, the variation in average speed in mixed traffic became more noticeable. In the same situation (Scenario 1, 2, and 3), a higher number of CAVs or an appropriate combination of CAVs and AVs significantly improved traffic efficiency on the ring road. This is attributed to the fact that the collaborative abilities of CAVs help smooth traffic flow and reduce congestion, leading to increased average speed.
These analyses demonstrate that as the proportion of HDVs decreases and the share of CAVs and AVs increases, traffic efficiency improves considerably. A higher proportion of CAVs and AVs contributed to shortening travel time and increasing average speed, highlighting their potential advantages in mixed traffic efficiency.
The distribution of travel time for different proportions of mixed traffic on the highway is depicted in Figure 7. In the baseline scenario, it is noticeable that the vehicle travel time was concentrated around 20 s, and some vehicles even exceeded 30 s. In Figure 7a, the travel time of most vehicles was clustered between 15 s and 25 s in Scenario 1, but the increase in the proportion of CAVs and AVs did not lead to a significant change in travel time.
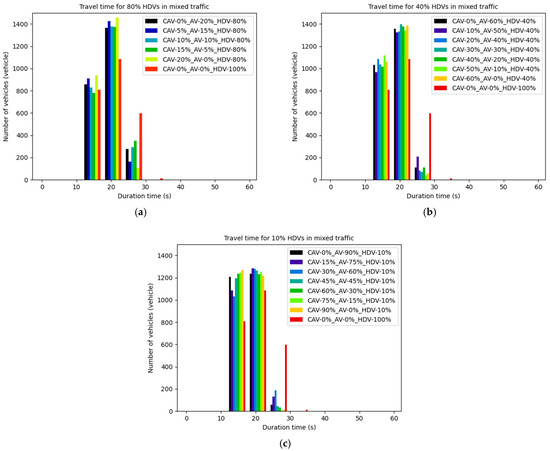
Figure 7.
The distribution of travel time for different proportions of mixed traffic on the highway. (a) The travel time for 80% of HDVs (Scenario 1); (b) The travel time for 40% of HDVs (Scenario 2); (c) The travel time for 10% of HDVs (Scenario 3).
Compared to Scenario 1, the travel time distribution in Scenario 2 was more concentrated, with a peak of around 20 s. In the case of a high proportion of CAVs and AVs (e.g., CAV-60%, AV-0%), the travel time distribution was very narrow, with almost all vehicles completing their trips in under 20 s. More CAVs resulted in faster, more consistent travel time, indicating that a higher presence of CAVs improves overall traffic flow. In Figure 7c, the distribution of travel time was more concentrated in shorter intervals (15–25 s), and a relatively short travel time was maintained in most scenarios with different proportions. As the proportion of HDVs decreased and the proportion of CAVs and AVs increased, the travel time became even shorter. When the proportion of HDVs was 10%, introducing CAVs and AVs greatly enhanced traffic efficiency, resulting in shorter travel times that were mostly concentrated in shorter intervals.
From the above analysis, it is evident that in mixed traffic, as the proportion of CAVs and AVs increased, the distribution of travel time became more concentrated and shorter, suggesting an improvement in traffic efficiency. The higher the percentage of HDVs, the longer the travel time, especially in scenarios with fewer CAVs and AVs. The shift from 80% HDVs to 10% HDVs led to a significant reduction in travel time and a more efficient traffic flow.
Figure 8 showed the average speed in the different scenarios on the highway. It is observed from Scenario 1 that the average speed remained at about 21 m/s as the proportion of CAVs increased. The slight increase in average speed compared to the baseline scenario suggested that with 80% HDVs, the introduction of CAVs and AVs has a limited effect on enhancing traffic efficiency. This could be due to the benefits of CAVs being neutralized in the mixed traffic flow. In Scenario 2, the average speed of traffic flow improved significantly as the proportion of CAVs in mixed traffic increased, especially when the percentage of CAVs exceeded 30%, with the average speed rising to over 22 m/s. Nevertheless, when the number of CAVs was small (around 10% or 20%), the improvement in average speed was fairly small, which may be due to the fact that bottlenecks and delay occur during merging and lane changes in mixed traffic flow. In Scenario 3, the average speed reached its peak, approaching 24.5 m/s. However, when the number of CAVs and AVs in the mixed traffic was lower, the average speed experienced a slight decline but was higher than the average speed in Scenarios 1 and 2. This could be related to the merging of the on-ramp and traffic density on the highway.
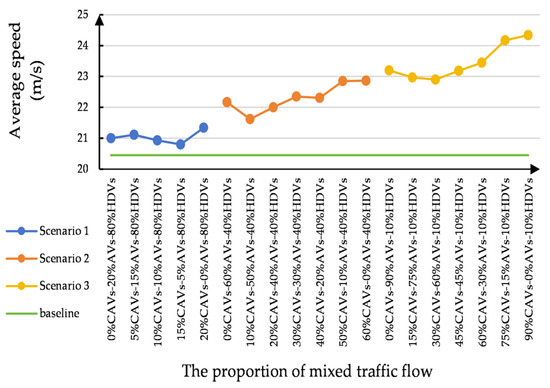
Figure 8.
The average speed for different proportions of mixed traffic flow on the highway.
From the analysis above, it is evident that the average speed tended to increase as the proportion of CAVs grew. This suggested that autonomous driving technology contributes to enhancing traffic efficiency on the highway. However, when the percentage of autonomous vehicles is very low, the increase in average speed slightly decreases, which may be related to the interactions between different types of vehicles and the complexity of the on-ramp.
5.2.2. Impacts on Traffic Dynamics
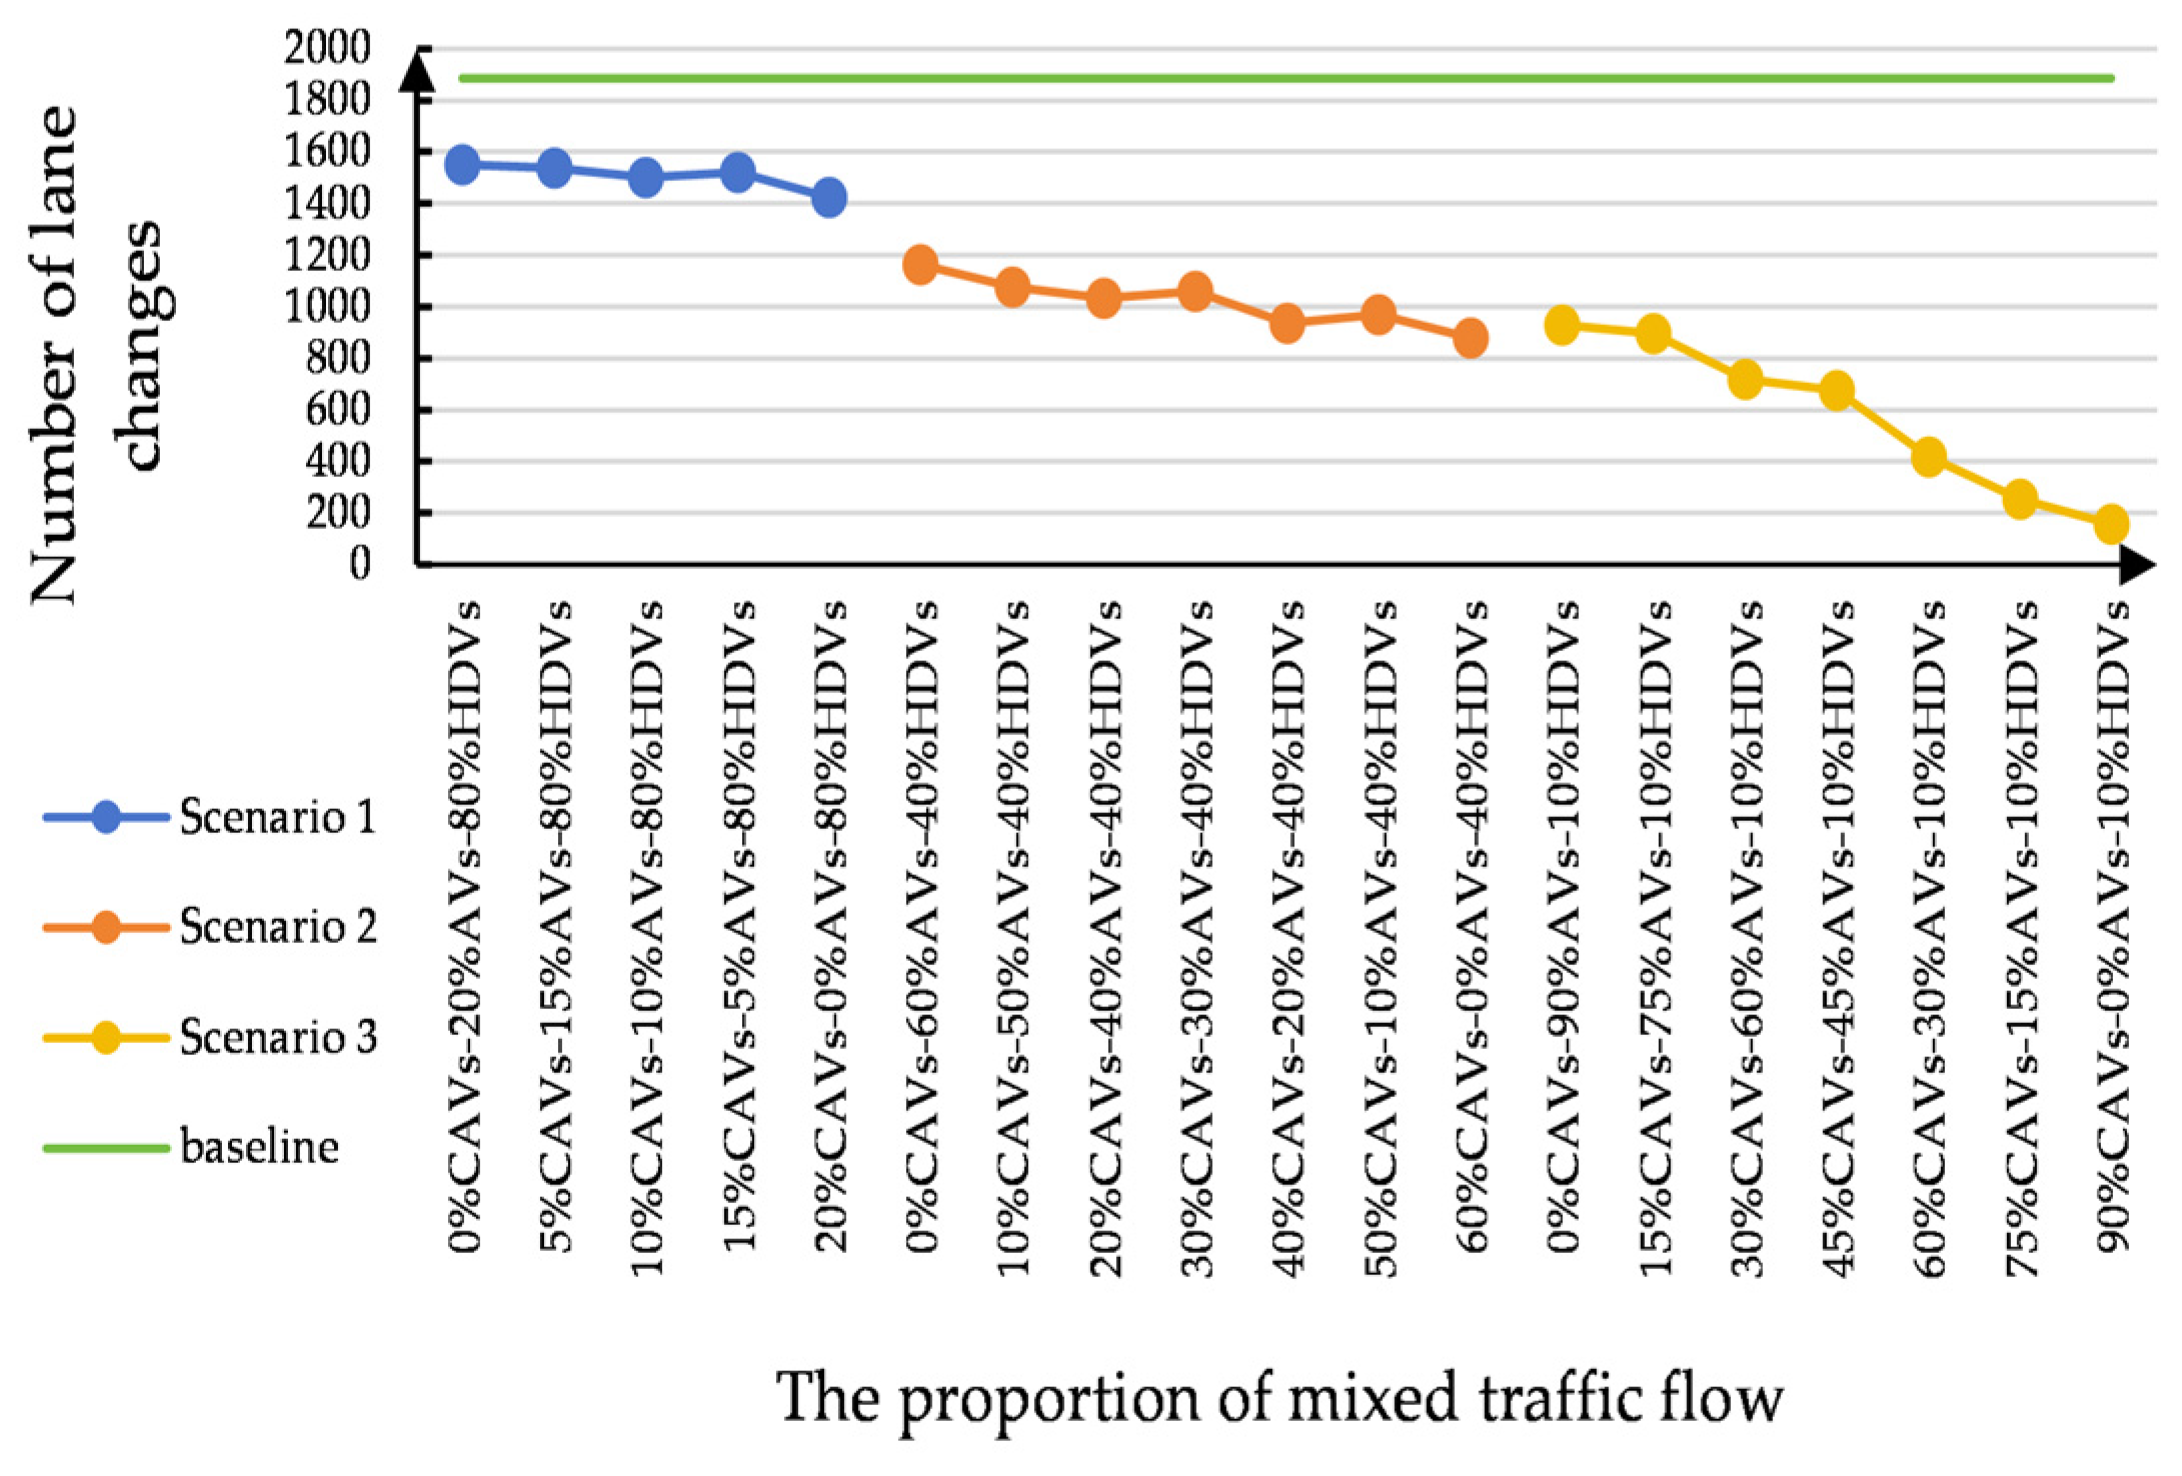
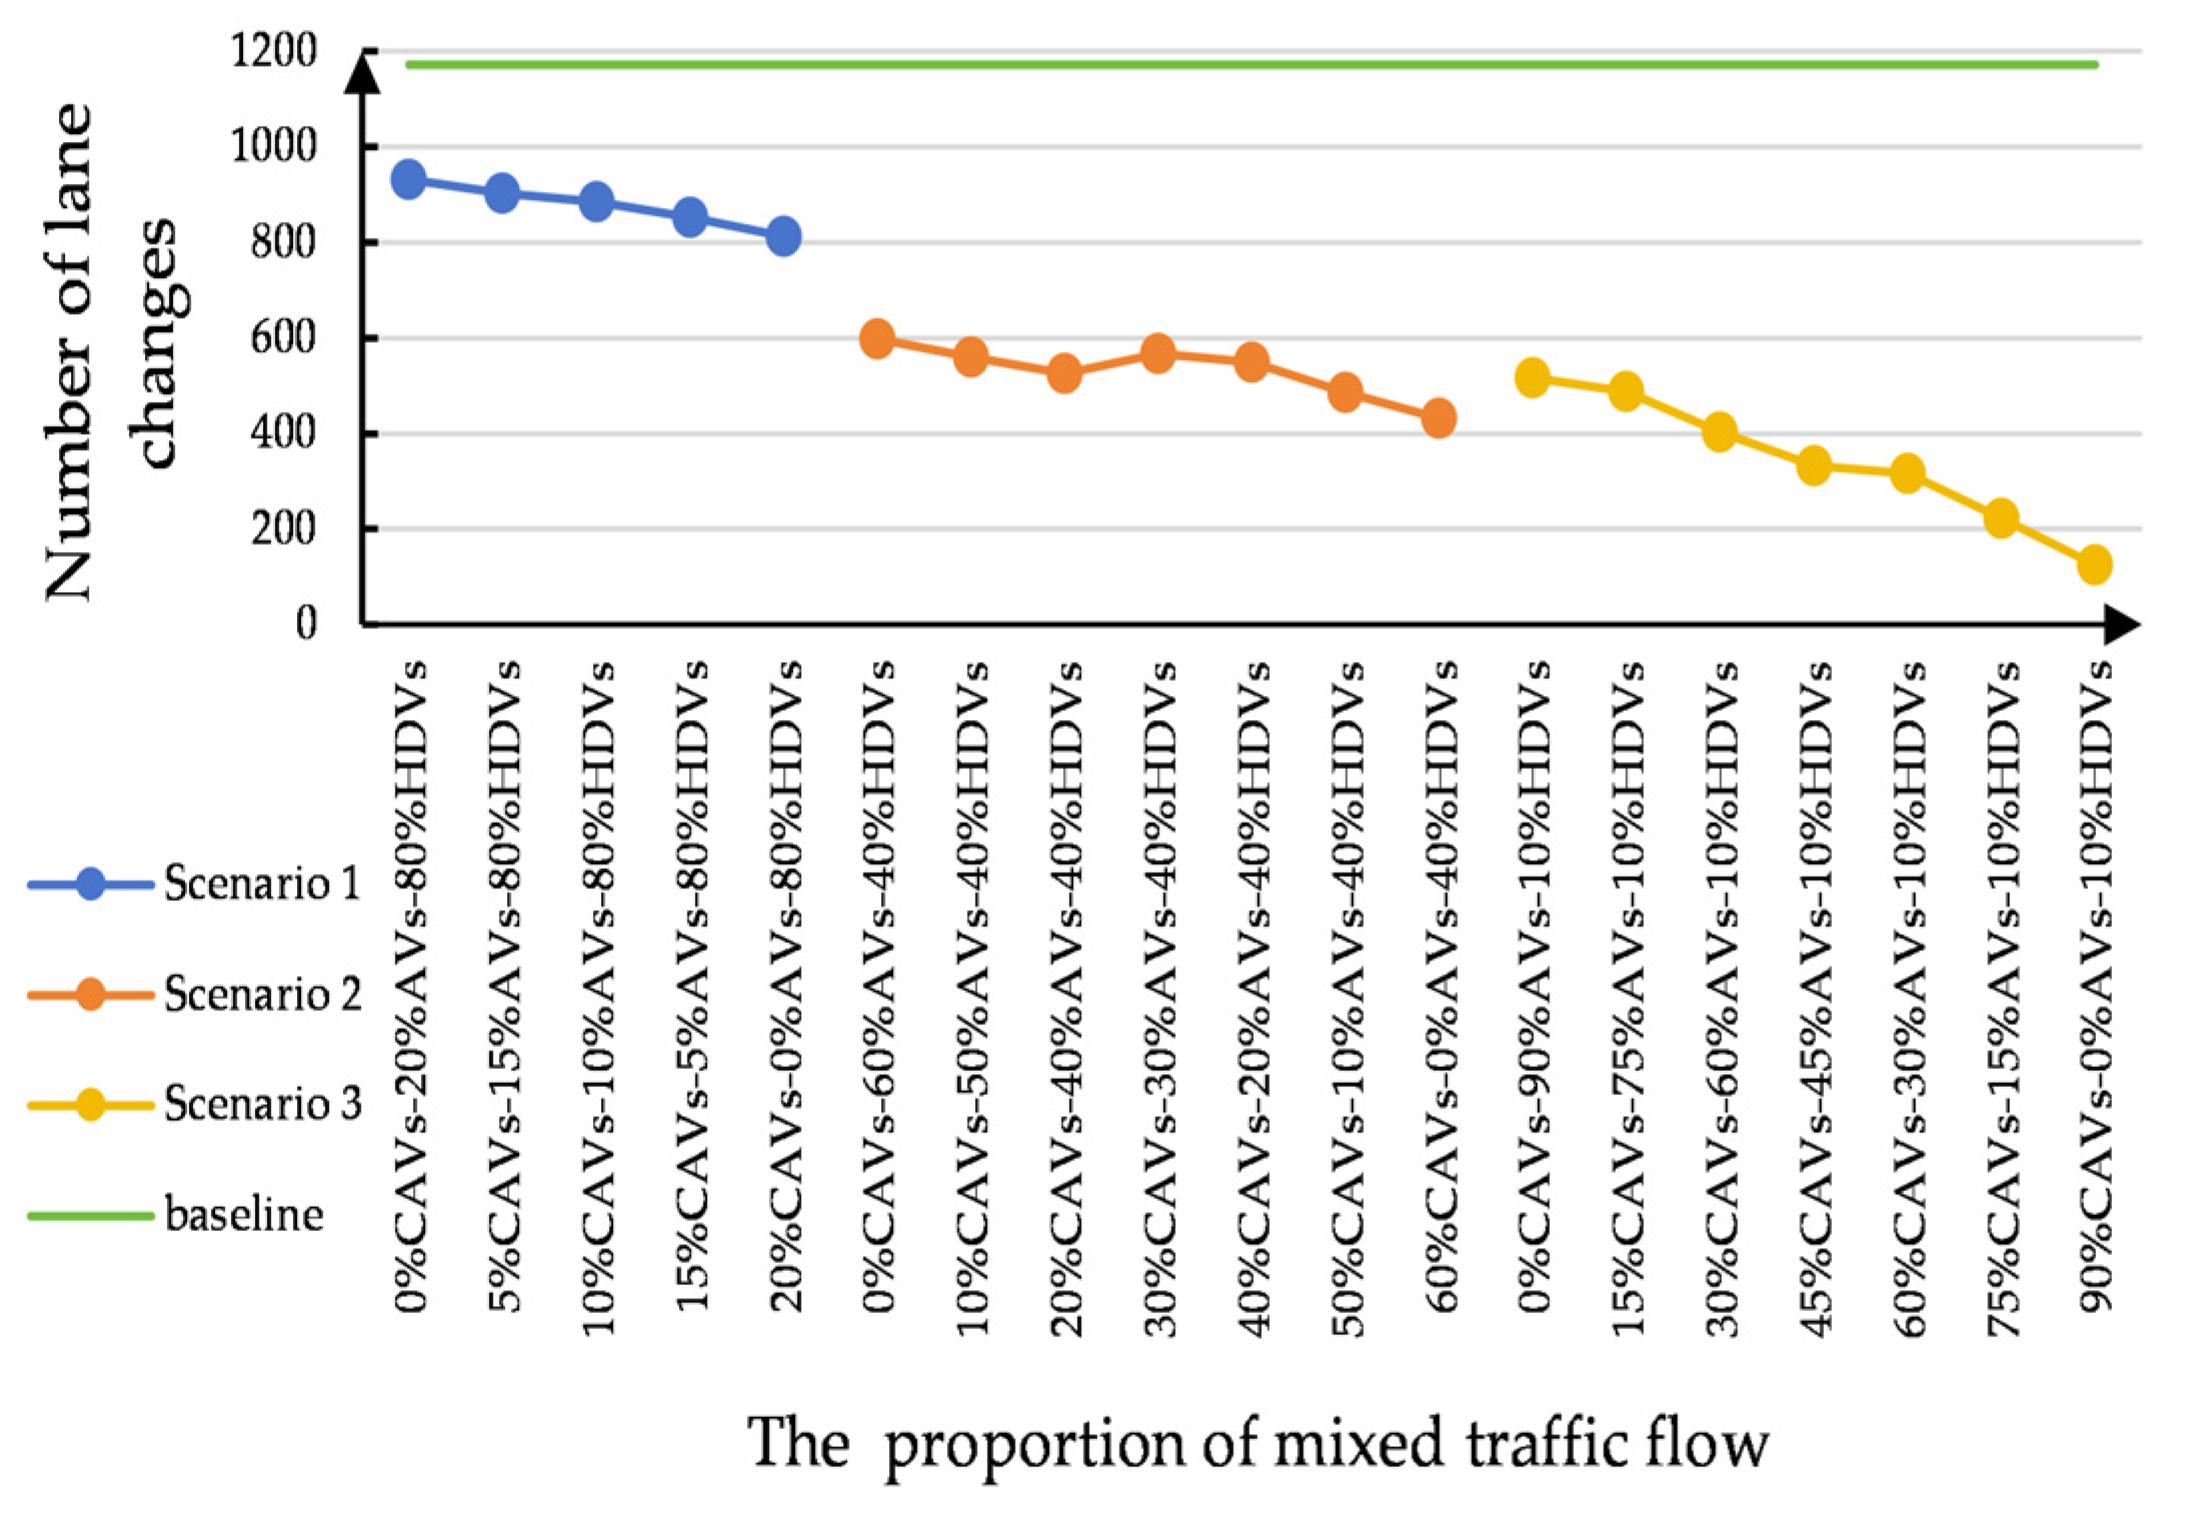
To evaluate the impact of traffic dynamics, the number of lane changes on the ring road and highway under different experimental scenarios was analyzed, as shown in Figure 9 and Figure 10. In Scenario 1, it is evident that as the percentage of CAVs rose, the number of lane changes did not change significantly and remained at a high level. This suggested that in an environment dominated by HDVs, increasing the number of CAVs does not lead to a significant reduction in lane-changing behavior. The primary reason is that the high proportion of HDVs has a substantial negative impact on the dynamics of traffic flow. The number of lane changes in Scenario 3 was the lowest when compared to Scenario 1 and Scenario 2. In comparison to the baseline scenario, the number of lane changes gradually decreased as the proportion of CAVs and AVs increased. This indicated that CAV technologies can reduce lane-changing behavior and improve the stability and efficiency of traffic flow.
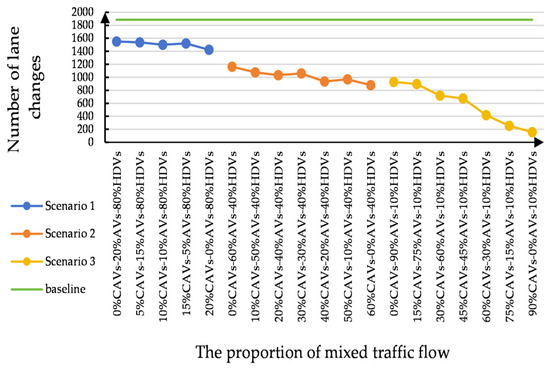
Figure 9.
The number of lane changes on the ring road.

Figure 10.
The number of lane changes on the highway.
On the highway with an on-ramp and ring road, the variation in the proportion of different types of vehicles has a direct impact on traffic dynamics. In addition, the introduction of CAVs contributes to optimizing overall traffic flow and safety.
5.2.3. Impacts on Traffic Safety
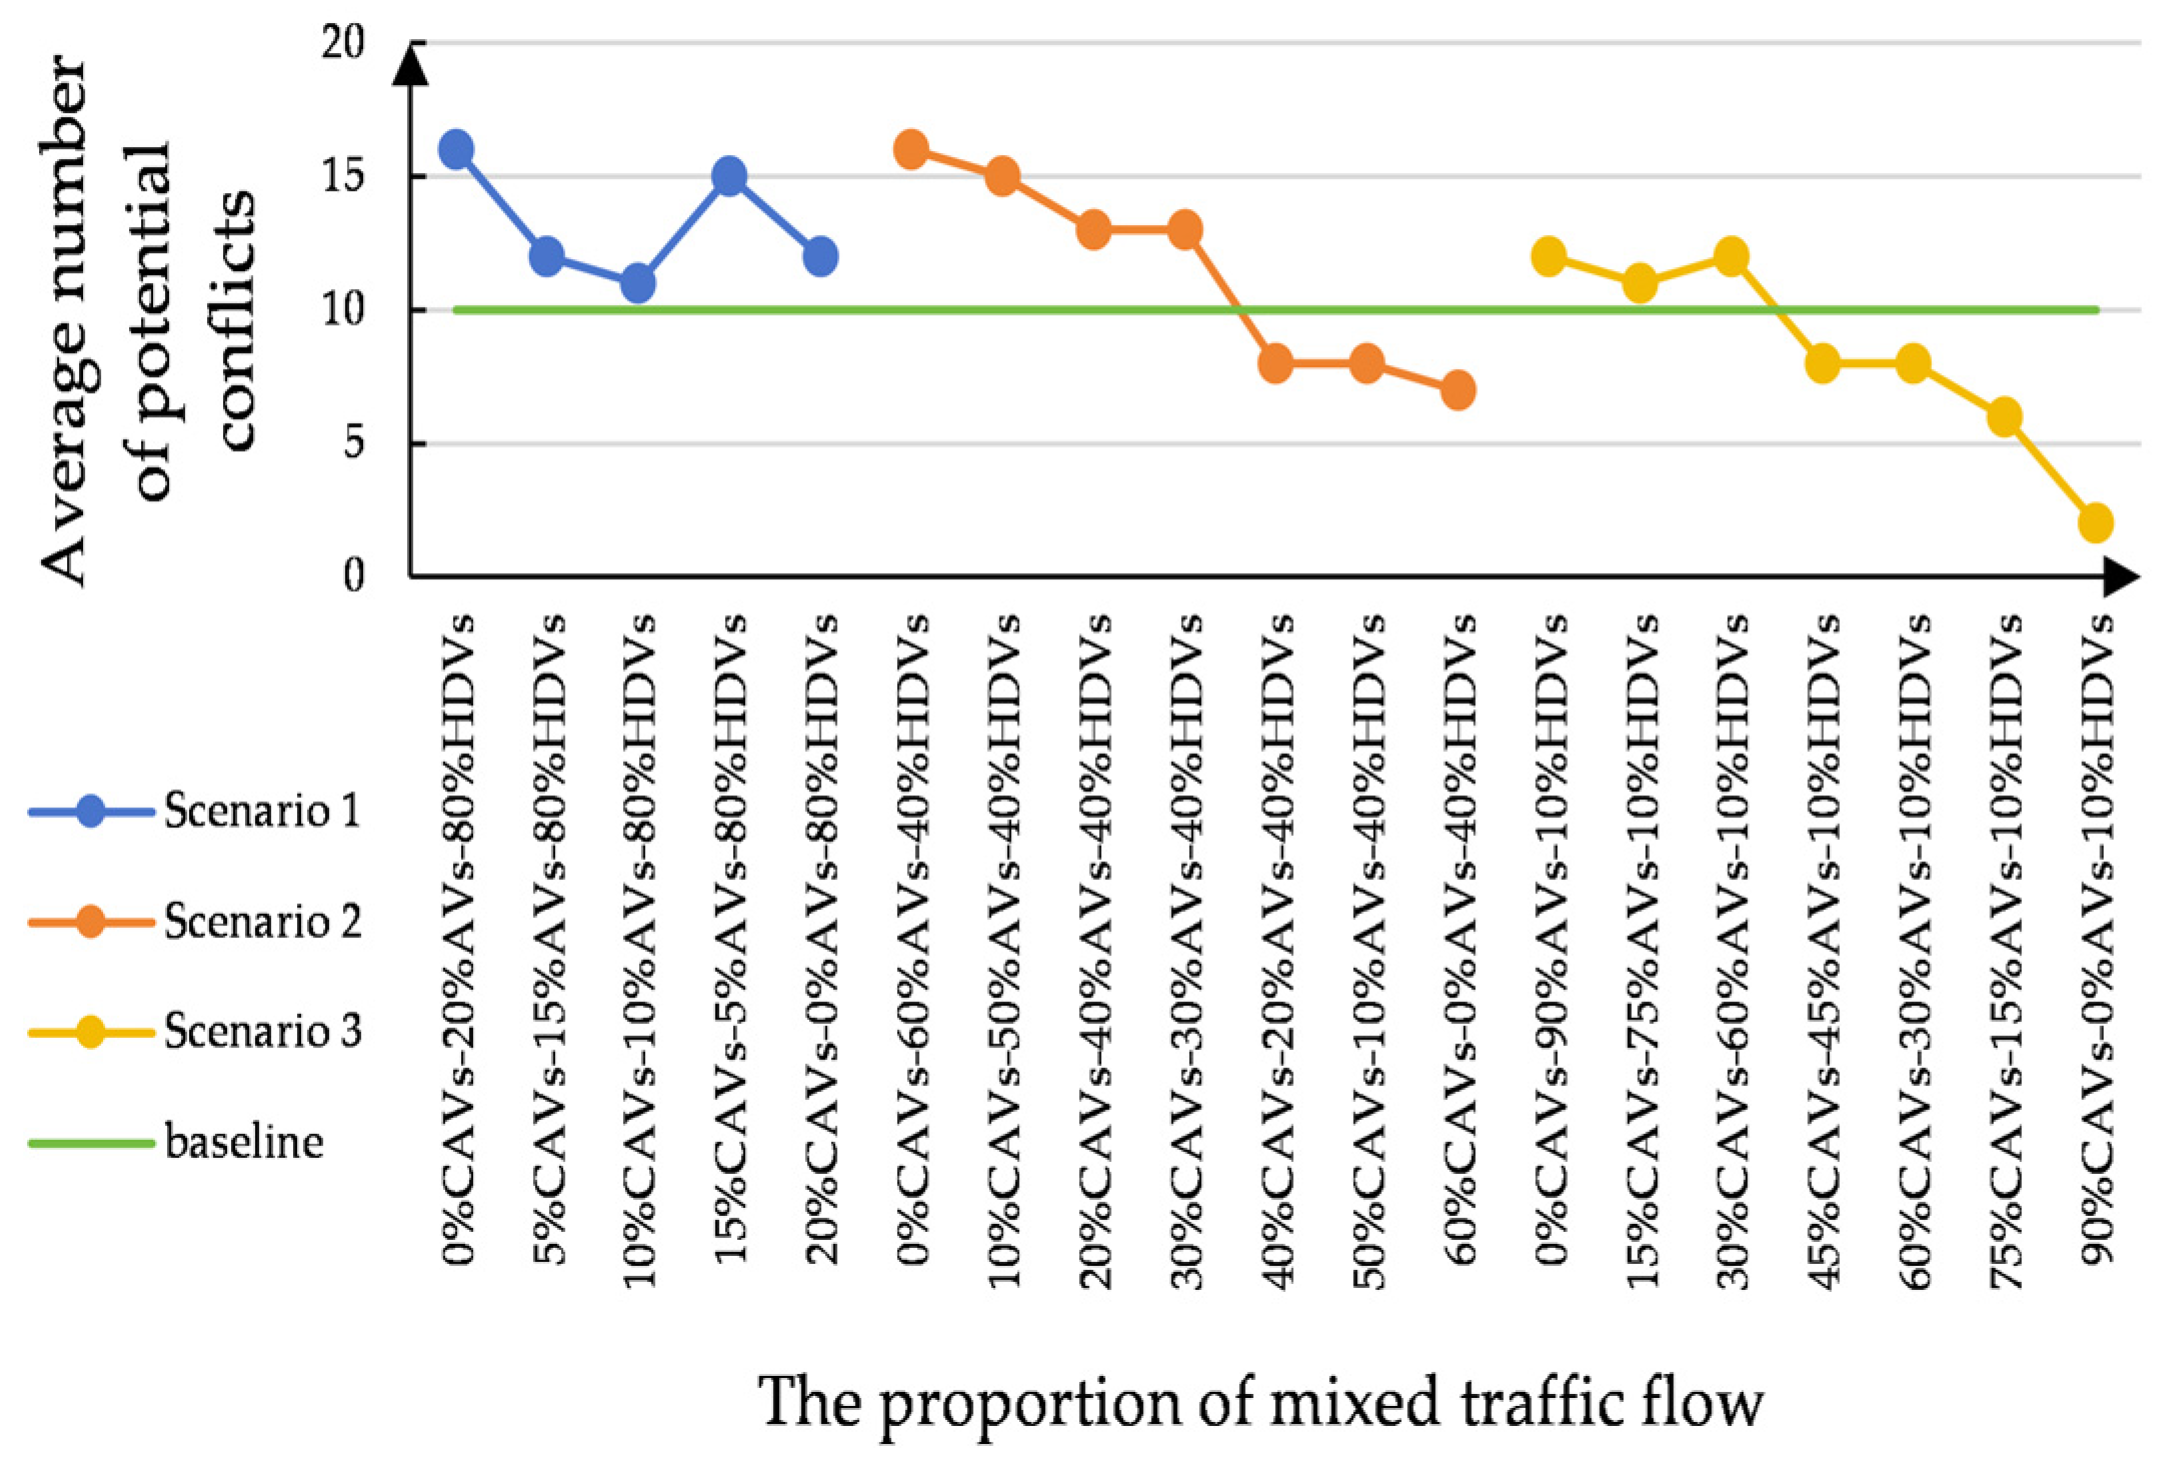
In numerical simulation experiments, the number of vehicle conflicts was used to evaluate the impact of heterogeneous traffic on traffic safety on the ring road and highway. Figure 11 showed the average number of potential traffic conflicts for different proportions of mixed traffic flow on the ring road. The number of potential conflicts in mixed traffic decreased as the proportion of CAVs increased, with the reduction being most significant at a higher proportion of CAVs.
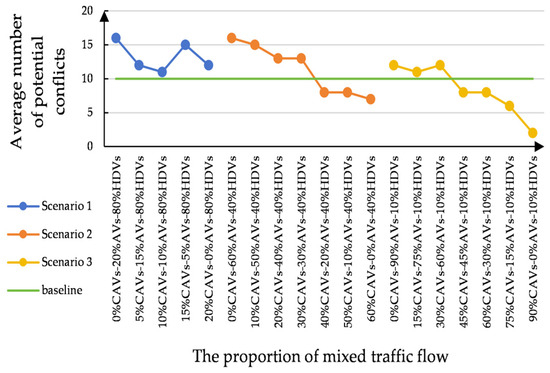
Figure 11.
The average number of potential conflicts for different scenarios on the ring road.
Compared to the baseline scenario, Scenario 1 exhibited a higher number of traffic conflicts, and as the proportion of CAVs and AVs increased, the number of conflicts showed a general decline. This suggested that a higher proportion of HDVs might have a negative impact on traffic safety, but this adverse effect gradually diminishes as the number of CAVs increases. In Scenario 2, when the percentage of CAVs rose to 30%, the number of traffic conflicts steadily decreased, approaching the level seen in the baseline scenario. This suggested that the negative impact on traffic safety in mixed traffic gradually diminishes. However, once the proportion of CAVs reaches or exceeds 40%, the impact on traffic safety becomes positive, indicating a gradual improvement overall in traffic safety.
In Scenario 3, when the percentage of CAVs was less than 45%, the number of traffic conflicts gradually declined, approaching the level seen in the baseline scenario. This indicated that the negative impact on traffic safety in mixed flow progressively decreases. However, traffic safety improves when the proportion of CAVs reaches or surpasses 45%. Particularly, when the proportion of CAVs reaches 90%, traffic conflicts are nearly eliminated, indicating optimal traffic safety.
The distribution of traffic conflicts in mixed traffic on the highway is shown in Figure 12. It is obvious that the number of conflicts gradually decreased as the proportion of CAVs and AVs increased. In Scenario 1, when the proportion of CAVs reached 20%, the number of traffic conflicts approached that of the baseline scenario. This suggested that a low proportion of CAVs in a mixed traffic environment may not be sufficient to control traffic flow effectively, leading to more potential conflicts. However, as the proportion of CAVs increased, the traffic flow became more stable and coordinated, resulting in a sharp decrease in conflicts. The number of conflicts in Scenario 2 was slightly lower than that in Scenario 1, and when the ratio of CAVs was not less than 50%, the number of traffic conflicts fell below those in the baseline scenario. In Scenario 3, the number of traffic conflicts was significantly lower than in other scenarios, and when the proportion of CAVs was over 30%, the number of conflicts gradually approached zero. This indicated that a higher proportion of CAVs or a more balanced vehicle distribution in Scenario 3 can significantly improve traffic safety. This is likely because the interactions between CAVs and HDVs are smoother, thereby reducing the potential risk of conflicts.
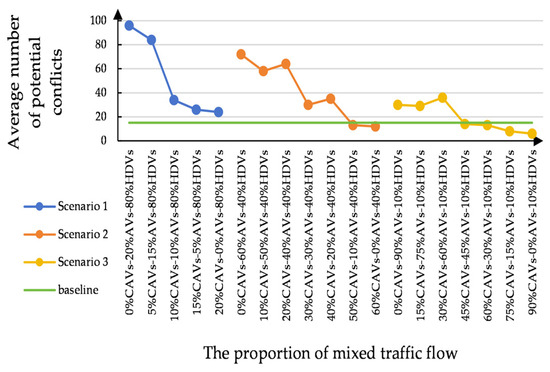
Figure 12.
The average number of potential conflicts for different scenarios on the highway.
Overall, the introduction and increase in the proportion of autonomous vehicles have a positive impact on traffic safety. However, the effect on traffic safety is different in different scenarios, which may be related to the composition of mixed traffic flow in each situation.
5.2.4. Environmental Impacts
To investigate the environmental impact of mixed traffic flow on the ring road and highway, CO, HC, and NOx emissions were plotted. Specifically, in experimental scenarios involving different proportions of mixed traffic flow, the process began by generating emission output files (emission-output) based on the simulation configuration file (.sumocfg). Subsequently, Python scripts were employed to parse and aggregate emission data from different experimental scenarios, producing a comprehensive analysis of emissions. Finally, the processed data were visualized using Excel, providing a clear and intuitive representation of the emission characteristics across various experimental settings.
Figure 13 and Figure 14 depict the reduction in traffic emissions in mixed traffic on the ring road and highway, respectively.
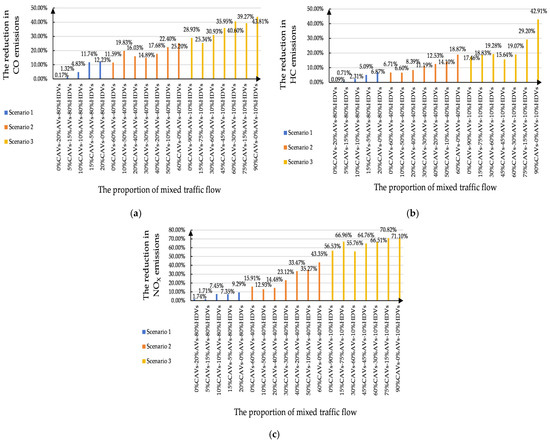
Figure 13.
The reduction in traffic emissions in mixed flow on the ring road. (a) CO emissions; (b) HC emissions; (c) NOX emissions.
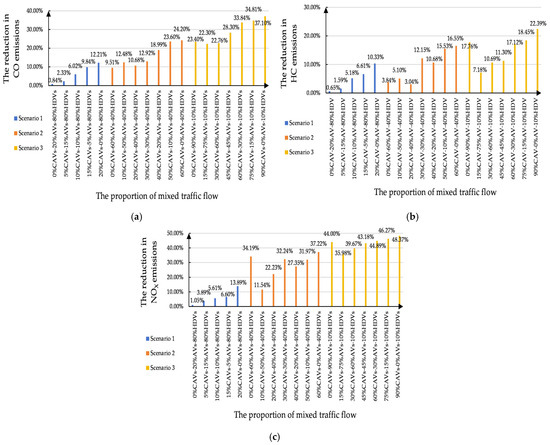
Figure 14.
The reduction in traffic emissions in mixed traffic on the highway. (a) CO emissions; (b) HC emissions; (c) NOX emissions.
The introduction of CAVs and AVs led to a reduction in CO, HC, and NOx emissions in all experimental scenarios. However, traffic emissions differed due to differences in the scenarios and the proportion of mixed traffic flow. In particular, Scenario 1 showed the least improvement in CO, HC, and NOx emissions compared to the other scenarios. This suggested that the low number of autonomous vehicles in Scenario 1 is insufficient to significantly enhance overall traffic flow efficiency, resulting in a smaller reduction in traffic emissions. Conversely, Scenario 3 exhibited the largest decrease in CO, HC, and NOx emissions compared to the other scenarios. With a lower proportion of HDVs, the introduction of CAVs and AVs can better control speed and spacing, reduce traffic fluctuations and instability, and thereby further lower emissions. The emission reduction in Scenario 2 fell between that of Scenario 1 and Scenario 3, suggesting that the moderate number of CAVs and AVs in Scenario 2 can improve traffic flow and reduce emissions to some extent. However, the impact is limited due to the lower proportion of CAVs and AVs.
With the growing number of CAVs and AVs, there has been a notable decrease in traffic emissions for different road networks. This suggests that autonomous driving technology substantially reduces fuel consumption and pollutant emissions by optimizing driving behaviors, such as reducing sudden braking and maintaining a steady speed.
In summary, compared to the baseline scenario, the implementation of the JAD strategy for speed control in the mixed traffic flow effectively reduces traffic waves, enhances traffic efficiency, stability, and safety, while also reducing pollution emissions. This finding enhances the understanding of the dynamic characteristics of heterogeneous traffic flow in complex mixed traffic scenarios and their implications for traffic management. Furthermore, the results could provide valuable insights for policy-making on the integration of autonomous vehicles into current traffic systems and the planning of future road networks. However, this study has some limitations, as it does not consider factors such as adverse weather conditions, emergencies, or the long-term environmental and economic impacts of integrating autonomous vehicles.
6. Conclusions
To assess the impact of mixed traffic scenarios involving CAVs, AVs, and HDVs on traffic efficiency, dynamics, safety, and environment, with vehicle types including both cars and trucks, all experiments were conducted on the multi-lane circular road and highway. Numerical analysis revealed that different experimental scenarios exhibited different traffic performance on different road networks.
The experimental results demonstrated that on different road networks, traffic performance improves as the proportion of HDVs decreases and the percentage of CAVs and AVs increases. Specifically, lower average speed and longer travel time for scenarios with a low proportion of CAVs and AVs (a high proportion of HDVs) resulted in lower overall traffic efficiency compared to the baseline scenario. Similarly, in the scenario with the high proportion of HDVs, both lane changes and traffic emissions were lower compared to the baseline scenario. Moreover, when compared to other scenarios, the higher number of lane changes and a smaller reduction in traffic emissions suggested that the improvement in traffic stability and environment is minimal in mixed traffic. In the case of the ring road, this could be attributed to the fact that the high proportion of HDVs results in frequent speed adjustments, turning maneuvers, and unpredictable traffic congestion and fluctuations. The integration of CAVs and AVs largely offsets the negative effect of HDVs on traffic flow. For the highway, this may be related to the interaction between different vehicle types and the complexity of the on-ramp. Conversely, compared to the baseline scenario, traffic safety had a negative impact in the scenario with a high proportion of HDVs. This may be because frequent acceleration and deceleration of vehicles will increase traffic risk. Moreover, as the proportion of CAVs and AVs increased, the negative impact on traffic safety decreased gradually. This indicated that the benefits of CAVs in mixed traffic flow are diminished.
In scenarios with a high proportion of CAVs and AVs, the smoother operation of vehicles led to optimal traffic efficiency and stability. In addition, the greatest reduction in traffic emissions of CO, HC, and NOx resulted in minimal environmental impact. This is due to the fact that vehicle-to-vehicle communication and coordination enhance driving routes and speed, reducing traffic congestion and unnecessary stops. In scenarios with a moderate proportion of CAVs and AVs, traffic performance fell between that of low and high proportions of CAVs and AVs. For the ring road, in terms of traffic safety, in scenarios with a moderate proportion of CAVs and AVs, traffic risk gradually decreased and approached the number of traffic conflicts seen in the baseline scenario when the proportion of CAVs was below 40%. This indicated that the adverse effect on traffic safety in mixed traffic decreased. However, traffic safety improved noticeably when the proportion of CAVs was 40% or higher. In scenarios with a high proportion of CAVs and AVs, traffic risk steadily declined and neared the number of traffic conflicts observed in the baseline scenario when the percentage of CAVs was less than 45%. This suggested that the negative impact on traffic safety in mixed traffic experienced a gradual fall. However, traffic safety improves when the proportion of CAVs is not less than 45%. Notably, when the proportion of CAVs was 90%, traffic risk was nearly eliminated, resulting in optimal traffic safety. For the highway, regarding traffic safety, traffic safety progressively improved as the proportion of CAVs rose. In scenarios with a moderate proportion of CAVs and AVs, the adverse effect on traffic safety steadily declined until the ratio of CAVs reached 50%, after which traffic safety significantly improved. In scenarios with a high proportion of CAVs and AVs, the negative impact on traffic safety gradually went down before the proportion of CAVs was 45%, and then traffic safety steadily grew after reaching 45%.
By analyzing the effects of different mixed traffic flows on traffic efficiency, dynamics, safety, and environment for the multi-lane ring road and highway with an on-ramp, it becomes easier to capture the dynamic characteristics of heterogeneous traffic. Compared to the baseline scenario, the implementation of the JAD strategy for speed guidance in mixed traffic flow significantly reduced traffic waves, improved traffic efficiency, stability, and safety, and decreased pollutant emissions. By incorporating the JAD strategy into real-world traffic management, the system can dynamically adjust lane speed and traffic distribution in real-time, helping to prevent localized congestion and optimize road capacity. This study helps to understand the interactions between multiple vehicle types in complex mixed traffic scenarios and their implications for traffic management. It provides insights into the dynamic characteristics of heterogeneous traffic flow under various vehicle composition ratios. The results provide valuable guidance for optimizing traffic management strategies, enhancing road safety, and improving the development of intelligent transportation systems. The findings could inform policy decisions regarding the integration of autonomous vehicles into existing traffic systems and the design of future road networks.
Future research should place greater emphasis on complex traffic scenarios such as lane merging, diverting, and intersections to be closer to the actual traffic conditions. Furthermore, there is a need to explore the integration of traffic management strategies with vehicle-to-everything (V2X) technology, employing dynamic route optimization and coordinated speed control to improve the stability and efficiency of traffic flow. At the same time, research should focus on optimizing traffic control strategies to handle different traffic patterns, driving behaviors, and weather conditions. This is crucial for promoting the development of ITSs.
Author Contributions
Conceptualization, H.L. and Y.J.; methodology, H.L.; software, H.L.; validation, H.L. and Y.J. All authors have read and agreed to the published version of the manuscript.
Funding
This research received no external funding.
Institutional Review Board Statement
Not applicable.
Informed Consent Statement
Not applicable.
Data Availability Statement
Data are contained within the article.
Conflicts of Interest
The authors declare no conflicts of interest.
References
- Babaei, A.; Khedmati, M.; Jokar, M.R.A.; Tirkolaee, E.B. Sustainable transportation planning considering traffic congestion and uncertain conditions. Expert Syst. Appl. 2023, 227, 119792. [Google Scholar] [CrossRef]
- Yao, Z.; Wu, Y.; Wang, Y.; Zhao, B.; Jiang, Y. Analysis of the impact of maximum platoon size of CAVs on mixed traffic flow: An analytical and simulation method. Transp. Res. Part C Emerg. Technol. 2023, 147, 103989. [Google Scholar] [CrossRef]
- Li, H.; Roncoli, C.; Zhao, W.; Ju, Y. Assessing the impact of CAV driving strategies on mixed traffic on the ring road and freeway. Sustainability 2024, 16, 3179. [Google Scholar] [CrossRef]
- Narayanan, S.; Chaniotakis, E.; Antoniou, C. Factors affecting traffic flow efficiency implications of connected and autonomous vehicles: A review and policy recommendations. In Advances in Transport Policy and Planning; Academic Press: Cambridge, MA, USA, 2020; Volume 5, pp. 1–50. [Google Scholar] [CrossRef]
- Razavi, N.; Sierpinski, G. An attempt to determine the impact of the implementation of autonomous vehicles on a larger scale on the planning of city transport systems. J. Sustain. Dev. Transp. Logist. 2024, 9, 96–120. [Google Scholar] [CrossRef]
- Qin, Y.; Luo, Q.; Wang, H. Stability analysis and connected vehicles management for mixed traffic flow with platoons of connected automated vehicles. Transp. Res. Part C Emerg. Technol. 2023, 157, 104370. [Google Scholar] [CrossRef]
- Yu, W.; Hua, X.; Ngoduy, D.; Wang, W. On the assessment of the dynamic platoon and information flow topology on mixed traffic flow under connected environment. Transp. Res. Part C Emerg. Technol. 2023, 154, 104265. [Google Scholar] [CrossRef]
- Jiang, Y.; Cong, H.; Wang, Y.; Wu, Y.; Li, H.; Yao, Z. A new control strategy of CAVs platoon for mitigating traffic oscillation in a two-lane highway. Phys. A Stat. Mech. Its Appl. 2023, 630, 129289. [Google Scholar] [CrossRef]
- Nishi, R.; Tomoeda, A.; Shimura, K.; Nishinari, K. Theory of jam-absorption driving. Transp. Res. Part B Methodol. 2013, 50, 116–129. [Google Scholar] [CrossRef]
- He, Z.; Zheng, L.; Song, L.; Zhu, N. A jam-absorption driving strategy for mitigating traffic oscillations. IEEE Trans. Intell. Transp. Syst. 2016, 18, 802–813. [Google Scholar] [CrossRef]
- Ge, Y.; Jiang, R.; Sun, H.; Gao, Z.; Liu, J.; Wang, J. Environmental impact estimation of mixed traffic flow involving CAVs and human-driven vehicles considering the non-equilibrium state. Transp. Res. Part C Emerg. Technol. 2024, 161, 104542. [Google Scholar] [CrossRef]
- Xie, D.F.; Zhao, X.M.; He, Z. Heterogeneous traffic mixing regular and connected vehicles: Modeling and stabilization. IEEE Trans. Intell. Transp. Syst. 2018, 20, 2060–2071. [Google Scholar] [CrossRef]
- Huang, K.; Zhou, P.; Liu, Z.; Tang, T.; Zhang, H.; Jiang, W. The Calculation and distribution of CAV carbon emissions on urban transportation systems: A comparative analysis of renewable and non-renewable energy sources. Renew. Energ. 2024, 230, 120884. [Google Scholar] [CrossRef]
- Yu, Z.; Zhao, J.; Jiang, R.; Shen, J.; Wu, D.; Zheng, S. Theory-data dual driven car following model in traffic flow mixed of AVs and HDVs. Transp. Res. Part C Emerg. Technol. 2024, 165, 104747. [Google Scholar] [CrossRef]
- Li, H.; Roncoli, C.; Ju, Y. A helly model-based MPC control system for jam-absorption driving strategy against traffic waves in mixed traffic. Appl. Sci. 2024, 14, 1424. [Google Scholar] [CrossRef]
- Roncoli, C.; Papageorgiou, M.; Papamichail, I. Traffic flow optimisation in presence of vehicle automation and communication systems-Part II: Optimal control for multi-lane motorways. Transp. Res. Part C Emerg. Technol. 2015, 57, 260–275. [Google Scholar] [CrossRef]
- Mohammadian, S.; Zheng, Z.; Haque, M.M.; Bhaskar, A. Continuum modeling of freeway traffic flows: State-of-the-art, challenges and future directions in the era of connected and automated vehicles. Commun. Transp. Res. 2023, 3, 100107. [Google Scholar] [CrossRef]
- Guo, X.Y.; Zhang, G.; Jia, A.F. Study on mixed traffic of autonomous vehicles and human-driven vehicles with different cyber interaction approaches. Veh. Commun. 2023, 39, 100550. [Google Scholar] [CrossRef]
- Imran, W.; Tettamanti, T.; Varga, B.; Bifulco, G.N.; Pariota, L. Macroscopic modeling of connected, autonomous and human-driven vehicles: A pragmatic perspective. Transp. Res. Interdisc. 2024, 24, 101058. [Google Scholar] [CrossRef]
- Ramsahye, P.; Susilawati, S.; Tan, C.P.; Kamal, M.A.S. Data-driven adaptive automated driving model in mixed traffic. IEEE Access 2023, 11, 109049–109065. [Google Scholar] [CrossRef]
- Li, D.; Zhu, F.; Wu, J.; Wong, Y.D.; Chen, T. Managing mixed traffic at signalized intersections: An adaptive signal control and CAV coordination system based on deep reinforcement learning. Expert Syst. Appl. 2024, 238, 121959. [Google Scholar] [CrossRef]
- Stepanyants, V.G.; Romanov, A.Y. Influence of realistic perception and surroundings on qualitative results in automated and connected vehicle simulation. IEEE Access 2024, 12, 43721–43733. [Google Scholar] [CrossRef]
- Wang, C.; Ren, W.; Xu, C.; Zheng, N.; Peng, C.; Tong, H. Exploring the impact of conditionally automated driving vehicles transferring control to human drivers on the stability of heterogeneous traffic flow. IEEE Trans. Intell. Veh. 2024, 1–17. [Google Scholar] [CrossRef]
- Hu, J.; Li, X.; Hu, W.; Xu, Q.; Kong, D. A cooperative control methodology considering dynamic interaction for multiple connected and automated vehicles in the merging zone. IEEE Trans. Intell. Transp. Syst. 2024, 25, 12669–12681. [Google Scholar] [CrossRef]
- Liu, Q.; Gao, C.; Wang, H.; Cai, Y.; Chen, L.; Lv, C. Learning from trajectories: How heterogeneous CACC platoons affect the traffic flow in highway merging area. IEEE Trans. Veh. Technol. 2024, 73, 16212–16224. [Google Scholar] [CrossRef]
- Hao, W.; Liu, L.; Yang, X.; Li, Y.; Byon, Y.J. Reducing CACC platoon disturbances caused by state jitters by combining two stages driving state recognition with multiple platoons’ strategies and risk prediction. IEEE Trans. Intell. Transp. Syst. 2020, 23, 2144–2154. [Google Scholar] [CrossRef]
- Dey, K.C.; Yan, L.; Wang, X.; Wang, Y.; Shen, H.; Chowdhury, M.; Yu, L.; Qiu, C.; Soundararaj, V. A review of communication, driver characteristics, and controls aspects of cooperative adaptive cruise control (CACC). IEEE Trans. Intell. Transp. Syst. 2015, 17, 491–509. [Google Scholar] [CrossRef]
- Hu, J.; Sun, S.; Lai, J.; Wang, S.; Chen, Z.; Liu, T. CACC simulation platform designed for urban scenes. IEEE Trans. Intell. Veh. 2023, 8, 2857–2874. [Google Scholar] [CrossRef]
- Vranken, T.; Schreckenberg, M. Modelling multi-lane heterogeneous traffic flow with human-driven, automated, and communicating automated vehicles. Phys. A Stat. Mech. Its Appl. 2022, 589, 126629. [Google Scholar] [CrossRef]
- Hwapyeong, Y.; Sehyun, T.; Minju, P.; Hwasoo, Y. Impact of autonomous-vehicle-only lanes in mixed traffic conditions. Transport. Res. Rec. 2019, 2673, 430–439. [Google Scholar] [CrossRef]
- Liu, C.; Liu, Z.; Xu, Z.; Li, X. A multistep cooperative lane change strategy for connected and autonomous vehicle platoons departing from dedicated lanes. Transp. Res. Part C Emerg. Technol. 2024, 165, 104720. [Google Scholar] [CrossRef]
- Wang, S.; Wang, Z.; Jiang, R.; Zhu, F.; Yan, R.; Shang, Y. A multi-agent reinforcement learning-based longitudinal and lateral control of CAVs to improve traffic efficiency in a mandatory lane change scenario. Transp. Res. Part C Emerg. Technol. 2024, 158, 104445. [Google Scholar] [CrossRef]
- Pan, T.; Lam, W.H.; Sumalee, A.; Zhong, R. Multiclass multilane model for freeway traffic mixed with connected automated vehicles and regular human-piloted vehicles. Transportmetrica A 2021, 17, 5–33. [Google Scholar] [CrossRef]
- Huang, X.; Lin, P.; Pei, M.; Ran, B.; Tan, M. Reservation-based cooperative ecodriving model for mixed autonomous and manual vehicles at intersections. IEEE Trans. Intell. Transp. Syst. 2023, 24, 9501–9517. [Google Scholar] [CrossRef]
- Chen, P.C.; Liu, X.; Lin, C.W.; Huang, C.; Zhu, Q. Mixed-traffic intersection management utilizing connected and autonomous vehicles as traffic regulators. In Proceedings of the 28th Asia and South Pacific Design Automation Conference, Tokyo, Japan, 31 January 2023; pp. 52–57. [Google Scholar] [CrossRef]
- Zhuo, J.; Zhu, F. Evaluation of platooning configurations for connected and automated vehicles at an isolated roundabout in a mixed traffic environment. J. Intell. Connect. Veh. 2023, 6, 136–148. [Google Scholar] [CrossRef]
- Campi, E.; Mastinu, G.; Previati, G.; Studer, L.; Uccello, L. Roundabouts: Traffic simulations of connected and automated vehicles-a state of the art. IEEE Trans. Intell. Transp. Syst. 2023, 25, 3305–3325. [Google Scholar] [CrossRef]
- Fernandes, P.; Nunes, U. Platooning of autonomous vehicles with intervehicle communications in SUMO traffic simulator. In Proceedings of the 13th International IEEE Conference on Intelligent Transportation Systems, Funchal, Portugal, 19–22 September 2010; pp. 1313–1318. [Google Scholar] [CrossRef]
- Liao, X.; Zhao, X.; Wang, Z.; Han, K.; Tiwari, P.; Barth, M.J.; Wu, G. Game theory-based ramp merging for mixed traffic with unity-sumo co-simulation. IEEE Trans. Syst. Man, Cybern. Syst. 2021, 52, 5746–5757. [Google Scholar] [CrossRef]
- Bautista, P.B.; Aguiar, L.U.; Igartua, M.A. How does the traffic behavior change by using SUMO traffic generation tools. Comput. Commun. 2022, 181, 1–13. [Google Scholar] [CrossRef]
- Krajzewicz, D. Traffic simulation with SUMO-simulation of urban mobility. In Fundamentals of Traffic Simulation; Springer: New York, NY, USA, 2010; Volume 145, pp. 269–293. [Google Scholar] [CrossRef]
- Lim, K.G.; Lee, C.H.; Chin, R.K.Y.; Yeo, K.B.; Teo, K.T.K. SUMO enhancement for vehicular ad hoc network (VANET) simulation. In Proceedings of the 2017 IEEE 2nd International Conference on Automatic Control and Intelligent Systems (I2CACIS), Kota Kinabalu, Malaysia, 21 October 2017; pp. 86–91. [Google Scholar] [CrossRef]
- Mena-Oreja, J.; Gozalvez, J. Permit-a SUMO simulator for platooning maneuvers in mixed traffic scenarios. In Proceedings of the 2018 21st International Conference on Intelligent Transportation Systems (ITSC), Maui, HI, USA, 4–7 November 2018; pp. 3445–3450. [Google Scholar] [CrossRef]
- Erdmann, J. SUMO’s lane-changing model. In Modeling Mobility with Open Data; Springer: Cham, Switzerland, 2015; pp. 105–123. [Google Scholar] [CrossRef]
- Taniguchi, Y.; Nishi, R.; Ezaki, T.; Nishinari, K. Jam-absorption driving with a car-following model. Phys. A Stat. Mech. Its Appl. 2015, 433, 304–315. [Google Scholar] [CrossRef]
- Treiber, M.; Kesting, A. Traffic Flow Dynamics: Data, Models and Simulation, 2013rd ed.; Springer: Berlin, Germany, 2013; pp. 1–505. [Google Scholar] [CrossRef]
- Xiao, L.; Wang, M.; van Arem, B. Realistic car-following models for microscopic simulation of adaptive and cooperative adaptive cruise control vehicles. Transport. Res. Rec. 2017, 2623, 1–9. [Google Scholar] [CrossRef]
- Milanés, V.; Shladover, S.E. Modeling cooperative and autonomous adaptive cruise control dynamic responses using experimental data. Transp. Res. Part C Emerg. Technol. 2014, 48, 285–300. [Google Scholar] [CrossRef]
- Das, T.; Samandar, M.S.; Autry, M.K.; Rouphail, N.M. Surrogate safety measures: Review and assessment in real-world mixed traditional and autonomous vehicle platoons. IEEE Access 2023, 11, 32682–32696. [Google Scholar] [CrossRef]
- Goh, K.C.; Currie, G.; Sarvi, M.; Logan, D. Experimental microsimulation modeling of road safety impacts of bus priority. Transport. Res. Rec. 2014, 2402, 9–18. [Google Scholar] [CrossRef]
- Kesting, A.; Treiber, M.; Schönhof, M.; Helbing, D. Adaptive cruise control design for active congestion avoidance. Transp. Res. Part C Emerg. Technol. 2008, 16, 668–683. [Google Scholar] [CrossRef]
- Garg, M.; Bouroche, M. Can connected autonomous vehicles improve mixed traffic safety without compromising efficiency in realistic scenarios? IEEE Trans. Intell. Transp. Syst. 2023, 24, 6674–6689. [Google Scholar] [CrossRef]
- Andreotti, E.; Boyraz, P. Safety-centred analysis of transition stages to traffic with fully autonomous vehicles. In Proceedings of the 2020 IEEE 23rd International Conference on Intelligent Transportation Systems (ITSC), Rhodes, Greece, 20–23 September 2020; pp. 1–6. [Google Scholar] [CrossRef]
- Sadid, H.; Antoniou, C. Modelling and simulation of (connected) autonomous vehicles longitudinal driving behavior: A state-of-the-art. IET Intell. Transp. Syst. 2023, 17, 1051–1071. [Google Scholar] [CrossRef]


Disclaimer/Publisher’s Note: The statements, opinions and data contained in all publications are solely those of the individual author(s) and contributor(s) and not of MDPI and/or the editor(s). MDPI and/or the editor(s) disclaim responsibility for any injury to people or property resulting from any ideas, methods, instructions or products referred to in the content. |
© 2025 by the authors. Licensee MDPI, Basel, Switzerland. This article is an open access article distributed under the terms and conditions of the Creative Commons Attribution (CC BY) license (https://creativecommons.org/licenses/by/4.0/).