Article

Water Consumption, Quantity and Quality of Wastewater and Sewage Sludge from Polish Dairies

by
Joanna Rodziewicz
1,
Artur Mielcarek
1,*,
Karolina Kłobukowska
1,
Krzysztof Jóźwiakowski
2,
Tadeusz Siwiec
2,
Piotr Bugajski
3 and
Wojciech Janczukowicz
1
1
Department of Environment Engineering, University of Warmia and Mazury in Olsztyn, Warszawska St. 117a, 10-719 Olsztyn, Poland
2
Department of Environmental Engineering, University of Life Sciences in Lublin, Leszczyńskiego St. 7, 20-069 Lublin, Poland
3
Department of Sanitary Engineering and Water Management, University of Agriculture in Kraków, Al. Mickiewicza St. 24/28, 30-059 Kraków, Poland
*
Author to whom correspondence should be addressed.
Appl. Sci. 2025, 15(3), 1525; https://doi.org/10.3390/app15031525
Submission received: 20 December 2024 / Revised: 24 January 2025 / Accepted: 29 January 2025 / Published: 2 February 2025
(This article belongs to the Special Issue Environmental Management in Milk Production and Processing)

Abstract

:
The peculiarity of the wastewater produced in Polish dairies stems from the frequency and specific technology of cottage cheese production. The aim of this study was to determine the water consumption and the quantity and quality of wastewater and sewage sludge discharged from Polish dairies based on the size of the plant and the production profile of the plant to characterize the wastewater treatment plants (WWTPs). Data were collected from eighteen dairies. Most of them have their own WWTP. Water consumption ranged from 1.5 litres (L) of water per litre of milk processed to 3.71 L/L. The specific volume of wastewater ranged from 1.18 to 5.78 L per L of milk processed. The raw wastewater concentrations were comparable to those of dairy wastewater in other European countries. Despite the disposal of domestic wastewater in WWTPs, the results of the sanitary examinations of the sludge showed it was suitable for agricultural purposes. Its heavy metal also made it applicable on agricultural land. The ratio of the sludge to raw milk processing was between 0.137 and 7.927 kg of sludge per 100 L of milk processed. The amount of sludge produced per pollutant (BOD) load removed ranged from 0.404 to 18.895 kg/kg BODremoved.

1. Introduction

In 2023, the EU Member States produced around 160.8 million tonnes of milk [1], with Poland accounting for 15.2 million tonnes in 2024. In 2019, with an annual EU production of 167.4 million tonnes, dairies produced 192.5 million m3 of dairy wastewater, which corresponds to a specific wastewater volume of 1.15 L per L of processed milk. Poland is one of the six largest milk producers in Europe and is responsible for discharging 73% of the milk wastewater produced in the EU into the sewerage system. Based on calculations made by Stasinakis et al. [2], it was estimated that Polish dairies would produce 16.95 million m3 of wastewater in 2024.
To estimate the amount of dairy wastewater generated in the EU-27 countries, a Greek research team analysed the annual production volumes of milk, cheese, butter and fermented milk in the individual countries [3]. Using data from the European Dairy Association (EDA) [4] on the specific volume of wastewater per kilogramme of dairy products, they calculated the quantities of wastewater produced by the European dairy industry [2].
Three types of wastewater are produced in dairies: process wastewater, domestic wastewater and cooling water and condensates [5].
The quantity and quality of process wastewater depends primarily on the plant size, with variable concentrations and irregular flow rates influenced by the number of production shifts and production type. Cheese and butter production plants generate most of the wastewater [6,7,8]. In the EU, 49% of wastewater comes from cheese production, and the same is true for Poland [2]. The structure of production in Poland is dominated by cottage cheese (52%), followed by cheese matured with rennet (39%) and processed cheese (8%) [9]. The special nature of the wastewater produced in Polish dairies is due to the frequency of cottage cheese (tvarg) production. Polish cottage cheese is unknown in other countries.
The quality of dairy wastewater is influenced also by the amount of raw materials lost during production, the management of whey, the use of permeate, the purification methods deployed and the type of detergents and disinfectants used [10]. Milk and fat losses in cheese production amount to 0.2% and 0.1%, respectively, while these losses in the production of drinking milk reach 1.9% and 0.7% [5]. A specific by-product of cottage cheese production is acid whey. It usually makes up 75–80% of the processed milk mass. A major problem is the management of acid whey: when discharged into a WWTP, it causes a significant reduction in the pH of the wastewater [11].
Sewage sludge is produced during the treatment of dairy wastewater (dairy processing sludge). Some of it is produced in the mechanical part of the treatment plant (mainly dissolved air flotation processing sludge (DAF)), but most of it is produced in the biological treatment plants, operating with both oxygen and anaerobic technology [12].
The estimated annual wastewater volume of 16.95 million m3 for Polish dairies, which is based on the methodology of Stasinakis et al. [2], is an approximate figure that does not come from direct measurements in the plants. There is a lack of data in the literature on the actual volume of wastewater produced by Polish dairies, taking into account the size and range of production. Similarly, there are no specific data on the water consumption per litre of milk processed in the production processes or the volume of wastewater discharged into the sewerage system per litre of milk processed [13].
According to Ashekuzzaman et al. [14], about 2 kg of sludge is produced per 100 L of milk processed. Thus, considerable quantities of sewage sludge from the dairy industry have to be dealt with at a national level. The most common solution is its agricultural and natural use after prior stabilization in aerobic and anaerobic sludge neutralization plants. Spreading on agricultural land is a common practice not only in Poland but also throughout Europe [12]. The benefits of this solution have been outlined in numerous publications [15,16,17].
Sludge application promotes plant growth due to the high concentrations of phosphorus, nitrogen and carbon and micronutrients (K, Cu, Fe, Mg, Mo and Zn), as well the low content of toxic metals. The application of dairy sewage sludge in agriculture can be legal, as the accumulation of heavy metals in this type of sewage sludge poses no problem [15,18]. The data on the quality of sewage sludge obtained in the studies carried out in the early 2000s do not reflect the characteristics of the sludge currently being disposed of from dairy WWTPs. This is due to the fact that in the last 15 years, DAF devices have been installed in many WWTPs to reduce the pollutant load of organic compounds, fats, oils and greases (FOGs) that flow into the biological section of the treatment plant. This change in treatment technology had an impact on the quantity and quality of the sludge removed from the biological part of the treatment plant. At the same time, sludge began to accumulate in the mechanical part of the treatment plant due to the flotation process, which contained significant amounts of poorly degradable FOG. From then on, a mixture of mainly lime-treated DAF sludge and biochemically treated excess activated sludge was discharged from WWTPs [13].
The continuous modernization of Polish dairies affects water and wastewater management in the dairies and consequently modifies the quantity and quality of wastewater discharged into the dairies’ wastewater networks and sewage sludge from WWTPs. According to data from the Ministry of Climate and Environment (letter dated 16 February 2024) [19], based on the BDO (Database of Products and Packaging and Waste Management), the annual amount of sewage sludge (waste code 02 05 02—sludge from on-site WWTPs in the dairy industry) in Polish dairies in 2020, 2021 and 2022 amounted to 95,352, 90,642 and 81,626 Mg dry matter, respectively. The observed downward trend is due, among other things, to the increasingly widespread replacement of aerobic by anaerobic technologies, both in terms of wastewater pipes and sewage sludge treatment plants in dairies. The second factor affecting the mass of sludge produced is the modernization of some biological WWTPs, which leads to a reduction in the pollutant load of the activated sludge, resulting in lower sludge growth and significant stabilization of the sludge [13].
There is also little data on the quality of dairy wastewater from Polish dairies. The last comprehensive wastewater tests were carried out in the early 2000s. [10]. It should be noted that, according to the l Statistic Poland, milk purchases in Poland increased by over 3 billion litres or 35% between 2005 and 2023 [20].
It is therefore crucial to keep up-to-date data on water consumption and the quantity and concentration of dairy wastewater discharged into the sewerage system. There is also a gap in the literature regarding the specific amount of wastewater per litre of water used to manufacture dairy products. A significant change in the production range, modernization of facilities, and a significant share of cottage cheese in cheese production all together significant impact on the quality of dairy wastewater and its quantity.
Changes in sludge management in dairy WWTPs also require determining the ratio of sludge to raw milk processing and the amount of sludge produced per pollutant load removed (true growth yield, Y). The values of these parameters will be useful for both planners and operators of WWTPs.
The aim of this study was to determine the volume of water consumed and the volume and quality of wastewater and sludges discharged from dairies in Poland in 2023 based on the size and production profile of the plant. The scope of this research included the evaluation of water consumption and wastewater volumes, the analysis of wastewater systems, the characterization of wastewater pre-treatment and treatment facilities, the determination of water and wastewater volumes per litre of milk processed and the qualitative analysis of wastewater. The sludge production and the physicochemical and sanitary properties of sewage sludge are presented as well.

2. Materials and Methods

Eighteen Polish dairies took part in this study. The survey included questions on the production profile, amount of milk processed, water consumption, use of closed water circuits within the plant, equipment for wastewater pre-treatment or treatment, disposal of domestic sewage in WWTPs, the quantity of waste water produced, the treatment technology, the equipment of the technological sequence of the treatment or pre-treatment plant and the pollution indicators of wastewater discharged into the dairies’ wastewater treatment plants or into the municipal sewerage system. The data received from the companies relate to the year 2023. The amount of water consumed was determined on the basis of water meter readings. The volume of wastewater discharged into the wastewater treatment plant was measured using flow meters installed at the entrance to the wastewater treatment plant. For both meters, the readings of both meters on 1 January and 31 December 2023 were used as the basis for calculating the annual water consumption and the annual wastewater volume. Since the plants (dairies) differ greatly in terms of product range and production volume, no average values were determined for the entire sector, neither for water consumption, nor for the quantity and value of the indicators of wastewater pollution nor for the quantity and parameters of sewage sludge.
The scope of the physico-chemical analysis of the wastewater included BOD₅ (biochemical oxygen demand), COD (chemical oxygen demand), total suspended solids, total nitrogen, total phosphorus and pH. The analyses were carried out in accordance with the Polish standard methods for the examination of water, wastewater and sludge (PN-EN ISO 5815-1:2019-12; PN-EN ISO 15705:2005; PN-EN 872:2007+Ap1:2007; PN-EN 12260: 2004 (A),(W),(NR); PN-EN ISO 11885:2009; PN-EN ISO 10523:2012 (A)) [21,22,23,24,25,26]. The pollutant loads in the wastewater were determined in daily composite samples based on 24 h quality monitoring of the wastewater.
Data on the amount of sewage sludge were provided by 14 dairies. The results of the qualitative studies were submitted by 9 dairies.
The dairies were asked to state whether domestic sewage is discharged into the WWTP, how much sludge is produced annually, how the sludge is processed and whether it is used for agricultural purposes. They were also asked about the results of the sanitary tests of the sludge (presence of Ascaris sp., Trichuris sp., Toxocara sp. Eggs and presence of Salmonella) and the results of the physicochemical analysis of the sludge (dry matter, organic matter, ammonium nitrogen, TKN, Mg, Ca, TP, Cr, Zn, Cd, Cu, Ni, Pb, Hg and pH value). The sewage sludge analyses were carried out in accordance with the Polish standard methods for the examination of water, wastewater and sludge (PN-EN 15934:2013-02; PN-EN 15935:2022-01; PN-75/C-04576/15(W); PN-EN 13342:2002; PN-EN ISO 11885:2009 PN-EN 16173:2012; PN-EN ISO 11885:2009 PN-EN 16173:2012; PN-EN ISO 11885:2009 PN-EN 16173:2012; PN-EN ISO 11885:2009 PN-EN 16173:2012; PN-EN ISO 11885:2009 PN-EN 16173:2012; PN-EN ISO 11885:2009 PN-EN 16173:2012; PN-EN ISO 11885:2009 PN-EN 16173:2012; PN-EN ISO 11885:2009 PN-EN 16173:2012; PN-EN 15933:2013-02) [25,27,28,29,30,31,32]. Sanitary tests of the sludge were performed in accordance with the following standards: PN-Z-19000-4:2001 and PN-EN ISO 6579-1:2017-04/A1:2020-09 [33,34].
Analyses of sludge and wastewater were carried out by accredited laboratories.

3. Results and Discussion

Most of the completed questionnaires contained answers to almost all the questions asked about water and wastewater management. One exception was Plant 18, which provided only limited data on the production profile (processed cheese and matured cheese), daily water consumption and daily wastewater production (Table 1 and Table 2).
The dairies are listed in the table in order of daily milk processing volume. The highest processing volume was 2,800,000 L per day, whereas the lowest was 21,000 L per day. The first six dairies processed more than 1 million litres of milk per day, with only two dairies processing less than 100,000 L per day. In the remaining ten dairies, daily milk processing was between 100,000 and 1,000,000 L per day.
The tables also include the amount of whey processed, as this was the case in ten dairies. The dairy managers were not able to state the percentage of water used for whey processing compared to the total water consumption for milk processing. For these dairies, the whey processing volume is shown in brackets below the milk processing volume in Table 1 and Table 2.
Noteworthy is that whey processing via membrane processes produces permeate with different compositions. This permeate can be partially or completely discharged into the wastewater system and subsequently into the WWTP. Consequently, it has an immediate effect on the total volume of treated wastewater and increases the hydraulic load on the specific treatment plants.
Only two dairies used closed water circuits. At one facility, the operator clearly stated that there was no such system, and no response was received from the other facilities. This shows that water consumption can be reduced in the future in most dairies by implementing this solution.
The lowest specific water consumption was 1.5 L of water per litre of milk processed, whereas the highest was 3.71 L per L. In five facilities, it was less than 2.0 L per L (Figure 1). In six plants, this parameter was between 2.0 and 2.5 L per L and in another four locations it was above 3.0 L per L. According to [5], specific water consumption in Poland was found to be within the recommended values corresponding to the BAT criteria (from 0.3 to 3.0). Only four dairies had individual water losses above 3.0 L per L. According to the studies by Boguniewicz-Zablocka et al. [7], water consumption ranges from 1 to 10 L/L of processed origin, depending on the production profile and the size of the plant. Fundamental devices that influence water consumption and wastewater generation are the automation of production and the implementation of cleaning-in-place (CIP) techniques in conventional plants [35]. The values determined are higher than those of the world market leader in this field—Australia [36].
In three of the four dairies where specific water consumption exceeded 3.0 L/L, the production profile was very diverse and included the production of ripening cheese, cottage cheese, butter, fermented beverages, yoghurt, buttermilk, kefir, cream, milk powder, whey powder, etc. Such fragmentation of production is due to the use of many smaller specialized production lines and consequently to higher specific water consumption. Particularly high water consumption (up to 17.2 L per L) is typical of fermented milk production [10]. Whey processing also has an impact on the amount of water consumed [37,38]. Thus, it may be expected that the specific water consumption per litre of processed milk will be lower in dairies processing whey. The analysis of data showed no explicit influence of whey processing on the increase in the volume of water per unit compared to the plants not processing whey. In the plant where the unit volume of water was the lowest (1.5 L/L), 0.8 million litres of whey were processed in addition to 1.1 million litres of milk (80% of the processed milk volume). At the same time, in the plant with the highest specific water consumption (3.71 L/L), the proportion of whey processed was less than 50% (Figure 1). This confirms that, in addition to independent factors such as the amount of milk and whey processed, water consumption is also determined by the individual solutions implemented in a particular plant [39].
Based on the data obtained, the volume of water consumed depending on the production type could only be determined for the blue cheese and ripening cheese production plants. For the maturing cheeses, the volume of water used per litre of processed milk was between 1.75 and 2.37 L/L, whereas for blue cheese it was 1.7 L/L (Table 1, Figure 1; processed milk of 256,200). For both types of cheese, the water consumption values were below the upper limit specified in the literature (0.24–4.90 L/L) [5]. As no information was available on the production profile of the other dairies or the product range was very broad, it was not possible to determine the specific water consumption in the production of other dairy products.
Most dairies surveyed had their own WWTPs (13). Those that did not have such a plant (5) discharged their wastewater into the municipal sewage system. Three plants had no facilities for pre-treatment of wastewater prior to discharge into the sewage system, while the remaining two plants had facilities for mechanical and chemical pre-treatment of wastewater or for biological aerobic pre-treatment of wastewater in activated sludge chambers (Table 1 and Table 2).
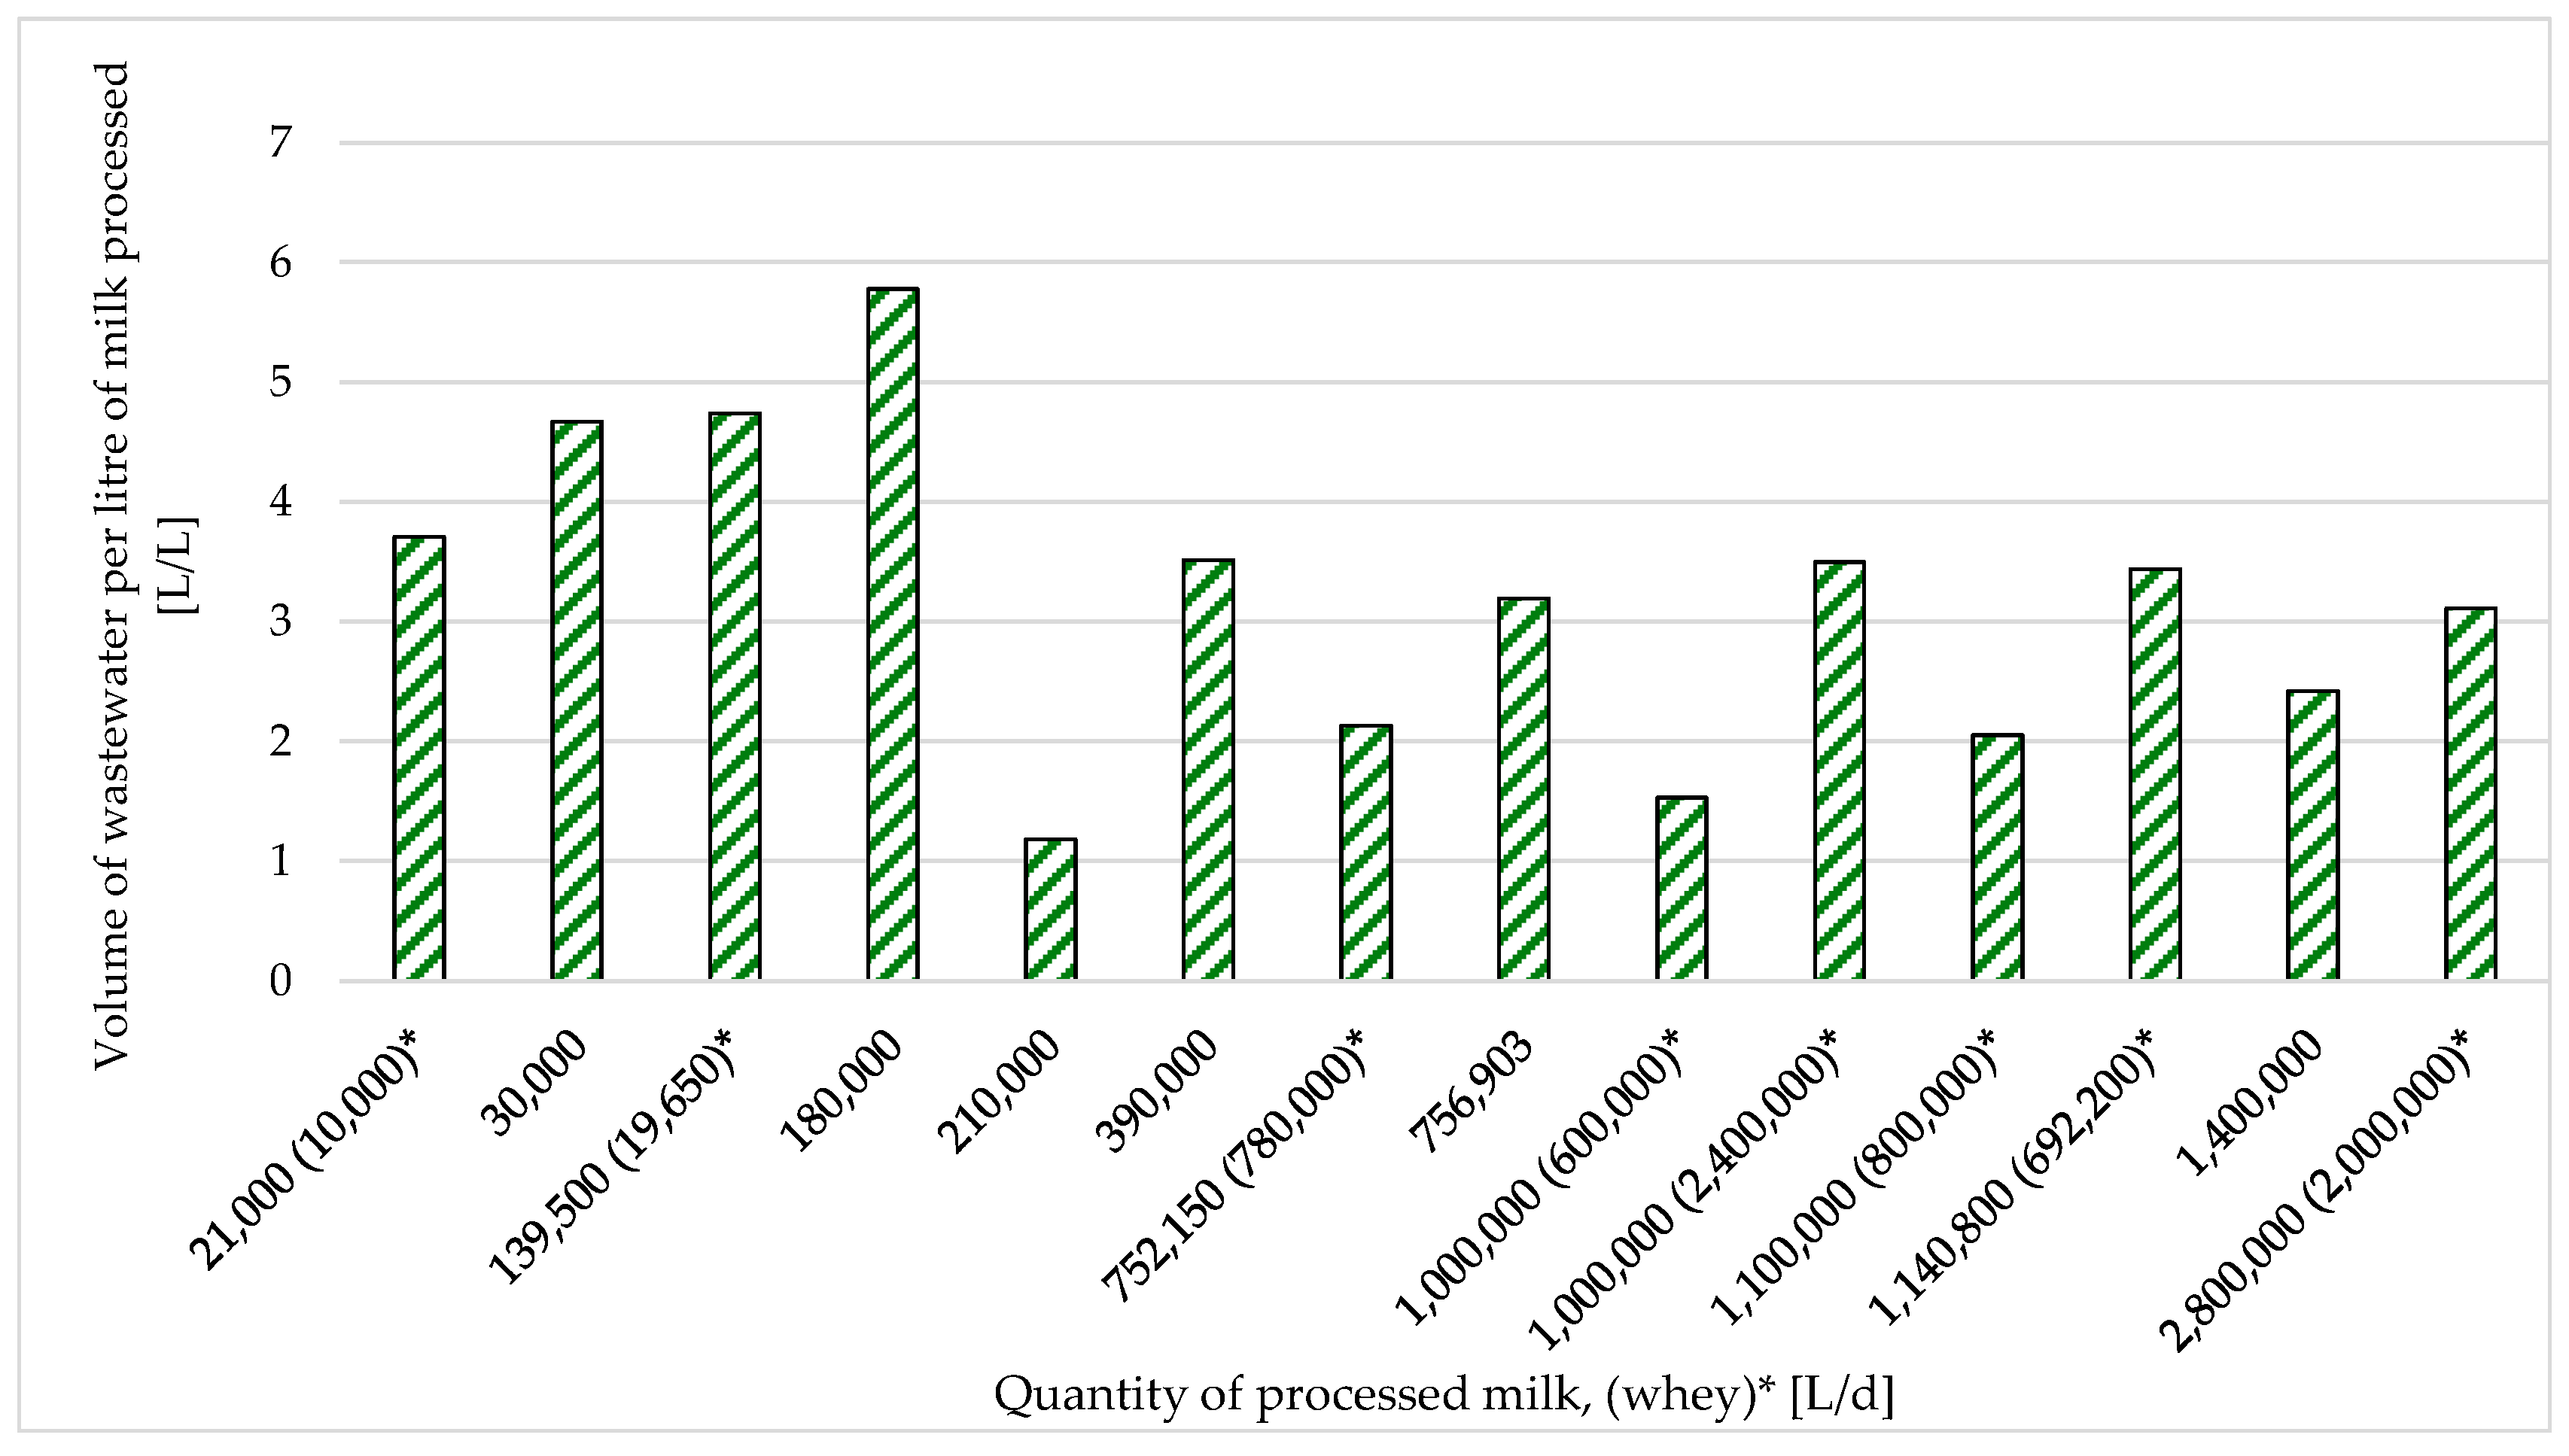
The dairies differ in the amount of wastewater produced during the production processes associated with the processing of 1 L of milk. The lowest value of this indicator is 1.18 L per L of milk, while the highest value is 5.78 L per L (Figure 2). Nine dairies produced more than 3 L of wastewater when processing 1 L of milk. These are high values compared to the data from the 1970s (2.43–3.14 L/L; [40]) and 1990s (1.26 L/L; [6]). At the same time, they are also higher than the values calculated by Stasinakis et al. [2] for drinking milk, ripening cheese and milk powder, namely 0.3–3 L/L milk, 0.75–2.5 L/L and 1.2–2.7 L/L, respectively.
In some plants, especially those that process whey, a higher volume of generated wastewater may result from the discharge of permeate from membrane whey thickening into the sewerage system as well as from milk and whey losses during production processes and their discharge into the wastewater system. The parameter that shows that such processes can take place is the unit quantity of wastewater per 1 L of water consumption (L/L). Only in two plants was the volume of wastewater discharged lower than the amount of water consumed (50 and 82%), which could be due to very economical water management (Figure 3). In three plants, the volume of wastewater was practically equal to the volume of water consumed (97, 100 and 104%). In one dairy, wastewater accounted for 234% of the water consumed, which could indicate considerable milk losses during production, as this dairy plant did not process whey. In four dairies processing whey as well as milk, the volume of generated wastewater was over 130% (134, 143, 137 and 147%) of the water consumed, which can be explained by the discharge of permeate into the sewerage system and the losses of whey and/or milk in the production process (Figure 3). In both cases, we are dealing with a loss of valuable raw materials [41].
The main difference between the surveyed treatment plants of the dairies was their capacity. The smallest plant treated 78 m3/d, while the largest treated 8710 m3/d. In 10 plants, the average daily flow was over 1000 m3/d. Four treatment plants had a capacity of over 3000 m3/d and one had a capacity of over 8700 m3/d. In 8 of the 13 WWTPs, the wastewater treatment technology was based on aerobic processes, whereas 5 were operated based on aerobic and anaerobic processes.
The mechanical section of the WWTP is dominated by screen traps, screens, grit chambers and sieves. Many plants use equalization tanks, flotation tanks (dissolved air flotation (DAF)) or degreasing plants. DAF is used in many plants around the world [2]. Multiphase aeration chambers in combination with secondary clarifiers are mainly used in the biological section, but also UASB and MBBR bioreactors. These modern systems are increasingly being used worldwide [42,43]. In some plants, older technological solutions are still used (BIOBLOK, BIOKON and other activated sludge chambers, e.g., with Kessen brushes). These solutions are among the technologies used for the treatment of dairy wastewater [44].
The concentration of organic compounds in the wastewater flowing into the treatment plant, expressed by the BOD5, was in the range of 465–3275 mg O2/L; in nine plants, it was above 1000 mg O2/L, whereas in the others it was below this value. For COD, the concentration range was 850–5032 mg O2/L. In nine plants, the COD value was above 2000 mg O2/L, and in the others it was below this value. The concentration of total suspended solids ranged from 75 to 1109 mg/L, nitrogen 16.2 to 168.4 mg/L and phosphorus 9.0 to 52.5 mg/L. The concentration of fats ranged from 22.0 to 400.0 mg/L. The pH of the wastewater was in the range of 6.5–9.5. In seven facilities, the pH value was below 8.0. The highest concentrations of BOD5, COD, total suspended solids, nitrogen and phosphorus were found in the largest facility, which processes 2.8 million litres of milk and 2.0 million litres of whey per day. With such a high production, all these plants could struggle with milk and whey losses (discharge of permeate into the sewerage system); they could also encounter problems related to the quality of some of the raw materials fed to the system that are unsuitable for processing. Despite the highest values of the indicators among the dairies examined, the wastewater concentrations are within the ranges specified in the literature. The BOD5 and COD values do not differ from the data obtained in Ireland [2,6,45,46]. At the same time, the BOD and COD concentrations were si2gnificantly lower than the values measured in Brazil [47]. These are higher values than those found in previous studies by Janczukowicz et al. [48], which could be due to the fact that water consumption in dairies in Poland has decreased over the last decade or so due to the increased cost of water purchase, environmental taxes and, most importantly, the introduction of water-saving solutions using “cow water” as a water source in some processes.
The concentrations of biogenic compounds in wastewater from the surveyed dairies are higher than in Denmark [49] and significantly higher than those reported for Spain [50]. However, it should be noted that the data cited relate to wastewater produced during the manufacture of the selected product range (milk powder or drinking milk). In such cases, very high values of wastewater concentrations from individual technological processes are recorded, and the concentration of the wastewater mixture flowing into the WWTP is determined by both the concentrations and the flow rates of the individual wastewater streams [10,51]. In the surveyed dairy plants, the production range was very extensive (Table 1), and the wastewater mixture flew into the WWTP from all production departments. The samples used to analyse the wastewater concentrations were average daily samples from a 24 h investigation period. The concentration of fats in the raw wastewater (even up to 400 mg/L) shows the viability of using flotation plants or degreasing plants, which is the case in most companies (Table 2).
An important issue is the management of treated wastewater. In accordance with the provisions of the water permit, it is discharged into receiving water and is “irretrievably lost”. Its treatment is associated with high costs. In addition, the water, which accounts for more than 99.99% of the wastewater, is supplied to the dairy by the owner of the water supply network or taken from the plant’s own intake. In both cases, costs are incurred for the purchase of tap water or charges for water services (water withdrawal) and water treatment costs. At the same time, charges are also incurred for water services consisting of the transportation of treated wastewater to the recipients. The costs of water extraction, wastewater treatment and discharge into water bodies are not offset by anything.
The current management of treated wastewater therefore involves significant costs and brings no environmental benefits. In view of ongoing climate change and the resulting problems with access to water, it would be worth considering taking measures to reuse treated dairy wastewater.
In 2020, the European Union issued a regulation on the minimum requirements for the reuse of water [52]. It specifies the requirements for treated wastewater depending on the crop category, irrigation methods and proposed technical solutions to ensure that the water meets these requirements. Disinfection and secondary treatment procedures are the same for all crop categories. In the case of crops where the edible part of the plant is consumed raw and is in direct contact with treated wastewater, a filtration process must also be used before disinfection.
Advanced treatment uses methods such as microfiltration and reverse osmosis (RO) to reuse dairy wastewater. In addition to these methods, there are other technologies for obtaining reclaimed water [53].
Only in1 plant was no domestic or industrial wastewater discharged into the production WWTP; in 17 plants, the domestic and industrial wastewater were discharged into the company’s sanitary system and treated together with the production wastewater (Table 3). This solution involves the risk of sanitary contamination of the sewage sludge and its exclusion from agricultural use. This need not be the case, because the greater the “dilution” of domestic wastewater with production wastewater, the lower the probability of the presence of pathogenic organisms in the sewage sludge discharged from the WWTP [51].
The annual volume of dehydrated sludge discharged from the WWTPs studied was between 15 and 27,553 Mg (Table 3). In most WWTPs, excess activated sludge was stabilized aerobically, directly in the activated sludge chambers or in separate stabilization chambers, followed by a solution combining aerobic and anaerobic sludge stabilization (aerobic in activated sludge chambers, anaerobic in separate digestion chambers). The sludge from two plants was transported to industrial biogas plants owned by another company. In one dairy, the thickened excess sludge is fed into an external biogas plant together with the post-flotation sludge. The sludge was usually dehydrated on filter presses. Agricultural application of dehydrated sewage sludge predominated (10/14 of the surveyed WWTPs). Only at one wastewater treatment plant did the sewage sludge not end up on agricultural land. No relevant data were collected for three plants (Table 3).
Despite the discharge of domestic wastewater in WWTPs, the results of the sanitary examinations of the sludge showed that none of the samples contained dangerous pathogenic organisms that would prevent their agricultural application (Table 4). The dry matter of the sludges examined ranged from 6.14 to 23.65%, which means that the hydration of the sludges was between 76.35% and 93.86%. Therefore, the sludge has a sticky or earthy form.
The organic matter content of the sludges ranged from 40.15 to 80.2%, which means that not all of them should be considered stabilized. According to [54], the technical threshold of stabilization is a reduction in the original organic matter in the sludge by 38–40% (Table 4). The fertilizing value of sewage sludge is determined not only by the organic matter content, but also by the nitrogen and phosphorus content as well as contents of other macronutrients. In the case of nitrogen, this value was between 3.86 and 8.29% of the dry matter (DM). For phosphorus, it was between 1.03 and 8.13% DM. These values are comparable to those determined in studies with sewage sludge from a dairy WWTP in Ireland [55] and to the data presented in the study by Hu et al. [56] and by Usmani et al. [57]. Unfortunately, none of the reports from the studies on sewage sludge contained information on potassium content.
The content of meso-elements (Mg and Ca) was in the range of 0.27–0.66% DM and 1.13–19.6% DM, respectively, and were higher than the values reported by [58] for biochemically treated activated sludge, but lower than those found for the lime-treated sludge from DAF.
The analyses of the content of heavy metals, mercury (0.01–0.28 mg/kg DM), lead (2.49–16.52 mg/kg DM), cadmium (0.25–1.18 mg/kg DM), chromium (6.50–20.57 mg/kg DM), nickel (3.51–16.70 mg/kg DM), copper (8.19–133.40 mg/kg DM) and zinc (87.30–1138.0 mg/kg DM), showed that the concentrations found were well below the values specified in European Council Directive 86/278/EEC for application on agricultural land [59]. They did not differ significantly from the values provided in articles on the quality of sewage sludge from Polish dairy WWTPs in the early 2000s [15,17] and in flotation sludges from the pre-treatment of dairy wastewater in the DAF [60].
The pH value of the sewage sludge ranged from 6.05 to 12.1. The higher values result from the use of lime during sludge stabilization, e.g., from the DAF. The pH value of the sewage sludge is not a parameter that determines its suitability for agricultural use. The pH value of the soil in the agricultural areas where the sewage sludge is to be used is important; it must not be below 5.6 [59].
When analysing the results, it was not possible to establish a relationship between the quality characteristics of the sludge and the quantity of milk processed or the volume of wastewater treated and the technology of wastewater and sludge treatment. Too many factors influence water, wastewater and sludge management in dairies.
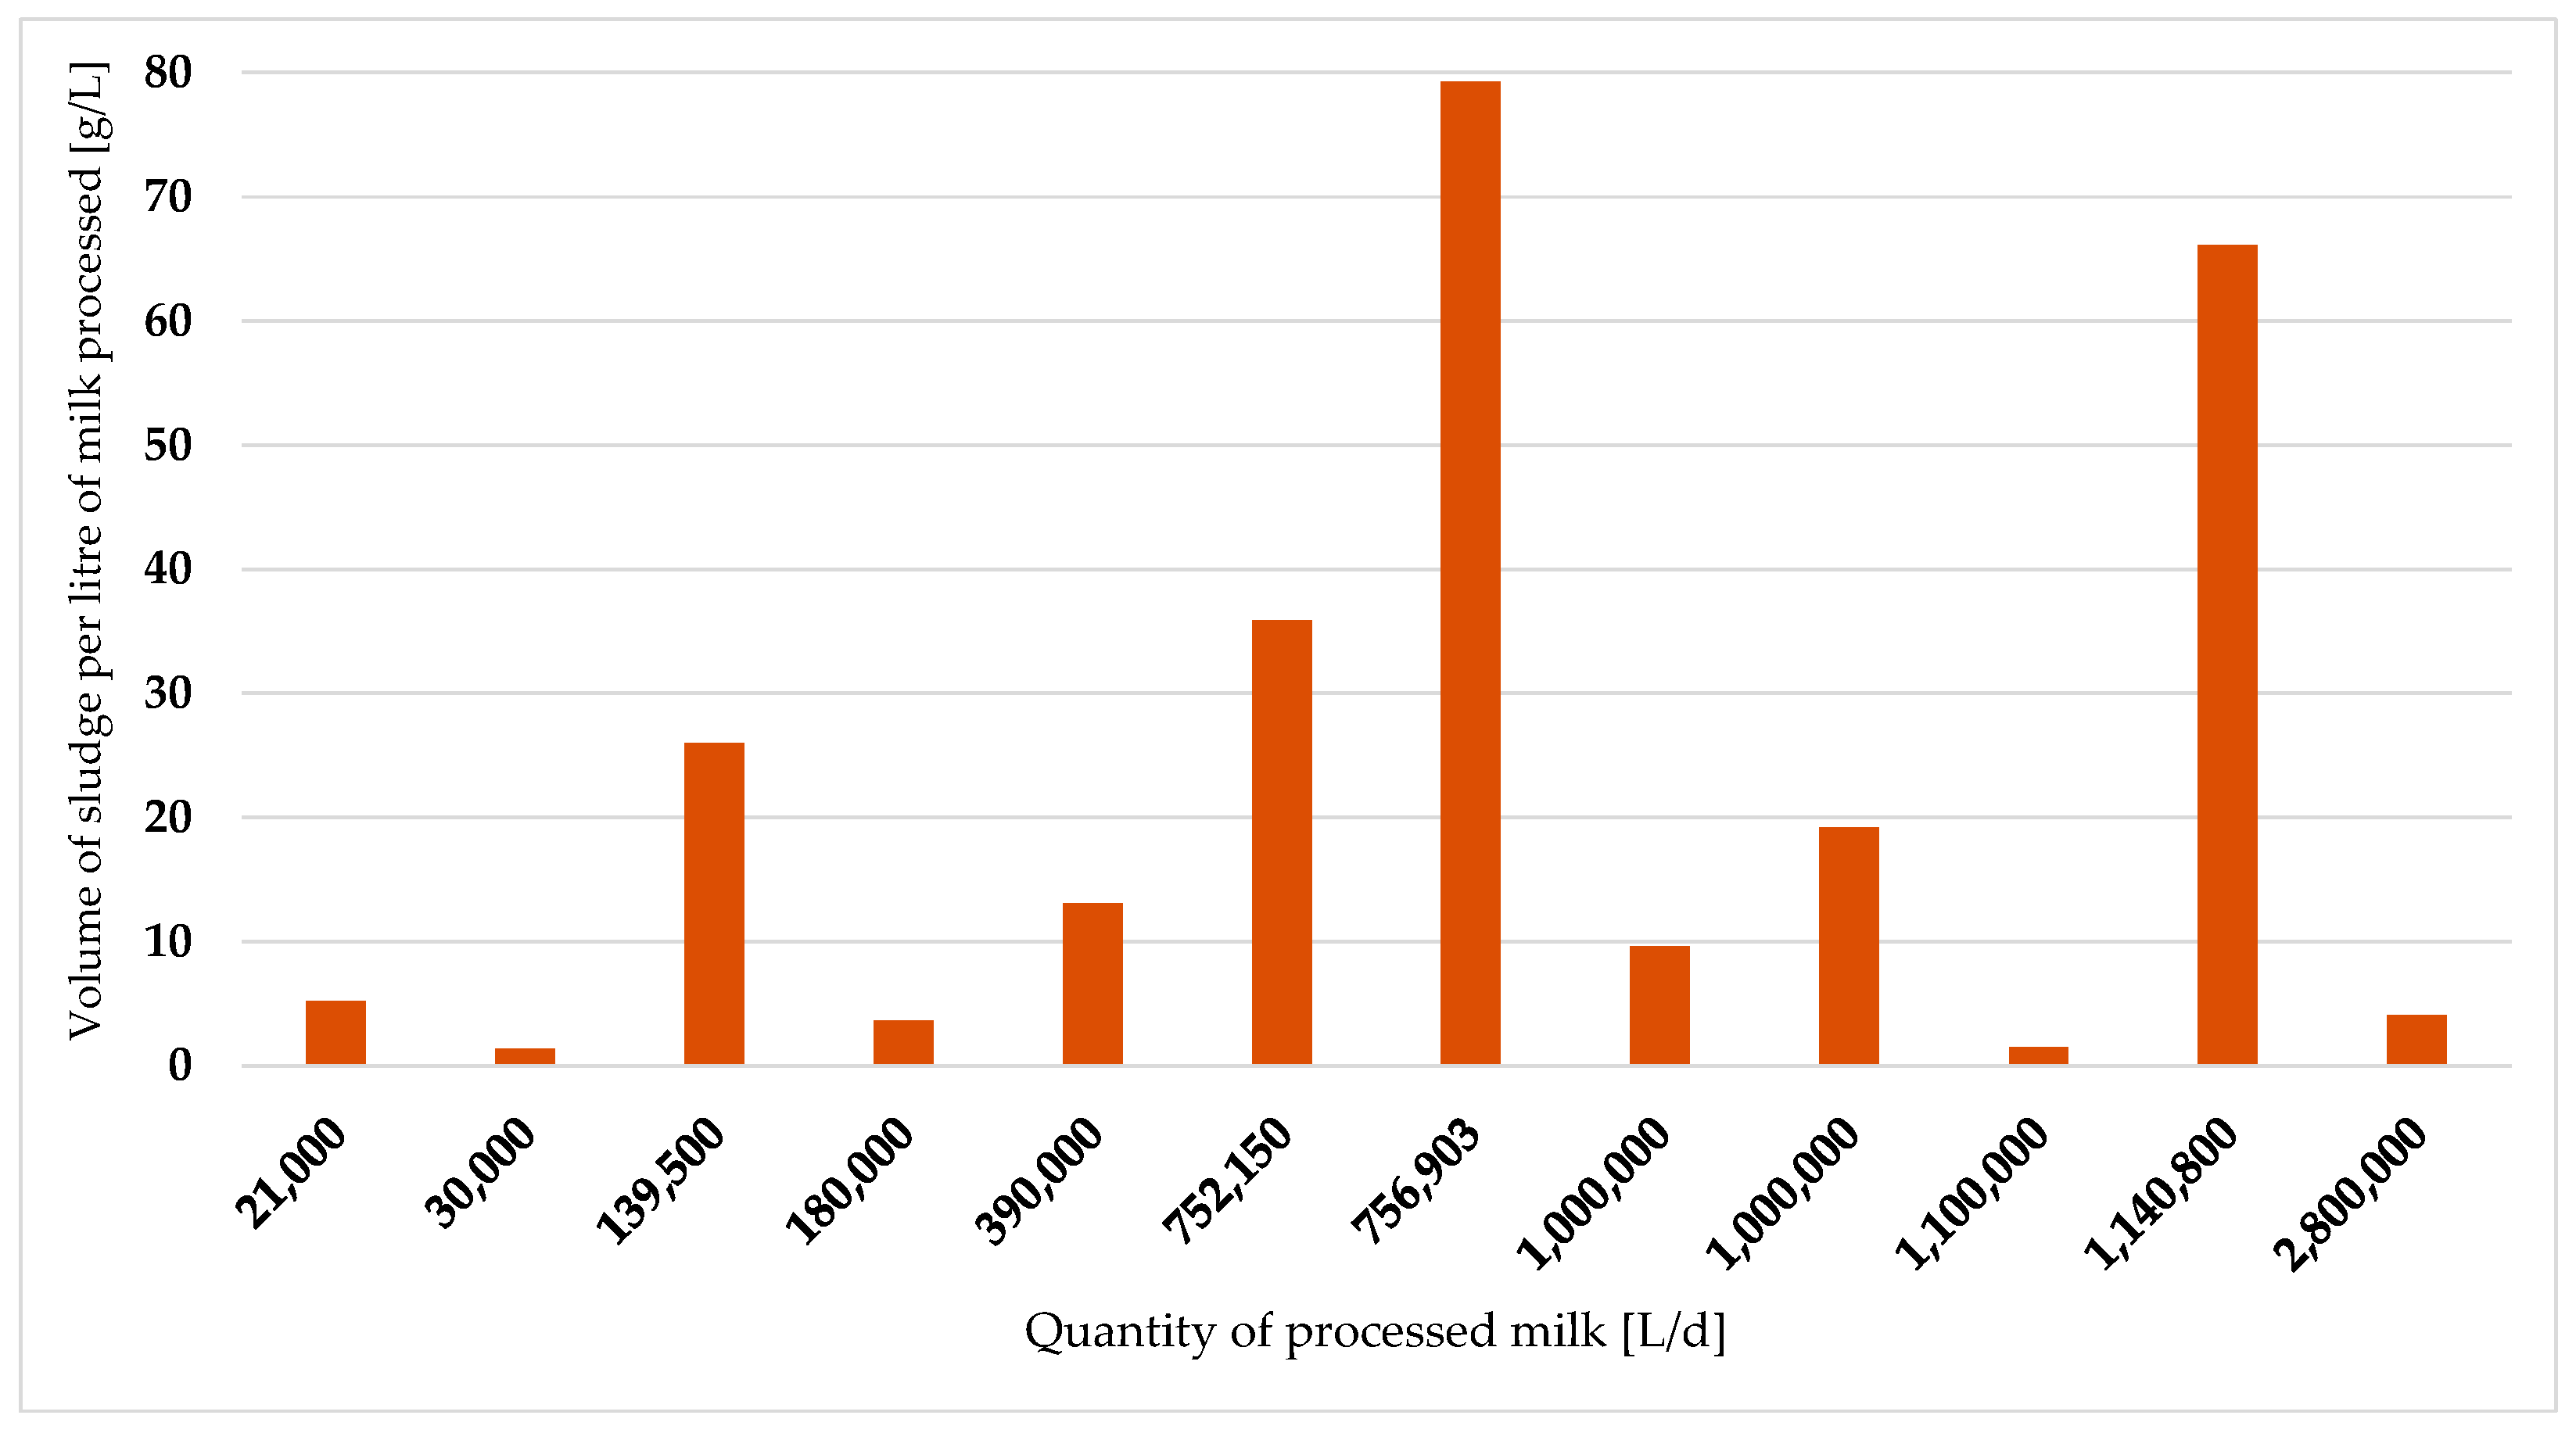
The data on the volume of generated sludge show that the ratio of sludge to raw milk processing was between 0.137 and 7.927 kg of sludge per 100 L of milk processed (Figure 4). The upper limit is significantly higher than the value reported by Ashekuzzaman et al. [14] (2.0 kg/100 L), but it should be noted that the values reported by the dairies include all types of sludge produced in their treatment plants. The highest value is also significantly higher than the value observed in dairies in Ireland in 2017 (1.51 kg/100 L milk) [12].
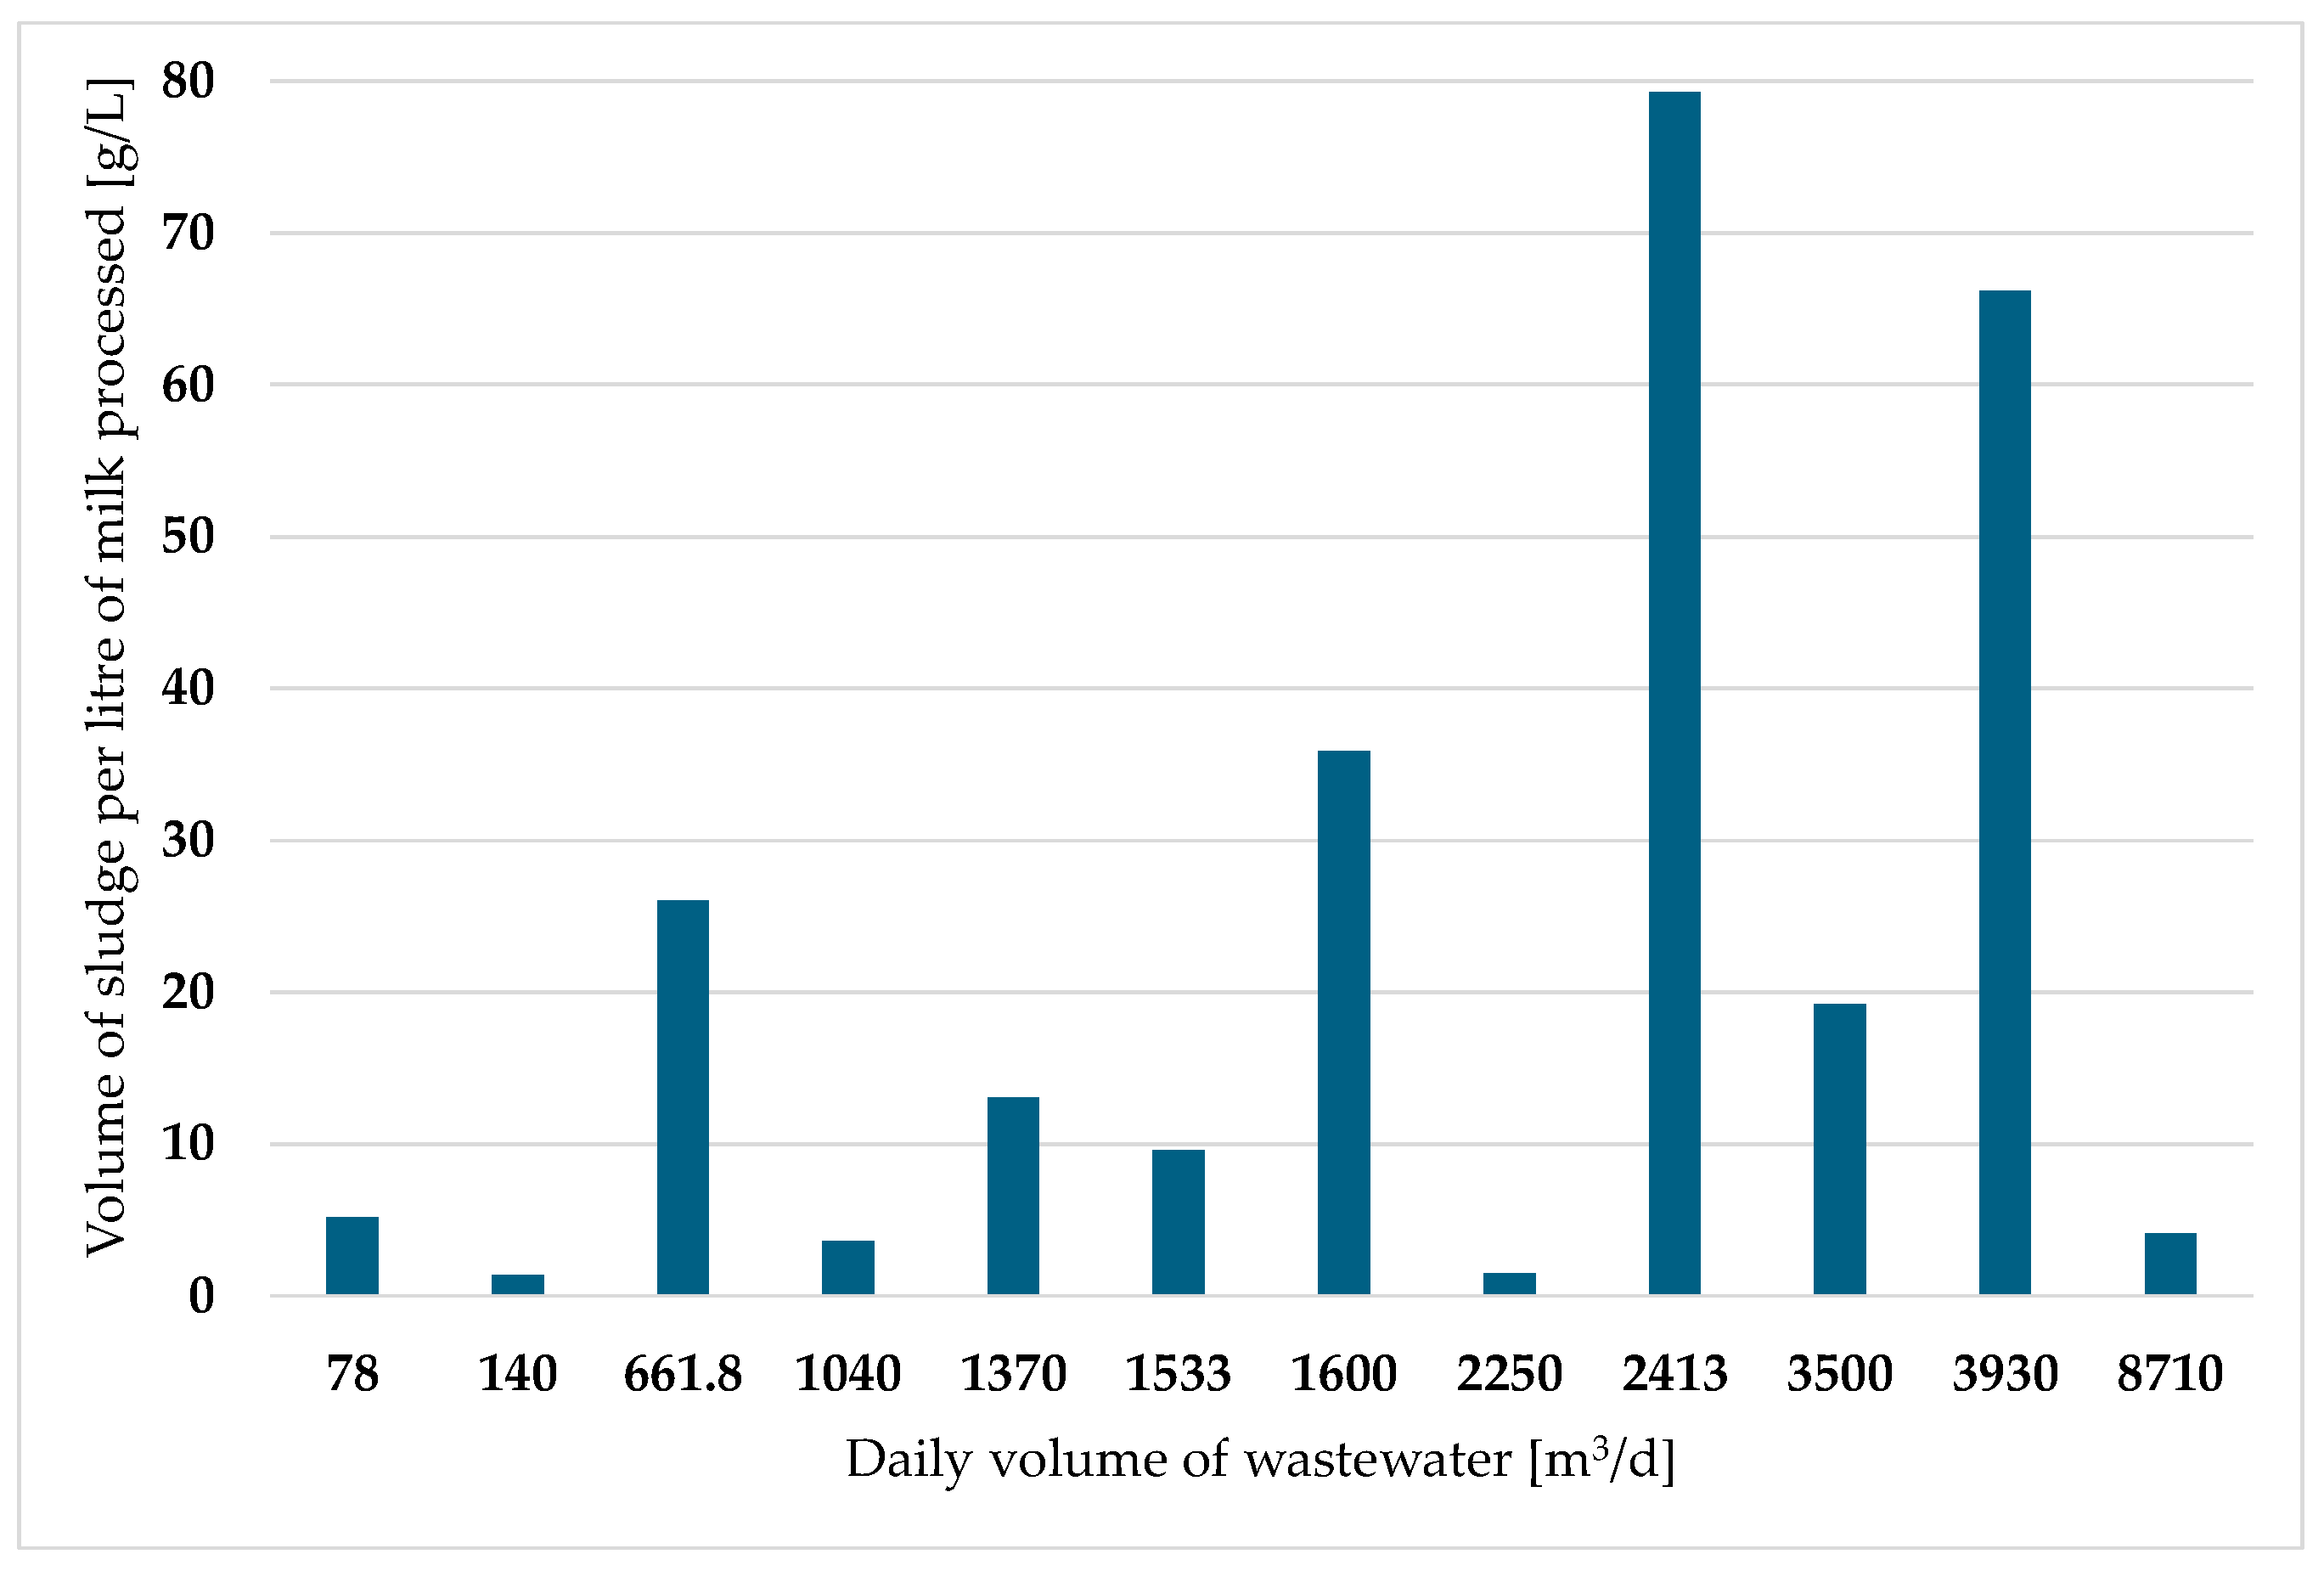
The lowest value was found in a dairy plant processing 30,000 L of milk per day and the highest one in a plant processing over 750,000 L. In the plant with the largest milk processing capacity (2,800,000 L/day), 0.409 kg of sludge was produced per 100 L of milk processed. There was no influence of the amount of milk processed (Figure 4) or the amount of wastewater treated on the amount of sludge produced by the milk (Figure 5).
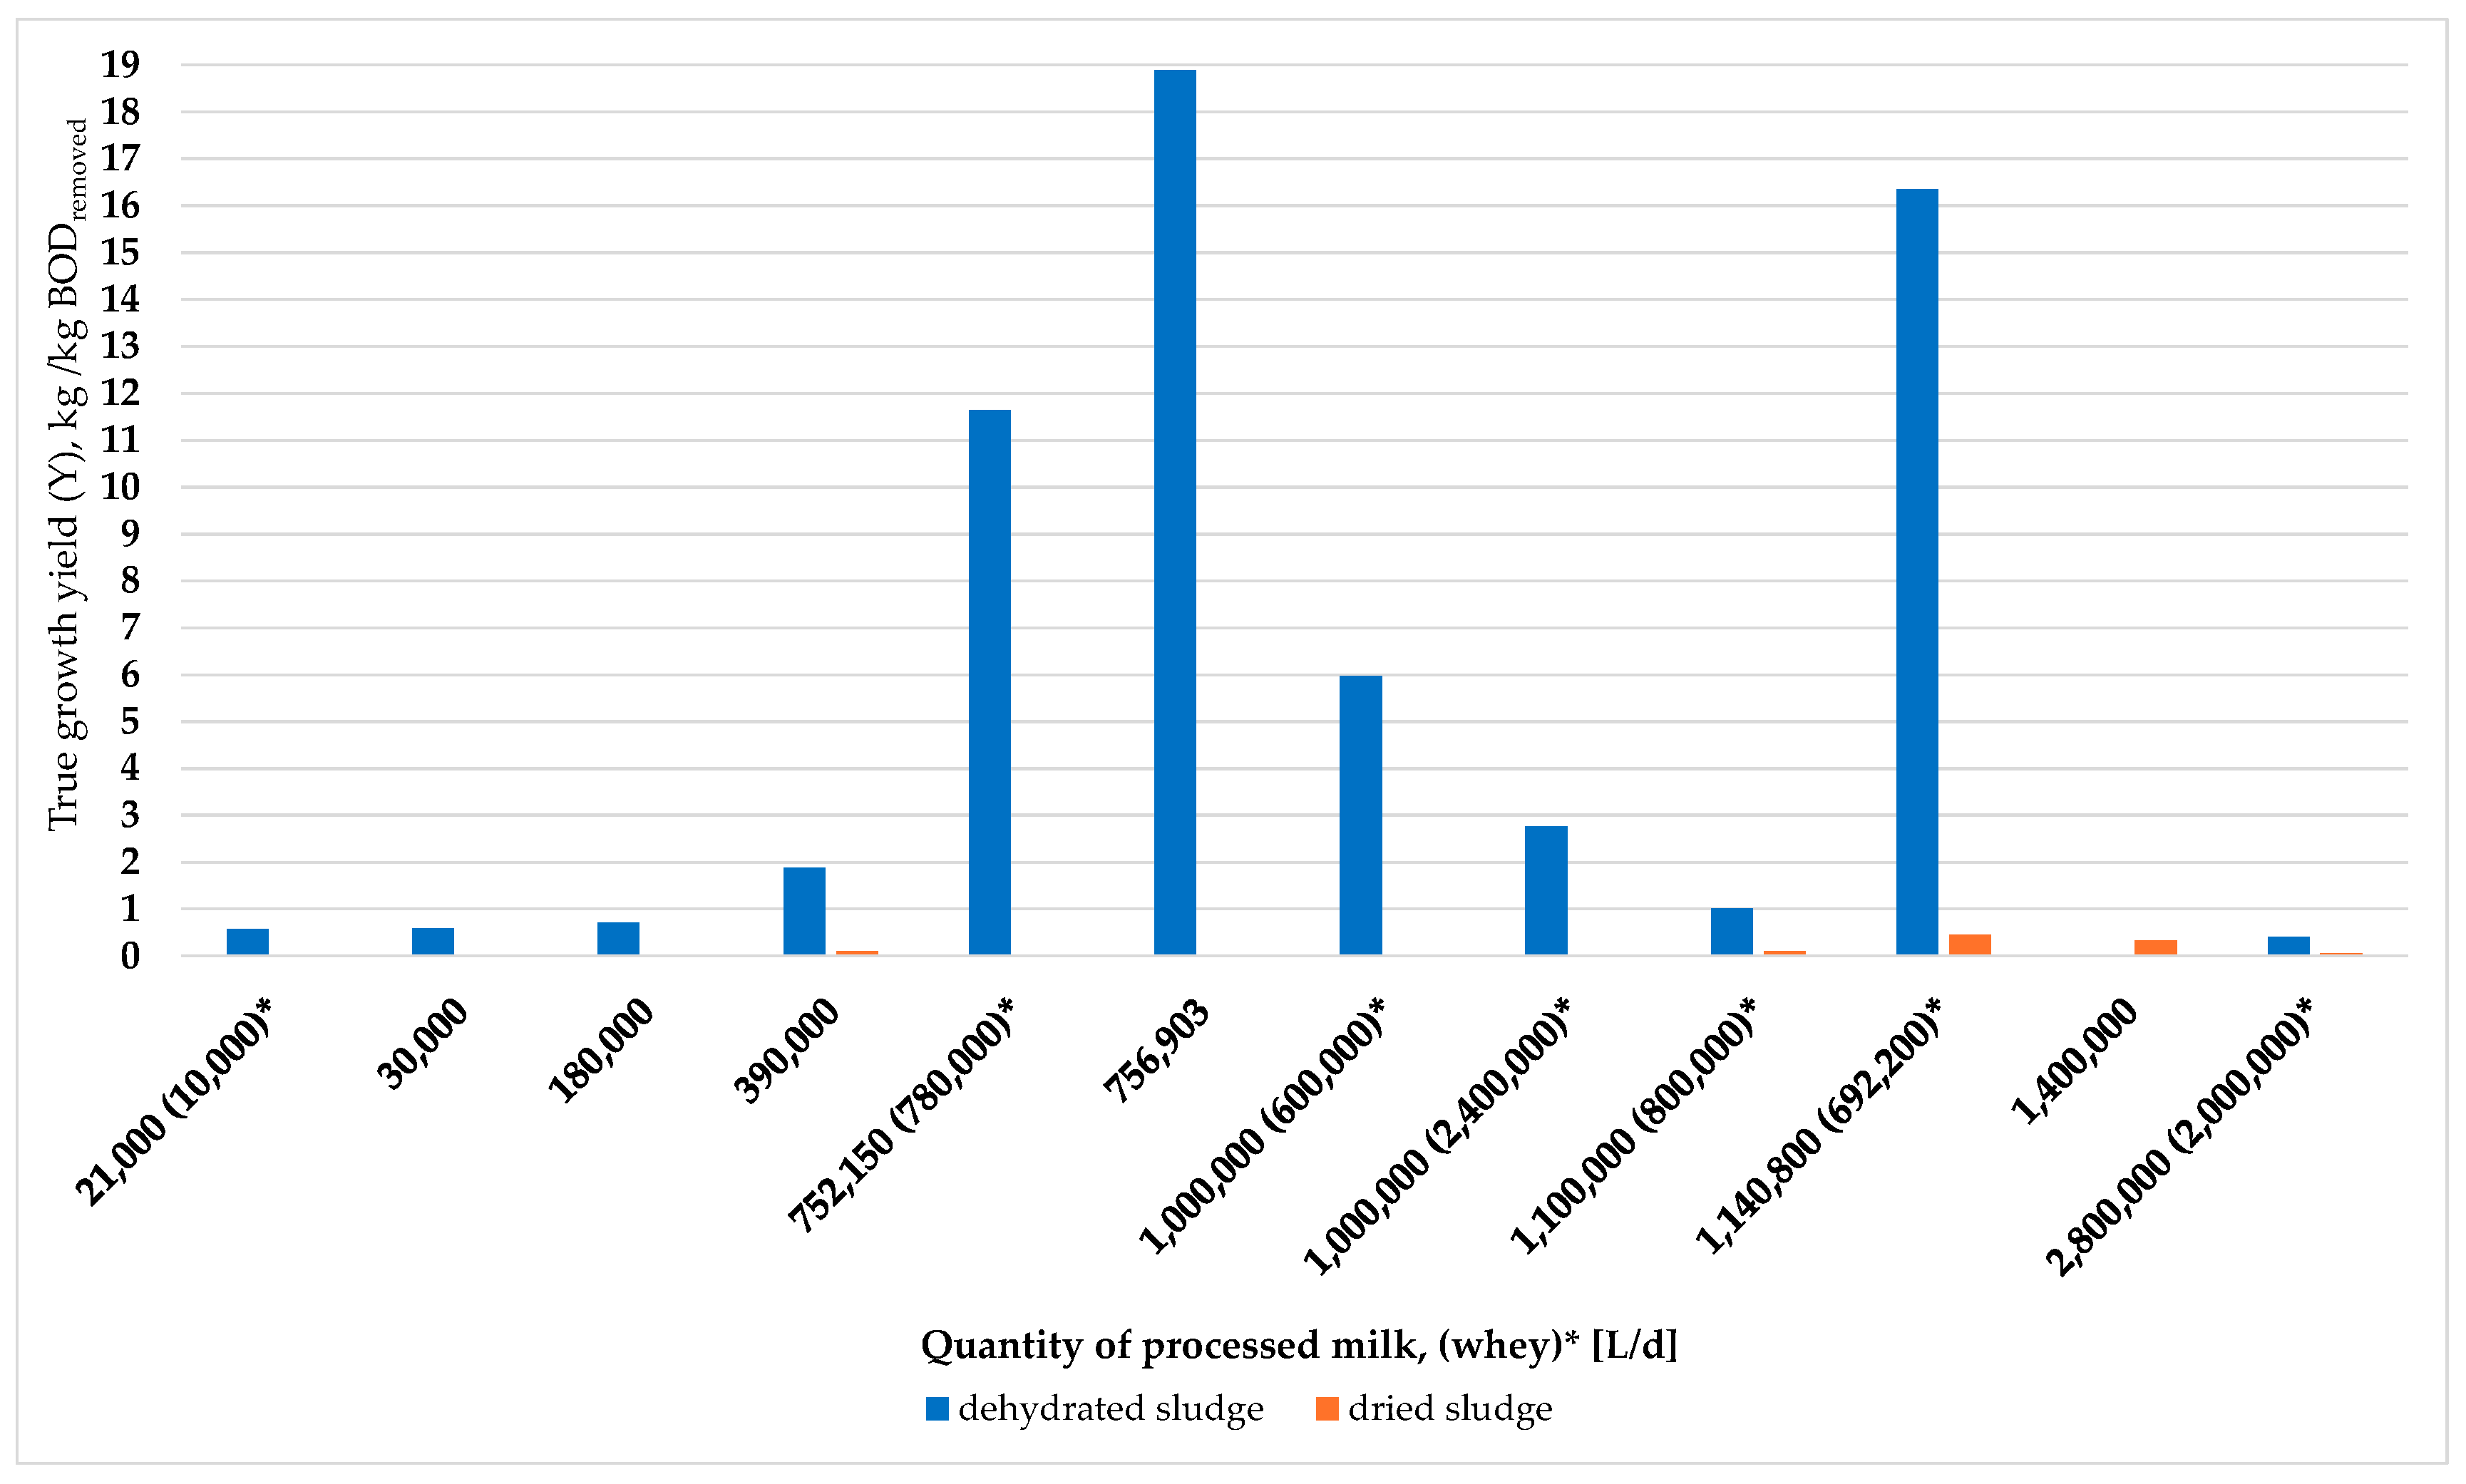
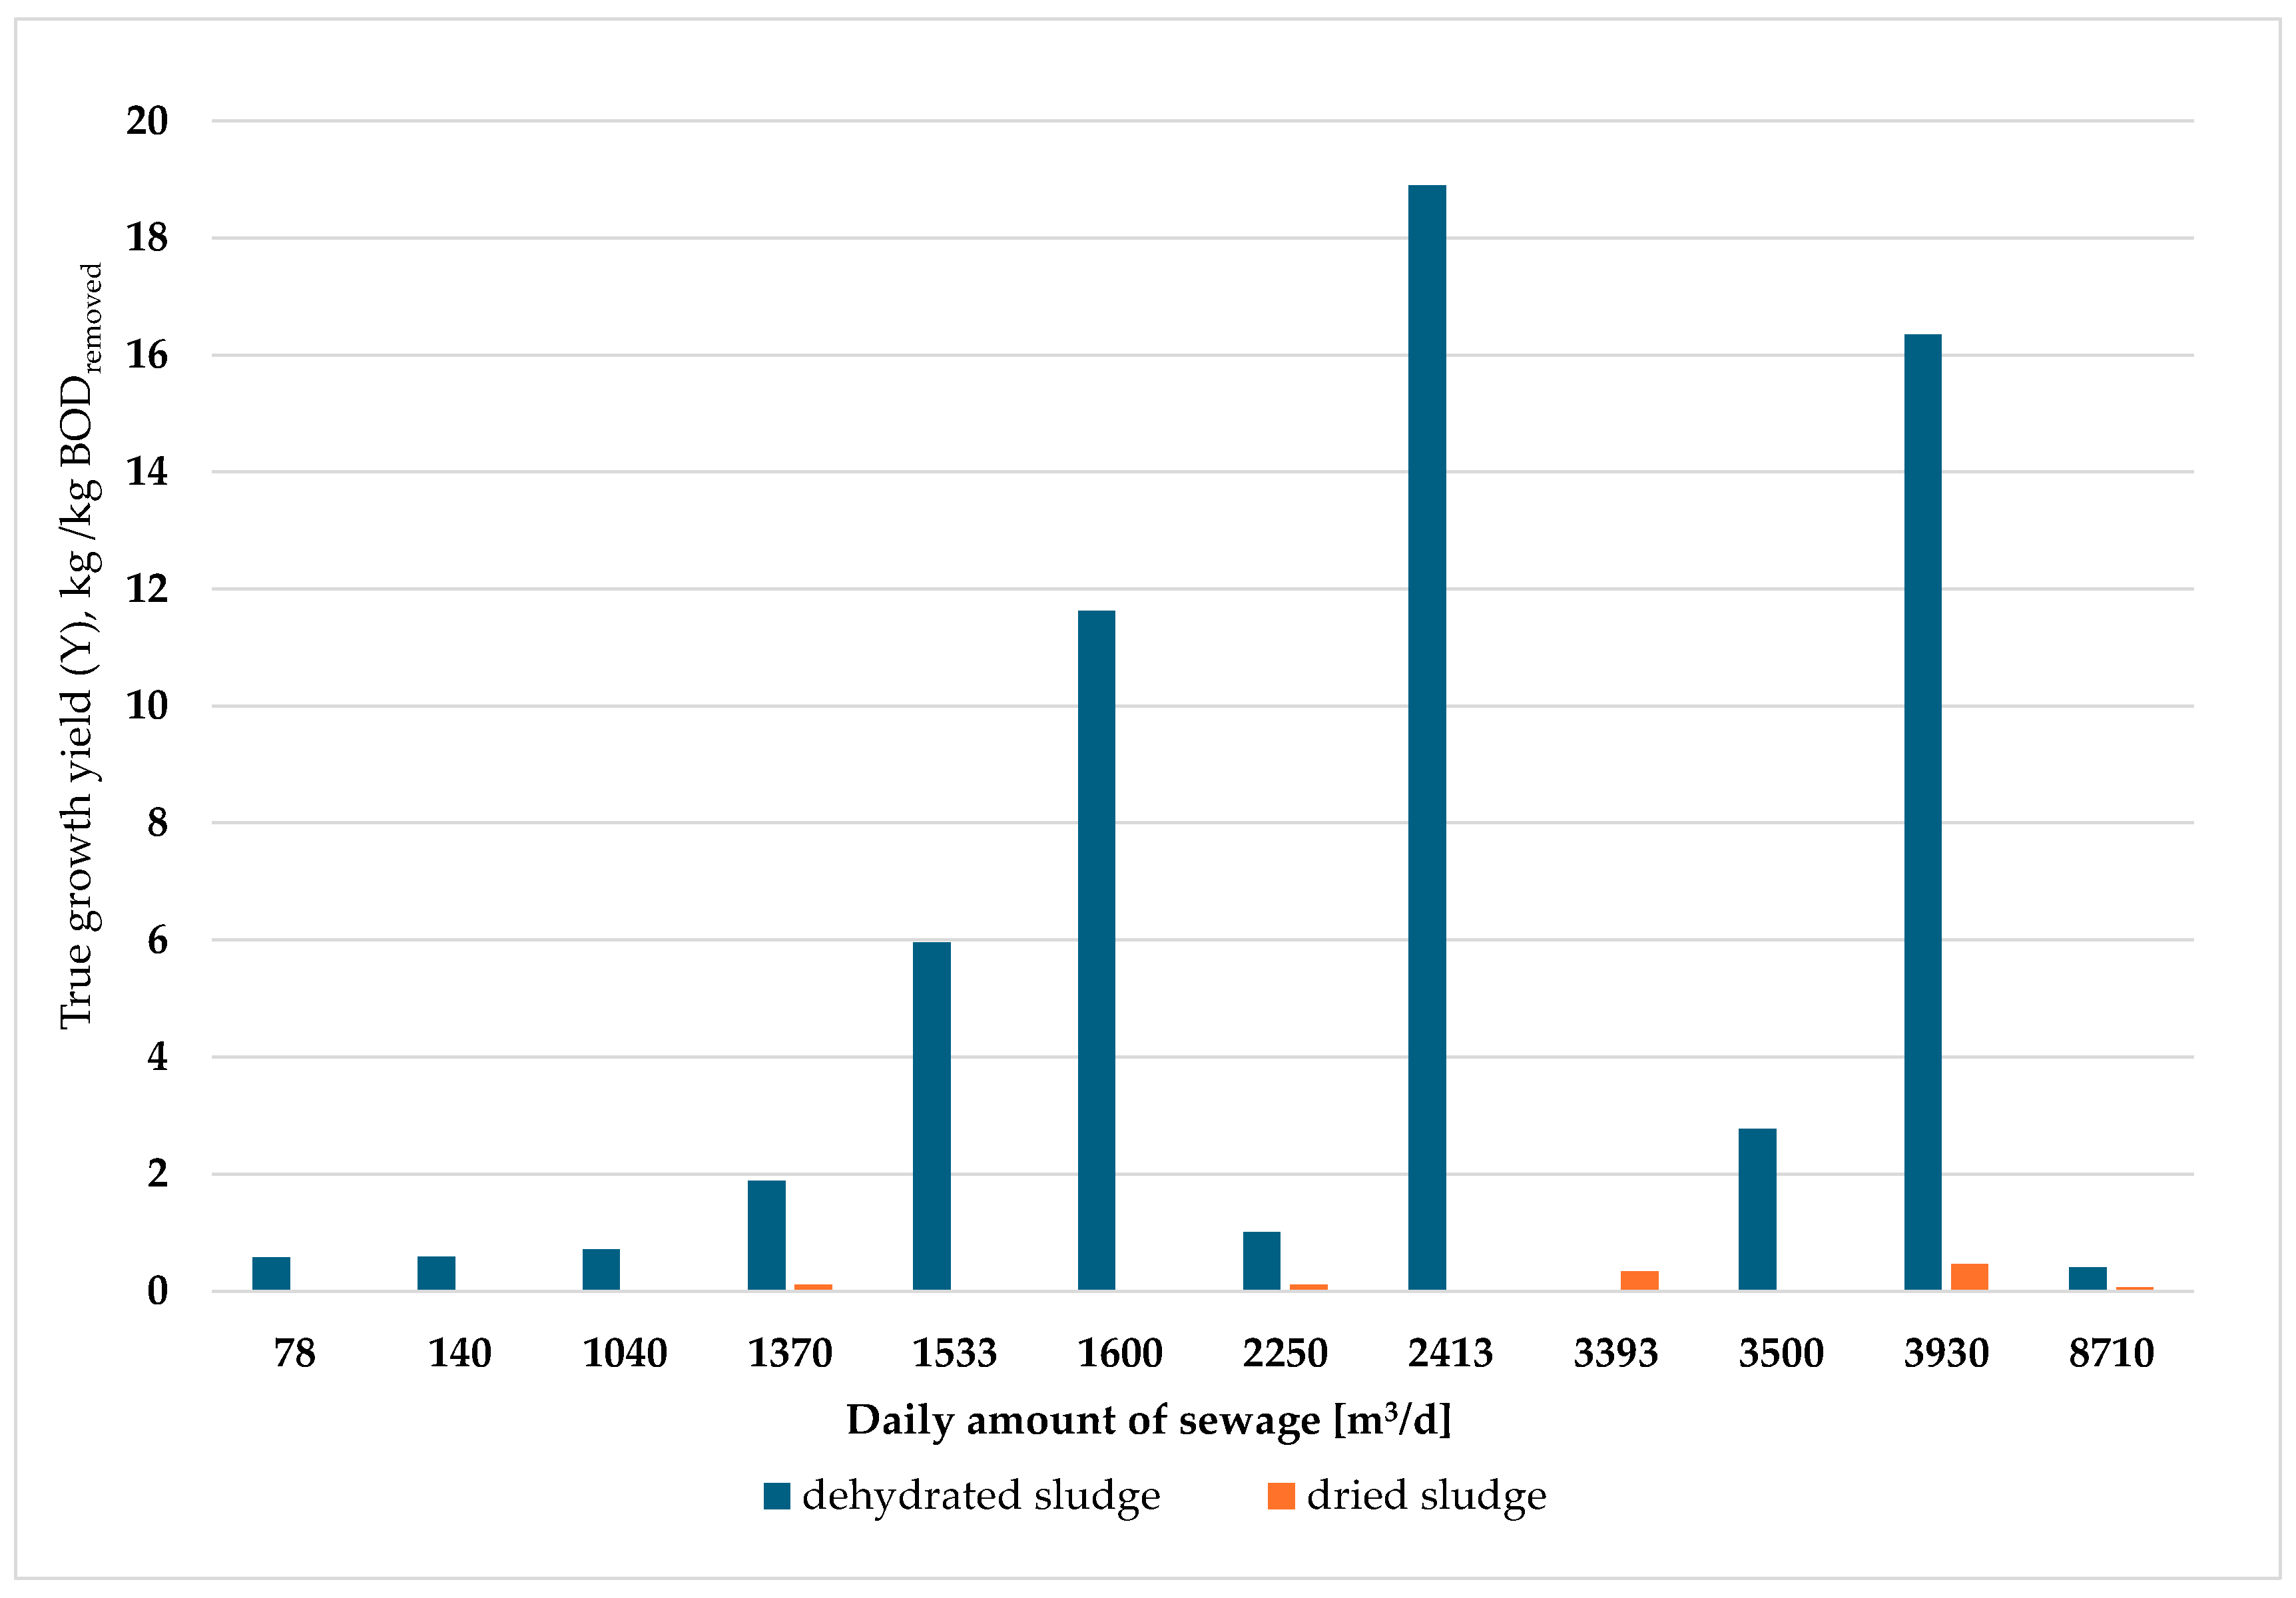
An important parameter in the planning of new WWTPs is the amount of sludge produced per pollutant load removed (Y). In the present study, it ranged from 0.404 to 18.895 kg/kg BODrem. (Figure 6). It should be again noted that the values reported by the dairies include all types of sludge produced in their treatment plants. Again, no correlation was found between the amount of milk processed, the amount of sludge treated and true growth yield (Figure 6 and Figure 7).
It can be assumed that significantly less sludge is produced in the biological section of the WWTP during the treatment process, as evidenced in Figure 6 and Figure 7. According to the results of research by Boruszko and Dąbrowski [60], the pre-treatment of 1 m3 of dairy wastewater in the DAF leads to the formation of 0.64 kg DM to about 1.4 kg DM of post-flotation sludge.

4. Conclusions

Surveys were conducted in 18 dairies with different water, wastewater and sewage sludge management models. Only two plants used closed water circuits. This shows that it will be possible to reduce water consumption in most plants in the future by implementing this type of solution. The water consumption per unit ranged from 1.5 L of water per litre of milk processed to 3.71 L per L. In most cases, the values for water consumption per unit were within the recommended values and fulfilled the BAT criteria. In three of the four dairies where the water consumption per unit was above 3.0 L/L, the product range was very diversified. Such fragmentation of production is associated with the operation of many smaller, specialized production lines and consequently higher water consumption per unit. When analysing the data, no explicit effect of whey processing on the increase in the volume of water per unit was found compared to dairies where such processing did not take place. This confirms that water consumption is mainly determined by the unitary solutions of water and wastewater management in a given plant.
The dairies differed in the unit volume of wastewater produced during the processing of 1 L of milk. The lowest value of this indicator was 1.18 L per L of milk, while the highest value was 5.78 L per L. In some plants, especially those that process whey, a higher amount of wastewater may result from the discharge of permeate from membrane whey thickening into the sewerage system and from milk and whey losses during production processes.
The parameter that illustrates the state of water and wastewater management on the dairies is the unit volume of wastewater per 1 litre of water consumed (L/L). In two dairies, the volume of wastewater discharged was less than the volume of water consumed, which could be due to very economical water management. In one dairy, wastewater accounted for 234% of the water consumed, which could indicate significant milk losses during production as this dairy plant does not process whey. The concentrations of dairy fed into WWTPs were comparable to the concentrations of dairy wastewater in other European countries. Depending on the size of the plant, technologies based on simple solutions, such as activated sludge chambers aerated with Kessen brushes, up to UASB- and MMBR-type reactors, MBR and oxygen aeration, are used for its treatment. In turn, degreasing plants or flotation plants (DAF) are used to remove fats.
In most WWTPs, excess activated sludge was stabilized aerobically, directly in the activated sludge chambers or in separate stabilization chambers, followed by a solution combining aerobic and anaerobic sludge stabilization (aerobic in activated sludge chambers, anaerobic in separate digestion chambers). Despite the disposal of domestic wastewater in WWTPs, the results of the sanitary examinations of the sludge show that none of the samples contained dangerous pathogenic organisms that would prevent their agricultural application. The analyses of the content of heavy metals showed that the concentrations found were well below the values specified for application on agricultural land. The data on the volume of sludge show that the ratio of sludge to raw milk processing was between 0.137 and 7.927 kg of sludge per 100 L of milk processed. The volume of sludge produced per pollutant (BOD) load removed (Y) ranged from 0.404 to 18.895 kg/kg BODrem.
The high values of water consumption per litre of milk processed, the volume of wastewater per litre of water and per litre of milk processed, the ratio between sludge and raw milk processing and sludge production in some dairies show that it is necessary to analyse both water and wastewater management and sludge management in order to rationalize water consumption and reduce the amount of sludge and wastewater produced.
The current management of dairy wastewater involves significant costs. In view of ongoing climate change and the resulting problems with access to water, it would be worth considering taking measures to reuse treated dairy wastewater. The European Union regulation for the reuse of treated wastewater water in agriculture specifies the requirements for treated wastewater and proposed technical solutions to ensure that the wastewater meets these requirements. Disinfection and secondary treatment procedures are the same for all crop categories. In the case of crops where the edible part of the plant is consumed raw and is in direct contact with treated wastewater, a filtration process must also be used before disinfection. The implementation of these regulations in Poland requires the expansion of dairy wastewater treatment plants with filtration and disinfection systems.

Author Contributions

Conceptualization, J.R. and W.J.; methodology, K.K. and A.M.; validation, K.J., P.B. and T.S.; formal analysis, J.R. and A.M.; data curation, K.K. and J.R.; writing—original draft preparation, W.J.; writing—review and editing, K.J., P.B. and T.S.; supervision, W.J. All authors have read and agreed to the published version of the manuscript.

Funding

Project funded under the designated subsidy of the Minister of Science and Higher Education Republic of Poland, task entitled The Research Network of Life Sciences Universities for the Development of the Polish Dairy Industry—Research Project.

Institutional Review Board Statement

Not applicable.

Informed Consent Statement

Not applicable.

Data Availability Statement

The data presented in this study are available in the article.

Conflicts of Interest

The authors declare no conflicts of interest.

References

  1. Eurostat. Milk and Milk Product Statistics. 2024. Available online: https://ec.europa.eu/eurostat/statistics-explained/index.php?title=Milk_and_milk_product_statistics (accessed on 2 October 2024).
  2. Stasinakis, A.S.; Charalambous, P.; Vyrides, I. Dairy wastewater management in EU: Produced amounts, existing legislation, applied treatment processes and future challenges. J. Environ. Manag. 2022, 303, 114152. [Google Scholar] [CrossRef]
  3. Eurostat. Milk and Milk Product Statistics. 2021. Available online: https://ec.europa.eu/eurostat/statistics-explained/index.php/Milk_and_milk_product_statistics#Milk_production (accessed on 2 October 2024).
  4. EDA. Product Environmental Footprint Category Rules for Dairy Products. The European Dairy Association. 2018. Available online: https://ec.europa.eu/environment/eussd/smgp/pdf/PEFCR-DairyProducts_2018-04-25_V1.pdf (accessed on 22 October 2024).
  5. JRC. Best Available Techniques (BAT) Reference Document for the Food, Drink and Milk Industries. Industrial Emissions Directive 2010/75/EU Integrated Pollution Prevention and Control. 2019. Available online: https://publications.jrc.ec.europa.eu/repository/handle/JRC118627 (accessed on 15 October 2024).
  6. Danalewich, J.R.; Papagiannis, T.G.; Belyea, R.L.; Tumbleson, M.E.; Raskin, L. Characterization of dairy waste streams, current treatment practices, and potential for biological nutrient removal. Water Res. 1998, 32, 3555–3568. [Google Scholar] [CrossRef]
  7. Boguniewicz-Zablocka, J.; Klosok-Bazan, I.; Naddeo, V. Water quality and resource management in the dairy industry. Environ. Sci. Pollut. Res. 2019, 26, 1208–1216. [Google Scholar] [CrossRef]
  8. Bella, K.; Venkateswara Rao, P. Anaerobic digestion of dairy wastewater: Effect of different parameters and co-digestion options—A review. Biomass Convers. Bioref. 2023, 13, 2527–2552. [Google Scholar] [CrossRef]
  9. Available online: https://www.portalspozywczy.pl/mleko/wiadomosci/ile-gatunkow-sera-produkuje-sie-w-polsce-ten-segment-rosnie-w-sile,255276.html (accessed on 10 December 2024).
  10. Janczukowicz, W.; Zieliński, M.; Dębowski, M. Biodegradability evaluation effluents originated in selected sections of dairy production. Bioresour. Technol. 2008, 99, 4199–4205. [Google Scholar] [CrossRef] [PubMed]
  11. Janczukowicz, W. Phosphorus removal from process dairy wastewater in a sequencing biological reactor in the presence of selected volatile fatty acids (VFA) application. In Dissertations and Monographs; Publishing House of the University of Warmia and Mazury: Olsztyn, Poland, 2005. (In Polish) [Google Scholar]
  12. Ashekuzzaman, S.M.; Forrestal, P.; Richards, K.; Fenton, O. Dairy industry derived wastewater treatment sludge: Generation, type and characterization of nutrients and metals for agricultural reuse. J. Clean. Prod. 2019, 230, 1266–1275. [Google Scholar] [CrossRef]
  13. Rodziewicz, J.; Janczukowicz, W.; Jóźwiakowski, K.; Mielcarek, A. A review on generation, composition, and valorization of dairy processing sludge: A circular economy-based sustainable approach. Dairy Rev. 2024, 11, 2–9. (In Polish) [Google Scholar]
  14. Ashekuzzaman, S.M.; Kwapinska, M.; Leahy, J.J.; Richards, K.; Fenton, O. Novel use of dairy processing sludge derived pyrogenic char (DPS-PC) to remove phosphorus in discharge effluents. Waste Biomass Valoriz. 2020, 11, 1453–1465. [Google Scholar] [CrossRef]
  15. Ciećko, Z.; Wyszkowski, M.; Rolka, E. Chemical characteristics of sewage sludge from dairy treatment plants. Probl. Noteb. Adv. Agric. Sci. 2001, 477, 313–318. (In Polish) [Google Scholar]
  16. Lopez-Mosquera, M.E.; Cascallana, V.; Seoane, S. Comparison of the effects of dairy sludge and a mineral NPK fertilizer on an acid soil. Investig. Agrar. Prod. Prot. Veg. 2002, 17, 87–99. [Google Scholar]
  17. Filipek, T.; Fidecki, M.; Harasim, P. The influence of sewage sludge from dairy on yielding and some quality indices on grain of winter wheat. Ann. UMCS Sect. E 2004, 59, 1925–1931. (In Polish) [Google Scholar]
  18. Ashekuzzaman, S.M.; Fenton, O.; Meers, E.; Forrestal, P.J. Differing phosphorus crop availability of aluminium and calcium precipitated dairy processing sludge potential recycled alternatives to mineral phosphorus fertilizer. Agronomy 2021, 11, 427. [Google Scholar] [CrossRef]
  19. Ministry of Climate and Environment (Warsaw, Poland). Data (Database of Products and Packaging and Waste Management) from the Ministry of Climate and Environment Received in the Response on the Letter. 16 February 2024. [Google Scholar]
  20. Statistical Yearbook of the Republic of Poland 2024; Statistics Poland: Warsaw, Poland, 2024.
  21. PN-EN ISO 5815-1:2019-12; Water Quality—Determination of Biochemical Oxygen Demand After n Days (BODn)—Part 1: Dilution Method with Seeded Inoculum and Allylthiourea. Polish Committee for Standardization: Warsaw, Poland, 2019.
  22. PN-EN ISO 15705:2005; Water Quality—Determination of the Chemical Oxygen Demand Index (ST-COD)—Small-Scale Sealed-Tube Method. Polish Committee for Standardization: Warsaw, Poland, 2005.
  23. PN-EN 872:2007+Ap1:2007; Water Quality—Determination of Suspended Solids—Method by Filtration Through Glass Fibre Filters. Polish Committee for Standardization: Warsaw, Poland, 2007.
  24. PN-EN 12260: 2004 (A),(W),(NR); Water Quality—Determination of Total Nitrogen—Method by Oxidation with Peroxodisulfate. Polish Committee for Standardization: Warsaw, Poland, 2004.
  25. PN-EN ISO 11885:2009; Water Quality—Determination of Selected Elements by Inductively Coupled Plasma Optical Emission Spectrometry (ICP-OES). Polish Committee for Standardization: Warsaw, Poland, 2009.
  26. PN-EN ISO 10523:2012 (A); Water Quality—Determination of pH. Polish Committee for Standardization: Warsaw, Poland, 2012.
  27. PN-EN 15934:2013-02; Sludge, Treated Biowaste, Soil and Waste—Determination of Dry Matter Content by Drying at 105 °C. Polish Committee for Standardization: Warsaw, Poland, 2013.
  28. PN-EN 15935:2022-01; Soil, Waste, Treated Bio-Waste and Sewage Sludge—Determination of Losses on Ignition. Polish Committee for Standardization: Warsaw, Poland, 2022.
  29. PN-75/C-04576/15(W); Determination of Ammonium Nitrogen in Sewage Sludge—Distillation Method. Polish Committee for Standardization: Warsaw, Poland, 1975.
  30. PN-EN 13342:2002; Characterization of Sewage Sludge—Determination of Kjeldahl Nitrogen. Polish Committee for Standardization: Warsaw, Poland, 2002.
  31. PN-EN 16173:2012; Sludge, Treated Biowaste and Soil—Digestion of Nitric Acid Soluble Fractions. Polish Committee for Standardization: Warsaw, Poland, 2012.
  32. PN-EN 15933:2013-02; Sludge, Treated Biowaste and Soil—Determination of pH. Polish Committee for Standardization: Warsaw, Poland, 2013.
  33. PN-Z-19000-4:2001; Soil Quality—Assessment of Soil Sanitary Condition—Detection of Eggs of Intestinal Parasites Ascaris Lumbricoides and Trichuris Trichiura. Polish Committee for Standardization: Warsaw, Poland, 2001.
  34. PN-EN ISO 6579-1:2017-04/A1:2020-09; Microbiology of the Food Chain—Horizontal Method for the Detection, Enumeration and Serotyping of Salmonella—Part 1: Detection of Salmonella spp. Polish Committee for Standardization: Warsaw, Poland, 2020.
  35. Kim, W.-J.; Park, H.W.; Heldman, D.R. Clean-In-Place (CIP) wastewater management using nanofiltration (NF)-forward osmosis (FO)-direct contact membrane distillation (DCMD): Effects of draw salt Food Research International. Food Res. Int. 2024, 178, 113939. [Google Scholar] [CrossRef] [PubMed]
  36. Prasad, P.; Pagan, R.; Kauter, M.; Price, N. Eco-Efficiency for the Dairy Processing Industry. UNEP Working Group for Cleaner Production in the Food Industry, Victoria, Australia. 2004. Available online: https://espace.library.uq.edu.au/data/UQ_40900/Eco-efficiency_manual_201_Pagan.pdf?Expires=1738412586&Key-Pair-Id=APKAJKNBJ4MJBJNC6NLQ&Signature=cpDzKlQIdBNXAz08uJagO3kTLdDN8lIoN7t6o8Y1K9KkE-PvCZhbLRg1dg78bixFWu04jhsEmo~iV3xiShttUEuUkCRp8d-ViMgCt0AG-NDD7yeUGTjv4hG79pCfP08WBl2Tf5sbAZmq8jQbEsTpS761-~ET~sfyUVLkV9W9rgg1omvsNnx7amkPX3d2zE5N8pcpa6Dv0giT8QwETUBJSTf4GJJ4HEAch1ZVK7dKyJr3ul8hbfSfRmEImiRzSb0OxTUnUkAPfsa2Gq8hQzC6eeq3QAfvnobU92eTVjNCI3ZhPpNnk0DwaVaC16j0aifnyPPgE3lzekeE4qwubGyzaA__ (accessed on 2 December 2024).
  37. Prazeres, A.R.; Carvalho, F.; Rivas, J. Cheese whey management: A review. J. Environ. Manag. 2012, 110, 48–68. [Google Scholar] [CrossRef]
  38. Carvalho, F.; Prazeres, A.R.; Rivas, J. Cheese whey wastewater: Characterization and treatment. Sci. Total Environ. 2013, 445–446, 385–396. [Google Scholar] [CrossRef]
  39. Giner-Santonja, G.; Karlis, P. Developing EU environmental standards for the food, drink and milk industries: Key environmental issues and data collection. Environ. Sci. Eur. 2020, 32, 152. [Google Scholar] [CrossRef]
  40. Harper, W.J.; Blaisdell, J.L.; Grosshopf, J. Dairy Food Plant Wastes and Waste Treatment Practices; U.S. Environmental Protection Agency: Washington, DC, USA, 1971.
  41. Nazos, T.T.; Stratigakis, N.C.; Spantidaki, M.; Lagouvardou-Spantidaki, A.; Ghanotakis, D.F. Characterization of Cheese whey Effluents and Investigation of Their Potential to be used as a Nutrient Substrate for Chlorella Biomass Production. Waste Biomass Valoriz. 2023, 14, 3643–3655. [Google Scholar] [CrossRef]
  42. Zkeri, E.; Iliopoulou, A.; Katsara, A.; Korda, A.; Aloupi, M.; Gatidou, G.; Fountoulakis, M.S.; Stasinakis, A.S. Comparing the use of a two-stage MBBR system with a methanogenic MBBR coupled with a microalgae reactor for medium-strength dairy wastewater treatment. Bioresour. Technol. 2021, 323, 124629. [Google Scholar] [CrossRef] [PubMed]
  43. Ji, S.; Ma, W.; Wei, Q.; Zhang, W.; Jiang, F.; Chen, J. Integrated ABR and UASB system for dairy wastewater treatment: Engineering design and practice. Sci. Total Environ. 2020, 749, 142267. [Google Scholar] [CrossRef]
  44. Al-Tayawi, A.N.; Sisay, E.J.; Beszédes, S.; Kertész, S. Wastewater Treatment in the Dairy Industry from Classical Treatment to Promising Technologies: An Overview. Processes 2023, 11, 2133. [Google Scholar] [CrossRef]
  45. Finnegan, W.; Clifford, E.; Goggins, J.; O’Leary, N.; Dobson, A.; Rowan, N.; Xiao, L.; Miao, S.; Fitzhenry, K.; Leonard, P.; et al. Dairy Water: Striving for sustainability within the dairy processing industry in the Republic of Ireland. J. Dairy Res. 2018, 85, 366–374. [Google Scholar] [CrossRef] [PubMed]
  46. Arunadevi, P.S.; Saravanaraja, M. Two phase upflow anaerobic sludge blanket (UASB) reactor on the reduction of chemical oxygen demand in dairy effluent. Asian J. Adv. Agric. Res. 2020, 3, 15–23. [Google Scholar]
  47. Ribeiro, T.S.; Aguiar, A. Performance evaluation of a wastewater treatment plant from a dairy in the state of Minas Gerais, Brazil: A case study. Environ. Monit. Assess. 2024, 196, 956. [Google Scholar] [CrossRef] [PubMed]
  48. Janczukowicz, W.; Rodziewicz, J.; Czaplicka, K.; Kłodowska, I.; Mielcarek, A. The effect of volatile fatty acids (VFAs) on nutrient removal in SBR with biomass adapted to dairy wastewater. J. Environ. Sci. Health A 2013, 48, 809–816. [Google Scholar] [CrossRef]
  49. Skrydstrup, J.; Larsen, S.L.; Rygaard, M. Eco-efficiency of water and wastewater management in food production: A case study from a large dairy in Denmark. J. Ind. Ecol. 2020, 24, 1101–1112. [Google Scholar] [CrossRef]
  50. Martín-Rilo, S.; Coimbra, R.N.; Martín-Villacorta, J.; Otero, M. Treatment of dairy industry wastewater by oxygen injection: Performance and outlay parameters from the full scale implementation. J. Clean. Prod. 2015, 86, 15–23. [Google Scholar] [CrossRef]
  51. Available online: https://clearfox.com/dairy-industry-wastewater/ (accessed on 9 October 2024).
  52. Regulation (EU) 2020/741 of the European Parliament and of the Council on minimum requirements for water reuse. Off. J. Eur. Union 2020, L 177, 32–55.
  53. Tabelini, D.B.; Lima, J.P.P.; Borges, A.C.; Aguiar, A. A review on the characteristics and methods of dairy industry wastewater treatment in the state of Minas Gerais, Brazil. J. Water Process Eng. 2023, 53, 103779. [Google Scholar] [CrossRef]
  54. Metcalf & Eddy, Inc. Wastewater Engineering: Treatment and Resource Recovery, 5th ed.; McGraw Hill: New York, NY, USA, 2014. [Google Scholar]
  55. Shi, W.; Healy, M.G.; Ashekuzzaman, S.M.; Daly, K.; Leahy, J.J.; Fenton, O. Dairy processing sludge and co-products: A review of present and future re-use pathways in agriculture. J. Clean. Prod. 2021, 314, 128035. [Google Scholar] [CrossRef]
  56. Hu, Y.; Khomenko, O.; Shi, W.; Velasco-Sánchez, Á.; Ashekuzzaman, S.M.; Bennegadi-Laurent, N.; Daly, K.; Fenton, O.; Healy, M.G.; Leahy, J.J.; et al. Systematic review of dairy processing sludge and secondary STRUBIAS products used in agriculture. Front. Sustain. Food Syst. 2021, 5, 763020. [Google Scholar] [CrossRef]
  57. Usmani, Z.; Sharma, M.; Gaffey, J.; Sharma, M.; Dewhurst, R.J.; Moreau, B.; Newbold, J.; Clark, W.; Thakur, V.K.; Gupta, V.K. Valorization of dairy waste and by-products through microbial bioprocesses. Bioresour. Technol. 2022, 346, 126444. [Google Scholar] [CrossRef]
  58. Mohapatra, J.; Kumar, R.; Basak, B.; Ganesh Saratale, R.; Dattatraya Saratale, G.; Mishra, A.; Tripathy, S.K.; Jeon, B.-H.; Chakrabortty, S. A review on generation, composition, and valorization of dairy processing sludge: A circular economy-based sustainable approach. J. Ind. Eng. Chem. 2024, 143, 45–64. [Google Scholar] [CrossRef]
  59. CEC; European Commission. Council Directive 86/278/EEC of 12 June 1986 on the Protection of the Environment, and in Particular of the Soil, When Sewage Sludge is Used in Agriculture; CEC: Luxembourg, 1986. [Google Scholar]
  60. Boruszko, D.; Dąbrowski, W. Research on the Effectiveness of the Flotation Process and Properties of Flotation Sludge from Dairy Wastewater Pretreatment. Eng. Environ. Prot. 2014, 17, 269–280. (In Polish) [Google Scholar]
Figure 1. Unit water consumption in dairies depending on the quantity of milk processed. ‘*’ the volume of processed whey.
Applsci 15 01525 g001
Figure 2. The volume of wastewater per litre of processed milk depending on the production volume. ‘*’ the volume of processed whey.
Applsci 15 01525 g002
Figure 3. The volume of wastewater per litre of water used depends on the production volume. ‘*’ the volume of processed whey.
Applsci 15 01525 g003
Figure 4. The ratio of sludge produced to raw milk processing depending on the quantity of processed milk.
Applsci 15 01525 g004
Figure 5. The ratio of sludge produced to raw milk processing depending on wastewater flow.
Applsci 15 01525 g005
Figure 6. The amount of sludge produced per pollutant load removed depending on quantity of processed milk. ‘*’ the volume of processed whey.
Applsci 15 01525 g006
Figure 7. The amount of sludge produced per pollutant load removed depending on wastewater flow.
Applsci 15 01525 g007
Table 1. Water and wastewater management in dairy companies—volume of water consumed, water and wastewater management.
Plant NumberProduction ProfileQuantity of Processed Milk,
(Whey) * [L/d]
Volume of Water Used [m3/d]Is There a Closed Water Circuit in the Plant?Does the Facility Have a WWTP?Does the Treatment Plant Treat Industrial and Domestic Wastewater?
1no data2,800,000
(2,000,000) *
6500YesYesYes
2UHT products, milk powder, cottage cheese, butter, granular cheese, whey concentrate, cheese packaging1,400,0003171no dataYesYes
3milk processing, cottage cheese, cream, yoghurt, 1,140,800
(692,200) *
2750no dataYesNo
4no data1,100,000
(800,000) *
1650NoYesYes
5matured cheese, mozzarella cheese, cheese packaging, processed cheese, whey powder (WPC, lactose, permeate)1,000,000
(2,400,000)*
3000no dataYesYes
6no data1,000,000
(600,000) *
1875no dataYesYes
7cheeses, butter, whey powder930,0001637no dataNoNo
8no data756,9032334no dataYesYes
9matured cheese, cottage cheese, fermented drinks, butter, powder (milk + whey), whey concentrate752,150
(780,000) *
1648no dataYesYes
10cheese (cheddar, mozzarella and Dutch cheese)395,381
(355,000) *
690no dataNoNo
11dairy products, hard cheese, cottage cheese, whey powder and milk390,0001120no dataNoNo
12blue cheese252,690
(98,480) *
504no dataNoNo
13matured cheese210,000497YesNoNo
14no data180,000no datano dataYesYes
15cottage cheese, quark, fermented drinks, sweetcream, sour cream, milk powder139,500
(19,650) *
451.1no dataYesYes
16no data30,00060no dataYesYes
17cottage cheese, cheese, drinking milk (pasteurized), butter, yoghurts, buttermilk, cream21,000
(10,000) *
78no dataYesYes
18processed cheese, matured cheeseno data150no dataYesYes
‘*’ the volume of processed whey.
Table 2. Wastewater management in dairies—volume and quality of raw wastewater and technology and equipment for wastewater treatment.
Plant NumberQuantity of Processed Milk, (Whey) * [Ll/d]Daily Volume of Sewage [m3/d]Wastewater Treatment TechnologyWastewater Treatment and Sludge Processing EquipmentPollution Indicator [mg/L]
BODCODSuspended SolidsNtotPtotpHFats
12,800,000
(2,000,000) *
8710Aerobicscreening grit chamber, equalization tank, emergency tank, dissolved air floatation (DAF), multiphase activated sludge chamber, secondary sedimentation tank, wastewater and sludge pumping stations32755032110916852.56.7–9.3n.d./n.d.
21,400,0003393Aerobic and anaerobicscreenings, grit trap, dissolved air floatation (DAF), sludge thickener10082002426.661.044.97.2n.d.
31,140,800
(692,200) *
3930Aerobichorizontal grit chamber, pumping station, equalization tank, oxygen purification block, radial and horizontal sedimentation tank1200193267844.625.16.5–9.5250–400
41,100,000
(800,000) *
2250Aerobicpumping station, screenings, degreaser, biological chamber, aeration tank, secondary sedimentation tank750180018052.8137.270
51,000,000
(2,400,000) *
3500Aerobic and anaerobicscreenings, grit trap, dissolved air floatation (DAF), UASB bioreactor, hydrolyser, two oxygen reactors, secondary sedimentation tank, combined heat and power plant, biogas plant20004200580100258.375
61,000,000
(600 000) *
1533Aerobic and anaerobicequalization tank, dissolved air floatation (DAF), activated sludge chambers, secondary sedimentation tank107623115187215.57.1102
7930,000no datanot applicablenot applicable4651133185449822
8756,9032413Aerobic and anaerobicscreenings, grit trap, dissolved air floatation (DAF), MBBR, anoxic chamber, IFAS chamber, secondary sedimentation tank1341242675110628.58.956.33
9752,150
(780,000) *
1600Aerobicpumping stations, screenings, equalization tank, circulation trenches, MBR reactors, dissolved air floatation (DAF)1474264443711322.26.646.7
10395,381
(355,000)*
no datanot applicablenot applicablen.d.n.d.n.d.n.d.n.d.n.d.n.d.
11390,0001370Mechanical treatmentpump station, fine screens, buffer tank, dissolved air floatation (DAF)20003000800n.d.40n.d.n.d.
12256,200
(98,480) *
no datanot applicablenot applicable890176539016.2507.2563.5
13210,000247not applicablenot applicablen.d.n.d.n.d.n.d.n.d.n.d.n.d.
14180,0001040AerobicKessener brushes, aerators, jet pumps900144042484.616.45n.d.n.d.
15139,500
(19,650) *
661.8Aerobic screenings, horizontal grit chamber, aeration chamber, secondary sedimentation tankn.d.2,7367659820.17.95n.d.
1630,000140Aerobicactivated sludge chambers5208507565147.7n.d.
1721,000
(10,000) *
78Aerobicactivated sludge chambers2453379067015228871.6
18no data90Aerobic and anaerobicgravity grease separator, pumping station, equalization tank, dissolved air floatation (DAF), activated sludge chambersn.d.n.d.n.d.n.d.n.d.n.d.n.d.
‘*’ the volume of processed whey. N.d.—no data.
Table 3. Sewage sludge management.
No.Production ProfileQuantity of Processed Milk [L/d] Does the WWTP Treat Production and Domestic Wastewater?Daily Amount of Sewage [m3/d]Sewage Sludge Processing TechnologyAnnual Amount of Sludge [mg/year]Are the Sludge Used for Agriculture?
1Production of cottage cheese, cheese, drinking milk (pasteurized), butter, yoghurt, buttermilk, kefir, cream21,000YES78Aerobic40YES
2no data30,000YES140Aerobic15NO
3Production of cottage cheese, fermented drinks, creams, milk powder139,500YES661.8Aerobic1324YES
4no data180,000YES1040Aerobic237.6YES
5Production of dairy products, hard cheese, cottage cheese, whey and milk powder390,000NO1370no data1860 YES
6Production of matured cheese, cottage cheese, fermented drinks, butter, powders (milk + whey), whey concentrate752,150YES1600The thickened excess sludge is channelled to an external biogas plant together with the post-flotation sludge9843.58no data
7no data756,903YES2413Aerobic and anaerobic21,900YES
8Production of hard cheese, mozzarella cheese, cheese packaging, production of processed cheese, production of whey powders (WPC, lactose, permeate)1,000,000YES3500Aerobic and anaerobic7000no data
9no data1,000,000YES1533Aerobic3508YES
10no data1,100,000YES2250Aerobic600 YES
11Milk processing, production of cottage cheese, cream, yoghurt1,140,800YES3930Part of excess sewage sludge is channelled into agricultural biogas plants27,553 (dewatered) 779 DMYES
12Production of UHT products, milk powder, cottage cheese, butter, granulated cheese, whey concentrate, cheese packaging1,400,000YES3393Aerobic and anaerobic cogeneration, drying of secondary fermentation sludge with a belt dryer414 DMYES
13no data2,800,000YES8710Aerobic and anaerobic4181 (646 DM)YES
14Production of processed cheese and ripened cheeseno dataYES90Sludge screw press–sludge dewatering line200 no data
Table 4. Sewage sludge characteristic.
No.Quantity of Processed Milk [L/d]Does the WWTP Treat Production and Domestic Wastewater?Sewage Sludge Processing TechnologyPhysicochemical and Sanitary Indicators of Sludge
Live Egg Larvae
Ascaris sp., Trichuris sp., Toxocara sp. Salmonella bacteria in 100 g
Dry MatterOrganic CompoundsN-NH4TKNMgCaTPCrZnCdCuNiPbHgpH
[%][% DM][mg/kg DM]-
121,000YESAerobicNot detected9.5273.150.176.180.316.142.748.987230.27186.478.470.287.45
2139,500YESAerobicNot detected12.3772.81.938.290.314.212.7915.411380.77133.414.9715.930.087.57
3756,903YESAerobic and anaerobicNot detected16.6546.151.195.650.3810.58.1320.652980.8327.458.053.840.027.9
41,000,000YESAerobic and anaerobicNot detected10.8180.20.146.680.271.932.6310.395970.2515.965.0116.520.016.05
51,000,000YESAerobicNot detected12.176.71.005.20.361.131.0311.573140.0918.110.374.90.112.1
61,140,800NOPart of excess sludge is transferred to agricultural biogas plantsNot detected6.1470.330.236.360.564.524.366.587.30.258.193.512.50.017.4
71,400,000YESAerobic and anaerobicNot detected15.659.21.427.370.666.596.2320.72781.1837.516.72.490.048.1
82,800,000YESAerobic and anaerobicNot detected20.5340.150.63.860.6619.62.678.36143.50.38.4312.252.510.0210.0
9NO DATAYESSludge screw press–sludge dewatering lineNot detected23.65621.064.350.637.853.910.31450.54911.557.050.017.95
Disclaimer/Publisher’s Note: The statements, opinions and data contained in all publications are solely those of the individual author(s) and contributor(s) and not of MDPI and/or the editor(s). MDPI and/or the editor(s) disclaim responsibility for any injury to people or property resulting from any ideas, methods, instructions or products referred to in the content.