Abstract
Timeouts are a widely supported strategy in the literature, recognized for directly influencing team performance during basketball games. This study aimed to analyze and define the successful patterns of actions after timeouts (ATOs) during critical moments in the 2022/23 EuroLeague season. The sample was drawn from the last two minutes and overtime of 169 games with a final point difference of 10 points or fewer, totaling 365 ATOs. An observational methodology was used, applying the LINCE PLUS software version 2.1.0 and an ad hoc observational instrument. Descriptive analysis and chi-square tests (χ2) were conducted using SPSS 25.0, and T-pattern analysis was performed with Theme 6 software. Statistical significance was set at p < 0.05. Teams in the lead often concluded successful plays through free throws following opponent fouls, while teams trailing behind attempted to close the gap by committing fouls to force free throws in defense and scoring two-point baskets on offense. The findings offer insights into ATOs strategies that can support coaches and technical staff in training and adapting these actions to meet competition demands during critical game moments. These results may assist in enhancing team performance and decision-making under high-stakes conditions.
1. Introduction
In recent years, scientific literature has highlighted the importance of the coach in a team’s success through their multifactorial role [1]. Basketball is a non-deterministic sport with multiple technical-tactical solutions [2], making pre-game strategy crucial to the outcome [3]. Coaches can adjust tactics during the game to adapt to its dynamics [4]. In this way, coaches can indirectly influence team performance through interaction with players and directly impact the game itself by making decisions such as tactical adjustments, substitutions, or timeouts [5,6].
Unlike direct methods, player interaction can be provided continuously from the technical area but may be distorted by factors such as bench distance or ambient noise [4]. On the other hand, substitutions and timeouts are subject to regulation in their application, yet they remain some of the most effective ways to influence the team due to their direct effect on gameplay [7,8].
Due to their significant impact, the use of timeouts has been studied in various indoor sports, such as volleyball [5,8,9] or handball [4,7,10,11]. However, most scientific evidence is found in basketball, with publications addressing their effects [3,6,12,13,14,15], the physiological responses of players [16] and coaches [17], the mental rotation process players undergo after receiving instructions [18,19], coach experience and type of speech [20,21], and the phases of the timeout [22].
Coaches often call timeouts to break negative streaks, rest players, or adjust the game plan [3]. Given that timeouts are limited to 60 s and are considered a period of high psychological and physiological demand for coaches, especially those occurring in the final minutes of the game [17,22], it is logical to adopt certain strategies to maximize their effectiveness.
In this regard, recent research [22] divides timeouts into three phases: an initial phase for players to recover and the coach to identify key points; an intermediate phase for calmly addressing strengths and weaknesses with visual aids; and a final phase for players to summarize the coach’s instructions. During the timeout, it is essential that information is transmitted clearly, concisely, and simply [21]. For this purpose, visual aids should align with the coach’s perspective to reduce cognitive load and prevent misunderstandings [18,19].
Despite these measures, the scientific literature presents conflicting views on their impact on performance. Early research observed that using timeouts effectively interrupted an opponent’s scoring streak in both men’s and women’s basketball [23,24]. Similarly, more recent studies affirmed that offensive and defensive performance improved following a timeout [3], or that the team calling the timeout increased the number of points scored, with this effect lasting up to 10 possessions after [15]. However, recent studies employing complex mathematical models claim that timeouts have no effect on performance. This improvement can be attributed to the natural tendency of the game to return to its baseline state [12], suggesting that teams may not experience significant short-term performance improvements after a timeout compared to if one had not been called [13].
Research on timeouts during the final phases of a game is scarce. Studies have only been reported examining the effect of timeouts on offensive and defensive performance in basketball based on the game period (the first 35 min versus the last 5 min) [3]; the effects of timeouts on free-throw performance in NCAA close games [25]; or coaches’ heart rates during the execution of all timeouts, including those taken during the final minutes [17]. However, to the authors’ knowledge, no research has analyzed the effectiveness and offensive patterns in plays after timeouts during “crunch time”. Research on these phases of the game appears to be highly relevant, as in elite basketball, the final possessions often determine the final score [26], especially when the score difference is equal to or less than 10 points [27]. This context makes timeouts even more important during the last five minutes of the final quarter [3]. Similarly, the study of these actions through observational methodology will allow for the analysis of actions in their natural context [28]. In other studies on timeouts, only game-related statistics have been considered [15]. Conducting research using only the data obtained from the box score will have the limitation of not being able to observe play patterns that help to understand the complexity of the game [29].
Thus, the objectives of the research were: (1) to analyze the effectiveness of baskets after a timeout in relation to the research criteria, (2) to observe the relationship between the location of the game (home or away) and the team’s result (winning, losing, or tying) concerning technical-tactical and spatio-temporal aspects, (3) and to identify successful patterns after a timeout based on game location (home or away), team result (winning, losing, or tying), and possession remaining (24–17 s, 16–9 s, and 8–0 s) during the last two minutes and overtimes of close games in the 2022/23 Men’s EuroLeague.
2. Methods
2.1. Design
In order to meet the objective of the study we employed an observational methodology [30]. This methodology is acknowledged as a rigorous and validated scientific framework for the analysis of complex sports dynamics, such as those observed in basketball [31]. Numerous studies underscored this phenomenon [31,32,33,34,35]. Game analyses within observational methodology enable diachronic studies to uncover underlying structures in datasets collected over time through intrasessional tracking [36]. The methodology allowed us to analyze basketball in its usual context and with its customary dynamics [37]. The observational design [38] was nomothetic (we studied the offensive actions after timeouts of all participating teams), follow-up (we analyzed 169 men’s Euroleague 2022/23 games) and unidimensional (there was only one level of response).
2.2. Sample
The sample was composed of all the offensive technical-tactical actions obtained after timeouts from the last two minutes of the final quarters and overtime of men’s Euroleague 2022/23 (regular season, play-offs, and final four), whose difference in the final score was equal to or less than ten points (n = 365). This specific criterion was chosen to focus on critical moments of the game, where the outcome remains uncertain and the impact of timeouts and strategic decisions are most pronounced. A total of 169 matches were analyzed. Informed consent was not required from participants because the data were not generated by experimentation and the video material was obtained secondarily [39]. The study was approved by the Ethics Committee of the Faculty of Education and Sport Science (University of Vigo, Application 06-280722).
2.3. Instruments
The observational instrument (see Table 1 and Figure 1) was created ad hoc and consisted of 14 criteria and 71 categories drawn from previous research [26,37,40,41]. This instrument is a categories system that meets the conditions of exhaustiveness and mutual exclusivity. The 14 criteria and 71 categories were selected based on a comprehensive review of previous research [26,37,40,41]. The validity of the observational instrument was established through its coherence with the theoretical framework [42] and consultation with two experts in observational methodology and basketball, who assessed the instrument and reached an initial agreement level of 95%. After discussing and resolving discrepancies, a consensus was achieved, resulting in 100% agreement.

Table 1.
Observational instrument and descriptive analysis of the research.

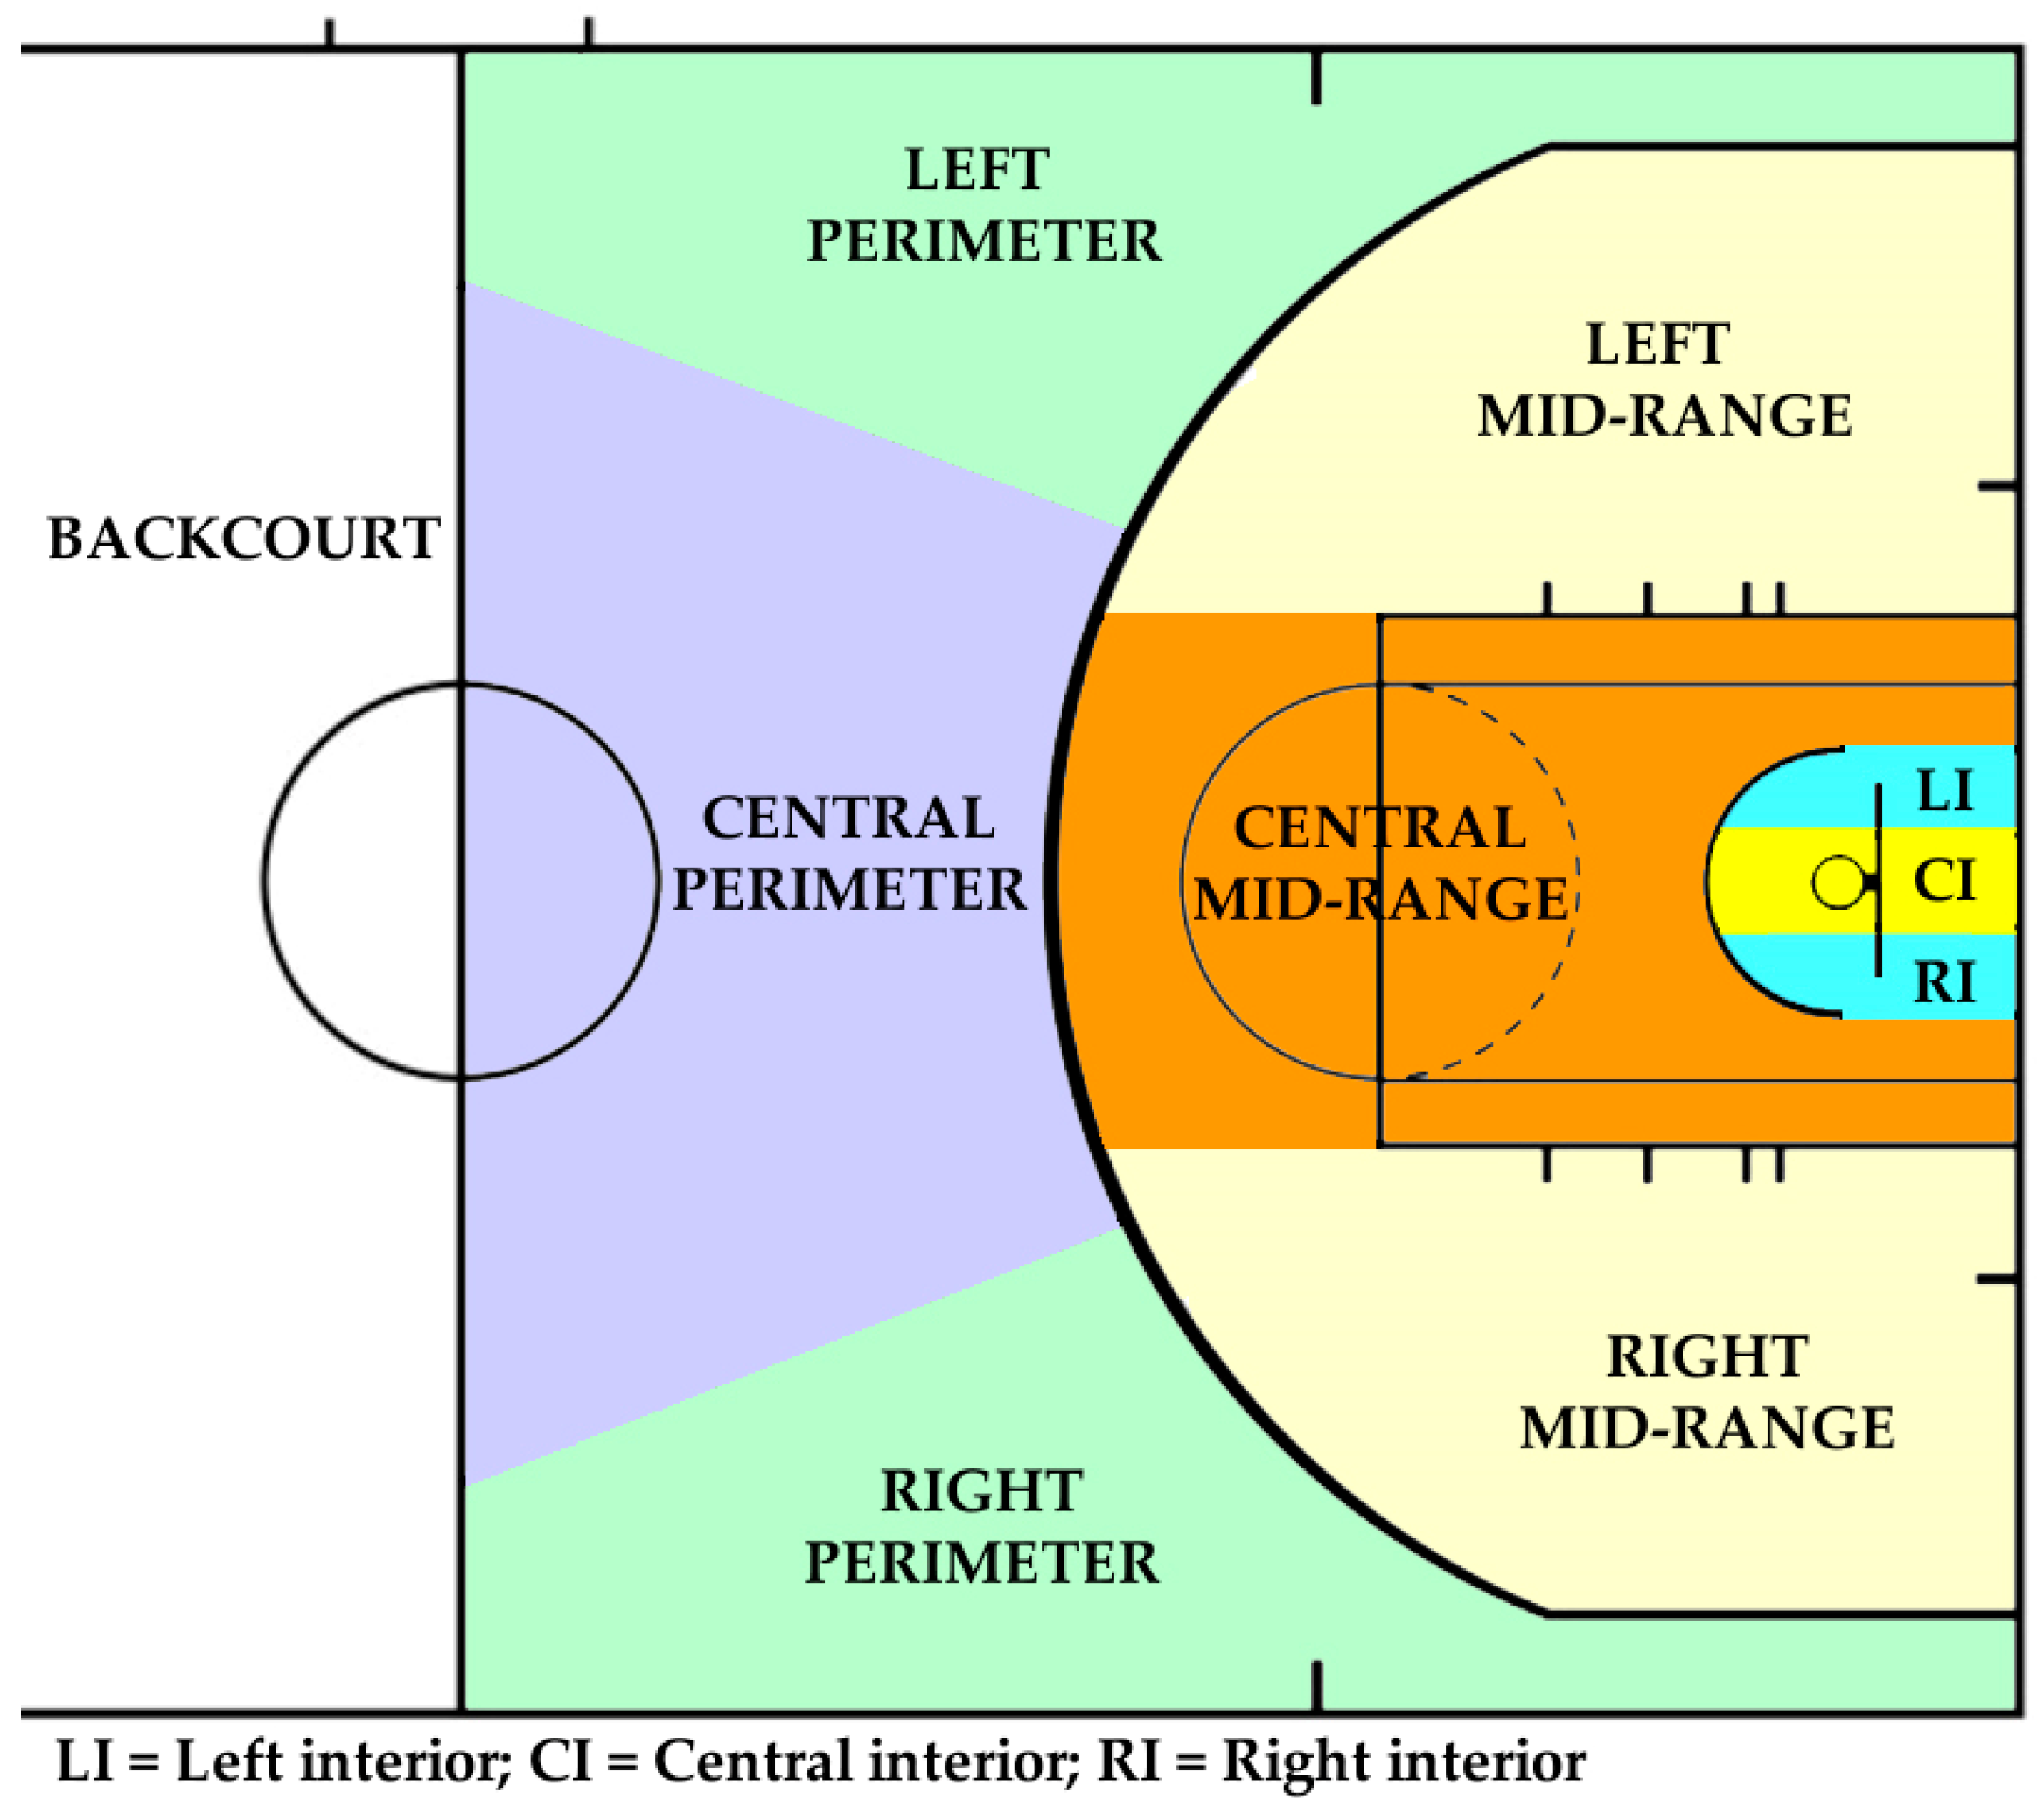
Figure 1.
Ending court zone.
For the purposes of data recording, the computer software LINCE PLUS version 2.1.0 was used [43].
2.4. Procedure
The videos analyzed in this study were downloaded from the website of the channel that held the television rights for the championship for that season (DAZN).
After compiling all the matches, the final two minutes of the last quarter and any overtime periods were extracted to create a single file, organizing the games chronologically. The editing and processing of this file were carried out using Filmora software, version 10.1.
Following comprehensive training in the use of analytical tools, two expert observers examined and documented the offensive technical-tactical actions. To maintain accuracy in data collection [44], intra- and inter-observer reliability was assessed using the kappa coefficient [45], computed with LINCE PLUS software. These reliability tests were conducted on a subset of actions not included in the final sample (n = 75, approximately 20% of the total). The intra-observer agreement yielded a kappa value of 0.93 for observer 1 and 0.92 for observer 2, while the inter-observer agreement was measured at 0.91. When discrepancies were detected, the observers reached a consensus to enhance the consistency of their evaluations. Once this validation process was completed, the final dataset was recorded through a consensus-based approach between both observers. This type of recording allowed us to optimize the observation.
The kappa values obtained are consistent with those reported in similar observational studies in team sports, where values above 0.80 are typically regarded as excellent [46]. For instance, prior research in basketball analysis has reported kappa values ranging from 0.80 to 0.93, depending on the complexity of the observational instrument and the expertise of the observers [47,48]. These high values reflect the reliability of the data collection process and the robustness of the instrument. Furthermore, the agreement rates achieved can be attributed to the extensive training provided to the observers, who were experienced in technical-tactical analysis and thoroughly familiarized with the LINCE PLUS software and the instrument’s categories. Observer expertise plays a critical role in minimizing variability and ensuring data quality. Additionally, the use of a consensus process to resolve discrepancies further strengthened the reliability of the observations.
Once all actions were recorded, an Excel file was generated containing the sequence of behaviors. The flexibility of this file enabled various modifications to be applied, facilitating the different analyses conducted throughout the study, as demonstrated in previous research [49].
2.5. Data Analysis
All descriptive statistical analyses were performed using the Statistical Package for the Social Sciences (SPSS) version 25.0 (IBM-SPSS Inc., Chicago, IL, USA). A significance level of p < 0.05 was established. A descriptive examination of each variable was conducted, presenting results in terms of frequencies and percentages. To assess differences among the categories within each criterion, a χ2 goodness-of-fit test was applied.
Furthermore, a χ2 test of independence was utilized to determine significant associations between the study criteria and the variables “basket,” “game location,” and “team result.”
To identify offensive play patterns following timeouts, Theme 6 Edu software [50] was employed. This specialized tool is widely recognized in disciplines such as psychology, ethology, and sports analysis for its ability to detect temporal patterns in sequential data. Theme is particularly effective in uncovering T-patterns—recurrent sequences that may not be immediately evident—by analyzing large datasets and identifying patterns that do not follow rigid sequences. This capability makes it an essential tool for examining dynamic and complex behaviors in basketball [31].
In this study, Theme 6 was used to extract the most relevant offensive success patterns based on the team’s status at the time of possession, the game location, and the timing of the play. The analysis adhered to the following parameters: (a) the presence of a minimum of four T-patterns within the observed sequence set; (b) a 90% reduction in redundancy for recurring T-pattern instances; and (c) a significance threshold of 0.005.
3. Results
3.1. Descriptive Analysis
Table 1 shows a descriptive analysis of all the study variables as well as the results of the χ2 test to contrast the differences existing between the categories of each criterion (χ2 goodness-of-fit test). In particular, there were statistically significant differences in all criteria except the in-game location and basket.
The study data showed that just over half of the timeouts were requested by the home team (53.4%), primarily in the last 30 s of the game (50.4%). Most of these requests came from teams that were losing at that moment (60.8%) and had a score difference of between 0 and 3 points (53.7%).
Regarding the actions following the timeout, it was observed that 60% of the plays resumed in the frontcourt, against an individual defense (97.3%), with no passes made during the play (47.1%) and in the last 8 s of the possession (58.9%). In terms of technical-tactical elements, no type of screen was used in 46% of the cases, and the play ended with a foul in 23.3% of the cases, resulting in two free throws (18.4%). The finishing zone showed a higher concentration in the outer areas (16.4% on the right perimeter, 17.5% in the central perimeter, and 15.1% on the left perimeter), with the point guard being the player responsible for finishing the play in 57.5% of the cases. Finally, 53.4% of the plays did not result in a basket, while in the remaining 46.6%, at least one point was scored.
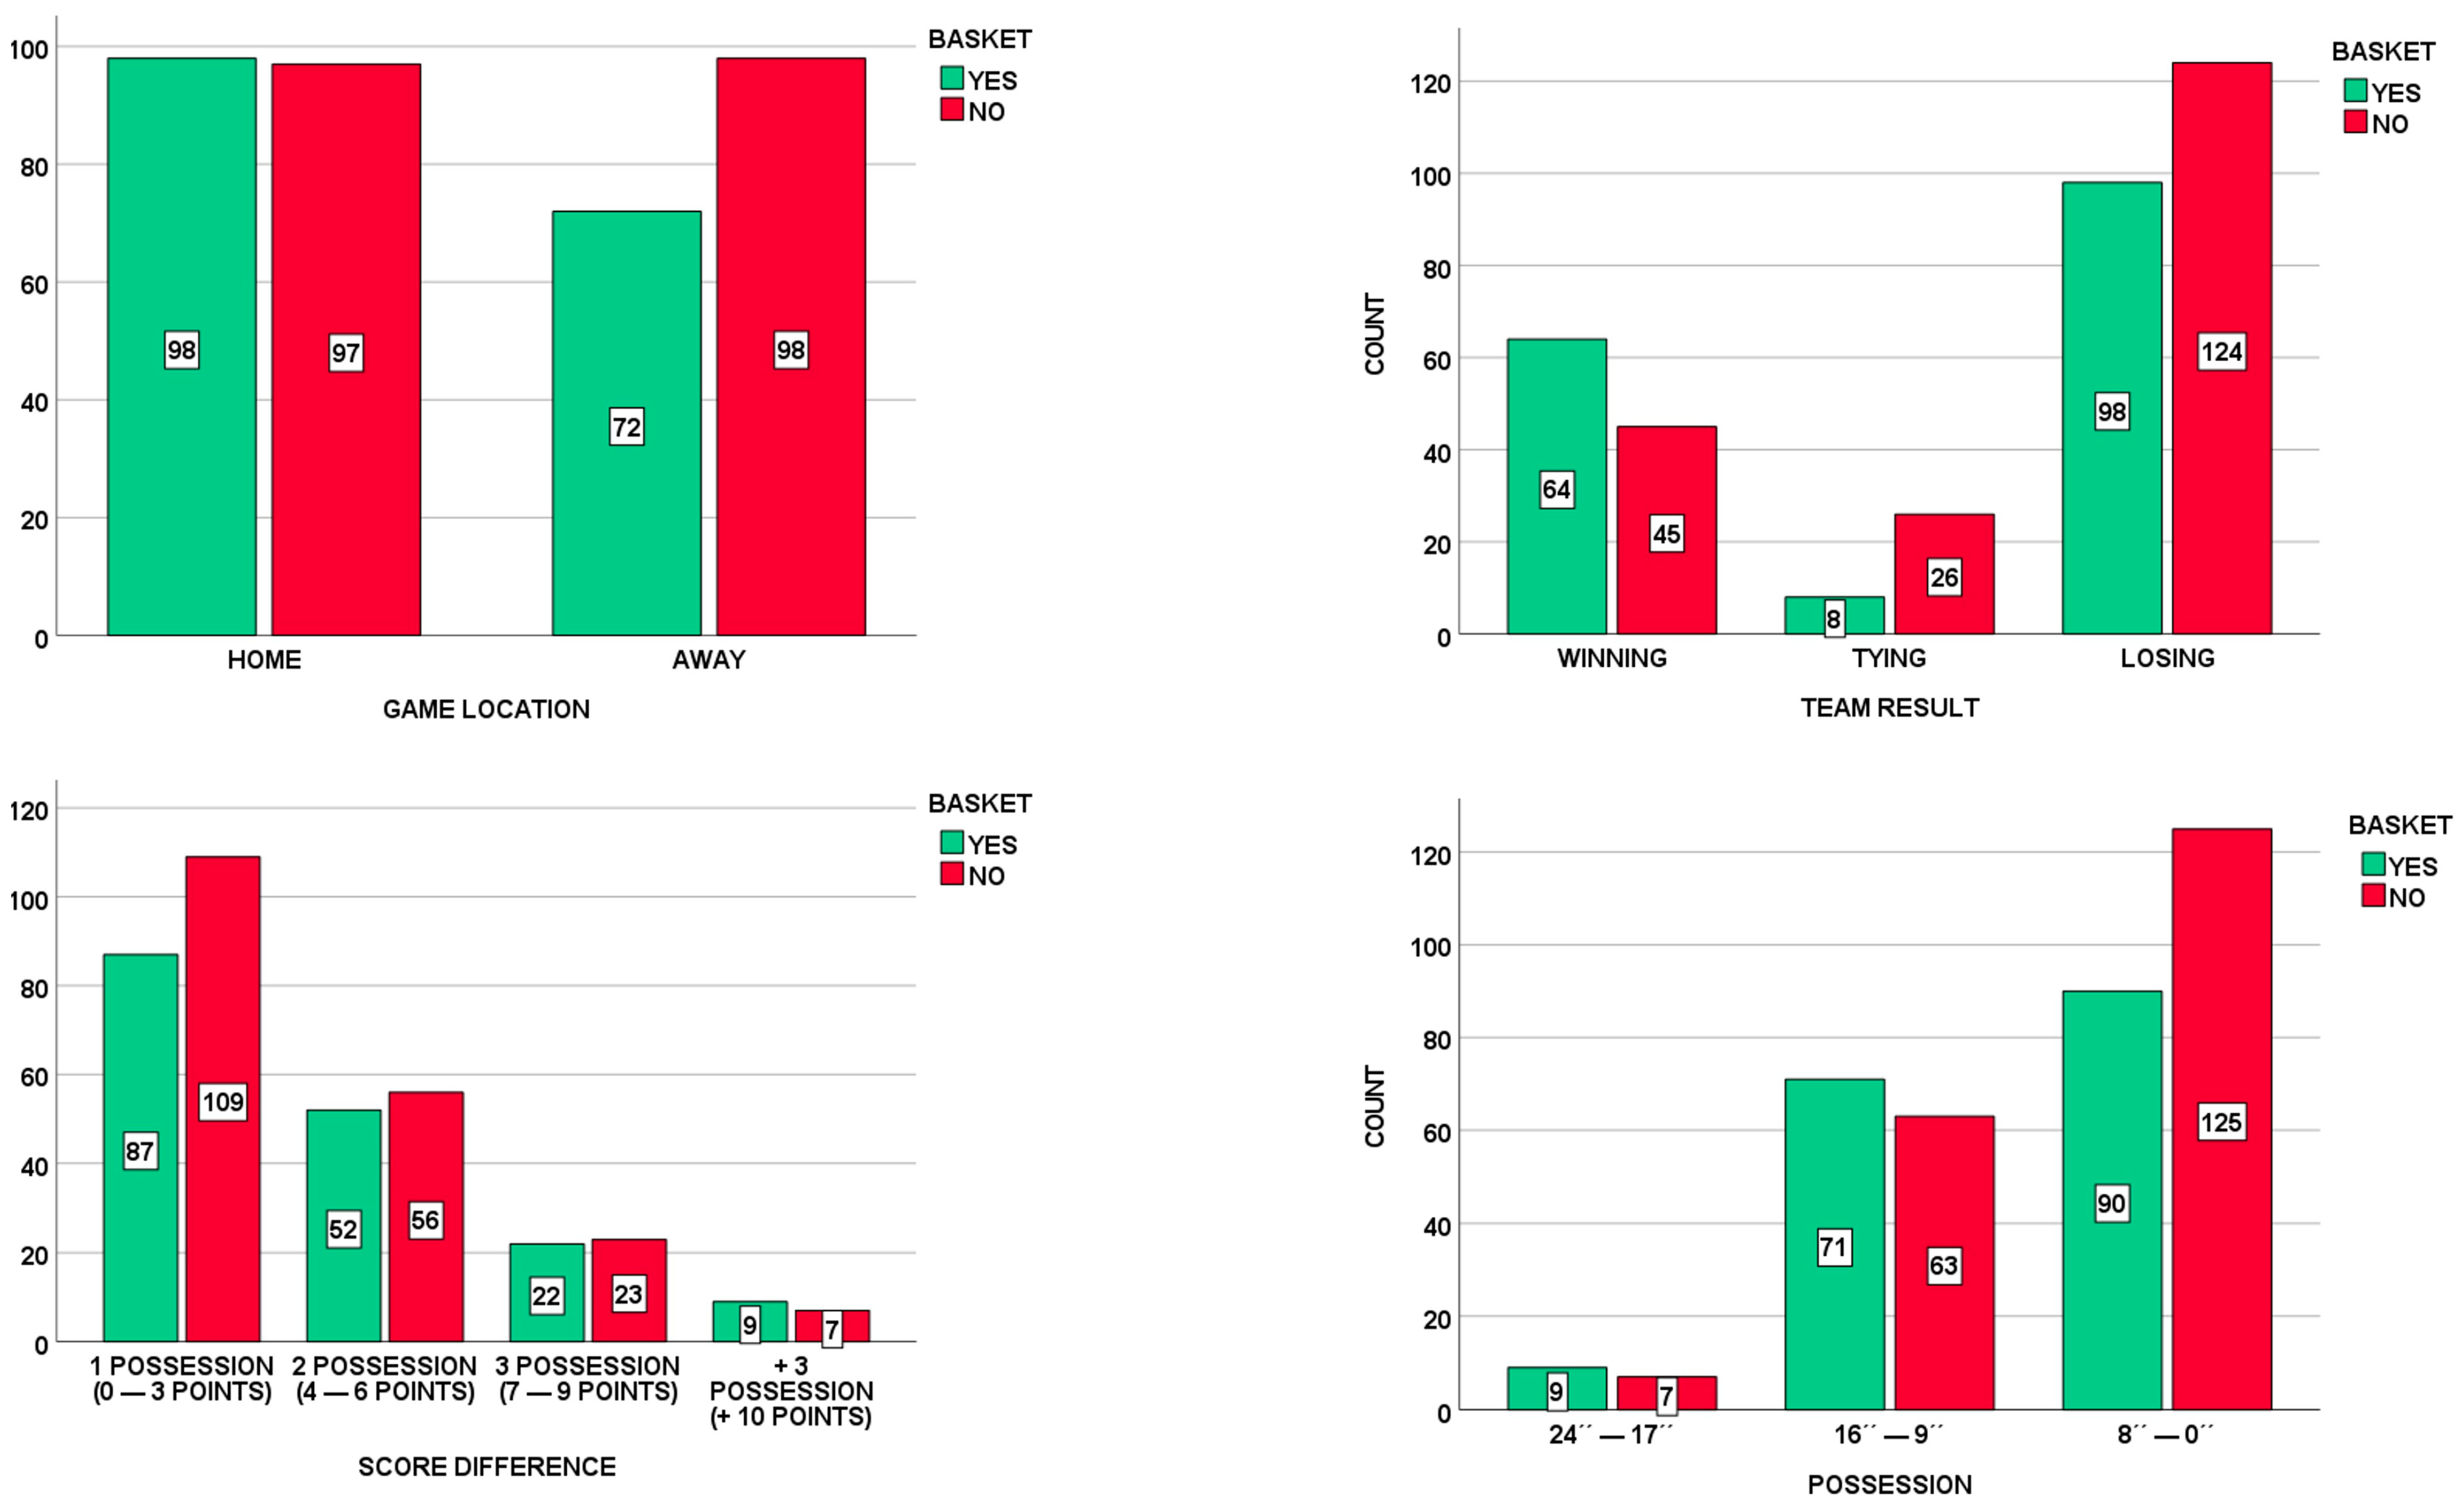
In the analysis of scoring effectiveness following timeouts (Figure 2), home teams showed higher effectiveness compared to the away teams (50.3% vs. 42.4%), although the differences were not statistically significant (χ2 = 2.280; p = 0.131), indicating that game location does not have a strong influence on shooting accuracy in this context. On the other hand, teams that were winning had a 58.7% shooting accuracy after the timeout, compared to 44.1% for teams that were losing and 23.5% for those tied. This difference was statistically significant (χ2 = 14.241; p < 0.001), suggesting that teams in the lead may experience a psychological or tactical advantage that enhances their shooting effectiveness after timeouts. It was also observed that as the point difference increased, the likelihood of scoring also increased, going from 44.4% accuracy with a one-possession lead (0–3 points) to 56.3% when the lead was greater than three possessions (+10 points), although this trend was not statistically significant (χ2 = 1.183; p = 0.757). This indicates that the point difference does not have a consistent impact on scoring effectiveness. Furthermore, the shooting percentage decreased as the possession time ran out, from 56.3% in the first 8 s to 41.9% in the last 8 s. While this trend suggests that shooting becomes less effective as time runs out, the result was not statistically significant (χ2 = 4.735; p = 0.094), likely due to the limited sample size in some categories.
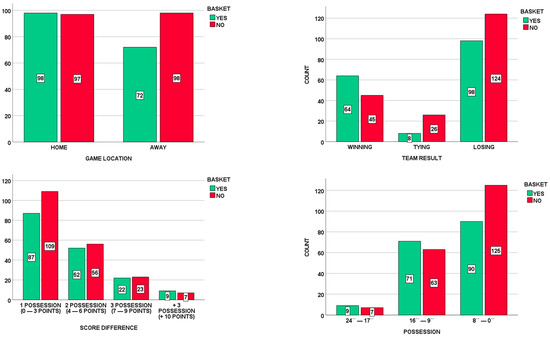
Figure 2.
Relationship between the “Basket” criteria and “Game Location”, “Team Result”, “Score Difference” and “Possession” criteria.
Considering the location of the game (Figure 3), it was observed that in 61.5% of the cases where a team was winning, the team was the home team (χ2 = 6.221; p = 0.045). This statistically significant result underscores the potential influence of playing at home on maintaining a lead during critical moments of the game. Similarly, 58.9% of the inbound passes from the backcourt were made by home teams (χ2 = 2.936; p = 0.087), reflecting a non-significant trend that could suggest a slight home advantage in possession control. Finally, 53.6% of the plays without screens also corresponded to home teams, indicating a small predominance of this pattern for home teams.
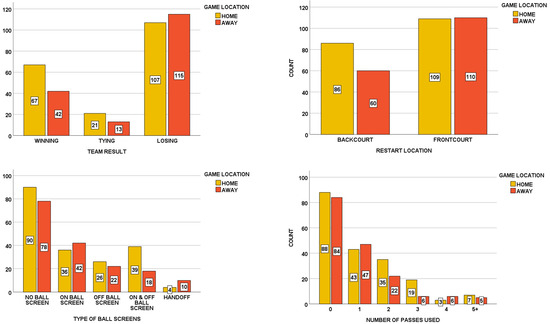
Figure 3.
Relationship between the “Game Location” criteria and “Team Result”, “Restart Location”, “Type of Ball Screens” and “Number of Passes Used” criteria.
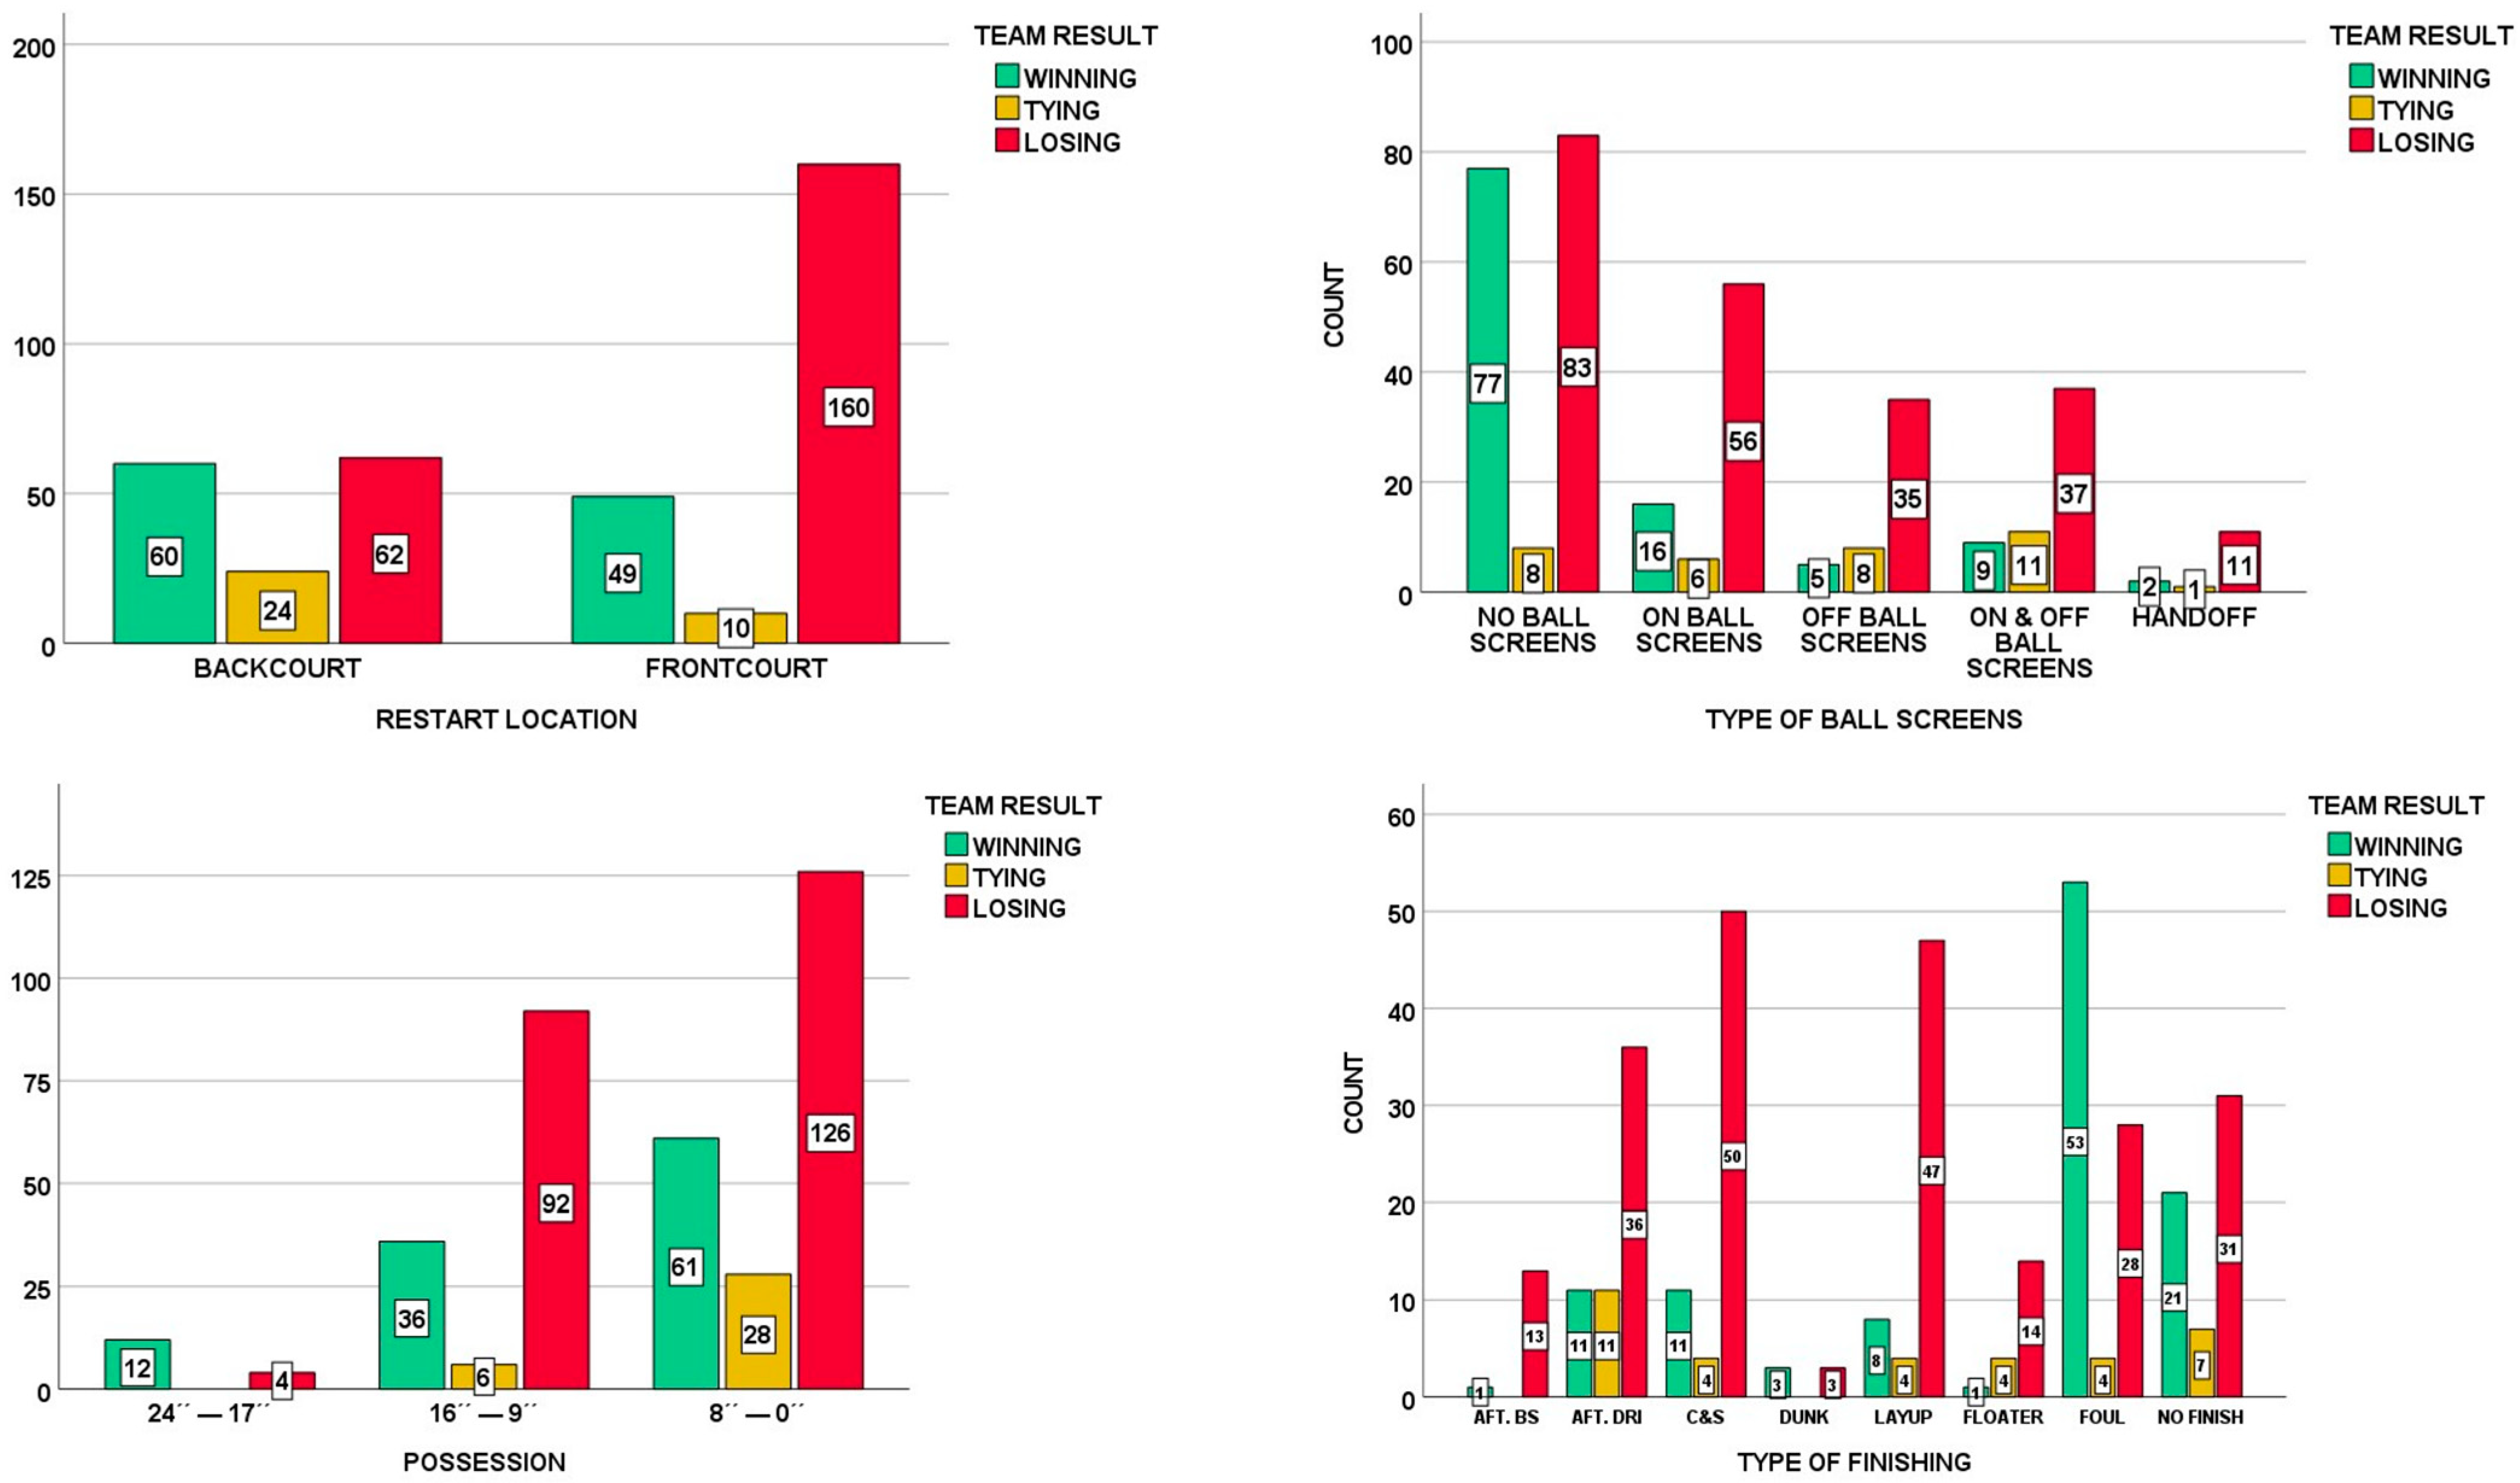
Regarding the team result (Figure 4), it was found that 72.1% of the inbound passes by teams that were losing were made from the frontcourt (χ2 = 37.017; p < 0.001), indicating a strategic effort to create quick scoring opportunities and reduce time spent advancing the ball. As for the use of screens, teams that were winning did not use screens in 70.6% of the cases, while teams that were losing used on-ball screens (25.2%), off-ball screens (15.8%), and combinations of both (16.7%) (χ2 = 47.723; p < 0.001). This suggests that losing teams adopt more complex strategies to generate offensive opportunities. Finally, regarding the types of finishing, winning teams were fouled in 48.6% of the cases, highlighting their ability to draw contact and gain free-throw opportunities, while the teams that were trailing finished their plays with catch-and-shoot actions (22.5%) or layups (21.1%) (χ2 = 83.660; p < 0.001). These results emphasize the distinct tactical approaches employed by teams based on their game situation, reflecting their efforts to optimize scoring under varying conditions.
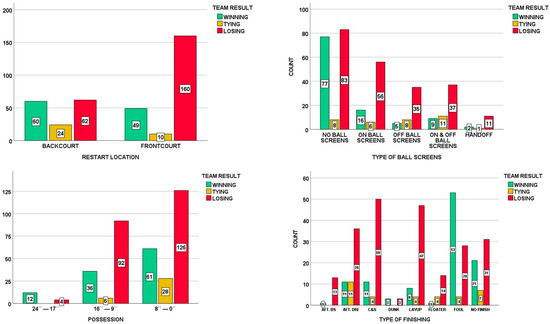
Figure 4.
Relationship between the “Team Result” criteria and “Restart Location”, “Type of Ball Screens”, “Possession” and “Type of Finishing” criteria. Note: AFT.BS: After Ball Screen; AFT.DRI: After Dribbling; C&S: Catch & Shoot.
3.2. Analysis of Successful Patterns on Offense
Table 2 presents a T-Patterns analysis of the 170 successful actions recorded. Regarding game location (home—98 actions or away—72 actions), a higher number of successful actions was observed for home teams (57.6%) compared to visiting teams (42.4%).
Table 2.
T-Pattern analysis of the 170 successful plays observed.
Concerning the team’s result at the start of the play (winning, losing, or tying), home teams that began losing achieved the highest proportion of successful actions (51%), followed by those that started while winning (42.9%) and those that were tying (6.1%). Conversely, among away teams, those that began the play while losing completed a greater number of successful actions (66.7%) compared to those that were winning (30.6%) or tied (2.7%).
Finally, regarding the phase of possession, regardless of the game location or team result, most successful actions occurred during the final phase of possession (8′′–0′′).
The most representative patterns of play are presented below stratified according to game location, team result, and possession.
4. Discussion
The objective of this research was to analyze the development and patterns of plays after timeouts (ATO’s) in the last two minutes and overtime periods of games with final scores equal to or within 10 points in the 2022/23 EuroLeague. This study is pioneering in examining the development of plays following timeouts during critical moments of the game.
The results reveal, first and foremost, that home teams request a greater number of timeouts and have a higher scoring success rate on the subsequent play compared to visiting teams. This may relate to the ‘home advantage phenomenon’ [51], where teams benefit from playing at home. This advantage, widely documented in the literature [52], may be due to the more assertive attitude of home teams, fostered by the arena environment, which drives them to seek more contact and force the visiting team to take worse shots due to defensive pressure [53]. This phenomenon is especially prominent in the Balkans, in indoor sports involving physical contact, and in men’s teams [52]. The probability of winning at home ranges from 52% in countries like Estonia to 70% in Bosnia-Herzegovina or Croatia [54]. However, it is estimated that approximately two-thirds of this advantage accumulate during the first quarter, gradually diminishing as the game progresses [55]. In high-stress situations, such as the final minutes and overtime, this effect diminishes, as visiting teams tend to adapt to the arena environment [56,57]. Our data support this, showing no significant differences in scoring or location, consistent with findings [15] that timeout effects are similar for home and away teams.
When analyzing the timing of timeouts during ‘crunch time’, it becomes evident that the highest number occurs as the game nears its end, especially in the last 30 s and with a one-possession margin. This pattern highlights the strategic importance of timeouts in these moments, as they allow coaches to design specific plays, disrupt the opponent’s momentum, and manage player fatigue and psychological pressure. In elite basketball, such as the NBA, games are often decided in the final minute since a single possession can influence the final outcome [58]. This aligns with a study [3] showing 64.9% of timeouts occur in the last five minutes, especially with a score difference of −2 to 3 points (one possession). In the final minute, timeouts become increasingly critical due to the heightened stochasticity and complexity inherent in late-game scenarios [59]. Another factor that could be associated with this is the significant physical fatigue that might accumulate during the final quarter of the game [60]. Additionally, the psychological pressure players could experience in these critical phases [56] might contribute to a decline in performance [61]. Coaches might choose to use timeouts to give players recovery opportunities and to execute plays under more optimal physical and mental conditions.
Through examining the team’s status when requesting a timeout, our analysis revealed that in 60.8% of the cases, the team was losing, which seems consistent, as one of the main reasons for requesting a timeout is to try to reverse a negative trend [3]. After the timeout, teams that were losing scored 44.1% of the time, compared to a 58.7% success rate for teams that were winning. These data are consistent with the findings of another study [3], where it was shown that the offensive performance of losing teams remained similar before and after the timeout, while teams that were winning exhibited an improvement in performance. This difference could be attributed to the psychological advantage held by winning teams, who may approach timeouts with greater confidence and focus, allowing them to execute plays more effectively. Additionally, teams in the lead often play with less urgency and are better positioned to control the game tempo, reducing the likelihood of rushed or pressured decisions [62]. Similarly, other researchers [56] reported that teams in the lead showed higher shooting accuracy during the last five minutes of the game, suggesting that these teams are less affected by pressure in the offensive phase during the final minutes. The combination of tactical adjustments and psychological resilience may contribute to the superior performance of leading teams during crunch time. Another factor could be attributed to the natural tendency of the game to return to its baseline state [12], where teams that are leading might maintain their scoring momentum following a timeout.
As for the defensive strategies following timeouts, it was observed that in almost all instances, the opposing team opted for man-to-man defense. These findings are consistent with the results of another study [63], which also found that man-to-man defense was the most frequent, both for home and away teams. This preference may be explained by the tactical advantages of man-to-man defense in high-pressure situations, such as those following timeouts during the final minutes of close games. Man-to-man defense allows for greater control over individual matchups, making it easier to neutralize key offensive players and disrupt set plays designed during the timeout. The greater the defensive pressure, the higher the difficulty in scoring [64], assuming that high defensive pressure can only be achieved through man-to-man defense. Additionally, this strategy facilitates quick switches and adjustments, which are critical during unpredictable, high-stakes moments. The situational urgency of ’crunch time’ may also discourage the use of zone defenses, which could be more susceptible to breakdowns against well-organized offensive plays. However, other authors [6] identified a higher use of zone defense in the phases before and after the timeout. Nonetheless, their study highlighted the tendency of the requesting teams to switch from zone defense to man-to-man defense after the timeout, which could indicate a strategy to adapt to higher-pressure situations or better game control.
When examining passing patterns during possession, the data indicate that a lower number of passes correlates with a higher shooting success rate, with the best results obtained in plays involving between 0 and 2 passes. This could be attributed to the urgency and time constraints typically present during the final minutes of close games, which may discourage prolonged ball movement. The heightened psychological pressure during crunch time may prompt players to prioritize straightforward scoring opportunities over more complex passing sequences. This finding was reflected in a study that observed how the most effective actions during critical moments of EuroBasket games were those involving simple plays, such as the 1-on-1 plays [48]. Additionally, plays with fewer passes allow teams to quickly exploit defensive mismatches or capitalize on previously planned set plays, reducing the risk of turnovers. These findings align with those of one of the studies consulted [40], where it was observed that in the last five minutes of the game, plays with zero to two passes predominated, highlighting how the absence of passes in this phase of the game increases shooting effectiveness during possessions. Additionally, previous studies have noted an average of two passes in fast-break situations [65], 3.7 passes in offensive systems, and 1.45 passes in transitions [66], or 2.95 passes in the EuroLeague and 2.71 in the NBA [67]. Furthermore, it appears that teams with a lead tend to employ a greater number of passes [68,69], which could be related to a focus on maximizing possession time to reduce the opposing team’s opportunities [26,62].
In addition, it was observed that in almost half of the analyzed plays, no type of screen was used, which aligns with the results of other researchers [40], who found that in the last five minutes of the game, screens were used in 44% of the cases. This limited use of screens in late-game situations may be attributed to the urgency of the moment, where teams prioritize faster, less complex plays to minimize the risk of turnovers or miscommunications. On the other hand, the absence of screens can be attributed to the high number of actions that result in a quick foul by the teams trailing on the scoreboard. When screens were employed, the on-ball screen was the most frequent (21.4%). The use of the pick-and-roll in the final minutes appears to be an effective element in these phases of the game [49]. These results are consistent with studies addressing similar contexts in terms of time and score; for example, a 29.1% use of on-ball screens was observed in the last two minutes of NBA games [26] and 15.92% in the EuroLeague during the same period [62].
Observing successful patterns, we noticed that teams in the lead, regardless of location or the phase of possession, most frequently scored through free throws resulting from fouls. Fouls were the most common type of play-ending event, accounting for 23.3%. Within the context of this research—analyzing the final two minutes of games with a final score margin of less than 10 points—and considering that teams trailing in the score accounted for 60.8% of the sample, it seems reasonable to hypothesize that these teams resort to fouling their opponents to stop the game clock and challenge the leading team to score through free throws [25]. However, this “comeback” strategy of fouling may not be the most effective, as the probability of overcoming the deficit and winning increases if the trailing team allows their opponent’s attack to proceed without committing a foul [26]
On the other hand, it was observed that teams trailing in the score, regardless of location or possession phase, most commonly scored through a two-point basket, usually a layup, predominantly executed by a point guard. Other studies [70] highlight that the most efficient way to end possession in the EuroLeague is by scoring a two-point basket. Additionally, some patterns emerged where plays concluded with a three-point shot, consistent with other studies showing that teams trailing on the scoreboard tend to attempt faster scoring opportunities with fewer passes. This strategy aims to minimize the actions required to reduce the scoring gap [71].
4.1. Practical Applications
The knowledge of this data can be highly useful for coaches and technical staff of high-performance basketball teams, helping them adapt training to the competitive demands in these specific situations. According to the results, the preparation of these plays should differ depending on whether the team is winning or losing. On one hand, the team in the lead should prioritize training situations where the ball is in the possession of players with high free throw accuracy, as it is likely that the opposing team will attempt to commit a foul during the play after the timeout. On the other hand, teams that are trailing should focus on plays that result in two-point shots, executed by technically proficient players, such as point guards, and with the shortest possible possession time. Similarly, in both cases, these actions should be practiced in environments that replicate the high physical and psychological demands of real competition conditions. This is supported by the observation that more than half of the timeouts during critical moments occur in the final 30 s of the game. Given the nature of these plays, which always follow a timeout, both the coach’s instructions and the actions to be performed during the play can be trained in a more analytical way. This contrasts with other actions that occur during the game, which are more influenced by the flow of the match.
4.2. Limitations of the Research and Future Perspectives
The results of this study should be interpreted with caution, as the sample was limited to games with a final score difference of 10 points or less during a full season of the EuroLeague. This criterion ensured an emphasis on critical game moments, where the outcome remains uncertain, and the impact of timeouts and strategic decisions is most pronounced. However, this narrow focus might have excluded significant patterns observed in games with larger score differences, where tactical and psychological dynamics could differ
Additionally, the exclusive focus on a single season of the EuroLeague games represents a limitation in terms of generalizability. Although the EuroLeague is highly competitive and globally recognized, its playing style, strategies, and cultural context may not reflect other leagues. For instance, leagues such as the NBA or national leagues in Europe might exhibit different tactical tendencies, pacing, or defensive strategies compared to the EuroLeague, which could influence the applicability of the findings. Moreover, cultural and stylistic differences in basketball, including the philosophies of coaches or the emphasis on specific offensive or defensive systems, might lead to variations in how after-timeout plays (ATOs) are executed and their overall effectiveness.
Furthermore, as this study represents a relatively novel area of research, there is a scarcity of direct studies for comparison, often requiring reference to broader analyses that examine entire games rather than close-score moments. The exclusive focus on the men’s EuroLeague further limits the generalizability of the findings to other levels of competition, such as youth or amateur leagues, and to women’s basketball
Future studies could address these limitations by incorporating games with broader score margins, analyzing a wider range of competitions, and evaluating short-duration tournaments on neutral courts, such as international selection tournaments or cup championships. Such approaches could expand the understanding of after-timeout plays in diverse contexts.
While the current study focused on descriptive statistics, chi-square tests, and T-Pattern analysis to identify patterns of behavior after timeouts (ATOs), future research could benefit from integrating regression models to determine which variables have the strongest impact on successful outcomes. For instance, logistic regression could be used to assess the probability of scoring based on factors such as the type of screen employed or the phase of possession. Additionally, comparative analyses between winning and losing teams could extend beyond descriptive statistics. Techniques such as MANOVA or ANOVA could provide a more nuanced exploration of how combinations of variables, including game location, possession time, and type of finish, differ between these groups. These advanced approaches would yield deeper insights into the tactical and psychological dynamics of critical game moments.
Moreover, future research could explore the psychological impact of timeouts on players and coaches across different competitive contexts. Investigating how timeouts affect motivation, concentration, and emotional states could provide valuable insights into their effectiveness. Additionally, analyzing gender differences in timeout strategies and effectiveness, particularly in women’s basketball leagues, would be beneficial. Understanding whether variations exist in the utilization and outcomes of timeouts between male and female teams could inform tailored coaching strategies. Furthermore, examining the role of timeout strategies in youth basketball or lower-tier leagues could shed light on their effectiveness in developmental contexts, potentially guiding coaching practices at these levels.
5. Conclusions
In critical moments during EuroLeague games, most timeouts occur with less than 30 s remaining in the game, predominantly called by the losing teams, and primarily when the score difference is within one possession (0–3 points). Teams that are winning seem to have a higher success rate in the action immediately following the timeout compared to those that are losing, and the game’s location does not appear to influence this advantage.
Winning teams typically finish the play by scoring at least one point from the free-throw line after a foul is committed by the opposing team, which is attempting to mount a comeback using this strategy. Losing teams tend to score two-point plays but attempt and miss more catch-and-shoot three-pointers than the winning teams.
Author Contributions
Conceptualization, I.P.-L., C.V.-E., A.J.S.-P., X.R.-L.-d.-l.-O. and A.G.-S.; methodology, I.P.-L., C.V.-E., X.R.-L.-d.-l.-O. and A.G.-S.; software, I.P.-L., A.J.S.-P. and A.G.-S.; validation, J.C.A.-G., A.J.S.-P. and X.R.-L.-d.-l.-O.; formal analysis, I.P.-L. and A.G.-S.; investigation, I.P.-L., J.C.A.-G., C.V.-E., A.J.S.-P., X.R.-L.-d.-l.-O. and A.G.-S.; resources, I.P.-L., C.V.-E., J.C.A.-G., A.J.S.-P. and X.R.-L.-d.-l.-O.; data curation, I.P.-L., C.V.-E., J.C.A.-G. and A.G.-S.; writing—original draft, I.P.-L., A.J.S.-P., C.V.-E. and A.G.-S.; writing—review and editing, I.P.-L., C.V.-E., X.R.-L.-d.-l.-O. and A.G.-S.; visualization, C.V.-E., J.C.A.-G. and A.J.S.-P.; supervision, I.P.-L., C.V.-E. and A.G.-S.; project administration, I.P.-L., J.C.A.-G., X.R.-L.-d.-l.-O. and A.G.-S.; funding acquisition, C.V.-E., I.P.-L. and A.G.-S. All authors have read and agreed to the published version of the manuscript.
Funding
This study was funded by the Ministerio de Cultura y Deporte (https://www.culturaydeporte.gob.es/portada.html (accessed on 20 June 2024)), Consejo Superior de Deportes (https://www.csd.gob.es/es (accessed on 20 June 2024)) and European Union (https://european-union.europa.eu/index_es (accessed on 20 June 2024)) under Project “Integración entre datos observacionales y datos provenientes de sensores externos: Evolución del software LINCE PLUS y desarrollo de la aplicación móvil para la optimización del deporte y la actividad física beneficiosa para la salud (2023)” EXP_74847 to A.G.-S. and I.P.-L. This research was funded by the Universidade de Vigo through a predoctoral fellowship awarded to C.V.-E. (Axudas Predoutorais para a formación de Doutoras/es 2022, Universidade de Vigo. P.P. 00VI 131H 6410211).
Institutional Review Board Statement
The study was conducted in accordance with the Declaration of Helsinki, and approved by the ethics committee of the Faculty of Education and Sport Science (University of Vigo, application 06-280722, 28 July 2022).
Informed Consent Statement
Not applicable.
Data Availability Statement
The original contributions presented in this study are included in the article. Further inquiries can be directed to the corresponding authors.
Acknowledgments
This publication was made possible thanks to the research stays during the years 2023 and 2024 at the Instituto Politécnico de Viana do Castelo (IPVC)—Escola Superior de Desporto e Lazer.
Conflicts of Interest
The authors declare no conflict of interest.
References
- Griffo, J.M.; Jensen, M.; Anthony, C.C.; Baghurst, T.; Kulinna, P.H. A Decade of Research Literature in Sport Coaching (2005–2015). Int. J. Sports Sci. Coach. 2019, 14, 205–215. [Google Scholar] [CrossRef]
- Lamas, L.; De Rose Junior, D.; Santana, F.; Rostaiser, E.; Negretti, L.; Ugrinowitsch, C. Space Creation Dynamics in Basketball Offence: Validation and Evaluation of Elite Teams. Int. J. Perform. Anal. Sport 2011, 11, 71–84. [Google Scholar] [CrossRef]
- Gómez, M.Á.; Jiménez, S.; Navarro, R.; Lago-Penas, C.; Sampaio, J. Effects of Coaches’ Timeouts on Basketball Teams’ Offensive and Defensive Performances According to Momentary Differences in Score and Game Period. Eur. J. Sport Sci. 2011, 11, 303–308. [Google Scholar] [CrossRef]
- Gutiérrez-Aguilar, Ó.; Montoya-Fernández, M.; Fernández-Romero, J.J.; Saavedra-García, M.A. Analysis of Time-out Use in Handball and Its Influence on the Game Performance. Int. J. Perform. Anal. Sport 2016, 16, 1–11. [Google Scholar] [CrossRef]
- Lombard, G.; Cloes, M. Analysis of the Relevance of the Information Content given to the Players during Volleyball Timeouts with a 3D Device. Int. J. Perform. Anal. Sport 2021, 21, 965–980. [Google Scholar] [CrossRef]
- Ortega, E.; Palao, J.M.; Gómez, M.Á.; Ibáñez, S.J.; Lorenzo, A.; Sampaio, J. Efecto de La Solicitud de Tiempos Muertos Sobre El Marcador y El Tipo de Defensa Empleados Por Los Equipos En Baloncesto. Mot. Eur. J. Hum. Mov. 2010, 24, 95–106. [Google Scholar]
- Gomes, F.; Volossovitch, A.; Ferreira, A.P. Team Timeout Calling in Handball. Int. J. Perform. Anal. Sport 2014, 14, 98–110. [Google Scholar] [CrossRef]
- Fernández-Echeverría, C.; González-Silva, J.; Castro, I.T.; Moreno, M.P. The Timeout in Sports: A Study of Its Effect on Volleyball. Front. Psychol. 2019, 10, 2437. [Google Scholar] [CrossRef]
- Abreu, A.; Fernández-Echeverria, C.; Gonzalez-Silva, J.; Claver, F.; Conejero, M.; Moreno, M.P. The Use of Timeouts in Volleyball, Depending on the Team Score. J. Hum. Sport Exerc. 2017, 12, 813–820. [Google Scholar] [CrossRef]
- Prieto, J.; Gómez, M.Á.; Volossovitch, A.; Sampaio, J. Effects of Team Timeouts on the Teams’ Scoring Performance in Elite Handball Close Games. Kinesiology 2016, 48, 115–123. [Google Scholar] [CrossRef]
- Halldorsson, V. Coaches Use of Team Timeouts in Handball: A Mixed Method Analysis. Open Sports Sci. J. 2016, 9, 143–152. [Google Scholar] [CrossRef]
- Assis, N.; Assunção, R.; Vaz-de-Melo, P.O.S. Stop the Clock: Are Timeout Effects Real? Lect. Notes Comput. Sci. (Incl. Subser. Lect. Notes Artif. Intell. Lect. Notes Bioinform.) 2021, 12461 LNAI, 507–523. [Google Scholar] [CrossRef]
- Gibbs, C.P.; Elmore, R.; Fosdick, B.K. The causal effect of a timeout at stopping an opposing run in the NBA. Ann. Appl. Stat. 2022, 16, 1359–1379. [Google Scholar] [CrossRef]
- Lloveras, L.A.; Vollmer, T.R. An Analysis of Timeout Calling in College Basketball. Psychol. Rec. 2022, 72, 551–559. [Google Scholar] [CrossRef]
- Sampaio, J.; Lago-Peñas, C.; Gómez, M.A. Brief Exploration of Short and Mid-Term Timeout Effects on Basketball Scoring According to Situational Variables. Eur. J. Sport Sci. 2013, 13, 25–30. [Google Scholar] [CrossRef]
- Scanlan, A.T.; Tucker, P.S.; Dascombe, B.J.; Berkelmans, D.M.; Hiskens, M.I.; Dalbo, V.J. Fluctuations in activity demands across game quarters in professional and semiprofessional male basketball. J. Strength Cond. Res. 2015, 29, 3006–3015. [Google Scholar] [CrossRef] [PubMed]
- López-Laval, I.; Scanlan, A.T.; Sitko, S.; Vaquera-Jiménez, A. Influence of the Game Context and Levels of Physical Activity on the Behavior of Basketball Coaches. Rev. Psicol. Deporte 2021, 30, 240–245. [Google Scholar]
- Schul, K.; Memmert, D.; Weigelt, M.; Jansen, P. From the Wrong Point of View! Athletes’ Ability to Identify Structured Playing Patterns Suffers from the Misalignment of Tactic Boards during Time-Outs in Professional Basketball. Perception 2014, 43, 811–817. [Google Scholar] [CrossRef]
- Hellermann, F.; Piesch, L.; Weigelt, M. Mental Rotation in Sports A Comparison of the Mental Rotation of Two-Dimensional Timeout Displays in Basketball and the Classical Mental Rotation Test (MRT) of Three-Dimensional Objects. Z. Sports 2022, 29, 141–153. [Google Scholar] [CrossRef]
- Saavedra, S.; Mukherjee, S.; Bagrow, J.P. Is Coaching Experience Associated with Effective Use of Timeouts in Basketball? Sci. Rep. 2012, 2, 676. [Google Scholar] [CrossRef] [PubMed]
- Lorenzo, J.; Navarro, R.; Rivilla, J.; Lorenzo, A. The Analysis of the Basketball Coach Speech during the Moments of Game and Pause in Relation to the Performance in Competition. Rev. Psicol. Deport. 2013, 22, 227–230. [Google Scholar]
- Andrews, S.R. Emotional Control and Instructional Effectiveness: Maximizing a Timeout. Strategies 2015, 28, 33–37. [Google Scholar] [CrossRef]
- Roane, H.S.; Kelley, M.E.; Trosclair, N.M.; Hauer, L.S. Behavioral Momentum in Sports: A Partial Replication With Women’S Basketball. J. Appl. Behav. Anal. 2004, 37, 385–390. [Google Scholar] [CrossRef] [PubMed]
- Mace, F.C.; Lalli, J.S.; Shea, M.C.; Nevin, J.A. Behavioral Momentum in College Basketball. J. Appl. Behav. Anal. 1992, 25, 657–663. [Google Scholar] [CrossRef]
- Goldschmied, N.; Raphaeli, M.; Morgulev, E. “Icing the Shooter” in Basketball: The Unintended Consequences of Time-out Management When the Game Is on the Line. Psychol. Sport Exerc. 2023, 68, 102440. [Google Scholar] [CrossRef] [PubMed]
- Christmann, J.; Akamphuber, M.; Müllenbach, A.L.; Güllich, A. Crunch Time in the NBA–The Effectiveness of Different Play Types in the Endgame of Close Matches in Professional Basketball. Int. J. Sports Sci. Coach. 2018, 13, 1090–1099. [Google Scholar] [CrossRef]
- Ferreira, A.P.; Volossovitch, A.; Sampaio, J. Towards the Game Critical Moments in Basketball: A Grounded Theory Approach. Int. J. Perform. Anal. Sport 2014, 14, 428–442. [Google Scholar] [CrossRef]
- Anguera, M.T.; Hernández-Mendo, A. Observational Methodology and Sports Psychology: State of Affairs. Rev. Psicol. Deport. 2014, 23, 103–109. [Google Scholar]
- Akinci, Y. Examining the Differences Between Playoff Teams and Non-Playoff Teams in Men’s Euroleague; Play-Type Statistics Perspective. SAGE Open 2023, 13, 21582440231. [Google Scholar] [CrossRef]
- Anguera, M.T.; Blanco-Villaseñor, A.; Losada, J.L.; Portell, M. Guidelines for Designing and Conducting a Study That Applies Observational Methodology. Anu. Psicol. 2018, 48, 9–17. [Google Scholar] [CrossRef]
- Alsasua, R.; Lapresa, D.; Arana, J.; Anguera, M.T.; Garzón, B. Successful and Unsuccessful Offensive Sequences Ending in a Shot in Professional and Elite Under-16 Basketball. J. Hum. Kinet. 2018, 64, 147–159. [Google Scholar] [CrossRef] [PubMed]
- Alsasua, R.; Lapresa, D.; Arana, J.; Anguera, M.T. A Log-Linear Analysis of Efficiency in Elite Basketball Applied to Observational Methodology. Int. J. Sports Sci. Coach. 2019, 14, 363–371. [Google Scholar] [CrossRef]
- Serna Bardavío, J.; Muñoz-Arroyave, V.; March-Llanes, J.; Lavega-Burgués, P. Decisional Analysis of Finishing in Basketball. Cult. Cienc. Deport. 2022, 17, 173–192. [Google Scholar] [CrossRef]
- Serna, J.; Muñoz-Arroyave, V.; March-Llanes, J.; Teresa Anguera, M.; Prat, Q.; Rillo-Albert, A.; Falcón, D.; Lavega-Burgués, P. Effect of Ball Screen and One-on-One on the Level of Opposition and Effectiveness of Shots in the Acb. Int. J. Environ. Res. Public Health 2021, 18, 2676. [Google Scholar] [CrossRef]
- Refoyo, I.; Romarís, I.U.; Sampedro, J. Analysis of Men’s and Women’s Basketball Fast-Breaks Area Advance Mode. Rev. Psicol. Deport. 2009, 18, 439–444. [Google Scholar]
- Anguera, M.T.; Camerino, O.; Castañer, M.; Sánchez-Algarra, P.; Onwuegbuzie, A.J. The Specificity of Observational Studies in Physical Activity and Sports Sciences: Moving Forward in Mixed Methods Research and Proposals for Achieving Quantitative and Qualitative Symmetry. Front. Psychol. 2017, 8, 2196. [Google Scholar] [CrossRef]
- Fernandez, J.; Camerino, O.; Anguera, M.T.; Jonsson, G.K. Identifying and Analyzing the Construction and Effectiveness of Offensive Plays in Basketball by Using Systematic Observation. Behav. Res. Methods 2009, 41, 719–730. [Google Scholar] [CrossRef] [PubMed]
- Anguera, M.T.; Blanco-Villaseñor, A.; Hernández-Mendo, A.; Losada-López, J.L. Observational Designs: Their Suitability and Application in Sports Psychology. Cuad. Psicol. Deport. 2011, 11, 63–76. [Google Scholar]
- American Psychological Association Ethical Principles of Psychologists and Code of Conduct. Am. Psychol. 2002, 57, 1060–1073. [CrossRef]
- Gómez, M.Á.; Lorenzo, A.; Ibañez, S.J.; Sampaio, J. Ball Possession Effectiveness in Men’s and Women’s Elite Basketball According to Situational Variables in Different Game Periods. J. Sports Sci. 2013, 31, 1578–1587. [Google Scholar] [CrossRef]
- Gómez, M.Á.; Battaglia, O.; Lorenzo, A.; Lorenzo, J.; Jiménez, S.; Sampaio, J. Effectiveness during Ball Screens in Elite Basketball Games. J. Sports Sci. 2015, 33, 1844–1852. [Google Scholar] [CrossRef] [PubMed]
- González-Prado, C.; Iglesias, X.; Anguera, M.T. Regularities Detection in High Level of Taekwondo. Cuad. Psicol. Deport. 2015, 15, 99–110. [Google Scholar] [CrossRef]
- Soto, A.; Camerino, O.; Iglesias, X.; Anguera, M.T.; Castañer, M. LINCE PLUS: Research Software for Behavior Video Analysis. Apunt. Educ. Física Esports 2019, 35, 149–153. [Google Scholar] [CrossRef]
- Blanco-Villaseñor, A.; Anguera, M.T. Evaluación de La Calidad En El Registro Del Comportamiento. Aplicación a Los Deportes de Equipo. In Métodos Numéricos en Ciencias Sociales; Oñate, E., García-Sicilia, F., Ramallo, L., Eds.; Centro Internacional de Métodos Numéricos en Ingeniería: Barcelona, Spain, 2000; pp. 30–48. [Google Scholar]
- Cohen, J. Weighted Kappa: Nominal Scale Agreement with Provision for Scaled Disagreement of Partial Credit. Psychol. Bull. 1968, 70, 213–220. [Google Scholar] [CrossRef]
- Altman, D.G. Practical Statistics for Medical Research; Chapman and Hall: London, UK, 1991. [Google Scholar]
- Choi, H.; O’Donoghue, P.; Hughes, M. An Investigation of Inter-Operator Reliability Tests for Real-Time Analysis System. Int. J. Perform. Anal. Sport 2007, 7, 49–61. [Google Scholar] [CrossRef]
- Vázquez-Estévez, C.; Paramés-González, A.; Prieto-Lage, I.; Reguera-López-de-la-Osa, X.; Álvarez-Rodríguez, M.; Gutiérrez-Santiago, A. Analysis of Successful Offensive Patterns in Critical Moments in Men’s EuroBasket 2022 and Women’s 2021. Appl. Sci. 2024, 14, 10883. [Google Scholar] [CrossRef]
- Prieto-Lage, I.; Vázquez-Estévez, C.; Paramés-González, A.; Argibay-González, J.C.; Reguera-López-de-la-Osa, X.; Gutiérrez-Santiago, A. Ball Screens in the Men’s 2019 Basketball World Cup. Int. J. Environ. Res. Public Health 2023, 20, 59. [Google Scholar] [CrossRef]
- Magnusson, M.S. Discovering Hidden Time Patterns in Behavior: T-Patterns and Their Detection. Behav. Res. Methods Instrum. Comput. 2000, 32, 93–110. [Google Scholar] [CrossRef]
- Schwartz, B.; Barsky, S.F. The Home Advantage. Soc. Forces 1977, 55, 641–661. [Google Scholar] [CrossRef]
- Pollard, R.; Prieto, J.; Gómez, M.Á. Global Differences in Home Advantage by Country, Sport and Sex. Int. J. Perform. Anal. Sport 2017, 17, 586–599. [Google Scholar] [CrossRef]
- García, J.; Ibáñez, S.J.; Gómez, M.Á.; Sampaio, J. Basketball Game-Related Statistics Discriminating ACB League Teams According to Game Location, Game Outcome and Final Score Differences. Int. J. Perform. Anal. Sport 2014, 14, 443–452. [Google Scholar] [CrossRef]
- Pollard, R.; Gómez, M.Á. Variations in Home Advantage in the National Basketball Leagues of Europe. Rev. Psicol. Deport. 2013, 22, 263–266. [Google Scholar]
- Jones, M.B. Home Advantage in the NBA as a Game-Long Process. J. Quant. Anal. Sports 2007, 3, 2. [Google Scholar] [CrossRef]
- Gómez, M.Á.; Lorenzo, A.; Jiménez, S.; Navarro, R.M.; Sampaio, J. Examining Choking in Basketball: Effects of Game Outcome and Situational Variables during Last 5 Minutes and Overtimes. Percept. Mot. Ski. 2015, 120, 111–124. [Google Scholar] [CrossRef]
- Ribeiro, H.V.; Mukherjee, S.; Zeng, X.H.T. The Advantage of Playing Home in NBA: Microscopic, Team-Specific and Evolving Features. PLOS ONE 2016, 11, e0152440. [Google Scholar] [CrossRef] [PubMed]
- González, J.M.M.; De Saá Guerra, Y.; García-Manso, J.M.; Arriaza, E. Design and Flow in Basketball. Int. J. Heat Technol. 2016, 34, S51–S58. [Google Scholar] [CrossRef]
- García-Manso, J.M.; Martín-González, J.M.; De Saá Guerra, Y.; Valverde, T.; Jiménez, S.L. Last Minute in NBA Games. Rev. Psicol. Deport. 2015, 24, 31–35. [Google Scholar]
- Salazar, H.; Ujakovic, F.; Plesa, J.; Lorenzo, A.; Alonso-Pérez-Chao, E. Do Elite Basketball Players Maintain Peak External Demands throughout the Entire Game? Sensors 2024, 24, 4318. [Google Scholar] [CrossRef]
- Cao, S.; Geok, S.K.; Roslan, S.; Sun, H.; Lam, S.K.; Qian, S. Mental Fatigue and Basketball Performance: A Systematic Review. Front. Psychol. 2022, 12, 819081. [Google Scholar] [CrossRef]
- Foteinakis, P.; Pavlidou, S.; Stavropoulos, N. Analysis of the Effectiveness of Different Play Types in the End of Game Possessions of Close EuroLeague Matches. J. Hum. Sport Exerc. 2024, 19, 617–630. [Google Scholar] [CrossRef]
- Gómez, M.Á.; Lorenzo, A.; Ibáñez, S.J.; Ortega, E.; Leite, N.; Sampaio, J. An Analysis of Defensive Strategies Used by Home and Away Basketball Teams. Percept. Mot. Ski. 2010, 110, 159–166. [Google Scholar] [CrossRef]
- Csataljay, G.; James, N.; Hughes, M.; Dancs, H. Effects of Defensive Pressure on Basketball Shooting Performance. Int. J. Perform. Anal. Sport 2013, 13, 594–601. [Google Scholar] [CrossRef]
- Cárdenas, D.; Ortega, E.; Llorca, J.; Courel-Ibáñez, J.; Sánchez-Delgado, G.; Piñar, M.I. Motor Characteristics of Fast Break in High Level Basketball. Kinesiology 2015, 47, 208–214. [Google Scholar]
- Selmanović, A.; Jerak, T.; Mihaljević, V. The Relation in Quantity of Ball Passes and Effectiveness in Elite the Relation in Quantity of Ball Passes. In Proceedings of the 9th International Scientific Conference on Kinesiology, Opatija, Croatia, 15–19 September 2021; Salaj, S., Skegro, D., Eds.; University of Zagreb, Faculty of Kinesiology: Opatija, Croatia, 2021; pp. 850–955. [Google Scholar]
- Milanović, D.; Selmanović, A.; Skegro, D. Characteristics and Differences of Basic Types of Offenses in European and American Top-Level Basketball. Int. Sci. Conf. Kinesiol. 2014, 7, 400–403. [Google Scholar]
- Ortega, E.; Palao, J.M.; Gómez, M.Á.; Lorenzo, A.; Cárdenas, D. Analysis of the Efficacy of Possessions in Boys’ 16-and-under Basketball Teams: Differences between Winning and Losing Teams. Percept. Mot. Ski. 2007, 104, 961–964. [Google Scholar] [CrossRef] [PubMed]
- Gómez, M.Á.; Evangelos, T.; Alberto, L. Defensive Systems in Basketball Ball Possessions. Int. J. Perform. Anal. Sport 2006, 6, 98–107. [Google Scholar] [CrossRef]
- Matulaitis, K.; Bietkis, T. Prediction of Offensive Possession Ends in Elite Basketball Teams. Int. J. Environ. Res. Public Health 2021, 18, 1083. [Google Scholar] [CrossRef]
- Cabarkapa, D.; Deane, M.A.; Fry, A.C.; Jones, G.T.; Cabarkapa, D.V.; Philipp, N.M.; Yu, D. Game Statistics That Discriminate Winning and Losing at the NBA Level of Basketball Competition. PLoS ONE 2022, 17, e0273427. [Google Scholar] [CrossRef] [PubMed]

Disclaimer/Publisher’s Note: The statements, opinions and data contained in all publications are solely those of the individual author(s) and contributor(s) and not of MDPI and/or the editor(s). MDPI and/or the editor(s) disclaim responsibility for any injury to people or property resulting from any ideas, methods, instructions or products referred to in the content. |
© 2025 by the authors. Licensee MDPI, Basel, Switzerland. This article is an open access article distributed under the terms and conditions of the Creative Commons Attribution (CC BY) license (https://creativecommons.org/licenses/by/4.0/).