Article

Study of Reynolds Number Effects on Aerodynamic Forces and Vortex-Induced Vibration Characteristics of a Streamlined Box Girder

1
School of Civil Engineering, Shijiazhuang Tiedao University, Shijiazhuang 050043, China
2
State Key Laboratory of Mechanical Behavior and System Safety of Traffic Engineering Structures, Shijiazhuang Tiedao University, Shijiazhuang 050043, China
3
Innovation Center for Wind Engineering and Wind Energy Technology of Hebei Province, Shijiazhuang 050043, China
4
Key Laboratory of Roads and Railway Engineering Safety Control, Ministry of Education, Shijiazhuang 050043, China
5
School of Civil Engineering, Central South University, Changsha 410075, China
*
Author to whom correspondence should be addressed.
Appl. Sci. 2025, 15(4), 2202; https://doi.org/10.3390/app15042202
Submission received: 22 December 2024 / Revised: 14 February 2025 / Accepted: 16 February 2025 / Published: 19 February 2025

Abstract

:
Due to the limitations of wind tunnel speed and size, achieving a model’s Reynolds number equal to the actual Reynolds number is challenging and may lead to discrepancies between experimental and actual results. To investigate the effects of the Reynolds number on the aerodynamic forces and vortex-induced vibration (VIV) characteristics of a streamlined box girder, wind tunnel tests were conducted to study the variations in aerodynamic forces and surface pressures on the static main beam, as well as the VIV response and time–frequency characteristics of the aerodynamic forces on the dynamic main beam, as the Reynolds number varied. The results indicate that in static tests, as the Reynolds number increases, the drag coefficient of the main beam decreases, the lift coefficient slightly increases, and the pitching moment coefficient remains almost unchanged. The root mean square (RMS) values of the wind pressure coefficients show a significant Reynolds number effect, with values generally decreasing as the Reynolds number increases. In free vibration tests, as the Reynolds number increases, the onset wind speed of VIV increases from 14.35 m/s to 16.03 m/s, the maximum amplitude decreases from 0.076 to 0.004, and the VIV lock-in range narrows. The dynamic pressure results indicate that as the Reynolds number increases, the RMS values of the wind pressure coefficients decrease. At some measurement points, the dominant frequencies of the fluctuating pressure amplitude spectra deviate from the corresponding VIV frequency, and the correlation and contribution coefficients between the local aerodynamic forces and the overall vortex-induced force (VIF) decrease. These changes may explain the reduction in the VIV amplitude with an increasing Reynolds number. The motion state of the main beam has a minimal effect on the mean wind pressure coefficients and their Reynolds number effect, whereas it has a more significant effect on the RMS values of the pressure coefficients.

1. Introduction

As bridge spans increase, main beams become more slender, and wind loads and wind-induced vibration problems become more prominent [1,2,3,4]. Vortex-induced vibration (VIV) is a type of wind-induced vibration that occurs easily at low wind speeds. When airflow passes over the main beam surface, vortices are shed periodically and alternately, generating periodic vortex-induced forces (VIFs). The main beam undergoes VIV under the action of these VIFs. When the shedding frequency of the vortices approaches or matches the natural frequency of the main beam, vortex resonance occurs [5,6,7]. Many bridge main beams worldwide have experienced VIV, including the Tokyo Bay Bridge in Japan [8], the West Approach Bridge of the Great Belt East Bridge in Denmark [9], the Volga River Bridge in Russia [10], the Humen Pearl River Bridge in China [11], and the Xigangmen Bridge [2], among others. Although VIV does not lead to catastrophic failure, it can affect driving comfort, and prolonged vibration may lead to structural fatigue damage [1,5,6]. Therefore, studying VIV characteristics is crucial for ensuring both driving and bridge safety.
Wind tunnel testing is one of the most commonly used methods to study VIV. To ensure flow similarity between models and prototypes, the similarity criteria related to the flow must be matched. However, owing to limitations in wind tunnel size, wind speed, and other factors, the Reynolds number, one of the similarity criteria, often differs by several orders of magnitude between experimental and actual bridge values [12]. This discrepancy may cause deviations between the experimental and actual results, which could hinder the design of wind-resistant bridges [13,14].
Main beams of large-span bridges often adopt streamlined box girders with favorable aerodynamic shapes [15,16]. Earlier studies suggested that for main beam cross-sections with distinct edges, the aerodynamic coefficient variations with the Reynolds number could be ignored, as they have fixed flow separation points [17]. However, subsequent studies revealed that even main beams with distinct edges can exhibit Reynolds number effects [9,13,18,19]. Many scholars have conducted in-depth studies on the effects of the Reynolds number on the aerodynamic forces and VIVs of main beams and other structures.
In terms of aerodynamic forces, Li et al. [12] conducted static tests to study the effects of the Reynolds number on the pressure distribution and aerodynamic forces of twin-box girders in the range of 1.05 × 10⁴ < Re < 8.93 × 10⁴. They reported that as the Reynolds number increased, the size of the separation bubble and the drag coefficient decreased. In a large Reynolds number range (104 < Re < 107), Schewe and Larsen [9,18] reported that with the increase in the Reynolds number, the drag coefficient of the bridge section decreased first and then remained constant, and the lift coefficient decreased first and then increased. The pitching moment coefficient was basically unchanged. Larose et al. [19] reported that as the Reynolds number increased from 0.25 × 10⁶ to 1.0 × 10⁶, the drag coefficient of the rectangular section increased, whereas the lift and pitching moment coefficients remained constant. Pires et al. [20] examined the effects of the Reynolds number on the aerodynamic characteristics of airfoils and reported that as the Reynolds number increased, the drag coefficient decreased, and the lift coefficient increased. Lee et al. [21] studied the effects of the Reynolds number on the aerodynamic forces of streamlined twin-box girders and reported that the drag and lift coefficients obtained from low-Reynolds-number wind tunnel tests were lower. Kargarmoakhar et al. [22] conducted force measurements to study the effects of the Reynolds number on the aerodynamic characteristics of double-deck bridges as the Reynolds number increased from 1.3 × 10⁶ to 6.1 × 10⁶. The results revealed that the Reynolds number effect was not significant at negative angles of attack, but as the Reynolds number increased at 0° and positive angles of attack, the drag coefficient decreased, and the lift coefficient increased. Other scholars [23,24,25,26,27] have also used pressure or force measurements to confirm that changes in the Reynolds number do indeed have an effect on the three force coefficients. However, existing studies have only analyzed the effects of the Reynolds number on the static wind pressure coefficients, while the effects of the Reynolds number on the wind pressure coefficients under a free vibration state need to be improved, and there is a lack of comparative studies on the effects of the Reynolds number on the wind pressure coefficients in both static and free vibration states. Therefore, this study is based on static and dynamic tests to compare and analyze the effects of the Reynolds number on the wind pressure coefficients. The influences of the motion state of the main beam on the Reynolds number effects of the wind pressure coefficients are revealed.
In the field of VIV, some scholars have studied the effects of the Reynolds number on the VIV characteristics of cylinders. They reported that as the Reynolds number changed, the amplitude [28,29], frequency [30], wind speed corresponding to the maximum amplitude [31], and phase difference between the aerodynamic forces and displacement [32] all changed. Other researchers have investigated the effects of the Reynolds number on the aerodynamic characteristics of airfoils and the VIV characteristics of streamlined box girders. Liu et al. [33] showed that the aerodynamic characteristics of supercritical airfoils are highly sensitive to the Reynolds number and that the design and optimization of large aircraft using supercritical airfoils should consider Reynolds number effects. Several scholars have used vibration and pressure measurement tests to study the effects of the Reynolds number on the VIV amplitude, vortex shedding frequency, and other characteristics of streamlined box girders [34,35,36]. Li et al. [12] further studied the surface wind pressure distribution and aerodynamic characteristics of the main beam at different Reynolds numbers and reported that the VIV of streamlined main beams is significantly influenced by the Reynolds number. Other scholars [12,37,38,39] investigated the pressure amplitude at the dominant frequency, the correlation and phase difference between the aerodynamic forces and the VIF, and the contribution coefficients of the aerodynamic forces to the VIF. They reported that at different Reynolds numbers, the surface wind pressure and the phase difference between the local aerodynamic forces and VIF vary significantly, indicating a clear Reynolds number effect. Cui et al. [40] analyzed the effects of the Reynolds number on the VIV amplitude, vibration amplitude spectrum, wind pressure distribution, fluctuating pressure dominant frequency, and pitching moment coefficient time history and the correlation between the local and total pitching moment coefficients, revealing that the effects of the Reynolds number on the correlation between the local and total aerodynamic forces, as well as on Cp,rms, are the underlying causes of the effects of the Reynolds number on VIV. Although a lot of work has been done by scholars, the interval span of the Reynolds number is large, and the number of comparison groups is small, resulting in weak regularity. In addition, the existing studies only analyze the effects of the Reynolds number on VIV characteristics, but there is a lack of research on the formation mechanism. Therefore, in this study, the number of Reynolds number comparison groups is increased, the effects of the Reynolds number on VIV characteristics are improved, and the time–frequency characteristics of VIV are studied, which reveals the formation mechanism of the effects of the Reynolds number on VIV.
In summary, scholars have studied the effects of the Reynolds number on the static aerodynamic forces, VIV response, and time–frequency characteristics of the aerodynamic forces of streamlined box girders and have drawn many conclusions. However, several issues remain unresolved. First, the effects of the Reynolds number on the VIV characteristics of the main beam still require further refinement. Second, the mechanisms underlying the effects of the Reynolds number on VIV characteristics are not yet fully understood. Third, comparative studies on the effects of the Reynolds number on the wind pressure coefficients in both static and free vibration states are lacking.
Therefore, a streamlined box girder of a certain cable-stayed bridge was selected as the research object. Static pressure tests and dynamic pressure and vibration tests were conducted. Through the static tests, the effects of the Reynolds number on the static three-force coefficients and static wind pressure distributions of the main beam were investigated. Through the free vibration tests, the effects of the Reynolds number on the VIV response and dynamic aerodynamic force time–frequency characteristics of the main beam were studied, and the mechanism behind the Reynolds number effects on VIV was revealed. The innovations of this paper lie in further refining the understanding of the effects of the Reynolds number on the VIV characteristics of the main beam, exploring its formation mechanism, and comparing the effects of the Reynolds number on the wind pressure coefficients under both static and free vibration states.

2. Wind Tunnel Test Setup

2.1. Wind Tunnel

The tests were conducted in the low-speed section of the STU-1 atmospheric boundary layer wind tunnel at the Wind Engineering Research Center, Shijiazhuang Tiedao University. The test section has a width of 4.4 m, a height of 3.0 m, and a length of 24.0 m, with a wind speed range of 0–30 m/s. The background turbulence intensity in the flow field is less than 0.4%.

2.2. Model Setup

A streamlined box girder from a certain cable-stayed bridge was selected as the research object. The main beam has a width of 34.0 m, a height of 3.5 m, and a wind nozzle angle of 56°. Considering the wind tunnel test section dimensions and blockage ratio requirements, the scale ratio was set to 1:30. The scaled model has a length of 2.140 m, a width of 1.070 m, and a height of 0.117 m, with a width-to-length ratio of 2:1 and a width-to-height ratio of 9.15:1. The maximum blockage ratio is less than 4.48%. The sectional model parameters are shown in Table 1. The model is constructed with a steel tube and rib plates as the framework and covered with ABS panels to ensure sufficient strength and stiffness.
A ring of pressure measurement holes was arranged at the midspan of the model, with a total of 180 pressure holes on both the upper and lower surfaces. Figure 1 shows the sectional model of the main beam and the layout of its surface pressure measurement holes. The wind pressure was measured using the micro ESP pressure scanning valve and data acquisition system, with a measurement range of ±20 in H2O, a sampling frequency of 330 Hz, and a static accuracy of ±0.05%FS. To facilitate the representation of each measurement point, the dimensionless distance Dd is defined as
D d = d i D
where di is the distance from the i-th pressure measurement point on the upper or lower surface to point A along the surface and D is the distance along the surface on which the i-th point is located between points A and B, with both di and D measured in meters. Points A and B are the end points on both sides of the main beam section. Figure 2 shows the dimensionless distance diagram for the sectional model of the main beam.
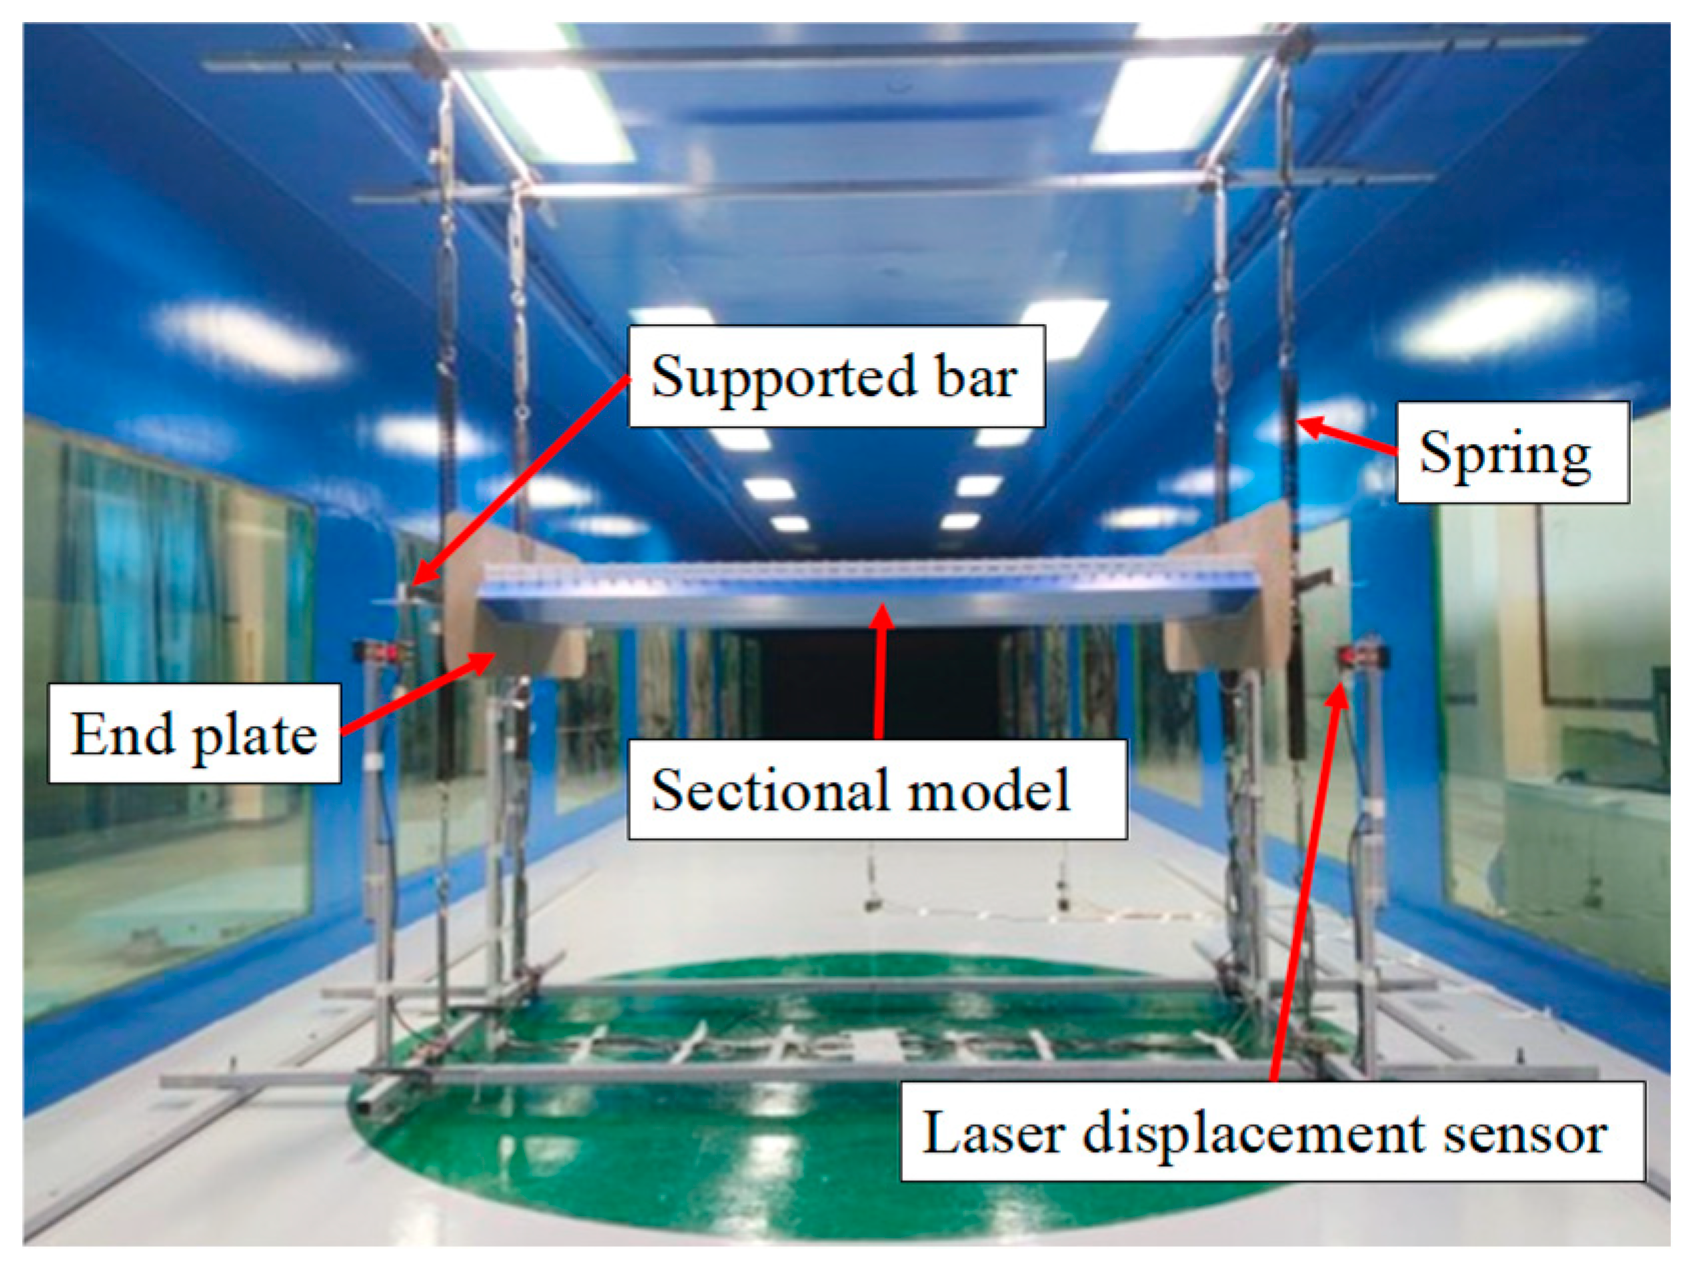
The model is supported by eight vertical springs. The influence of the end plate on the flow pattern and the aerodynamic characteristics of the test models are complicated. Many researchers have carried out numerous experimental and numerical studies. Many valuable conclusions were obtained [41,42,43,44]. Generally, the end plate can suppress the end effect. The suppression effect is dependent on the shape and dimension of the end plate. The end plates used in wind tunnel tests for a streamlined beam section model were usually rectangular plates with round corners. The width of rectangular plates was around 1.4–5.5 times the beam width, and the height was around 3–5 times the beam height [1,3,36,44]. Thus, the rounded rectangular end plates with a width of 1.5B and a height of 3.5H were employed to eliminate the end effects in the current study. The wind speed was measured using the Series 100 Cobra Probe (Turbulent Flow Instrumentation Pty Ltd., Tallangatta, VIC, Australia), with a measurement range of 2–100 m/s, a sampling frequency of 625 Hz, and a measurement accuracy of ±0.5 m/s. The vibration displacement was measured using the HL-G112-A-C5 laser displacement sensor (Panasonic Holdings Corporation, Kadoma, Japan), with a distance of 120 mm between the laser emission point and the measurement center, a measurement range of 120 ± 60 mm, a sampling frequency of 1000 Hz, and a resolution of 8 μm. The installation diagram of the model is shown in Figure 3.

2.3. Test Conditions

The Reynolds number (Re) represents the ratio of inertial forces to viscous forces in the fluid, which can be defined as
R e = U B v
where U represents the mean wind speed, B represents the characteristic length, which is the model width, and v represents the kinematic viscosity of air.
In the static tests, the Reynolds number varied by 1.6 × 10⁴ < Re < 1.2 × 10⁵ by changing the wind speed.
In the free vibration tests, four systems with different natural frequencies were obtained by replacing four springs with varying stiffnesses. The natural frequencies of the systems were 1.93 Hz, 2.98 Hz, 4.55 Hz, and 5.29 Hz. Although the Reynolds numbers corresponding to the models with these four natural frequencies are the same when scaled to the actual bridge, the Reynolds numbers at which VIV occurred during the tests are different. The Reynolds numbers corresponding to the maximum VIV amplitude were 3.2 × 10⁴, 4.7 × 10⁴, 7.1 × 10⁴, and 8.3 × 10⁴, respectively. During the tests, the mass and damping parameters of the four systems were kept constant, and the differences in the test results were attributed to the variations in the Reynolds numbers. Both static and free vibration tests were conducted under a +5° wind attack angle.

3. Reynolds Number Effects on Static Aerodynamic Characteristics

3.1. Mean Aerodynamic Force Coefficients

Aerodynamic force coefficients are dimensionless parameters that describe wind loads and provide an intuitive representation of the overall forces acting on the model. The drag coefficient CD, lift coefficient CL, and pitching moment coefficient CM of the main beam are expressed as follows:
C D = 2 F D ρ U 2 B
C L = 2 F L ρ U 2 B
C M = 2 M M ρ U 2 B 2
where ρ represents the air density, U represents the mean wind speed, FD represents drag, FL represents lift, MM represents the pitching moment, and B represents the width of the main beam cross-section.
By integrating the local pressure on the surface of the main beam, the overall drag FD, lift FL, and pitching moment MM per unit length are obtained.
Figure 4 shows the variations in the mean aerodynamic force coefficients of the static main beam with respect to the Reynolds number.
As shown in Figure 4a, the drag coefficient has an obvious Reynolds number effect. In the Reynolds number range of 1.6 × 10⁴ < Re < 4.3 × 10⁴, the drag coefficient decreases significantly upon increasing the Reynolds number. At Re = 1.6 × 10⁴, it is around 0.44, and at Re = 4.3 × 10⁴, it is around 0.38, which is a reduction of 0.06 or approximately 14%. In the range of 4.3 × 10⁴ < Re < 1.2 × 10⁵, the drag coefficient remains relatively stable upon increasing the Reynolds number, maintaining a value between 0.38 and 0.39. The change law of the drag coefficient is the same as that obtained by other scholars, with only minor numerical differences [9,12,19,23], which indicates that this study is credible.
As shown in Figure 4b, the lift coefficient is negative across the range of Reynolds numbers tested, indicating that the overall force on the main beam is directed downward. This is similar to the results obtained by Matsuda et al. [14] and Larose et al. [19] but different from the results obtained by Li et al. [12], which may be caused by different factors, such as the aerodynamic shape, the wind attack angle, and the Reynolds number. The lift coefficient exhibits a weak Reynolds number effect. In the range of 1.6 × 10⁴ < Re < 8.0 × 10⁴, the lift coefficient slightly increases with the Reynolds number by approximately 0.01. In the range of 8.0 × 10⁴ < Re < 1.2 × 10⁵, the lift coefficient does not significantly change upon increasing the Reynolds number.
As shown in Figure 4c, the pitching moment coefficient does not change significantly upon increasing the Reynolds number, indicating that the main beam’s pitching moment coefficient is unaffected by the Reynolds number.
Overall, within the range of Reynolds numbers tested, the drag and lift coefficients of the main beam show a Reynolds number effect. As the Reynolds number increases, the drag coefficient decreases significantly, whereas the lift coefficient increases slightly. The pitching moment coefficient remains unaffected by the Reynolds number. The drag coefficient is positive, and the lift coefficient is negative, indicating that the main beam experiences drag in the backward direction in the crosswind direction and lift in the downward direction. The results show that there is a Reynolds number effect on the mean aerodynamic force coefficients of the static beam and reveal the laws of variation with the Reynolds number, which provides a reference for relevant research of the mean aerodynamic force coefficients.

3.2. Mean Values of the Wind Pressure Coefficients

The surface wind pressure of the main beam was processed to obtain the wind pressure coefficient CPi, which is defined as
C P i = 2 P i P 0 ρ U 2
where Pi is the pressure time history at the i-th measurement point, P0 is the reference static pressure, ρ is the air density, and U is the mean wind speed. After calculating the Cp mean and the RMS values, Cp,mean and Cp,rms can be obtained.
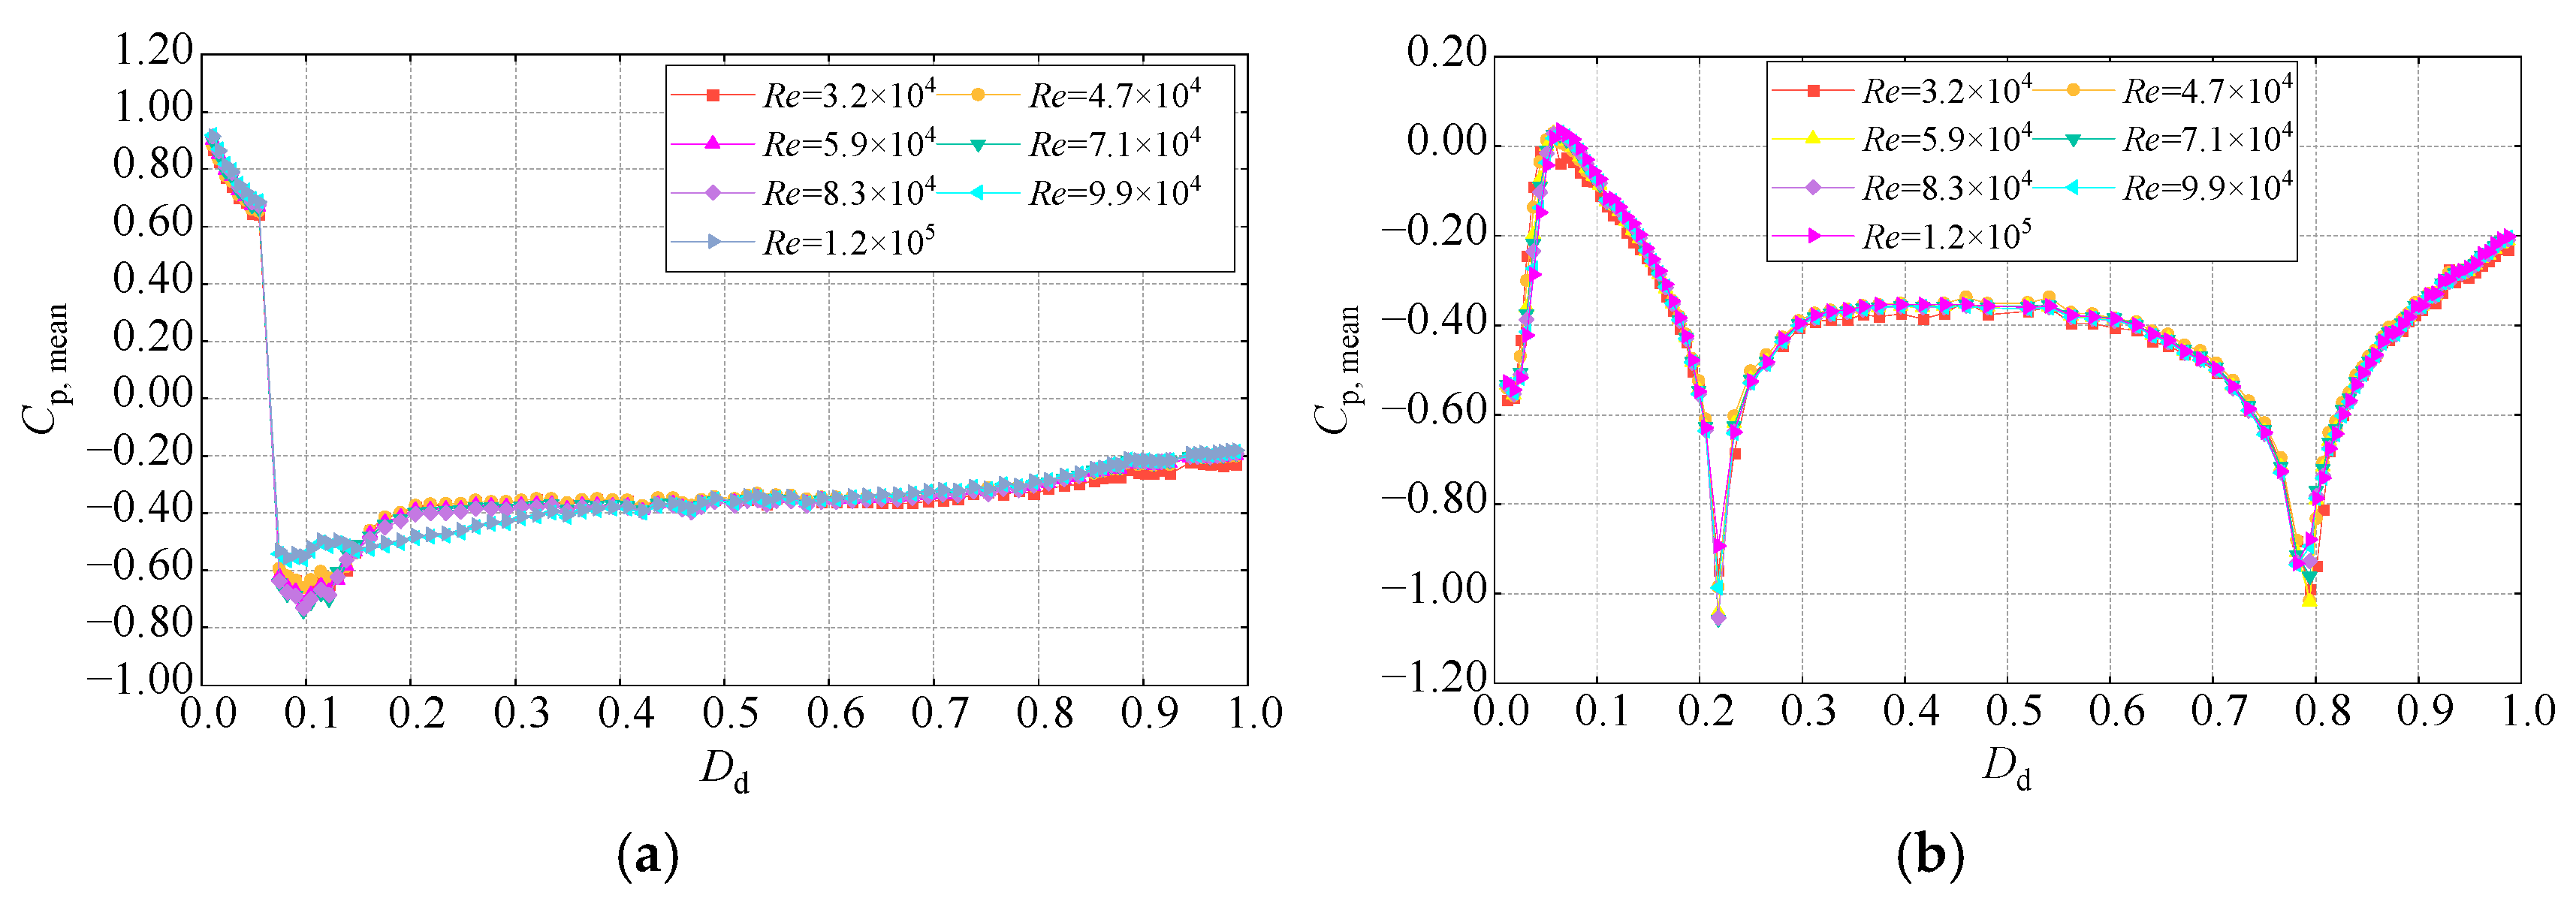
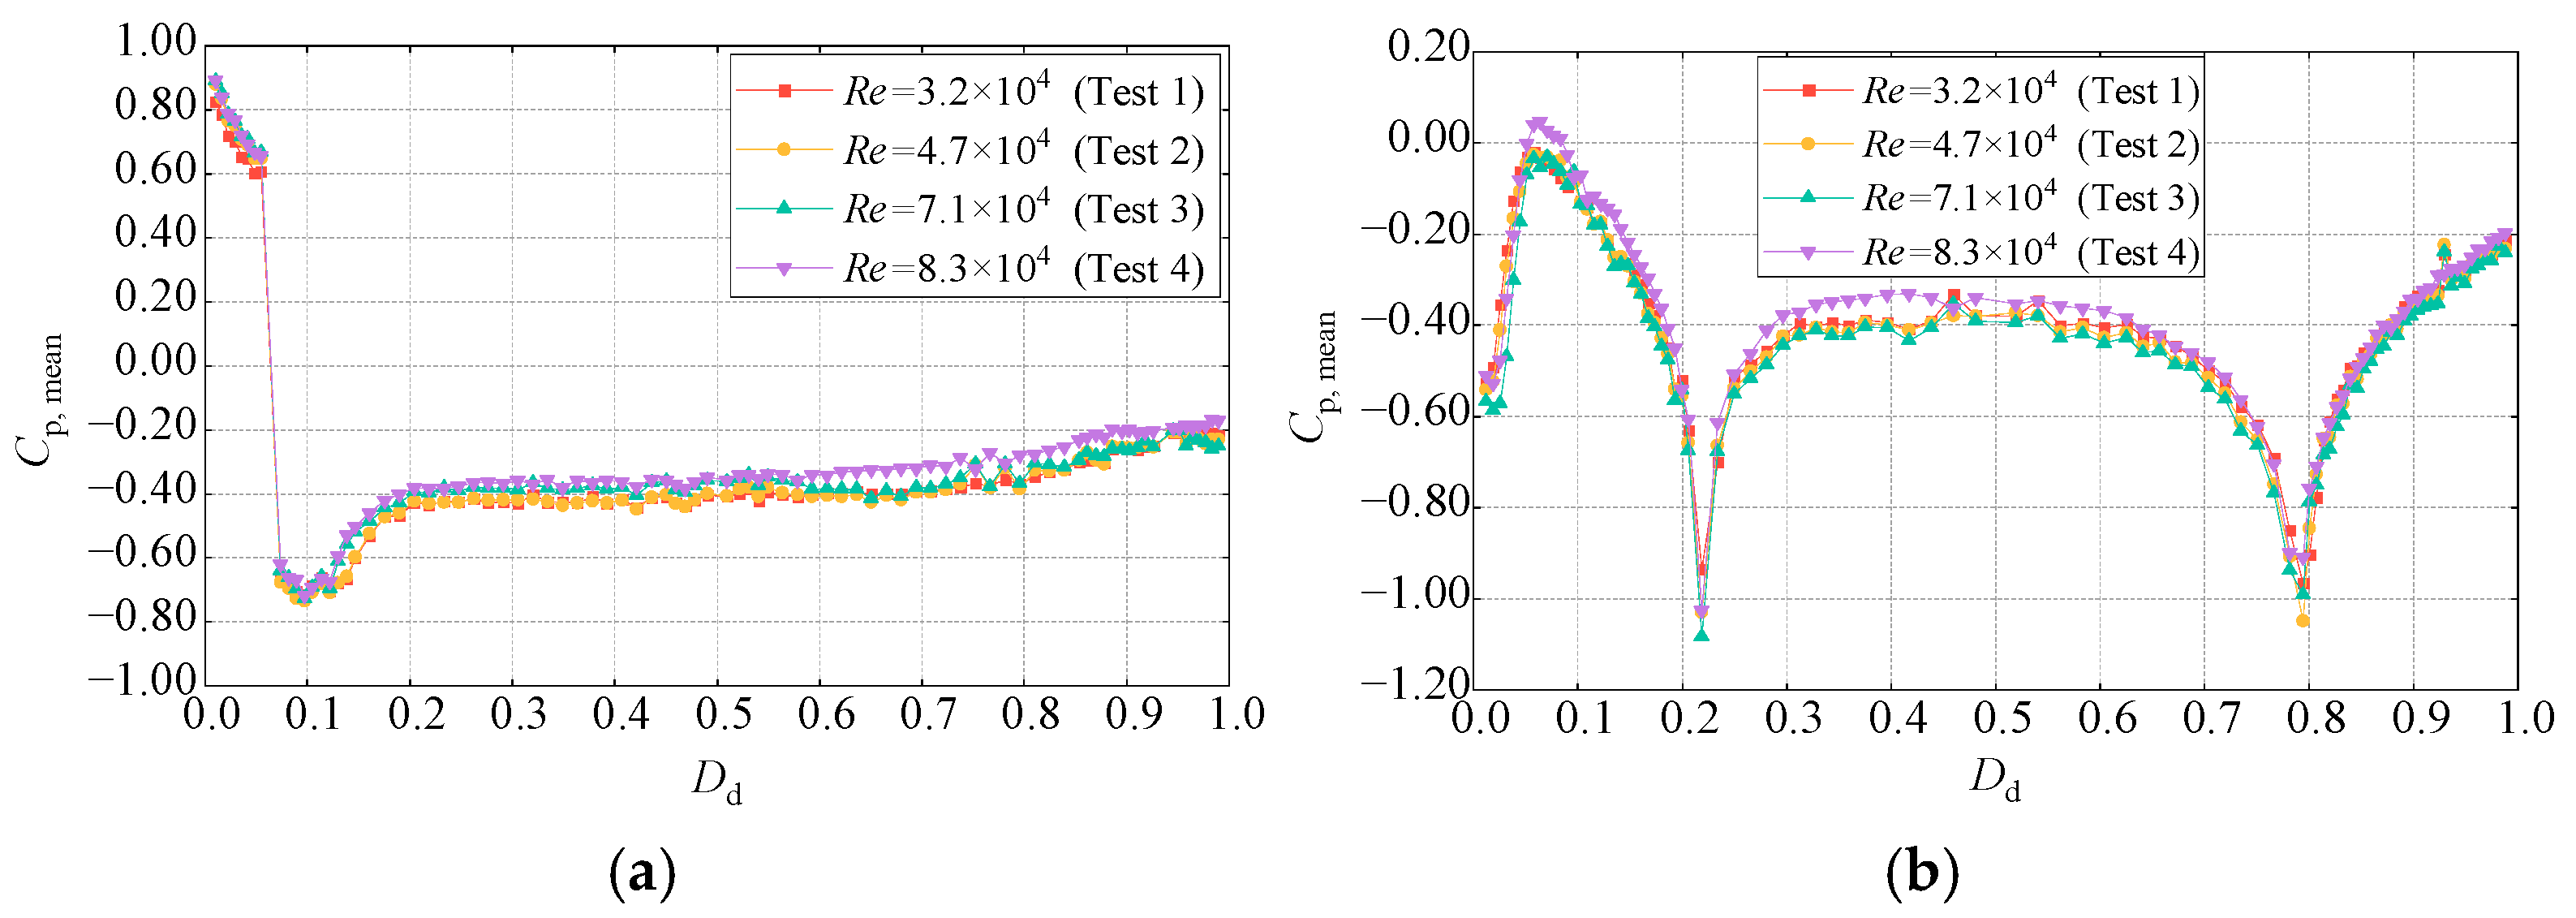
The distribution of the mean values of the wind pressure coefficients can provide an initial reflection of the flow separation and reattachment behavior on the main beam’s surface [37]. Figure 5 shows the distributions of the mean values on the main beam surface at different Reynolds numbers. The distributions and magnitudes of the mean wind pressure coefficient in the present study are similar to those obtained by Laima et al. and Li et al. [12,35]. This indicates that the current test results are correct.
As shown in Figure 5a, the distribution trends of the mean values on the upper surface are generally consistent across different Reynolds numbers. Specifically, except for the windward side of the air intake (Dd = 0.01–0.05), where the Cp,mean values are positive and relatively large, the other regions have negative values. This finding indicates that the windward side of the intake is subjected to pressure, whereas the other regions experience suction. The maximum negative value occurs at Dd = 0.10, suggesting that the windward sidewalk experiences stronger suction. In the range of Dd = 0.20–0.99, Cp,mean increases gradually.
In the Reynolds number range of 3.2 × 10⁴ < Re < 8.3 × 10⁴, no Reynolds number effect is observed on the mean values of the wind pressure coefficients. However, as the Reynolds number increases from 8.3 × 10⁴ to 9.9 × 10⁴, the distributions of the Cp,mean change in the region of Dd = 0.07–0.33 from large fluctuations to a more gradual pattern. This indicates a slight Reynolds number effect on the mean values when the Reynolds number exceeds 8.3 × 10⁴. For example, at Dd = 0.10, the Cp,mean values at Re = 9.9 × 10⁴ and Re = 1.2 × 10⁵ are −0.56 and −0.55, respectively, whereas at other Reynolds numbers, the Cp,mean values range from −0.66 to −0.74, changing by 0.11 to 0.19 or approximately 17% to 26%.
Figure 5b shows that the distribution pattern of mean values on the lower surface of the main beam follows a consistent trend across different Reynolds numbers. Specifically, the Cp,mean values are mostly negative, indicating the presence of suction. Three local extrema occur at Dd = 0.06, 0.22, and 0.79. Near Dd = 0.06, the absolute value of Cp,mean is the smallest and close to zero, indicating that the aerodynamic force at the junction of the wind nozzle and lower slant web is minimal. At Dd = 0.22 and 0.79, the Cp,mean values reach their maximum negative values, approximately −1.00. This is likely due to the two maintenance vehicle tracks causing flow separation, leading to a negative pressure zone downstream of the tracks, where suction is strongest. In the range of Dd = 0.30–0.60, Cp,mean stabilizes at approximately −0.40, with a uniform distribution of aerodynamic forces.
The mean values of the wind pressure coefficients on the lower surface of the main beam at different Reynolds numbers slightly vary near Dd = 0.22 and 0.79. Specifically, at Dd = 0.22, as the Reynolds number increases, the Cp,mean first decreases and then increases. For example, at Re = 8.3 × 10⁴, the mean value is −1.05, whereas when Re = 1.2 × 10⁵, it is −0.89, representing a change of 0.16 (approximately 15%). This finding suggests that the maintenance vehicle tracks have a noticeable effect on the Reynolds number dependence of the mean values on the lower surface.

3.3. RMS Values of the Wind Pressure Coefficients

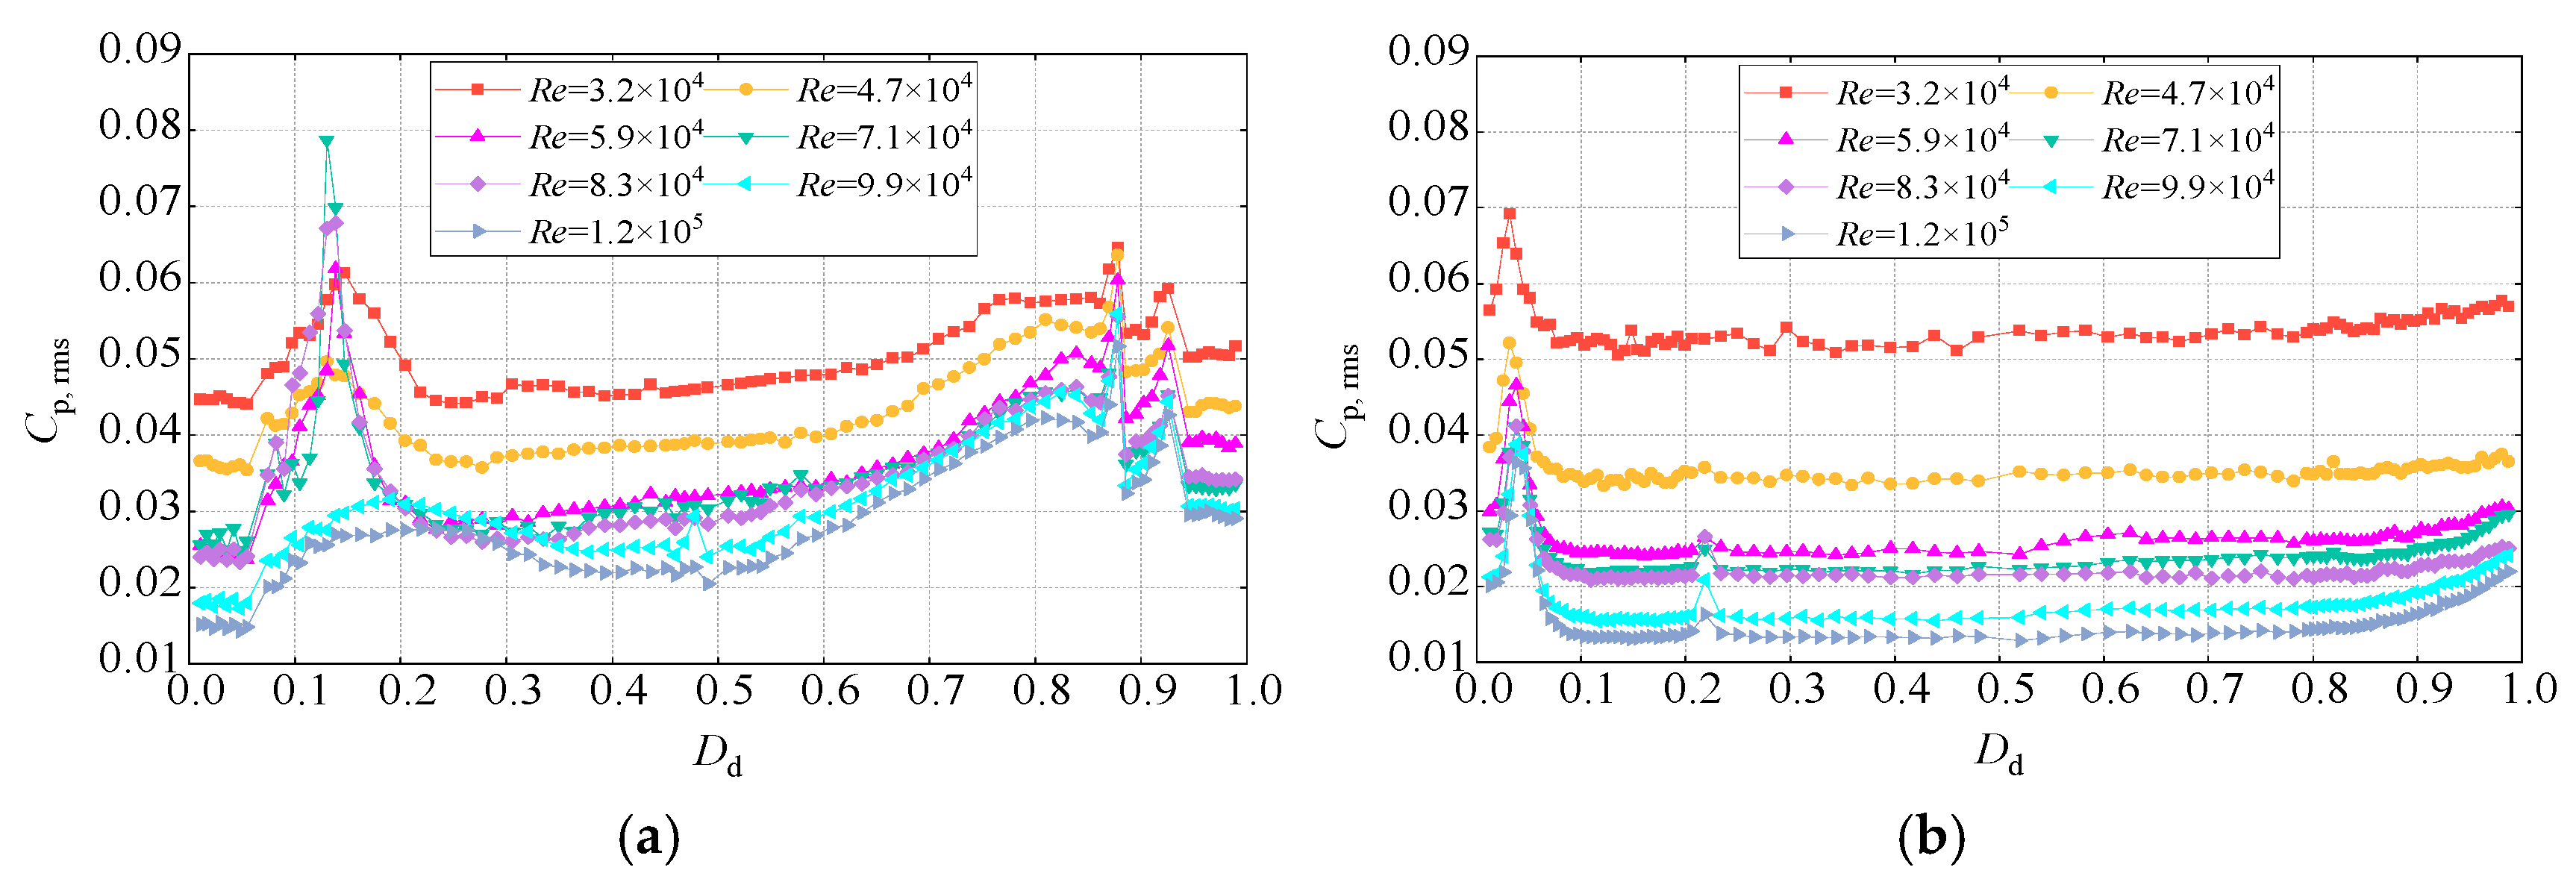
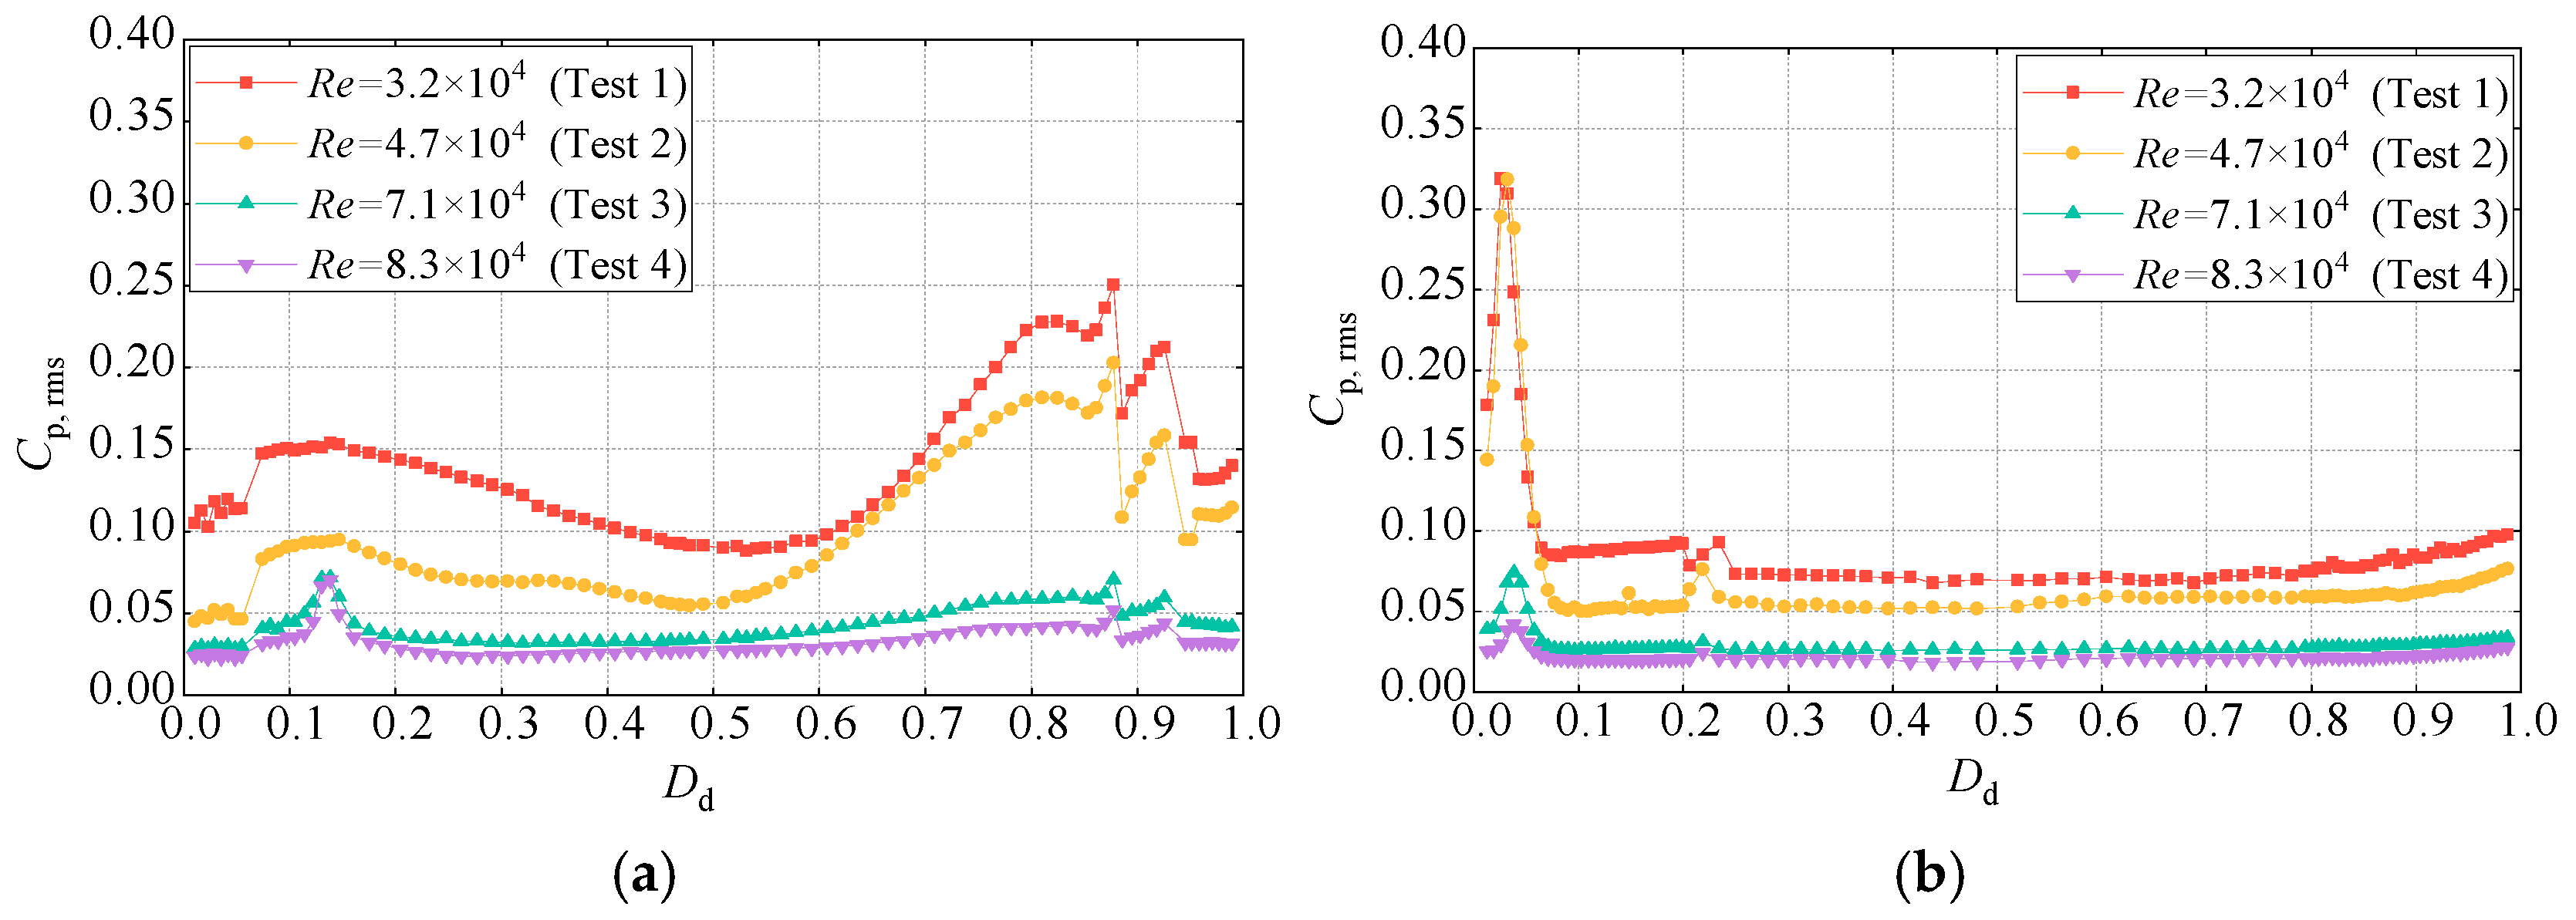
The RMS values of the wind pressure coefficients can reflect the intensity of pressure fluctuations. Figure 6 shows the distributions of the RMS values on the surface of the main beam at different Reynolds numbers.
As shown in Figure 6a, the distribution curves of the RMS values on the upper surface at different Reynolds numbers are similar in shape. At Dd = 0.13, 0.87, and 0.92, Cp,rms reaches its maximum value, indicating that the turbulence induced by the railing enhances the pressure fluctuations. There are differences in the Cp,rms values at different Reynolds numbers. Except for the region where Dd = 0.10–0.17, the Cp,rms decreases with increasing Reynolds number. In the region where Dd = 0.10–0.17, Cp,rms decreases, increases, and then decreases again with increasing Reynolds numbers. The variation amplitude of Cp,rms differs across Reynolds number ranges. For 3.2 × 10⁴ < Re < 5.9 × 10⁴, the variation amplitude is large, reaching 60%, whereas for 5.9 × 10⁴ < Re < 1.2 × 10⁵, the fluctuation amplitude is smaller.
As shown in Figure 6b, the RMS values on the lower surface exhibit a similar trend across different Reynolds numbers. A sharp variation in the RMS values occurs at the junction of the wind nozzle and the lower slanted belly plate. At Dd = 0.03, Cp,rms reaches its maximum value and then decreases. It stabilizes at approximately Dd = 0.08, indicating that the pressure fluctuation is stronger at this junction. There are noticeable differences in the values of Cp,rms in different Reynolds number tests, which decrease as the Reynolds number increases. For 3.2 × 10⁴ < Re < 5.9 × 10⁴, the Cp,rms changes significantly, with the largest decrease of approximately 37%. For 5.9 × 10⁴ < Re < 1.2 × 10⁵, the reduction in Cp,rms is less pronounced.
Overall, the mean values significantly vary along the surface, with different distribution trends for the upper and lower surfaces. Specifically, a sudden change in Cp,mean is observed near the junction between the wind nozzle and the upper deck (Dd = 0.05) on the upper surface, whereas a large negative pressure is observed near the two maintenance vehicle tracks (Dd = 0.22 and 0.79) on the lower surface. The mean values show slight Reynolds number effects in some regions. As the Reynolds number increases, Cp,mean in the Dd = 0.07–0.33 range on the upper surface changes after a Reynolds number of 8.3 × 10⁴. For the lower surface, near the two maintenance vehicle tracks (Dd = 0.22 and 0.79), Cp,mean first decreases and then increases as the Reynolds number increases.
In the regions near the side railings on the upper surface (Dd = 0.13 and 0.87) and near the junction of the wind nozzle and the lower inclined web (Dd = 0.03) on the lower surface, the RMS values of the wind pressure coefficients exhibit significant variation, with higher fluctuation levels. The effects of the Reynolds number on the RMS values are prominent on both the upper and lower surfaces of the main beam. As the Reynolds number increases, Cp,rms generally decreases, with a significant reduction observed in the range of 3.2 × 10⁴ < Re < 5.9 × 10⁴, whereas the decrease is less pronounced in the range of 5.9 × 10⁴ < Re < 1.2 × 10⁵.

4. Reynolds Number Effect on VIV Characteristics and the Underlying Mechanism

4.1. VIV Response

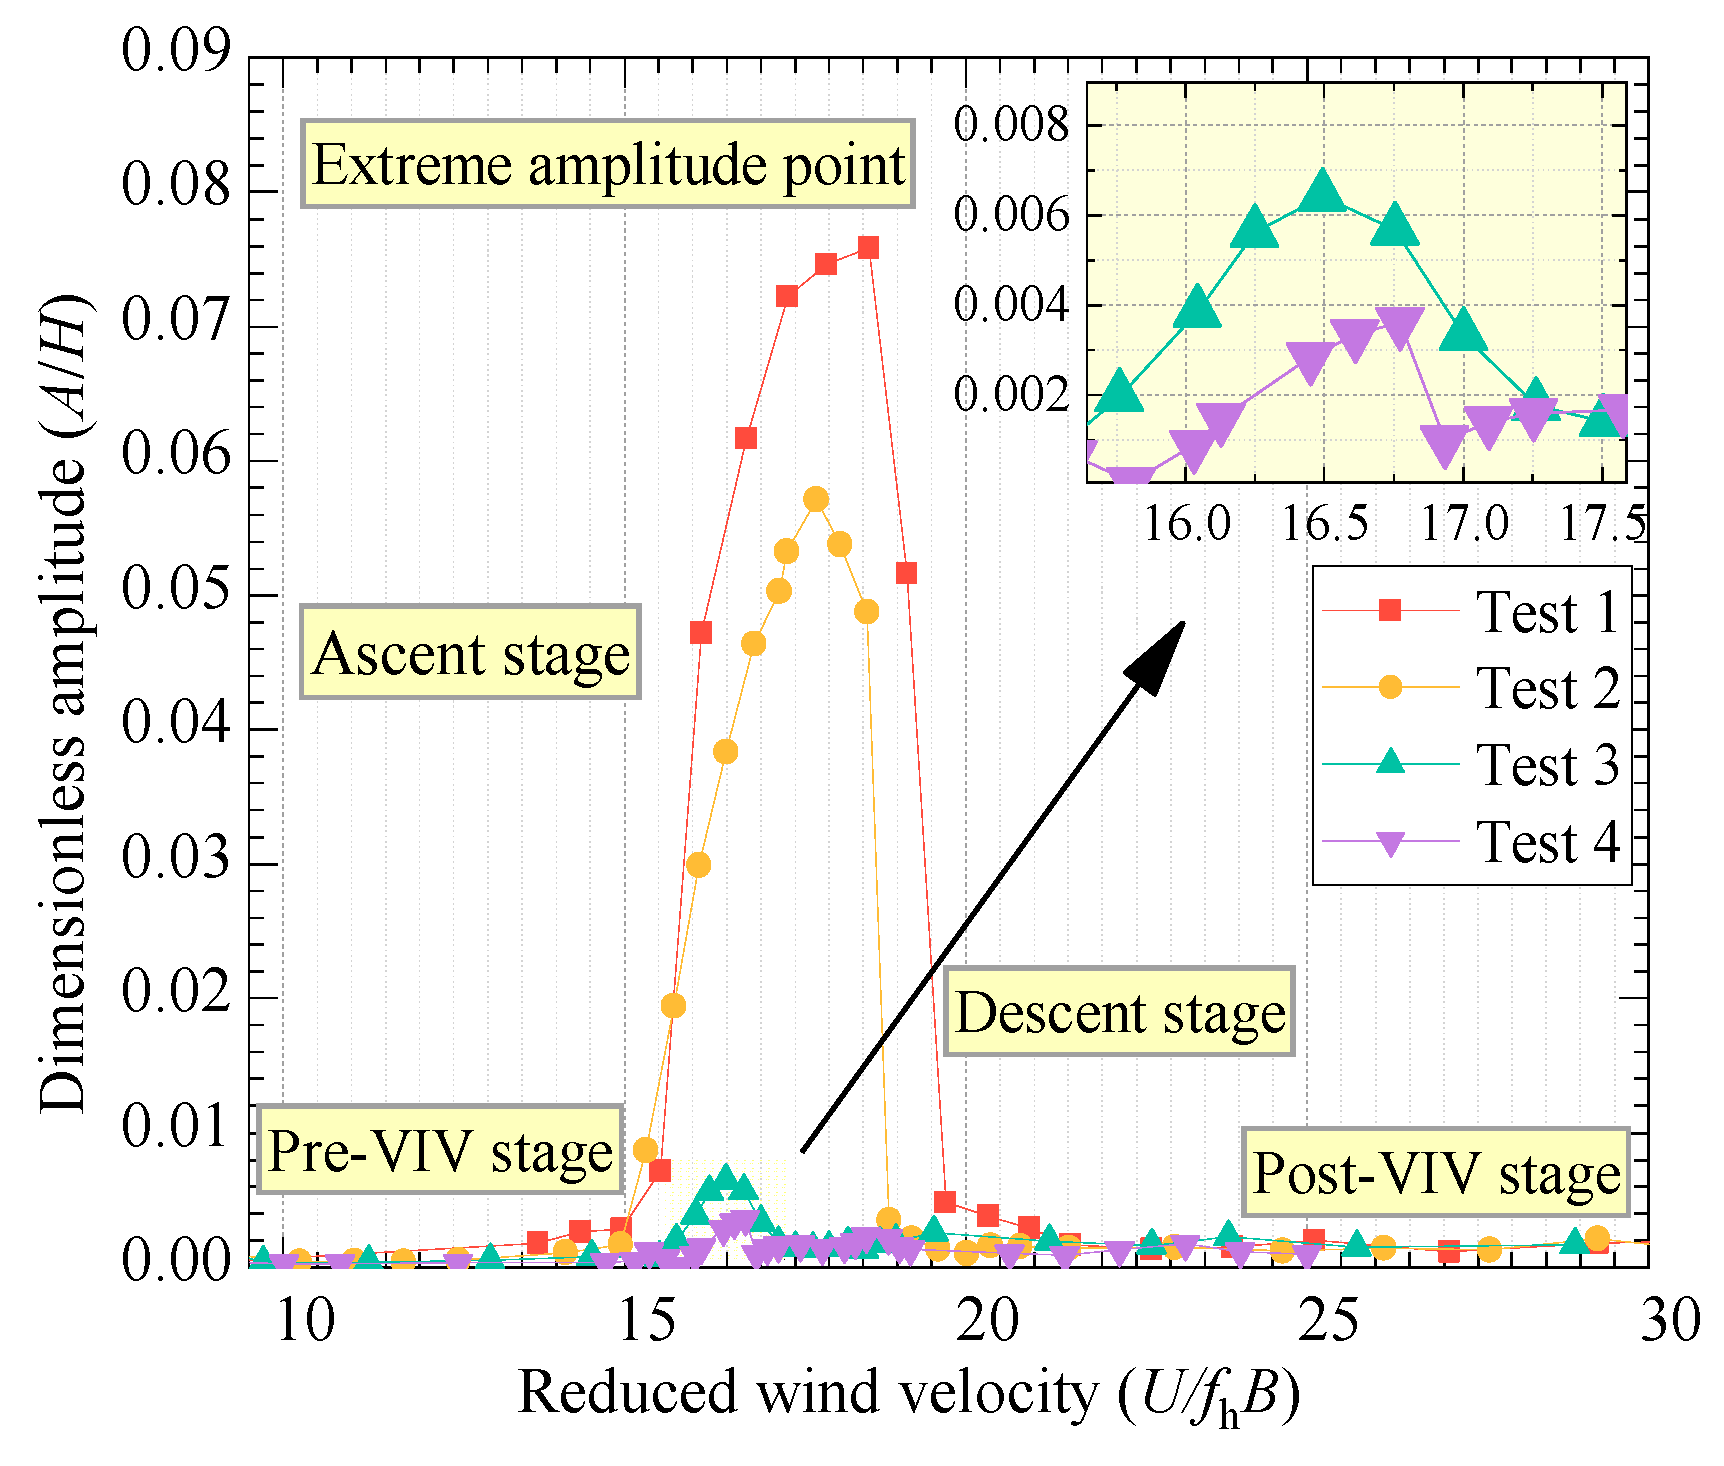
In the four tests with different spring stiffnesses corresponding to four different Reynolds numbers, the variation in the dimensionless VIV amplitude with the dimensionless wind speed is shown in Figure 7. Here, the dimensionless amplitude is defined as A/H, where A is the vertical displacement of the main beam and H is the height of the main beam. The dimensionless wind speed is defined as U/fhB, where fh is the vertical natural frequency and B is the width of the main beam.
Figure 7 shows that in all four tests, the main beam model experienced VIV. In Tests 1 and 2, VIV was more significant, whereas in Tests 3 and 4, VIV was less pronounced. Despite these differences, the VIV process across all tests followed a similar progression, including the pre-VIV stage, the lock-in ascent stage, the extreme amplitude point, the lock-in descent stage, and the post-VIV stage, as shown in the curve for Test 1. Specifically, in these four tests, the onset wind speed, maximum amplitude, wind speed at the maximum amplitude, and lock-in range of VIV varied. In Test 1, the onset wind speed was 14.35 m/s, the stop wind speed was 20.32 m/s, the maximum amplitude was 0.076, and the corresponding wind speed was 18.58 m/s. In Test 2, the VIV was slightly weaker than that in Test 1, with an onset wind speed of 14.94 m/s, a stop wind speed of 18.87 m/s, a maximum amplitude of 0.057, and a corresponding wind speed of 17.81 m/s. In Tests 3 and 4, the maximum amplitudes were 0.006 and 0.004, respectively, which were 0.070 and 0.072 lower than those in Test 1. Overall, in the four tests, the Reynolds numbers corresponding to the maximum VIV amplitudes were 3.2 × 10⁴, 4.7 × 10⁴, 7.1 × 10⁴, and 8.3 × 10⁴, respectively. As the Reynolds number increased, the onset wind speed of VIV increased from 14.35 m/s to 16.03 m/s, the maximum amplitude decreased from 0.076 to 0.004, when Re > 4.7 × 10⁴, the VIV amplitude sharply decreased, and the lock-in range decreased from 14.35–20.32 m/s to 16.03–16.93 m/s. In conclusion, the VIV response of the main beam exhibited a significant Reynolds number effect, with stronger VIV responses at lower Reynolds numbers and weaker responses at higher Reynolds numbers.
Figure 8 shows the vibration amplitude spectra at the maximum amplitude point for the four test cases.
Figure 8 shows that the vibration amplitude spectra exhibit distinct dominant frequencies of 1.93 Hz, 2.98 Hz, 4.57 Hz, and 5.31 Hz, which are close to or equal to the corresponding system’s vertical natural frequencies. The spectra display typical narrowband characteristics, confirming that vertical VIV occurred in the four test cases [45,46,47].

4.2. Time–Frequency Characteristics of Dynamic Aerodynamic Forces

4.2.1. Mean Values of the Wind Pressure Coefficients

Figure 9 shows the mean values of the wind pressure coefficients’ distribution characteristics of the main beam at the Reynolds numbers corresponding to the maximum amplitude in the four test cases, which is similar to the results obtained by Hu et al. [6]. But, there are differences in numerical values, which may be caused by the differences in aerodynamic shape, wind attack angle, and Reynolds number.
As shown in Figure 9, with increasing Reynolds numbers, the mean values on both the upper and lower surfaces of the main beam show no significant changes overall, with only minor differences observed in the upper surface in the region of Dd = 0.59–0.93 and in the lower surface in the region of Dd = 0.22–0.79. A comparison of the mean values from the static and free vibration tests at different Reynolds numbers reveals that both tests exhibit similar distribution characteristics and comparable values. As the Reynolds number increases from 3.2 × 10⁴ to 8.3 × 10⁴, the mean values in both tests do not significantly change. This finding indicates that the main beam’s motion state has a minimal effect on the mean values of the wind pressure coefficients on both the upper and lower surfaces, as well as on their Reynolds number effects.

4.2.2. RMS Values of the Wind Pressure Coefficients

Figure 10 shows the distribution characteristics of the RMS values of the wind pressure coefficients on the surface of the main beam in the free vibration test.
As shown in Figure 10a, the RMS values on the upper surface in the free vibration tests exhibit significant variations across different Reynolds numbers. When Re = 3.2 × 10⁴ and Re = 4.7 × 10⁴, the RMS values on the upper surface exhibit considerable changes, reaching their maxima near the downstream railings. As the Reynolds number increases, Cp,rms decreases. Specifically, from Re = 3.2 × 10⁴ to Re = 4.7 × 10⁴, Cp,rms decreases by a maximum of 0.07, approximately 60%. From Re = 4.7 × 10⁴ to Re = 7.1 × 10⁴, Cp,rms decreases by a maximum of 0.13, approximately 65%, and its spatial distribution characteristics change. When Re = 8.3 × 10⁴, the RMS values are similar to those at Re = 7.1 × 10⁴, with no significant change and relatively small values, remaining below 0.05.
As shown in Figure 10b, the distribution characteristics of Cp,rms on the lower surface across different Reynolds numbers are similar, but the values differ. Near Dd = 0.03, there is a local maximum in Cp,rms. As the dimensionless distance increases, Cp,rms becomes relatively stable. As the Reynolds number increases, Cp,rms on the lower surface decreases. From Re = 3.2 × 10⁴ to Re = 8.3 × 10⁴, at Dd = 0.03, Cp,rms decreases from 0.31 to 0.04, a decrease of 0.27 or approximately 87%. At Dd = 0.48, Cp,rms decreases from 0.07 to 0.02, a reduction of 0.05 or approximately 71%.
Overall, with increasing Reynolds number, the RMS values of the wind pressure coefficients on both the upper and lower surfaces decrease, and their spatial distribution characteristics change. Combined with the variation in VIV with the Reynolds number, the reduction in surface RMS values may be one of the reasons for the weakening of VIV. A comparison between the static and free vibration tests reveals that the RMS distributions differ, with the static test yielding much smaller values than the dynamic tests do. Both static and dynamic tests show a decreasing trend in the RMS values with increasing Reynolds numbers, but the specific variations differ.
In summary, in the free vibration tests, the mean values of the wind pressure coefficients on the main beam surface exhibit a slight Reynolds number effect in certain regions, whereas the RMS values show a significant Reynolds number effect, decreasing with increasing Reynolds numbers, and their distribution characteristics change. The motion state of the main beam has little effect on the mean values and their Reynolds number effects, whereas it has a noticeable effect on the RMS values and their Reynolds number effects. The above studies reveal the influences of the Reynolds number and the motion state on the mean and RMS values of the wind pressure coefficients, which provides a reference for future related research.

4.2.3. Dominant Frequency of Fluctuating Pressure

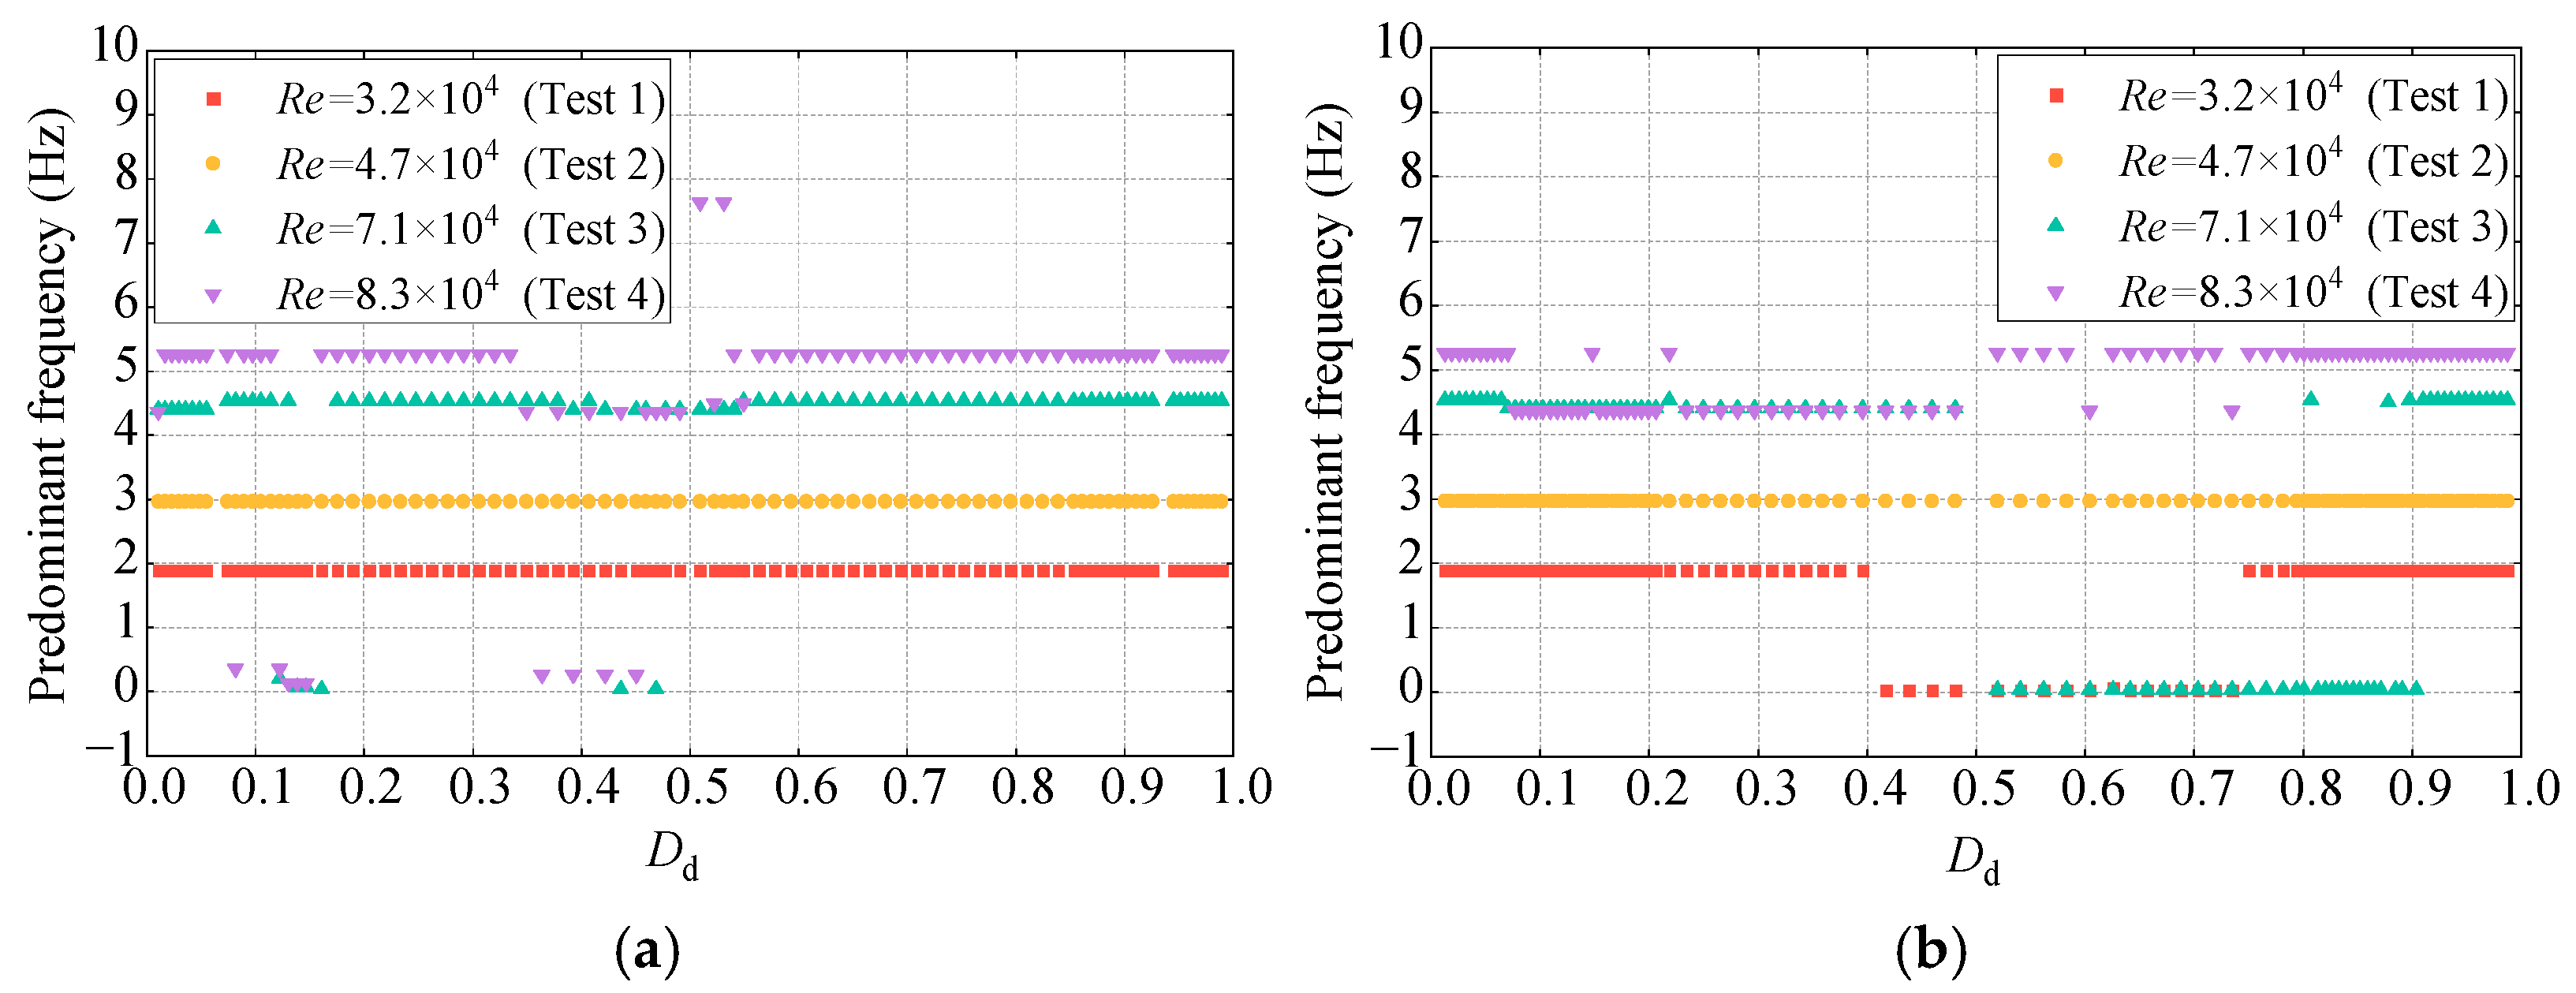
The surface pressure fluctuation spectrum of the main beam reflects the frequency characteristics of the pressure, with the dominant frequency representing the main frequency of the pressure. By comparing the dominant pressure fluctuation frequency at individual measurement points with the dominant vibration frequency of the model, the relationship between local pressure fluctuations and overall vibration can be assessed [37,38,39]. Figure 11 shows a comparison of the distribution characteristics of the dominant frequencies in the pressure fluctuation spectrum at different measurement points on the surface of the main beam during VIV for four different Reynolds number tests.
As shown in Figure 11a, when Re = 3.2 × 10⁴ and 4.7 × 10⁴, the dominant frequencies of the fluctuating pressure at all of the measurement points are nearly the same, matching the vertical VIV frequencies of 1.90 Hz and 2.97 Hz, respectively. However, when Re = 7.1 × 10⁴ and 8.3 × 10⁴, the dominant frequencies at the measurement points differ. At these two Reynolds numbers, the dominant frequencies at most measurement points are 4.53 Hz and 5.27 Hz, respectively, which are consistent with the vibration frequencies observed in the VIV tests of the corresponding Reynolds numbers. However, the dominant frequencies at the measurement points in the upper surface regions of Dd = 0.12–0.15 and Dd = 0.35–0.55 deviate from the VIV frequencies.
As shown in Figure 11b, the dominant frequency of the fluctuating pressure at each measurement point is consistent with the VIV frequency only when Re = 3.2 × 10⁴. For the other Reynolds number tests, the dominant frequencies at most measurement points do not match the VIV frequency.
Overall, the spatial distribution characteristics of the dominant frequencies of fluctuating pressure at each measurement point on the main beam surface differ at different Reynolds numbers. As the Reynolds number increases, the frequencies become more dispersed. This could be a significant reason for the decrease in the VIV amplitude with increasing Reynolds numbers, which is consistent with the conclusion drawn by Cui et al. [40].

4.2.4. Distribution Characteristics of the Wind Pressure Coefficient at the Dominant Frequency

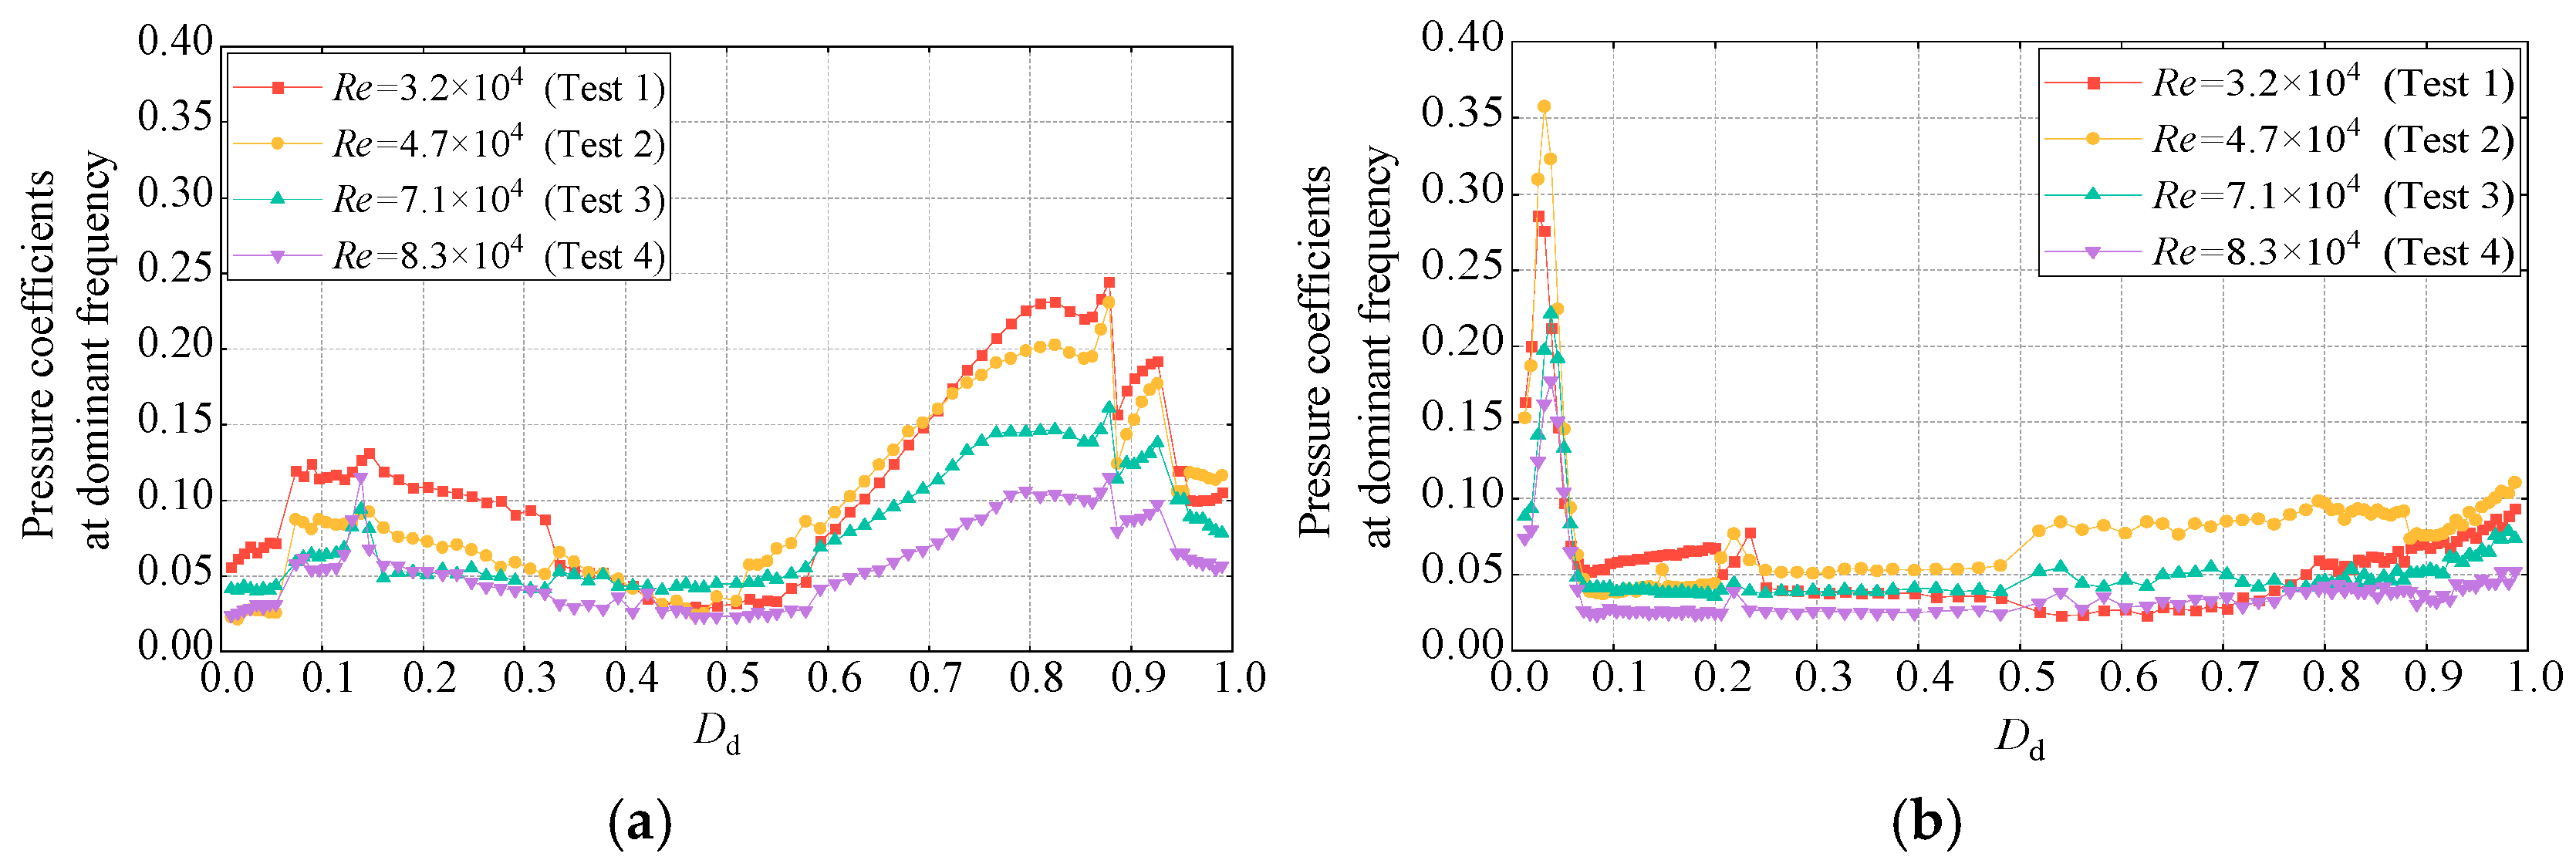
Figure 12 shows the distribution characteristics of the wind pressure coefficient at the dominant frequency on the surface of the main beam.
Figure 12 shows that the distribution characteristics of the wind pressure coefficient at the dominant frequency are similar to those of Cp,rms, but the values differ. This finding suggests that the surface wind pressure on the main beam during VIV may undergo periodic changes at the dominant frequency. As the Reynolds number increases, the wind pressure coefficient at the dominant frequency generally decreases, although the distribution characteristics remain unchanged. When Re = 7.1 × 10⁴ and 8.3 × 10⁴, the wind pressure coefficients at the dominant frequency are significantly greater than Cp,rms, indicating that at high Reynolds numbers, the fluctuations in the VIV of the main beam involve both self-excited forces and forced components, with the forced component suppressing the self-excited force. This may be related to the reduction in the VIV amplitude with increasing Reynolds numbers.

4.2.5. Correlation Coefficient Between the Local Aerodynamic Forces and the Total VIF

The correlation coefficient Ccor,i between the local aerodynamic force at each measurement point on the main beam surface and the total VIF reflects both their frequency and phase characteristics [38] and is defined as
C cor , i = C o v ( F aero ( t ) , p i ( t ) ) D ( F aero ( t ) ) D ( p i ( t ) )
where Ccor,i represents the correlation coefficient between the pressure at the i-th measurement point and the VIF. Faero(t) represents the VIF time history, and pi(t) is the pressure time history at the i-th measurement point. The VIF is obtained through pressure integration. D(Faero(t)) and D(pi(t)) denote the standard deviation of Faero(t) and pi(t), respectively. Cov(Faero(t), pi(t)) denotes the covariance, which can be defined as
C o v ( F aero ( t ) , p i ( t ) ) = E [ ( F aero ( t ) E ( F aero ( t ) ) ) ( p i ( t ) E ( p i ( t ) ) ) ]
where E is the mathematical expectation.
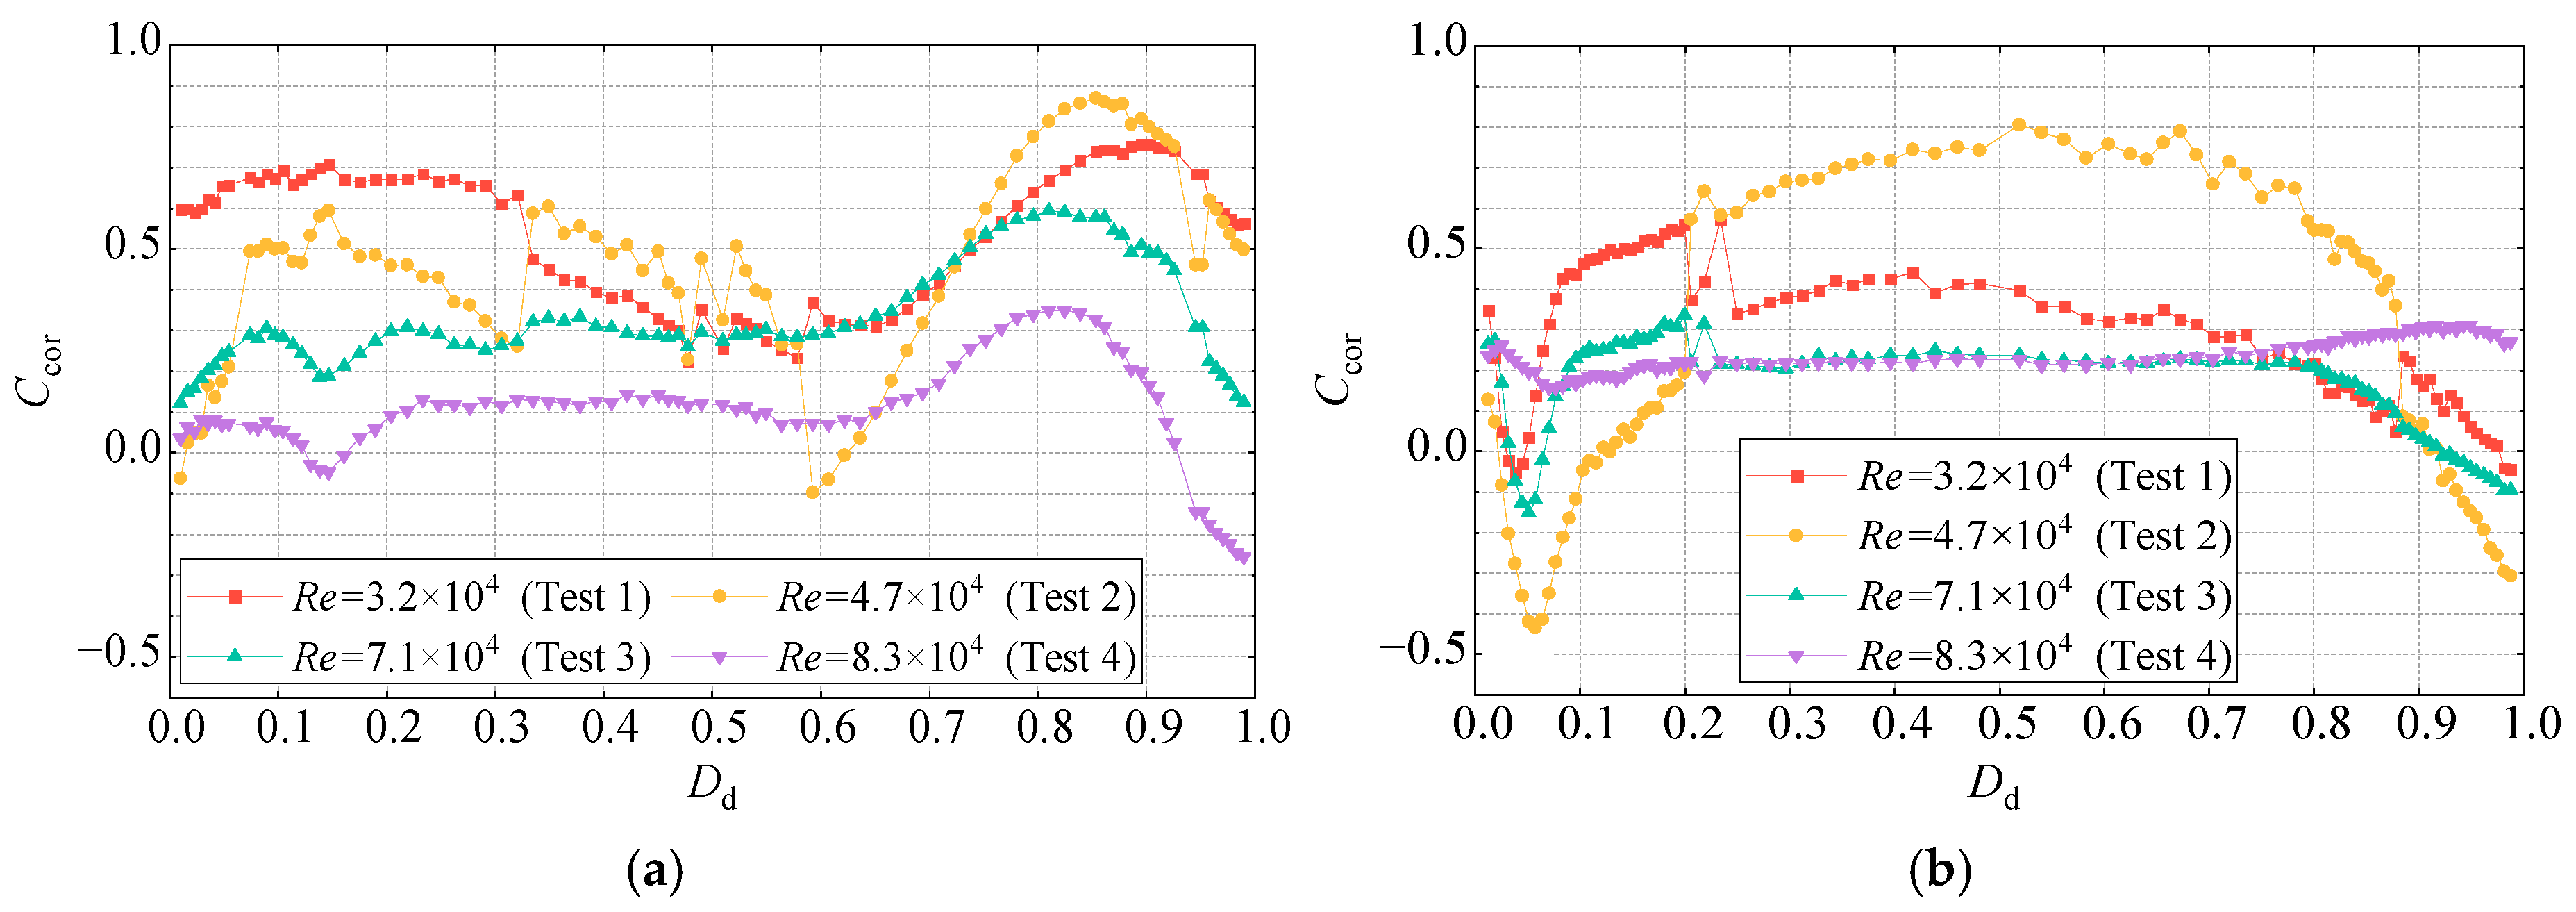
Figure 13 shows the distribution characteristics of the correlation coefficients between the local aerodynamic forces at each measurement point and the total VIF at different Reynolds numbers.
On the basis of Figure 13a, in the range Dd = 0.01–0.64 on the upper surface of the main beam, Ccor exhibits large fluctuations and higher values when Re = 3.2 × 10⁴ and 4.7 × 10⁴. However, when Re = 7.1 × 10⁴ and 8.3 × 10⁴, the Ccor values along the surface change more steadily and are smaller. In the range Dd = 0.64–0.99, the Ccor values for all four Reynolds numbers show an increasing trend followed by a decrease, with the maximum point being at the same location as the maximum point of the upper surface. There are significant differences in the distribution characteristics of the correlation coefficients on the upper surface of the main beam at different Reynolds numbers. Overall, Ccor decreases with increasing Reynolds numbers. For Re = 3.2 × 10⁴ and 7.1 × 10⁴, the correlation is positive over the entire upper surface, indicating that local aerodynamic forces on the upper surface contribute to VIV. Negative correlations are observed for the Dd = 0.59–0.62 region when Re = 4.7 × 10⁴ and the Dd = 0.13–0.16 and Dd = 0.95–0.99 regions when Re = 8.3 × 10⁴, meaning that local aerodynamic forces in these regions suppress VIV.
According to Figure 13b, the distribution characteristics of Ccor on the lower surface of the main beam are similar for Re = 3.2 × 10⁴, 4.7 × 10⁴, and 7.1 × 10⁴. In the Dd = 0.01–0.20 region, Ccor first decreases but then increases. Afterward, Ccor remains relatively stable along the lower surface, decreasing in the Dd = 0.79–0.99 region, with Ccor being negative in parts of the lower slanted belly plate. This finding indicates that in the first three Reynolds number tests, local aerodynamic forces in parts of the lower slanted belly plate suppress VIV. The Ccor values differ significantly across the first three Reynolds number tests. As the Reynolds number increases from 3.2 × 10⁴ to 7.1 × 10⁴, the Ccor values first decrease and then increase in the Dd = 0.01–0.20 region. In the Dd = 0.20–0.88 region, the Ccor values first increase and then decrease, and in the Dd = 0.88–0.99 region, these values first decrease and then increase. Overall, the correlation coefficients between the local aerodynamic forces and the total VIF decrease with increasing Reynolds numbers. When the Reynolds number increases from 7.1 × 10⁴ to 8.3 × 10⁴, the distribution characteristics of Ccor change, becoming positive over the entire lower surface and remaining stable.

4.2.6. Contribution Coefficients of the Local Aerodynamic Forces to the Overall VIF

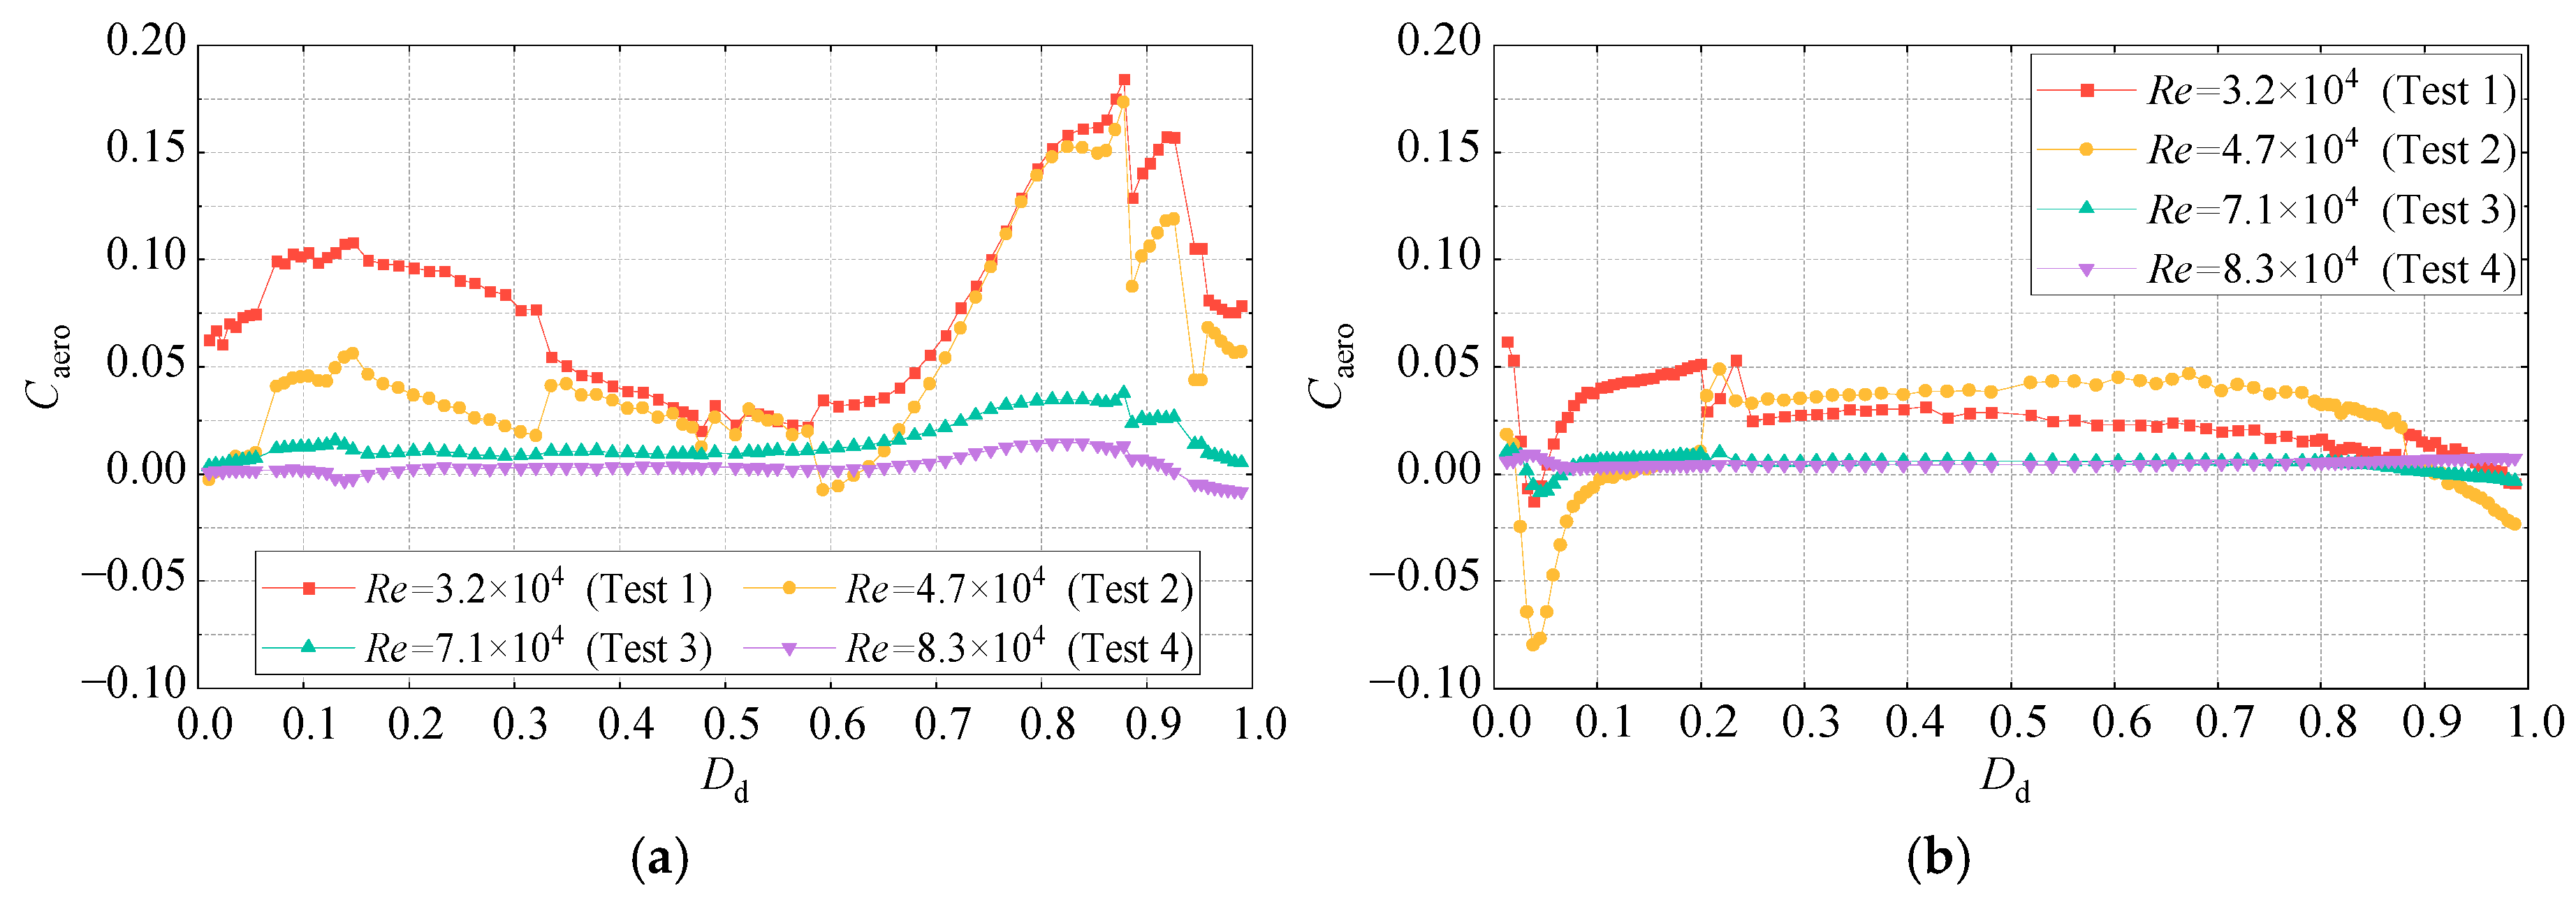
The contribution of the local aerodynamic force at each measurement point on the main beam surface to the VIF is determined by the Cp,rms at each point and the Ccor between the local aerodynamic force and the VIF. The contribution coefficient Caero,i of the local aerodynamic force at each measurement point to the VIF is defined as
C aero , i = C p , rms , i C cor , i
where Cp,rms,i represents the RMS value of the wind pressure coefficients at the i-th measurement point and is obtained from the wind pressure time history analysis, Ccor,i is the correlation coefficient between the local aerodynamic force at the i-th point and the overall VIF, and Caero,i is the contribution coefficient of the local aerodynamic force at the i-th point to the overall VIF. When Caero,i is positive, the local aerodynamic force at the i-th measurement point promotes the VIF. When Caero,i is negative, the local aerodynamic force suppresses the VIF.
Figure 14 shows the distribution characteristics of the contribution coefficients on the surface of the main beam at different Reynolds numbers. As shown in Figure 14a, the contribution coefficients on the upper surface differ across Reynolds numbers. At Re = 3.2 × 10⁴ and 4.7 × 10⁴, the distribution characteristics of Caero are similar in the upstream and downstream regions, showing a trend of first increasing and then decreasing, with relatively large values. For example, at Re = 3.2 × 10⁴, Caero reaches maxima at Dd = 0.15 and Dd = 0.88, with values of 0.11 and 0.18, respectively. At Re = 7.1 × 10⁴ and 8.3 × 10⁴, the distribution characteristics of Caero are similar, with no significant changes and relatively small values. For example, at Re = 7.1 × 10⁴, the maximum Caero occurs at Dd = 0.88, with a value of 0.38. As the Reynolds number increases from 3.2 × 10⁴ to 8.3 × 10⁴, Caero generally decreases, and the distribution characteristics undergo significant changes, indicating a noticeable Reynolds number effect on the contribution coefficients of local aerodynamic forces to the VIF on the upper surface.
As shown in Figure 14b, at Re = 3.2 × 10⁴, the Caero values of the local aerodynamic forces to the VIF on the lower surface of the main beam are predominantly positive. At Re = 4.7 × 10⁴, Caero in the regions Dd = 0.03–0.13 and Dd = 0.92–0.99 is negative, which indicates that the local aerodynamic forces suppress the occurrence of VIV, whereas in other regions, Caero is positive. At Re = 7.1 × 10⁴ and 8.3 × 10⁴, Caero is nearly zero across the entire lower surface, indicating that there is no significant effect on VIV.
There are clear differences in the distribution characteristics of Caero at different Reynolds numbers. At Re = 3.2 × 10⁴, 4.7 × 10⁴, and 7.1 × 10⁴, Caero first decreases and then increases in the Dd = 0.01–0.20 region and decreases in the Dd = 0.79–0.99 region, which is distinct from the distribution at Re = 8.3 × 10⁴. As the Reynolds number increases, the changes in the contribution coefficients become more complex. Overall, the Caero values for Re = 3.2 × 10⁴ and 4.7 × 10⁴ are larger than those for Re = 7.1 × 10⁴ and 8.3 × 10⁴, indicating the presence of Reynolds number effects on the contribution coefficients of local aerodynamic forces to the VIF on the lower surface. On the basis of the analysis of the VIV response, the variation in the contribution coefficients with the Reynolds number may be a key factor responsible for the decrease in the VIV amplitude as the Reynolds number increases.

5. Conclusions

Through wind tunnel static and free vibration tests, the effects of the Reynolds number on the aerodynamic forces and VIV response of a streamlined box girder were studied. The underlying mechanism of the Reynolds number effect on VIV was revealed in conjunction with the time–frequency characteristics of the vibration. The conclusions are as follows.
(1) As the Reynolds number increases from 104 to 1.2 × 10⁵, the static drag coefficient of the streamlined box girder significantly decreases, the lift coefficient slightly increases, and the pitching moment coefficient remains almost unchanged. The mean values of the wind pressure coefficients on the main beam surface exhibit a weak Reynolds number effect in certain regions, primarily in the upper surface area from Dd = 0.07 to 0.33, and at the locations of two maintenance vehicle tracks on the lower surface (Dd = 0.22 and 0.79). The RMS values of the wind pressure coefficients show a significant Reynolds number effect. Overall, both the upper and lower surface RMS values decrease as the Reynolds number increases.
(2) The VIV of the main beam has a significant effect on the Reynolds number. As the Reynolds number increases from 3.2 × 10⁴ to 8.3 × 10⁴, the VIV onset wind speed increases by 1.68 m/s, the maximum vibration amplitude decreases by 0.072, and the lock-in range decreases from 14.35–20.32 m/s to 16.03–16.93 m/s. In the range of 3.2 × 10⁴ < Re < 8.3 × 10⁴, the mean values of the wind pressure coefficients on the upper and lower surfaces of the vibrating main beam are similar to the static results, with both exhibiting a weak Reynolds number effect. Both the dynamic and static RMS values of the wind pressure coefficients on the upper and lower surfaces decrease as the Reynolds number increases; however, there are significant differences in the distribution characteristics and values along the surface.
(3) In free vibration tests, as the Reynolds number increases, the surface RMS values of the wind pressure coefficients of the main beam decrease. The dominant frequencies in the fluctuating pressure amplitude spectra at each measurement point become more dispersed. The correlation coefficients between the aerodynamic forces at each measurement point and the VIF, as well as the contribution coefficients of the aerodynamic forces to the VIF, generally decrease. To varying extents, the aerodynamic time–frequency parameters reveal the underlying reasons for the attenuation of the main beam’s VIV with increasing Reynolds numbers. In this paper, the research on the Reynolds number effect mechanism of VIV characteristics of a streamlined box girder is further improved, which provides a reference for solving practical problems.

Author Contributions

Conceptualization, Q.L.; data curation, B.W. and Y.H.; methodology, Z.L.; writing—original draft, B.W.; writing—review and editing, Y.S. and K.L. All authors have read and agreed to the published version of the manuscript.

Funding

This research was funded by National Natural Science Foundation of China (52408551), Natural Science Foundation of Hebei Province of China (E2022210078, E2024210071), Science and Technology Project of Hebei Education Department (QN2024038), Central Leading Local Science and Technology Development Fund Project (236Z5410G), High-End Talents Project of Hebei Province of China ([2019] 63), S&T Program of Hebei (225676162GH), and Shijiazhuang Tiedao University graduate student innovation funding project (YC202412).

Institutional Review Board Statement

Not applicable.

Informed Consent Statement

Not applicable.

Data Availability Statement

The raw data supporting the conclusions of this article will be made available by the authors on request.

Conflicts of Interest

The authors declare no conflict of interest.

References

  1. Li, J.W.; Wu, P.; Hao, J.M.; Pan, H. Experimental and numerical studies on the two “lock-in” regions characteristic of vertical vortex-induced vibration of Π-shaped composite bridge deck. J. Wind Eng. Ind. Aerodyn. 2022, 228, 105122. [Google Scholar] [CrossRef]
  2. Ge, Y.J.; Zhao, L.; Cao, J.X. Case study of vortex-induced vibration and mitigation mechanism for a long-span suspension bridge. J. Wind Eng. Ind. Aerodyn. 2022, 220, 104866. [Google Scholar] [CrossRef]
  3. Duan, Q.S.; Ma, C.M.; Zhang, T.; Li, Z.G. Vortex-induced vibration characteristic and trigger mechanism of semi-closed streamlined box girder trans-sea bridges. Ocean Eng. 2024, 312, 119053. [Google Scholar] [CrossRef]
  4. Larsen, A. Aerodynamic aspects of the final design of the 1624 m suspension bridge across the great belt. J. Wind Eng. Ind. Aerodyn. 1993, 48, 261–285. [Google Scholar] [CrossRef]
  5. Li, H.; Laima, S.; Ou, J.; Zhao, X.; Zhou, W.; Yu, Y.; Li, N.; Liu, Z. Investigation of vortex-induced vibration of a suspension bridge with two separated steel box girders based on field measurements. Eng. Struct. 2011, 33, 1894–1907. [Google Scholar] [CrossRef]
  6. Hu, C.X.; Zhao, L.; Wang, X.L.; Ge, Y.J. Spatio-temporal distribution of aerodynamic forces and their associated vortex drift patterns around a closed-box girder during torsional vortex-induced vibration. Eng. Struct. 2024, 302, 117459. [Google Scholar] [CrossRef]
  7. Chang, Q.; Fu, Z.; Zhang, S.; Wang, M.; Pan, X. Experimental Investigation of Reynolds Number and Spring Stiffness Effects on Vortex-Induced Vibration Driven Wind Energy Harvesting Triboelectric Nanogenerator. J. Nanomater. 2022, 12, 3595. [Google Scholar] [CrossRef]
  8. Fujino, Y.; Yoshida, Y. Wind-Induced Vibration and Control of Trans-Tokyo Bay Crossing Bridge. J. Struct. Eng. 2002, 128, 1012–1025. [Google Scholar] [CrossRef]
  9. Schewe, G.; Larsen, A. Reynolds number effects in the flow around a bluff bridge deck cross section. J. Wind Eng. Ind. Aerodyn. 1998, 74–76, 829–838. [Google Scholar] [CrossRef]
  10. Corriols, A.S.; Morgenthal, G. Computational Analysis of VIV Observed on Existing Bridges. In Proceedings of the Seventh International Colloquium on Bluff Body Aerodynamics and Applications (BBAA7), Shanghai, China, 2–6 September 2012. [Google Scholar]
  11. Zhao, L.; Cui, W.; Shen, X.; Xu, S.; Ding, Y.; Ge, Y. A fast on-site measure-analyze-suppress response to control vortex-induced-vibration of a long-span bridge. Structures 2022, 35, 192–201. [Google Scholar] [CrossRef]
  12. Li, H.; Laima, S.J.; Jing, H.Q. Reynolds number effects on aerodynamic characteristics and vortex-induced vibration of a twin-box girder. J. Fluids Struct. 2014, 50, 358–375. [Google Scholar] [CrossRef]
  13. Larose, G.; D’auteuil, A. On the Reynolds number sensitivity of the aerodynamics of bluff bodies with sharp edges. J. Wind Eng. Ind. Aerodyn. 2006, 94, 365–376. [Google Scholar] [CrossRef]
  14. Matsuda, K.; Cooper, K.; Tanaka, H.; Tokushige, M.; Iwasaki, T. An investigation of Reynolds number effects on the steady and unsteady aerodynamic forces on a 1:10 scale bridge deck section model. J. Wind Eng. Ind. Aerodyn. 2001, 89, 619–632. [Google Scholar] [CrossRef]
  15. Larsen, A.; Larose, G.L. Dynamic wind effects on suspension and cable-stayed bridges. J. Sound Vib. 2015, 334, 2–28. [Google Scholar] [CrossRef]
  16. Larsen, A.; Wall, A. Shaping of bridge box girders to avoid vortex shedding response. J. Wind Eng. Ind. Aerodyn. 2012, 104–106, 159–165. [Google Scholar] [CrossRef]
  17. Liu, Q.K.; Ma, W.Y.; Liu, X.B. Reynolds number effect on bridge wind engineering. J. Wind Eng. 2014, 39, 340–343. [Google Scholar] [CrossRef]
  18. Schewe, G. Reynolds-number effects in flow around more-or-less bluff bodies. J. Wind. Eng. Ind. Aerodyn. 2001, 89, 1267–1289. [Google Scholar] [CrossRef]
  19. Larose, G.; D’auteuil, A. Experiments on 2D rectangular prisms at high Reynolds numbers in a pressurised wind tunnel. J. Wind Eng. Ind. Aerodyn. 2008, 96, 923–933. [Google Scholar] [CrossRef]
  20. Pires, O.; Munduate, X.; Ceyhan, O.; Jacobs, M.; Snel, H. Analysis of high Reynolds numbers effects on a wind turbine airfoil using 2D wind tunnel test data. J. Phys. Conf. Ser. 2016, 753, 022047. [Google Scholar] [CrossRef]
  21. Lee, S.; Kwon, S.-D.; Yoon, J. Reynolds number sensitivity to aerodynamic forces of twin box bridge girder. J. Wind Eng. Ind. Aerodyn. 2014, 127, 59–68. [Google Scholar] [CrossRef]
  22. Kargarmoakhar, R.; Chowdhury, G.A.; Irwin, A.P. Reynolds number effects on twin box girder long span bridge aerodynamics. Wind Struct. 2015, 20, 327–347. [Google Scholar] [CrossRef]
  23. Laima, S.; Wu, B.; Jiang, C.; Chen, W.; Li, H. Numerical study on Reynolds number effects on the aerodynamic characteristics of a twin-box girder. Wind Struct. 2019, 28, 285–298. [Google Scholar]
  24. Ran, Y.; Chen, W.-L.; Jin, Y.; Li, H.; Gao, D. Reynolds number sensitivity of the aerostatic characteristics of a long-span rail-cum-road bridge girder with three separated boxes. J. Wind Eng. Ind. Aerodyn. 2024, 250, 105776. [Google Scholar] [CrossRef]
  25. Zhao, H.; Yang, Y.; Zhang, Y.; Li, W. Simulation Research on the Effect of Reynolds Number on the Aerodynamic Characteristics of High Lift Device. J. Phys. Conf. Ser. 2022, 2280, 012010. [Google Scholar] [CrossRef]
  26. Wang, Y.; Liu, D.; Xu, X.; Li, G. Investigation of Reynolds Number Effects on Aerodynamic Characteristics of a Transport Aircraft. Aerospace 2021, 8, 177. [Google Scholar] [CrossRef]
  27. Alireza MNavid, G. Experimental investigation of Reynolds number and spring stiffness effects on vortex induced vibrations of a rigid circular cylinder. Eur. J. Mech. B Fluids 2018, 74, 34–40. [Google Scholar]
  28. Wang, R.; Zhang, M. An analytical study on vortex-induced vibrations of cylinders with variable cross-section in the range of low Reynolds numbers. Int. J. Comput. Methods Eng. Sci. Mech. 2024, 25, 45–55. [Google Scholar] [CrossRef]
  29. Kang, Z.; Zhang, C.; Chang, R.; Ma, G. A Numerical Investigation of the Effects of Reynolds Number on Vortex-Induced Vibration of the Cylinders with Different Mass Ratios and Frequency Ratios. Int. J. Nav. Archit. Ocean. Eng. 2019, 11, 835–850. [Google Scholar] [CrossRef]
  30. Gu, J.; Fernandes, A.C.; Sales, J.S. Alternative insight to understand the Reynolds number effects in vortex-induced vibration. Mar. Struct. 2020, 69, 102686. [Google Scholar] [CrossRef]
  31. Zhao, H.; Ding, H.; Wang, C.; Li, K.; Wang, G.; Ren, B. Vortex-induced vibration at low Reynolds numbers: Vortex shedding modes transitions. Ocean Eng. 2023, 288, 115931. [Google Scholar] [CrossRef]
  32. Liu, G.; Song, Z.; Xu, W.; Sha, M. Numerical study on the VIVs of two side-by-side elastically coupled cylinders under different Re and natural frequencies. Ocean Eng. 2023, 284, 115261. [Google Scholar] [CrossRef]
  33. Liu, D.; Wang, Y.; Chen, D.; Peng, X.; Xu, X. Numerical Investigation on the Reynolds Number Effects of Supercritical Airfoil. Procedia Eng. 2012, 31, 103–109. [Google Scholar] [CrossRef]
  34. Ran, Y.; Chen, W.-L.; Jin, Y.; Li, H.; Gao, D. Reynolds number sensitivity of the vortex dynamics around a long-span rail-cum-road bridge girder with three separated boxes. J. Wind Eng. Ind. Aerodyn. 2024, 250, 105785. [Google Scholar] [CrossRef]
  35. Laima, S.; Jiang, C.; Li, H.; Chen, W.; Ou, J. A numerical investigation of Reynolds number sensitivity of flow characteristics around a twin-box girder. J. Wind Eng. Ind. Aerodyn. 2018, 172, 298–316. [Google Scholar] [CrossRef]
  36. Wang, C.; Hua, X.; Feng, Z.; Xiao, H.; Chen, Z.; Zhang, J. Experimental investigation on vortex-induced vibrations of a triple-box girder with web modification. J. Wind Eng. Ind. Aerodyn. 2021, 218, 104783. [Google Scholar] [CrossRef]
  37. Hu, C.; Zhao, L.; Chen, H.; Zhou, Z.; Ge, Y. Reynolds number effects on aerodynamic forces of a streamlined closed-box girder during vortex-induced vibrations. J. Vib. Shock 2019, 38, 118–125. (In Chinese) [Google Scholar]
  38. Hu, C.; Zhao, L.; Ge, Y. Time-frequency evolutionary characteristics of aerodynamic forces around a streamlined closed-box girder during vortex-induced vibration. J. Wind Eng. Ind. Aerodyn. 2018, 182, 330–343. [Google Scholar] [CrossRef]
  39. Xu, F.; Ying, X.; Li, Y.; Zhang, M. Experimental Explorations of the Torsional Vortex-Induced Vibrations of a Bridge Deck. J. Bridg. Eng. 2016, 21, 04016093. [Google Scholar] [CrossRef]
  40. Cui, X.; Li, J.W.; Chen, F.; Liu, J.X. Reynolds number effect on vortex resonance of streamline-like bridge deck section. J. Changan Univ. 2011, 31, 47–51+62. (In Chinese) [Google Scholar]
  41. Lee, B.E. The susceptibility of tests on two-dimensional bluff bodies to incident flow variations. J. Wind Eng. Ind. Aerodyn. 1977, 2, 133–148. [Google Scholar] [CrossRef]
  42. Zheng, Y.F.; Liu, Q.K.; Liu, X.B.; Ma, W.Y. Influence of end state on aerodynamic characteristics of cable segment model. Eng. Mech. 2017, 34 (Suppl. S1), 192–196. (In Chinese) [Google Scholar]
  43. Kubo, Y.; Miyazaki, M.; Kato, K. Effects of end plates and blockage of structural members on drag forces. J. Wind Eng. Ind. Aerodyn. 1989, 32, 329–342. [Google Scholar] [CrossRef]
  44. Bai, H.; Liu, B.X.; Ji, N.C.; Li, J.W. Reasonable size estimation of the binary and plates of a segmental model. J. Vib. Shock 2023, 42, 312–320. (In Chinese) [Google Scholar]
  45. Gabbai, R.; Benaroya, H. An overview of modeling and experiments of vortex-induced vibration of circular cylinders. J. Sound Vib. 2004, 282, 575–616. [Google Scholar] [CrossRef]
  46. Duranay, A.; Demirhan, A.E.; Dobrucali, E.; Kinaci, O.K. A review on vortex-induced vibrations in confined flows. Ocean Eng. 2023, 285, 115309. [Google Scholar] [CrossRef]
  47. Sarpkaya, T. Hydrodynamic damping, flow-induced oscillations, and biharmonic response. J. Offshore Mech. Arctic. Eng. 1995, 117, 232–238. [Google Scholar] [CrossRef]
Figure 1. Diagram of the model and measuring points (unit: mm).
Applsci 15 02202 g001
Figure 2. Schematic diagram of the dimensionless distance.
Applsci 15 02202 g002
Figure 3. Model installation diagram.
Applsci 15 02202 g003
Figure 4. Mean aerodynamic force coefficients of the main beam at different Reynolds numbers. (a) Drag coefficient. (b) Lift coefficient. (c) Pitching moment coefficient.
Applsci 15 02202 g004
Figure 5. Distribution characteristics of the mean values of the wind pressure coefficients at different Reynolds numbers. (a) Upper surface. (b) Lower surface.
Applsci 15 02202 g005
Figure 6. Distribution characteristics of the RMS values of the wind pressure coefficients at different Reynolds numbers. (a) Upper surface. (b) Lower surface.
Applsci 15 02202 g006
Figure 7. VIV amplitude versus the wind speed.
Applsci 15 02202 g007
Figure 8. VIV amplitude spectra for the four test cases. (a) Test 1. (b) Test 2. (c) Test 3. (d) Test 4.
Applsci 15 02202 g008
Figure 9. Distribution characteristics of the mean values of the wind pressure coefficients at different Reynolds numbers. (a) Upper surface. (b) Lower surface.
Applsci 15 02202 g009
Figure 10. Distribution characteristics of the RMS values of the wind pressure coefficients at different Reynolds numbers. (a) Upper surface. (b) Lower surface.
Applsci 15 02202 g010
Figure 11. Distribution characteristics of the dominant frequencies of pressure at different Reynolds numbers at each measurement point. (a) Upper surface. (b) Lower surface.
Applsci 15 02202 g011
Figure 12. Distribution characteristics of the wind pressure coefficient at the dominant frequency at different Reynolds numbers. (a) Upper surface. (b) Lower surface.
Applsci 15 02202 g012
Figure 13. Correlation coefficient distributions between the local aerodynamic forces and the VIF at different Reynolds numbers. (a) Upper surface. (b) Lower surface.
Applsci 15 02202 g013
Figure 14. Contribution coefficient distributions of the local aerodynamic force to the VIF at different Reynolds numbers. (a) Upper surface. (b) Lower surface.
Applsci 15 02202 g014
Table 1. Test parameters of the main beam sectional model.
Parameter NamePrototype ValueSimilitude RatioModel Value
Length, L [m]96.8--2.140
Width, B [m]32.01:301.070
Height, H [m]3.51:300.117
Mass, m [kg·m−1]2.56 × 1041:30228.545
Frequency, f [Hz]0.2451:7.8371.920
Damping ratio, ζ----0.22%
Disclaimer/Publisher’s Note: The statements, opinions and data contained in all publications are solely those of the individual author(s) and contributor(s) and not of MDPI and/or the editor(s). MDPI and/or the editor(s) disclaim responsibility for any injury to people or property resulting from any ideas, methods, instructions or products referred to in the content.