Article

Three-Band Spectral Camera Structure Design Based on the Topology Optimization Method

1
Intelligent Optical Sensing Laboratory, School of Physics and Information Engineering, Fuzhou University, Fuzhou 350108, China
2
Aerospace System Engineering Shanghai, Shanghai 201109, China
3
Luoyang Institution of Electro-Optical Equipment of Avic, Luoyang 471000, China
*
Author to whom correspondence should be addressed.
Appl. Sci. 2025, 15(6), 2974; https://doi.org/10.3390/app15062974
Submission received: 14 January 2025 / Revised: 7 March 2025 / Accepted: 9 March 2025 / Published: 10 March 2025

Abstract

:
The housing and bracket structure are critical components of multispectral cameras; the mechanical properties significantly affect the stability of the optical system and the imaging quality. At the same time, their weight directly impacts the overall load capacity and functional expansion of the device. In this study, the housing and bracket structure of a three-band camera were optimized based on the initial design. Using a combination of density-based topology optimization and multi-objective genetic algorithms in parametric optimization, redundant structures were removed to achieve a lightweight design. As a result, the total weight of the housing and bracket was reduced from 9.56 kg to 5.51 kg, achieving a 42.4% weight reduction. In the optimized structure, under gravity conditions, the maximum deformation along the z-axis did not exceed 7 nm, and the maximum amplification factor in the dynamic analysis was 1.42. The analysis demonstrates that the optimized housing and bracket exhibit excellent dynamic and static performance, meeting all testing requirements, and, under gravitational conditions, the spot diagram and modulation transfer function effect are negligible. Furthermore, in a static environment, the detection range across all spectral bands reaches 18.5 km, satisfying the mission requirements. This optimization design provides a strong reference for the lightweight design of future optical equipment.

1. Introduction

Compared to single-band imaging systems, multi-band imaging systems not only inherit the imaging advantages of multiple single-band optical systems but also capture target features across multiple spectral dimensions, significantly enhancing the spatial situational awareness capabilities [1,2,3]. With unique advantages such as cloud penetration, all-weather operation, and the ability to detect camouflaged targets [4], multi-band imaging systems have been widely applied in military reconnaissance, national defense development, aerial mapping, ground monitoring, environmental regulation, and intelligence gathering [5,6,7,8,9]. However, the implementation of these advanced functions often comes at the cost of increased system complexity and weight, imposing a heavier burden on platforms. A lightweight design is particularly crucial in this regard.
By reducing the weight of the imaging system, it is possible to lower the carrier’s energy consumption, improve the endurance and flexibility, and create valuable space and weight margins for the integration of additional functional components. This enables the incorporation of multi-band modules, higher-resolution sensors, or other advanced measurement devices, further enhancing the system’s performance and multifunctional capabilities. The combination of multi-band imaging systems and a lightweight design not only optimizes the overall efficiency but also enhances their adaptability and competitiveness in harsh environments and complex tasks. With the continuous development of technology and increasing demand, compact and portable multi-band multispectral cameras have emerged. For instance, Ma et al. [10] successfully achieved the simultaneous imaging of visible light and long-wave infrared while ensuring a compact system structure. These instruments are primarily designed to meet the imaging needs of diverse scenarios and applications, especially in complex environments and specific task conditions. The growing demand has driven advancements in both technology and performance requirements. Multi-band spectral cameras not only need an improved spatial resolution but must also adhere to stricter structural design standards [11,12].
In recent years, various optimization methods have been adopted for optical cameras to enhance the design efficiency, becoming a popular focus of research. The lightweight multi-band camera currently primarily employs two methods: topology optimization and parameter optimization [13]. Among the different methods of structural optimization, topology optimization has recently attracted much interest across research teams [14]. However, discrepancies often arise in the weight reduction of the same structure when using these two methods. While parameter optimization provides optimization within an existing framework, topology optimization allows for a more radical redesign, often leading to superior weight savings and structural performance improvements.
Parameter optimization allows the selective optimization of the model based on the given parameters and their value ranges. It can easily lead to globally optimal shape and size solutions for linear and convex problems, but it cannot optimize the topology of the structure [15]. For example, Zhang [16] performed parameter optimization on the thickness of the lens barrel wall, resulting in a significant weight reduction of approximately 33%. Sun et al. [17] optimized the thickness and width of the frame for a wide-format push-broom camera, aiming to minimize the weight. This optimization effectively shifted the natural frequency away from the excitation frequency. Wang et al. [18] achieved a weight reduction rate of 73.8% for a space-reflective mirror through dimensional optimization and material substitution. Song [19] designed a size optimization strategy with the fundamental frequency as the objective function, obtaining the optimal distribution of materials in the support structure of a space multispectral camera, resulting in a configuration with high stiffness and favorable dynamic properties.
On the other hand, topology optimization reduces the material usage while maintaining both the quality and the robustness of the structures [20]. Although topology optimization alters the structure, it effectively enhances the performance by optimizing the material distribution and improving the structural efficiency. Li et al. [21] optimized the flexible vibration-damping support structure of a space camera through topology optimization, targeting the RMS values of random responses. Jia et al. [22] optimized the main load-bearing substrate of a camera through topology optimization, reducing its weight from 36.8 kg to 15.6 kg, achieving a weight reduction rate of 58.2%. Similarly, Guan et al. [23] used topology optimization to refine the main support structure of the optical system in a space camera. After optimization, the first-order natural frequency of the primary support structure increased from 41 Hz to 72 Hz, while its weight decreased by 15%. Lastly, Qu [24] applied topology optimization for the lightweight design of a 300-mm-aperture secondary mirror structure, ensuring that the RMS of each reflective mirror surface met the requirement of being less than 12.6 nm.
In summary, contemporary research primarily focuses on optimizing individual structural components, while studies on the overall load-bearing framework remain relatively scarce. In particular, the structural design of three-band cameras is relatively underexplored, with structural optimization in this domain being even more limited. This underscores the critical need for focused research and development regarding their supporting structures. Moreover, existing optimization methodologies tend to emphasize either topology optimization or parameter optimization, with limited investigation into their interactions. This gap constrains advancements in multispectral camera design, as the integration of these optimization approaches is crucial in achieving more efficient and robust structures. Three-band cameras’ structural optimization remains a key focal point, requiring further exploration to bridge existing gaps and drive innovation in the field.
The purpose of this study is to perform the topology optimization of the overall support structure of a camera to achieve an optimal solution. Using a simulation analysis platform, topology optimization is applied to the housing and support components. For structural components that meet performance requirements but exhibit redundancies, further refinement is conducted through parameter optimization to enhance the design stability and precision. The final design is validated through static and dynamic analyses, as well as imaging tests, confirming its performance and reliability. This study provides a reference for the development of three-band camera structures.

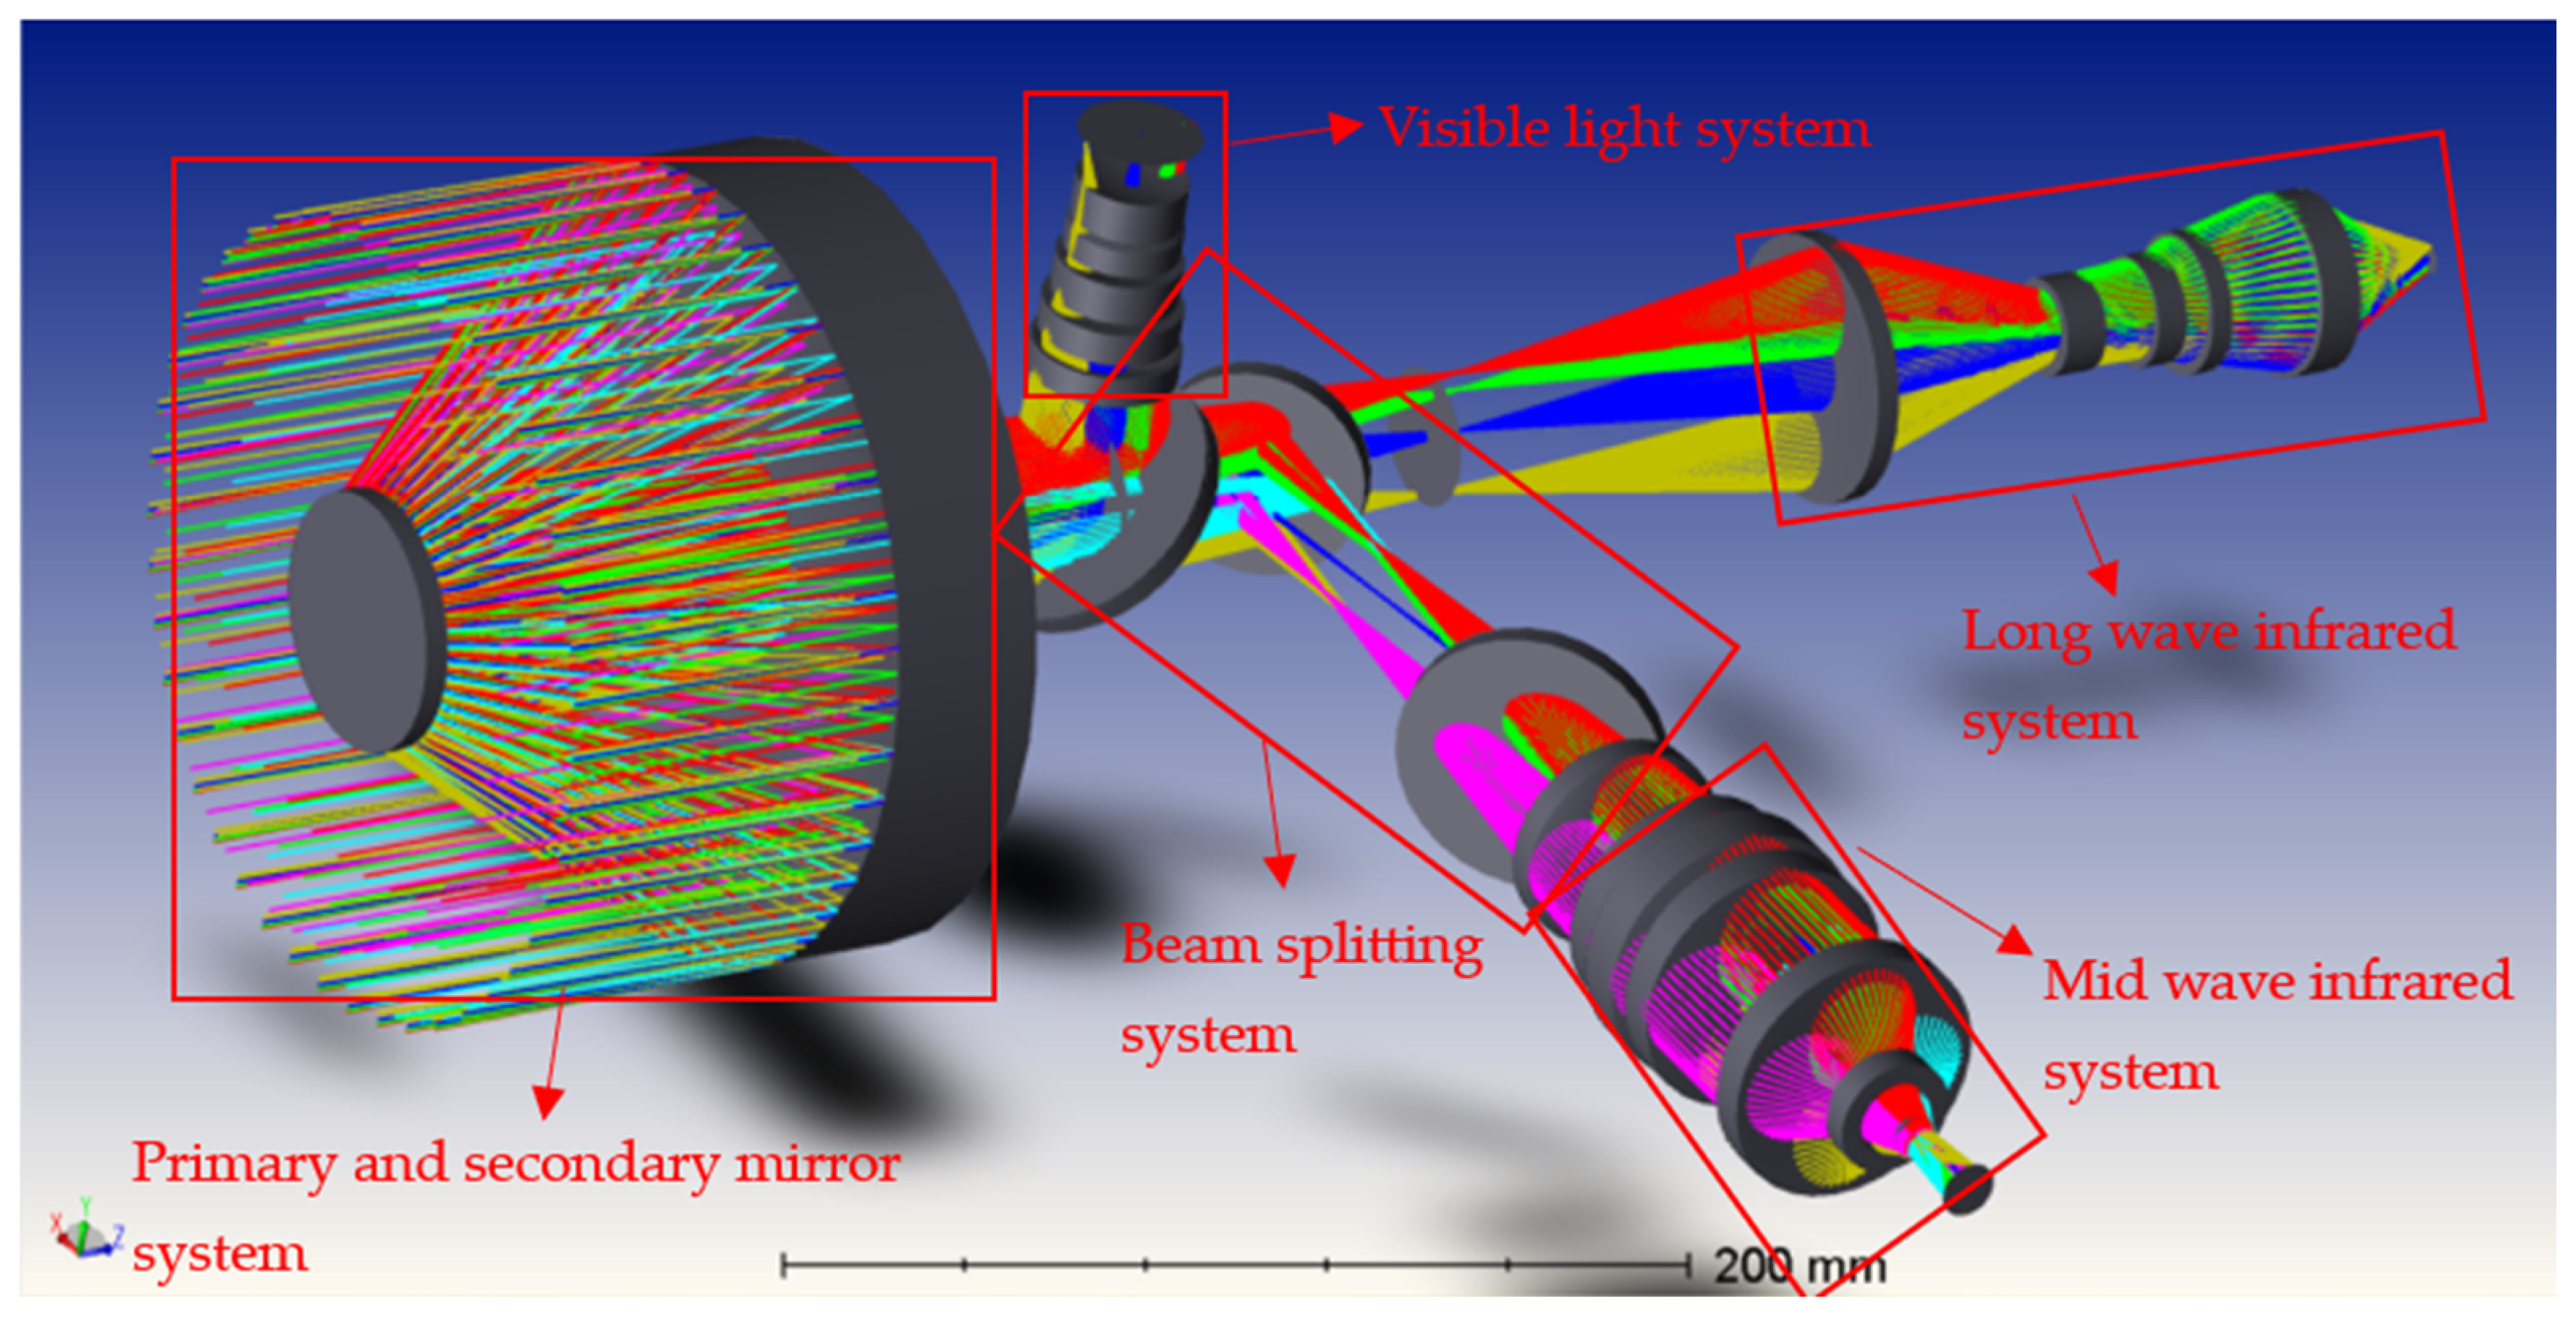
2. Design of Three-Band Structural Components

2.1. Structural Design Requirements

The three-band multispectral camera operates across three spectral ranges: visible light (450–900 nm), mid-wave infrared (3.8–4.8 μm), and long-wave infrared (8–12 μm). To meet the high requirements for assembly accuracy and mechanical stability across these spectral bands, the structural design must ensure that the first-order natural frequency exceeds 100 Hz. During the design process, structural stability and assembly precision must be maintained. To achieve this, the three-band structure is divided into several independent units, adopting a modular design approach that allows each unit to be independently assembled and tested. Once testing is completed, the components are integrated and adjusted as a whole.
To achieve a compact and efficient overall structure for the spectral camera, the optical design employs a common-aperture scheme, integrating imaging technologies for visible light, mid-wave infrared, and long-wave infrared. The optical system is based on an R-C coaxial catadioptric optical design, characterized by a large relative aperture, high throughput, and a shared field of view. As shown in Figure 1, the spectral camera system consists of five optical components: the primary and secondary mirrors, the beam-splitting section, the visible light section, the mid-wave infrared section, and the long-wave infrared section. Light first enters the primary mirror and is reflected onto the secondary mirror. The light is then reflected by the secondary mirror onto the beam-splitting component, which directs the beams separately to the visible light system, the mid-wave infrared optical system, and the long-wave infrared optical system, where the final imaging occurs on the detectors.

2.2. Initial Structural Design

The stability of the structural components plays a decisive role in maintaining the relative positions of the optical components and ensuring the overall imaging quality. Based on the requirements of the initial optical system, an initial structural design was developed, as shown in Figure 2a. The system is divided into five submodule systems, with all five modules connected to the housing by screws, as depicted in Figure 2b. These modules are then secured to the housing through five support legs, as shown in Figure 2c. In Figure 2d, the structural components are labeled as follows: structure D supports the mid-wave infrared system; structures C and B support the beam-splitting system; and structures A and E provide support for the visible light system. The structural material chosen is hard aluminum. The initial weight for the housing is 8.84 kg, and the mass for the support is 0.72 kg, as shown in Figure 2d. The total weight of the initial structure before optimization is 9.56 kg.
Given the small size of the lenses, their mounting method is based on common aerospace practices. Each individual lens is fixed using its own lens barrel with a protruding base on the end face and a retaining ring. During lens installation, an adhesive is applied around the circumference to bond the lens to the frame. The retaining ring is then screwed in place to secure the lens. Each lens is individually mounted as a single lens assembly. To ensure the alignment of the optical axis with the barrel’s axis, centering machining is performed for all lens assemblies. The axial spacing between the optical components is maintained using spacers. Inside the lens barrel, a 0.5-mm-deep adhesive groove is added to ensure that the spatial positions of the optical components remain stable in complex mechanical environments.

2.3. Optimization Method of the Structure

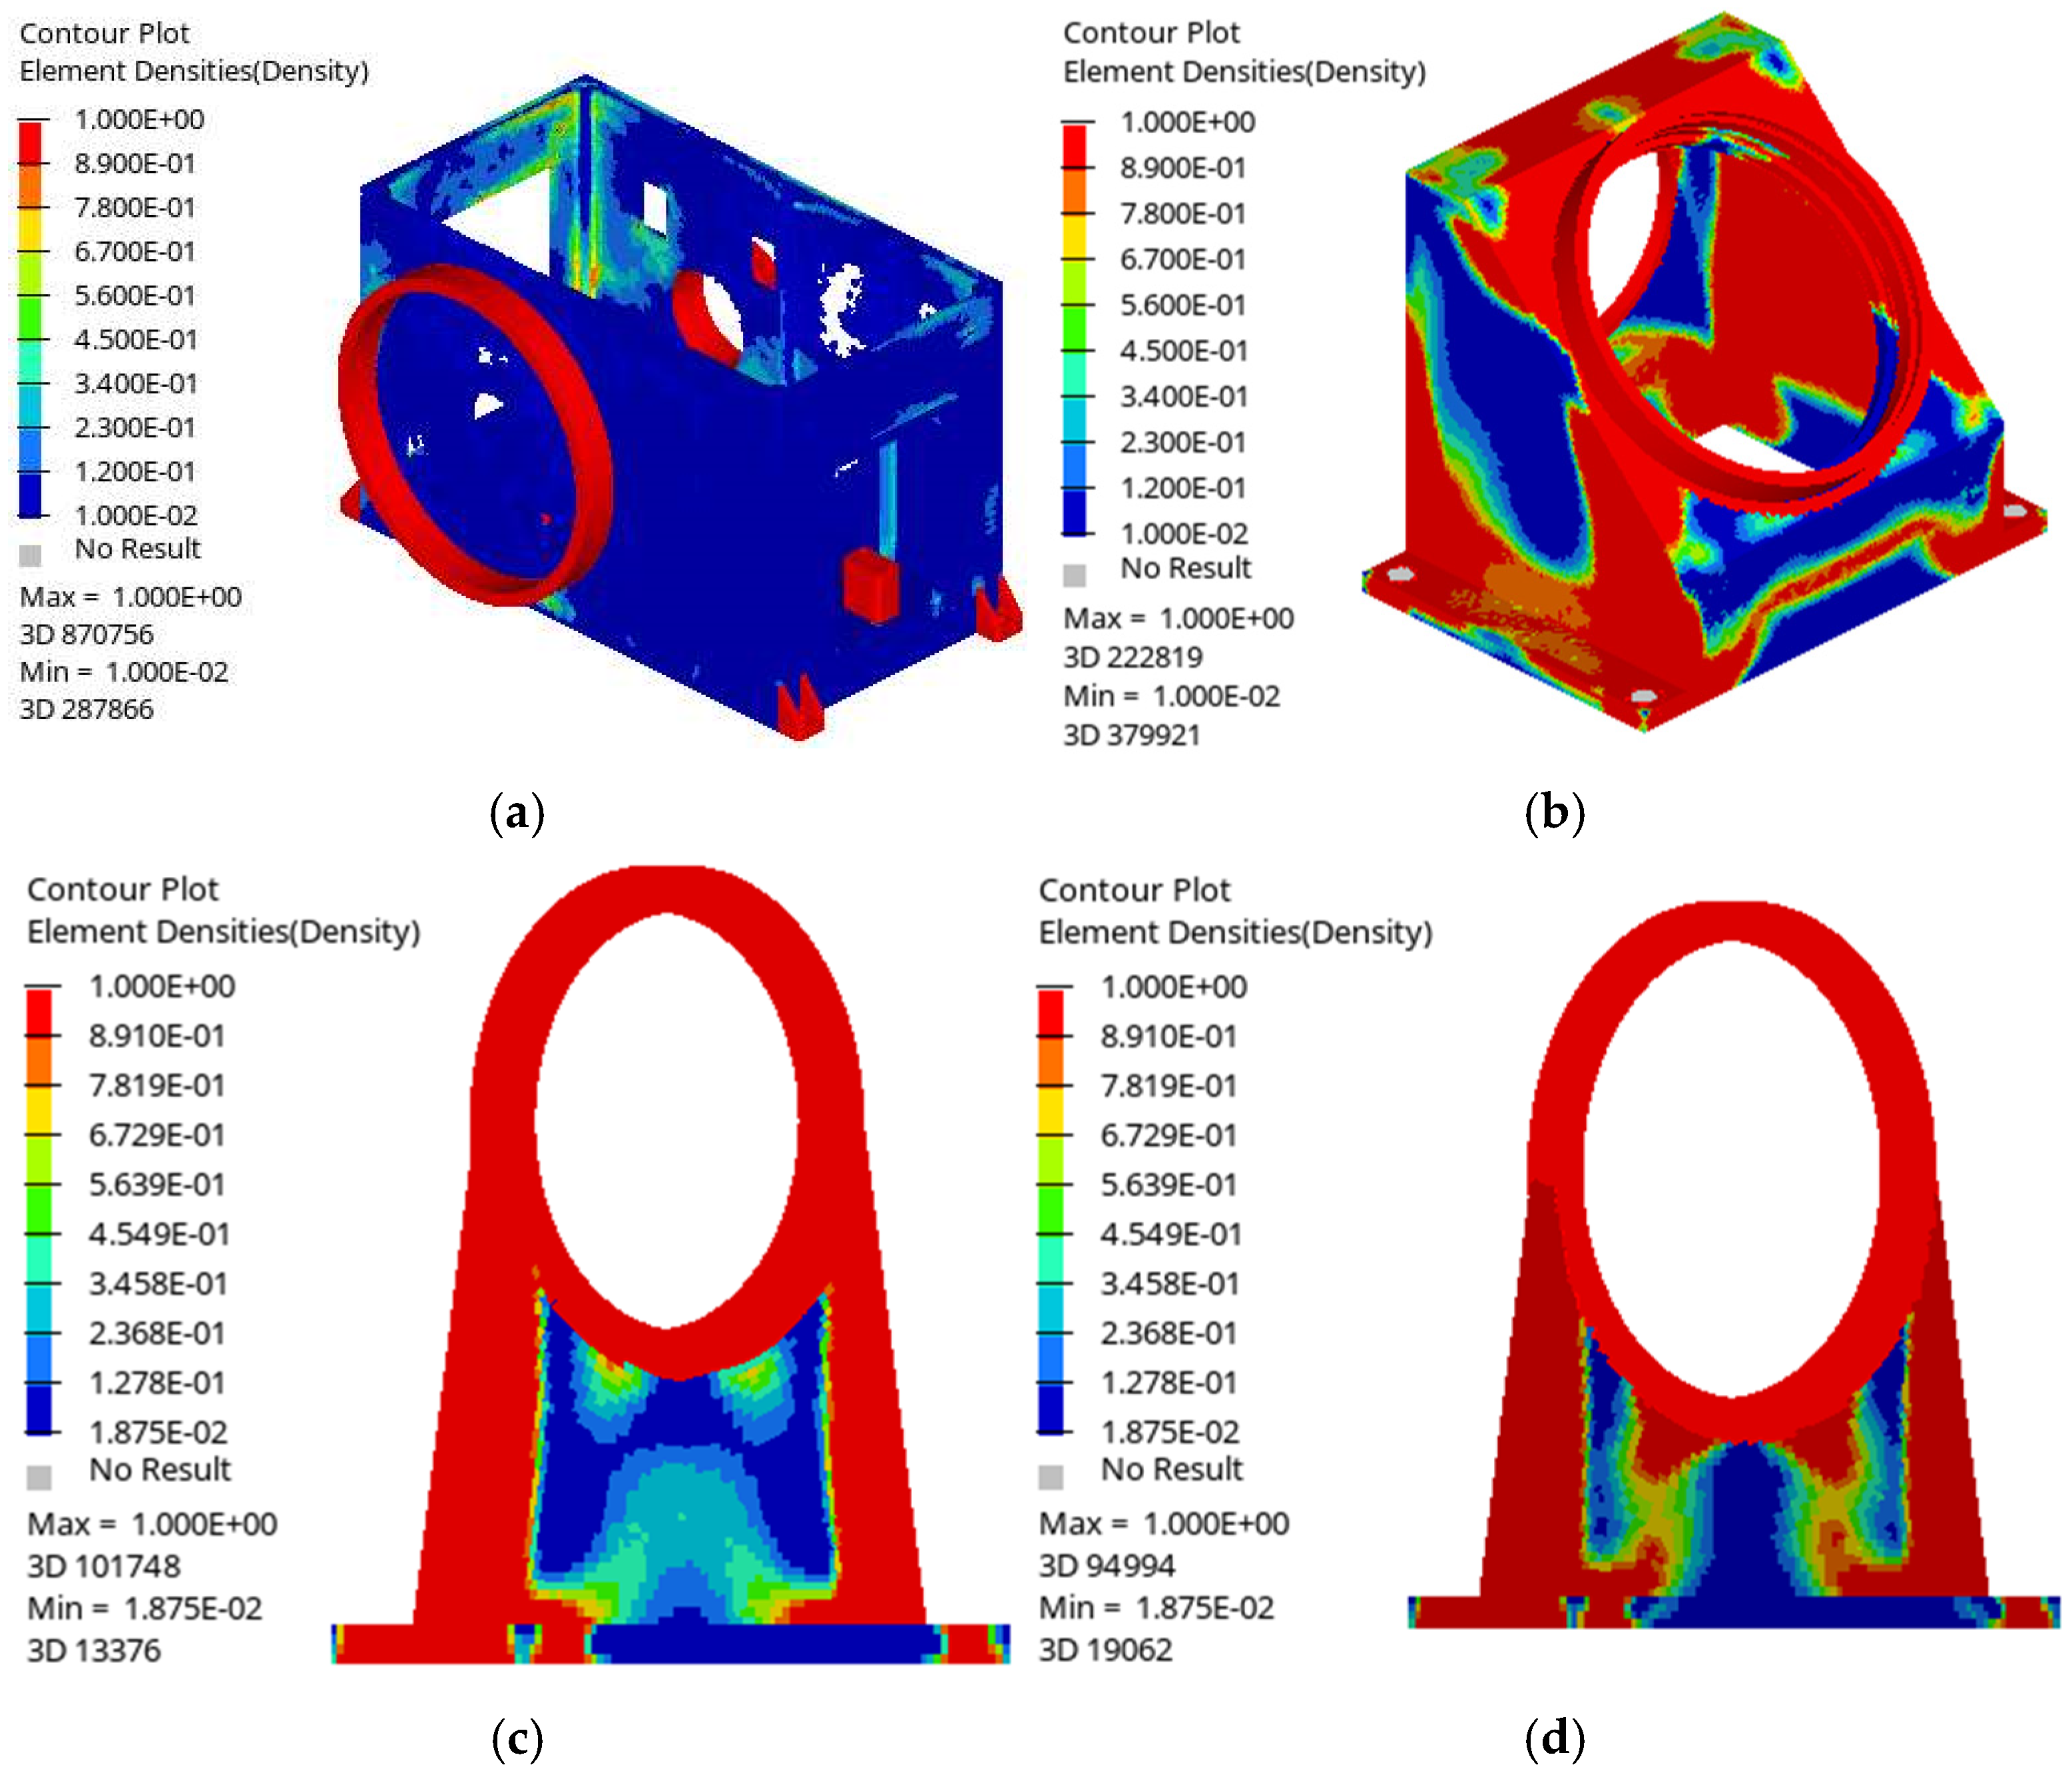
2.3.1. Topology Optimization Method

In the design of the spectral camera, the optimization of the housing and the components carrying the optical lenses is crucial, particularly in terms of the fundamental frequency. By increasing the natural frequency of the housing and supports, resonance with external vibration frequencies can be avoided, ensuring system stability. Therefore, the structural design should focus on material selection and structural reinforcement to improve the rigidity, minimize deformation, and ensure the stability and reliability of the optical system in complex operating environments.
This study adopts the continuum topology optimization method based on a variable density, aiming to achieve a lightweight design for the supporting structure while meeting practical requirements. The optimization design variable is the relative density of the elements [25]. When handling discrete optimization problems, the design variable values for the elements are either 0 or 1. However, by introducing the concept of the relative density, the design variable values for grid elements become continuous within the range of 0 to 1, thereby transforming the problem from discrete to continuous. The variable density method assumes a constant material density and defines the design variable as the element density, converting the problem into a material distribution optimization problem. The mathematical formulation is expressed as
ρ = x ρ 0
where x represents the relative density of each element, ρ 0 is the inherent density of each element, and ρ is the topology design variable. When applying the variable density method to optimize the supporting structure, commonly used interpolation models include the RAMP interpolation model and the SIMP interpolation model, with the SIMP model being the most widely used. The mathematical expression for the SIMP model is
E = ρ p E 0
In the equation, p represents the penalty factor, E is the elastic modulus, and E 0 is the inherent elastic modulus of the material. For 3D structures, the limitation for the penalty factor is expressed as
p max 15 1 v 0 7 5 v 0 , 3 2 1 v 0 1 2 v 0
In the equation, v is the Poisson ratio of the material. Topology optimization based on the SIMP method can be widely applied to various objective function constraint scenarios, such as the maximum eigenvalue problem, minimum compliance problem, and minimum weight problem [26]. Based on the SIMP model, the mathematical formulation of the continuous topology optimization can be expressed as follows:
Find
x = { x 1 , x 2 , x 3 , x n T } R
and minimize
C = F T U
C represents the structural compliance, F is the force vector matrix, and U is the displacement matrix.
Q = y Q 0 = i = 1 n x i Q i Q *
F = K U
0 < x min x i x max 1
K represents the total stiffness matrix of the structure, Q is the optimized structural volume, Q 0 is the initial total volume, and Q * is the maximum allowable material volume in the design. Y represents the optimized volume ratio, while x m i n and x m a x are the minimum and maximum limits of the relative density of the elements, respectively.

2.3.2. Parameter Optimization Method

The parameter optimization adopts the Latin hypercube random sampling method. On this basis, a multiple linear regression model is established. The coefficients of the multiple linear regression equation are analyzed based on the experimental results, and linear regression equations are constructed for each factor and its corresponding responses. The coefficient values of each term represent the contribution of each test factor to the mechanical properties, as well as the sensitivity of dimensional parameters to performance responses [27].
The optimization mathematical model is as follows.
Find
L ( L 1 , L 2 , L 3 , L 4 , L 5 , L 6 , L n )
and minimize
M a s s = M a s s ( L )
subject to
f 1 f
f 1 f L n _ l o w L n L n _ u p , n = r e a l

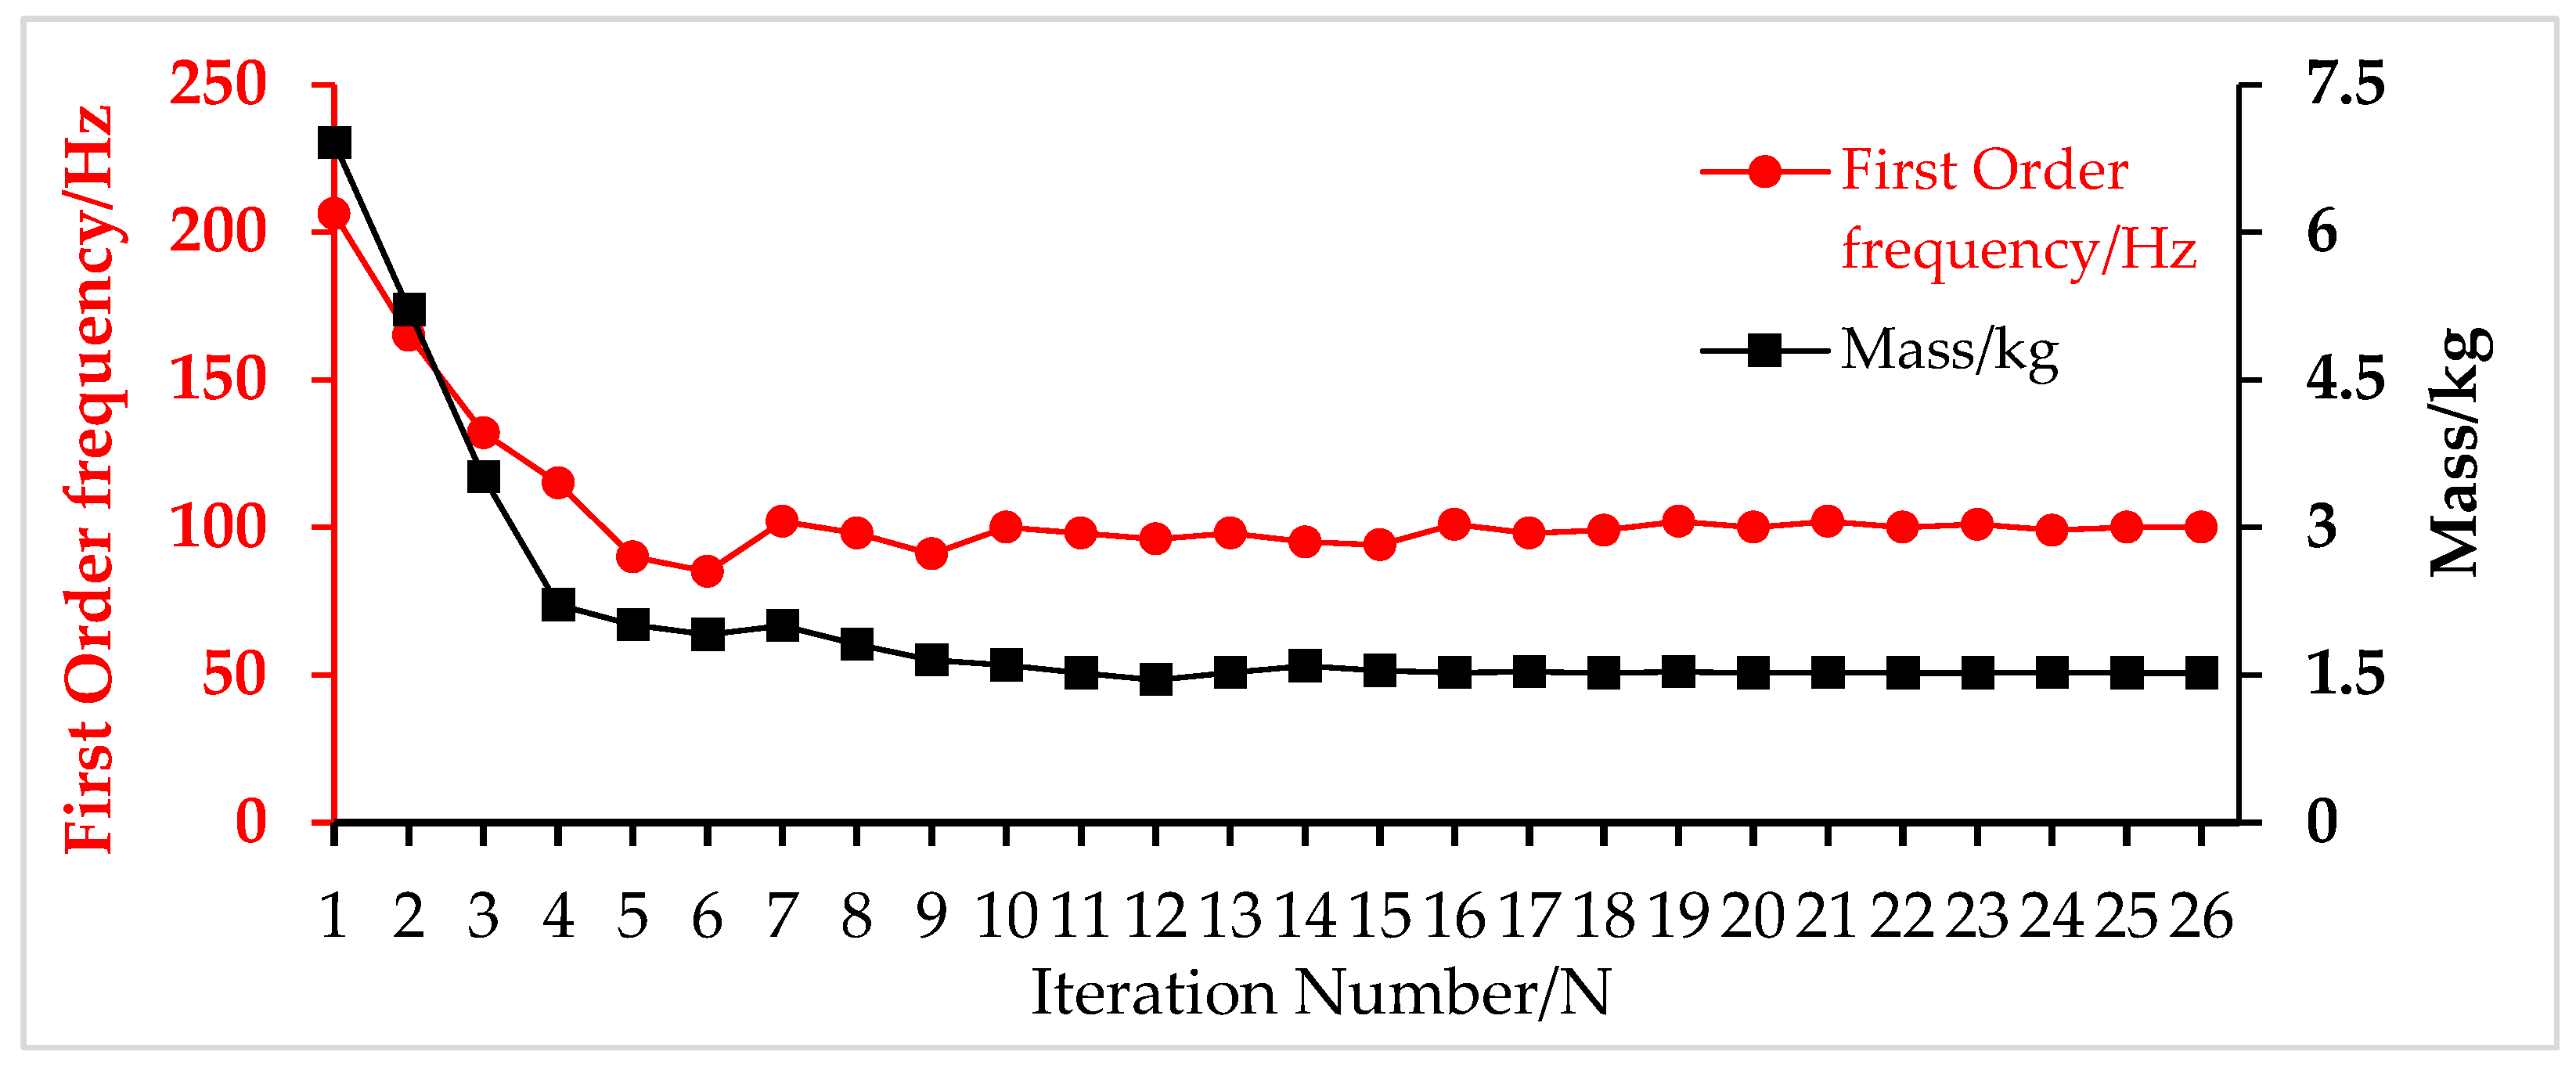
2.4. Optimization Process

In order to maximize the structural performance, this study first uses topology optimization; then, for the redundancies, we further use parameter optimization for the overall process, as shown in Figure 3.

3. Three-Band Optimization Results

3.1. Topology Optimization Results

In this study, OptiStruct was used to optimize the structure, with the first limitation being the first-order natural frequency of 100 Hz, set as the lower limit, since the excitation power tends to be significantly higher under 100 Hz in the working platform, which could lead to resonance. The 100 Hz lower bound is selected to avoid the structural design resonance. Regarding the penalty factor, based on Equation (3), the value is computed. A minimum of 7.5 was selected to ensure stiffness while avoiding excessive material usage. Higher values will over-penalize structural elements, introducing an unnecessary stiffness reduction. In the multispectral camera, a lack of stiffness leads to structural vibrations and misalignment, causing irreversible degradations in the image accuracy. Finally, the minimum mass of the housing was set as the objective. The optimization process, as shown in Figure 4, initially exhibited a rapid decline in both the mass and first-order natural frequency, followed by gradual stabilization, and it converged after 26 iterations. The first-order natural frequency (red curve) decreased sharply from around 200 Hz to approximately 100 Hz within the first few iterations before stabilizing, while the mass (black curve) was reduced from around 7 kg to approximately 1.5 kg, demonstrating the effectiveness of the optimization in reducing the weight. The final optimization model, without surface skin treatment, achieved a first-order natural frequency close to 100 Hz and a mass of approximately 1.5 kg. However, to meet the requirements for light shielding and dust protection, a 0.5 mm skin was added to the external surface of the housing, ensuring functionality while maintaining structural integrity.
Structures A, B, C, D, and E were individually optimized for minimum compliance, and the objective function converged after 12, 10, 8, 9, and 12 iterations, respectively. Key components, such as the inner diameter for the mounting lenses and the areas around the screws, were designated as non-design domains. The final density distribution, as shown in Figure 5, was determined after optimization. For material elements with densities approaching zero, the deformation or response to external forces or stimuli was minimal, so these elements were removed. Conversely, elements with higher densities that contributed more significantly to the structural performance were retained.
Optimization involves removing low-stress regions or materials that contribute little to load transfer and are not significantly relevant to key functions. These regions, for instance, do not participate in load bearing, stability, or other critical functions and have minimal contributions to the stiffness. Optimization achieves lightweighting by retaining the primary load paths, stress balance, stiffness, and functional integrity. As a result, it has a minimal impact on other performance indicators, such as strength and stiffness. The performance indicators before and after optimization are compared in Table 1. Although the first-order frequency decreased slightly, the first-order natural frequencies of both the housing and the support structure remained above the 100 Hz threshold. The optimization achieved a weight reduction of 42.5% for the housing and 30.6% for the support structure, resulting in an overall weight reduction of 41.6%. While the deformation in the Z-direction under gravity conditions increased in the static analysis, the mechanical performance remained stable overall, meeting the design requirements.

3.2. Parameter Optimization Results

To eliminate redundant mass during topology optimization, methods such as rib reinforcement and hole design are commonly used. However, the topology optimization results often fail to fully meet practical design requirements. Based on the original topology optimization, the structure was parameterized, with parameters such as the thickness and diameter being further optimized. After the skinning treatment in topology optimization, preliminary analysis and verification showed that the inherent fundamental frequency of the housing was around 126 Hz. Although this frequency is close to some external vibration frequencies, the rigid design of the housing was proven to sufficiently meet the vibration resistance requirements of the system. Additionally, the external excitation energy within the 126 Hz frequency range was relatively low, meaning that its impact on the overall system’s performance was limited. Thus, no further optimization of the housing was necessary.
For the support structure, its inherent fundamental frequency was designed to far exceed the requirements, reaching approximately 500 Hz. To further enhance the lightweight performance of the system, the support structure underwent parameter optimization to reduce its mass while ensuring its load-bearing capacity and structural stability. This ultimately achieved an optimized balance between overall system performance and weight, improving the comprehensive performance of the multispectral camera.
In the optimization design of optical–mechanical structural parameters, the number of parameters is relatively large. Including all of them as design variables in the optimization model would make the optimization process overly complex, create difficulties in convergence, and significantly increase the computational workload, thereby affecting the overall efficiency and accuracy. Therefore, it is necessary to screen the most important design variables. The selected design variables should not affect the original structure while influencing the optimization objectives, such as the mass and fundamental frequency. As shown in Figure 6, L1 and L2 represent the thickness dimensions of the support modules in the optical system. L3 and L4 refer to the thickness and outer diameter of the support module plates for the small semi-transparent and semi-reflective components in the beam-splitting system. L5 and L6 represent the outer diameter and thickness dimensions of the support module plates for the large semi-transparent and semi-reflective components in the beam-splitting system. L7 and L8 correspond to the outer diameter and thickness dimensions of the support modules for the mid-wave infrared system’s lens barrel. By setting these as variables, targeted parameter optimization can be performed. Combining this approach with multi-objective optimization methods improves both the efficiency and feasibility of the optimization results [28]. As shown in Figure 7, the sensitivity analysis indicates that the eight selected parameters have a certain influence on both the mass and the fundamental frequency.
For the parameters subjected to structural optimization, the Latin hypercube sampling method was adopted to generate the initial 86 sample data. Subsequently, these samples were optimized.
The minimum first-order natural frequency of 200 Hz is set as the lower limit. Currently, a series of relatively mature and reliable solutions have been developed for multi-objective optimization problems, including algorithms such as the Multi-Island Genetic Algorithm, the Neighborhood Cultivation Multi-Objective Genetic Algorithm, and the Non-Dominated Sorting Genetic Algorithm (NSGA), among others [29,30,31]. In this study, the MOGA variant of the second-generation Non-Dominated Sorting Genetic Algorithm (NSGA-II) was applied to solve the optimization problem of the dimensional parameters. Using the MOGA algorithm in ANSYS 2024, the model reached convergence after 13 iterations, as shown in the iteration process in Figure 8. Table 2 presents the upper and lower limits of L1-L8 along with the optimized optimal dimensions. Compared to the optimization results, the thickness of the visible light supports, L1 and L2, was reduced to 1.6 mm and 4.1 mm, respectively, while the outer diameters of L4, L5, and L7 increased slightly. The thicknesses of the plate-type supports, L3, L6, and L8, were reduced to 3.1 mm, 3 mm, and 3.1 mm, respectively. Additionally, Table 3 lists the performance metrics before and after optimization. Although the first-order frequency decreased slightly, it still remained above 100 Hz. The structure achieved a total weight reduction of 40.3% based on topology optimization.

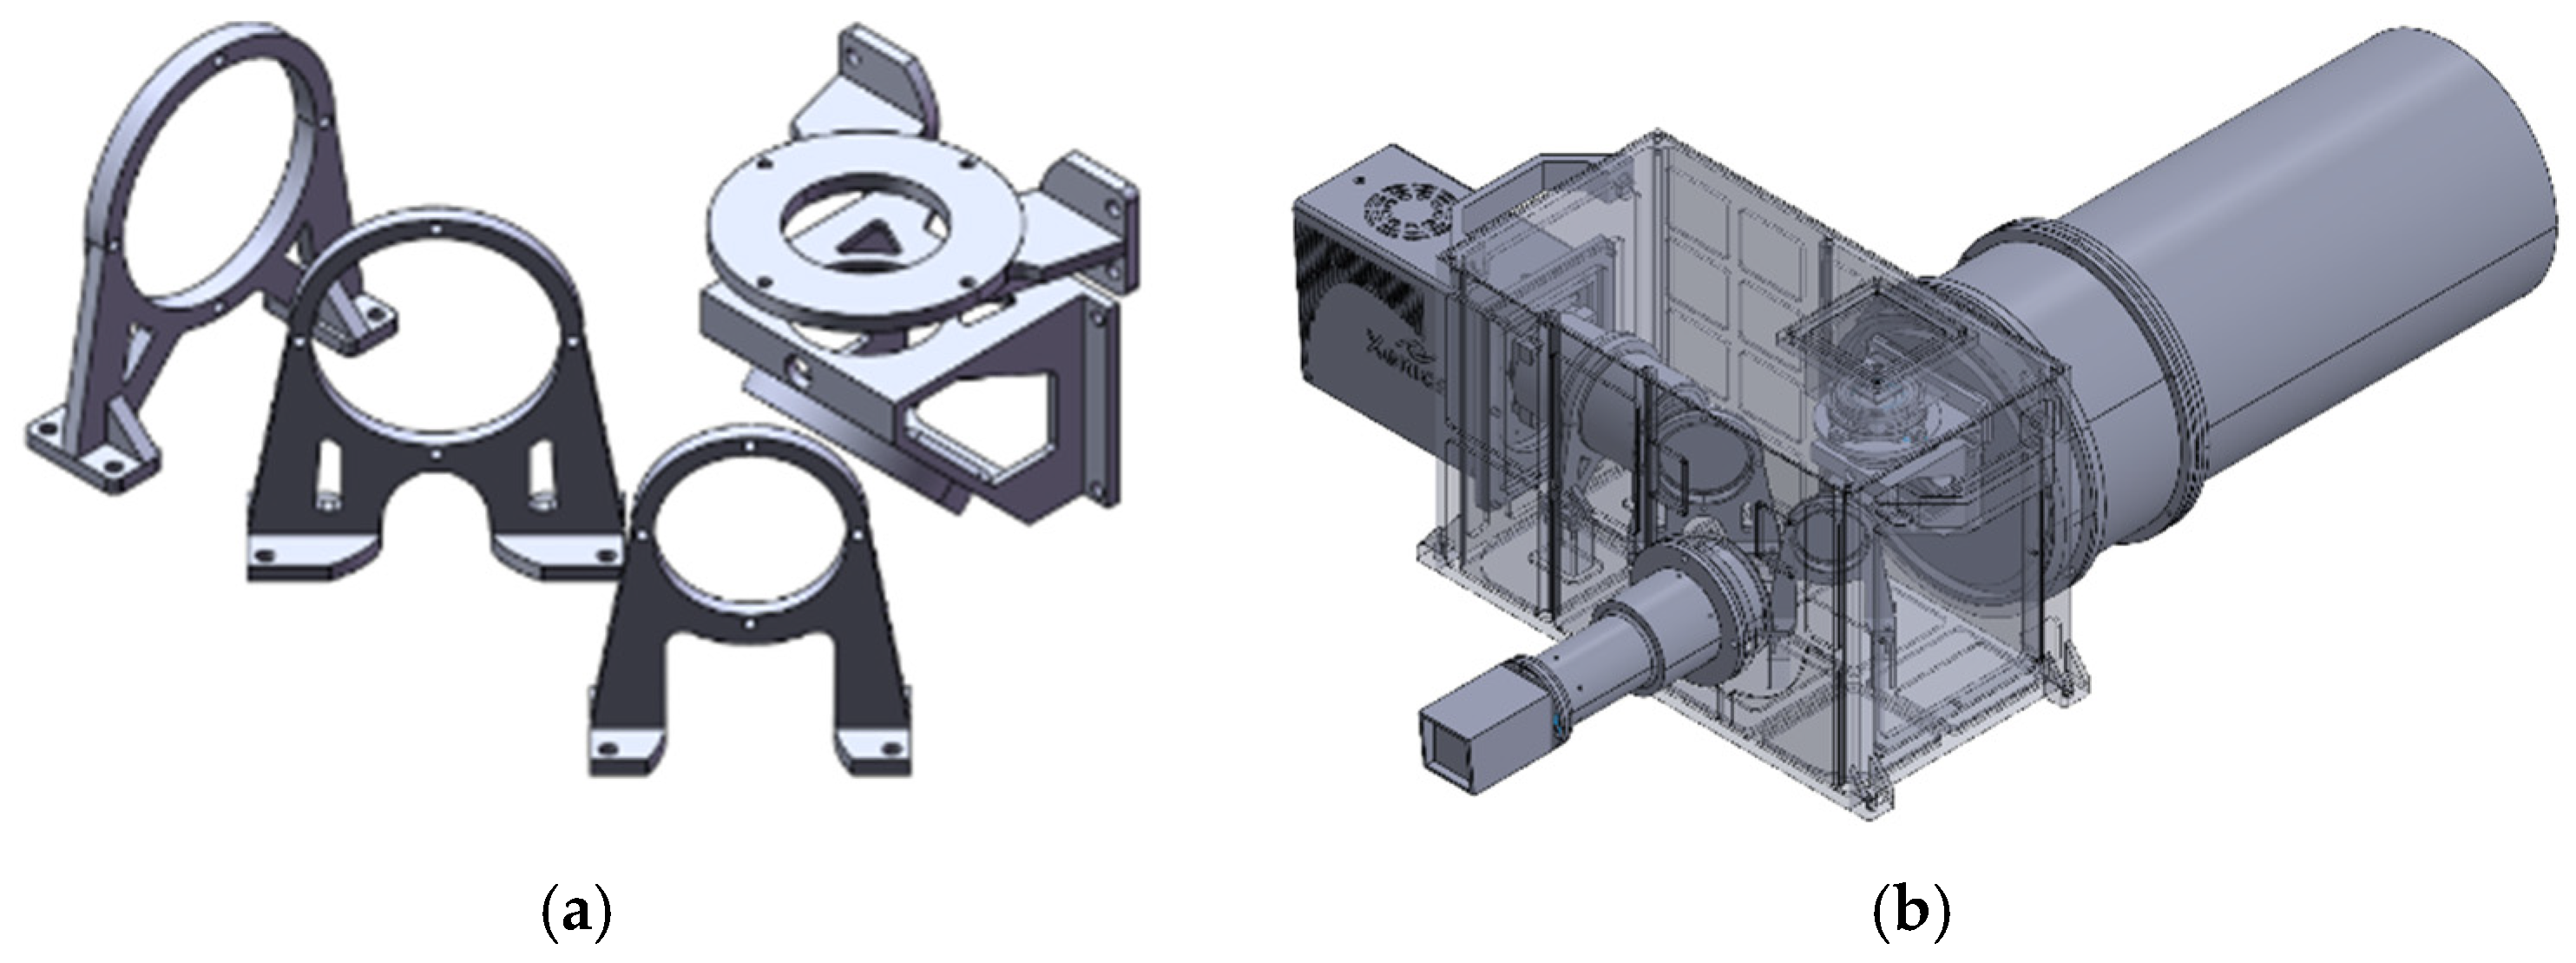
3.3. Final Optimization Results

After optimization, the structural parameters of L1-L8 were as shown in Figure 9a. The final structure of the three-band multispectral camera is shown in Figure 9b. The total mass of the support was reduced from the initial 0.72 kg to 0.50 kg through topology optimization and further reduced to 0.43 kg after parameter optimization, achieving a total weight reduction rate of 40.3%. Under gravity conditions, the deformation in the Z-direction was optimized, improving from an initial maximum deformation of 5.52 nm to 5.34 nm. Although the first-order fundamental frequency slightly decreased, it still remained above 100 Hz.

4. Performance Analysis

4.1. Modal Analysis

The optimized model underwent modal analysis using ANSYS. The first three mode shape cloud diagrams for the housing and support structure are shown in Figure 10 and Figure 11. After optimization, the first-order mode of the housing is 126.01 Hz, the second-order mode is 192.7 Hz, and the third-order mode is 297.22 Hz. For the support structure, the first-order mode is 217.89 Hz, the second-order mode is 270.28 Hz, and the third-order mode is 292.81 Hz. Both the housing and the support structure meet the requirement of a first-order mode greater than 100 Hz after optimization.

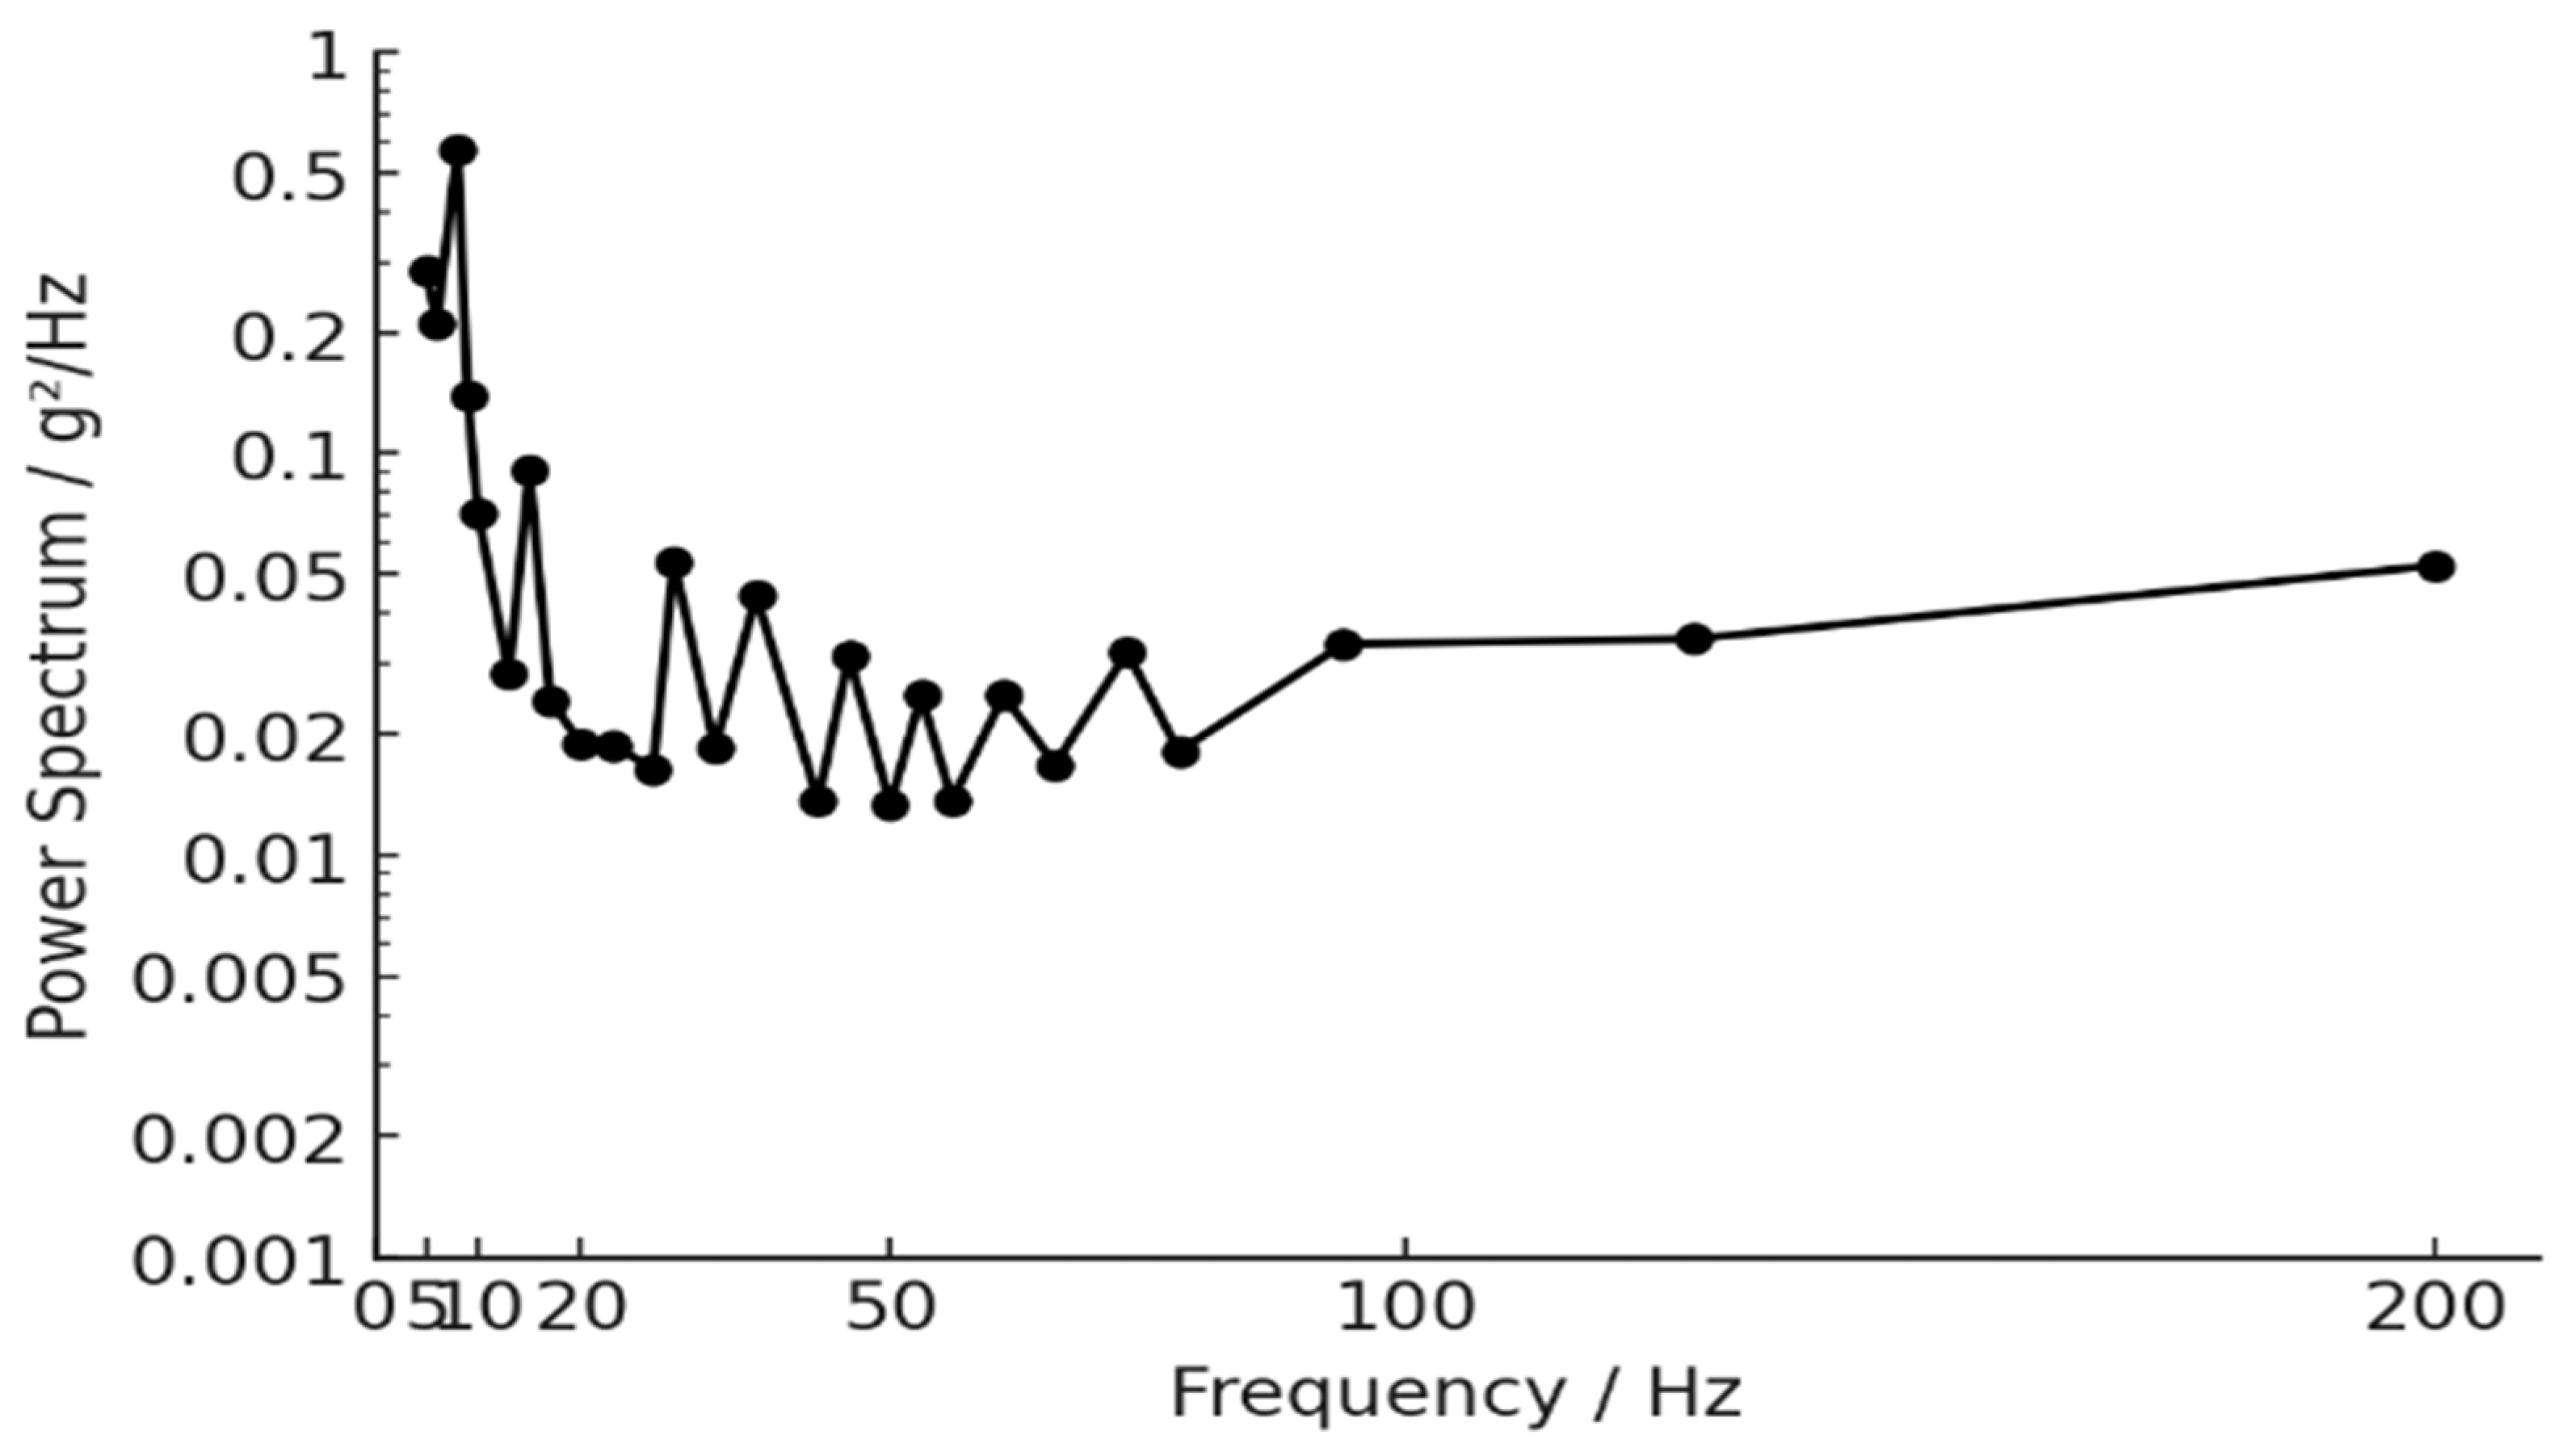
4.2. Dynamic Analysis

The calculation of the structural response under random loads is crucial in the process of instrument structural design [32,33]. A random vibration analysis was conducted on the support structure components of the three-band multispectral camera using finite element software. The random vibration test data were based on the National Military Standards of the People’s Republic of China [34]. The power spectral density is shown in Figure 12, and the random vibration response results are presented in Table 4.
The analysis indicates that the amplification factor is 1.42, and the maximum response occurs in the Z-direction. This demonstrates that the structure exhibits good mechanical performance under random vibration conditions, performs stably overall, and meets the design requirements.

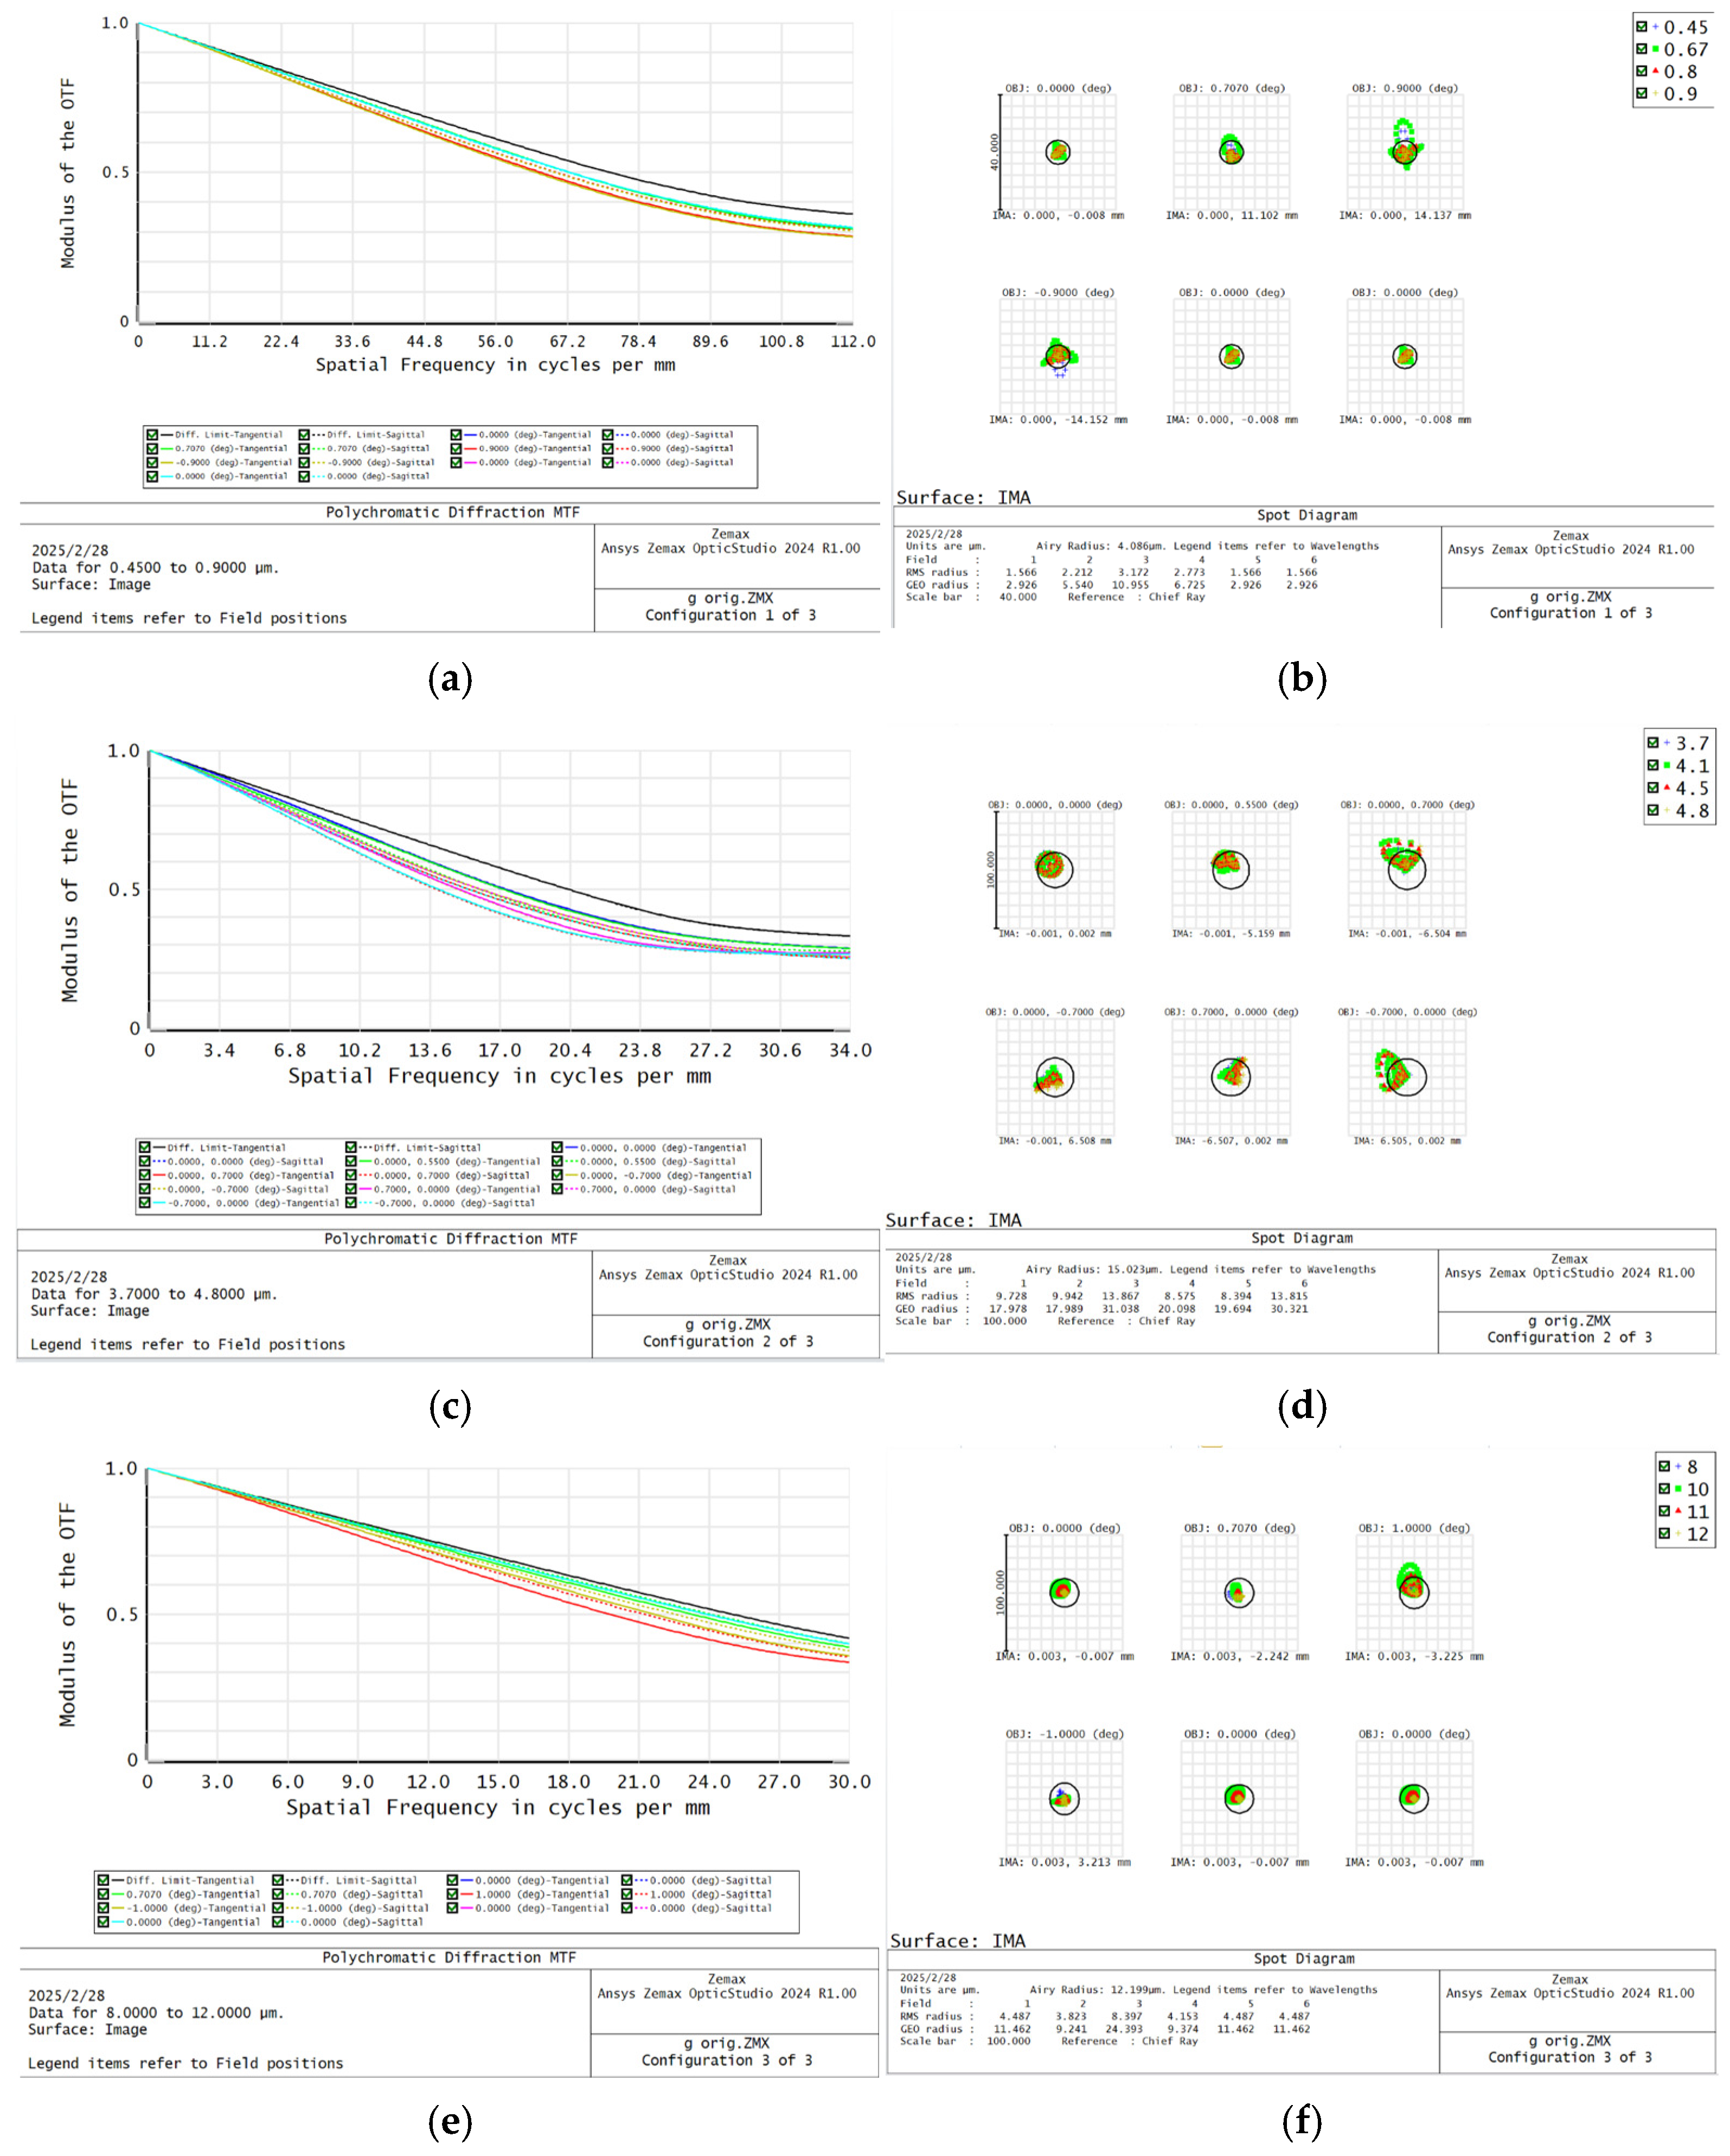
4.3. Optical Analysis

An optical analysis is conducted on the structural components of the three-band camera. The applied displacement constraints restrict the six degrees of freedom at the mounting holes where the camera is attached to the device base plate. A gravitational load of 1 g (where g represent the acceleration due to gravity) is applied in the z-axis direction, vertically downward. The results for each lens are fitted into Zernike polynomials [35,36] and imported into optical design software to evaluate the changes in the image quality of the optical system. A simulation is conducted to analyze the degradation of the system performance caused by the deformation of the optical surfaces under gravitational conditions. The primary focus is on comparing the spot diagrams and modulation transfer functions (MTFs) of the optical system before and after optimization under the gravitational influence. The MTF results under these conditions are shown in Figure 13 and Figure 14, and the corresponding spot diagrams are also presented in Figure 13 and Figure 14.
Using ANSYS, a finite element method (FEM) analysis is performed on the entire system. The deformation results are then imported into the optical design software Zemax 2024 and applied to the corresponding lens surfaces to compare the changes in image quality. A comparative evaluation of the overall system performance reveals that, under the gravitational influence, the optimized system experiences a slight performance degradation. However, the changes in the optical system’s spot size remain minimal and within acceptable limits. The spot size’s maximum root mean square (RMS) increased from 3.172 μ m to 3.214 μ m for the visible light system and from 13.867 μ m to 14.043 μ m for the mid-wave infrared system, and it decreased from 8.397 μ m to 8.272 μ m for the long-wave infrared system after optimization. All values meet the RMS requirements of less than 4 μ m , 10 μ m , and 15 μ m , respectively, for each system. The MTFs at 112   l p / m m increase from 0.2789 to 0.2791 for the visible light system, those at 34   l p / m m remain the same at 0.2513 for the mid-wave infrared system, and those at 30   l p / m m increase from 0.3329 to 0.3356 for the long-wave infrared system after optimization. All values meet the MTF requirements of greater than 0.25, 0.25, and 0.3 for the respective systems.

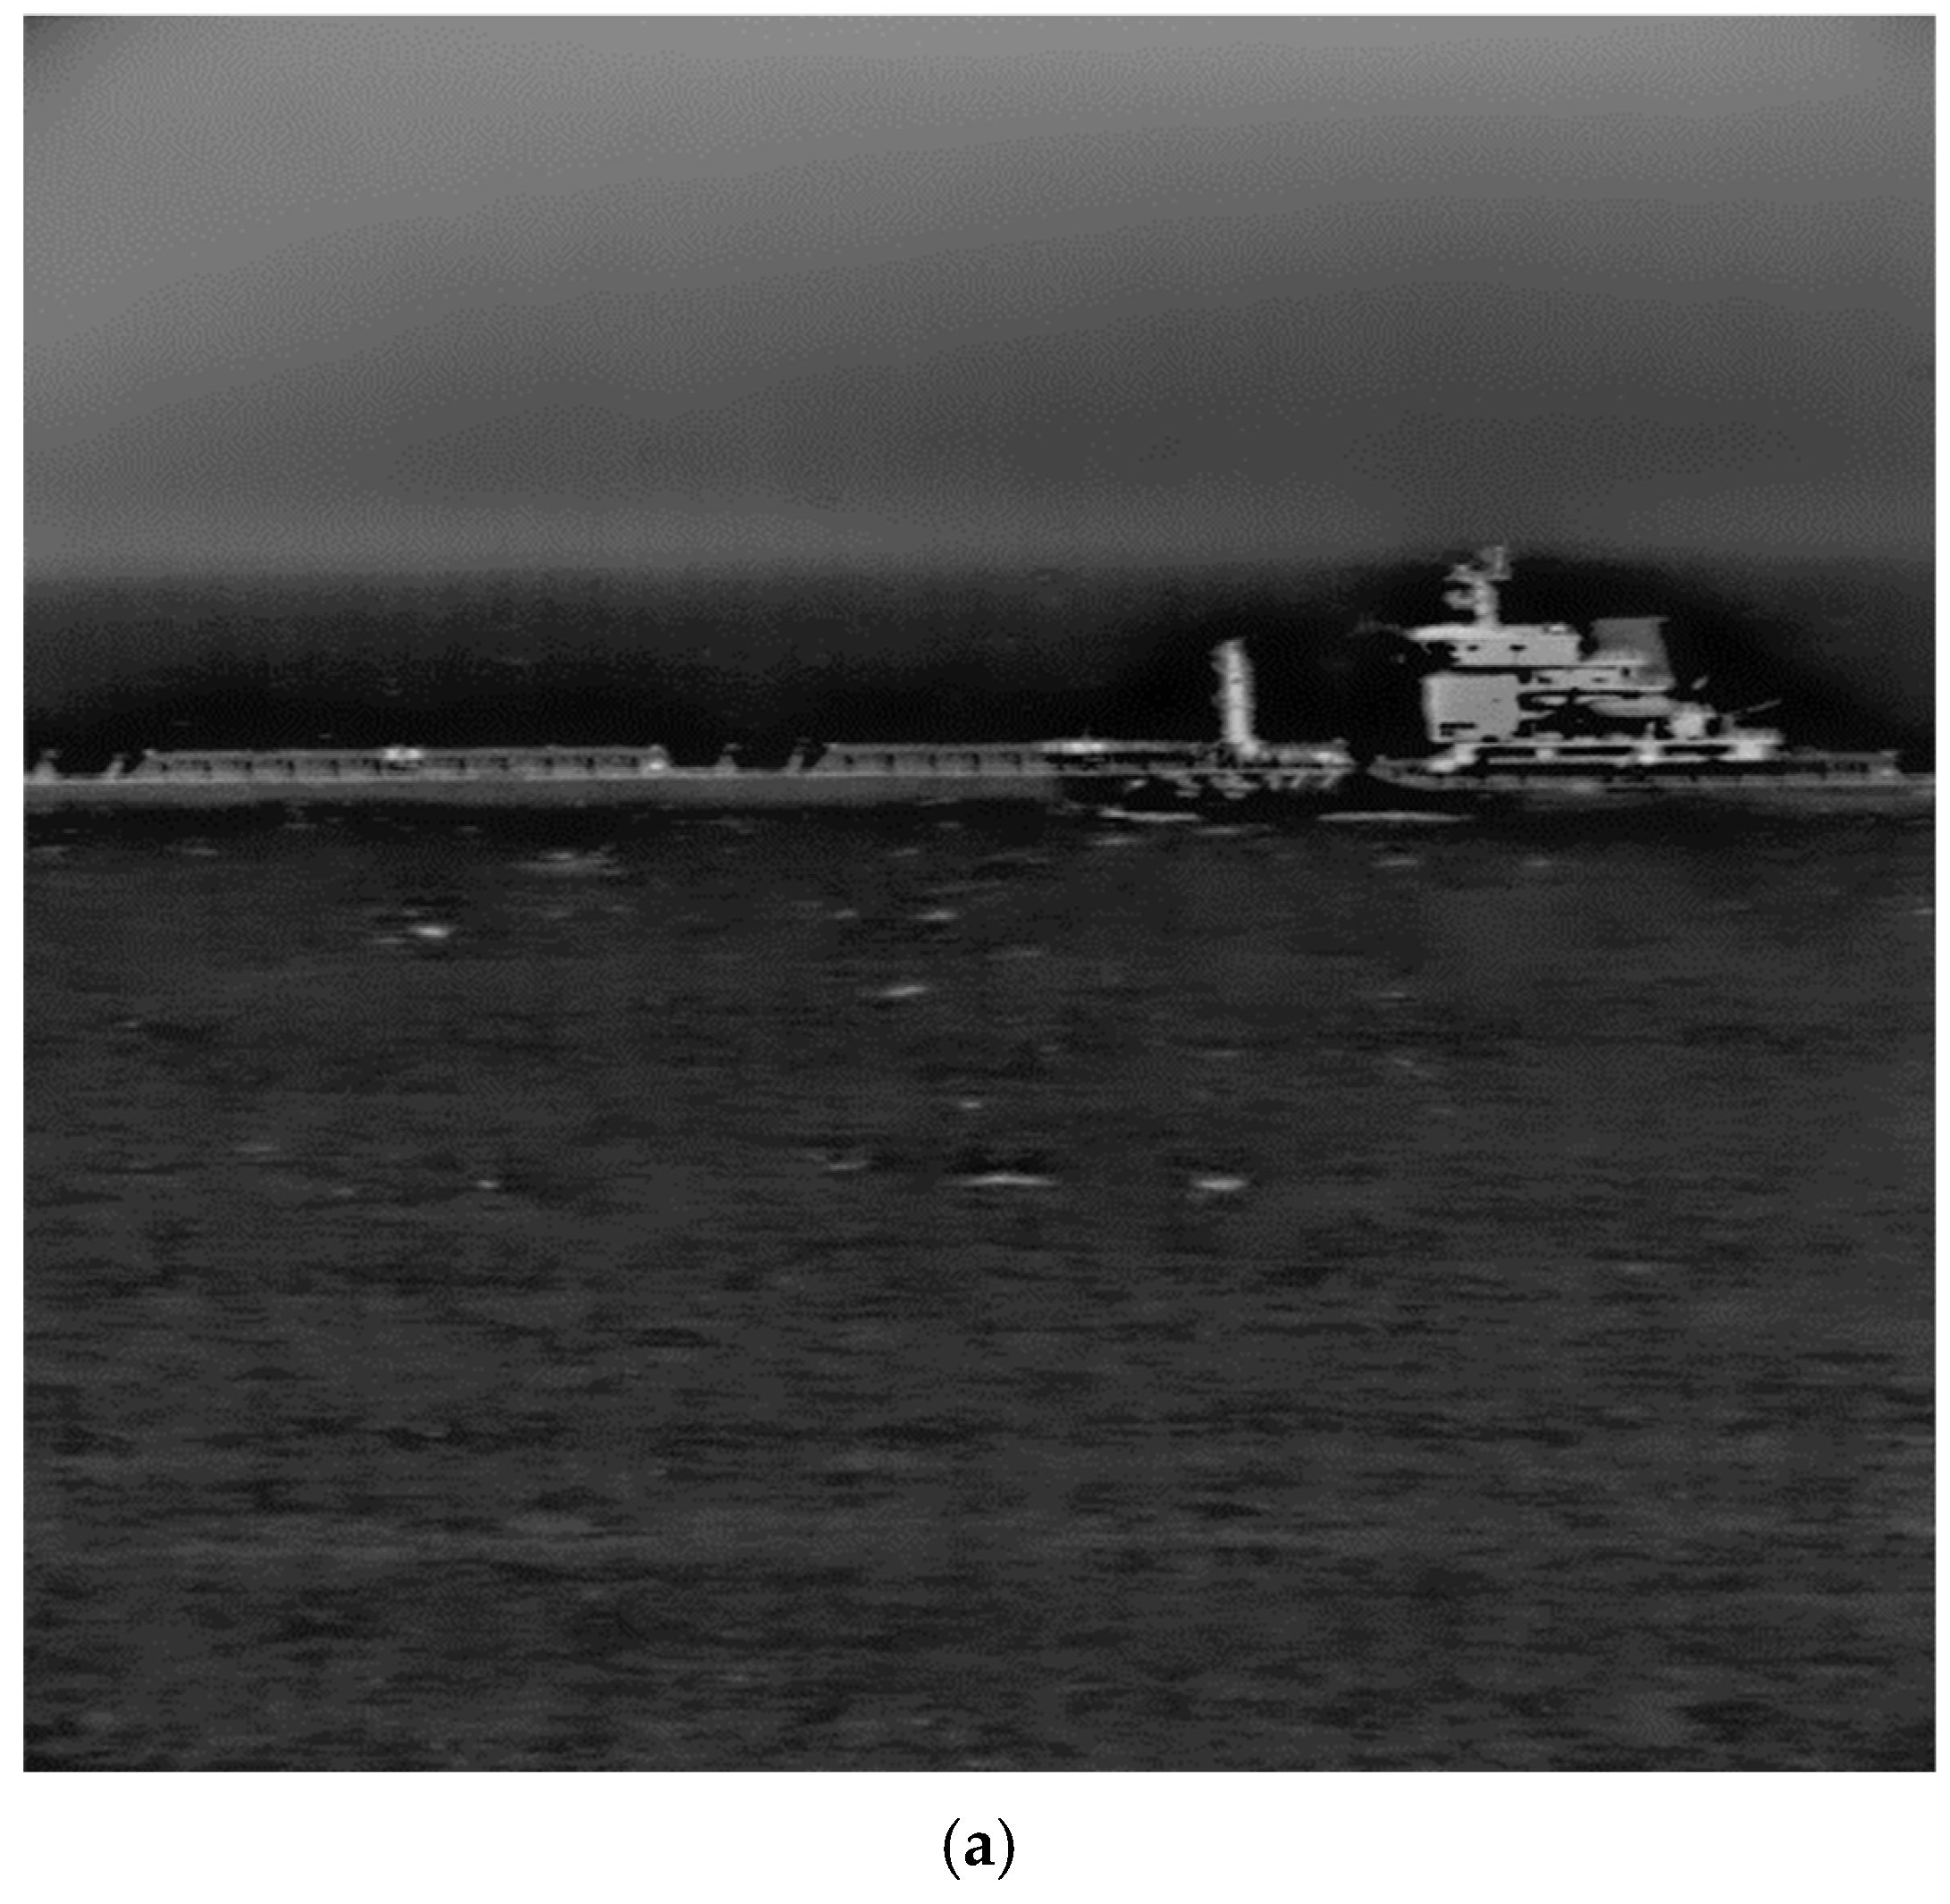
5. Three-Band Multispectral Camera Testing

The stable imaging results for visible light, mid-wave infrared, and long-wave infrared are shown in Figure 15. As observed in Figure 15a, in the visible light band, the camera can clearly detect the outline of a warship at a distance of 18.5 km. Figure 15b,c demonstrate that, under nighttime and foggy conditions at a distance of 18.5 km, the mid-wave and long-wave infrared images effectively distinguish the warship’s outline from the background. Through practical testing and verification, the common-aperture three-band system successfully achieved the required detection range of over 18 km for all three bands.

6. Conclusions

This paper proposes a topology optimization approach for the support structure of a three-band multispectral camera, enhancing both system performance and weight reduction. Through a combination of topology optimization and parameter optimization using the MOGA algorithm, a lightweight design for the support structure was developed, ultimately reducing the total mass of the housing and support by 42.4%.
The engineering analysis shows that the entire structure experiences the maximum deformation of 6.15 nm under a gravitational load. When subjected to a 1 g gravity load, the deformation of each lens was evaluated using Zernike polynomials to assess its impact on the optical system’s imaging quality. The results showed that all values complied with the RMS requirements, remaining below 4 μ m , 10 μ m , and 15 μ m for the visible light system, the mid-wave infrared optical system, and the long-wave infrared optical system, respectively. Additionally, all values satisfied the MTF requirements, exceeding 0.25, 0.25, and 0.3 for the respective systems. In terms of dynamic performance, the structure achieved a satisfactory fundamental frequency exceeding 100 Hz. Test results further confirmed that the designed optical support structure met the imaging requirements at 18.5 km, demonstrating excellent mechanical performance.
The feasibility of combining topology optimization with parameter optimization has been demonstrated, providing valuable insights for the structural design of three-band multispectral cameras. However, a key challenge remains in reducing the overall volume of the support structure, which could further enhance the camera’s compactness and integration capabilities. Future research could explore the use of advanced materials, such as composite materials, or additive manufacturing technologies to further improve the performance while reducing the costs and production time.

Author Contributions

K.H., Y.W. and J.G. were responsible for the whole experiment; K.H. wrote the manuscript; K.H. carried out the topology optimization method and the numerical simulations; C.Z. designed the optical system; X.Z. was responsible for image collection. All authors have read and agreed to the published version of the manuscript.

Funding

This research was funded by the National Natural Science Foundation of China, grant number 62271484, and in part by the National Science Fund for Distinguished Young Scholars, grant number 61925112.

Institutional Review Board Statement

Not applicable.

Informed Consent Statement

Not applicable.

Data Availability Statement

The original contributions presented in this study are included in the article. Further inquiries can be directed to the corresponding author.

Conflicts of Interest

The authors declare no conflicts of interest.

References

  1. Li, X.J.; Liu, J.; Chen, Y. Design of dual-band, high zoom ratio and continuous co-focal optical system. Acta Photonica Sin. 2016, 45, 1022003. [Google Scholar]
  2. Liu, K.; Chen, R.L.; Chang, L.Y.; Lei, G.Z.; Zou, G.Y. Common-aperture dual channel infrared scanning imaging optical system. J. Appl. Opt. 2012, 33, 395–401. [Google Scholar]
  3. Wu, H.B.; Zhang, X.; Wang, L.J.; Yan, L.; Shi, G.W. Common aperture optical system of single photon laser and medium wave infrared. Opt. Precis. Eng. 2021, 29, 1260–1269. [Google Scholar] [CrossRef]
  4. Guo, Y.L.; Yu, X.; Cai, K.J.; Yang, L. Optical design of TV/IR dual-band common-aperture system. Infrared Technol. 2018, 40, 125–132. [Google Scholar]
  5. Yu, H.; Fei, J.D.; Zhang, Y.; Gao, Y.; Kang, W.M. Common aperture combination simulation technology for multi-spectral scene. Infrared Laser Eng. 2011, 40, 1629–1633. [Google Scholar]
  6. Smeesters, L.; Belay, G.Y.; Ottevaere, H.; Meuret, Y.; Vervaeke, M.; Erps, V.J.; Thienpont, H. Two-channel multiresolution refocusing imaging system using a tunable liquid lens. Appl. Opt. 2014, 53, 4002–4010. [Google Scholar] [CrossRef]
  7. Cheng, Z.F.; Liu, F.H.; Xun, X.C. Opto-mechanical design and analysis of dual-band sharing aperture imaging system. Infrared Laser Eng. 2015, 44, 3366–3372. [Google Scholar]
  8. Yue, B.Y.; Liu, J.; Guo, J.; Chen, Y.; Li, H. Optical system design of folded/diffractive co-aperture infrared dual-band beam positioner. Infrared Laser Eng. 2019, 48, 418003. [Google Scholar]
  9. Chen, X.Y.; Gao, M. Design of airborne dual-band common aperture photoelectric aiming optical system. Infrared Laser Eng. 2021, 50, 20200322. [Google Scholar]
  10. Ma, Z.P.; Xue, Y.K.; Shen, Y.; Zhao, X.H.; Zhou, C.L. Design and realization of visible/LWIR dual-color common aperture optical system. Acta Photonica Sin. 2021, 50, 24–32. [Google Scholar]
  11. Shao, M.Q. Research of the Integrated Optimization Design Method for the Optomechanical Structure of Space Cameras. Doctor’s Thesis, University of Chinese Academy of Sciences, Changchun, China, 2021. [Google Scholar]
  12. Wang, Z.S. Structure Optimization Design and Mechanical Properties Research of a Space Ultraviolet Large Field Scanning Imager. Master’s Thesis, University of Chinese Academy of Sciences, Changchun, China, 2021. [Google Scholar]
  13. Tyflopoulos, E.; Steinert, M. Topology and Parametric Optimization-Based Design Processes for Lightweight Structures. Appl. Sci. 2020, 10, 4496. [Google Scholar] [CrossRef]
  14. Hassani, V.; Mehrabi, H.A.; Ibrahim, Z.; Ibrahim, Z.; Ituarte, I. A Comparison between parametric structural optimization methods and software-based topology optimization of a rectangular sample under tensile load for additive manufacturing processes. Int. J. Eng. Res. Appl. 2021, 11, 37–58. [Google Scholar]
  15. Ravichandran, K.; Masoudi, N.; Fadel, G.M.; Wiecek, M.M. Parametric Optimization for Structural Design Problems. In Proceedings of the International Design Engineering Technical Conferences and Computers and Information in Engineering Conference, Anaheim, CA, USA, 18–21 August 2019. [Google Scholar]
  16. Zhang, M.Q. Optimization design of optical lens structure for large field of view in space TOF cameras. China New Technol. Prod. 2022, 20, 79–82. [Google Scholar]
  17. Sun, B.Y.; Guo, X.W.; Zhang, Z.L.; Jiang, Z.H.; Wang, C. Structural optimization design of wide-format array scanning cameras. J. Nanjing Univ. Aeronaut. Astronaut. 2020, 52, 191–198. [Google Scholar]
  18. Wang, P.P.; Xin, H.W.; Zhu, J.Q.; Wang, Y.X. Optimization design of lightweight long-strip reflective mirror structures. Opto-Electron. Eng. 2020, 47, 101–107. [Google Scholar]
  19. Song, W.Y. Design of a Novel All-Carbon Support Structure for Space Cameras and Research on Mechanical and Thermal Stability of the Entire System. Doctor’s Thesis, University of Chinese Academy of Sciences, Changchun, China, 2022. [Google Scholar]
  20. Tyflopoulos, E.; Flem, D.T.; Steinert, M.; Olsen, A. State of the art of generative design and topology optimization and potential research needs. In Proceedings of the DS 91: Proceedings of NordDesign 2018, Linköping, Sweden, 14–17 August 2018. [Google Scholar]
  21. Li, L.; Wang, D.; Yang, H.B.; Tan, L.Y.; Sun, Z.L. Optimization design of flexible vibration damping support structure for space cameras. Opt. Precis. Eng. 2016, 24, 1677–1684. [Google Scholar]
  22. Jia, X.Z.; Jin, G.; Jia, J.Q.; Ang, Y.; Xu, Z. Topology optimization design of the main load-bearing substrate structure for lightweight space cameras. J. Space Sci. 2011, 31, 395–400. [Google Scholar]
  23. Guan, Y.J.; Xin, H.W.; Zhao, G.J.; Liu, J.; Ren, J.Y. Topology optimization design of the main supporting structure for space cameras. Opt. Precis. Eng. 2007, 8, 1157–1163. [Google Scholar]
  24. Qu, H.D. Design and Mechanical Characteristics Research of Optomechanical Structures for Space Telescopes. Master’s Thesis, Changchun University of Technology, Changchun, China, 2021. [Google Scholar]
  25. Lazarov, B.S.; Wang, F.W.; Sigmund, O. Length scale and manufacturability in density-based topology optimization. Arch. Appl. Mech. 2016, 86, 189. [Google Scholar] [CrossRef]
  26. Fu, X.J. Key Technology Research on Topology and Shape Integrated Optimization Algorithms. Doctor’s Thesis, University of Technology, Hangzhou, China, 2008. [Google Scholar]
  27. Yang, J.Y.; Yang, X.; Zheng, J.H. Structure Components Optimization Design of Ultraviolet Imaging Spectrometer. Acta Photonica Sin. 2023, 52, 0930004. [Google Scholar]
  28. Owen, A.B. Orthogonal arrays for computer experiments, integration and visualization. Stat. Sin. 1992, 2, 439–452. [Google Scholar]
  29. Deb, K.; Pratap, A.; Agarwal, S.; Meyarivan, Y. A fast and elitist multiobjective genetic algorithm: NSGA-II. IEEE Trans. Evol. Comput. 2002, 6, 182–197. [Google Scholar] [CrossRef]
  30. Fonseca, C.M.; Fleming, P.J. An overview of evolutionary algorithms in multiobjective optimization. Evol. Comput. 1995, 3, 1–16. [Google Scholar] [CrossRef]
  31. Fonsenca, C.M.; Fleming, P.J. Genetic algorithms for multiobjective optimization: Formulation, discussion and generalization. In Proceedings of the 5th International Conference on Genetic Algorithms, Urbana-Champaign, IL, USA, 1 June 1993; Morgan Kaufmann Publishers Inc.: San Francisco, CA, USA, 1993. [Google Scholar]
  32. Sun, Y.; Li, F.; Yang, J.F.; Qian, C.S. Optimum design and experiment verification of space coaxial reflective secondary mirror support structure. Acta Photonica Sin. 2018, 47, 722003. [Google Scholar] [CrossRef]
  33. Jiang, R.K. Dynamic analysis and optimization of astronomical survey camera. Master’s Thesis, University of Chinese Academy of Sciences, Chengdu, China, 2018. [Google Scholar]
  34. National Military Standard GJB 150.6-1986. Available online: https://www.doc88.com/p-7374950707990.html (accessed on 1 January 2025).
  35. Zernike, F. Beugungstheorie des Schneidenver-fahrens und Seiner Verbesserten Form, der Phasenkontrastmethode. Physica 1934, 1, 689–704. [Google Scholar] [CrossRef]
  36. Bhatia, A.B.; Wolf, E. On the circle polynomials of Zernike and related orthogonal sets. Math. Proc. Camb. Philos. Soc. 1954, 50, 40–48. [Google Scholar] [CrossRef]
Figure 1. Three-band optical system.
Applsci 15 02974 g001
Figure 2. Initial structural design: (a) preliminary overall structural diagram; (b) preliminary overall housing structure; (c) preliminary optimization of support with opti-lens; (d) preliminary optimized support.
Applsci 15 02974 g002
Figure 3. Overall flowchart of optimization process.
Applsci 15 02974 g003
Figure 4. Iteration optimization curve.
Applsci 15 02974 g004
Figure 5. Topology optimization result: (a) topology optimization results of housing; (b) topology optimization results of structure A; (c) topology optimization results of structure B; (d) topology optimization results of structure C; (e) topology optimization results of structure D; (f) topology optimization results of structure E.
Applsci 15 02974 g005aApplsci 15 02974 g005b
Figure 6. Geometric parameters: (a) geometric parameters of structure A; (b) geometric parameters of structure B; (c) geometric parameters of structure C; (d) geometric parameters of structure D; (e) geometric parameters of structure E.
Applsci 15 02974 g006
Figure 7. Contributions of parameters to various response functions.
Applsci 15 02974 g007
Figure 8. The iteration curve (black line: iteration curve; red line: convergence curve).
Applsci 15 02974 g008
Figure 9. Final structure: (a) final optimization structure; (b) three-band optical system structure.
Applsci 15 02974 g009
Figure 10. Mode shapes for housing: (a) housing 1st-order modal; (b) housing 2nd-order modal; (c) housing 3rd-order modal.
Applsci 15 02974 g010aApplsci 15 02974 g010b
Figure 11. Mode shapes for support: (a) support 1st-order modal; (b) support 2nd-order modal; (c) support 3rd-order modal.
Applsci 15 02974 g011aApplsci 15 02974 g011b
Figure 12. Random vibration test experiment data in X-, Y-, and Z-directions (total RMS 2.8 g).
Applsci 15 02974 g012
Figure 13. Spot diagrams of initial structure of optical system subjected to gravity: (a) MTF for visible light system; (b) spot diagram for visible light system; (c) MTF for mid-wave infrared system; (d) spot diagram for mid-wave infrared system; (e) MTF for long-wave infrared system; (f) spot diagram for long-wave infrared system.
Applsci 15 02974 g013
Figure 14. Spot diagrams of optimized structure of optical system subjected to gravity: (a) MTF for visible light system; (b) spot diagram for visible light system; (c) MTF for mid-wave infrared system; (d) spot diagram for mid-wave infrared system; (e) MTF for long-wave infrared system; (f) spot diagram for long-wave infrared system.
Applsci 15 02974 g014
Figure 15. Three-band multispectral camera testing images: (a) visible light image; (b) mid-wave infrared image; (c) long-wave infrared image.
Applsci 15 02974 g015aApplsci 15 02974 g015b
Table 1. Parameters before and after topology optimization of housing and support structure.
HousingA, B, C, D, E
Mass/kgInitial 8.84 ± 0.01 0.72 ± 0.01
Optimization 5.08 ± 0.13 0.50 ± 0.03
First Modal/HzInitial 312.52 ± 3.75 546.04 ± 8.19
Optimization 126.01 ± 1.20 492.55 ± 4.48
Z-Deformation/nmInitial 2.37 ± 0.07 5.52 ± 0.12
Optimization 6.15 ± 0.1 6.80 ± 0.15
Table 2. Optimization of dimensions for preceding and succeeding parameters.
L1L2L3L4L5L6L7L8
Upper/mm4.06.03.036.044.05.548.07.5
Lower/mm1.54.03.532.040.03.544.03.0
Initial/mm3.05.05.033.041.05.045.06.0
Parameter optimization/mm 1.6 ± 0.1 4.1 ± 0.1 3.1 ± 0.2 33.1 ± 0.0 41.2 ± 0.0 3.0 ± 0.1 45.0 ± 0.0 3.1 ± 0.2
Table 3. Performance analysis before and after structural optimization.
Mass/kgFrequency/Hz
Initial 0.72 ± 0.01 546.04 ± 8.19
Topology optimization 0.50 ± 0.03 492.55 ± 4.48
Parameter optimization 0.43 ± 0.02 217.89 ± 2.32
Z-Deformation for topology optimization 6.80 ± 0.15   n m
Z-Deformation for parameter optimization 5.34 ± 0.02   n m
Table 4. Random vibration response results of the three-band camera’s structural components.
DirectionXYZ
Result/RMS3.640.5123.97
Magnification1.30.181.42
Disclaimer/Publisher’s Note: The statements, opinions and data contained in all publications are solely those of the individual author(s) and contributor(s) and not of MDPI and/or the editor(s). MDPI and/or the editor(s) disclaim responsibility for any injury to people or property resulting from any ideas, methods, instructions or products referred to in the content.

