Article

A Multifunctional Bottomhole Power Drilling Tool Rotary Speed Sensor Based on Triboelectric Nanogenerator

1
School of Engineering and Technology, China University of Geosciences, Beijing 100083, China
2
Institute of Exploration Techniques, Chinese Academy of Geological Sciences (CAGS), Langfang 065000, China
*
Author to whom correspondence should be addressed.
Appl. Sci. 2025, 15(6), 3196; https://doi.org/10.3390/app15063196
Submission received: 18 December 2024 / Revised: 22 February 2025 / Accepted: 12 March 2025 / Published: 14 March 2025

Abstract

:
The rotary speed of bottomhole power drilling tools during drilling operations provides feedback on bottomhole assembly malfunctions and borehole trajectory anomalies. However, existing rotary speed sensors suffer from limitations in their power supply methods, leading to reduced drilling efficiency and increased costs. This study presents a novel multifunctional rotary speed sensor with self-powered capabilities based on a triboelectric nanogenerator. Utilizing the triboelectric effect and electrostatic induction generated by the rotation of the bottomhole assembly, the sensor outputs triboelectric pulses correlated with rotational speed, enabling the measurement of both rotational speed and angle. Experimental results demonstrate a measurement range of 0 to 1000 rpm for rotational speed, an angular resolution of 30 degrees, a measurement error of less than 3.2%, and a maximum power output of 6.4 µW. The sensor operates reliably within a temperature range of 0 to 160 degrees Celsius and a relative humidity range of 0 to 90%, exhibiting excellent performance. Compared to conventional downhole sensors, the developed sensor’s self-powered functionality makes it more suitable for actual downhole operating conditions.

1. Introduction

Drilling is a technology that utilizes specialized drilling tools to bore holes from the surface to the subsurface. It is a crucial technique for the exploration and development of petroleum, natural gas, and solid mineral resources [1,2]. During drilling, the complex and variable nature of borehole trajectories leads to significant energy loss due to friction between the drill string and borehole wall, resulting in insufficient power transfer from the surface rig to the bottomhole assembly. To address this issue, bottomhole power drilling tools are commonly employed in field operations. A bottomhole power drilling tool is an axial-flow hydraulic motor installed at the bottom of the borehole that utilizes the flow of drilling fluid to drive its rotation, thereby providing continuous rock-breaking power to the bottomhole [3,4]. The rotational speed of the bottomhole power drilling tools during drilling provides feedback on bottomhole assembly malfunctions and borehole trajectory anomalies [5]. Drilling engineers rely on real-time monitoring of a bottomhole power drilling tool’s rotational speed to adjust drilling parameters; therefore, real-time measurement is essential.
Numerous surface-based rotational speed measurement methods exist, categorized by principle into eddy current [6], magneto-resistive [7], laser [8], and capacitive types [9]. However, these sensors require an external power source, typically a battery or an external cable. For downhole applications, cable-powered systems necessitate passing the cable through the hollow drill string, significantly reducing operational efficiency. Battery-powered systems, on the other hand, require retrieving the entire drill string to the surface for battery replacement when the downhole sensor battery is depleted. This is particularly problematic in deep wells (several kilometers), where retrieval and battery replacement can take one to two days, considerably increasing drilling costs. Therefore, a self-powered downhole sensor would effectively mitigate the shortcomings of conventional power supply methods and significantly enhance drilling efficiency.
Triboelectric nanogenerators (TENGs) offer a novel approach to addressing these challenges. First proposed in 2012 [10], it can be divided into four types, contact-separation mode, lateral-sliding mode, single-electrode mode, and freestanding mode [11]. TENGs based on the triboelectric effect and electrostatic induction have found widespread applications in energy harvesting [12,13] and self-powered sensing [14,15]. Energy harvesting research using TENGs encompasses diverse energy sources, including kinetic energy [16,17], wave energy [18], wind energy [19,20,21], two-phase flow energy [22], rain energy [23], vibrational energy [24,25,26], and rotational energy [27]. Equally prolific is the development of self-powered sensors, with researchers demonstrating strain sensors [28], gas sensors [28,29,30], seismic sensors [31], fluid sensors [32], environmental sensors [33], humidity sensors [34,35], rain sensors [36], biomechanical sensors [37], and vibration sensors [38,39,40]. The application of TENGs solves the problem of inefficient utilization of small-scale energy in the environment while enabling traditional sensors to break free from dependence on external power sources, thereby enhancing the flexibility of sensor application scenarios.
These findings demonstrate the significant advantages of TENGs in both energy generation and sensing applications, particularly in the development of self-powered sensors, where their scope is continuously expanding. Therefore, this study presents a multifunctional self-powered downhole rotary speed sensor for drilling tools, based on a TENG, capable of simultaneously measuring both the rotational speed and angle of the drill string. This provides crucial data for assessing downhole conditions and dynamically adjusting drilling parameters.

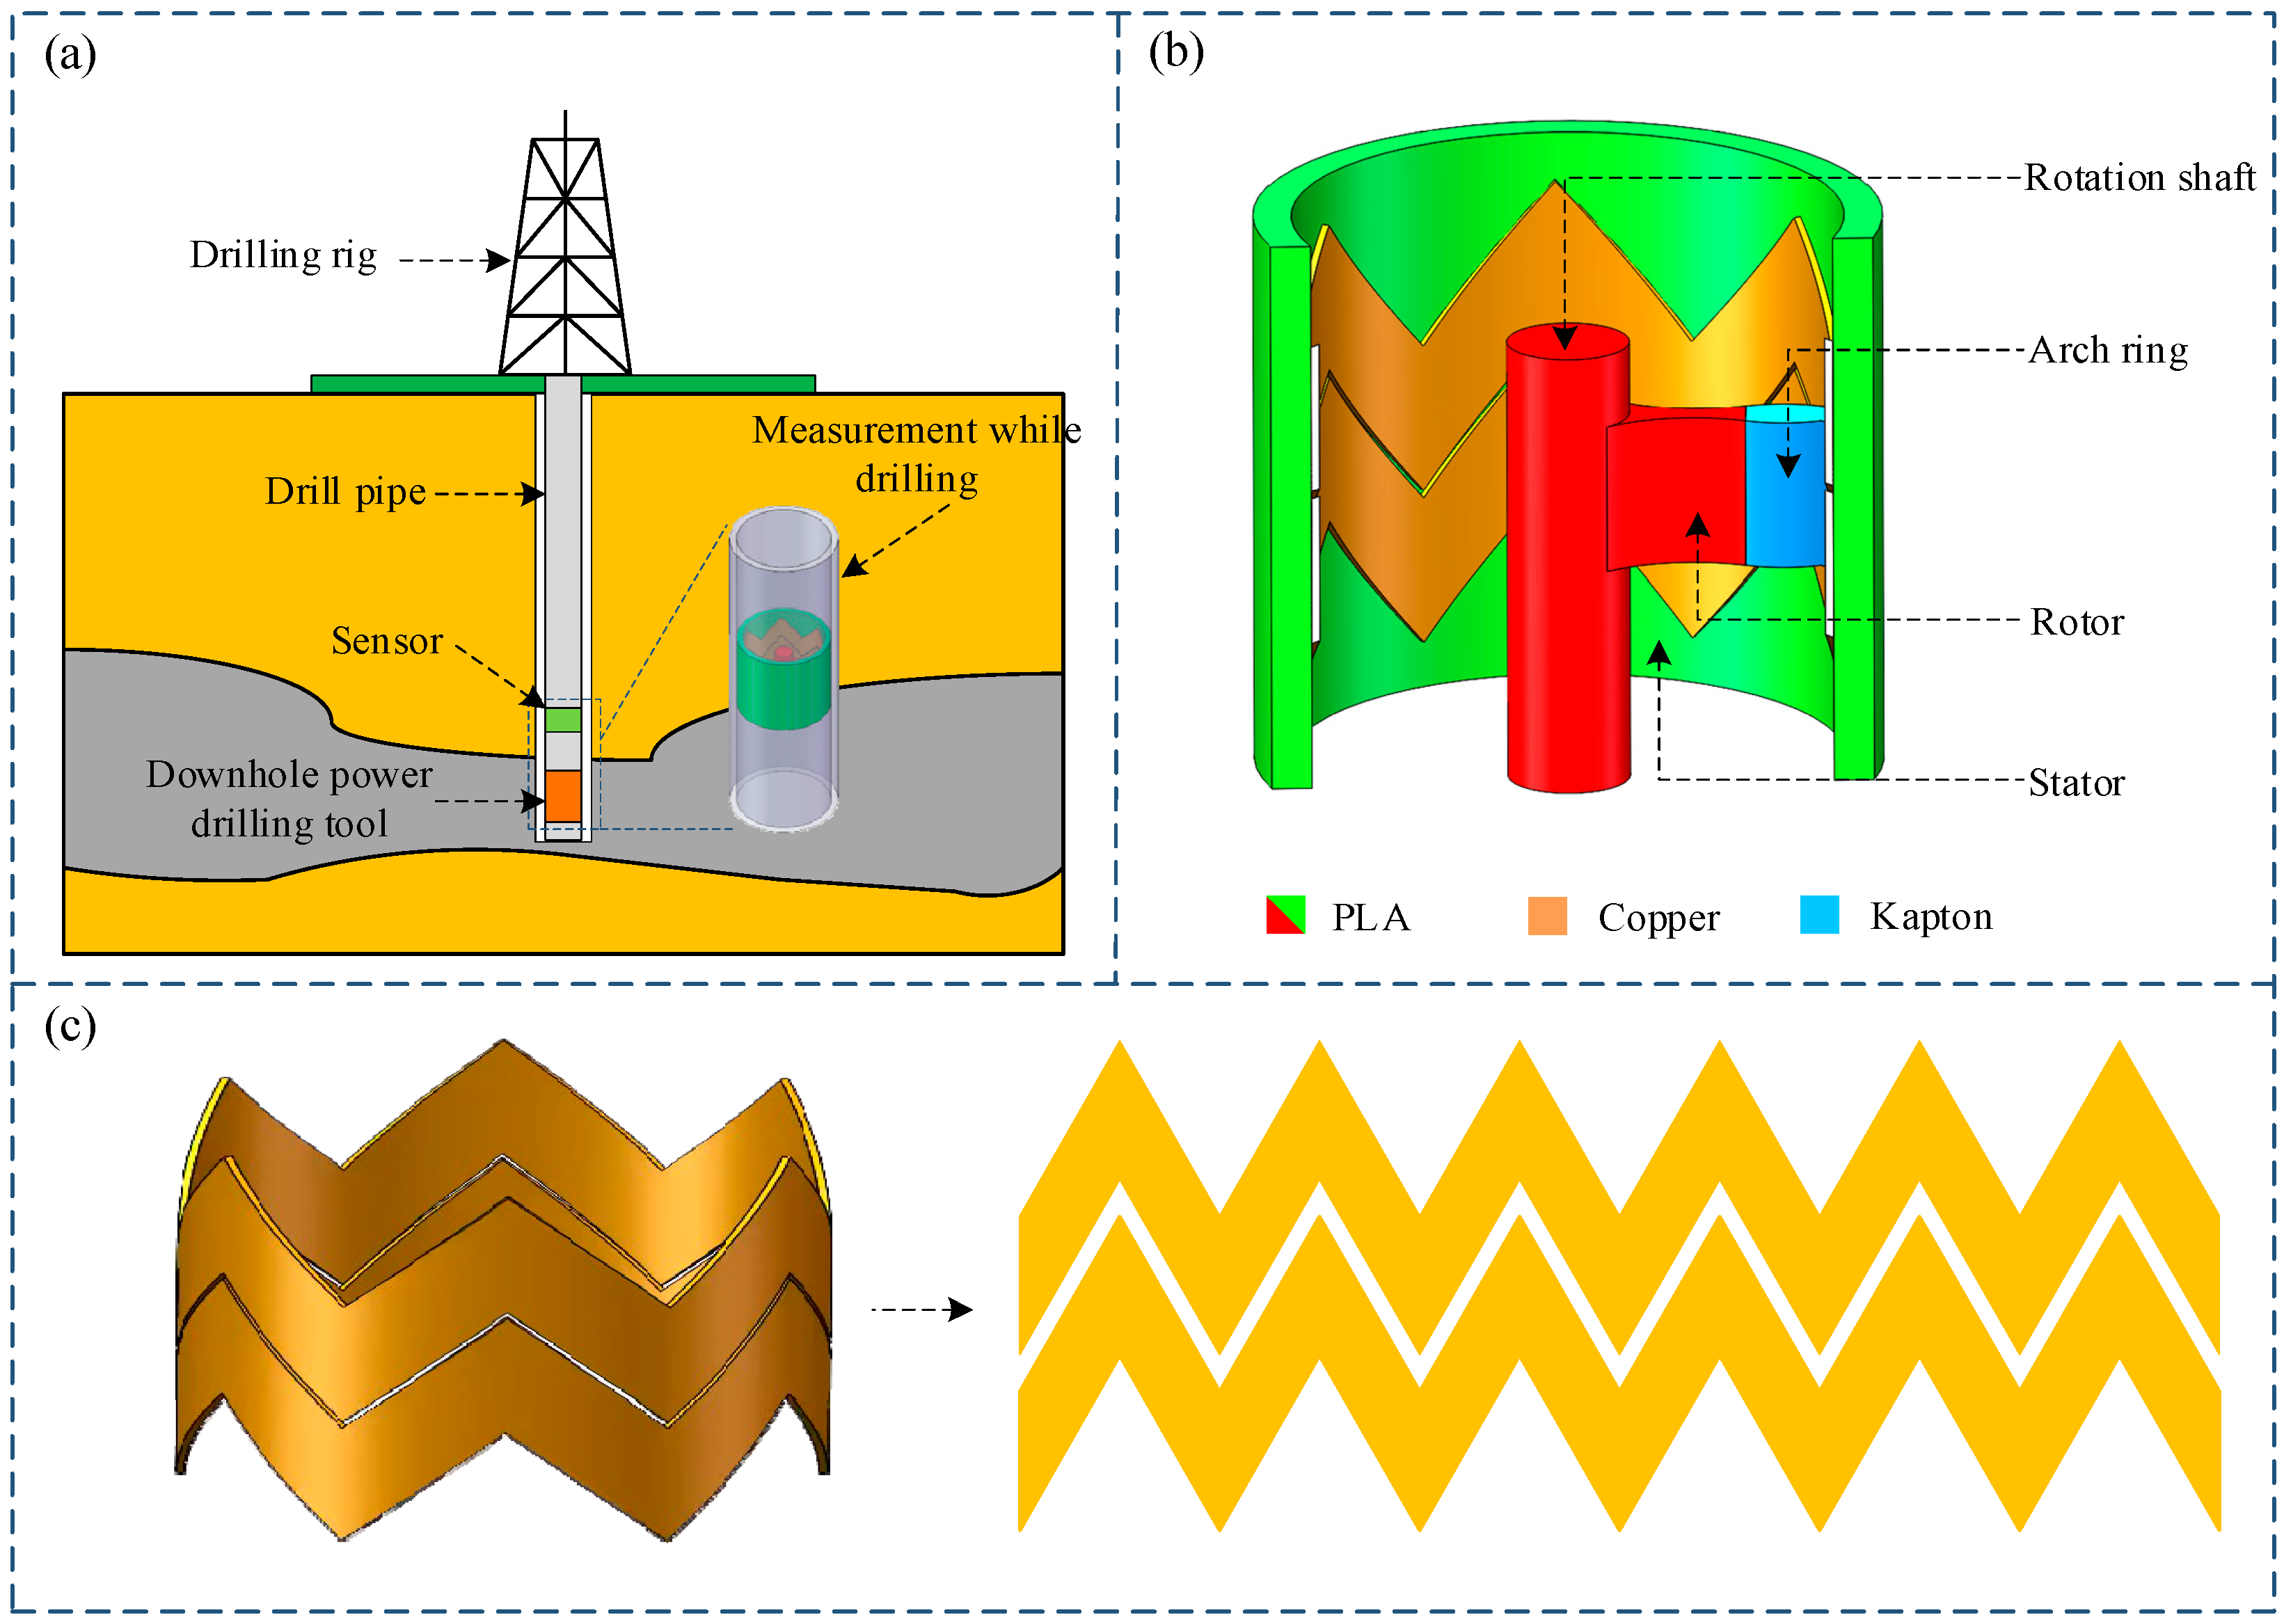
2. Structure and Working Principle

2.1. Sensor Structure

Figure 1a illustrates the in situ deployment of the sensor. A measurement-while-drilling (MWD) system is mounted above the downhole power drilling tool within the borehole. The sensor is sealed within the MWD system and connected to the downhole power drilling tool, enabling rotational speed measurement, so the sensor does not come into direct contact with the external environment. Figure 1b presents a schematic diagram of the sensor’s structure. The sensor is a cylindrical structure with dimensions of φ75 mm × 130 mm, primarily comprising a stator and a rotor. The stator remains stationary, while the rotor rotates relative to the stator. Both stator and rotor are 3D printed from polylactic acid (PLA), and the printing temperature was set to 210 °C. The rotor consists of a rotation shaft and a rotating body, with a flexible arch ring attached to the end of the rotating body. A 0.1 mm thick Kapton polyimide film is adhered to the surface of the arch ring to form a friction layer. The stator is a cylindrical tube with an outer diameter of 75 mm, and two 0.1 mm thick copper foil layers are affixed to its inner wall to serve as electrodes. Kapton and copper foil are both adhered to the corresponding positions by applying a layer of pressure-sensitive adhesive on the back. Figure 1c shows the unfolded electrode layers. Both electrode layers exhibit a sawtooth pattern, each being divided into six segments, resulting in a 60 degrees rotational angle per segment. The electrode width is 25 mm, equal to the height of the rotor’s arch ring, and the distance between the two electrode layers is 1 mm. The sawtooth base of electrode layer one and the sawtooth apex of electrode layer two are aligned horizontally.

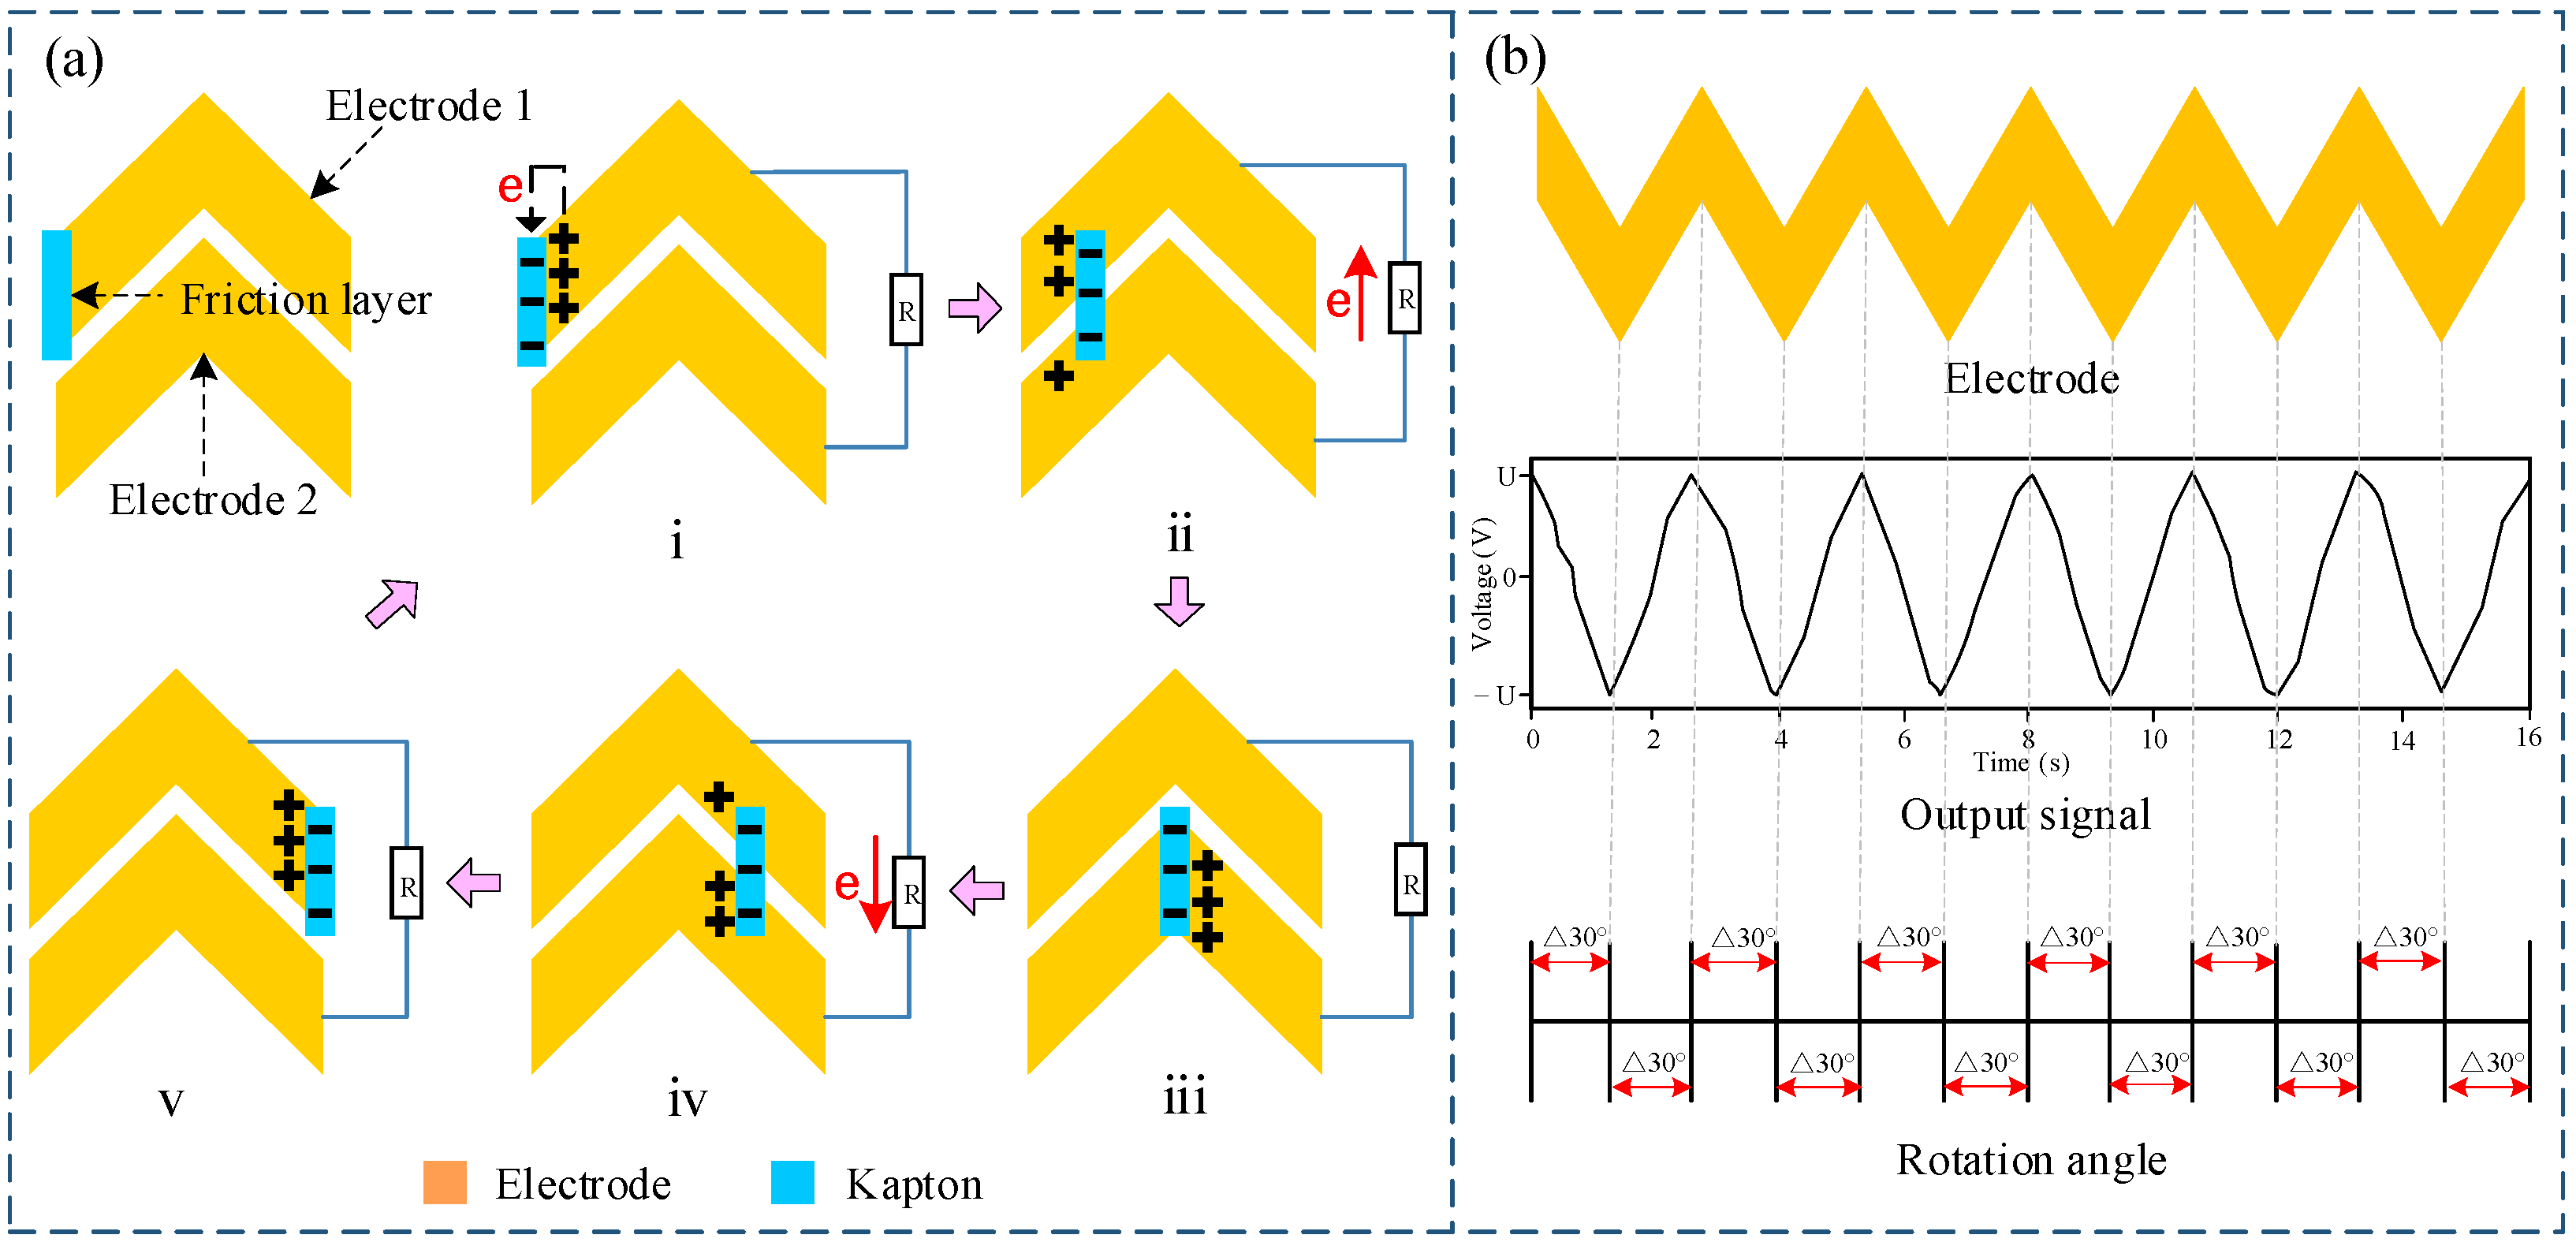
2.2. Working Principle

The Kapton friction layer on the rotor surface and the copper electrode layer on the stator surface form a sliding-mode triboelectric nanogenerator, which is more suitable for cyclic motion. During the rotation of the sensor’s rotor within the downhole power drilling tool, friction between the stator and rotor generates electrical pulse signals from the electrode layers. The unique design of the sensor electrode geometry produces six pulses per rotor revolution. Therefore, detection of a single pulse by the subsequent microprocessor indicates a 60 degrees rotor rotation, while six pulses signify a full revolution. Consequently, rotational speed and angle are determined by counting the number of electrical pulses generated by the sensor.
Figure 2a provides a detailed explanation of the rotational speed measurement principle. As shown in Figure 2(a-i) (initial state), the friction layer is in full contact with electrode one, generating triboelectric charges. Due to the differing electron affinities of the materials, the Kapton friction layer readily gains electrons, while the copper of electrode one readily loses them, resulting in a positive charge on the copper and an equal and opposite negative charge on the Kapton. As the rotor rotates, and as depicted in Figure 2(a-ii), the friction layer begins to separate from electrode one. During this process, the contact area between the Kapton and electrode one decreases, while the contact area with electrode two increases. The reduced attraction between the Kapton and the charge on electrode one causes charge to flow from electrode two to electrode one, inducing a current in the circuit. Further rotation to the state shown in Figure 2(a-iii), where the Kapton is fully separated from electrode one and in full contact with electrode two (half the distance of a single sawtooth electrode), completes the charge transfer, resulting in a peak voltage. Continued rotation to the state shown in Figure 2(a-iv) causes the Kapton to separate from electrode two and contact electrode one. This separation again reduces the attractive force, leading to a reverse charge transfer and a reverse current in the circuit. When the rotor completes a rotation across one sawtooth electrode, reaching the state in Figure 2(a-v), the Kapton is fully separated from electrode two and fully contacting electrode one, completing the reverse charge transfer and resulting in a reverse peak voltage.
Figure 2b illustrates the correspondence between the electrodes, the output waveform, and the rotation angle. One electrical pulse is generated per sawtooth electrode traversed by the rotor. Given the six sawtooth electrodes in the design, six pulses are generated per rotor revolution, meaning each pulse corresponds to a 60 degrees rotation. However, the sensor outputs bipolar pulses with both positive and negative voltage amplitudes. Therefore, 30 degrees angular resolution is achievable by differentiating between the positive and negative amplitudes within a single pulse. Consequently, the sensor not only measures rotational speed but also provides angular measurement with a resolution of 30 degrees based on the pulse signals.

3. Experiments and Analysis

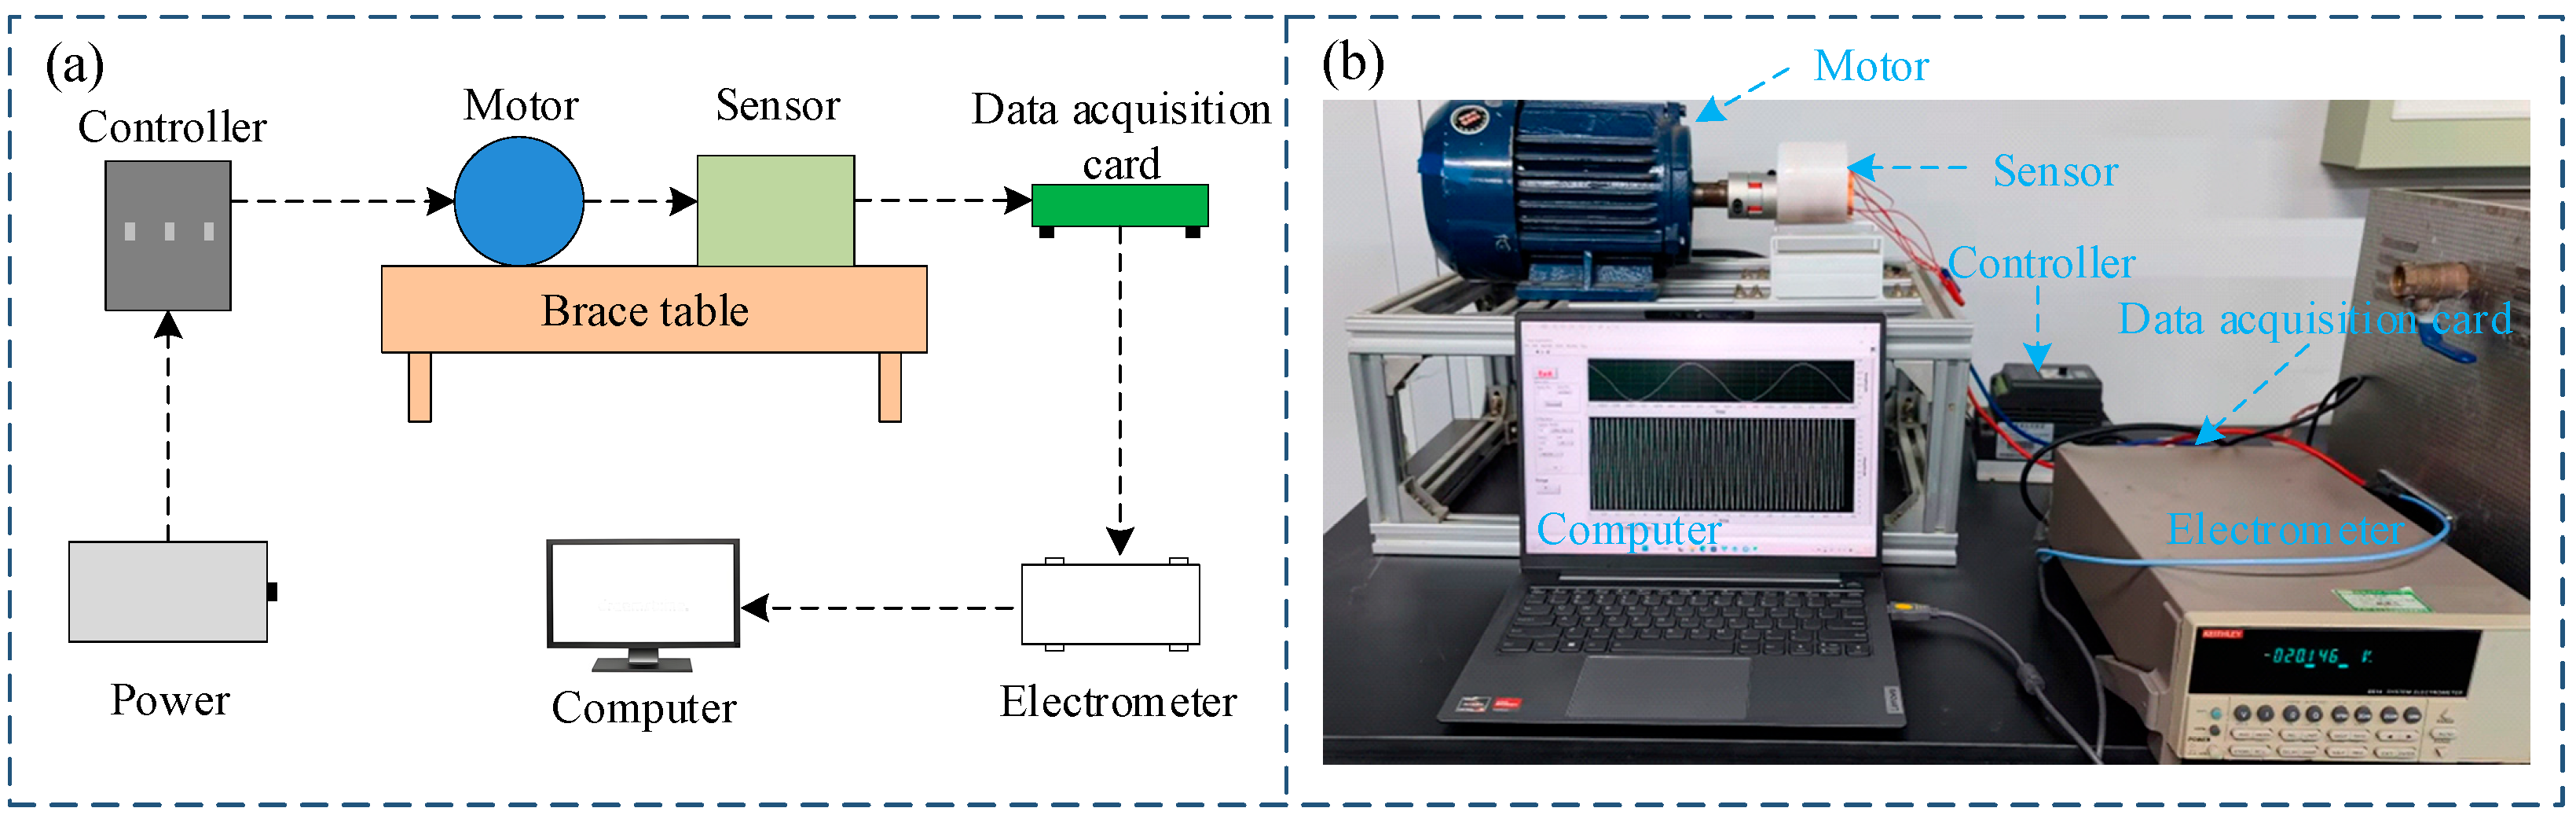
3.1. Experimental Setup

The indoor experimental setup is shown in Figure 3. The motor’s output shaft is connected to the sensor’s rotor, while the stator is fixed to a supporting platform. The motor’s rotation simulates the rotation of a downhole power drill. The motor speed is controlled by a controller, allowing precise control from 0 to 1000 rpm. The sensor’s output signal is processed sequentially by a data acquisition card and an electrometer before being input to a computer. LabVIEW (version 13.0)-based data processing software installed on the computer allows for real-time display and storage of the sensor’s output data. Experiments were conducted to test the sensor’s rotational speed measurement, angular measurement, power generation, and environmental adaptability functions, as detailed below.

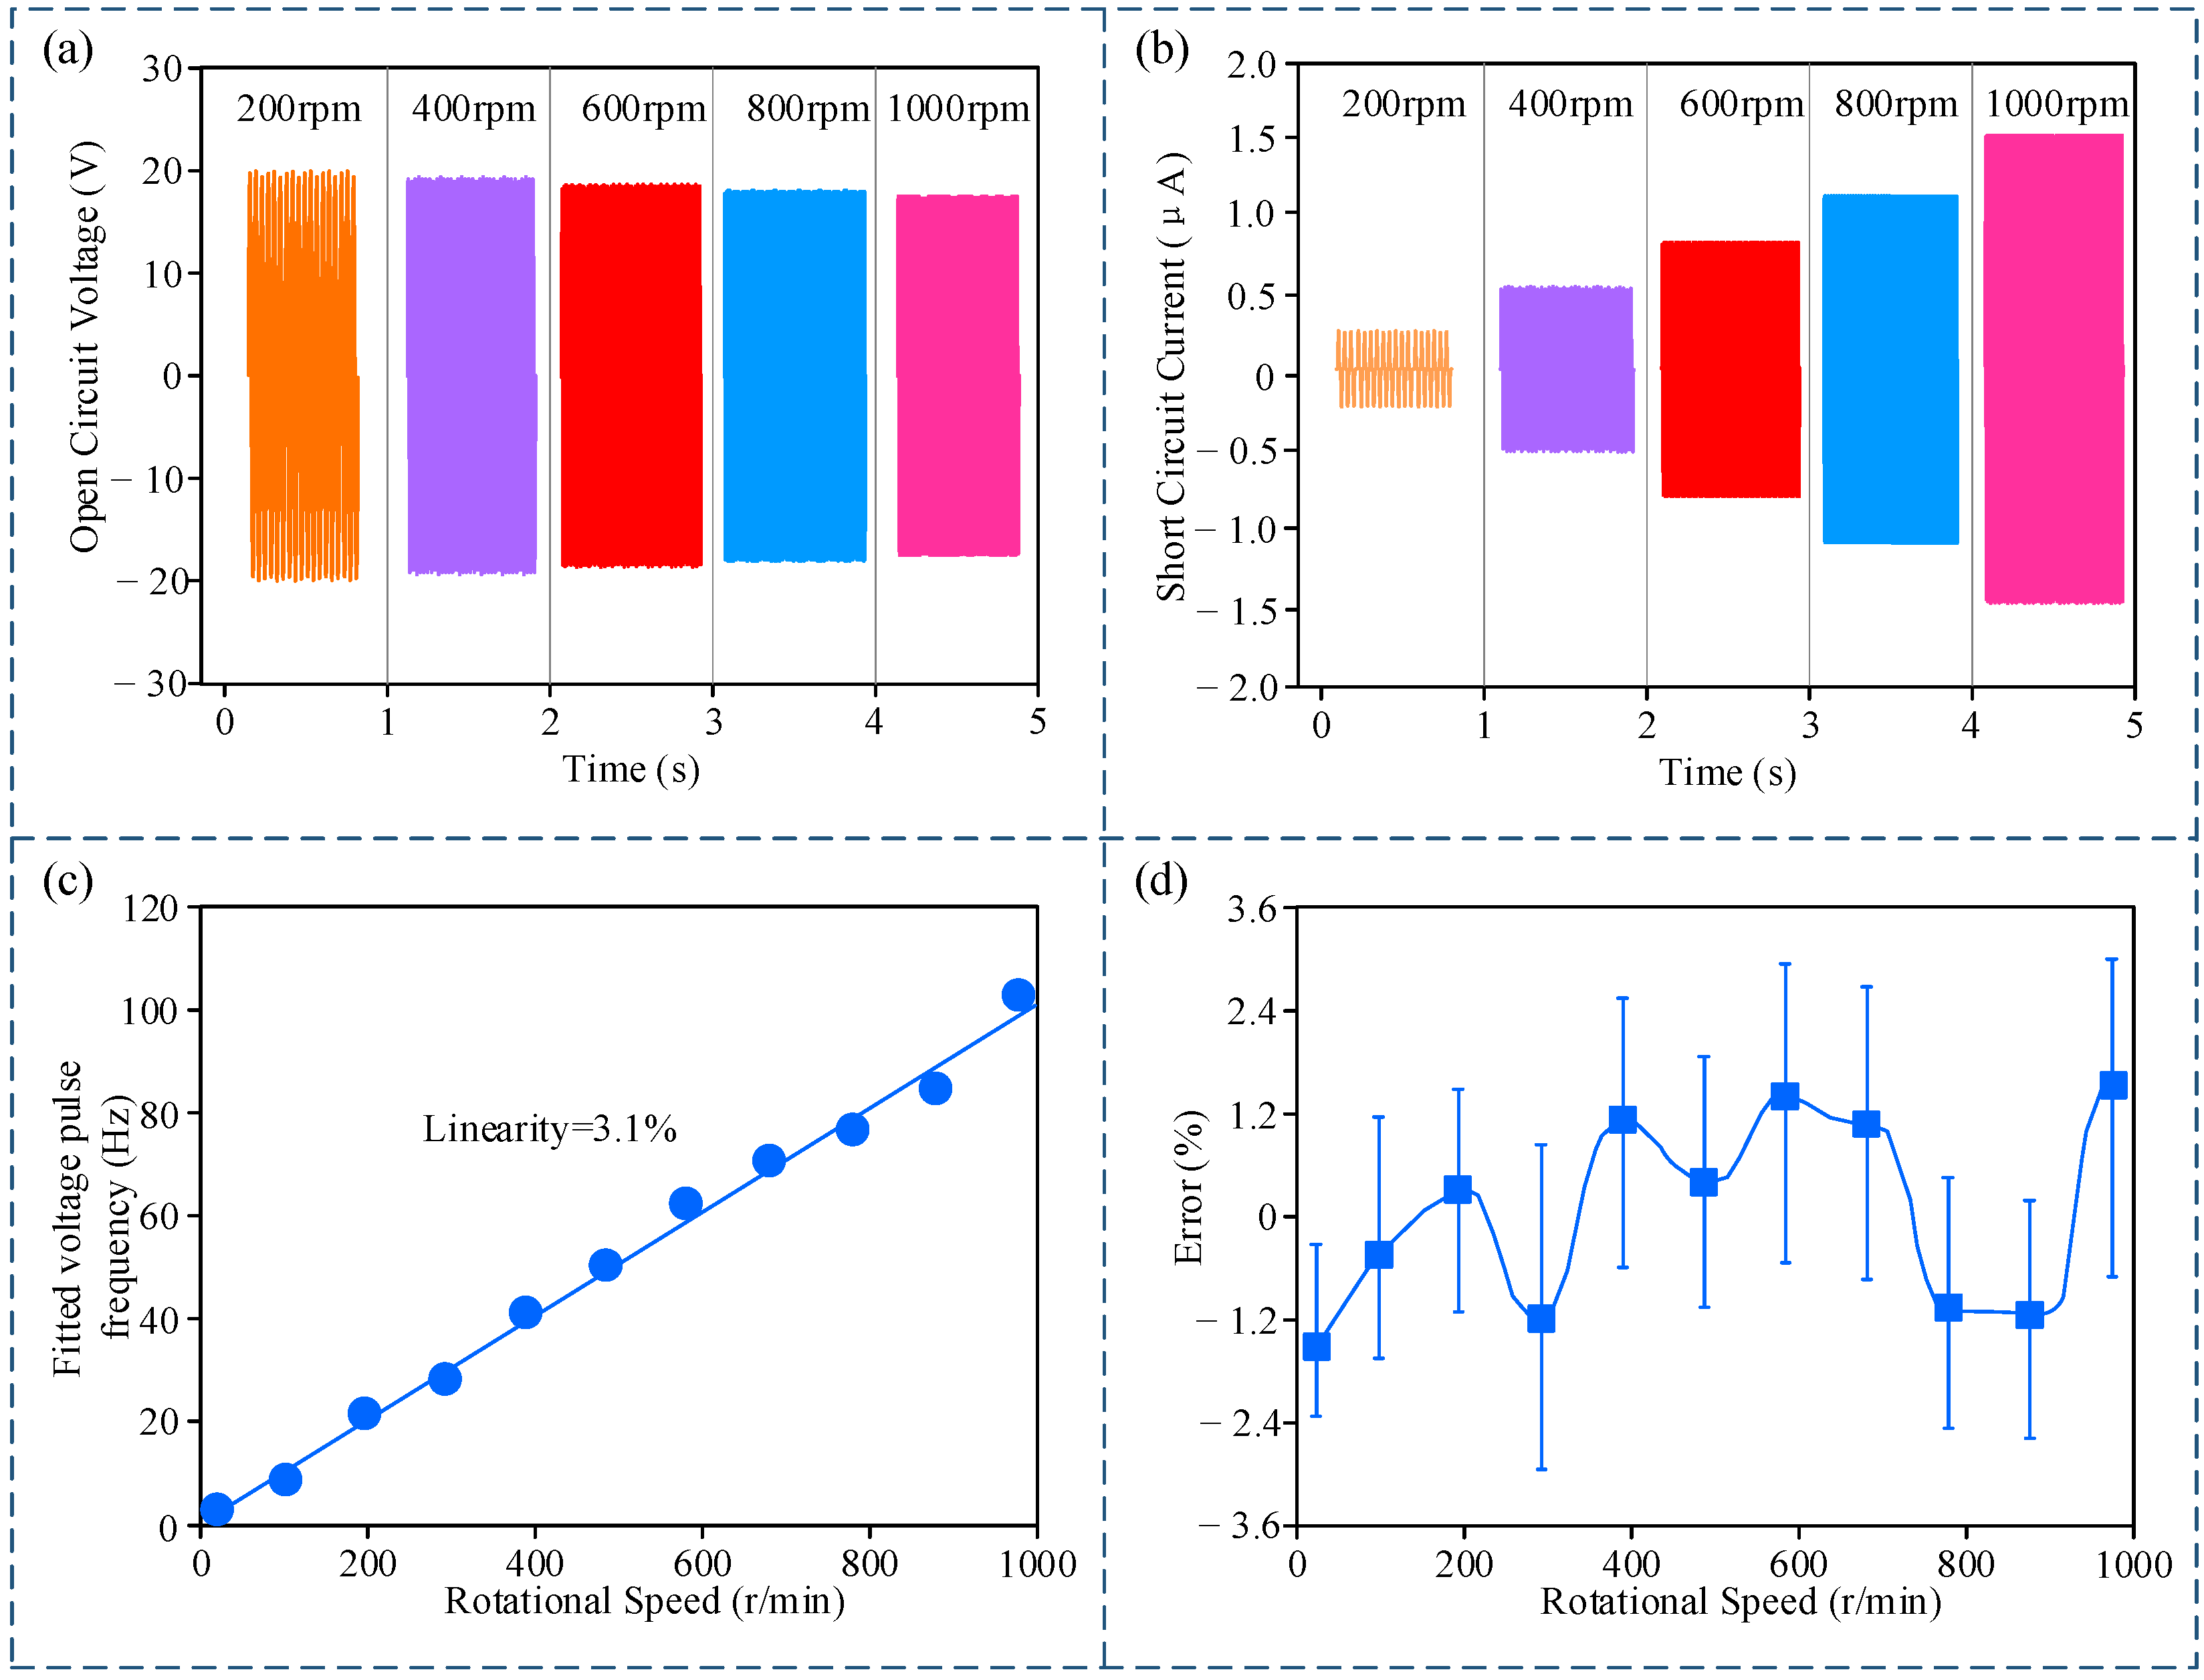
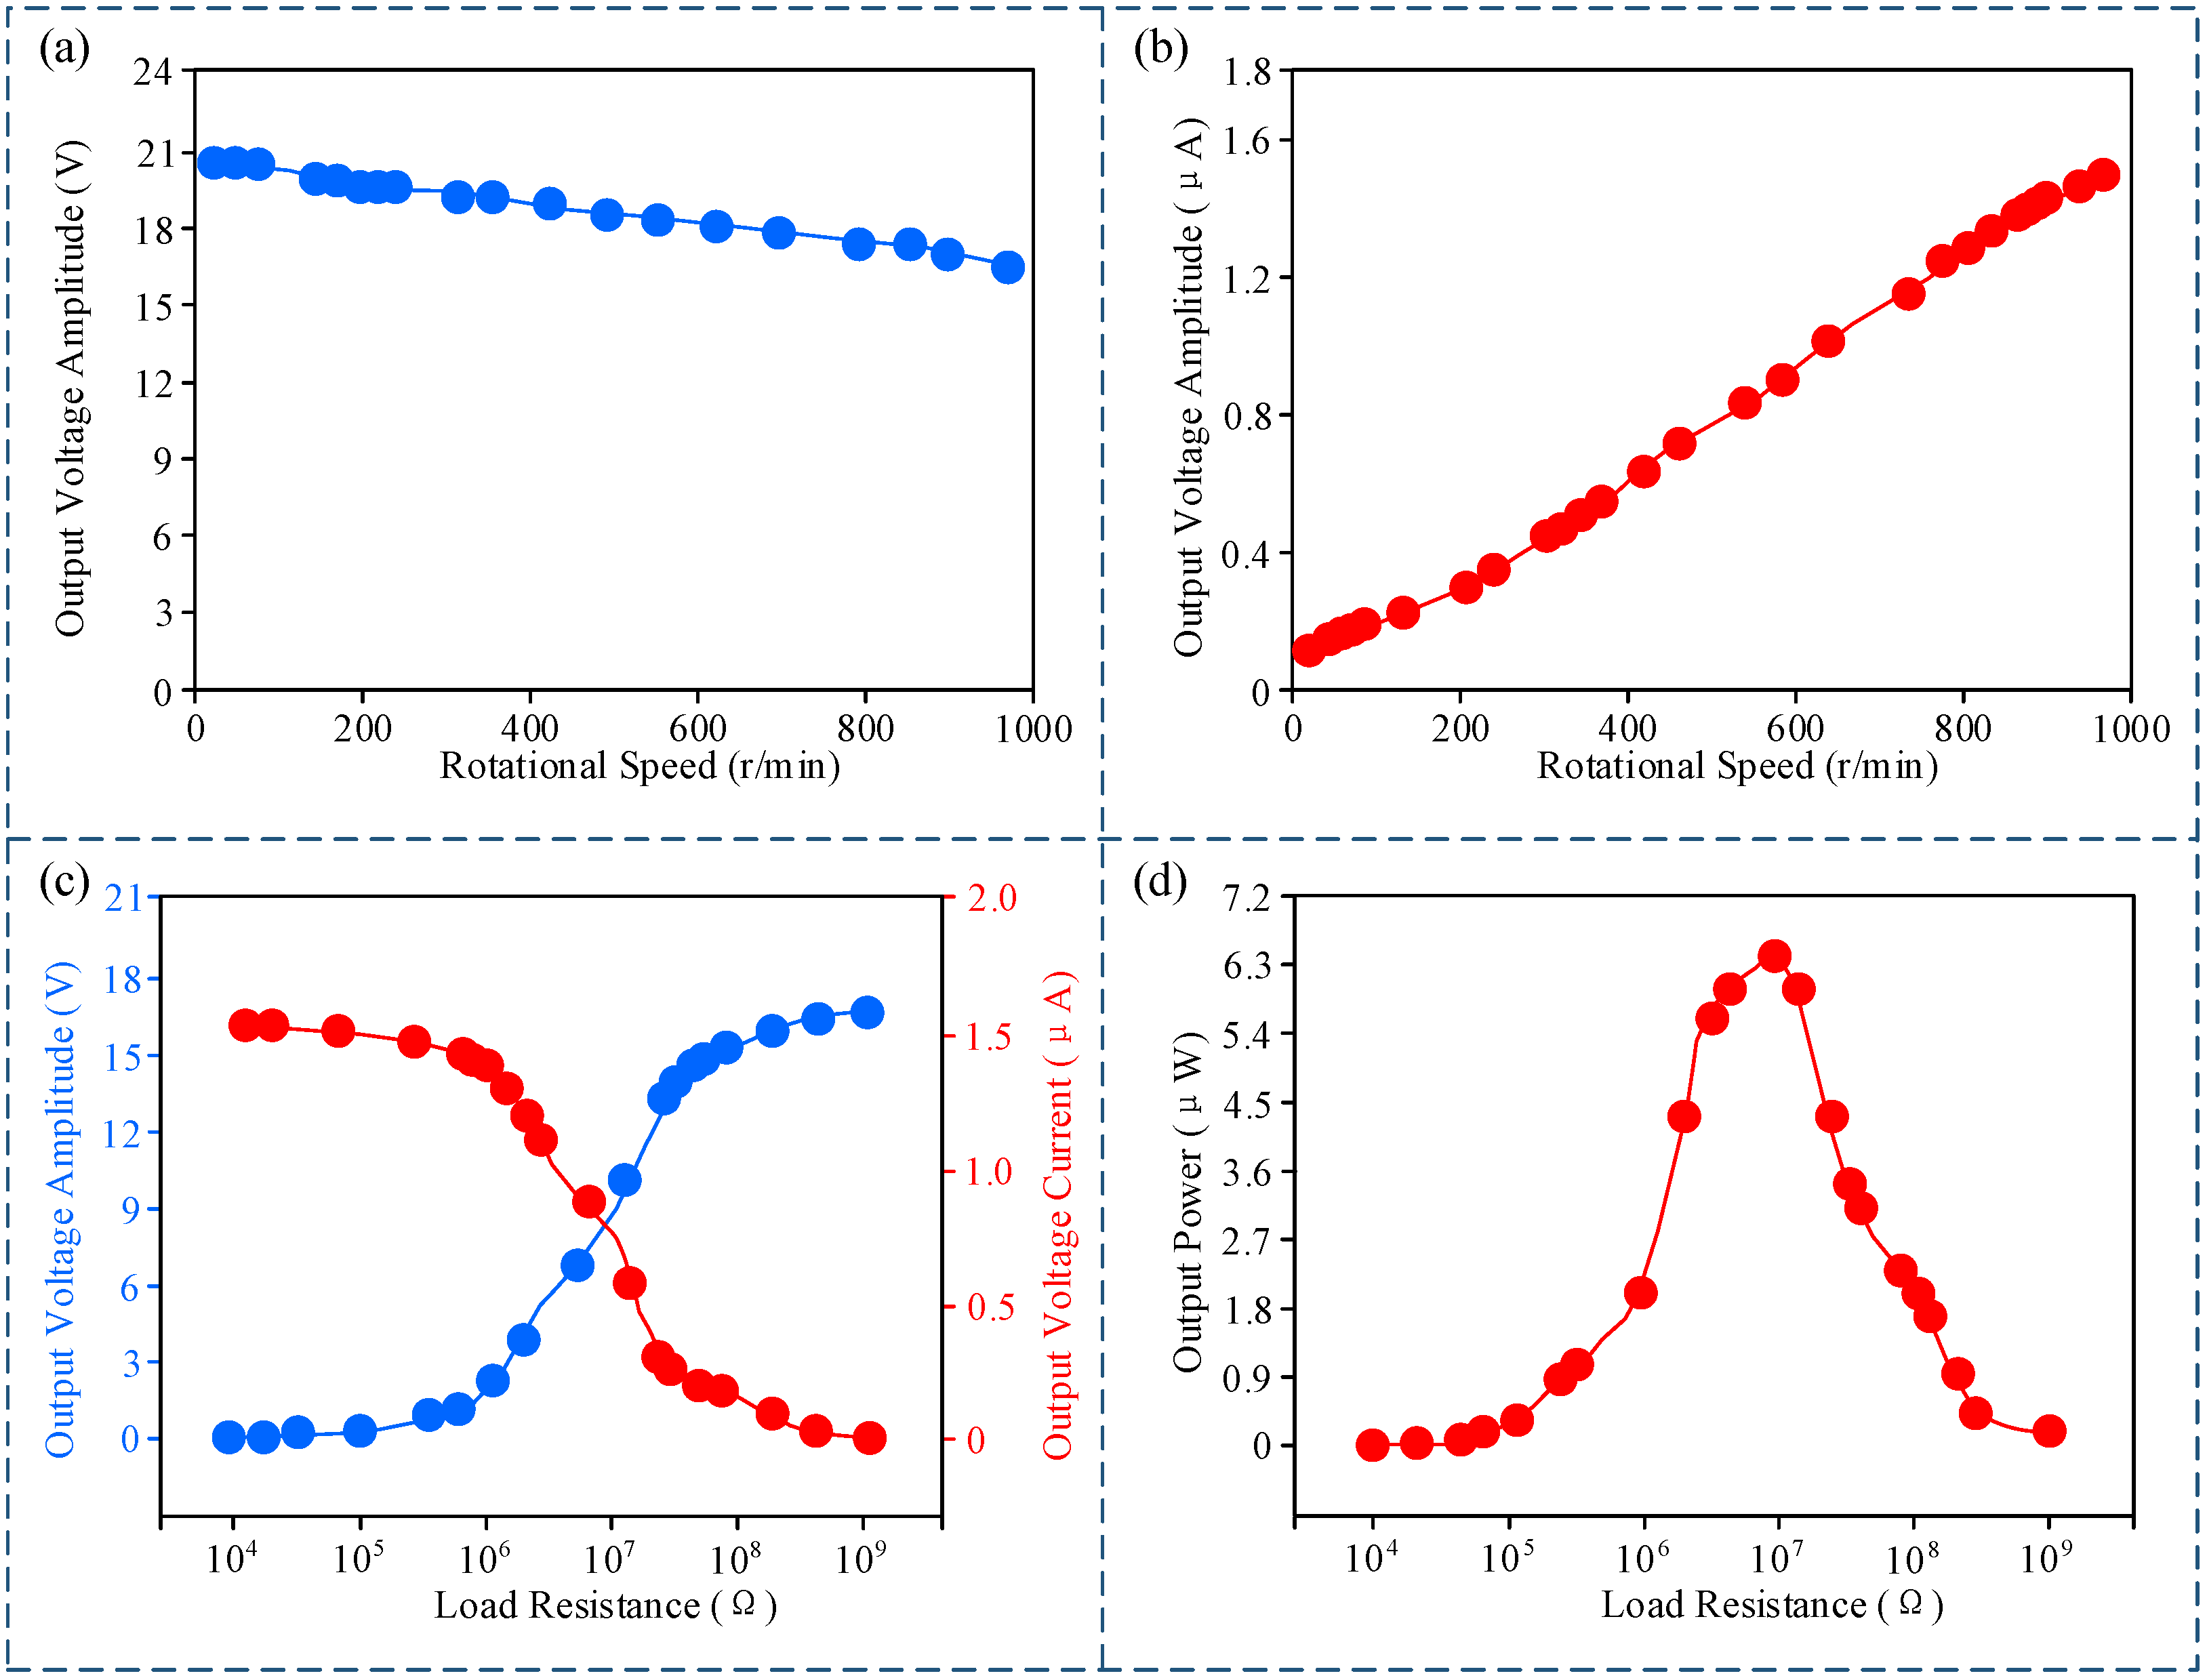
3.2. Rotational Speed Measurement Experiment

The rotational speed of bottomhole power drilling tools in actual drilling operations does not exceed 1000 rpm. Therefore, the sensor’s measurement range was defined as 0 to 1000 rpm, and the sensor’s rotational speed measurement characteristics were tested within this range. The experimental results are shown in Figure 4. Figure 4a shows that the amplitude of the sensor’s output voltage slightly decreases with increasing rotational speed. The triboelectric output voltage is theoretically only related to the friction contact area and the magnitude of the frictional force; therefore, the voltage should remain constant with increasing rotational speed. However, the arch ring bonded with Kapton is flexible. At higher rotational speeds, the recovery of the flexible material takes time, which may lead to insufficient friction contact, resulting in a slight reduction in the friction contact area and a slight decrease in output voltage. Figure 4b shows that the amplitude of the sensor’s output current gradually increases with increasing rotational speed. This is because an increased rotational speed leads to a greater number of friction contacts per unit time, resulting in an increased accumulation of charge per unit time. Since current is directly proportional to the amount of charge, the current also increases.
Both the voltage pulse and current pulse signals output by the sensor can be used for rotational speed measurement. However, as shown in Figure 4a,b, the amplitude of the voltage pulse signal is in volts (V), while the amplitude of the current pulse signal is in microamperes (µA). The magnitude of the voltage signal is significantly larger than that of the current signal. Given the presence of noise interference in practical environments, and the significantly larger magnitude of the voltage signal, the voltage signal exhibits far superior noise immunity compared to the current signal. Therefore, the voltage pulse signal was selected as the sensor’s rotational speed measurement signal. Subsequently, the output pulse frequency of the sensor at different rotational speeds was measured, and the results are shown in Figure 4c. This figure demonstrates a good linear relationship between the frequency of the sensor’s output voltage signal and the rotational speed, with a linearity of 3.1%, indicating that the maximum deviation of the fitted curve from the ideal straight line accounts for 3.1% of the full scale. Further testing of the measurement error within the measurement range was conducted using 10,000 sets of data. The dataset consists of 10,000 sets of voltage measurement results at different rotational speeds. Each set contains 11 data points corresponding to different rotational speeds. The resulting measurement error curve is shown in Figure 4d, indicating that the sensor’s measurement error is less than 3.2%, satisfying the requirements for downhole applications.

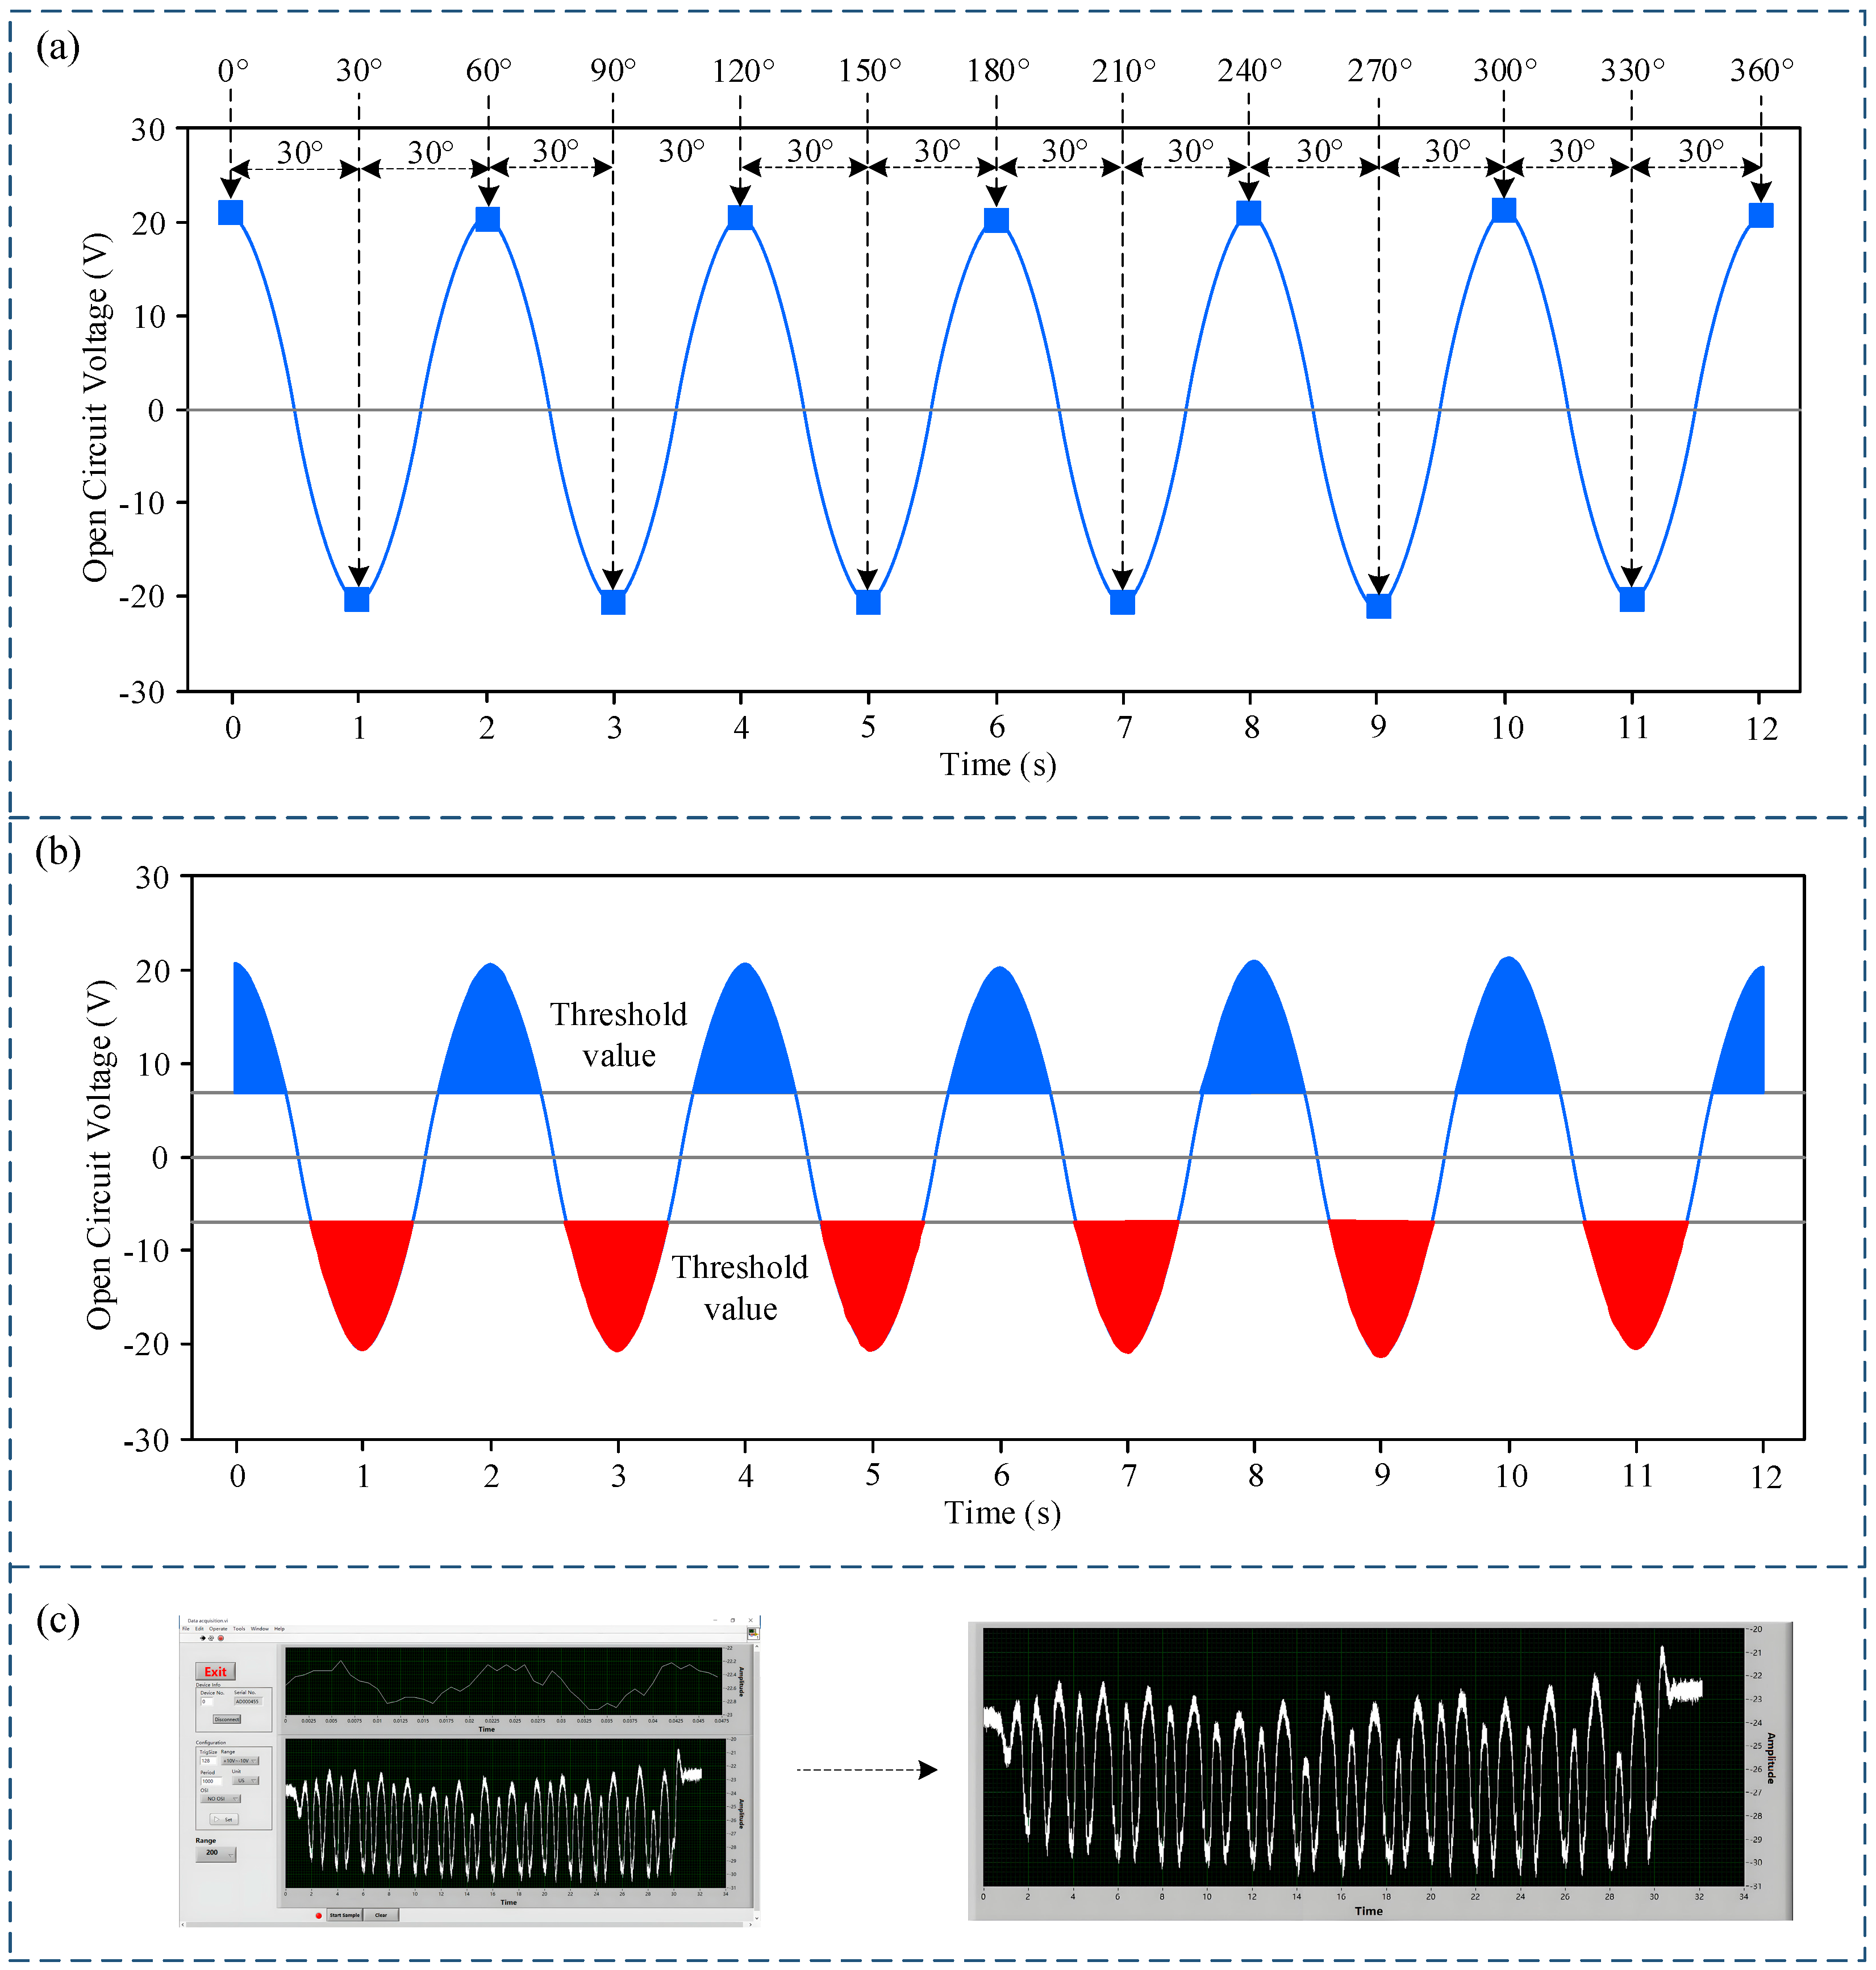
3.3. Relative Rotational Angle Measurement Experiments

The sensor achieves a relative rotational angle measurement resolution of 30 degrees. To verify this, experiments were conducted, and the results are shown in Figure 5. As shown in Figure 5a, during the experiment, the peak or trough of any arbitrarily selected electrode was chosen as the zero-angle reference point (0 degrees). The sensor was then rotated through one complete revolution, yielding six output waveforms. Therefore, the angular difference between consecutive waveforms is 60 degrees. As illustrated in Figure 5b, within a single waveform, the output voltage signal exhibits successive peaks and troughs. Peaks correspond to positive voltage, and troughs to negative voltage. Thus, a voltage polarity change occurs with each tooth of the rotor. Therefore, in the subsequent data processing, a voltage threshold is set to detect peaks and valleys, thereby improving the sensor’s angular measurement resolution to 30 degrees, wherein the threshold voltage is determined based on the experimental conditions of this study. Since the sensor uses the same output signal for measuring both rotational speed and angle, differing only in the subsequent signal processing, the measurement error for relative rotational angle is the same as that for rotational speed, namely 3.2%. Figure 5c includes a screenshot of the sensor data processing software, displaying the actual data collected by the sensor.

3.4. Power Generation Performance Experiments

The sensor utilizes the triboelectric and electrostatic induction principles. Its operation inherently generates power during the sensing process. Therefore, its power generation characteristics were evaluated, with the results presented in Figure 6. Figure 6a shows that the output voltage decreased from 20.64 V to 16.92 V with increasing rotational speed. This is attributed to the reduced recovery capability after friction between the rotor and stator at higher speeds, resulting in a smaller contact area and consequently a lower output voltage. Figure 6b illustrates that the output current increased with rotational speed, reaching 1.52 μA at 1000 rpm. The sensor’s power generation performance under varying external loads was also investigated, with the experimental rotational speed set to 1000 rpm. As depicted in Figure 6c, the output current decreased while the output voltage increased with increasing external load, consistent with Ohm’s law. Finally, Figure 6d reveals a non-linear relationship between the generated power and the external load. A maximum power output of 6.4 µW was observed at a 10 MΩ external load. This power level can currently only supply the sensor itself and cannot power the subsequent circuits. Additionally, when the sensor is used as a power generation device, it needs to be connected to a load. However, when used as a sensor, no load is required.

3.5. Condition Adaptability Experiments

The sensor was subjected to environmental adaptability testing to account for the high temperature and humidity conditions prevalent in underground environments. The test results are shown in Figure 7. As illustrated in Figure 7a,b, the experiment was conducted at 200 rpm. When the relative humidity is high, surface charges on the material dissipate with moisture loss. At higher temperatures, intensified thermal motion of electrons increases resistance. Consequently, the sensor’s output voltage amplitude tends to decrease with increasing temperature and relative humidity. When the temperature increased from 0 to 160 degrees Celsius, the sensor’s output voltage signal experienced a significant attenuation, decreasing from an initial value of 20.1 V to 13.3 V, representing an approximate 34% reduction. Similarly, when the relative humidity increased from 0% to 90%, the sensor’s output voltage amplitude decreased from 19.8 V to 10.6 V, a reduction of approximately 46%.
The sensor outputs a pulse signal directly compatible with the pulse signal input port of a subsequent microprocessor. Both hardware ports adhere to the Transistor–Transistor Logic (TTL) level standard. TTL logic level recognition is based on the amplitude of the input pulse signal. An input pulse signal amplitude exceeding 2 V is considered valid (high level); otherwise, the input signal is deemed invalid. According to the TTL logic level standard, although the output voltage amplitude of the sensor shows a significant decrease across the temperature range of 0 to160 degrees Celsius and the relative humidity range of 0 to 90%, the attenuated amplitude still significantly surpasses the TTL signal recognition threshold. Therefore, the sensor remains operational under these conditions.
Further testing assessed the sensor’s long-term stability, with results shown in Figure 7c,d. Figure 7c displays the output voltage waveform under different cycle numbers, where each rotation for 10 s is considered one cycle, while Figure 7d presents a fitted curve of the data in Figure 7c. They are also the stability of the sensor. Figure 7c,d reveal that after 50,000 cycles of working the output voltage amplitude decreased from an initial 19.2 V to 17.4 V, a reduction of approximately 9%. However, the attenuated amplitude still exceeds the TTL logic level recognition threshold, demonstrating the sensor’s long-term stability.

4. Conclusions and Discussions

This study presents a novel self-powered multifunctional rotational speed sensor for bottomhole power drilling tools based on the triboelectric nanogenerator. The sensor enables the measurement of rotational speed and angle under self-powered operation. Experimental results demonstrate a rotational speed measurement range of 0 to1000 rpm, an angular resolution of 30 degrees, and a measurement error less than 3.2%, demonstrating that it can meet the accuracy requirements for actual underground rotational speed and angle measurements. The maximum power generation is 6.4 µW under a 10 MΩ load, demonstrating that it can meet the self-powering requirements of the sensor while also providing a potential power source for other instruments. The sensor operates reliably within a temperature range of 0 to 160 degrees Celsius and a relative humidity range of 0 to 90%, exhibiting excellent performance.
Compared with conventional downhole rotational speed sensors, the developed multifunctional sensor offers several advantages. Firstly, its dual functionality, encompassing both rotational speed and angular displacement measurement, provides more precise data for dynamic control of surface drilling operations. Secondly, the generator has a self-powering capability. If the power output continues to increase in the future, it holds promise for solving the power supply challenges in underground environments. At the same time, it also provides a reference for rotational speed measurement in other fields.
The current power output of the sensor remains relatively low, sufficient only for its own operation and insufficient to power other downhole drilling-while-drilling (DWD) measurement instruments and sensors. Therefore, future research will focus on three key approaches to increase the sensor’s power generation. First, the sensor’s structural design will be optimized to increase its effective triboelectric contact area. Second, novel triboelectric nanogenerator materials will be selected to ensure optimal energy harvesting efficiency. Third, novel nanowire structures will be synthesized to modify the nanomaterial surface morphology, thereby enhancing power generation.

Author Contributions

Conceptualization, J.Y., J.L. and H.Z.; methodology, J.Y.; software, L.C.; validation, J.L., L.C. and H.Z.; formal analysis, J.L.; investigation, H.Z.; resources, L.C.; data curation, J.Y.; writing—original draft preparation, J.Y.; writing—review and editing, H.Z.; visualization, L.C.; supervision, J.L.; project administration, J.Y.; and funding acquisition, H.Z. All authors have read and agreed to the published version of the manuscript.

Funding

This research was funded by National Major Science and Technology Special Project: research and development on high efficiency downhole power drilling tool for high temperature resistant, grant number 2024ZD1000903.

Institutional Review Board Statement

Not applicable.

Informed Consent Statement

Not applicable.

Data Availability Statement

The raw data supporting the conclusions of this article will be made available by the authors on request.

Conflicts of Interest

The authors declare no conflicts of interest.

References

  1. Gowida, A.; Gamal, H.; Elkatatny, S. Exploring the potential of laser technology in oil well drilling: An overview. Geoenergy Sci. Eng. 2023, 230, 212278. [Google Scholar] [CrossRef]
  2. Ghanitoos, H.; Goharimanesh, M.; Akbari, A. Prediction of drill penetration rate in drilling oil wells using mathematical and neurofuzzy modeling methods. Energy Rep. 2024, 11, 145–152. [Google Scholar] [CrossRef]
  3. Zhang, Y.; Zhang, L.; Gao, Y.; Shi, P.; Wang, Y.; Kong, L. Research on Erosion Damage Laws and Structural Optimization of Bypass Valve for Positive Displacement Motors. Processes 2024, 12, 1953. [Google Scholar] [CrossRef]
  4. Gong, Y.; Liu, Y.; Peng, C. Hydraulic loss analysis of turbodrill blade cascades based on entropy production theory. Geoenergy Sci. Eng. 2024, 241, 213093. [Google Scholar] [CrossRef]
  5. Alsaihati, A.; Elkatatny, S.; Mahmoud, A.A.; Abdulraheem, A. Use of machine learning and data analytics to detect downhole abnormalities while drilling horizontal wells, with real case study. J. Energy Resour. Technol. 2021, 143, 043201. [Google Scholar] [CrossRef]
  6. Mirzaei, M.; Ripka, P.; Grim, V. A novel structure of an eddy current sensor for speed measurement of rotating shafts. IEEE Trans. Energy Convers. 2022, 38, 170–179. [Google Scholar] [CrossRef]
  7. Lu, C.; Zhu, R.; Yu, F.; Jiang, X.; Liu, Z.; Dong, L.; Hua, Q.; Ou, Z. Gear rotational speed sensor based on FeCoSiB/Pb(Zr,Ti)O3 magnetoelectric composite. Measurement 2021, 168, 108409. [Google Scholar] [CrossRef]
  8. Li, Z.-M.; Chen, L.-L.; Ren, Y.; Qiu, S.; Liu, T.; Wang, C.; Wang, H. Laser-Based Detection of Rotation Speed with High Accuracy and High signal-to-Noise Ratio (SNR) Based on the Rotational Doppler Effect. Lasers Eng. 2021, 50, 367. [Google Scholar]
  9. Chen, C.; Ma, T.; Jin, H.; Wu, Y.; Hou, Z.; Li, F. Torque and rotational speed sensor based on resistance and capacitive grating for rotational shaft of mechanical systems. Mech. Syst. Signal Process. 2020, 142, 106737. [Google Scholar] [CrossRef]
  10. Fan, F.R.; Tian, Z.Q.; Wang, Z.L. Flexible triboelectric generator. Nano Energy 2012, 1, 328–334. [Google Scholar] [CrossRef]
  11. Wang, Z.L.; Yang, Y.; Zhai, J.; Wang, J. (Eds.) Handbook of Triboelectric Nanogenerators; Springer Nature: Berlin/Heidelberg, Germany, 2023. [Google Scholar]
  12. Cheng, T.; Shao, J.; Wang, Z.L. Triboelectric nanogenerators. Nat. Rev. Methods Primers 2023, 3, 39. [Google Scholar] [CrossRef]
  13. Prasanna, A.P.S.; Anithkumar, M.; Kim, S.J. Hybrid Triboelectric Nanogenerators: Revolutionizing the Energy Harvesting through Material Diversity and Device Architecture for Different Applications. Nano Energy 2024, 131, 110253. [Google Scholar] [CrossRef]
  14. Pan, Y.C.; Dai, Z.; Ma, H.; Zheng, J.; Leng, J.; Xie, C.; Yuan, Y.; Yang, W.; Yalikun, Y.; Song, X.; et al. Self-powered and speed-adjustable sensor for abyssal ocean current measurements based on triboelectric nanogenerators. Nat. Commun. 2024, 15, 6133. [Google Scholar] [CrossRef] [PubMed]
  15. Hajara, P.; Shijeesh, M.R.; Rose, T.P.; Saji, K.J. ZnO-based triboelectric nanogenerator and tribotronic transistor for tactile switch and displacement sensor applications. Sens. Actuators A Phys. 2024, 377, 115728. [Google Scholar] [CrossRef]
  16. Chen, Z.; Xu, M.; Zhou, C.; Hu, Z.; Du, Z.; Fu, X.; Song, Y.; Jia, Y.; Wen, X.; Wang, J.; et al. Phase transformation enabled textile triboelectric nanogenerators for wearable energy harvesting and personal thermoregulation. Nano Energy 2024, 132, 110361. [Google Scholar] [CrossRef]
  17. Gao, Y.; Xu, B.; Tan, D.; Li, M.; Wang, Y.; Yang, Y. Asymmetric-elastic-structure fabric-based triboelectric nanogenerators for wearable energy harvesting and human motion sensing. Chem. Eng. J. 2023, 466, 143079. [Google Scholar] [CrossRef]
  18. Chen, C.; Guo, D.; Tuo, L.; Wen, Y.; Li, J.; Qu, H.; Wen, H.; Wan, L.; Liu, G.; Guo, H. One Meter Triboelectric Nanogenerator for Efficient Harvesting of Meter-Scale Wave Energy. Adv. Funct. Mater. 2024, 34, 2406775. [Google Scholar] [CrossRef]
  19. Mu, Q.; He, W.; Shan, C.; Fu, S.; Du, S.; Wang, J.; Wang, Z.; Li, K.; Hu, C. Achieving High-Efficiency Wind Energy Harvesting Triboelectric Nanogenerator by Coupling Soft Contact, Charge Space Accumulation, and Charge Dissipation Design. Adv. Funct. Mater. 2024, 34, 2309421. [Google Scholar] [CrossRef]
  20. Choi, J.A.; Jeong, J.; Kang, M.; Ko, H.J.; Kim, T.; Park, K.; Kim, J.; Pyo, S. Externally motionless triboelectric nanogenerator based on vortex-induced rolling for omnidirectional wind energy harvesting. Nano Energy 2024, 119, 109071. [Google Scholar] [CrossRef]
  21. Cao, Y.; Su, E.; Sun, Y.; Wang, Z.L.; Cao, L.N. A Rolling-Bead Triboelectric Nanogenerator for Harvesting Omnidirectional Wind-Induced Energy toward Shelter Forests Monitoring. Small 2024, 20, 2307119. [Google Scholar] [CrossRef]
  22. Dong, Y.; Feng, M.; Cheng, J.; Chang, S.; Wang, D.; Lu, W. Ring-shaped single-electrode triboelectric nanogenerator (RSE-TENG) for energy harvesting and liquid flow rate monitoring of gas-liquid two-phase flow. Nano Energy 2024, 119, 109083. [Google Scholar] [CrossRef]
  23. Ye, C.; Liu, D.; Chen, P.; Cao, L.N.Y.; Li, X.; Jiang, T.; Wang, Z.L. An integrated solar panel with a triboelectric nanogenerator array for synergistic harvesting of raindrop and solar energy. Adv. Mater. 2023, 35, 2209713. [Google Scholar] [CrossRef]
  24. Wang, R.; Ren, J.; Ding, W.; Liu, M.; Pan, G.; Wu, C. Research on Vibration Accumulation Self-Powered Downhole Sensor Based on Triboelectric Nanogenerators. Micromachines 2024, 15, 548. [Google Scholar] [CrossRef]
  25. Feng, Y.; Pan, G.; Wu, C. Experiment Study of Deformable Honeycomb Triboelectric Nanogenerator for Energy Collection and Vibration Measurement in Downhole. Appl. Sci. 2024, 14, 2539. [Google Scholar] [CrossRef]
  26. Du, T.; Dong, F.; Xi, Z.; Zhu, M.; Zou, Y.; Sun, P.; Xu, M. Recent advances in mechanical vibration energy harvesters based on triboelectric nanogenerators. Small 2023, 19, 2300401. [Google Scholar] [CrossRef]
  27. Segkos, A.; Tsamis, C. Rotating triboelectric nanogenerators for energy harvesting and their applications. Nanoenergy Adv. 2023, 3, 170–219. [Google Scholar] [CrossRef]
  28. Zhao, L.; Ling, Q.; Fan, X.; Gu, H. Self-healable, adhesive, anti-drying, freezing-tolerant, and transparent conductive organohydrogel as flexible strain sensor, triboelectric nanogenerator, and skin barrier. ACS Appl. Mater. Interfaces 2023, 15, 40975–40990. [Google Scholar] [CrossRef]
  29. Lu, P.; Guo, X.; Liao, X.; Liu, Y.; Cai, C.; Meng, X.; Wei, Z.; Du, G.; Shao, Y.; Nie, S.; et al. Advanced Application of Triboelectric Nanogenerators in Gas Sensing. Nano Energy 2024, 126, 109672. [Google Scholar] [CrossRef]
  30. Veeralingam, S.; Badhulika, S. Ti@ MoS2 incorporated Polypropylene/Nylon fabric-based porous, breathable triboelectric nanogenerator as respiration sensor and ammonia gas sensor applications. Sens. Actuators B Chem. 2023, 380, 133346. [Google Scholar] [CrossRef]
  31. Chandrasekhar, A.; Basith, S.A.; Vivekananthan, V.; Khandelwal, G.; Raj, N.P.M.J.; Purusothaman, Y.; Kim, S.J. Smart maracas: An innovative triboelectric nanogenerator for earthquake detection and energy harvesting. Nano Energy 2024, 123, 109379. [Google Scholar] [CrossRef]
  32. Cao, L.N.Y.; Xu, Z.; Wang, Z.L. Application of triboelectric nanogenerator in fluid dynamics sensing: Past and future. Nanomaterials 2022, 12, 3261. [Google Scholar] [CrossRef] [PubMed]
  33. Wang, D.; Zhang, D.; Tang, M.; Zhang, H.; Sun, T.; Yang, C.; Mao, R.; Li, K.; Wang, J. Ethylene chlorotrifluoroethylene/hydrogel-based liquid-solid triboelectric nanogenerator driven self-powered MXene-based sensor system for marine environmental monitoring. Nano Energy 2022, 100, 107509. [Google Scholar] [CrossRef]
  34. Panda, S.; Jeong, H.; Hajra, S.; Rajaitha, P.; Hong, S.; Kim, H.J. Biocompatible polydopamine based triboelectric nanogenerator for humidity sensing. Sens. Actuators B Chem. 2023, 394, 134384. [Google Scholar] [CrossRef]
  35. Mohamadbeigi, N.; Shooshtari, L.; Fardindoost, S.; Vafaiee, M.; Zad, A.I.; Mohammadpour, R. Self-powered triboelectric nanogenerator sensor for detecting humidity level and monitoring ethanol variation in a simulated exhalation environment. Sci. Rep. 2024, 14, 1562. [Google Scholar] [CrossRef]
  36. Wu, C.; Zou, H. Research on self-powered rainfall sensor suitable for landslide monitoring based on triboelectric nanogenerator. IEEE Sens. J. 2023, 24, 2620–2627. [Google Scholar] [CrossRef]
  37. Domingos, I.; Saadi, Z.; Sadanandan, K.S.; Pocinho, H.A.; Caetano, D.M.; Neves, A.I.; Craciun, M.F.; Alves, H. Printed graphene electrodes for textile-embedded triboelectric nanogenerators for biomechanical sensing. Nano Energy 2023, 115, 108688. [Google Scholar] [CrossRef]
  38. Jaurker, D.; Gupta, P.; Sahu, A.; Joshi, S.S.; Palani, I. Investigation of Laser micro-textured triboelectric nanogenerator based self-powered vibration sensor for industry 4.0 application. Sens. Actuators A Phys. 2024, 377, 115679. [Google Scholar] [CrossRef]
  39. Kaushik, P.S.; Gupta, P.; Diksha, J.; Tripathi, A.S.; Joshi, S.S.; Palani, I.A. Investigation of laser-textured triboelectric nanogenerator for vibration sensing of machine tools. Smart Mater. Struct. 2023, 32, 085028. [Google Scholar]
  40. Gao, S.; Li, G.; Wu, S.; Cheng, T.X.; Sha, Z.; He, S.; Peng, S.; Wang, C.H. High-bandwidth self-powered vibration sensors based on triboelectric particle-surface interactions. Nano Energy 2024, 119, 109060. [Google Scholar] [CrossRef]
Figure 1. Schematic diagram of the sensor structure and working principle. (a) Schematic diagram of the sensor installation environment; (b) schematic diagram of the sensor structure; and (c) unfolded diagram of the sensor electrode structure.
Applsci 15 03196 g001
Figure 2. Schematic diagrams illustrating the sensor operating principle. (a) Schematic diagram of the rotational speed measurement principle and (b) schematic diagram of the angular measurement principle.
Applsci 15 03196 g002
Figure 3. Experimental setup. (a) Schematic diagram of the experimental setup and (b) photograph of the experimental setup.
Applsci 15 03196 g003
Figure 4. Rotational speed measurement experimental results. (a) Open-circuit voltage waveforms at different rotational speeds; (b) short-circuit current waveforms at different rotational speeds; (c) fitted voltage pulse curves at different rotational speeds; and (d) measurement errors at different rotational speeds.
Applsci 15 03196 g004
Figure 5. Relative rotational angle measurement experimental results. (a) Correspondence between sensor output waveform and angle; (b) schematic diagram of subsequent data processing for sensor angle measurement; and (c) screenshot of sensor data processing software (Version 2.0.0).
Applsci 15 03196 g005
Figure 6. Power generation performance experimental results. (a) Output voltage of the sensor at different rotational speeds; (b) output current of the sensor at different rotational speeds; (c) output voltage and current of the sensor under different loads; and (d) output power of the sensor under different loads.
Applsci 15 03196 g006
Figure 7. Condition adaptability experimental results. (a) Output voltage of the sensor at different temperatures; (b) output voltage of the sensor at different relative humidity levels; (c) output voltage waveforms of the sensor under different cycle numbers; and (d) fitted curves of the output voltage of the sensor under different cycle numbers.
Applsci 15 03196 g007
Disclaimer/Publisher’s Note: The statements, opinions and data contained in all publications are solely those of the individual author(s) and contributor(s) and not of MDPI and/or the editor(s). MDPI and/or the editor(s) disclaim responsibility for any injury to people or property resulting from any ideas, methods, instructions or products referred to in the content.

