
Consumer Perceptions and Attitudes Towards Ultra-Processed Foods

 ,
,  ,
,  , , and
Abstract
:1. Introduction
- The growing public debate surrounding UPFs involves health concerns, socio-economic factors, and environmental sustainability, all of which contribute to shifting consumer preferences [8]. For example, increased awareness of nutrition-related diseases and sustainable eating habits may lead consumers to reconsider their food choices, while economic constraints and lifestyle convenience continue to increase demand for UPFs.
- Although aggressive marketing, including digital advertising and celebrity endorsements, influences consumer trust and willingness to purchase these products [9], consumers are more mindful of the harmful consequences of consuming such foods. As a result, manufacturers have leveraged advancements in food technology and marketing strategies to offer and promote UPFs with healthier components and reduced nutrients of concern.
- The vast amount of data and the multifaceted nature of the problem require the application of innovative data analysis methods. Meanwhile, methods for analysing consumer attitudes and decision-making processes have expanded significantly with the integration of big data analytics, multi-criteria decision-making (MCDM), sentiment analysis, and other advanced artificial intelligence (AI) techniques [10]. These methods, tools, and technologies offer deeper insights into behavioural trends and help uncover the underlying motivations behind UPF consumption.
- Develop a conceptual model that allows for the systematic examination of consumer attitudes towards UPFs and the identification of underlying behavioural patterns influencing purchasing decisions.
- Gather and structure a dataset reflecting consumer experiences, perceptions, and preferences regarding UPFs, incorporating key socio-economic and demographic factors, and food preferences.
- Identify the main determinants that impact consumer willingness to purchase UPFs by reviewing previous studies and proposing appropriate analytical approaches to assess their impact.
- Construct and validate mathematical models based on the identified factors and compare the results with findings from prior research on food consumption behaviour.
2. State-of-the-Art Review of Consumer Attitudes Towards Ultra-Processed Foods
2.1. Key Features and Taxonomy of Ultra-Processed Foods
- The expansion of functional UPFs—in response to increasing health consciousness, food manufacturers are reformulating UPFs by incorporating added vitamins, fibre, probiotics, and protein-enriched alternatives [9]. These so-called “healthier” UPFs aim to appeal to consumers looking for convenient yet nutritionally enhanced options.
- Growth of plant-based UPFs—the demand for plant-based diets has led to a surge in UPFs marketed as vegetarian or vegan alternatives, such as meat substitutes and dairy-free products. While these products align with sustainability and ethical consumption trends, they often remain highly processed, containing emulsifiers and synthetic ingredients [16].
- Ultra-convenience in food innovation—the rise of ready-to-eat meals, instant snacks, and meal replacement products reflects a shift in consumer preferences toward faster and more effortless eating solutions. Many of these products prioritise convenience over nutritional value, contributing to an increased intake of ultra-processed foods [17].
- Sustainability challenges and reformulation efforts—concerns over environmental sustainability have prompted some manufacturers to explore eco-friendly packaging, reduce food waste, and develop “clean-label” UPFs with fewer artificial additives [18]. However, balancing sustainability with affordability and profitability remains a challenge.
- Increased reliance on digital food marketing—brands leverage social media platforms, food delivery apps, and personalised advertising to target consumers with UPF promotions [19]. The use of influencer endorsements and algorithm-driven recommendations have contributed to the growing acceptance and appeal of UPFs, particularly among younger consumers.
2.2. Assessing Ultra-Processed Foods
3. Related Work
3.1. Consumer Attitudes Towards Ultra-Processed Foods and Their Influence on Purchase Intentions
3.2. Comparison of Existing Models of User Attitudes Towards Industrially Formulated Foods
3.3. Main Factors Affecting Consumer Attitudes Towards Ultra-Processed Foods and Their Impact on Buying Decisions
4. Research Methodology
4.1. Questionnaire Design and Data Collection
4.2. Questionnaire Measurements and Scales
4.3. Data Analysis Methods
5. Data Analysis
5.1. Data Collection and Preprocessing
5.2. Preliminary Statistical Analysis
5.3. Clustering
5.4. Sentiment Analysis
5.5. SEM Model of Customer Attitudes and Purchase Behaviour Towards UPFs
5.6. Other Models of Customer Attitudes Towards UPFs
6. Conclusions
Author Contributions
Funding
Institutional Review Board Statement
Informed Consent Statement
Data Availability Statement
Acknowledgments
Conflicts of Interest
References
- Monteiro, C.A.; Cannon, G.; Levy, R.B.; Moubarac, J.C.; Louzada, M.L.; Rauber, F.; Khandpur, N.; Cediel, G.; Neri, D.; Martinez-Steele, E.; et al. Ultra-processed foods: What they are and how to identify them. Public Health Nutr. 2019, 22, 936–941. [Google Scholar] [CrossRef] [PubMed]
- Wood, B.; Robinson, E.; Baker, P.; Paraje, G.; Mialon, M.; van Tulleken, C.; Sacks, G. What is the purpose of ultra-processed food? An exploratory analysis of the financialisation of ultra-processed food corporations and implications for public health. Glob. Health 2023, 19, 85. [Google Scholar] [CrossRef]
- Elizabeth, L.; Machado, P.; Zinöcker, M.; Baker, P.; Lawrence, M. Ultra-processed foods and health outcomes: A narrative review. Nutrients 2020, 12, 1955. [Google Scholar] [CrossRef] [PubMed]
- Anastasiou, K.; Baker, P.; Hadjikakou, M.; Hendrie, G.A.; Lawrence, M. A conceptual framework for understanding the environmental impacts of ultra-processed foods and implications for sustainable food systems. J. Clean. Prod. 2022, 368, 133155. [Google Scholar] [CrossRef]
- Ballard Brief. The Overconsumption of Ultra-Processed Foods in the United States. Available online: https://ballardbrief.byu.edu/issue-briefs/the-overconsumption-of-ultra-processed-foods-in-the-united-states (accessed on 1 February 2025).
- Gangopadhyay, A. Ultraprocessed Foods and Cancer in Low-Middle-Income Countries. Nutr. Cancer 2023, 75, 1863–1873. [Google Scholar] [CrossRef]
- Onyeaka, H.; Nwaiwu, O.; Obileke, K.; Miri, T.; Al-Sharify, Z.T. Global Nutritional Challenges of Reformulated Food: A Review. Food Sci. Nutr. 2023, 11, 2483–2499. [Google Scholar] [CrossRef]
- Pereira, T.N.; Bortolini, G.A.; Campos, R.D.F. Barriers and Facilitators Related to the Adoption of Policies to Reduce Ultra-Processed Foods Consumption: A Scoping Review. Int. J. Environ. Res. Public Health 2023, 20, 4729. [Google Scholar] [CrossRef]
- Russell, C.; Dickie, S.; Baker, P.; Lawrence, M. Does the Australian health star rating system encourage added sugar reformulation? Trends in sweetener use in Australia. Nutrients 2021, 13, 898. [Google Scholar] [CrossRef]
- Estévez, M.; Arjona, A.; Sánchez-Terrón, G.; Molina-Infante, J.; Martínez, R. Ultra-processed vegan foods: Healthy alternatives to animal-source foods or avoidable junk? J. Food Sci. 2024, 89, 7008–7021. [Google Scholar] [CrossRef]
- Colozza, D. A qualitative exploration of ultra-processed foods consumption and eating out behaviours in an Indonesian urban food environment. Nutr. Health 2022, 30, 613–623. [Google Scholar] [CrossRef]
- Seferidi, P.; Scrinis, G.; Huybrechts, I.; Woods, J.; Vineis, P.; Millett, C. The neglected environmental impacts of ultra-processed foods. Lancet Planet. Health 2020, 4, e437–e438. [Google Scholar] [CrossRef] [PubMed]
- Vignola, E.F.; Nazmi, A.; Freudenberg, N. What Makes Ultra-Processed Food Appealing? A critical scan and conceptual model. World Nutr. 2021, 12, 136–175. [Google Scholar] [CrossRef]
- Kliestik, T.; Zvarikova, K.; Lăzăroiu, G. Data-driven machine learning and neural network algorithms in the retailing environment: Consumer engagement, experience, and purchase behaviors. Econ. Manag. Financ. Markets 2022, 17, 57–69. [Google Scholar] [CrossRef]
- Juul, F.; Vaidean, G.; Lin, Y.; Deierlein, A.L.; Parekh, N. Ultra-processed foods and incident cardiovascular disease in the Framingham Offspring Study. J. Am. Coll. Cardiol. 2021, 77, 1520–1531. [Google Scholar] [CrossRef]
- Levy, R.B.; Rauber, F.; Chang, K.; Louzada, M.L.D.C.; Monteiro, C.A.; Millett, C.; Vamos, E.P. Ultra-processed food consumption and type 2 diabetes incidence: A prospective cohort study. Clin. Nutr. 2021, 40, 3608–3614. [Google Scholar] [CrossRef]
- Kesse-Guyot, E.; Allès, B.; Brunin, J.; Fouillet, H.; Dussiot, A.; Berthy, F.; Perraud, E.; Hercberg, S.; Julia, C.; Mariotti, F.; et al. Environmental impacts along the value chain from the consumption of ultra-processed foods. Nat. Sustain. 2023, 6, 192–202. [Google Scholar] [CrossRef]
- Popkin, B.M.; Barquera, S.; Corvalan, C.; Hofman, K.J.; Monteiro, C.; Ng, S.W.; Swart, E.C.; Taillie, L.S. Towards unified and impactful policies to reduce ultra-processed food consumption and promote healthier eating. Lancet Diabetes Endocrinol. 2021, 9, 462–470. [Google Scholar] [CrossRef]
- Lane, M.M.; Gamage, E.; Du, S.; Ashtree, D.N.; McGuinness, A.J.; Gauci, S.; Baker, P.; Lawrence, M.; Rebholz, C.M.; Srour, B.; et al. Ultra-processed food exposure and adverse health outcomes: Umbrella review of epidemiological meta-analyses. BMJ 2024, 384, e077310. [Google Scholar] [CrossRef]
- Martini, D.; Godos, J.; Bonaccio, M.; Vitaglione, P.; Grosso, G. Ultra-Processed Foods and Nutritional Dietary Profile: A Meta-Analysis of Nationally Representative Samples. Nutrients 2021, 13, 3390. [Google Scholar] [CrossRef]
- Monteiro, C.A.; Cannon, G.; Lawrence, M.; Costa Louzada, M.D.; Pereira Machado, P. Ultra-Processed Foods, Diet Quality, and Health Using the NOVA Classification System; FAO: Rome, Italy, 2019; Volume 48. [Google Scholar]
- Wood, B.; Williams, O.; Nagarajan, V.; Sacks, G. Market strategies used by processed food manufacturers to increase and consolidate their power: A systematic review and document analysis. Glob. Health 2021, 17, 17. [Google Scholar] [CrossRef]
- Baker, P.; Machado, P.; Santos, T.; Sievert, K.; Backholer, K.; Hadjikakou, M.; Russell, C.; Huse, O.; Bell, C.; Scrinis, G.; et al. Ultra-processed foods and the nutrition transition: Global, regional and national trends, food systems transformations and political economy drivers. Obes. Rev. 2020, 21, e13126. [Google Scholar] [CrossRef] [PubMed]
- Julia, C.; Ducrot, P.; Péneau, S.; Deschamps, V.; Méjean, C.; Fézeu, L.; Touvier, M.; Hercberg, S.; Kesse-Guyot, E. Discriminating nutritional quality of foods using the 5-Color nutrition label in the French food market: Consistency with nutritional recommendations. Nutr. J. 2015, 14, 100. [Google Scholar] [CrossRef] [PubMed]
- Scarborough, P.; Rayner, M.; Stockley, L.; Black, A. Nutrition professionals’ perception of the ‘healthiness’ of individual foods. Public Health Nutr 2007, 10, 346–353. [Google Scholar] [CrossRef] [PubMed]
- Jones, A.; Rådholm, K.; Neal, B. Defining “unhealthy”: A systematic analysis of alignment between the Australian Health Star Rating system and dietary guidelines. Nutrients 2018, 10, 501. [Google Scholar] [CrossRef]
- Feyzabadi, V.Y.; Mohammadi, N.K.; Omidvar, N.; Karimi-Shahanjarini, A.; Nedjat, S.; Rashidian, A. Factors associated with unhealthy snacks consumption among adolescents in Iran’s schools. Int. J. Health Policy Manag. 2017, 6, 519–528. [Google Scholar] [CrossRef]
- Poudel, B.; Tiraphat, S.; Hong, S.A. Factors associated with junk food consumption among urban school students in Kathmandu District of Nepal. J. Public Health Dev. 2018, 16, 59–72. Available online: https://he01.tci-thaijo.org/index.php/AIHD-MU/article/view/134934 (accessed on 25 March 2025).
- Rosenstock, I.M.; Strecher, V.J.; Becker, M.H. Social learning theory and the Health Belief Model. Health Educ. Q. 1988, 15, 175–183. [Google Scholar] [CrossRef]
- Ajzen, I. The theory of planned behavior. Organ. Behav. Hum. Decis. Process. 1991, 50, 179–211. [Google Scholar] [CrossRef]
- Contini, C.; Boncinelli, F.; Gerini, F.; Scozzafava, G.; Casini, L. Investigating the role of personal and context-related factors in convenience foods consumption. Appetite 2018, 126, 26–35. [Google Scholar] [CrossRef]
- Yan, C.; Siddik, A.B.; Masukujjaman, M.; Dong, Q.; Hamayun, M.; Guang-Wen, Z.; Ibrahim, A.M. Bi-dimensional values and attitudes toward online fast food-buying intention during the COVID-19 pandemic: An application of VAB model. Front. Nutr. 2022, 9, 894765. [Google Scholar] [CrossRef]
- Arroyo, P. The influence of food values on snacks and beverage choices: An experimental study in Mexico. Estud. Gerenc. 2023, 39, 387–401. [Google Scholar] [CrossRef]
- Calvo-Porral, C.; Rivaroli, S.; Orosa-González, J. Proposal and Validation of a Measurement Scale of the Acceptance of Ultra-Processed Food Products. Foods 2024, 13, 1481. [Google Scholar] [CrossRef] [PubMed]
- Norfarah, N.; Ali, S.M.; Suzlipah, S. How AI-Powered Recommendations Moderate the Effect of Consumer Value on Ultra-Processing Food Consumption? Glob. Bus. Manag. Res. 2024, 16, 252–272. [Google Scholar]
- Raj, S.; Choudhury, M.; Mishra, B.B.; Samal, A.R. The role of extrinsic and intrinsic factors on the purchase intention toward processed food: A cross-sectional study in India. Int. J. Bus. Emerg. Mark. 2024, 16, 21–49. [Google Scholar] [CrossRef]
- Stamatelou, D.; Leonti, E.; Komzia, T.; Strati, G.; Arsenou, E.; Vlastaridou, E.; Panagiotakos, D. Knowledge, perceptions and consumption of ultra-processed foods in the Greek population: A cross-sectional epidemiological study. Arch. Hell. Med. 2024, 41, 761–770. [Google Scholar]
- Yuan, S.; Liu, W.; Shen, Z.; Ren, M.; Hao, S. Knowledge, attitude, and practice toward food preservatives among pregnant women. Res. Sq. 2024. [Google Scholar] [CrossRef]
- van der Merwe, D.; de Beer, H.; Ellis, S.; Bester, P.; Marais, F.; Steyn, A. Consumer objective and subjective knowledge about healthy foods: An approach to promote healthy lifestyle choices in South Africa. PLoS ONE 2024, 19, e0296504. [Google Scholar] [CrossRef]
- Zheng, S.; Wang, L.; Yu, Z. The Impact of Multidimensional Perceived Value on Purchase Intentions for Prepared Dishes in China: The Mediating Role of Behavioral Attitudes and the Moderating Effect of Time Pressure. Foods 2024, 13, 3778. [Google Scholar] [CrossRef]
- Mai, R.; Hoffmann, S. How to combat the unhealthy= tasty intuition: The influencing role of health consciousness. J. Public Policy Mark. 2015, 34, 63–83. [Google Scholar] [CrossRef]
- Cairns, G. A critical review of evidence on the sociocultural impacts of food marketing and policy implications. Appetite 2019, 136, 193–207. [Google Scholar] [CrossRef]
- Nguyen, T.T.; Cashin, J.; Ching, C.; Baker, P.; Tran, H.T.; Weissman, A.; Nguyen, T.T.; Mathisen, R. Beliefs and norms associated with the use of ultra-processed commercial milk formulas for pregnant women in Vietnam. Nutrients 2021, 13, 4143. [Google Scholar] [CrossRef] [PubMed]
- Ilieva, G.; Yankova, T.; Ruseva, M.; Dzhabarova, Y.; Klisarova-Belcheva, S.; Dimitrov, A. Ultra-Processed Foods—Exploring Consumer Attitudes and Consumption Behaviour. Mendeley Data 2025. [Google Scholar] [CrossRef]
- Wang, L.; Martínez Steele, E.; Du, M.; Pomeranz, J.L.; O’Connor, L.E.; Herrick, K.A.; Luo, H.; Zhang, X.; Mozaffarian, D.; Zhang, F.F. Trends in Consumption of Ultraprocessed Foods Among US Youths Aged 2–19 Years, 1999–2018. JAMA 2021, 326, 519–530. [Google Scholar] [CrossRef]
- Monteiro, C.A.; Moubarac, J.C.; Levy, R.B.; Canella, D.S.; Louzada, M.L.D.C.; Cannon, G. Household availability of ultra-processed foods and obesity in nineteen European countries. Public Health Nutr. 2018, 21, 18–26. [Google Scholar] [CrossRef]
- Dittmann, A.; Werner, L.; Hörz, L.; Luft, T.; Finkbeiner, F.; Storcksdieck genannt Bonsmann, S. Sociodemographic and behavioural differences between frequent and non-frequent users of convenience food in Germany. Front. Nutr. 2024, 11, 1369137. [Google Scholar] [CrossRef]
- Ringle, C.M.; Wende, S.; Becker, J.-M. SmartPLS 4; SmartPLS GmbH: Bönningstedt, Germany, 2024. [Google Scholar]
- Pett, M.A.; Lackey, N.R.; Sullivan, J.J. Making Sense of Factor Analysis: The Use of Factor Analysis for Instrument Development in Health Care Research; Sage Publications: Thousand Oaks, CA, USA, 2003; 368p. [Google Scholar] [CrossRef]
- Hair, J.F., Jr.; Black, W.C.; Babin, B.J.; Anderson, R.E. Multivariate Data Analysis, 7th ed.; Pearson: Edinburgh, UK, 2014. [Google Scholar]
- Fornell, C.; Bookstein, F.L. Two Structural Equation Models: LISREL and PLS Applied to Consumer Exit-voice Theory. J. Mark. Res. 1982, 19, 440–452. [Google Scholar] [CrossRef]


| Reference | Study Design | Evaluation Factors (Number) | Statistically Significant Factors (Number) | Model Quality (s) |
|---|---|---|---|---|
| Contini et al., 2018 [31] | SEM | Value for money, taste, naturalness, healthiness, cooking skills, time pressure, monetary resources, social influence, market availability (9) → intention → consumption | Naturalness, cooking skills, time pressure, social influence, market availability (5) | R2: 0.74; 0.63 |
| Yan et al., 2022 [32] | SEM | Convenience, food quality, novelty seeking, subjective norms, self-identification, utilitarian value, hedonic value (7) → cognitive attitude, affective attitude (2) → buying intention (1) | Convenience, novelty seeking, subjective norms, self-identification, utilitarian value, hedonic value (6) | R2: 0.85, 0.77; 0.79 |
| Arroyo 2023 [33] | CFA, DTs | Safety and sustainability, weight control, convenience, basic sensory attributes, traditionalism, emotional value, novelty of functional food Self-control, self-assessment of diet quality, health consciousness (10) | Safety and sustainability, weight control, convenience, basic sensory attributes, traditionalism, emotional value, novelty of functional food Self-control, self-assessment of diet quality, health consciousness (10) | Accuracy: 0.78, 0.90 |
| Calvo-Porral et al., 2024 [34] | CFA | Quality, time, price, effortless preparation, convenience, hedonism, marketing strategies (7) → satisfaction → purchase intention | Quality, time, price, effortless preparation, convenience, hedonism, marketing strategies (7) | RMSEA: 0.05 |
| Norfarah et al., 2024 [35] | SEM | Functional, emotional, confidential, social values (4) → continuance consumption | Functional, emotional, confidential, social values (4) | R2: 0.50 |
| Raj et al., 2024 [36] | SEM | Extrinsic factors, intrinsic factors (2) → attitude → purchase intention | Extrinsic factors, intrinsic factors—partial effect (2) | RMSEA: 0.05; 0.07 |
| Stamatelou et al., 2024 [37] | Statistical methods | Knowledge and perceptions (1) → consumption | Knowledge and perceptions (1) | ST: 0.04 |
| Yuan et al. 2024 [38] | RA, SEM | Knowledge, attitude, practice (3) | Knowledge, attitude, practice (3) | RMSEA: 0.06 |
| Van der Merwe et al., 2024 [39] | SEM | Knowledge, income (2) → food and sleep, exercise and relaxation, dedicated efforts, not smoking | Knowledge, income (2) | RMSEA: 0.07 |
| Zheng et al., 2024 [40] | SEM | Functional, emotional, confidential values (3) → attitude, perceived control → willingness to buy | Functional, emotional, confidential values (3) | RMSEA: 0.06; R2: 0.52; 0.52 |
| Variables of the Sample | No. of Consumers | Percentage (%) | |
|---|---|---|---|
| 1. Gender | Male | 68 | 23.4 |
| Female | 222 | 76.6 | |
| 2. Age | Under 20 | 229 | 41.0 |
| Between 21 and 30 | 67 | 23.1 | |
| Between 31 and 40 | 33 | 11.4 | |
| Between 41 and 50 | 37 | 12.8 | |
| Over 50 | 34 | 11.7 | |
| 3. Place of residence | City | 196 | 67.6 |
| Town | 88 | 30.3 | |
| Village | 6 | 2.1 | |
| 4. Municipality | - | - | |
| 5. Monthly income per household member | Less than BGN 1438 | 137 | 47.2 |
| More than BGN 1438 | 153 | 52.8 | |
| 6. Education | High school | 168 | 57.9 |
| Bachelor | 59 | 20.3 | |
| Master | 58 | 19.7 | |
| PhD | 6 | 2.1 | |
| 7. Share of UPFs in your daily menu | I do not consume (0%) | 26 | 9.0 |
| Less than 25% | 149 | 51.4 | |
| Between 25% and 50% | 97 | 33.4 | |
| Between 50% and 75% | 15 | 5.2 | |
| Over 75% | 3 | 1.0 | |
| 8. How are the UPFs you consume divided by product group (I do not consume (0%), less than 25%, between 25% and 50%, between 50% and 75%, over 75%) | Snacks | 53, 142, 70, 19, 6 | 18.3, 49.0, 24.1, 6.6, 2.1 |
| Frozen meals | 107, 136, 34, 13, 0 | 36.9, 46.9, 11.7, 4.5, 0.0 | |
| Fast food | 68, 140, 54, 23, 5 | 23.4, 48.3, 18.6, 7.9, 1.7 | |
| Packaged breads and pasta | 52, 136, 54, 32, 16 | 17.9, 46.9, 18.6, 11.0, 5.5 | |
| Processed meat | 46, 135, 61, 39, 9 | 15.9, 46.6, 21.0, 13.4, 3.1 | |
| Sweetened cereals | 125, 113, 32, 14, 6 | 43.1, 39.0, 11.0, 4.8, 2.1 | |
| Sweetened dairy products | 82, 135, 46, 20, 7 | 28.3, 46.6, 15.9, 6.9, 2.4 | |
| Instant soups and pasta | 177, 76, 24, 11, 2 | 61.0, 26.2, 8.3, 3.8, 0.7 | |
| HC1 | HC2 | HC3 | UPFK1 | UPFK2 | SN1 | SN2 | |
| Cluster 1 | 4.119 | 4.552 | 3.858 | 4.045 | 4.455 | 2.828 | 3.858 |
| Cluster 2 | 2.628 | 3.660 | 2.840 | 3.256 | 3.654 | 2.160 | 2.449 |
| Difference | 1.491 | 0.892 | 1.018 | 0.788 | 0.801 | 0.668 | 1.409 |
| EC1 | EC2 | EC3 | ATT1 | ATT2 | ATT3 | WP1 | |
| Cluster 1 | 4.194 | 3.672 | 3.985 | 4.172 | 4.463 | 4.097 | 3.090 |
| Cluster 2 | 3.385 | 2.577 | 3.173 | 3.128 | 3.571 | 3.128 | 2.128 |
| Difference | 0.809 | 1.095 | 0.812 | 1.043 | 0.892 | 0.969 | 0.961 |
| WP2 | WP3 | ABB1 | ABB2 | ABB3 | |||
| Cluster 1 | 4.187 | 3.694 | 3.097 | 3.381 | 3.970 | ||
| Cluster 2 | 2.994 | 2.596 | 2.212 | 3.237 | 2.667 | ||
| Difference | 1.193 | 1.098 | 0.885 | 0.143 | 1.303 |
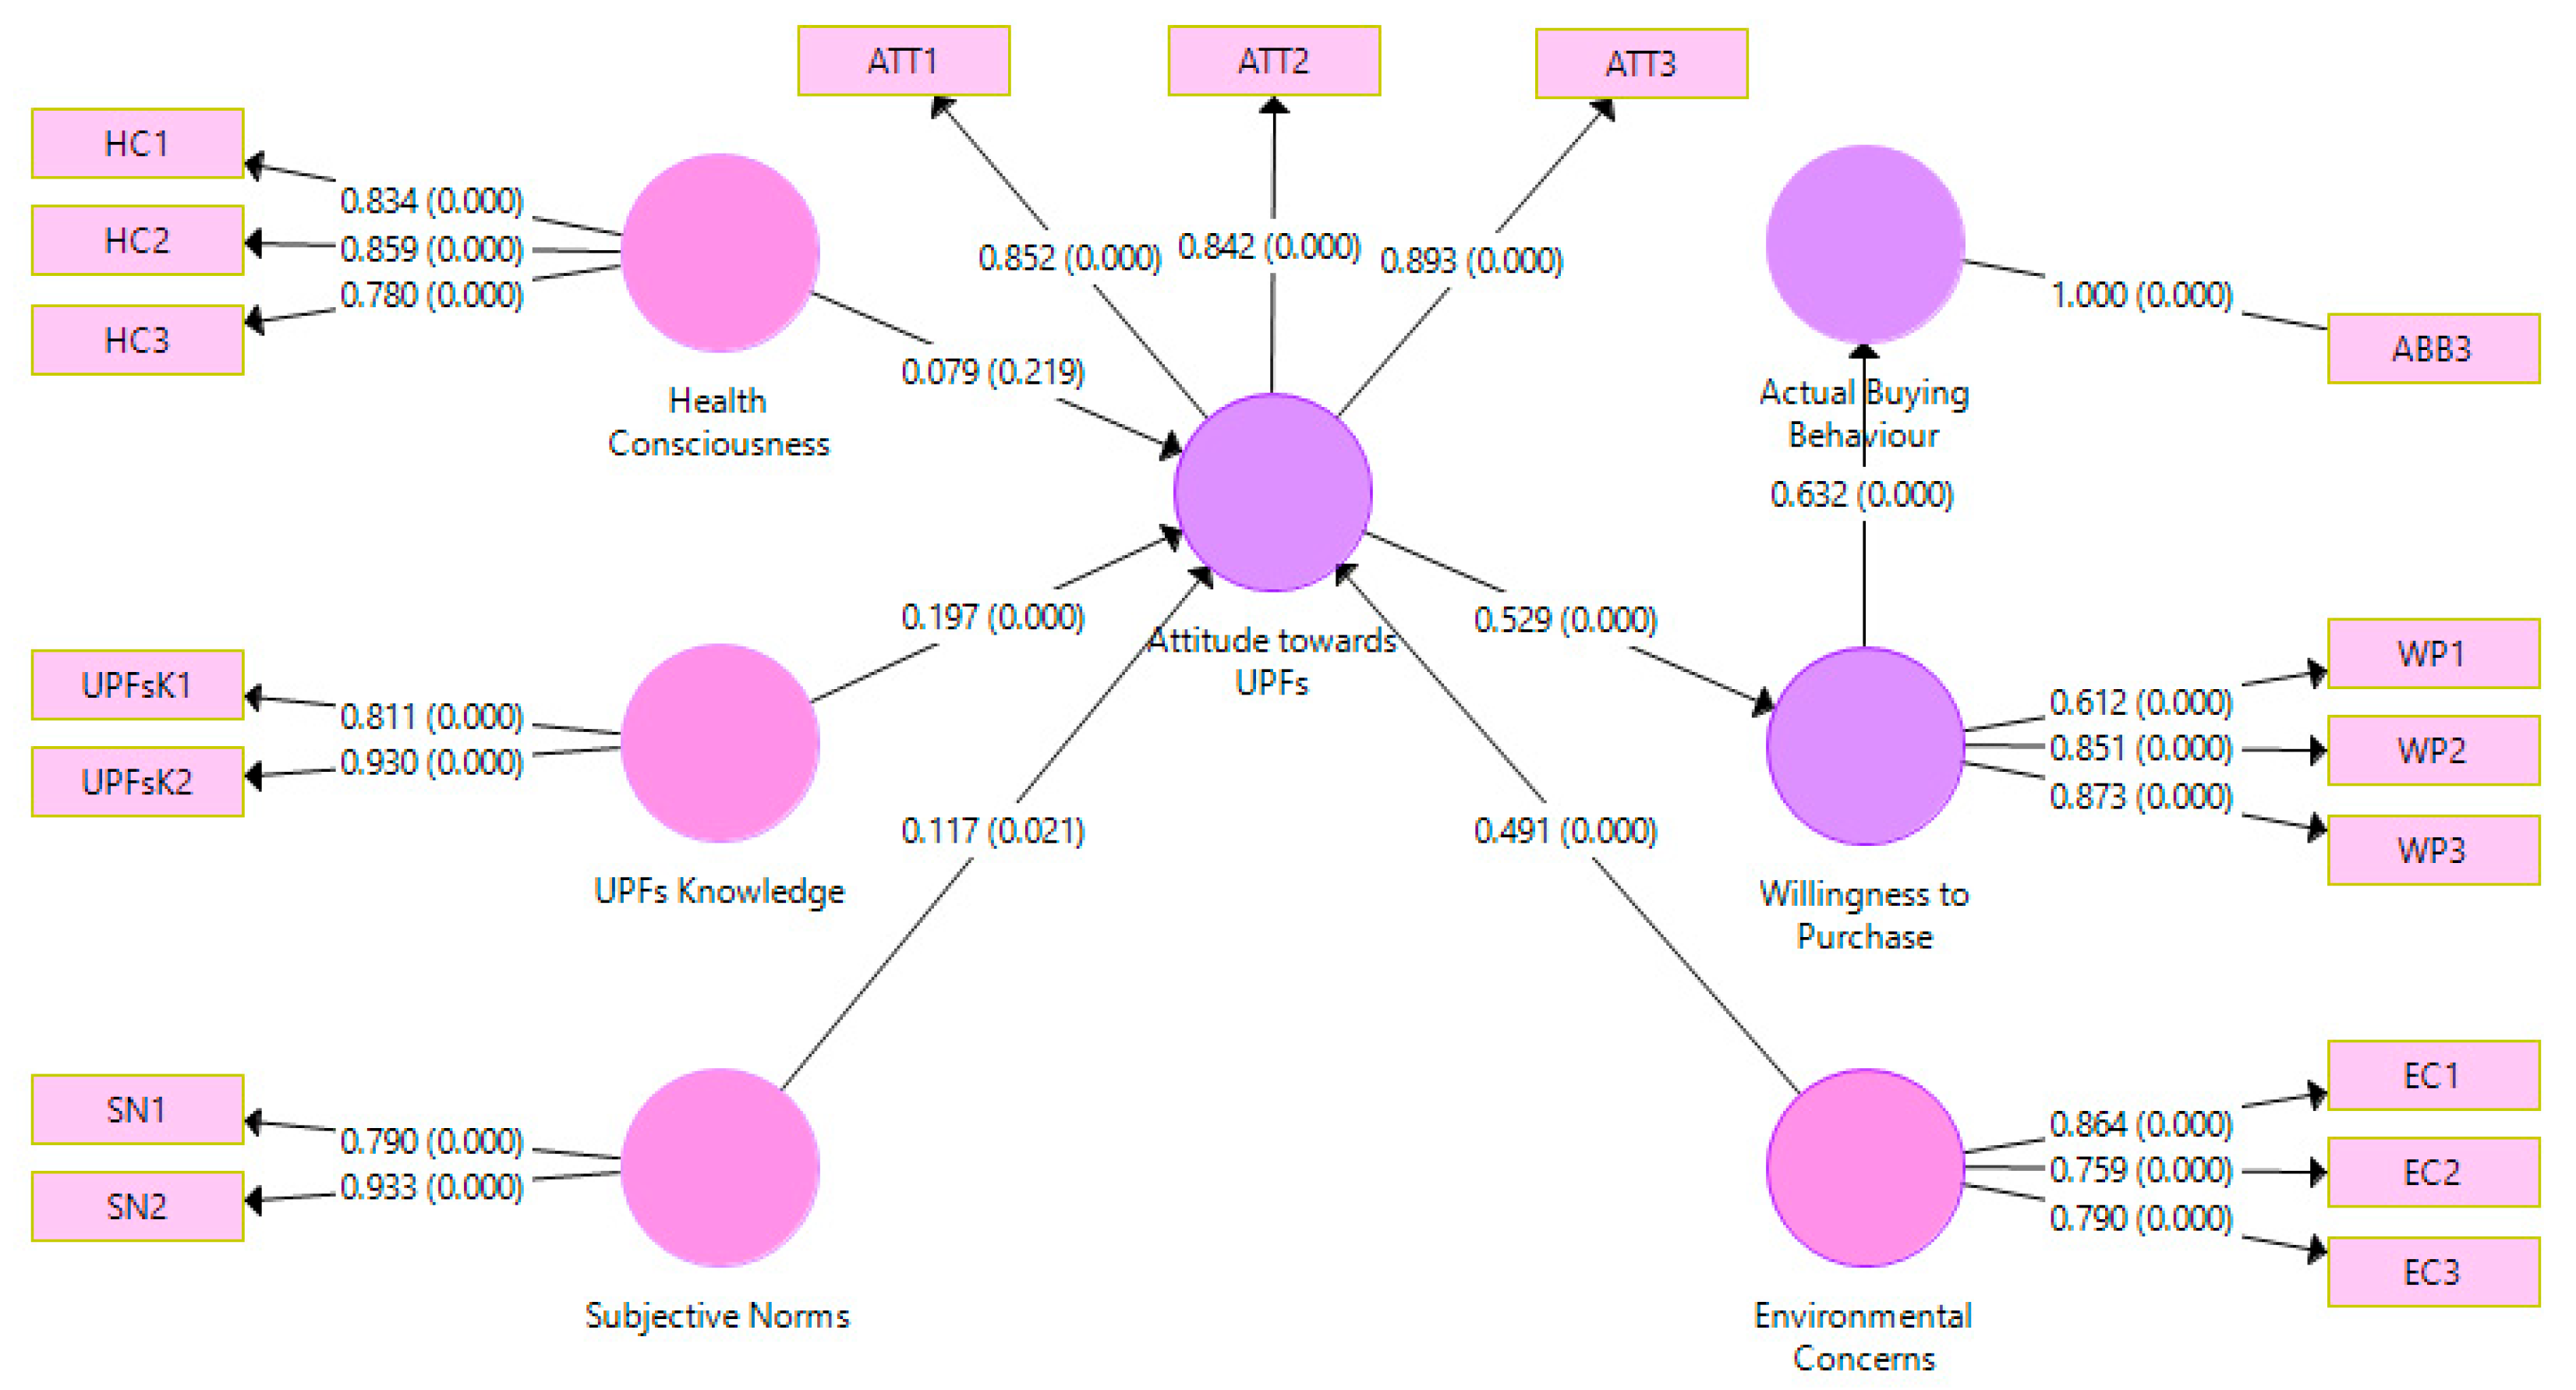
| Indicator Variable | Factor Loading | Indicator Variable | Factor Loading | Indicator Variable | Factor Loading |
|---|---|---|---|---|---|
| HC1 | 0.834 | SN2 | 0.933 | ATT3 | 0.893 |
| HC2 | 0.859 | EC1 | 0.864 | WP1 | 0.612 |
| HC3 | 0.780 | EC2 | 0.759 | WP2 | 0.851 |
| UPFK1 | 0.811 | EC3 | 0.790 | WP3 | 0.873 |
| UPFK2 | 0.930 | ATT1 | 0.852 | ABB3 | 1.000 |
| SN1 | 0.790 | ATT2 | 0.842 |
| Factor | Cronbach’sAlpha | DG rho | CR | AVE | VIF |
|---|---|---|---|---|---|
| Health consciences | 0.770 * | 0.799 * | 0.864 * | 0.680 * | 1.781 * |
| Knowledge about UPFs | 0.700 * | 0.804 * | 0.864 * | 0.761 * | 1.484 * |
| Subjective norms | 0.681 * | 0.817 * | 0.855 * | 0.747 * | 1.356 * |
| Environmental concerns | 0.731 * | 0.751 * | 0.847 * | 0.649 * | 1.484 * |
| Attitude towards UPFs | 0.828 * | 0.831 * | 0.897 * | 0.744 * | 1.000 * |
| Willingness to purchase | 0.680 * | 0.708 * | 0.827 * | 0.620 * | 1.000 * |
| Actual buying behaviour | 1.000 | 1.000 * | 1. 000 * | 1.000 * |
| Factor | Actual Buying Behaviour | Attitude Towards UPFs | Environmental Concerns | Health Consciousness | Subjective Norms | Knowledge About UPFs | Willingness to Purchase |
|---|---|---|---|---|---|---|---|
| Actual buying behaviour | 1 | ||||||
| Attitude towards UPFs | 0.509 | 0.863 | |||||
| Environmental concerns | 0.540 | 0.662 | 0.806 | ||||
| Health consciousness | 0.522 | 0.490 | 0.509 | 0.825 | |||
| Subjective norms | 0.512 | 0.427 | 0.429 | 0.456 | 0.864 | ||
| Knowledge about UPFs | 0.372 | 0.479 | 0.409 | 0.549 | 0.323 | 0.872 | |
| Willingness to purchase | 0.632 | 0.529 | 0.507 | 0.477 | 0.454 | 0.281 | 0.788 |
| Indicator Variable | Actual Buying Behaviour | Attitude Towards UPFs | Environmental Concerns | Health Consciousness | Subjective Norms | Knowledge About UPFs | Willingness to Purchase |
|---|---|---|---|---|---|---|---|
| ABB3 | 1.000 | 0.509 | 0.540 | 0.522 | 0.512 | 0.372 | 0.632 |
| ATT1 | 0.417 | 0.852 | 0.555 | 0.390 | 0.413 | 0.390 | 0.490 |
| ATT2 | 0.399 | 0.842 | 0.543 | 0.444 | 0.313 | 0.425 | 0.380 |
| ATT3 | 0.496 | 0.893 | 0.613 | 0.437 | 0.377 | 0.425 | 0.495 |
| EC1 | 0.385 | 0.624 | 0.864 | 0.453 | 0.305 | 0.476 | 0.328 |
| EC2 | 0.567 | 0.490 | 0.759 | 0.394 | 0.492 | 0.194 | 0.600 |
| EC3 | 0.371 | 0.468 | 0.790 | 0.377 | 0.254 | 0.283 | 0.322 |
| HC1 | 0.516 | 0.403 | 0.463 | 0.834 | 0.435 | 0.403 | 0.507 |
| HC2 | 0.333 | 0.478 | 0.449 | 0.859 | 0.261 | 0.555 | 0.289 |
| HC3 | 0.482 | 0.301 | 0.327 | 0.780 | 0.491 | 0.369 | 0.417 |
| SN1 | 0.301 | 0.260 | 0.276 | 0.290 | 0.790 | 0.198 | 0.291 |
| SN2 | 0.538 | 0.444 | 0.438 | 0.467 | 0.933 | 0.335 | 0.463 |
| UPFsK1 | 0.345 | 0.311 | 0.293 | 0.469 | 0.297 | 0.811 | 0.254 |
| UPFsK2 | 0.318 | 0.494 | 0.405 | 0.496 | 0.279 | 0.930 | 0.245 |
| WP1 | 0.503 | 0.247 | 0.281 | 0.237 | 0.231 | 0.062 | 0.612 |
| WP2 | 0.472 | 0.516 | 0.473 | 0.489 | 0.387 | 0.350 | 0.851 |
| WP3 | 0.526 | 0.457 | 0.424 | 0.378 | 0.432 | 0.221 | 0.873 |
| Factor | Actual Buying Behaviour | Attitude Towards UPFs | Environmental Concerns | Health Consciousness | Subjective Norms | Knowledge About UPFs | Willingness to Purchase |
|---|---|---|---|---|---|---|---|
| Actual buying behaviour | |||||||
| Attitude towards UPFs | 0.557 | ||||||
| Environmental concerns | 0.640 | 0.840 | |||||
| Health consciousness | 0.612 | 0.597 | 0.663 | ||||
| Subjective norms | 0.584 | 0.537 | 0.590 | 0.631 | |||
| Knowledge about UPFs | 0.452 | 0.603 | 0.536 | 0.734 | 0.449 | ||
| Willingness to purchase | 0.777 | 0.692 | 0.728 | 0.668 | 0.628 | 0.397 |
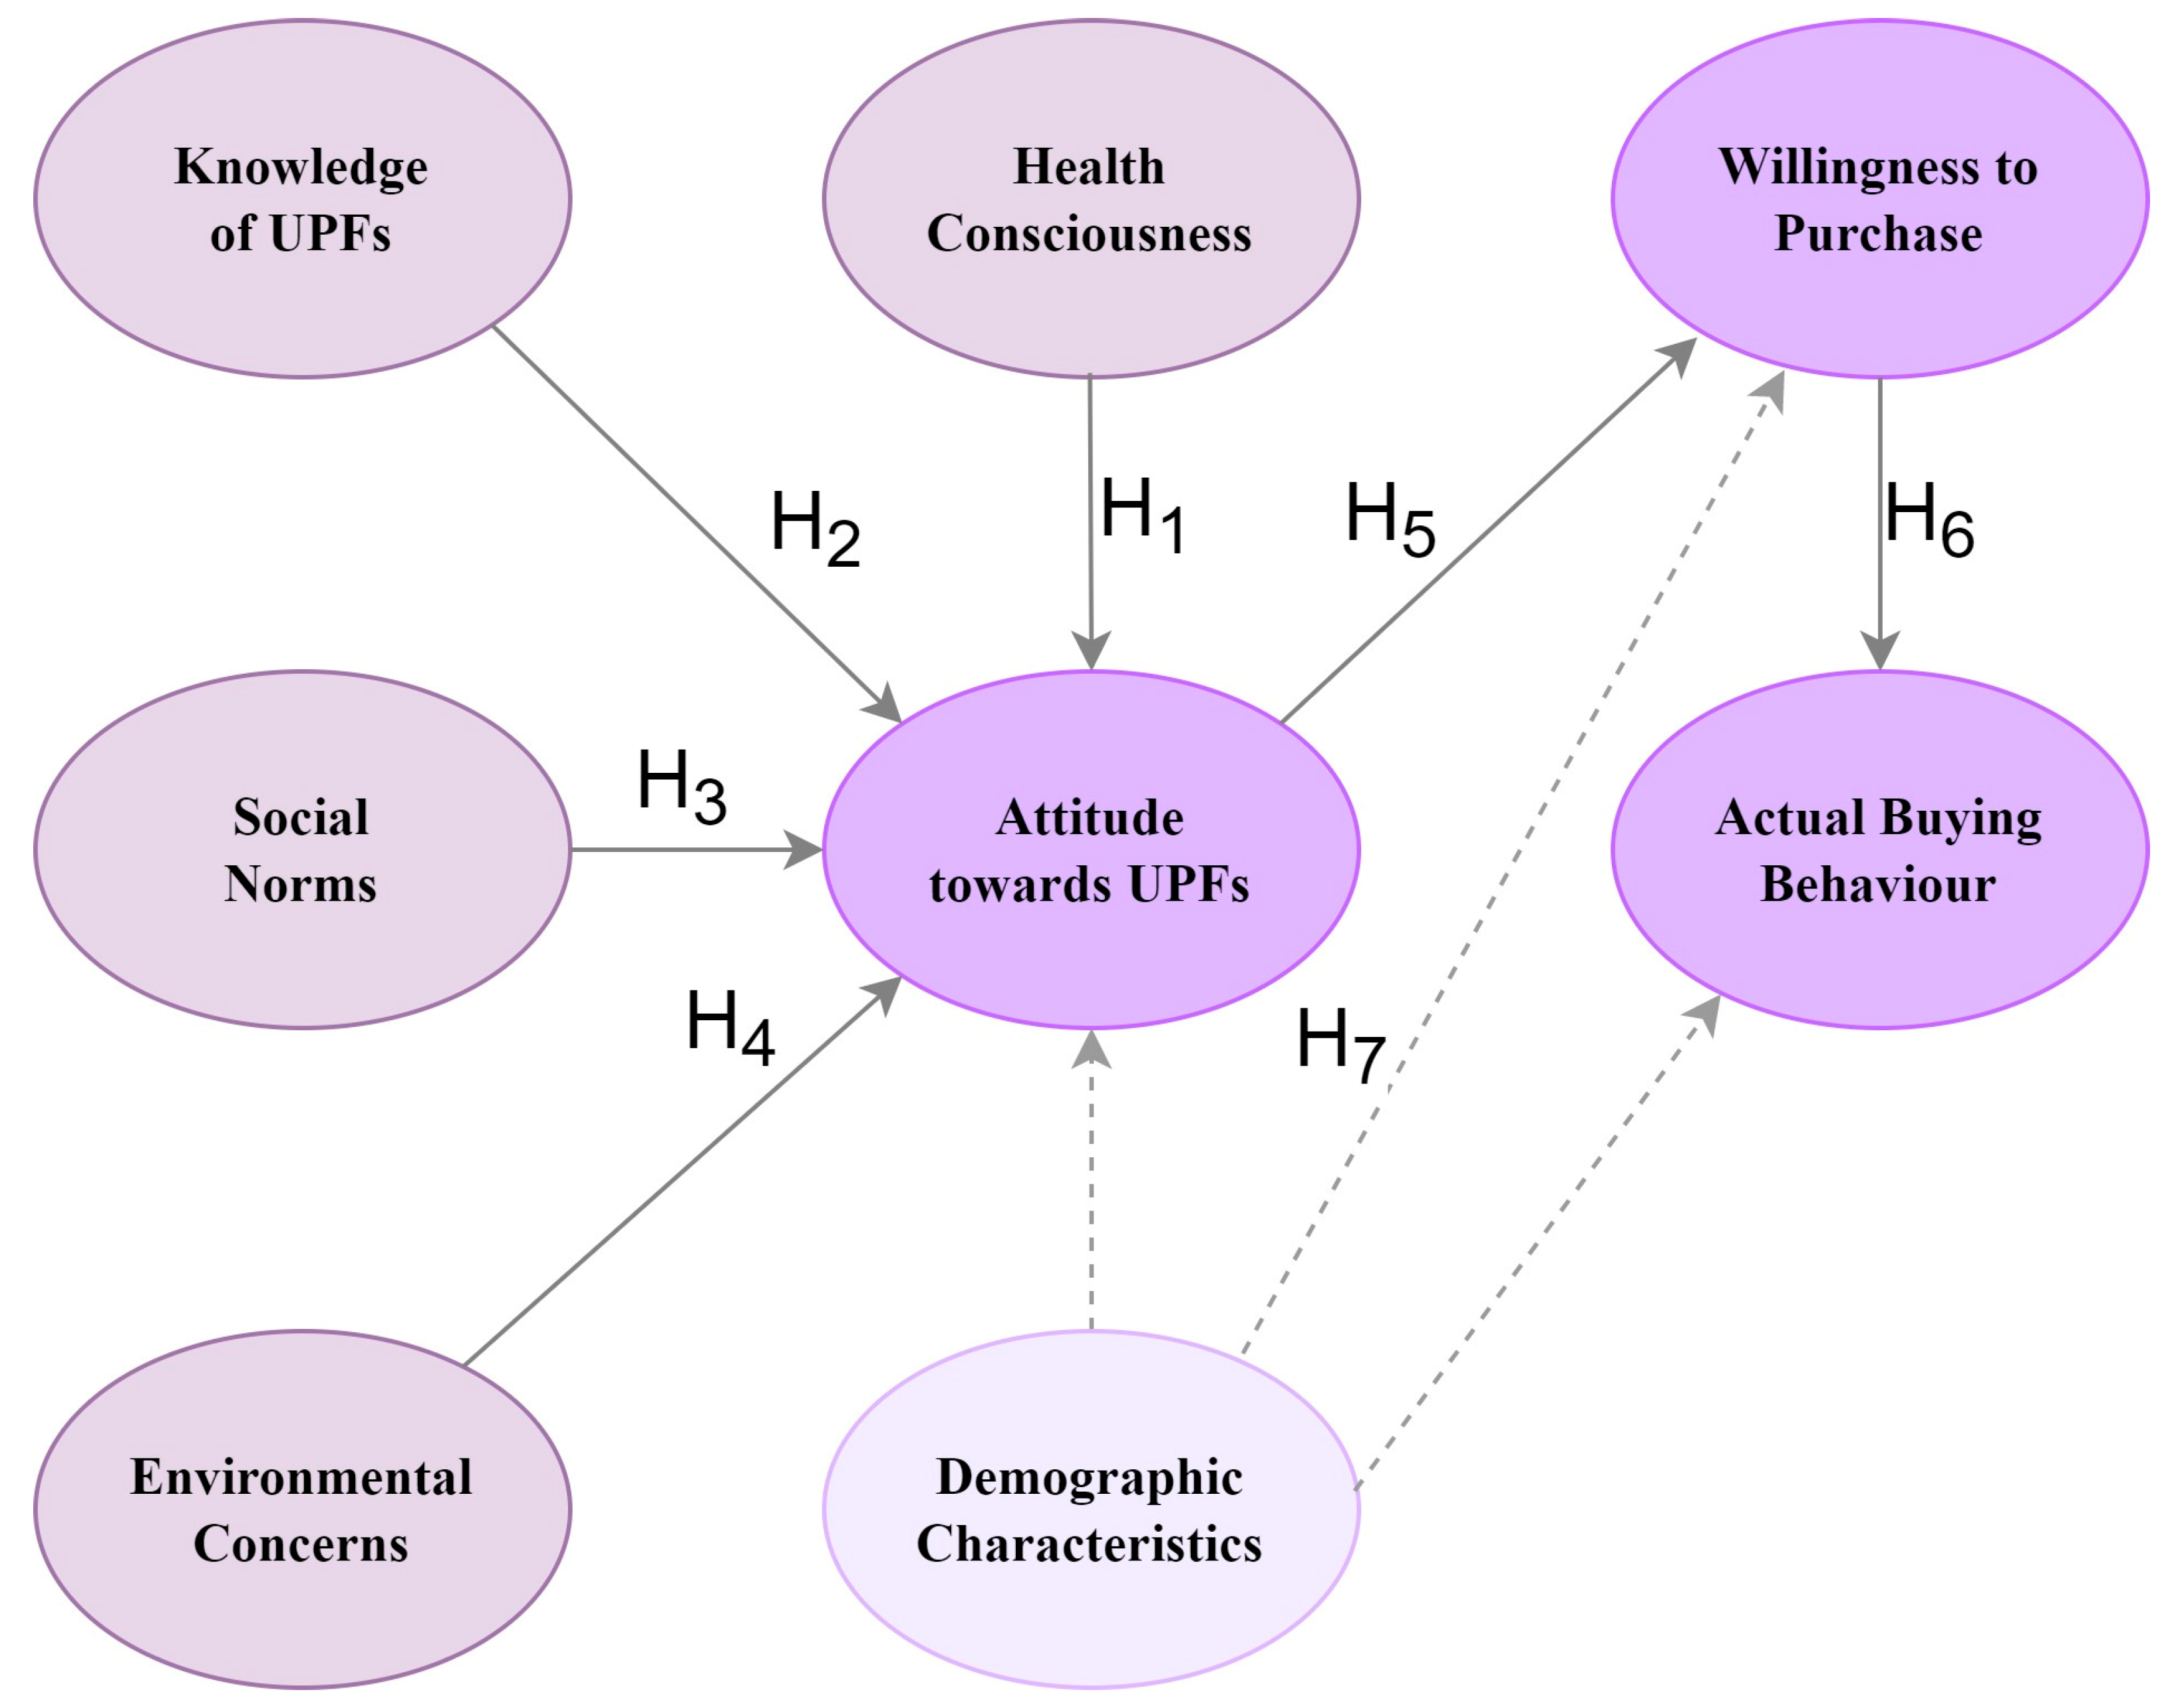
| Hypothesis | β | Sample Mean | SD | t Statistics | p-Values | R2 | Q2 |
|---|---|---|---|---|---|---|---|
| Attitude towards UPFs → willingness to purchase | 0.529 | 0.530 | 0.048 | 11.029 | 0.000 | 0.280 | 0.169 |
| Environmental concerns → attitude towards UPFs | 0.491 | 0.485 | 0.063 | 7.823 | 0.000 | 0.508 | 0.365 |
| Health consciousness → attitude towards UPFs | 0.079 | 0.082 | 0.064 | 1.230 | 0.219 | ||
| Subjective norms → attitude towards UPFs | 0.117 | 0.120 | 0.051 | 2.306 | 0.021 | ||
| Knowledge → attitude towards UPFs | 0.197 | 0.203 | 0.054 | 3.624 | 0.000 | ||
| Willingness to purchase → actual buying behaviour | 0.632 | 0.631 | 0.044 | 14.511 | 0.000 | 0.399 | 0.390 |
| ML Method | MSE | RMSE | MAE | R2 |
|---|---|---|---|---|
| Decision tree | 0.058 | 0.240 | 0.108 | 0.926 |
| SVM | 0.143 | 0.378 | 0.239 | 0.816 |
| Random forest | 0.027 | 0.164 | 0.091 | 0.965 |
| AdaBoost | 0.028 | 0.167 | 0.064 | 0.964 |
Disclaimer/Publisher’s Note: The statements, opinions and data contained in all publications are solely those of the individual author(s) and contributor(s) and not of MDPI and/or the editor(s). MDPI and/or the editor(s) disclaim responsibility for any injury to people or property resulting from any ideas, methods, instructions or products referred to in the content. |
© 2025 by the authors. Licensee MDPI, Basel, Switzerland. This article is an open access article distributed under the terms and conditions of the Creative Commons Attribution (CC BY) license (https://creativecommons.org/licenses/by/4.0/).
Share and Cite
Ilieva, G.; Yankova, T.; Ruseva, M.; Dzhabarova, Y.; Klisarova-Belcheva, S.; Dimitrov, A. Consumer Perceptions and Attitudes Towards Ultra-Processed Foods. Appl. Sci. 2025, 15, 3739. https://doi.org/10.3390/app15073739
Ilieva G, Yankova T, Ruseva M, Dzhabarova Y, Klisarova-Belcheva S, Dimitrov A. Consumer Perceptions and Attitudes Towards Ultra-Processed Foods. Applied Sciences. 2025; 15(7):3739. https://doi.org/10.3390/app15073739
Chicago/Turabian StyleIlieva, Galina, Tania Yankova, Margarita Ruseva, Yulia Dzhabarova, Stanislava Klisarova-Belcheva, and Angel Dimitrov. 2025. "Consumer Perceptions and Attitudes Towards Ultra-Processed Foods" Applied Sciences 15, no. 7: 3739. https://doi.org/10.3390/app15073739
APA StyleIlieva, G., Yankova, T., Ruseva, M., Dzhabarova, Y., Klisarova-Belcheva, S., & Dimitrov, A. (2025). Consumer Perceptions and Attitudes Towards Ultra-Processed Foods. Applied Sciences, 15(7), 3739. https://doi.org/10.3390/app15073739