Abstract
The article presents a research study dealing with the issue of identifying the crucial criteria driving the demand for electric vehicles and decision-making on the ideal electric vehicle choice for the company under investigation. Specifically, the research aimed to identify key factors influencing the decision-making process to purchase electric vans and to propose adequate recommendations when applying adequate multi-criteria decision-making methods, namely, ELECTRE I and PROMETHEE II, in the Czech and Slovak market conditions. The present survey identified six key criteria: mileage, load-carrying capacity, recharging speed, purchase price, load-bearing capacity, and electricity consumption. Based on the expert team preferences, the criteria weights were calculated, followed by data normalization and the application of both methods to evaluate individual vehicle models. Using the ELECTRE I method, the options were classified as either preferred (dominant) or unpreferred (undominant), while the PROMETHEE II ranked them from the best to the worst, preserving viable alternatives should the preferred model be unavailable. The study concludes by emphasizing the relevance of these methods in optimizing the selection of sustainable transport solutions and their broader applicability in the decision-making process on transport and mobility.
1. Introduction and Literature Review
1.1. Energy Transformation in the Face of Global Challenges
Transport is one of the key sectors of the economy, which is developing dynamically and affects both the functioning of enterprises and the daily lives of citizens. In the face of global challenges related to greenhouse gas emissions and the need to reduce the consumption of fossil fuels, electric vehicles are becoming an increasingly important element of the mobility and energy transformation [1,2]. Their growing popularity results not only from technological progress but also from the pro-ecological policies of many countries, which strive to reduce exhaust emissions and improve air quality in cities.
The adoption of electric vehicles is strongly dependent on economic and political incentives that reduce their cost and increase their attractiveness to both manufacturers and consumers. Government subsidies play a key role, reducing the purchase price of new electric cars. In many countries, governments offer direct subsidies for the purchase of EVs, often depending on the price of the vehicle and its technical parameters, such as battery capacity or range on a single charge. Such solutions effectively increase interest in electric cars, especially among people for whom high price is the main barrier to entry into the EV market [3,4,5]. Tax reliefs are also an important factor in accelerating the adoption of electric vehicles. In many countries, EV owners can count on a reduction in income tax, exemption from vehicle registration tax or lower VAT rates [6,7,8]. In addition, in some places, preferential rates have been introduced for companies investing in electric fleets, which encourages companies to switch to ecological means of transport [9,10]. In addition, some cities exempt EVs from parking and entry fees to low-emission zones, which makes them more competitive with traditional combustion cars [11,12].
In addition to direct financial benefits, governments and international organizations are also implementing regulations and strategies promoting electromobility. Examples include exhaust emission standards that force manufacturers to increase the share of low-emission vehicles in their offer, as well as investments in the development of charging infrastructure [13,14]. Building a dense network of fast chargers eliminates one of the main problems associated with the use of EVs—concerns about the lack of available charging points [15]. Combined with increasing restrictions on combustion vehicles, these incentives effectively contribute to accelerating the transformation of the automotive sector toward zero emissions. China and the USA are excellent examples in each area analyzed [16].
Therefore, electromobility is not only a technological trend but also a significant factor shaping national and global economies [16]. The development of this industry is conducive to changes in the labor market and, above all, increases investment in innovation and dynamic changes in the energy sector.
Electric vehicles are often perceived as an ecologically friendly mobility alternative to traditional combustion cars [17,18]. Although their operation is associated with lower emissions of harmful substances, it should be remembered that their actual impact on the environment depends on many factors, such as the method of electricity production or the process of battery production and disposal [19,20]. Therefore, choosing the right electric vehicle is not only a matter of user comfort but also a conscious approach to environmental protection. Making decisions in this area requires understanding the ecological consequences and a responsible approach to sustainable transport. Therefore, choosing the right electric vehicle is not easy and requires a comprehensive analysis of technical, economic, as well as ecological issues. It is also extremely important to examine the reliability of means of transport [21,22]. Taking these aspects into account allows an informed decision tailored to the individual needs of both an individual user and an entrepreneur to be made.
This is particularly important in a situation where the growing concern over carbon footprint and the rise of electric vehicles have captured the significant attention of both the public and media. Electromobility has firmly established itself within modern society, sparking a global environmental revolution. The rapid onset of electric vehicles and the inevitable phase-out of fossil fuels has created a divide within the population, with proponents and detractors highlighting various advantages and disadvantages of this evolving technology.
Proponents emphasize that the adoption of electric vehicles has significant social consequences, especially in terms of improving air quality in cities. EVs do not emit exhaust fumes, so their widespread use contributes to reducing the level of pollutants, such as nitrogen oxides (NOx) and particulate matter (PM), which are considered to be causes of health problems, including respiratory and cardiovascular diseases [23,24,25]. Also important in this context is the quieter operation of electric engines, which reduces noise levels in cities, which has a positive effect on the mental health and comfort of residents [26,27]. The introduction of electric vehicles may also affect the working conditions of drivers, especially in the public transport and logistics sectors. Electric vehicles are characterized by lower operating costs, which may lead to improved working conditions for fleet drivers through higher wages or better employment standards. On the other hand, the prices of electric vehicles are high, which causes higher barriers to entry into the market, and the electrification of transport may reduce jobs in the traditional automotive industry [28,29]. Moreover, the development of electromobility, from the perspective of sustainable development goals, contributes to the implementation of several key assumptions of the 2030 Agenda. First of all, it supports Goal 11 (“Sustainable Cities and Communities”) by improving air quality and reducing noise. It also affects Goal 13 (“Climate Action”) by reducing greenhouse gas emissions, especially if EVs are powered by energy from renewable sources. In the context of sustainable logistics, communities increasingly expect transport and trade companies to implement more ecological solutions, which can influence the strategy of large corporations and accelerate the transformation of the entire sector. The widespread adoption of EVs is, therefore, a significant step towards a more sustainable and socially responsible transport model [30,31,32].
However, before all the benefits can be realized, it is necessary to address the issues of both economic and individual consumer choices and key socio-economic processes that shape the future of mobility around the world.
1.2. Electric Vehicle Market, Status, Challenges and Literature Review
In many EU countries, we have been seeing a slow increase in the number of registered road vehicles powered exclusively by electric motors. These have been represented by vehicles with BEV (battery electric vehicles) and FCEV (fuel cell electric vehicles) propulsion systems. The Slovak Republic (see Figure 1) could represent an appropriate example of the low percentage share of these types of propulsion systems in the overall composition of a country’s vehicle fleet. At the beginning of 2025, in the Slovak Republic, only 18,102 of these types (of M1 category) out of a total of 3.4 million vehicles having an energy source, which represents only approximately 0.5%, were in operation. As for the share of light commercial electric vehicles of N1 category (i.e., vans), the situation is even worse. The analysis of the absolute growth-related values of these types of vehicle propulsion systems suggests that in the coming years, we cannot expect a higher relative share of this eco-friendly propulsion-system-type of vehicles in the Slovak Republic [10].
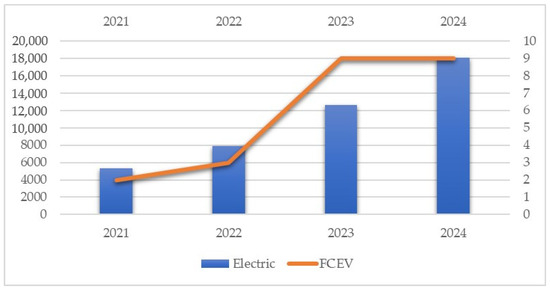
Figure 1.
Percentage share of vehicles with BEV and FCEV propulsion systems in the overall composition of the Slovak’s vehicle fleet. Source: authors according to [33].
As for the Czech Republic, 38,700 passenger battery electric vehicles of category M1 were in operation at the beginning of 2025, with almost 6400 public charging points available, of which over 580 points have very fast charging with outputs of 150+ kW. The development of new light commercial BEV registrations (i.e., electric vans of N1 category) in the Czech Republic over the last four years is depicted in Figure 2 [33].
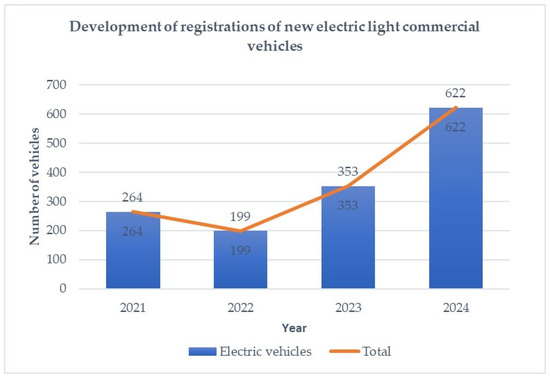
Figure 2.
Number of registrations of light commercial BEVs in the Czech Republic. Source: authors according to [33].
Electric motors were first introduced in the 19th century and have since been the subject of analysis by many authors; for instance, in literature [34,35,36,37,38,39,40,41,42,43,44,45,46,47,48,49,50,51,52,53,54,55,56,57,58,59,60,61,62,63,64]. Segrave [34] explains the gradual development of the field, describing the fierce competition with its conventional counterpart until its decline caused by the increasing popularity of combustion engines. Pedersen [35] and Arcos-Vargas [36] examine specific subtopics, delving into the impact of expanding electromobility on electric power distribution.
Desmond [37] focuses on the development and employment of electric trucks, while Van Mierlo [38] explores the role of plug-in hybrids. Westbrook [39] discusses the issue of batteries and their future development. Larminie and Lowry [40] examine the design and future of electric cars. Eastwood [41] analyses the [34,35,36,37,38,39,40,41,42,43,44,45,46,47,48,49,50,51,52,53,54,55,56,57,58,59,60,61,62,63,64] expectations concerning electromobility.
Electric vehicles have recently gained attention from many authors, who address various aspects of this issue in their studies. Langbroek et al. [42] conducted a case study on the Elbilsiandet (The Electric Vehicle Country) project in Gotland, Sweden. Lu et al. [43] introduce an innovative value-creation process for the electric vehicle (EV) industry.
The transformation of transport towards electrification is a key element of the global efforts to reduce greenhouse gas emissions in the context of small and medium-sized enterprises, which undoubtedly play an important role in this transformation but nevertheless face specific challenges related to the implementation of electric vehicles in their fleets. For example, the research conducted in [44] by Marklund and Rehnberg on the Swedish SME market identified key obstacles to EV adoption in small enterprises. The authors show that, in addition to high initial costs, SMEs face problems related to the availability of suitable EV models to meet their operational needs and uncertainty about the residual value of the vehicles. The study highlights that the predictability of operating costs is particularly important for SMEs. Complementing this perspective, Loengbudnark et al. in [45] conduct a survey that shows that concerns related to the safety of electric vehicles have a greater impact on the intention to implement electric vehicles than the purchase cost and perceived benefits.
An interesting study is conducted by Di Foggia [46]. Its results suggest a lack of information and awareness about electric vehicles in terms of technical parameters among 59% of the surveyed Italian fleet managers. In the context of high initial costs, Zhao et al. in [46] indicate approaches that lower the entry barrier and accelerate EV adoption in the transport sector in China. Similar studies are conducted on the Norwegian market [48], wherein Fuhrmann implies that economic factors are of the greatest importance for EV popularization. A different perspective on this issue is presented in [49], where, in addition to functional aspects of electric vehicles, such as ease of charging, battery price or electricity price, Khatua et al. discuss cognitive aspects and national culture as important parameters for the growth of the electric vehicle market.
For both companies and individual users, the problem of charging is important, therefore many articles have also tackled this issue, including Tian et al. [50], who explore EV charging load forecasting. A similar issue is addressed in [51,52,53] as well.
Current legal frameworks and consolidated functional roles in liberalized energy markets are analyzed comprehensively by Heinekamp et al. in their study [54]. Although electric vehicles (EVs) offer promising measures for reducing transport emissions, several obstacles hinder their adoption, and supply chain (SC) stakeholders must systematically identify and address these challenges. The study [55] by Dadashzada et al. aims to fill this gap, providing a foundation for future research and supporting organizational shifts toward sustainable transportation. The role of battery electric vehicles in off-peak hour deliveries is explored in [56] by Hassan et al., who assess the sustainability of this alternative. Additionally, Li et al. in [57] deal with the issue of introducing electric vans into the market from the general point of view.
The literature review indicates significant progress in electrification research, but at the same time, the following key conclusions emerge:
- The cost barrier remains significant, but innovative models of financing and support for users are becoming increasingly important.
- Effective support for electrification requires a holistic approach, combining financial instruments with operational and technical advice.
- Regional differences in EV adoption are significant and result not only from differences in support policies but also from cultural and structural conditions.
- Even the availability of charging infrastructure is necessary to reduce disparities between urban and rural areas.
- Continuous progress in technology is necessary, especially in batteries towards increased capacity, shorter charging times and longer battery life.
In order to facilitate the procedures for determining the compromise electric vehicle, in the present research, ELECTRE I and PROMETHEE II were utilized. ELECTRE I is discussed in [58], which focuses on choice procedures for selecting the best alternatives, considering reflexive binary relations. Additionally, [59] explores the range of criteria weights based on the outranking relations in ELECTRE I and II methods, considered as the sensitivity analysis regarding criteria weights.
The studies [60,61,62] apply PROMETHEE II. Specifically, [60] uses the PROMETHEE II method to choose the best laptop model from six different models available in the market. The research in [61] presents the possibilities of using the PROMETHEE II method to optimize the selection of e-learning courses. The survey conducted in [62] combines AHP and PROMETHEE II, with PROMETHEE II employed to evaluate environmental websites. The experiment revealed that the PROMETHEE II model was very effective in ranking environmental websites, outperforming other models.
The paper [63] analyzes the use of ELECTRE III, PROMETHEE I, II, and SMART decision aids in the context of four distinct real-world applications addressing environmental problems. The study defines the differences between these methods and their results, highlighting their applicability in supporting eco-friendly decision-making. The conclusion recommends using multiple methods for the same problem when feasible, with a preference for ELECTRE III when not. In addition, the manuscript [64] discusses very interesting outcomes of the application of ELECTRE III and PROMETHEE II as well.
The presented article provides a comprehensive analysis of the key drivers behind the aforementioned revolution, focusing on examining the circumstances affecting the desire to purchase electric vans for business purposes in the Czech Republic or/and Slovak Republic. A balanced approach was taken to assess the vans with electric propulsion systems available in the local market when comparing a variety of relevant factors.
The individual parts of this study explore the critical indicators influencing the decision-making to purchase a new light commercial vehicle with such a propulsion system. These indicators are meticulously analyzed using information from existing scholarly literature. Unlike the optimistic statistics presented in manufacturers’ brochures, academic research examines hard empirical data. The following part deals with the methods of multi-criteria decision-making employed to identify an electric van that meets the company’s requirements imposed by the weights of the properties assigned by the expert team.
For the purposes of the study, ELECTRE I and PROMETHEE II methods were applied, and the compromise solution in terms of electric propulsion system was chosen.
In light of the research conducted, the manuscript’s novel approach lies in particular in a combination of different multi-criteria decision-making methods in the subject addressed. The application of ELECTRE I and PROMETHEE II methods to the selection of electric vehicles (EVs), particularly electric vans, represents a novel approach due to the specific context and dynamic nature of the electromobility sector. While these methods have been widely utilized in transport- and energy-related studies, their application to the evaluation of electric vehicles, especially in terms of criteria, such as mileage, load-carrying capacity, recharging speed, purchase price, and fuel consumption, presents a unique challenge.
The novelty lies in applying these methods to the rapidly evolving EV market in the Czech and Slovak markets, where factors such as technology improvements, infrastructure developments, and sustainability goals continuously shift. Unlike traditional transport-related studies that often focus on standard vehicle categories or static operational factors, this study emphasizes the need for flexibility and adaptability in decision-making processes to account for long-term technological developments in electric vehicle technology, including battery efficiency and charging infrastructure.
By employing both ELECTRE I to classify vehicle options by their dominance and PROMETHEE II to rank them in descending order, the research provides a robust framework that not only reflects current market conditions but also accommodates future scenarios. This distinctive approach ensures that companies are not just selecting an optimal vehicle based on today’s needs but also considering future trends in electromobility, offering a more forward-looking, strategic method for corporate fleet decisions. The application of these methods to such a dynamic and multifaceted context is a key contribution to the field of sustainable transport solutions and highlights their utility in optimizing corporate decision-making in the face of rapidly changing technological and regulatory environments.
Therefore, following the statement above, it can be concluded that no research study or scientific work has ever dealt with the same topic as the authors of this article have, let alone applied an identical combination of methods of investigation.
2. Data and Methods
The PROMETHEE II method requires data for measuring the criteria of the alternatives. The weight values indicate if maximizing or minimizing criterion or minimum or maximum criteria values are to be considered.
The company under investigation, K-plyn Ltd., Čekanice, Tábor, Czech Republic, has been seeking a tender for purchasing (a) new van(s) for its assembly workers. The company specializes in installing heat pumps, air conditioning, and solar panels, as well as inspecting gas facilities and installing and maintaining solid-fuel and gas boilers. Assembly workers use vans to transport materials, tools, and large and heavy assembly units, including large boilers, air cleaners, and heat pumps.
However, first of all, it was necessary to address the ethical considerations related to the survey and data collection process in this study, as they play a crucial factor in terms of ensuring transparency, respect for participants’ rights, and the integrity of the research findings. Although the survey was conducted predominantly internally within the K-plyn Ltd. company by interviewing key expert team members, it is important to note that the process adhered to ethical guidelines for research involving human participants. To ensure voluntary participation and informed consent, all respondents were provided with a clear explanation of the study’s purpose, the role of their input, and how their responses would be used exclusively for the vehicle selection decision-making process.
They were assured that their personal opinions and preferences would remain confidential and anonymized. Furthermore, it should be noted that prior to conducting the survey, ethical approval for the data collection process was required from the relevant corporate board to ensure compliance with best practices in research ethics. These considerations are vital to maintain the credibility of the research and to ensure that the company’s decision-making process is conducted with full respect for the rights and welfare of the individuals involved.
Thus, subsequently, the expert team, encompassing both internal as well as external members, has identified the top six determining factors (i.e., utmost relevant criteria set) for the van purchase as follows [65]:
- mileage on a full recharge;
- load-carrying capacity;
- recharging speed up to 80% of the battery capacity;
- purchase price;
- load-bearing capacity;
- electricity consumption.
Based on these criteria (i.e., relevant parameters to be taken into consideration in the decision-making process and meticulously evaluated), the expert team has also identified the potentially suitable vehicles (i.e., variants in this matter) for the decision-making process, out of which the ideal/compromise option will then be selected—see their description below as well as Table 1 along with the relevant data corresponding to the identified criteria above.

Table 1.
Corresponding values of parameters (criteria) of individual vans (variants) under investigation. Source: authors according to Ford, 2024; Renault, 2024; VW, 2024; Opel, 2024; Peugeot, 2024.
Individual vehicle variants are taken into consideration as follows:
- Ford E-Transit L4H2—Electric motor with power of 135 kW or 198 kW, a range up to 309 km. Cargo space 15.1 m3, available in various lengths and heights of the body. Charging: 0–100% in 8 h (AC), 80% in 34 min (DC), 10 min of charging adds 78 km of range. Consumption can be reduced by 10% with economy mode. Battery warranty: 8 years/160,000 km. Standard equipment: heated windshield and mirrors, touchscreen, and air conditioning. Optional features: rain sensors, parking assistant, cruise control, and active safety systems (lane-keeping assistant, collision detection).
- Renault Master E-Tech L3H2—Electric motor with a real range of 204 km, at least 80 km in extreme conditions (city traffic, maximum load). Cargo space 13 m3, payload 1664 kg. In the L3 variant, it can carry up to 4 Euro pallets. Charging: 80% in 120 min (AC), full charge in 7 h. It does not support fast charging. Suitable for shorter city routes with frequent stops.
- VW E-Crafter—Electric motor with a range of 173 km, primarily designed for city traffic. Cargo space 13 m3, payload 1700 kg. Consumption: 21.5 kWh. Charging: 80% in 40 min (DC). Safety equipment: distance control system, emergency braking, lane-keeping assistant, and crosswind stabilization. Optionally, it comes with cruise control and fog lights with cornering assist.
- Opel Vivaro-E—Electric motor with a range of 330 km, lower construction for better driving characteristics. Cargo space 6.6 m3, payload 1200 kg. Charging: 80% in 30 min (DC). Consumption: 26.4 kWh. Option for a passenger version with up to 8 seats. Equipment: adaptive cruise control that adjusts to surrounding traffic, driver fatigue monitoring, head-up display, and panoramic camera. Optional heated seats, navigation. It has a more comfortable interior than most vans.
- Peugeot E-Partner—Electric motor with a range of 275 km. Cargo space 4.4 m3, payload 800 kg. Charging: 80% in 30 min (DC). Consumption: 16.2 kWh—the lowest among the assessed models. The lowest purchase price (€43,800 including VAT). Basic equipment: air conditioning, hill-start assist, lane-keeping assistant, and cruise control. Safety systems: obstacle detection, traffic sign recognition, and emergency braking. Optional parking sensors, navigation, adaptive cruise control, and camera systems.
As a follow-up step, to evaluate the above criteria, individual parameters were surveyed through five corporate levels, from managers to the workers operating the van. Each employee concerned uses the vehicle for different purposes and prioritizes different properties based on their position. As the van is expected to significantly increase the company’s income, the firm emphasizes maximizing its utilization and lifespan. For this purpose, the following positions were interviewed:
- corporate manager,
- logistics director,
- inbound logistics manager,
- external logistics expert in the academic sphere, and
- corporate electrotechnician.
Table 2 below illustrates the input preferences assigned by the individual expert team members (i.e., respondents) to each regarded criterion applied to the multi-criteria decision-making process. Each respondent assessed the criteria on a scale from 0 to 10, with the importance ranked in ascending order. If two criteria were considered equally important, the values in the table were repeated.
Table 2.
Preferences on a scale from 0–10. Source: authors based on preferences of the workers of K-plyn Ltd.
Based on the preferences, the models of electric vans were evaluated according to their suitability for the compromise alternative, which meets all the company’s requirements for the vehicle [66].
2.1. ELECTRE I
ELECTRE I was developed to complement effective and realistic decision-making approaches, particularly when dealing with complex and contradictory criteria. The method aimed to surpass traditional techniques that relied on simple data weighting and calculation. This alternative offered a way to effectively grasp the complexity of the real world [38].
ELECTRE I incorporates the concept of incomparability and the principle of dominance. The technique does not require all alternatives to be comparable, offering a realistic view of the decision-making process. The dominance principle helps identify alternatives that significantly outplay others across most or all criteria, while discarding inferior options [67]. ELECTRE I involves several key steps [68,69]:
- Decision matrix construction: A matrix is created, with values assigned to each alternative according to specific criteria;
- Criteria weighting: A weight is assigned to each criterion, reflecting its importance in the decision-making process;
- Concordance and discordance calculation: Concordance and discordance indexes are calculated for each pair of alternatives. The concordance index measures how much one alternative exceeds another, while the discordance index indicates whether there are any important criteria showing that one variable is significantly worse;
- Threshold values: Concordance and discordance threshold values are set to determine the minimum level at which a variable is considered “acceptable”;
- Dominance graph: The results from the concordance and discordance analysis are represented in a graph depicting dominant and subordinate alternatives.
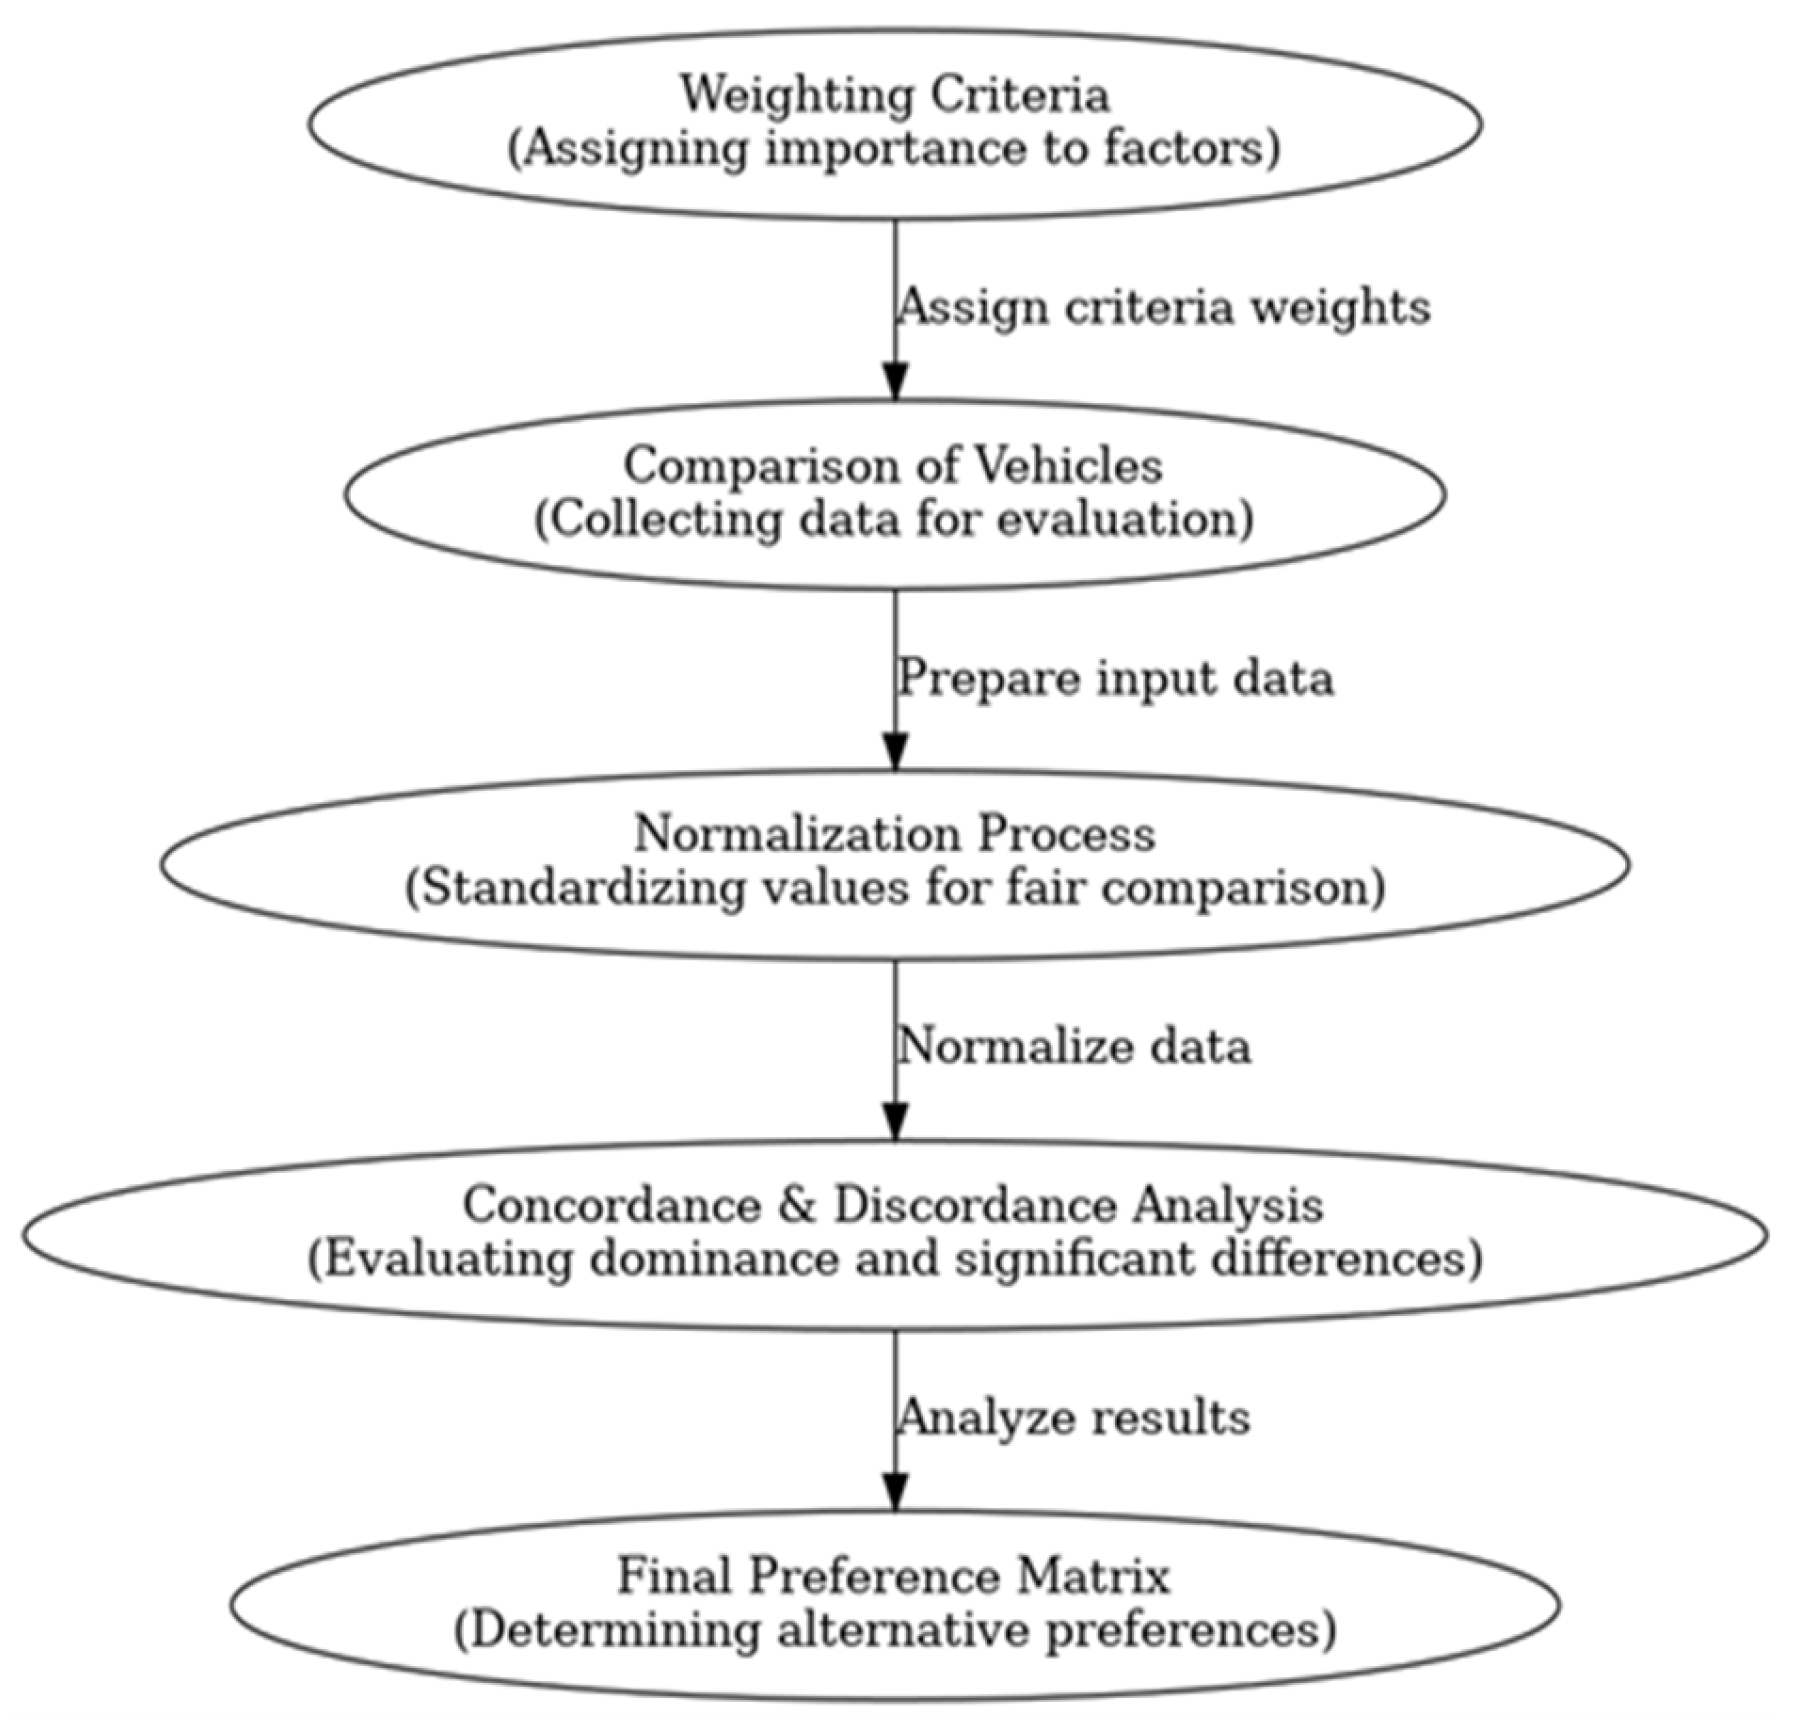
ELECTRE I covers areas with complex decision-making processes that require a realistic assessment of the variables. The method considers the incomparability of alternatives, avoiding unrealistic calculations of pros and cons. This makes ELECTE I one of the most effective decision-making techniques in situations where traditional approaches fail. The decision-making process follows a structured procedure of the ELECTRE I method to ensure consistency and fairness in evaluating alternatives (see Figure 3).
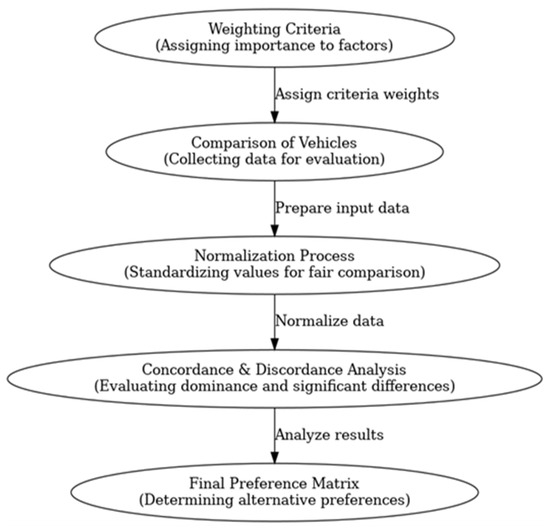
Figure 3.
Electre I Decision-making process flowchart.
The diagram above outlines the sequence of steps involved, from assigning weights to criteria to developing the final preference matrix. This approach ensures that the analysis remains objective and transparent.
2.2. PROMETHEE II
PROMETHEE II involves comparing pairs of alternatives according to specific criteria, allowing decision-makers to assess and compare various options. For the method to be effective, it is necessary to set weights for the criteria and define preference functions that reflect the decision-maker’s priorities [70,71].
The calculation within PROMETHEE II involves several steps that allow a systematic and objective assessment of the variables [72,73]:
- Normalizing the decision matrix;
- Calculating the preference functions;
- Aggregating the preference functions;
- Calculating flows (incoming, outgoing, net flow);
- Ranking the variables.
The PROMETHEE II method requires data for measuring the criteria of the alternatives. The weight values indicate if maximizing or minimizing criterion or minimum or maximum criteria values are to be considered (see Figure 4 that visually represents the diagram of the step-by-step methodology applied in the PROMETHEE II technique).
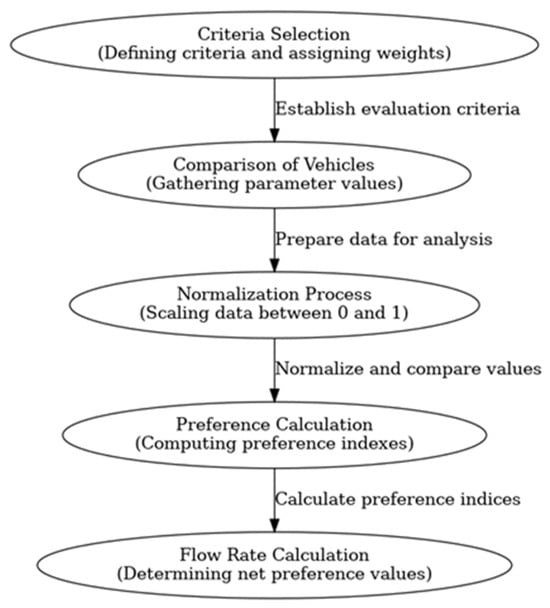
Figure 4.
PROMETHEE II Decision-making process flowchart.
The diagram above outlines the process from selecting criteria and comparing alternatives to calculating preference values and flow rates, providing a structured framework for decision-making.
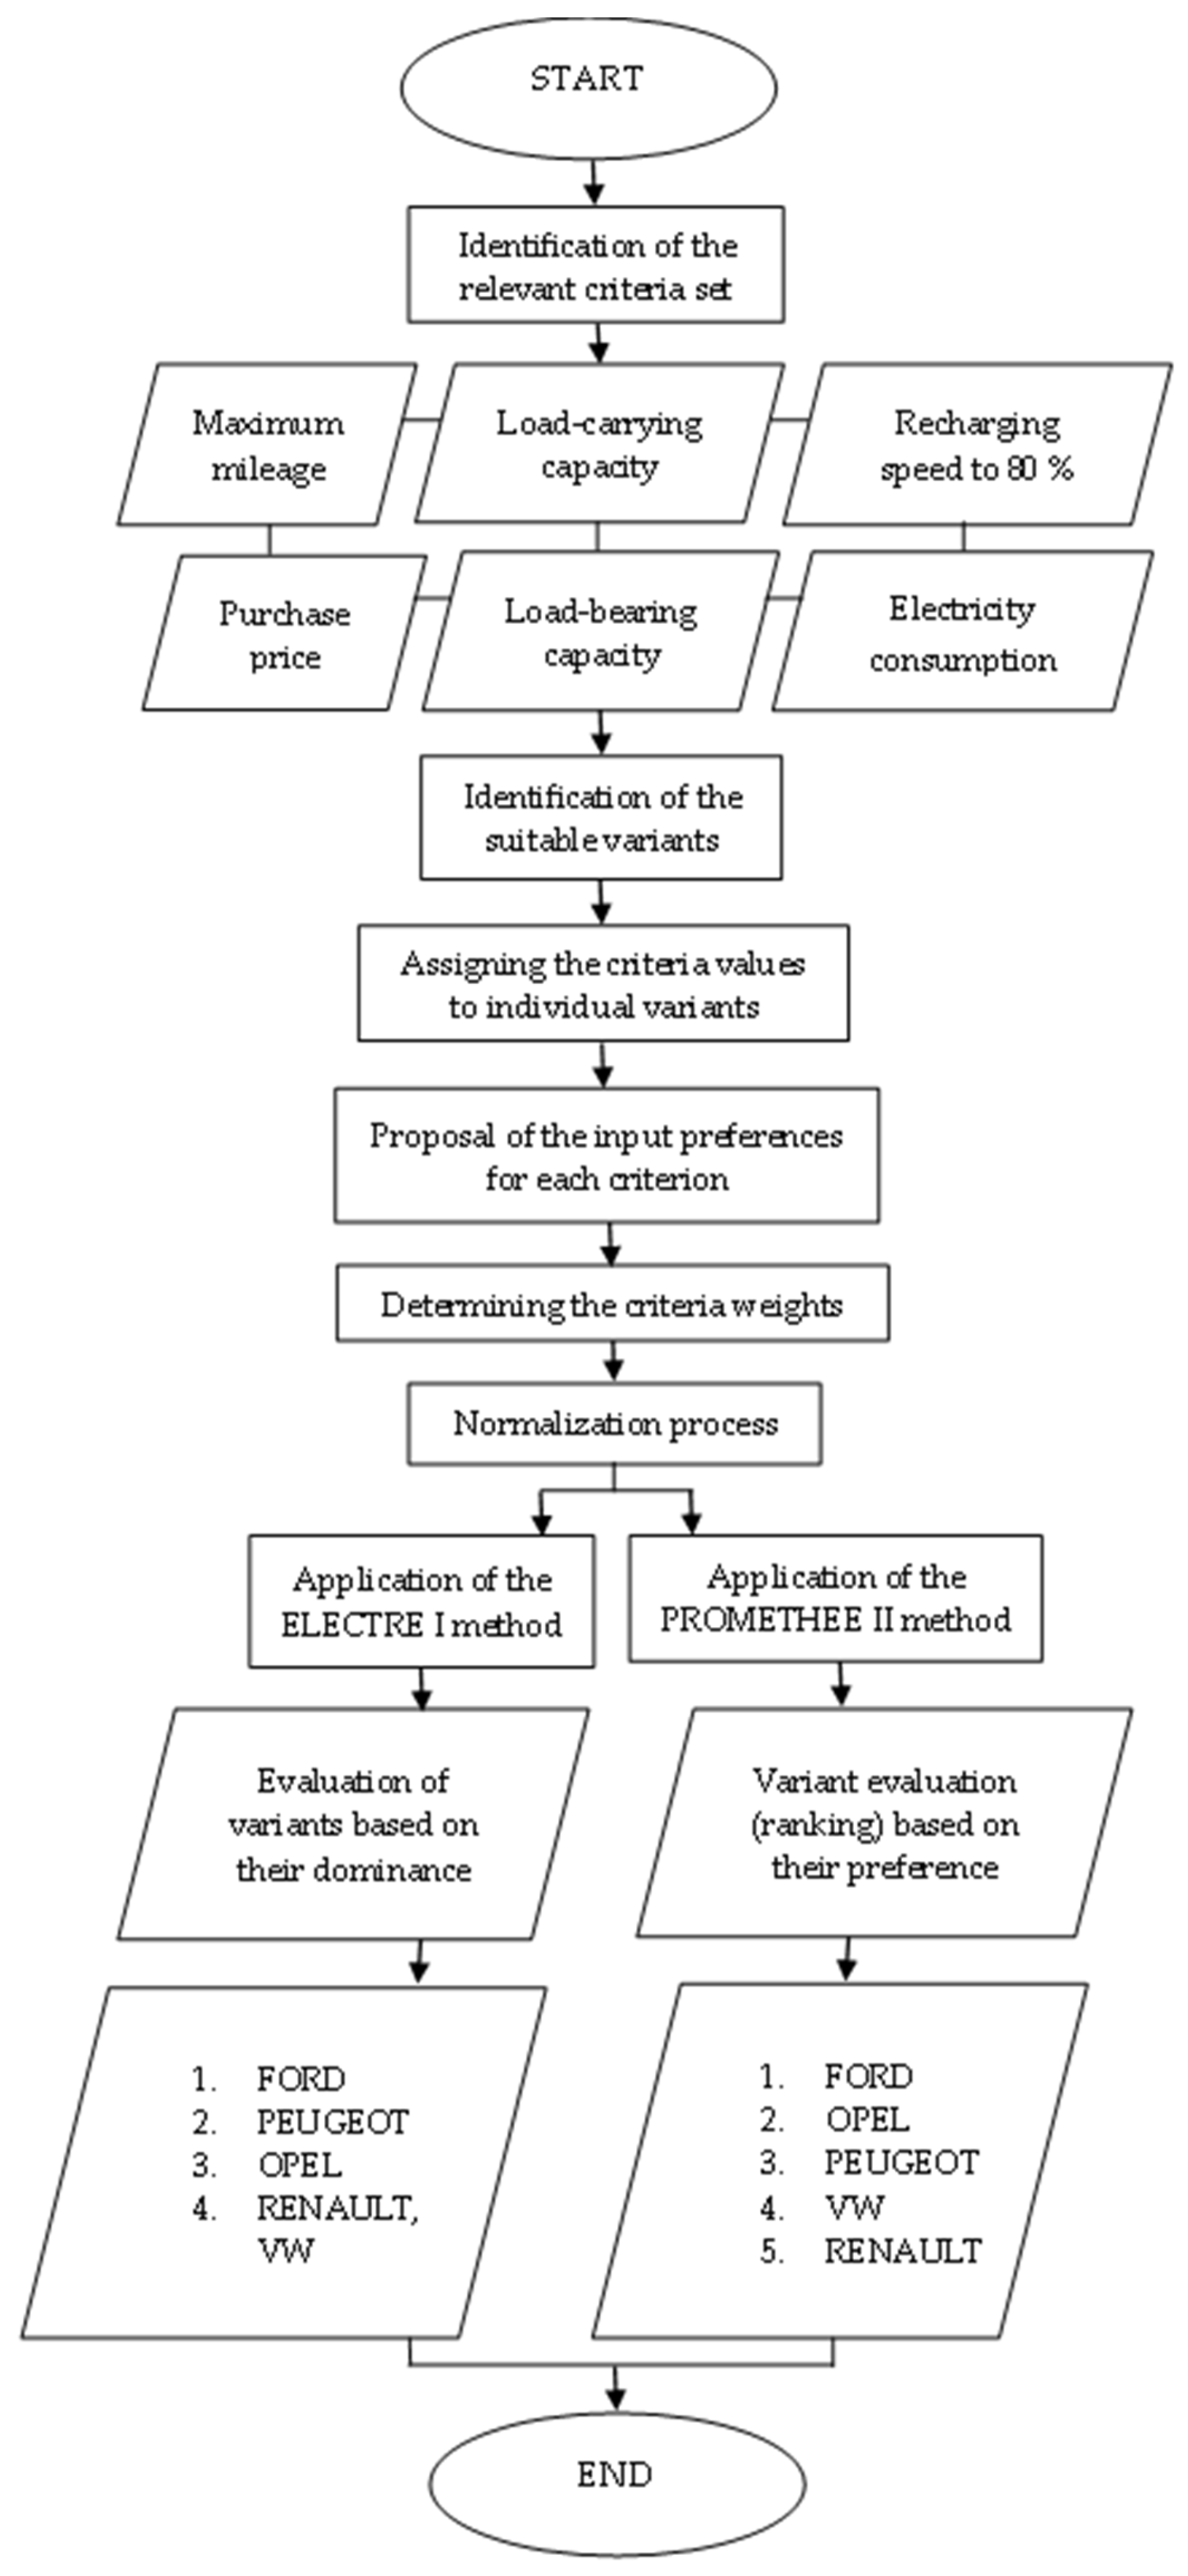
The whole procedure of the decision-making process by applying both the ELECTRE I as well as PROMETHEE II methods is vividly depicted in the following flowchart (see Figure 5).

Figure 5.
The comprehensive decision-making process flowchart.
3. Results Obtained
3.1. Application of the ELECTRE I
The criterion weights were assigned on a scale ranging from 0 (the least important) to 10 (the most important). The points for each criterion provided by each interviewee were calculated column-wise. Then, the sum of the points for each criterion was divided by the total number of points assigned to all criteria, resulting in a normalized weight for each criterion [74], as calculated by Formula (1) (weighting) and presented in Table 3.
where wh is weighting, n is number of interviewees, m is number of criteria, bhj is points, and h is criterion.
Table 3.
Weighted preferences. Source: authors.
Now, a table containing the criteria values must be drawn for the assessment. These figures indicate the differences between the vehicles being compared. It is also necessary to determine whether the criterion value should be minimized, with the ideal criterion value close to 0 (e.g., high noise level, obsolescence, high costs, etc.), or maximized, with the ideal criterion value close to 10 (e.g., profit, performance, load-carrying capacity, etc.) [75]. Table 4 presents the parameters.
Table 4.
Electre I—parameters of the compared variables. Source: authors according to Ford, 2024; Renault, 2024; VW, 2024; Opel, 2024; Peugeot, 2024.
The following step involves normalizing the data of the criteria values from 0 to 1, ensuring that no criterion value exceeds another and that all values in the columns are comparable. Without normalization, some criteria might show better values than others simply due to differences in the measurement scale. Normalization ensures the equality of all criteria, and its formula varies according to a specific criterion [67,76]. Formula (2) below is used for minimizing, while Formula (3) is applied for maximizing criteria.
Minimum criterion:
Maximum criterion:
where y’ih is a normalized value, maxi is the maximum criterion value, mini is the minimum criterion value, and yih is the normalized entry value [77].
Table 5 suggests the normalization process.
Table 5.
Electre I—normalization. Source: authors.
The following step involves the creation of a concordance table to illustrate the degree to which one variable dominates another (see Table 6), using Formula (4) [68].
Table 6.
Electre I—concordance table. Source: authors.
Concordance calculation:
where Hij is a criteria set where i variable dominates j variable.
The discordance table (see Table 7) depicts whether a significantly worse variable exists, using Formula (5) [68].
Table 7.
Electre I—discordance table. Source: authors.
Discordance calculation:
where cij ≥ c* and dij, then pij = 1, otherwise pij = 0 (see Table 7 and Table 8).
Table 8.
Electre I—P matrix for the evaluation of the results. Source: authors.
The evaluation involves threshold values calculated by the arithmetic mean from the concordance and discordance table [69].
- C ≥ 0.5—concordance threshold;
- D ≤ 0.70—discordance threshold.
Matrix p requires that the concordance and discordance thresholds are not exceeded. The possible entry value is either 1, indicating that both threshold values are satisfied (preferred variable), or 0, indicating that one or both threshold values are not satisfied (non-preferred variable or it is impossible to prefer the variables based on the threshold values) [70]. Matrix p (see Table 8), in terms of the ELECTRE I method, represents the final evaluation of preferences among individual variants after the application of concordance and discordance procedures.
- i variable is preferred over j variable, if pij = 1;
- the evaluation of the p matrix reveals dominant variables regarding the criteria.
Crucial findings:
- FORD is the strongest (the compromise) variant because it dominates over RENAULT, VW, as well as OPEL,
- OPEL only dominates over RENAULT but does not outweigh other variants,
- PEUGEOT dominates only over OPEL,
- RENAULT and VW are the weakest variants because they have no preference (all the values in their rows are 0).
Outcomes from the decision-making process in terms of the van selection based on the identified criteria are as follows:
- FORD represents an explicit compromise variant because it dominates over the other three considered variants (vans),
- RENAULT and VW are the worst options because they are not preferred over any other variant,
- OPEL and PEUGEOT have partial dominance, but they are not as strong as FORD.
The rows represent a competing variable, while the columns suggest a comparison with another variable. Entry value 1 implies that the row variable is preferred over the column alternative.
The application of the PROMETHEE II method in the ensuing section will either confirm or reject these results and rank the variables in the optimal order.
3.2. Application of the PROMETHEE II
PROMETHEE II involves gathering data concerning the criteria of the vehicles. The values of the weights, maximizing and minimizing criteria, and the minimum and maximum criteria values must be known.
The data used are the same as in Electre I. The table illustrates the nature of the criteria, including the weights and the maximum and minimum criteria values needed for normalization. The sum of the weights must equal zero. The maximizing criterion favors higher values, whereas the minimizing criterion prioritizes lower values [71]. Table 9 presents the input data processed by the PROMETHEE II method.
Table 9.
PROMETHEE II—the input data. Source: authors.
Now, the data had to be normalized again to facilitate an effective comparison of the criteria on a scale from 0 to 1. As in ELECTRE I, it is necessary to distinguish between maximizing and minimizing criteria and select appropriate formulas. Formula (6) depicts the normalization for maximizing criteria, while Formula (7) illustrates the minimizing criterion normalization [72].
Maximizing criterion:
Minimizing criterion:
where Pij refers to the normalized criterion value, maxi is the maximum value of the column, mini suggests the minimum criterion value, and yij shows a normalized entry value. The values calculated using Formulas (6) and (7) are shown in Table 10.
Table 10.
PROMETHEE II—normalized data. Source: authors.
Preference indexes for each criterion were also established to determine the degree of preference for the tested vehicles. The equation governs that ijh is a preference index for h criterion between i and j. yih,yjh are h values for i and j. It is assumed that q, p, and v are the parameters for the preference functions that define the threshold values for the preference levels. Preference indexes are calculated by subtracting the value of i from j within the compared pair according to Formula (8) [72]. Table 11, Table 12, Table 13, Table 14 and Table 15 depict the preferences.
Table 11.
PROMETHEE II—preferences v1. Source: authors.
Table 12.
PROMETHEE II—preferences v2. Source: authors.
Table 13.
PROMETHEE II—preferences v3. Source: authors.
Table 14.
PROMETHEE II—preferences v4. Source: authors.
Table 15.
PROMETHEE II—preferences v5. Source: authors.
Calculation of preference indexes:
The next step involves transferring the preference data into positive preferences, where only values that indicate a preference of one vehicle over another are considered. The data transfer to positive preferences was calculated according to Formula (9) [73].
Positive preference data transfer:
where is the total preference index between i and j, m refers to the number of criteria, wh is the weight for criterion h, and is the preference index for h between i and j. In the event of a negative preference index, j is preferred over i, and a value of 0 is input. Positive preferences are shown in Table 16, Table 17, Table 18, Table 19 and Table 20.
Table 16.
PROMETHEE II—v1 preference transfer to positive preferences. Source: authors.
Table 17.
PROMETHEE II—v2 preference transfer to positive preferences. Source: authors.
Table 18.
PROMETHEE II—v3 preference transfer to positive preferences. Source: authors.
Table 19.
PROMETHEE II—v4 preference transfer to positive preferences. Source: authors.
Table 20.
PROMETHEE II—v5 preference transfer to positive preferences. Source: authors.
Preference values were then obtained by multiplying the values by the weight values for the criterion, as outlined in Formulas (10) and (11) [73,74]. The results are presented in Table 21, Table 22, Table 23, Table 24 and Table 25.
Table 21.
PROMETHEE II—v1 preferences multiplied by weight values. Source: authors.
Table 22.
PROMETHEE II—v2 preferences multiplied by weight values. Source: authors.
Table 23.
PROMETHEE II—v3 preferences multiplied by weight values. Source: authors.
Table 24.
PROMETHEE II—v4 preferences multiplied by weight values. Source: authors.
Table 25.
PROMETHEE II—v5 preferences multiplied by weight values. Source: authors.
Positive flow rate:
Negative flow rate:
where is an aggregate preference index between i and j where n refers to the sum of the alternatives.
PROMETHEE II requires a table of flow rates. The outbound flow is a sum of the values in a line, indicating a situation where a vehicle’s properties outperform those of the other vans. The inbound flow refers to the identical sum of values but describes the opposite scenario, i.e., when a vehicle is outplayed by others. In this step, the values in the lines of the tables, i.e., “preferences multiplied by weight values”, are summed up, and the results are recorded in the tables titled “calculated flow rates”. By summing up the lines above this paragraph, it is, e.g., possible to achieve the following values: v5v1 (0.1545), v5v2 (0.404), v5v3 (0.4699), and v5v4 (0.1841) [73,78]. Table 26 below presents the calculated flow rates in detail.
Table 26.
PROMETHEE II—calculated flow rates. Source: authors.
The table of flow rates is used to calculate the difference between the flows, which allows the variables to be ranked and determines a compromise. The highest difference value corresponds to the ideal alternative, followed by the variables with lower flow differences. The net flow rates are calculated using Formula (12). Table 27 shows the evaluation of the method, including the ranking [74].
Table 27.
PROMETHEE II—evaluation and ranking. Source: authors.
Net flows calculated:
Net flow rates are key indicators in the results obtained by the PROMETHEE method. It is assumed that represents the inbound flow, while represents the outbound flow value [72,78].
4. Discussion
Although ELECTRE I focused primarily on classifying multiple variables into effective and ineffective, it is likely that only Variable 1 will succeed, dismissing other alternatives as inefficient. This outcome is highly dependent on the concordance and discordance thresholds, which provide the background for the technique.
The thresholds for ELECTRE I were calculated using the arithmetic mean. The resulting values were used to compile the p matrix for evaluating the variables. Even with ELECTRE I, an overwhelmingly dominant alternative for the propulsion system could be determined. It was anticipated that ELECTRE I would classify the variables into “effective” and “ineffective”, leaving PROMETHEE II to find a compromise among the remaining options. PROMETHEE II shows that Ford strongly outperforms Renault, VW, and Opel, losing only to Peugeot. In the case of Electre I, however, it cannot be clearly stated that Peugeot is superior to Ford.
The method addresses parameter weights, and its results comply with the preferences and requirements of K-plyn Ltd. The findings can be interpreted as follows:
While PROMETHEE II identified a compromise alternative, its steps and principles were inconsistent and did not clarify whether the ranking and compromise matched the previous technique.
ELECTRE I suggests that Ford outperforms all other alternatives except for Peugeot, indicating an overwhelmingly dominant variable and ranking Ford E-Transit as the best vehicle. PROMETHEE II defines a compromise, ranking the options in descending order. This method categorized all the analyzed vans, providing the company with more valuable findings.
Evaluation of the outcomes based on both methods applied as follows:
- ELECTRE I—Ford is the best (compromise) option, whereby in Figure 6 below, a directed graph of preferences (so-called dominance graph) according to the matrix p in terms of the ELECTRE I method, which can be interpreted as follows:
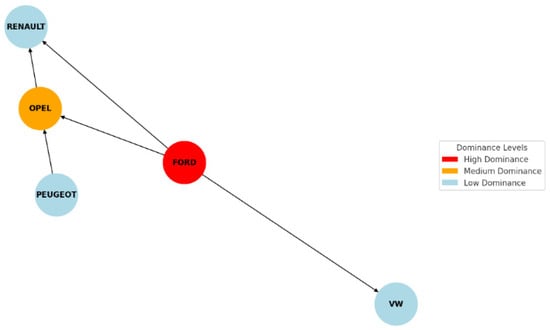 Figure 6. Dominance graph of preferences by the ELECTRE I method.
- FORD is a dominant choice because it has arrows pointing to multiple variants (RENAULT, VW, OPEL),
- PEUGEOT dominates over OPEL,
- OPEL is stronger than RENAULT,
- RENAULT and VW are the worst ones because arrows point to them, but they do not send out any.
- PROMETHEE II—ranks the vans from the best to the worst as follows (see Figure 7 as well):
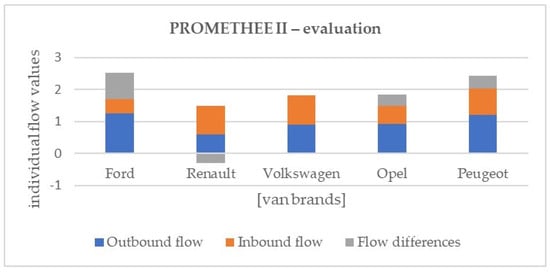 Figure 7. The comparative graph by the PROMETHEE II method.
- Ford,
- Opel,
- Peugeot,
- Volkswagen,
- Renault.
The increased demand, unstable market conditions, and the global chip shortage, recently hindering global automotive production, have led to a scarcity of specific vehicle models.
These complications resulted in extended waiting times, prolonged unavailability, or even the complete removal of certain models from the market. PROMETHEE II advises potential buyers to consider purchasing an e-vehicle when no compromise is possible.
The findings provide valuable insight to the company, identifying the best option available on the market, even when only two alternatives compared are available.
Recommendations for further research include:
- Deeper analysis of environmental impacts: extending the research by analyzing the emission cycle to assess the environmental benefit of e-van models, including the manufacturing and recycling of batteries;
- Comparison with other alternative fuels: analyzing and comparing e-vans with vehicles powered by different fuels in terms of eco-efficiency and sustainability, including hydrogen and hybrid technologies;
- Economic aspects: analyzing operating costs, maintenance, and recharging of e-vans compared to traditional diesel models in localities with varied infrastructure;
- Customer requirements and acceptance: extending the questionnaire survey to other companies that use e-vehicles to map the factors influencing customer satisfaction and decision-making;
- Improving electromobility infrastructure: analyzing the development and optimization of charging stations and their impact on e-vehicle traffic [79,80].
Both ELECTRE I and PROMETHEE II provided results that evaluated the compromise. ELECTRE I alone could be sufficient to determine the best option because it offers a specific interpretation. Ideally, Variable 1 outperforms the other alternatives across all aspects, indicating that the compromise is the best option. However, the method classifies the alternatives into ‘effective’ and ‘ineffective’, showing that the Ford E-Transit is the perfect option, surpassing the Volkswagen E-Crafter, Opel Vivaro-E, and Renault Master E-Tech. On the other hand, the findings do not confirm whether the Ford E-Transit is superior to the Peugeot E-Partner, leaving the company uncertain about which option is better.
PROMETHEE II provided clear and unambiguous results, suggesting Ford E-Transit as the compromise and ranking the other alternatives in descending order. Since both multicriteria methods are highly specific, it cannot be determined which one produces optimal results. In rare cases, both techniques may yield different conclusions regarding the compromise, requiring a different approach to determine the decisive criterion in the event of unclear outcomes. In case of inconsistent findings, it may be necessary to decide upon a determining factor, such as choosing the less costly alternative.
By applying the methods of multi-criteria decision-making, an optimal solution for an e-van available on the market was achieved. The vehicle represents a bold step towards climatic neutrality and enhancing corporate responsibility in achieving carbon neutrality across all business activities by 2035.
Nevertheless, the final evaluation of van brand variants, obtained through the application of the specific multi-criteria decision-making methods, could be significantly affected by conducting sensitivity analysis. Since the initial criteria weights were assigned based on the assembled expert team judgments, sensitivity analysis would investigate the matter of how variations in these weights impact the ranking of variants evaluated. If certain criteria were found to have a disproportionate effect on the final rankings, adjusting their weights could lead to changes in the relative positioning of van options. For instance, a van that was initially ranked lower might move higher if criteria favoring its strengths receive more weight, while a highly ranked variant could drop if its advantages become less significant in the analysis. Sensitivity analysis could thus reveal the robustness of the initial evaluation and provide deeper insights into how stable the rankings are under different weighting scenarios.
One way or another, in case of the study conducted, multiple calculations have been made when combining various groups of key criteria and their weights, and each time, more or less with identical or similar outcomes achieved.
Given the aim of the study, a key assumption for evaluating individual variants being the expert team preferences. However, conducting a sensitivity analysis is an interesting, stimulating, and valuable topic for a further study, which could serve as a continuation of our current research. We will certainly take this opportunity and note into account in our future research.
In addition, the management of the K-plyn company plans to implement a post-decision evaluation. This process includes:
- Feedback retrieval from fleet managers; i.e., assessing whether the selected vehicle actually meets expectations in terms of operating costs, mileage, reliability, and so forth.
- Monitoring real-traffic vehicle operation; i.e., comparing anticipated parameters (e.g., energy consumption, charging efficiency and others) with actual values in usual operation.
- Evaluating driver satisfaction; i.e., their experience with the vehicle in the field operation, ergonomic factors, ease of operation, etc.
5. Conclusions
As shown in the article, the implementation of electric delivery vehicles in companies is not only a technological issue but also a strategic one. Choosing the right vehicle model requires taking into account many factors, such as mileage, operating costs, charging infrastructure, as well as environmental impact. Due to increasing regulations on exhaust emissions and decarbonization policies, companies are increasingly analyzing different mobility options to adapt their fleets to the requirements of sustainable development. Hence, multi-criteria decision-making methods, such as, e.g., ELECTRE and PROMETHEE, play a key role in the process of selecting the vehicle that best meets specific operational needs. The article showed that these methods have proven to be excellent in this area. A great advantage of these methods is the ease of adapting them to individual expectations and markets.
The conducted analysis is just an example that can be easily translated to other countries. This shows the great utilitarianism and usefulness of these methods and indicates that their selection was accurate. This is particularly important, first of all, due to the fact that the development of technology in the electromobility sector means that choosing the best electric vehicle is a very dynamic process, and the factors that determine it are changing and require constant monitoring of market novelties. The universality of the proposed methods allows for easy adjustment to changing circumstances. Increasingly efficient batteries, faster charging systems, and integration with digital fleet management approaches mean that currently made decisions may require verification in the near future. This is particularly important in the case of companies planning long-term investments. In this case, the proposed methods will also work very well, allowing for the creation and comparison of several alternative scenarios. This approach guarantees not only the analysis of current needs but also the consideration of future directions of technological development so that the fleet remains efficient and in line with the forecasted standards.
Finally, the authors would like to emphasize once again that an effective choice of an electric vehicle requires a balanced approach, taking into account both data analysis and the long-term strategy of the company. The use of multi-criteria decision analysis methods allows for more objective and justified choices that maximize economic, operational and environmental benefits. As electromobility becomes a standard in the transport sector, skillful decision-making in this area will be crucial for the future of companies, their operational efficiency and market position. Therefore, the authors’ future research will focus on further improvement of multi-criteria decision analysis methods in the context of selecting the proper mobility option, taking into account the dynamic development of battery technology, charging infrastructure and the integration of electric vehicles with intelligent fleet management systems. As research continues, analyses will be proposed that take into account real-world operating conditions and the long-term impact of using electric delivery vehicles on operating costs and carbon dioxide emission reductions in various economic sectors. Based on the research carried out, it can be stated that a similar study, when addressing the identical subject and/or using the same multi-criteria-decision-making techniques, has not been published yet. Specifically, the novelty of the article consists of its application of a combination of particular methods of examination in the issue discussed.
Author Contributions
Conceptualization, O.S. and V.Ľ.; methodology, M.S. and O.S.; validation, A.B. and B.Š.; formal analysis, V.Ľ.; investigation, B.Š., O.S. and T.K.; sources, M.S., O.S. and A.B.; data management, O.S. and T.K.; writing—preparation of the original draft, O.S. and V.Ľ.; writing—review and editing, A.B. and O.S.; visualization, M.S. and O.S.; supervision, B.Š. and T.K.; project administration, O.S.; obtaining funding, O.S. All authors have read and agreed to the published version of the manuscript.
Funding
This research received no external funding.
Institutional Review Board Statement
Not applicable.
Informed Consent Statement
Not applicable.
Data Availability Statement
The original contributions presented in this study are included in the article. Further inquiries can be directed to the corresponding author.
Acknowledgments
The research was supported by the research project entitled LUABA24085 “Analysis and optimization of Czech-German worker mobilities to support cross-border cooperation (Locomotion)”, of the INTER-EXCELLENCE program, INTER-ACTION subprogram.
Conflicts of Interest
The authors declare no conflicts of interest.
References
- Kozłowski, E.; Wiśniowski, P.; Gis, M.; Zimakowska-Laskowska, M.; Borucka, A. Vehicle acceleration and speed as factors determining energy consumption in electric vehicles. Energies 2024, 17, 4051. [Google Scholar] [CrossRef]
- Poorani, S.; Jebarani Evangeline, S.; Bagyalakshmi, K.; Maris Murugan, T. Improving reliability in electric vehicle battery management systems through deep learning-based cell balancing mechanisms. Eksploat. Niezawodn.–Maint. Reliab. 2025, 27. [Google Scholar] [CrossRef]
- Rapson, D.S.; Muehlegger, E. The economics of electric vehicles. Rev. Environ. Econ. Policy 2023, 17, 274–294. [Google Scholar] [CrossRef]
- Xue, C.; Zhou, H.; Wu, Q.; Wu, X.; Xu, X. Impact of incentive policies and other socio-economic factors on electric vehicle market share: A panel data analysis from the 20 countries. Sustainability 2021, 13, 2928. [Google Scholar] [CrossRef]
- Liu, Y.; Zhao, X.; Lu, D.; Li, X. Impact of policy incentives on the adoption of electric vehicle in China. Transp. Res. Part A Policy Pract. 2023, 176, 103801. [Google Scholar] [CrossRef]
- Bakken, K.; Grønnestad, L.S.S. Implications of Tax Policy Changes on the Norwegian Electric Vehicle Market: An Empirical Analysis of Changes in the Value-Added Tax and the One-Off Registration Tax. Master’s Thesis, Norwegian School of Economics, Bergen, Norway, December 2023. [Google Scholar]
- Trotta, G.; Sommer, S. The effect of changing registration taxes on electric vehicle adoption in Denmark. Transp. Res. Part A Policy Pract. 2024, 185, 104117. [Google Scholar] [CrossRef]
- Camara, Y.; Holtsmark, B.; Misch, F. Electric vehicles, tax incentives and emissions: Evidence from Norway. Int. Monet. Fund 2021, 2021, 1–25. [Google Scholar] [CrossRef]
- Dimanchev, E.; Fleten, S.E.; MacKenzie, D.; Korpås, M. Accelerating electric vehicle charging investments: A real options approach to policy design. Energy Policy 2023, 181, 113703. [Google Scholar]
- Arlt, M.L.; Astier, N. Do retail businesses have efficient incentives to invest in public charging stations for electric vehicles? Energy Econ. 2023, 124, 106777. [Google Scholar] [CrossRef]
- Gonzalez, J.N.; Gomez, J.; Vassallo, J.M. Do urban parking restrictions and Low Emission Zones encourage a greener mobility? Transp. Res. Part D Transp. Environ. 2022, 107, 103319. [Google Scholar]
- Manglano-Redondo, P.; Paricio-Garcia, A.; Lopez-Carmona, M.A. Dynamic Low-Emission Zones for Urban Mobility: A Systematic Review. Appl. Sci. 2025, 15, 2915. [Google Scholar] [CrossRef]
- Singh, S.; Kulshrestha, M.J.; Rani, N.; Kumar, K.; Sharma, C.; Aswal, D.K. An overview of vehicular emission standards. Mapan 2023, 38, 241–263. [Google Scholar] [CrossRef]
- Sechel, I.C.; Mariasiu, F. Efficiency of governmental policy and programs to stimulate the use of low-emission and electric vehicles: The case of Romania. Sustainability 2021, 14, 45. [Google Scholar] [CrossRef]
- Ghasemi-Marzbali, A. Fast-charging station for electric vehicles, challenges and issues: A comprehensive review. J. Energy Storage 2022, 49, 104136. [Google Scholar]
- Borucka, A.; Stopka, O.; Kozłowski, E. Analysis of electric vehicles in the context of the world’s largest economies. Arch. Automot. Eng.–Arch. Motoryz. 2024, 106, 65–82. [Google Scholar] [CrossRef]
- Khwanrit, R.; Javaid, S.; Lim, Y.; Charoenlarpnopparut, C.; Tan, Y. Optimal vehicle-to-grid strategies for energy sharing management using electric school buses. Energies 2024, 17, 4182. [Google Scholar] [CrossRef]
- Zhu, L. Energy management in microgrid integrated with ultracapacitor-equipped electric vehicles and renewable resources using Hybrid Algorithm Perspective. Eksploat. Niezawodn.–Maint. Reliab. 2025. [Google Scholar] [CrossRef]
- Josephin Shermila, P.; Anu Disney, D.; Reeda Lenus, C.; Niruban, R. Efficiency and reliability: Optimization of energy management in electric vehicles applying Monarch Butterfly Algorithm and fuzzy logic control. Eksploat. I Niezawodn.–Maint. Reliab. 2025. [Google Scholar] [CrossRef]
- van Kooten, G.C.; Stobbe, T.E. The economics of electric vehicles with application to electricity grids. Energies 2024, 17, 4109. [Google Scholar] [CrossRef]
- Ziółkowski, J.; Oszczypała, M.; Lęgas, A.; Konwerski, J.; Małachowski, J. A method for calculating the technical readiness of aviation refuelling vehicles. Eksploat. Niezawodn.–Maint. Reliab. 2024, 26, 1–13. [Google Scholar] [CrossRef]
- Kozłowski, E.; Borucka, A.; Oleszczuk, P.; Leszczyński, N. Evaluation of readiness of the technical system using the semi-Markov model with selected sojourn time distributions. Eksploat. Niezawodn.–Maint. Reliab. 2024, 26, 1–15. [Google Scholar] [CrossRef]
- Wallington, T.J.; Anderson, J.E.; Dolan, R.H.; Winkler, S.L. Vehicle emissions and urban air quality: 60 years of progress. Atmosphere 2022, 13, 650. [Google Scholar] [CrossRef]
- Jonidi Jafari, A.; Charkhloo, E.; Pasalari, H. Urban air pollution control policies and strategies: A systematic review. J. Environ. Health Sci. Eng. 2021, 19, 1911–1940. [Google Scholar] [PubMed]
- Bessagnet, B.; Allemand, N.; Putaud, J.P.; Couvidat, F.; André, J.M.; Simpson, D.; Pisoni, E.; Murphy, B.N.; Thunis, P. Emissions of carbonaceous particulate matter and ultrafine particles from vehicles—A scientific review in a cross-cutting context of air pollution and climate change. Appl. Sci. 2022, 12, 3623. [Google Scholar] [CrossRef]
- Gonzalez, P.; Buigues, G.; Mazon, A.J. Noise in electric motors: A comprehensive review. Energies 2023, 16, 5311. [Google Scholar] [CrossRef]
- Tsoi, K.H.; Loo, B.P.; Li, X.; Zhang, K. The co-benefits of electric mobility in reducing traffic noise and chemical air pollution: Insights from a transit-oriented city. Environ. Int. 2023, 178, 108116. [Google Scholar]
- Zhao, X.; Li, X.; Mao, Y.; Sun, J. Electric vehicle industry and sustainable economic growth: A measurement, coupling and causal analysis. Sustain. Futures 2024, 8, 100242. [Google Scholar] [CrossRef]
- Sanguesa, J.A.; Torres-Sanz, V.; Garrido, P.; Martinez, F.J.; Marquez-Barja, J.M. A review on electric vehicles: Technologies and challenges. Smart Cities 2021, 4, 372–404. [Google Scholar] [CrossRef]
- United Nations, Department of Economic and Social Affairs, Sustainable Development. Transforming Our World: The 2030 Agenda for Sustainable Development. Available online: https://sdgs.un.org/2030agenda (accessed on 30 October 2024).
- Asekomeh, A.; Gershon, O.; Azubuike, S.I. Optimally clocking the low carbon energy mile to achieve the Sustainable Development Goals: Evidence from Dundee’s Electric Vehicle Strategy. Energies 2021, 14, 842. [Google Scholar] [CrossRef]
- Safrina, R.; Utama, N.A. ASEAN energy transition pathway toward the 2030 agenda. Environ. Prog. Sustain. Energy 2023, 42, e14101. [Google Scholar]
- Transport Research Center, Czech Republic. Clean Transport. The Development of New Light Commercial Vehicle Registrations in the Czech Republic. Available online: https://www.cistadoprava.cz/statistiky/ (accessed on 18 January 2025).
- Segrave, K. The Electric Car in America, 1890–1922, 1st ed.; McFarland, Incorporated: Jefferson, NC, USA, 2019. [Google Scholar]
- Pedersen, A. Electric Vehicle Integration into Modern Power Networks, 1st ed.; McFarland, Incorporated: Jefferson, NC, USA, 2012. [Google Scholar]
- Arcos-Vargas, A. The Role of the Electric Vehicle in the Energy Transition, 1st ed.; Springer: Cham, Switzerland, 2021. [Google Scholar]
- Desmond, K. Electric Trucks: A History of Delivery Vehicles, Semis, Forklifts and Others, 1st ed.; McFarland, Incorporated: Jefferson, NC, USA, 2012. [Google Scholar]
- Van Mierlo, J. Plug-in Hybrid Electric Vehicle (PHEV), 1st ed.; MDPI: Basel, Switzerland, 2019. [Google Scholar]
- Westbrook, M. The Electric Car: Development and Future of Battery, Hybrid and Fuel-Cell Cars (Energy Engineering), 1st ed.; The Institution of Engineering and Technology: London, UK, 2001. [Google Scholar]
- Larminie, J.; Lowry, J. Electric Vehicle Technology Explained, 2nd ed.; John Wiley: Chichester, UK, 2012. [Google Scholar]
- Eastwood, S. Trends in Electric Vehicles: What Can We Expect in 2023? Available online: https://evmagazine.com/mobility/trends-in-electric-vehicles-what-can-we-expect-in-2023 (accessed on 25 November 2024).
- Langbroek, J.H.M.; Cebecauer, M.; Malmsten, J.; Franklin, J.P.; Susilo, Y.O.; Georén, P. Electric vehicle rental and electric vehicle adoption. Res. Transp. Econ. 2019, 73, 72–82. [Google Scholar] [CrossRef]
- Lu, W.M.; Chou, C.H.; Ting, I.W.K.; Liu, S.M. A new integrated approach for evaluating sustainable development in the electric vehicle sector. Omega-Int. J. Manag. Sci. 2024, 133, 103247. [Google Scholar] [CrossRef]
- Marklund, E.; Rehnberg, M. The Adoption of Battery Electric Vehicles in Sweden: What Are the Adoption Barriers of BEVs for Small & Medium Enterprises in Sweden? 2022. Available online: https://urn.kb.se/resolve?urn=urn:nbn:se:hh:diva-47111 (accessed on 14 November 2024).
- Loengbudnark, W.; Khalilpour, K.; Bharathy, G.; Taghikhah, F.; Voinov, A. Battery and hydrogen-based electric vehicle adoption: A survey of Australian consumers perspective. Case Stud. Transp. Policy 2022, 10, 2451–2463. [Google Scholar] [CrossRef]
- Di Foggia, G. Drivers and challenges of electric vehicles integration in corporate fleet: An empirical survey. Res. Transp. Bus. Manag. 2021, 41, 100627. [Google Scholar] [CrossRef]
- Zhao, X.; Li, X.; Jiao, D.; Mao, Y.; Sun, J.; Liu, G. Policy incentives and electric vehicle adoption in China: From a perspective of policy mixes. Transp. Res. Part A Policy Pract. 2024, 190, 104235. [Google Scholar] [CrossRef]
- Fuhrmann, R.C. Norway’s EV Incentives: A Success Story? Evaluating the Effectiveness of Norway’s Incentive Mix for EV Uptake and Transition. Master’s Thesis, Utrecht University, Utrecht, The Netherlands, 2021. [Google Scholar]
- Khatua, A.; Kumar, R.R.; De, S.K. Institutional enablers of electric vehicle market: Evidence from 30 countries. Transp. Res. Part A Policy Pract. 2023, 170, 103612. [Google Scholar] [CrossRef]
- Tian, J.R.; Liu, H.; Gan, W.; Zhou, Y.; Wang, N.; Ma, S.Y. Short-term electric vehicle charging load forecasting based on TCN-LSTM network with comprehensive similar day identification. Appl. Energy 2024, 381, 125174. [Google Scholar] [CrossRef]
- Huang, W.X.; Wang, J.G.; Wang, J.P.; Zeng, H.Y.; Zhou, M.; Cao, J.X. Assessment of the technical economic viability and carbon reduction potential of urban-scale photovoltaic generation for electric vehicle charging station. Renew. Sustain. Energy Rev. 2024, 210, 115190. [Google Scholar] [CrossRef]
- Chemudupaty, R.; Hornek, T.; Pavic, I.; Menci, S.P. Optimizing trading of electric vehicle charging flexibility in the continuous intraday market under user and market uncertainties. Appl. Energy 2024, 381, 125103. [Google Scholar] [CrossRef]
- Guo, H.X.; Chen, L.X.; Wang, Z.C.; Li, L. Day-ahead prediction of electric vehicle charging demand based on quadratic decomposition and dual attention mechanisms. Appl. Energy 2024, 381, 125198. [Google Scholar] [CrossRef]
- Heinekamp, J.F.; Strunz, K. Actors and roles in integration of electric vehicles in energy markets and power systems: Theory, glossary, and application to virtual power plant and fleet operator. Int. J. Electr. Power Energy Syst. 2024, 164, 110416. [Google Scholar] [CrossRef]
- Dadashzada, I.; Garza-Reyes, J.A.; Ghatak, R.R.; Gonzalez-Aleu, F. An investigation into the major barriers to the adoption of electric vehicles in last-mile deliveries for sustainable transport. Int. J. Logist. Manag. 2024. [Google Scholar] [CrossRef]
- Hassan, S.E.; Andruetto, C.; Posch, A. The role of battery electric vehicles in off-peak hour deliveries: Sustainability assessment of a case study in Stockholm. Clean. Logist. Supply Chain 2024, 13, 100175. [Google Scholar] [CrossRef]
- Li, F.Y.; Zhao, Z.W.; Li, F.; Xie, W. Carbon reduction effects of electric delivery vehicle adoption in Chinese cities: Gradient pattern and scenario analysis. Energy 2024, 309, 133119. [Google Scholar] [CrossRef]
- Sanni, M.B.; Ogouyandjou, C.; Moussa, F.D. Characterization of Electre I choice procedures. RAIRO-Oper. Res. 2019, 54, 1673–1683. [Google Scholar] [CrossRef]
- Liu, X.L.; Wan, S.P. A method to calculate the ranges of criteria weights in ELECTRE I and II methods. Comput. Ind. Eng. 2019, 137, 106067. [Google Scholar] [CrossRef]
- Goswami, S.S. Outranking methods: PROMETHEE I and PROMETHEE II. Found. Manag. 2020, 12, 93–110. [Google Scholar] [CrossRef]
- Stecyk, A. Application of PROMETHEE II method for e-learning course selection in corporate training. E-Mentor 2019, 1, 39–45. [Google Scholar] [CrossRef]
- Kabassi, K.; Martinis, A. Sensitivity analysis of PROMETHEE II for the evaluation of environmental websites. Appl. Sci. 2021, 11, 9215. [Google Scholar] [CrossRef]
- Salminen, P.; Hokkanen, J.; Lahdelma, R. Comparing multicriteria methods in the context of environmental problems. Eur. J. Oper. Res. 1998, 104, 485–496. [Google Scholar] [CrossRef]
- Abedi, M. Reply to the comment by B. Ghobadipour and B. Mojarradi “M. Abedi, S.A. Torabi, G.-H. Norouzi and M. Hamzeh; ELECTRE III: A knowledge-driven method for integration of geophysical data with geological and geochemical data in mineral prospectivity mapping”. J. Appl. Geophys. 2015, 117, 138–140. [Google Scholar] [CrossRef]
- Ejem, E.A.; Uka, C.M.; Dike, D.N.; Ikeogu, C.C.; Igboanusi, C.C.; Chukwu, O.E. Evaluation and selection of Nigerian third-party logistics service providers using multi-criteria decision models. LOGI–Sci. J. Transp. Logist. 2021, 12, 135–146. [Google Scholar] [CrossRef]
- Małek, A.; Karowiec, R.; Jóżwik, K. A review of technologies in the area of production, storage and use of hydrogen in the automotive industry. Arch. Automot. Eng.–Arch. Motoryz. 2023, 102, 41–67. [Google Scholar] [CrossRef]
- Akram, M.; Ilyas, F.; Garg, H. Multi-criteria group decision making based on ELECTRE I method in Pythagorean fuzzy information. Soft Comput. 2020, 24, 3425–3453. [Google Scholar] [CrossRef]
- Akram, M.; Al-Kenani, A.N.; Shabir, M. Enhancing ELECTRE I method with complex spherical fuzzy information. Int. J. Comput. Intell. Syst. 2021, 14, 190. [Google Scholar] [CrossRef]
- Hasan, A.Y. Application of Electre method decision support system for laptop selection. bit-Tech 2023, 6, 248–254. [Google Scholar] [CrossRef]
- Bhol, S.G.; Mohanty, J.R.; Pattnaik, P.K. Selecting ultrasound machine using ELECTRE method. In Applied Analysis, Computation and Mathematical Modelling in Engineering, Proceedings of the AACMME 2021, Rourkela, India, 24–26 February 2021; Lecture Notes in Electrical Engineering; Ray, S.S., Jafari, H., Sekhar, T.R., Kayal, S., Eds.; Springer: Singapore, 2022; Volume 897. [Google Scholar] [CrossRef]
- Oubahman, L.; Duleba, S. Review of PROMETHEE method in transportation. Prod. Eng. Arch. 2021, 27, 69–74. [Google Scholar] [CrossRef]
- Singh, A.; Gupta, A.; Mehra, A. Best criteria selection based PROMETHEE II method. OPSEARCH 2021, 58, 160–180. [Google Scholar] [CrossRef]
- Agrawal, N. Multi-criteria decision-making toward supplier selection: Exploration of PROMETHEE II method. Benchmarking 2022, 29, 2122–2146. [Google Scholar]
- Sen, D.K.; Datta, S.; Patel, S.K.; Mahapatra, S.S. Multi-criteria decision making towards selection of industrial robot: Exploration of PROMETHEE II method. Benchmarking 2015, 22, 465–487. [Google Scholar] [CrossRef]
- Nguyen, T.K.L.; Luyen, L.A. Adopting SBM-Max and Super SBM-Max to evaluate the efficiency of freight transportation arrangement providers: A study in Vietnam. LOGI–Sci. J. Transp. Logist. 2024, 15, 73–84. [Google Scholar] [CrossRef]
- Więckowski, J.; Sałabun, W. How the normalization of the decision matrix influences the results in the VIKOR method? Procedia Comput. Sci. 2020, 176, 2222–2231. [Google Scholar] [CrossRef]
- Vafaei, N.; Ribeiro, R.A.; Camarinha-Matos, L.M. Data normalisation techniques in decision making: Case study with TOPSIS method. Int. J. Inf. Decis. Sci. 2018, 10, 19–38. [Google Scholar] [CrossRef]
- Wątróbski, J. Temporal PROMETHEE II—New multi-criteria approach to sustainable management of alternative fuels consumption. J. Clean. Prod. 2023, 413, 137445. [Google Scholar] [CrossRef]
- Alammal, F. A Review of Battery Electric Vehicle Powertrain System Requirements and Limitations. Bachelor’s Thesis, University of Twente, Enschede, The Netherlands, 2021; p. 36. Available online: https://essay.utwente.nl/87869/ (accessed on 6 February 2025).
- Andwari, A.M.; Pesiridis, A.; Rajoo, S.; Martinez-Botas, R.; Esfahanian, V. A review of Battery Electric Vehicle technology and readiness levels. Renew. Sustain. Energy Reviews 2017, 78, 414–430. [Google Scholar] [CrossRef]


Disclaimer/Publisher’s Note: The statements, opinions and data contained in all publications are solely those of the individual author(s) and contributor(s) and not of MDPI and/or the editor(s). MDPI and/or the editor(s) disclaim responsibility for any injury to people or property resulting from any ideas, methods, instructions or products referred to in the content. |
© 2025 by the authors. Licensee MDPI, Basel, Switzerland. This article is an open access article distributed under the terms and conditions of the Creative Commons Attribution (CC BY) license (https://creativecommons.org/licenses/by/4.0/).