Article

Seismic Non-Limited Active Earth Pressure Analysis of Retaining Walls Under Rotation-About-the-Base Mode

1
Anhui Provincial Key Laboratory of Building Earthquake Disaster Mitigation and Green Operations, Anhui Institute of Building Research & Design, Hefei 230031, China
2
State Key Laboratory of Geomechanics and Geotechnical Engineering, Institute of Rock and Soil Mechanics, Chinese Academy of Sciences, Wuhan 430071, China
*
Author to whom correspondence should be addressed.
Appl. Sci. 2025, 15(8), 4202; https://doi.org/10.3390/app15084202
Submission received: 8 March 2025 / Revised: 31 March 2025 / Accepted: 7 April 2025 / Published: 10 April 2025

Abstract

:
Under seismic loading conditions, the backfill soil behind retaining walls does not fully reach the limit state, while seismic earth pressure is influenced by wall displacement. The RB (rotation about the base) displacement pattern represents a prevalent deformation mode in retaining walls during operational service. To calculate the seismic non-limited active earth pressure under RB mode, this study first establishes the relationship between critical horizontal displacement (corresponding to a fully mobilized wall–soil interface friction angle) and depth based on numerical simulations, revealing a linear correlation. Subsequently, nonlinear distribution relationships for the mobilized soil internal friction angle and wall–soil interface friction angle with wall-top displacement are derived. Building upon this foundation and considering the failure mechanism of backfill soil under RB displacement, the soil mass is divided into inclined slices. A pseudo-static analytical framework is proposed to calculate both the magnitude and application point of non-limited seismic earth pressure for rigid walls under RB displacement. Validation against experimental data from referenced studies demonstrates the method’s rationality. Earth pressure transitions from an initially concave triangular distribution to a linear pattern as displacement progresses. The application point descends from the initial at-rest position (1/3 H) with increasing wall-top displacement, subsequently rising as the soil approaches full active limit states, ultimately stabilizing at 1/3 H under linear pressure distribution. The parameter sensitivity analysis section summarizes that the horizontal seismic coefficient dominates influencing factors, followed by wall displacement, while soil internal friction angle and soil–wall interface friction angle exhibit relatively minor effects. These findings provide critical insights for optimizing seismic design methodologies of retaining structures.

1. Introduction

Post-earthquake investigations following the 2008 Wenchuan earthquake revealed that a significant proportion of gravity retaining walls and cantilever retaining walls exhibited RB (rotation about the base) or RB+T (combined rotation and translation about the base) failure modes during the seismic event [1]. The RB displacement pattern represents a common deformation mode of retaining walls during operational service. Under seismic loading, the backfill soil behind the wall does not fully reach the limit state, and the seismic earth pressure is influenced by wall displacement. The calculation of dynamic earth pressure induced by ground motion acting on retaining walls constitutes a fundamental aspect of seismic design for retaining structures. Although extensive research has been conducted on this subject, satisfactory results have yet to be achieved.
Current methods for calculating seismic earth pressure can be classified into two categories: (1) methods considering soil–wall interaction and actual stress–strain behavior of soil [2,3]; (2) methods assuming sufficient relative movement between the wall and backfill to reach limit or failure states, with the Mononobe-Okabe (M-O) theory being the most representative achievement [4,5,6]. This approach, based on Coulomb’s earth pressure theory, applies seismic inertial forces to the sliding soil wedge behind the wall and derives earth pressure formulas through equilibrium conditions for stability analysis. Also known as the pseudo-static method, it remains widely adopted in engineering practice despite the actual stress–strain characteristics of soil–wall systems during earthquakes being far more complex than the M-O assumptions. Developed from Coulomb’s theory, the M-O theory assumes that seismic earth pressure is generated by a triangular soil wedge bounded by the wall back and a failure surface passing through the wall heel. During earthquakes, the entire wedge moves as a rigid body with uniform acceleration. While the M-O theory reveals the resultant seismic earth pressure, the pressure distribution and point of application currently lack theoretical solutions, being supported only by experimental studies [7,8,9]. Extensive model tests indicate that the resultant force application point varies between 0.45 H and 0.60 H (where H is the backfill height), closely related to wall stiffness and movement patterns [10], highlighting the need for further research on seismic earth pressure distribution.
Traditional earth pressure theories (Coulomb and Rankine) assume limit-state conditions. However, in practical engineering, backfill soils behind walls typically exist in non-limit states. Non-limit earth pressures lie between at-rest and limit earth pressures, depending on wall displacement and movement patterns. Through model tests, Bang [11] proposed that soil transitions gradually from at-rest to active limit states, introducing the concept of “intermediate active earth pressure” between these states. This work established the theoretical basis for displacement-dependent earth pressure calculations by deriving expressions for active earth pressure under RB displacement patterns. While active earth pressure represents the minimum resultant force, practical constraints often prevent backfill soils from reaching limit equilibrium states due to restricted wall displacements. Consequently, the soil stress state remains between at-rest and active limit conditions—referred to as the non-limit active state—with corresponding pressures defined as non-limit active earth pressures [12,13,14,15,16].
Current research on non-limit earth pressure primarily focuses on theoretical approaches: (1) Models incorporating variations in the soil internal friction angle and wall–soil friction angle with wall displacement, integrated into limit-state calculation methods [17,18,19,20,21,22]; (2) formulations establishing non-limit earth pressure calculations based on stress–strain displacement relationships [23,24,25,26]. Numerous experimental studies using particle image velocimetry have analyzed relationships between mechanical parameters and horizontal displacements along walls, characterizing slip surface geometries, displacements, and shear strains in passive zones [27,28,29,30,31]. Discrete element numerical simulations [32,33,34,35] have further reproduced the deformation characteristics of cohesionless backfills under different displacement patterns.
Nevertheless, critical knowledge gaps persist:
(1)
Simplistic critical displacement thresholds: Existing theories arbitrarily define critical displacements as fixed values (e.g., 0.01% H–0.05% H) based on Fang’s assumptions [12], neglecting their dependence on wall displacement modes.
(2)
Methodological limitations: Horizontal/slope differential element methods frequently employed in theoretical derivations disregard compatibility with actual soil failure mechanisms under specific displacement patterns. Moreover, assumed relationships between mobilized friction angles and wall displacements lack experimental validation.
(3)
Neglected displacement effects in seismic conditions: Few studies have systematically integrated displacement modes/states into seismic earth pressure calculations, despite backfill soils rarely reaching limit states during earthquakes.
To address these issues, this study develops a computational method for seismic non-limit active earth pressure under RB mode. Incorporating nonlinear depth-dependent variations in the soil internal friction angle and wall–soil interface friction angle, the proposed approach combines pseudo-static principles with the inclined slice method. Validation through experimental comparisons and parametric analyses of seismic acceleration, wall displacement, and friction characteristics provides theoretical support for optimizing seismic design of retaining walls.

2. Mobilized Friction Angle Under RB Active Earth Pressure Mode

2.1. Mobilized Wall–Soil Friction Angle Under RB Active Earth Pressure Mode

The magnitude of earth pressure on retaining walls is directly influenced by their displacement modes. Retaining walls exhibit three fundamental displacement modes: translational movement (T mode), rotation about the top (RT mode), and rotation about the base (RB mode). As shown in Figure 1, the RB displacement mode schematic illustrates a common displacement pattern for gravity retaining walls in engineering practice. Under the RB mode, for a rigid retaining wall with a horizontal displacement S at the wall top at a given moment, the horizontal displacement S(z) at depth z can be expressed as follows:
S ( z ) = ( 1 z / H ) S
As shown in Figure 2, soil failure is observed to reach a depth of approximately y = 0.4, while interfacial failure between the wall and soil occurs only within the range from the soil surface to y = 0.2 when the rotating angle is 0.7 mrad. This phenomenon correlates with the distribution of earth pressure: within the range y ∈ [0,0.2], the active earth pressure state is achieved. In the deeper range y ∈ [0.2,0.5], the earth pressure remains slightly higher than the active earth pressure value.
Within this deeper zone, the retaining wall provides partial support to the soil, preventing sliding along the wall–soil interface. Consequently, the weight of the failed soil mass is partially redistributed through interactive arching mechanisms to both the wall and the adjacent non-failed soil that has not undergone yielding [36].
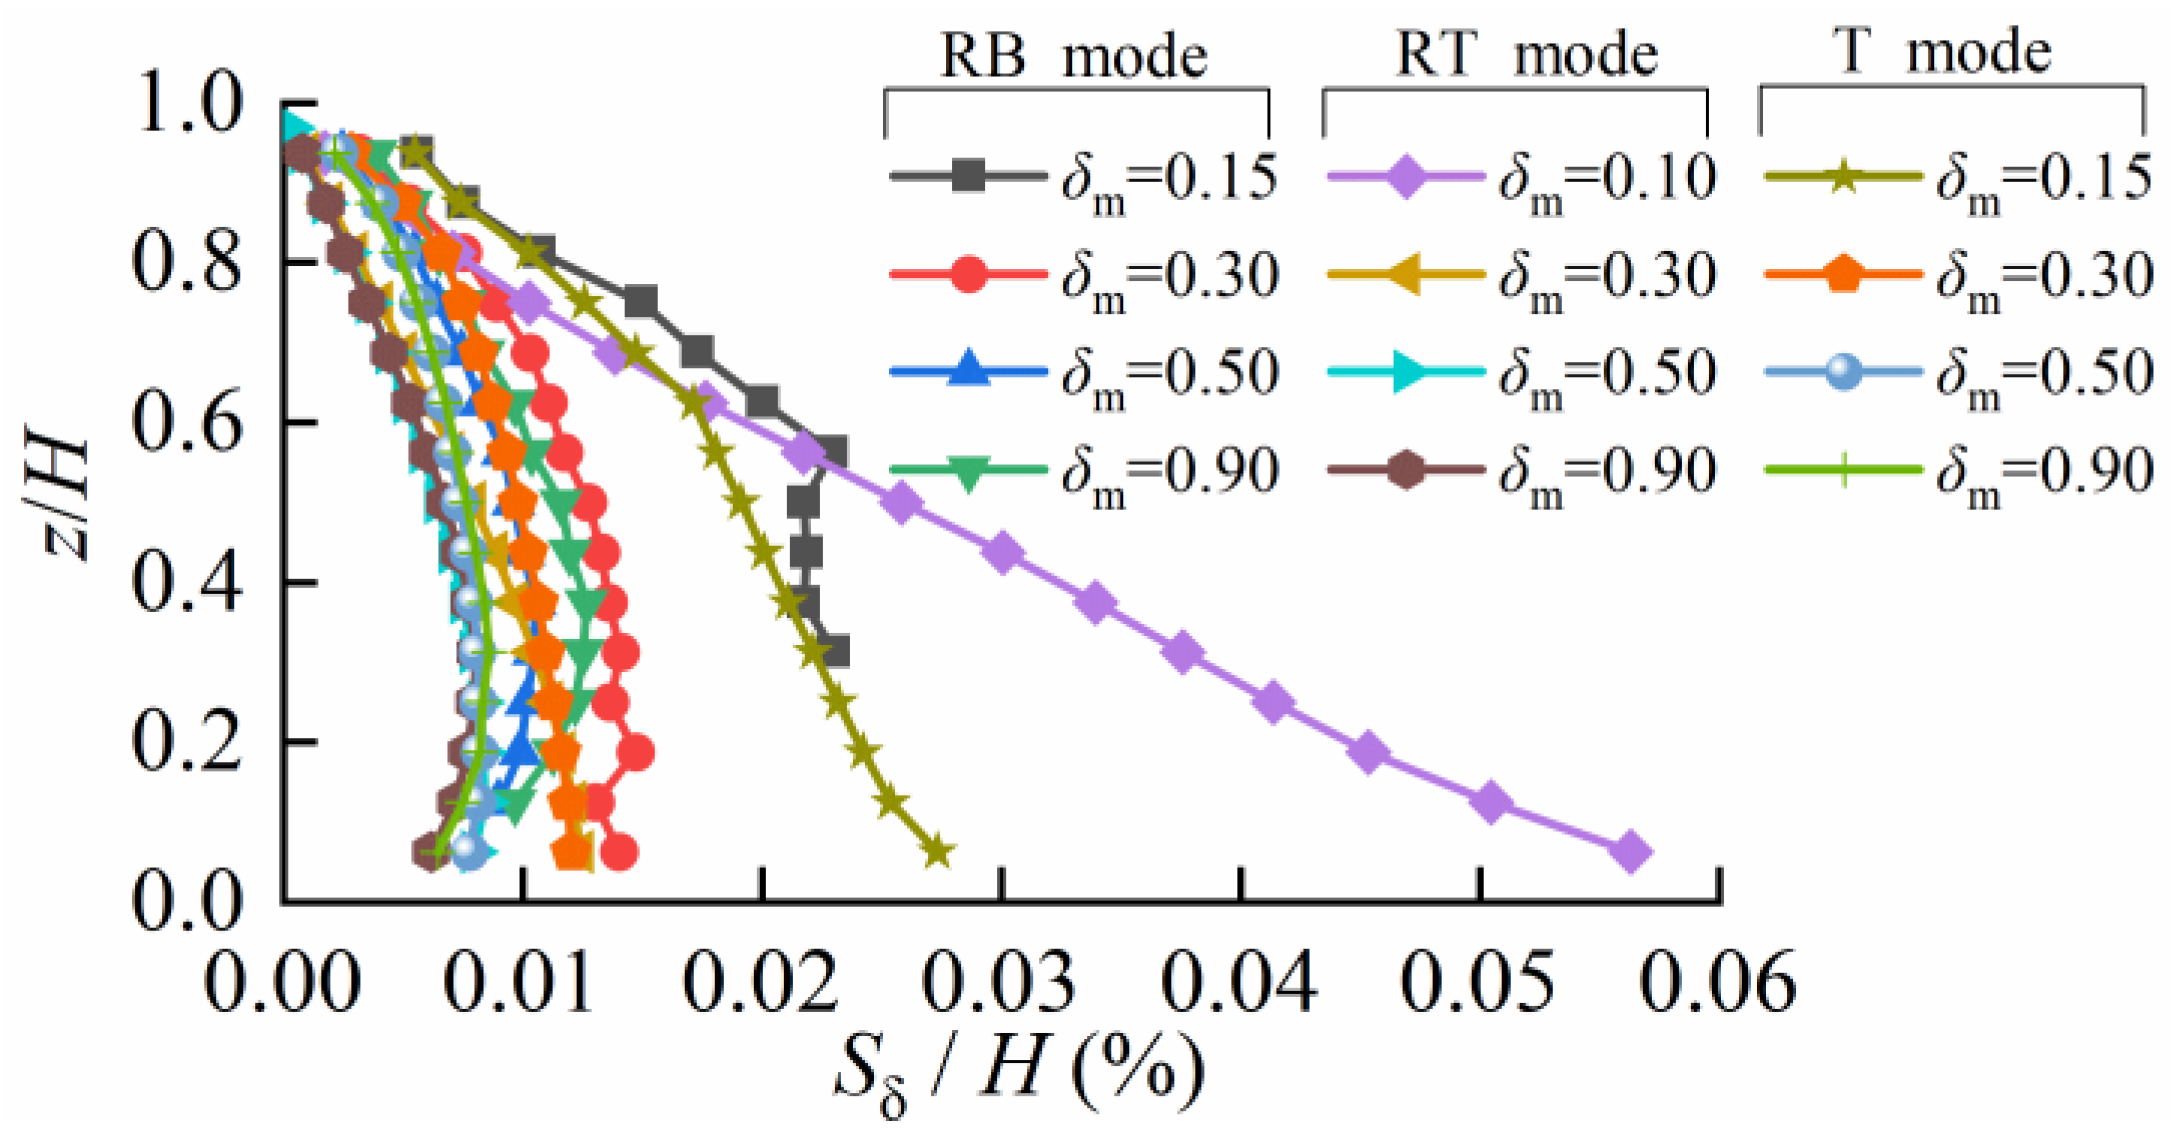
As illustrated in Figure 3, based on PLAXIS finite element numerical simulations, the critical horizontal displacement corresponding to the wall–soil interface friction angle reaching its ultimate state was extracted. The results demonstrate that when the friction angle between the retaining wall and soil attains its maximum value δm, the critical horizontal displacement Sδ required to reach the ultimate friction angle exhibits an approximately linear relationship with depth z, observed consistently under RB, RT, and T modes. Consequently, an expression for the mobilized friction angle at varying depths under non-limit states is proposed:
δ m = δ 0 + S z S δ ( z ) ( δ δ 0 ) , S z < S δ ( z ) δ , S z S δ ( z )
where δ is the ultimate wall–soil friction angle at the limit state, δ0 is the initial internal friction angle of the wall–soil interface, Sδ(z) is the critical displacement required for the interface friction angle to reach the ultimate state.
For the selection of the initial wall–soil friction angle δ0, Chang [37] recommends that it be determined based on actual engineering conditions: for embedded retaining walls, it may be taken as 0; for backfilled retaining walls, when exact values are unavailable, it can be conservatively estimated as δ 0 = φ / 3 .
According to Equation (2), by selecting δ0 = 5°, δ = 15°, Sδ(z) = 0.1% z, the mobilized friction angle between the wall and soil under RB mode is illustrated in Figure 4 when horizontal displacements at the top of the retaining wall reach different values.

2.2. Mobilized Friction Angle of the Fill Under RB Active Earth Pressure Mode

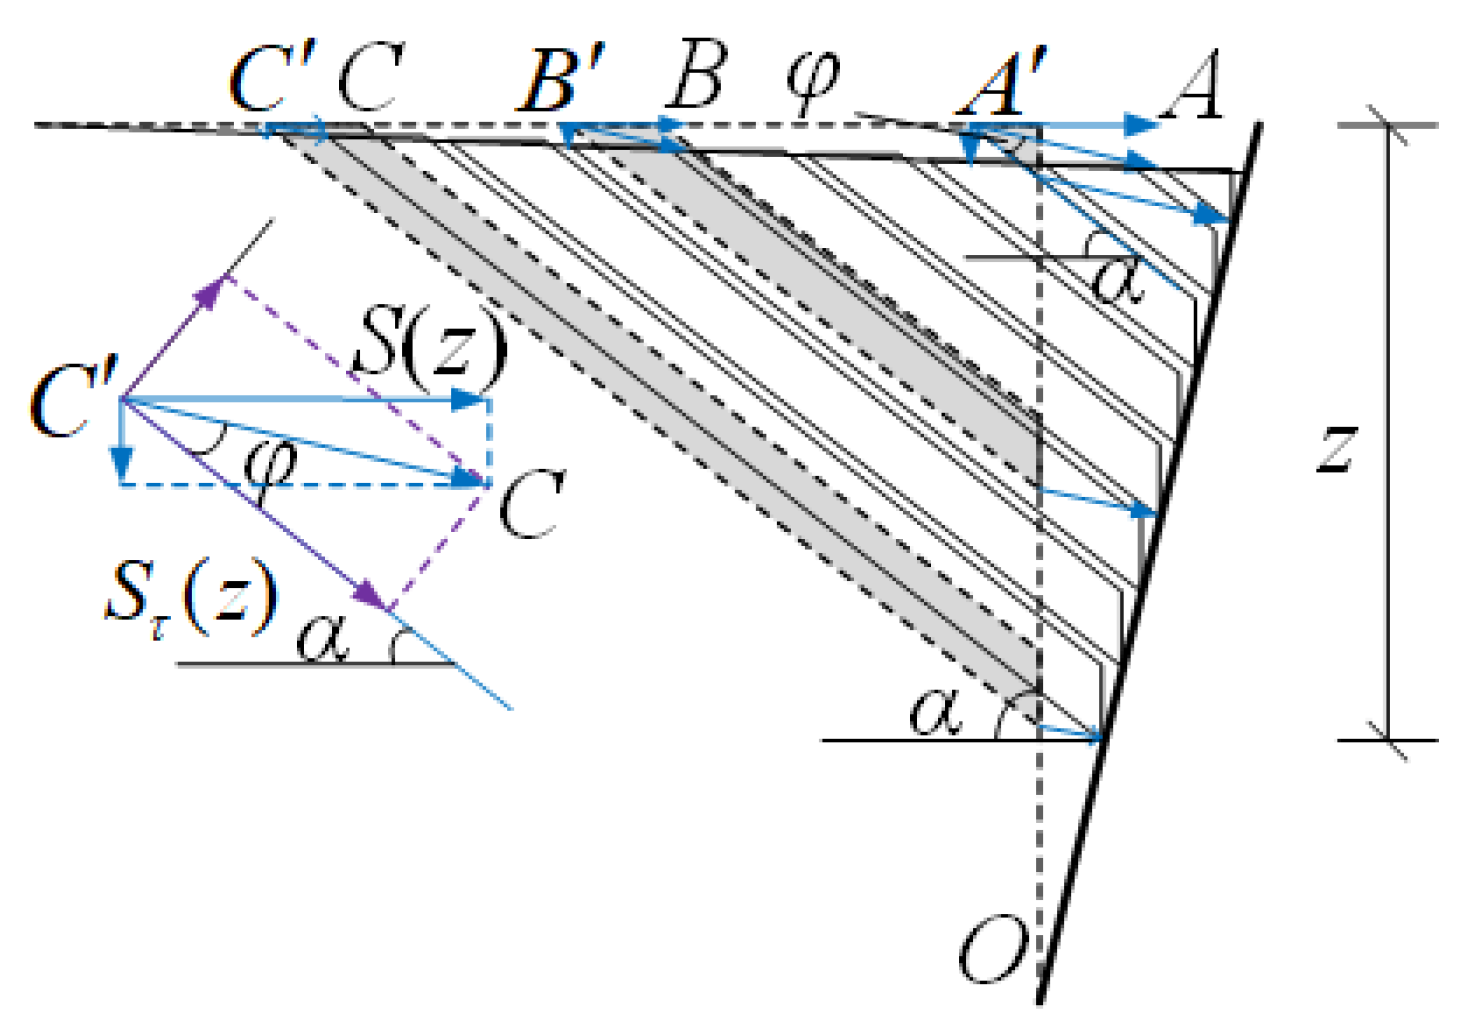
The soil in the shear zone is ideally generalized as parallel rigid slices with infinitesimal thickness, which move following the associated flow rule as the wall rotates. In this context, the associated flow rule dictates that each soil slice tilts away from the underlying soil at an angle equal to the soil’s friction angle during velocity increments. The failure mechanism of the backfill soil under RB mode under this configuration is illustrated in Figure 5.
According to the geometric relationship in Figure 5, we can get
S τ ( z ) = cos φ cos ( α φ ) S ( z ) = cos φ cos ( α φ ) ( 1 z H ) S a
The corresponding length of the shear plane is
L ( z ) = z sin α
Therefore, the shear strain on the corresponding shear plane can be obtained as
γ z = S τ ( z ) L ( z ) = sin α cos φ cos ( α φ ) ( 1 z H ) S a z
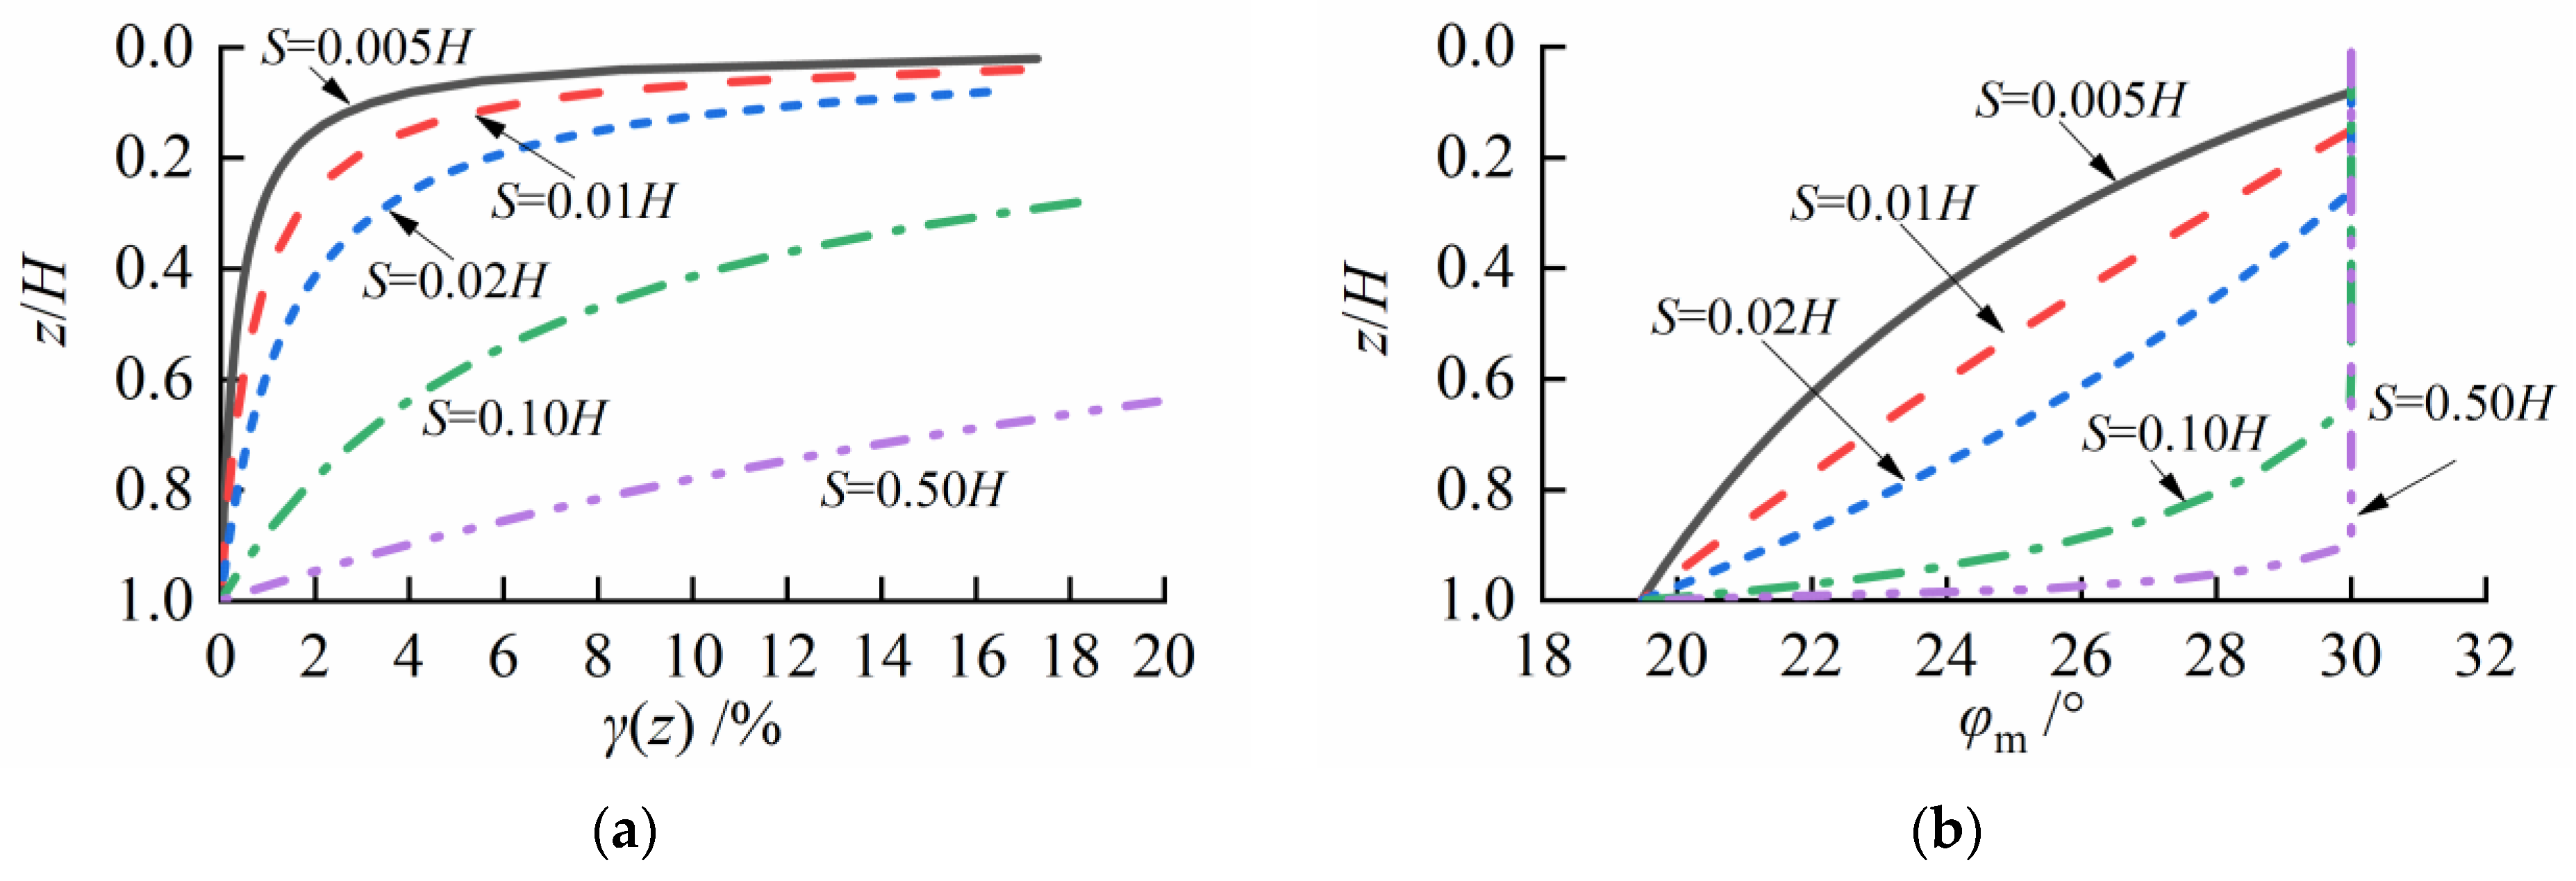
From Equation (5), when z = H, γ(z) = 0; when z = 0, γ(z) = ∞.
Assuming that the shear stress and shear strain of the soil behind the wall satisfy the hyperbolic relationship given in Equation (6), the non-limit internal friction angle is derived as Equation (7) [24]:
τ = γ a + b γ
sin φ m = 1 K 0 1 + sin φ 1 R f + η R f + η 1 + K 0 sin φ + K 0 1 1 + K 0 1 + sin φ 1 R f + η R f η 1 + K 0 sin φ + K 0 1
In Equation (7), φ is the internal friction angle of the backfill soil mobilized at the strength limit; φm is the internal friction angle of the backfill soil in the non-limit state; η is the strain ratio between the non-limit active state and the limit state (γm/γf, when η = 1, φm = φ); Rf is the failure ratio in the Duncan–Chang model, which is typically Rf = 0.75~0.95; and K0 is the coefficient of earth pressure at rest. For typical fill materials (e.g., sandy gravel), calculations can be performed using the formula provided in Table 1.
Using the corresponding shear strain γm from Figure 6a, the strain ratio η between the non-limit active state and the limit state can be calculated. Substituting K0 (the initial stress ratio, i.e., the coefficient of earth pressure at rest) into Equation (7), the distribution of the mobilized internal friction angle of the soil is obtained, as shown in Figure 6b.

2.3. Angle Between the Shear Surface and the Horizontal Plane in RB Mode

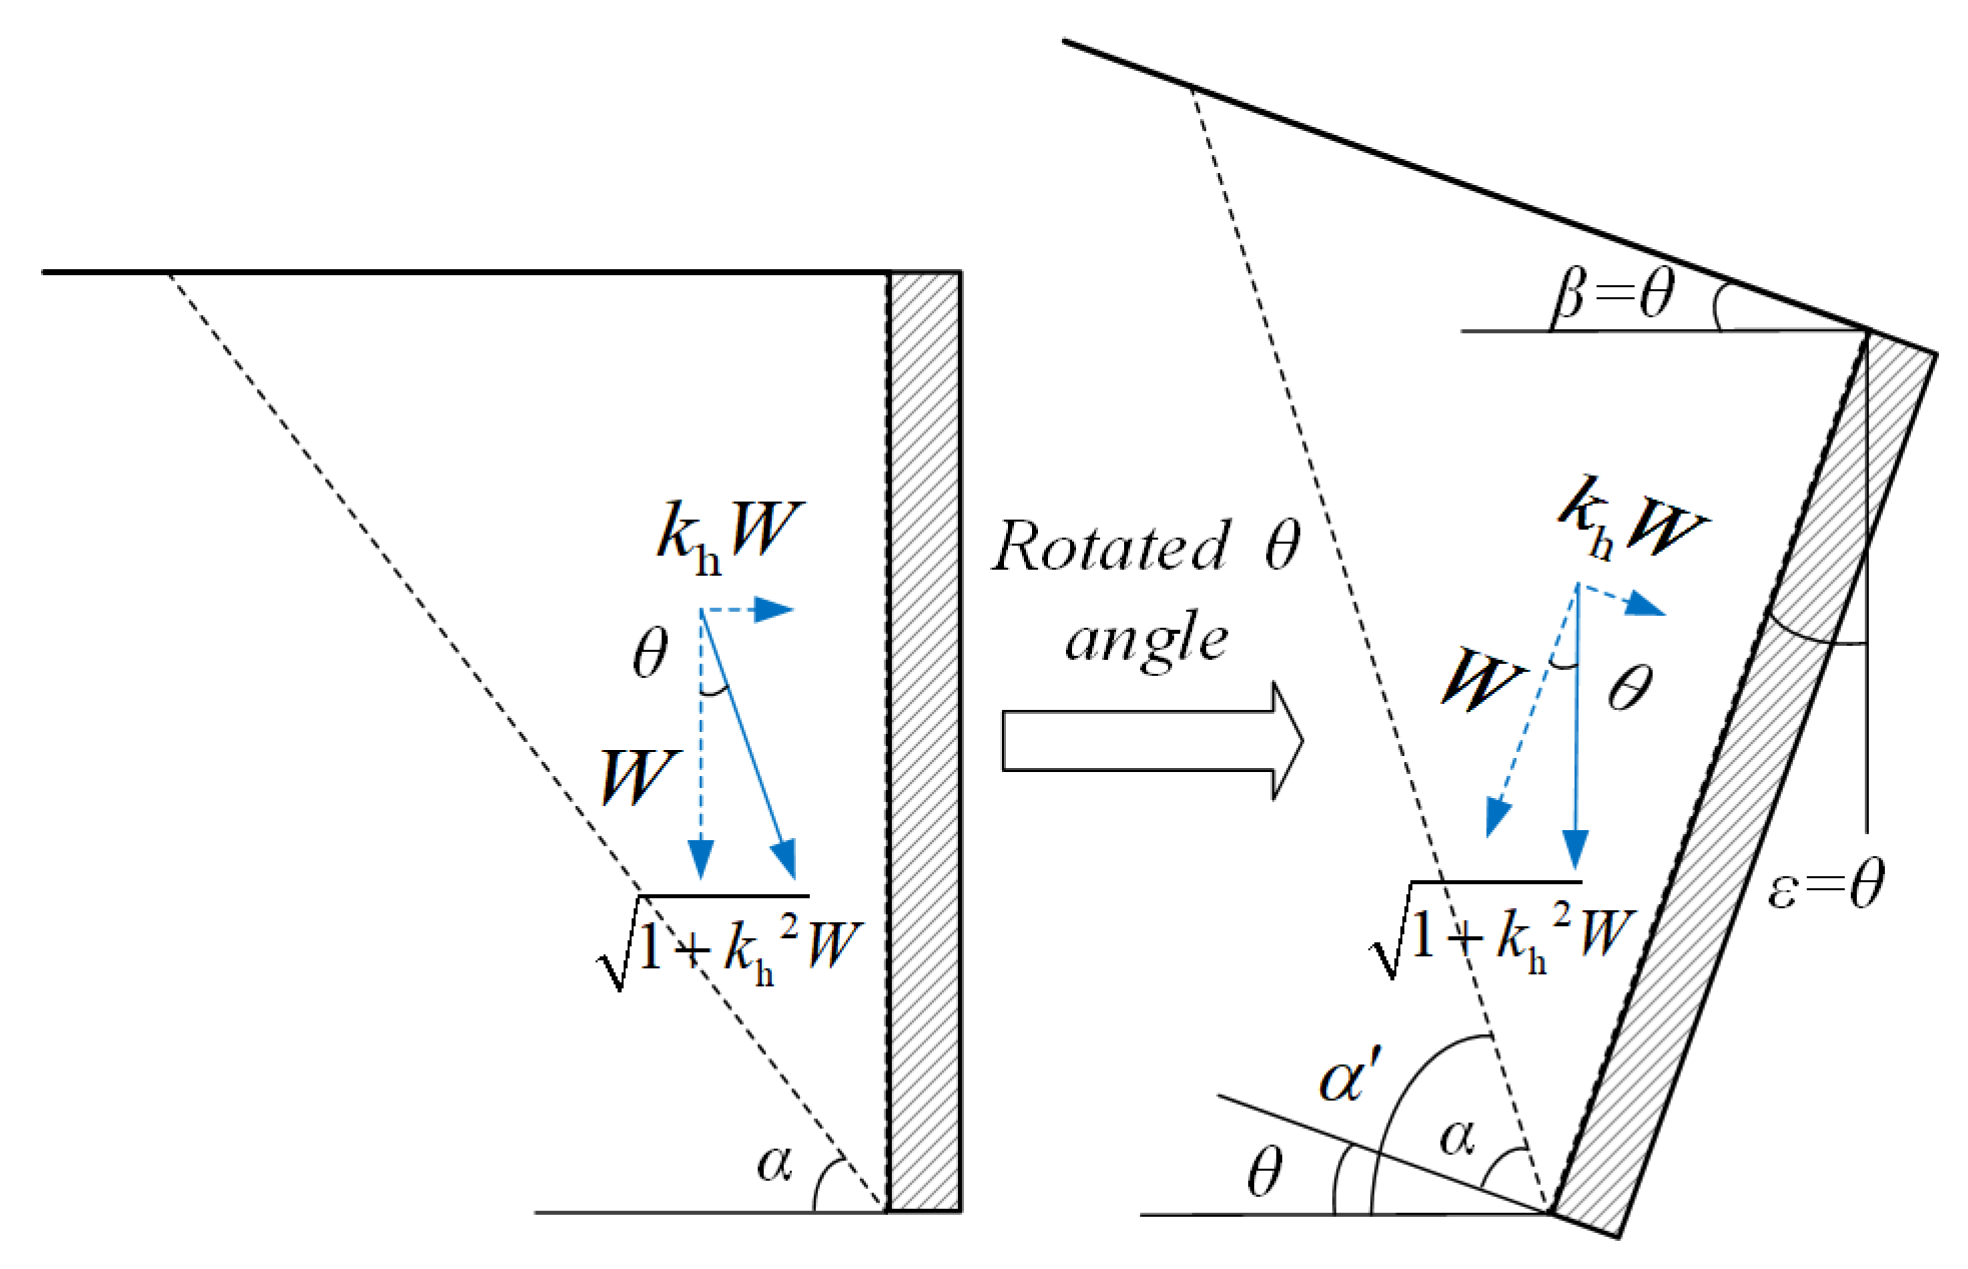
During an earthquake, the dynamic earth pressure acting on a retaining wall differs from static earth pressure in both magnitude and distribution pattern due to seismic dynamic effects. The determination of dynamic earth pressure represents a relatively complex problem, as it depends not only on seismic intensity but also on the vibration characteristics of foundation soil, retaining walls, and backfill materials. In current engineering practice worldwide, the pseudo-static method is predominantly adopted for seismic earth pressure calculation. This approach modifies the classical Coulomb’s earth pressure theory under static conditions by incorporating vertical and horizontal seismic acceleration effects. As shown in Figure 7, where θ represents the seismic deviation angle, the wall backfill system is conceptually rotated by this angle to enable direct application of Coulomb’s formula. This rotational transformation preserves the force equilibrium relationships while allowing the use of modified boundary parameters (β = θ, ε = θ) in the Coulomb equation. Figure 8 illustrates that the rupture angle of the sliding wedge derived from Coulomb’s active earth pressure theory can be adapted through this pseudo-static approach to obtain the rupture angle under horizontal seismic loading, expressed as follows:
α = α θ = arccot cot φ + tan φ + δ + θ tan φ + δ + θ tan θ tan φ + δ + θ θ

3. Calculation Formulas for Non-Limited Seismic Active Earth Pressure

3.1. Force Analysis and Non-Limited Active Earth Pressure Calculation

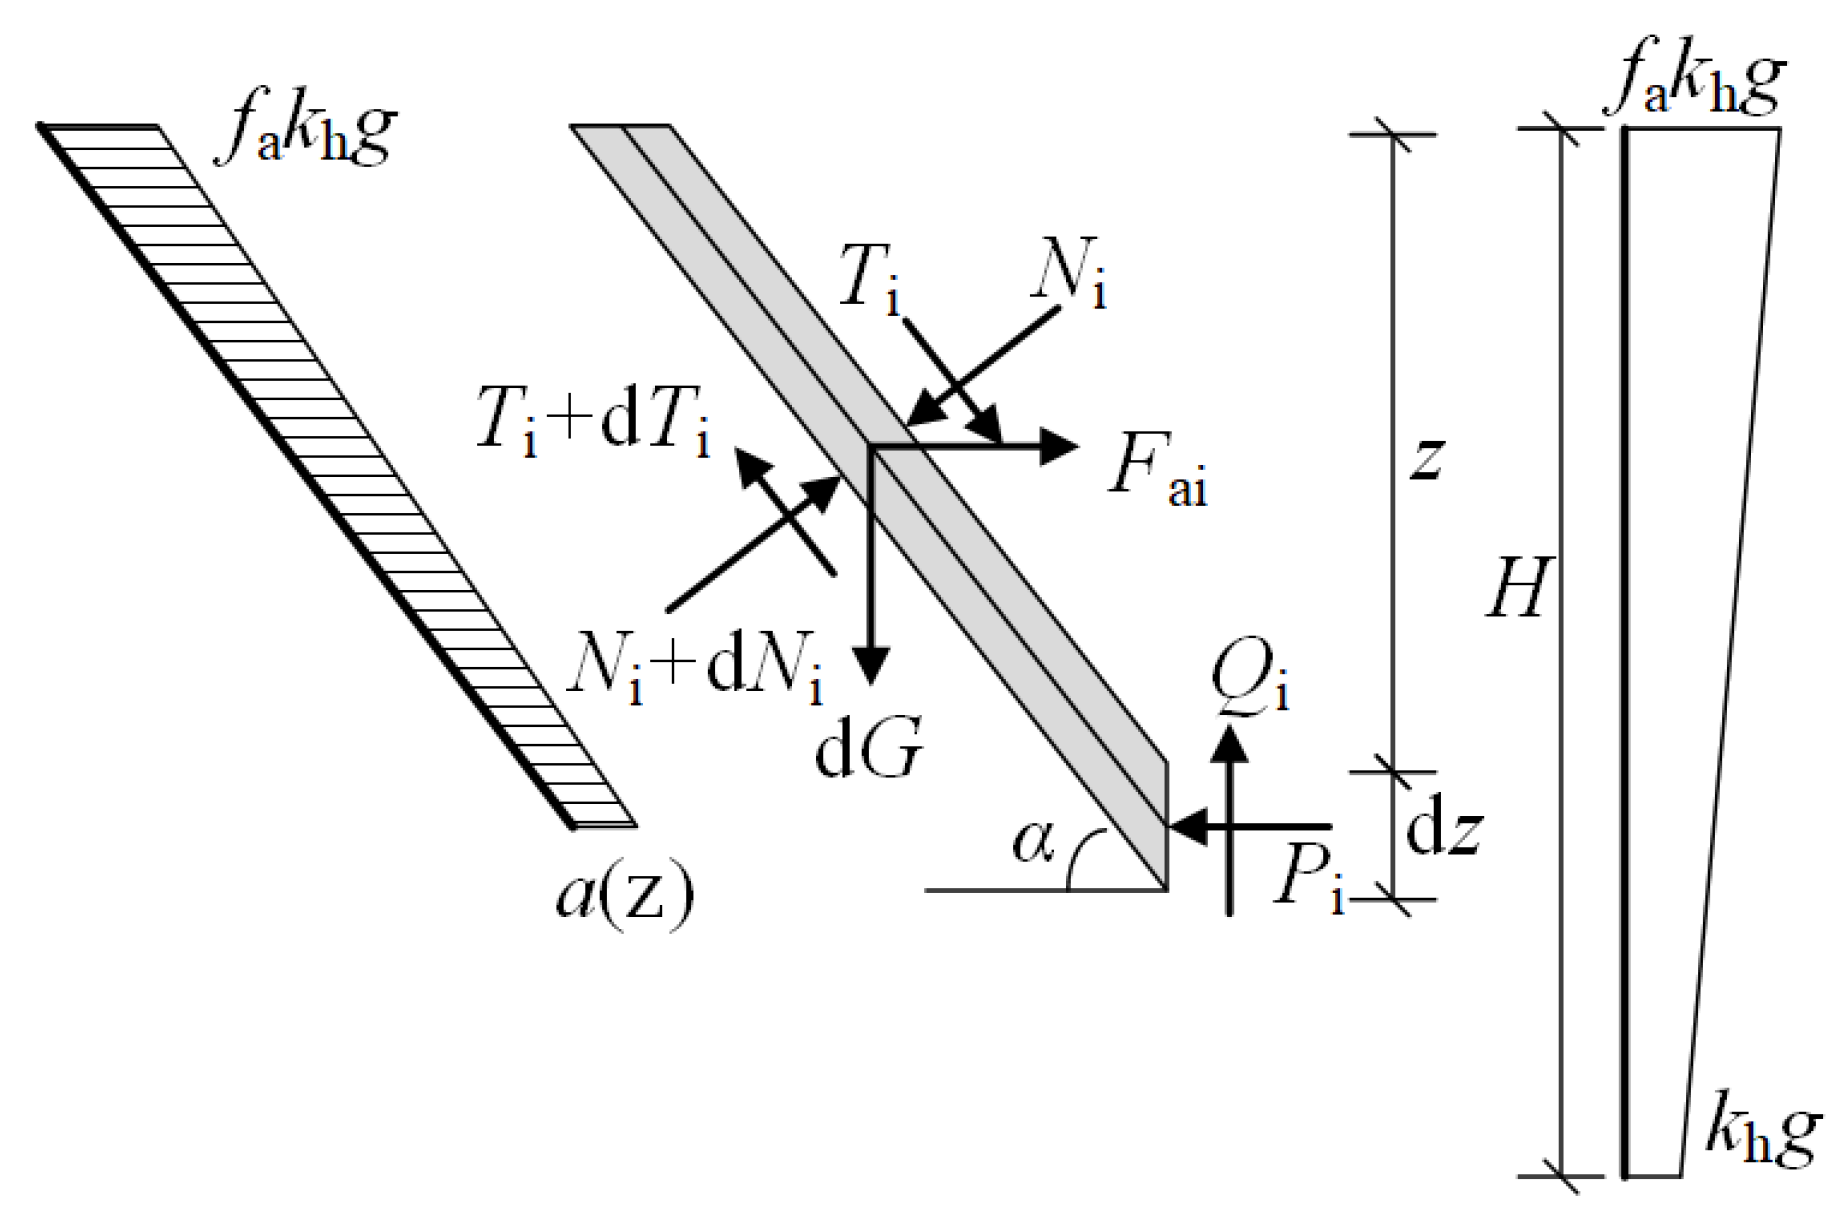
The RB model exhibits multiple parallel linear slip zones within the entire sliding soil wedge, indicating that the soil undergoes layer-by-layer sliding from top to bottom until the lowermost slip zone is activated. The geometry of slip zones and sliding soil wedges in the RB model closely aligns with Coulomb’s earth pressure theory, better satisfying its assumptions. Under RB mode, slip surfaces migrate downward as wall displacement increases. Lower parallel surfaces gradually reach limit states, becoming dominant slip zones. Specifically, multiple parallel “potential slip surfaces” exist within the backfill soil behind the wall, forming angles with the horizontal direction equal to the inclination angle defined in Coulomb’s theory. These “potential slip surfaces” exhibit identical mobilized values of the soil’s internal friction angle along their interfaces. As illustrated in Figure 8, one soil slice is selected for mechanical analysis.
X-direction equilibrium equation:
P i + cos α d T i = d N i sin α + F ai
Y-direction equilibrium equation:
Q i + cos α d N i + sin α d T i = d G
In Equation (10), Pi = σnidz, Qi = τnidz, Qi = Pi tanδm, Ti = Ni tanφm, dG = γzcotαdz. Pi, Qi represent the normal and tangential forces acting on the right boundary of the inclined differential element. σni, τni denote the normal and shear stresses on the left boundary of the inclined differential element. Ni, Ti correspond to the normal and tangential forces along the inclined edge of the element. Fai represents the horizontal inertial force of the soil slice. δm indicates the mobilized wall–soil friction angle under a non-limit active state. φm signifies the mobilized internal friction angle of the soil under non-limit active state.
The horizontal seismic force acting on the soil slice is
F ai = γ cot α k h g f a 1 z z 2 2 H + z d z = F ( z ) d z
Combining Equations (9)–(11), we obtain
σ ni = tan ( α φ m ) + k h g f a 1 1 z 2 H + 1 1 + tan δ m tan α φ m γ z cot α
Let σni = kmσz = kmγz, then
k m = tan ( α φ m ) + k h g f a 1 1 z 2 H + 1 1 + tan δ m tan α φ m cot α
When kh = 0 in Equation (13), the result aligns with Reference [14]. By substituting δm (mobilized wall–soil friction angle) and φm (mobilized soil internal friction angle) obtained from Equations (2) and (7) into Equation (13), the lateral pressure coefficient for the non-limit state km is derived.
Under non-limit conditions, the total horizontal earth pressure acting on the retaining wall is
P a = 0 H σ ni d z = 1 2 γ H 2 K m
where Km is the non-limit earth pressure coefficient.
The resultant moment of earth pressure about the wall base is
M a = 0 H σ ni H z d z
The distance from the resultant force to the wall base is
h P = M a P a = 0 H σ ni H z d z 0 H σ ni d z
When kh = 0 and the soil reaches the active limit state, the lateral pressure coefficient km calculated from Equation (13) equals the Coulomb active earth pressure coefficient. Consequently, the active earth pressure distribution reduces to the triangular Coulomb active earth pressure distribution.

3.2. Validation of the Calculation Method

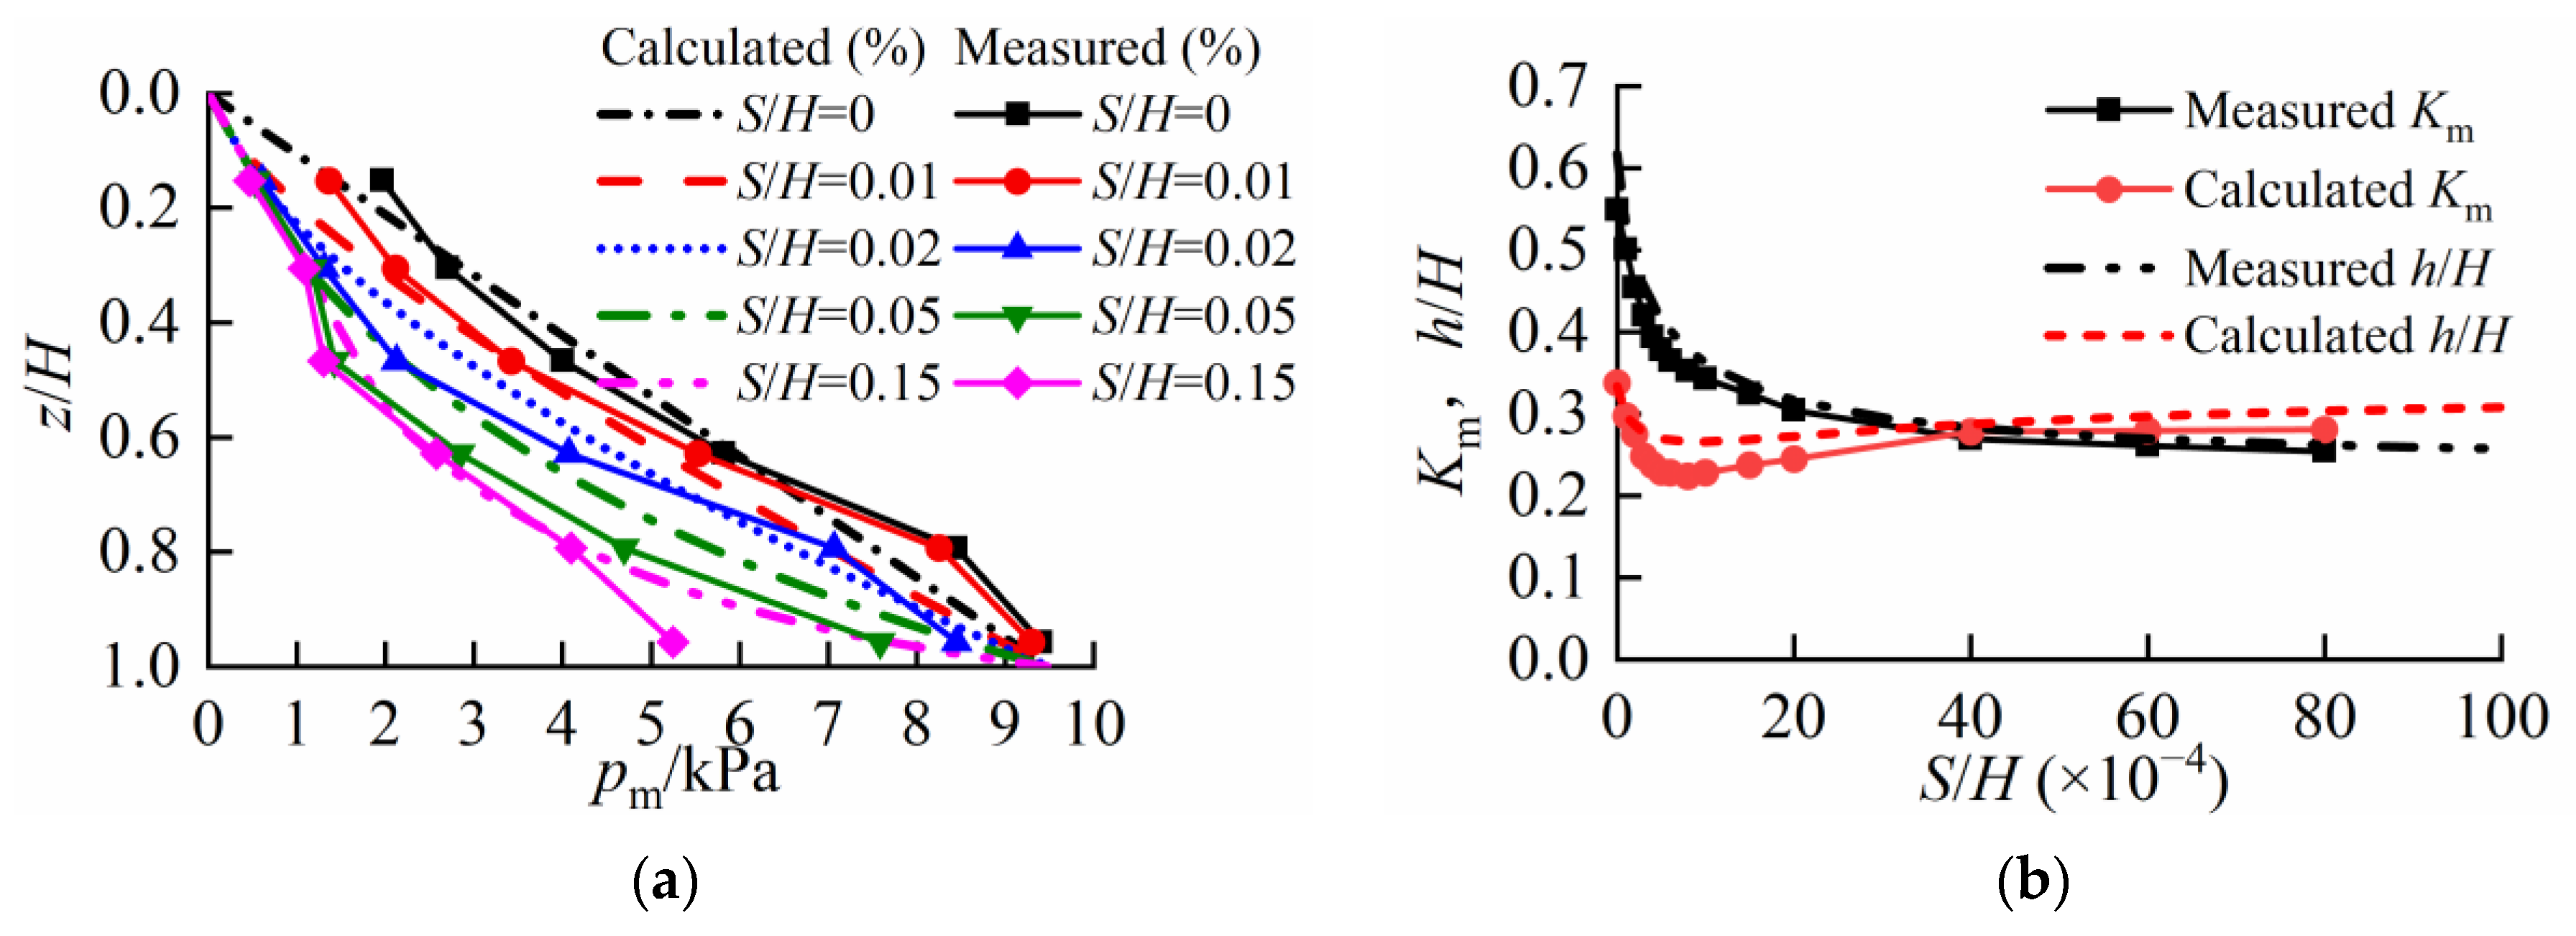
(1) When kh = 0, validation using experimental data from Reference [12]: Rigid wall with a vertical back face and height H = 1.0 m; the backfill is air-dried sandy soil with horizontal surface and no surcharge. The parameters used in the calculation are unit weight γ = 15.34 kN/m3, internal friction angle φ = 33.4°, initial soil friction angle φ0 = 8°, soil–wall friction angle: δ = 25°, initial soil–wall friction angle: δ0 = 10° and displacement Sδ(z) = 0.1% z. Using Equation (8), the calculated rupture angle α is 57.6°.
The comparison between experimental and calculated values of the horizontal earth pressure intensity pm distribution along the wall height under different horizontal displacements of a rigid retaining wall in the RB displacement mode is shown in Figure 9a. From Figure 9b, it can be observed that the calculated and measured values of pm at various points along the wall height closely match under different horizontal displacements at the wall top. As the horizontal displacement at the wall top increases, the horizontal earth pressure continuously decreases. Due to the smaller displacement in the lower soil layer, the mobilized friction angles between the wall–soil interface and the soil itself exhibit relatively minor variations, resulting in a gentler reduction trend of pm in the lower section. Specifically, the soil pressure at the wall toe changes minimally as the rotation angle increases. In the RB displacement mode, the displacement at the wall base is approximately zero. The proposed method in this study yields an at-rest earth pressure at this location, which remains constant regardless of the wall top displacement. However, in reality, the wall base is constrained by the foundation, leading to complex soil stress conditions that require further investigation. When the horizontal displacement at the wall top under the RB displacement mode is small, slight soil arching effects are observed in the upper soil layer from the measured pressure distribution. Since these effects are not considered in the proposed calculation method, the calculated values for this region are slightly lower than the measured values.
The relationships between the ratio h/H (the distance from the wall base to the horizontal earth pressure resultant force’s acting point relative to the wall height), the horizontal earth pressure coefficient Km, and the relative horizontal displacement S/H (or wall rotation angle) are illustrated in Figure 9b. Figure 9b shows that the calculated and measured values of h/H and Km agree well and follow consistent trends. The calculated relative position h/H of the resultant force aligns closely with experimental data. As the horizontal displacement at the wall top increases, h/H decreases gradually from an initial value of 1/3 (corresponding to the at-rest earth pressure state). This occurs because, under small displacements, the reduction rate of earth pressure in the upper wall section exceeds that in the lower section, shifting the resultant force downward. With further displacement, the upper soil reaches the active earth pressure state and ceases to decrease, while pressure near the wall base diminishes slowly. Only the mid-section continues to decrease, causing the resultant force to gradually rise. Ultimately, when the soil reaches the fully active limit state with linear pressure distribution, the resultant force returns to the 1/3 wall height position.
The non-limit horizontal earth pressure coefficient Km decreases progressively with increasing wall top displacement, exhibiting rapid initial reduction followed by a slower decline. When the rotation angle reaches a critical value and most of the soil behind the wall attains an active state, Km stabilizes. Overall, the calculated Km values are slightly higher than the measured values, which are conservative for engineering applications.
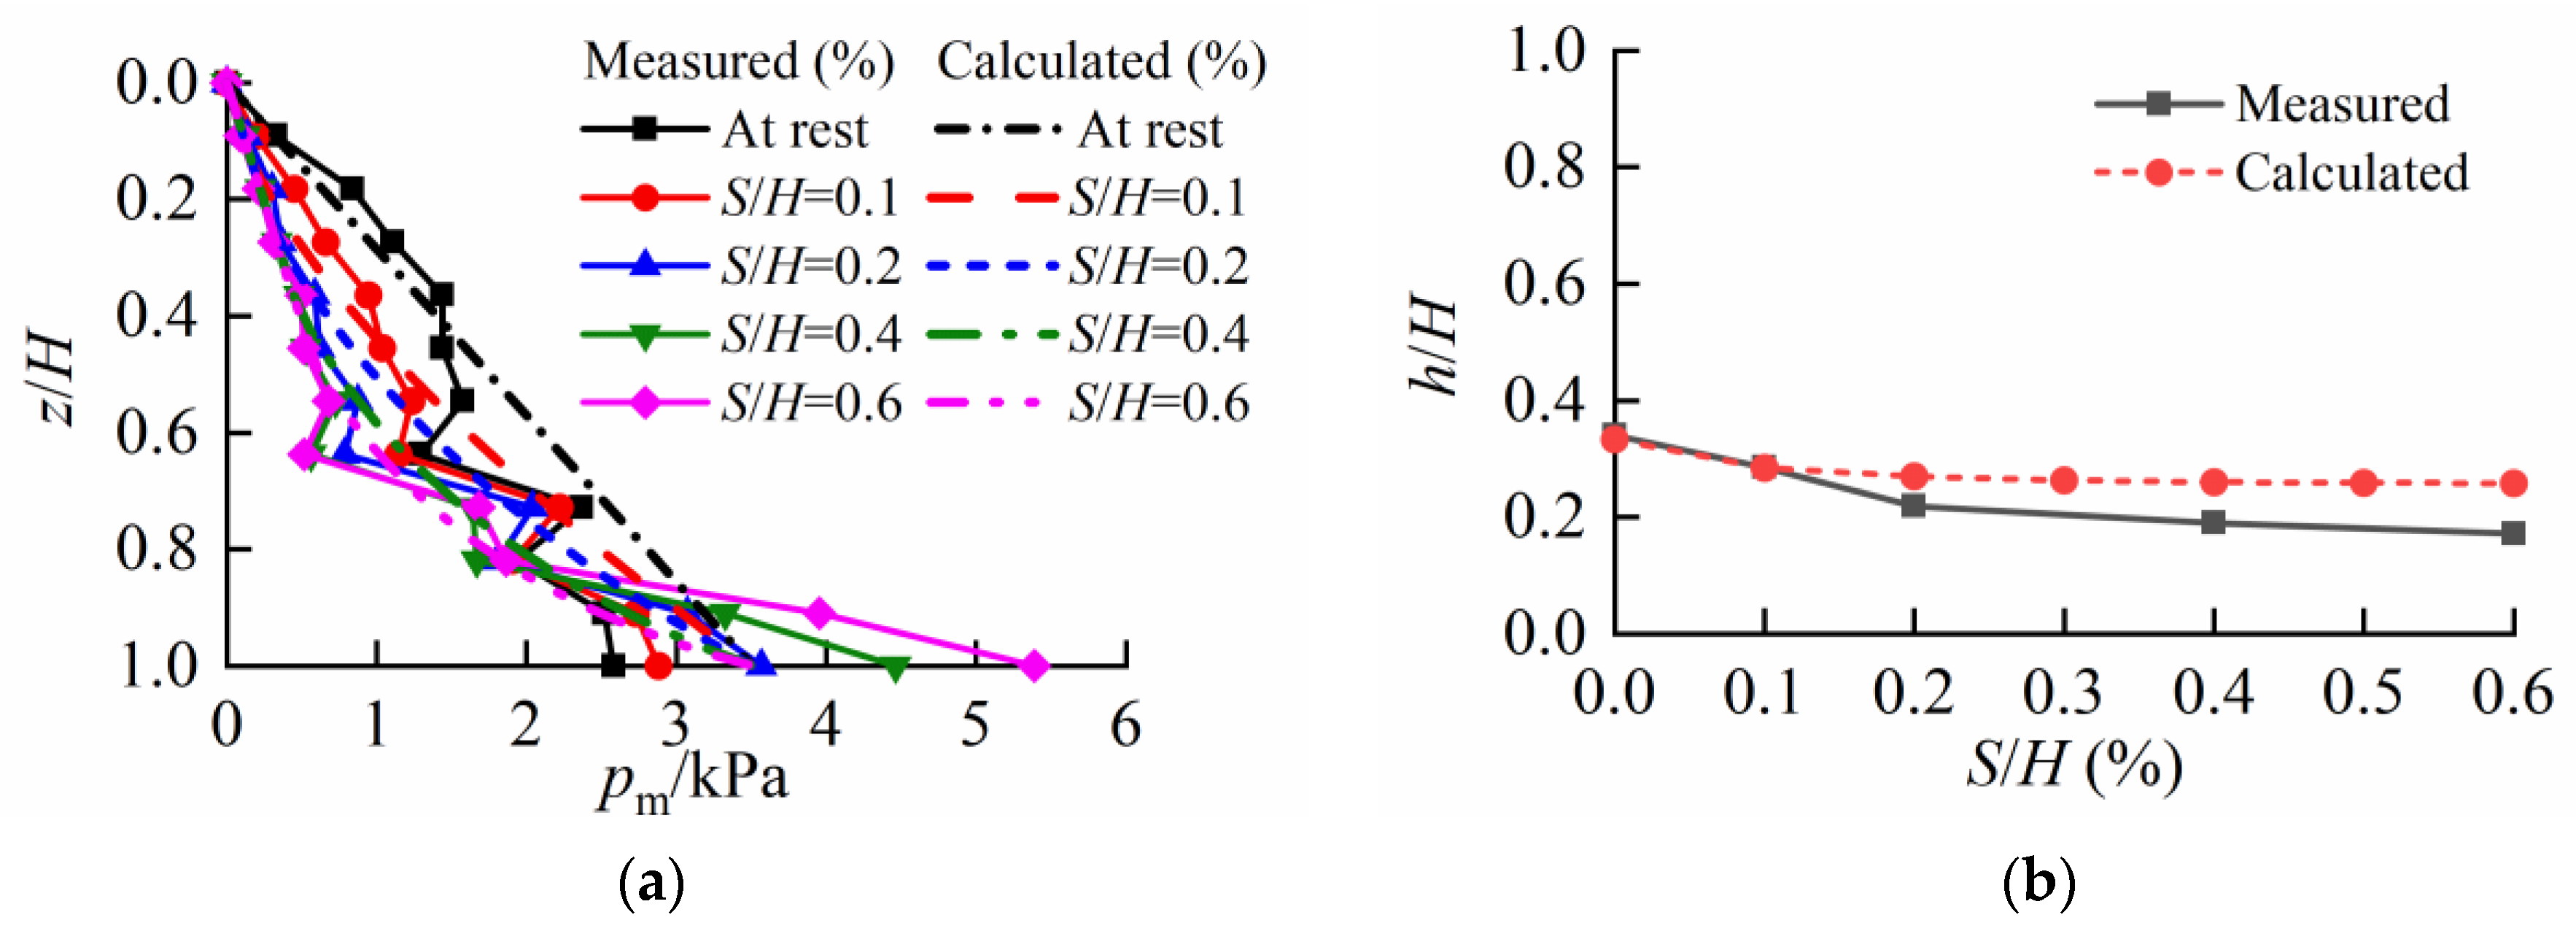
(2) When kh = 0, validation using experimental data from Reference [44]: Rigid wall with a vertical back face and height H = 0.55 m. The parameters used in the calculation are γ = 18.13 kN/m3, φ = 47.8°, φ0 = 15°, δ = 2φ/3 = 31.8°, δ0 = 23.9°, Sδ(z) = 0.6% z. Using Equation (8), the calculated rupture angle α = 66.4°.
The horizontal earth pressure distribution under the RB mode calculated using the proposed method is compared with the model test measurements in Figure 10a. Figure 10b illustrates the variations in the relative position h/H of the horizontal earth pressure resultant force’s acting point with the rotation angle, along with comparisons to experimental results. As shown in the figures, the calculated values closely align with the measured values. However, since the calculated earth pressure at the wall base is smaller than the experimental measurements, while exceeding the measured values within the range of 0.5 H to 0.85 H (where H is the wall height), the calculated relative position h/H of the resultant force is slightly higher than the measured value. Overall, the proposed non-limit earth pressure calculation method for the RB displacement mode demonstrates reasonable accuracy.
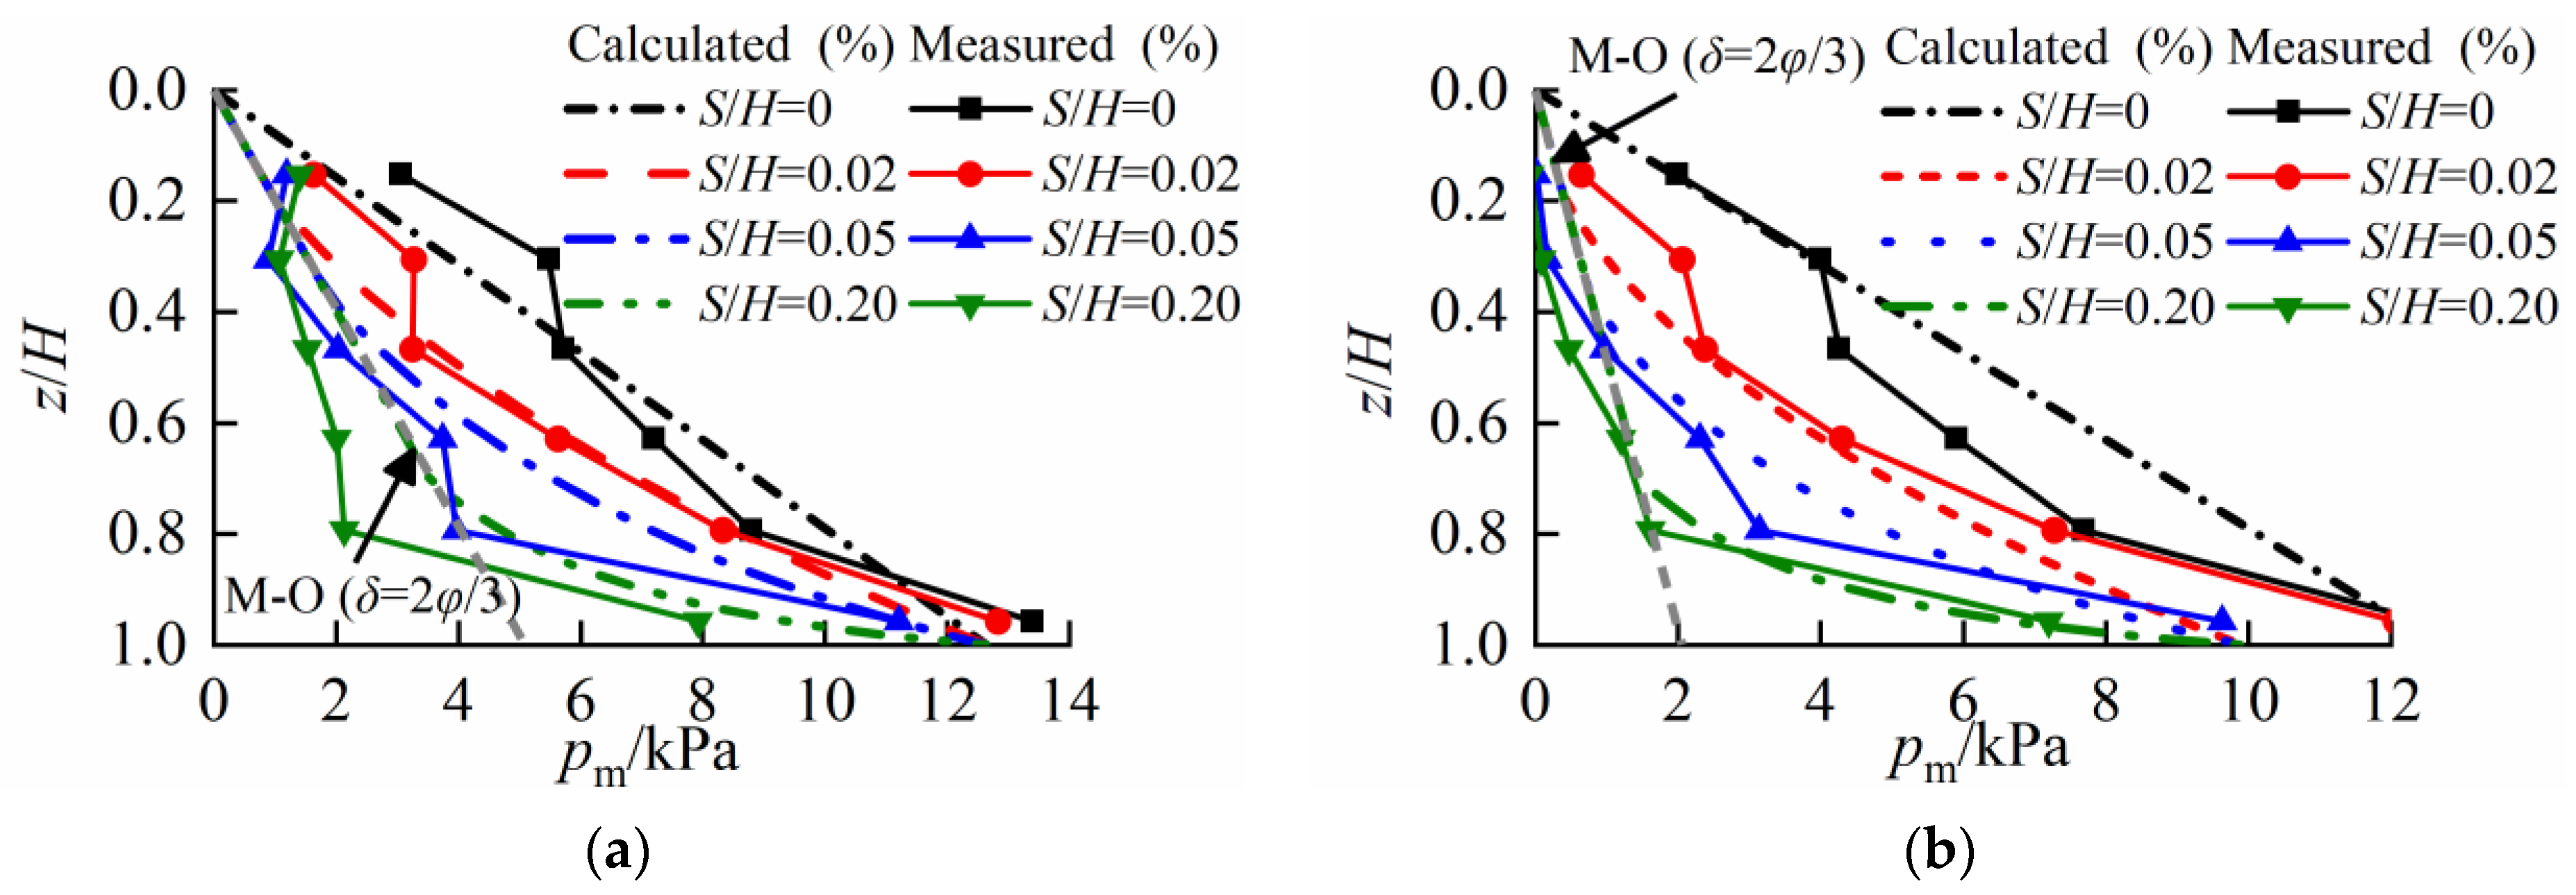
(3) When kh > 0, the experimental data are adopted from Reference [45]. The parameters are H = 1.02 m, γ = 16.1 kN/m3, φ = 40.1°, φ0 = 10°, δ = 2φ/3 = 26.7°, δ0 = 10°, Sδ(z) = 0.1%z, kh = 0.215, and fa = 1.1. Using Equation (8), the calculated rupture angle is α = 49.3°.
Figure 11a,b compare the experimental and calculated distributions of the maximum horizontal dynamic earth pressure and minimum horizontal dynamic earth pressure, respectively, under the RB displacement mode at different wall displacements.
As shown in Figure 11a,b, for the RB mode involving rotation about the wall base, the dynamic active earth pressure exhibits a nonlinear distribution with depth. Due to the small wall displacement, the earth pressure near the wall base remains relatively high, approaching the at-rest earth pressure, resulting in a lower acting point for the dynamic active earth pressure (below 1/3 of the wall height). In the maximum earth pressure measurements, higher pressures are observed near the wall base. For the minimum earth pressure measurements, when the horizontal displacement at the wall top exceeds a specific threshold, the earth pressure in the upper wall section is zero. This zero lateral stress indicates potential instantaneous separation between the wall and backfill, occurring when the lateral pressure induced by the negative inertial body forces of the backfill exceeds the lateral pressure from surcharge loads during near-active phases.
To align with experimental conditions, the maximum earth pressure in the calculations is derived by orienting inertial forces outward from the retaining wall, while the minimum earth pressure corresponds to kh = 0. Figure 11 demonstrates good agreement between calculated and experimental curves. However, under dynamic loading, the measured maximum active stress at the mid-height of the wall is slightly lower than the values predicted by the Mononobe-Okabe method. Discrepancies between calculated and measured pressure curves arise because the proposed method does not account for soil arching effects. Overall, the seismic non-limit active earth pressure calculation method based on the pseudo-static method and inclined slice method under the RB displacement mode yields reasonable results.

4. Parametric Analysis and Discussion

As indicated by Equations (2) and (7), the mobilized friction angles φm and δm under the non-limit active state in the RB displacement mode are related to the wall displacement S, the soil friction angle φ, and the soil–wall interface friction angle δ. Consequently, the mobilized values of these friction angles directly influence the magnitude of seismic non-limit lateral earth pressure. Equations (8) and (13) further reveal that the horizontal acceleration coefficient kh and the horizontal acceleration amplification factor fa are critically linked to the lateral earth pressure coefficient. The following analysis evaluates the effects of key parameters on the seismic non-limit active earth pressure under the RB mode.
(1) Influence of friction angle on non-limit earth pressure distribution in RB mode.
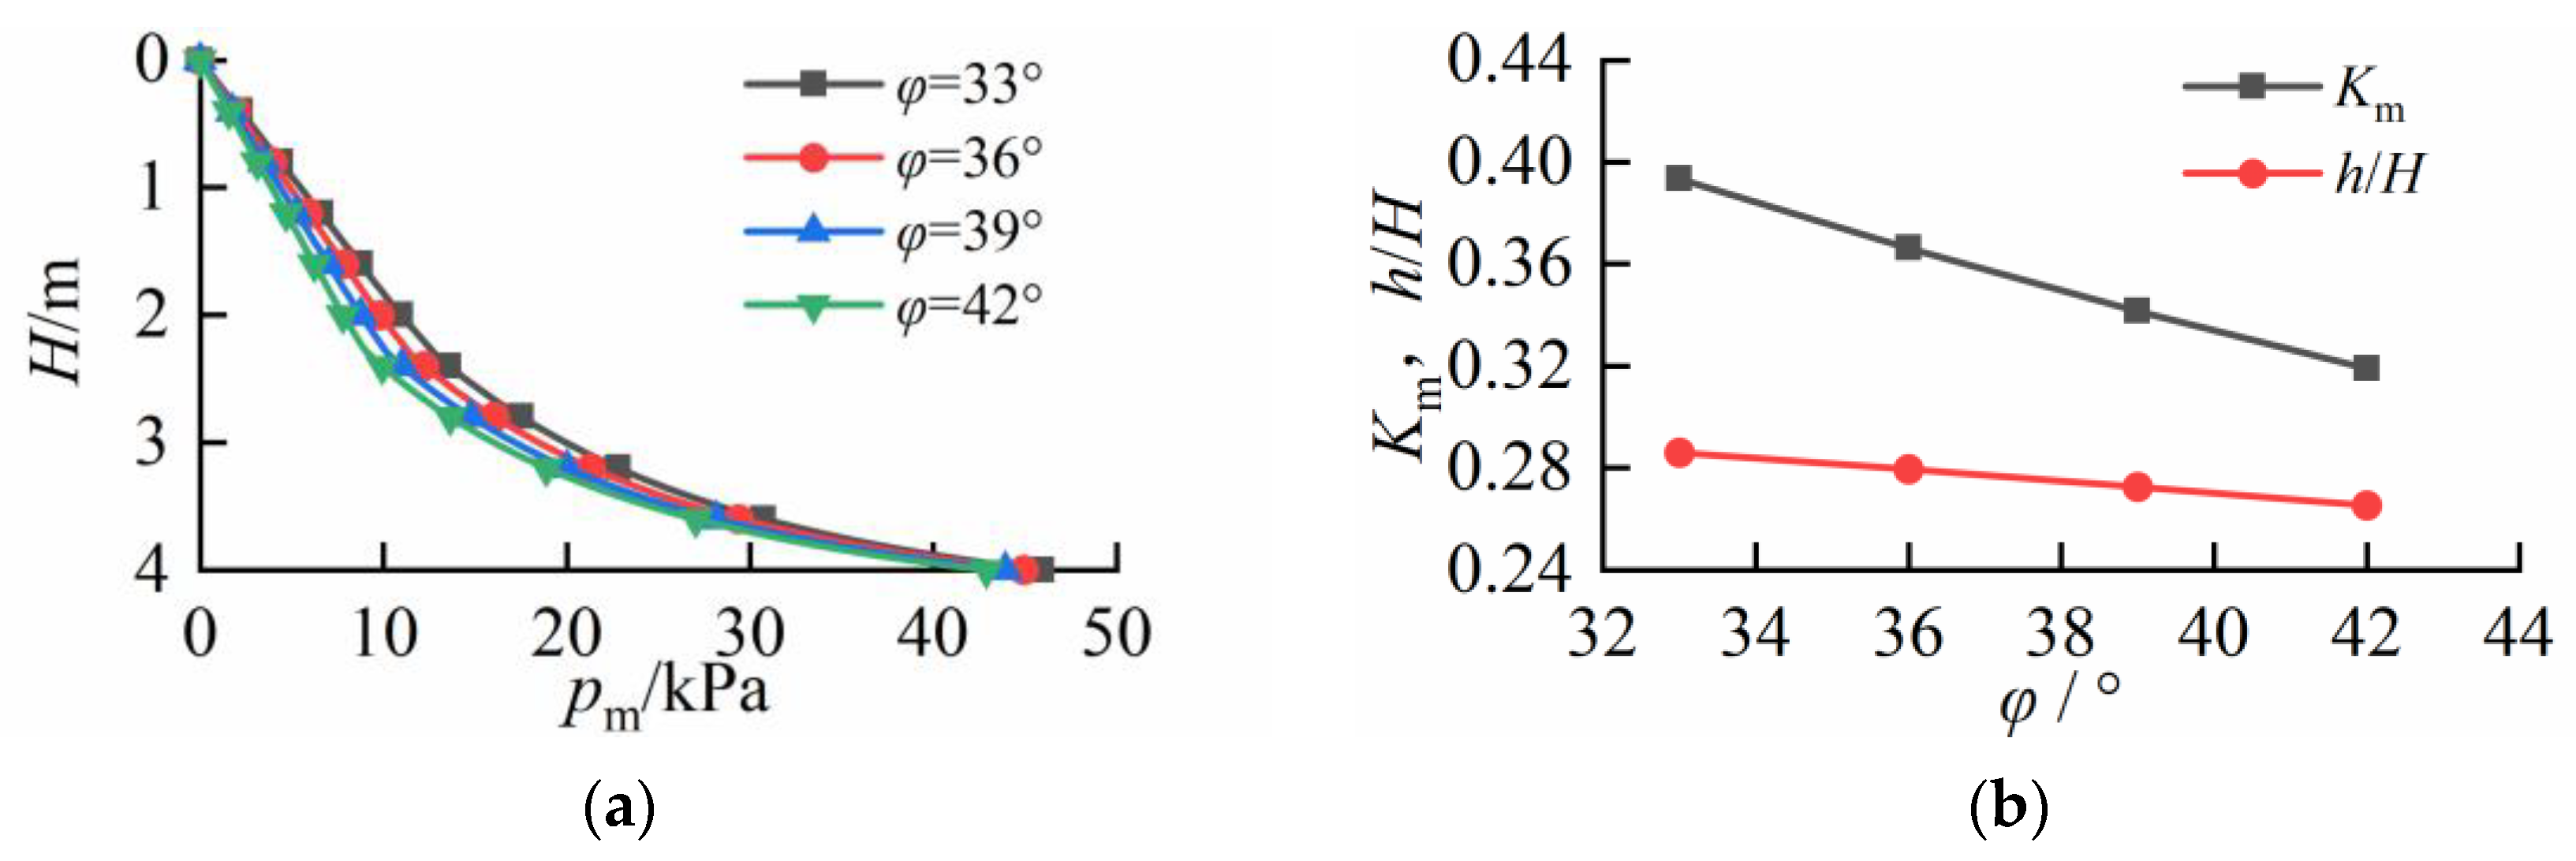
Calculation parameters: H = 4.0 m, γ = 17.6 kN/m3, φ0 = 11°, δ = 22°, δ0 = 11°, kh = 0.1, fa = 1.1, Rf = 0.85, and S/Sδ = 1.0. The internal friction angle of the backfill φ varies, and may be 33°, 36°, 39°, or 42°. The calculated earth pressure distributions are shown in Figure 12a, while the effects of φ on the active earth pressure coefficient and the acting point position of the resultant force are illustrated in Figure 12b.
From Figure 12a, has been is observed that the seismic non-limit active earth pressure under the RB mode exhibits a concave nonlinear distribution, with the intensity of the pressure increasing with depth. As the internal friction angle increases from 33° to 42°, the active earth pressure coefficient exhibits an approximately linear reduction from 0.39 to 0.32, while the point of application of earth pressure slightly shifts downward from 0.29 H to 0.27 H (where H denotes wall height), demonstrating limited positional variation (see Figure 12b).
It should be noted that this study does not account for the influence of the dilatancy angle, which may significantly affect earth pressure on retaining walls and requires dedicated investigation. Consequently, restricting the validity of the internal friction angle conclusions to non-dilative soils or soils with limited dilatancy constitutes a prudent approach.
(2) Influence of soil–wall friction angle on non-limit earth pressure distribution in RB mode.
Calculation parameters: H = 4.0 m, γ = 17.6 kN/m3, φ = 33°, φ0 = 11°, δ0 = 0°, kh = 0.1, fa = 1.1, Rf = 0.85, and S/Sδ = 1.0. The soil–wall friction angle δ varies, and may be 0°, 11°, 22°, or 33°. The calculated earth pressure distributions are shown in Figure 13a, and the influence of the soil–wall interface friction angle δ on the active earth pressure coefficient and resultant force position is illustrated in Figure 13b.
From Figure 13a, under identical parameters, within the depth range of 0–3 m, the earth pressure intensity at the same depth decreases as δ increases. However, in the 3–4 m depth range, the earth pressure intensity remains largely unaffected by variations in δ. This is because the mobilized value of the wall–soil interface friction angle near the wall base remains nearly constant under the given conditions (S/Sδ = 1.0). As shown in Figure 13b, both the active earth pressure coefficient and the acting point position of the resultant force decrease as δ increases. As the wall–soil interface friction angle increases from 0° to 33°, the active earth pressure coefficient shows an approximately linear decrease from 0.44 to 0.41, while the point of application of earth pressure shifts downward slightly from 0.29 H to 0.27 H.
Comparing the effects of the internal friction angle φ and the wall–soil interface friction angle δ on the active earth pressure coefficient and resultant force position, it is found that their trends are consistent. However, the influence of φ is more pronounced than that of δ.
(3) Influence of seismic horizontal acceleration kh on non-limit earth pressure distribution in RB mode.
Calculation parameters: H = 4.0 m, γ = 17.6 kN/m3, φ0 = 11°, δ = 22°, δ0 = 11°, fa = 1.1, Rf = 0.85, and S/Sδ = 1.0. kh is varied as 0.1, 0.2, 0.3 and 0.4. The influence of the horizontal seismic acceleration coefficient kh on non-limit active earth pressure under the RB displacement mode is investigated, excluding vertical seismic acceleration effects. The impacts of kh on earth pressure distribution curves, the active earth pressure coefficient, and resultant force position are presented in Figure 14.
From Figure 14a, it is evident that kh significantly affects the lateral earth pressure intensity, notably increasing the pressure near the wall base. As indicated by Equation (8), a larger kh enlarges the failure wedge volume, thereby increasing the active earth pressure coefficient. As shown in Figure 14b, when the horizontal seismic acceleration coefficient increases from 0.1 to 0.4, the active earth pressure coefficient rises significantly from 0.39 to 0.81, demonstrating a pronounced growth trend with the amplification of seismic acceleration. Meanwhile, the application point of earth pressure only slightly shifts from 0.29 to 0.30 times the retaining wall height, remaining essentially stable.
(4) Influence of wall top displacement S/Sδ on non-limit earth pressure distribution.
Calculation parameters: H = 4.0 m, γ = 17.6 kN/m3, φ0 = 11°, δ = 22°, δ0 = 11°, kh = 0.1, fa = 1.1, Rf = 0.85. The relative wall top displacements S/Sδ are set to 0.5, 1.0, 2.0, and 5.0. Under non-limit conditions, the influences of wall top displacement on seismic lateral earth pressure, the active earth pressure coefficient, and the resultant force position are illustrated in Figure 15.
As shown in Figure 15a, when S/Sδ = 0.5, the upper section of the wall exhibits active earth pressure under horizontal seismic loading, as both the internal friction angle of the upper soil and the wall–soil interface friction angle reach their limit states. In the RB displacement mode, as the wall top displacement increases, the earth pressure in the lower wall section further decreases, the zone of upper soil in the limit state gradually expands, and the active earth pressure decreases significantly.
Due to the rotation about the wall base in the RB mode, the displacement at the wall base remains minimal, resulting in nearly identical base earth pressures across different displacement conditions. As illustrated in Figure 15b, within the considered range of relative displacement at the wall top (increasing from 0.5 to 5.0), the non-limit active earth pressure coefficient decreases from 0.44 to 0.33. Concurrently, the application point of the resultant force gradually elevates from 0.28 to 0.31 times the wall height.

5. Summary and Conclusions

(1) The resultant force application point initially shifts downward as the upper earth pressure decreases faster than the lower portion under small wall-top displacements, progressively descending from the initial at-rest earth pressure height (1/3 relative height). During initial wall rotation, the resultant point rapidly lowers due to abrupt reduction in upper earth pressure. With further horizontal displacement, upper active earth pressure stabilizes while mid-section pressure continues to decrease. Ultimately, the earth pressure achieves a linear distribution at the active limit state, with the resultant point returning to the 1/3 wall height.
(2) Key findings from parametric analyses: Overall, as the horizontal seismic acceleration coefficient increases from 0.1 to 0.4, the active earth pressure coefficient rises from 0.39 to 0.81. When the parameter δ increases from 0.5 to 5.0, the non-limit active earth pressure coefficient decreases from 0.44 to 0.33. With the internal friction angle increasing from 33° to 42°, the active earth pressure coefficient exhibits an approximately linear reduction from 0.39 to 0.32. Similarly, as the wall–soil interface friction angle grows from 0° to 33°, the active earth pressure coefficient shows a near-linear decrease from 0.44 to 0.41. The position of the resultant force application point demonstrates minor variations, fluctuating slightly around 0.30 H (where H represents the retaining wall height).
(3) Finally, it should be emphasized that the pseudo-static method cannot fully capture the nonlinear distribution characteristics of seismic earth pressure under earthquake loading. The assumption of linear pressure distribution in this method represents a conservative (safety-oriented) simplification. While the pseudo-static method exhibits both distinct advantages and limitations, its adoption in this study allows partial consideration of dynamic loading characteristics. However, it inherently neglects material-specific dynamic properties, inter-structural dynamic interactions, and dynamic coupling effects, thereby failing to account for time-dependent stress redistribution, damping effects, or authentic soil–wall dynamic interactions. Application constraints must be strictly observed: they may be inapplicable to scenarios involving significant soil stiffness degradation or liquefaction during seismic events, or limited to structures with low design accelerations and negligible dynamic interactions. However, the pseudo-static method demonstrates notable strengths: its clear physical conceptualization, the relative simplicity of its computational procedures compared to fully dynamic analysis, and its minimal computational demands, easily determinable parameters, and extensive empirical validation make it widely accepted by design engineers. Additionally, this study does not address the influence of soil arching effects on stress redistribution, which is a direction for future research on seismic earth pressure mechanisms.

Author Contributions

Conceptualization, Z.S. and W.W.; methodology, Z.S.; validation, Z.S. and W.W.; formal analysis, W.W.; investigation, W.W.; resources, W.W.; data curation, Z.S.; writing—original draft preparation, Z.S.; writing—review and editing, Z.S. and W.W.; supervision, Z.S.; project administration, W.W.; funding acquisition, W.W. All authors have read and agreed to the published version of the manuscript.

Funding

This work was supported by the Open Research Fund of Anhui Provincial Key Laboratory of Building Earthquake Disaster Mitigation and Green Operations, Anhui Institute of Building Research & Design, Grant NO. 2022-JKYL-002.

Institutional Review Board Statement

Not applicable.

Informed Consent Statement

Not applicable.

Data Availability Statement

The raw data supporting the conclusions of this article will be made available by the authors on request.

Conflicts of Interest

The authors declare no conflicts of interest.

References

  1. Qiu, Y.L.; Yao, L.K.; Qin, W. Characteristic analysis of the damaged retaining wall in Wenchuan earthquake. J. Chongqing Jiaotong Univ. (Nat. Sci.) 2010, 29, 576–581. [Google Scholar]
  2. Kloukinas, P.; Langousis, M.; Mylonakis, G. Simple wave solution for seismic earth pressures on nonyielding walls. J. Geotech. Geoenviron. Eng. 2012, 138, 1514–1519. [Google Scholar] [CrossRef]
  3. Veletsos, A.S.; Younan, A.H. Dynamic response of cantilever retaining walls. J. Geotech. Geoenviron. Eng 1997, 123, 161–172. [Google Scholar] [CrossRef]
  4. Mononobe, N.; Matsho, H. On the determination of earthquake pressure during earthquake. Proc. World Eng. Congr. 1929, 9, 177–185. [Google Scholar]
  5. Okabe, S. General Theory on earth pressure and seismic stability of retaining wall and dam. Proc. Civ. Eng. Soc. 1924, 10, 1277–1323. [Google Scholar]
  6. Nakamura, S. Re-examination of Mononobe-Okabe theory of gravity retaining walls using centrifuge model tests. Soils Found. 2006, 46, 135–146. [Google Scholar] [CrossRef]
  7. Mikola, R.G.; Candia, G.; Sitar, N. Seismic earth pressures on retaining structures and basement walls in cohesionless soils. J. Geotech. Geoenviron. Eng. 2016, 142, 04016047. [Google Scholar] [CrossRef]
  8. Candia, G.; Mikola, R.G.; Sitar, N. Seismic response of retaining walls with cohesive backfill: Centrifuge model studies. Soil Dyn. Earthq. Eng. 2016, 90, 411–419. [Google Scholar] [CrossRef]
  9. Wagner, N.; Sitar, N. On seismic response of stiff and flexible retaining structures. Soil Dyn. Earthq. Eng. 2016, 91, 284–293. [Google Scholar] [CrossRef]
  10. Lin, Z.; Jiang, Y.; Xiong, Y.; Xu, C.; Guo, Y.; Wang, C.; Fang, T. Analytical solution for displacement-dependent active earth pressure considering the stiffness of cantilever retaining structure in cohesionless soil. Comput. Geotech. 2024, 170, 106258. [Google Scholar] [CrossRef]
  11. Bang, S. Active earth pressure behind retaining walls. J. Geotech. Eng. 1985, 111, 407–412. [Google Scholar] [CrossRef]
  12. Fang, Y.; Ishibashi, I. Static earth pressure with various wall movements. J. Geotech. Eng. 1986, 112, 317–333. [Google Scholar] [CrossRef]
  13. Xia, J.; Dou, G.; Su, Q.; Bai, W.; Yuan, F. Experiment study on non-limit passive earth pressure of clay under different displacement modes. J. Southwest Jiaotong Univ. 2019, 54, 769–777. (In Chinese) [Google Scholar]
  14. Zhang, Z.; Qie, B.; Xu, F.; Wang, W.; Liu, Z.; Lin, X.; Huang, A. Experimental study on the nonlimit active earth pressure of finite soil in proximity engineering. Sci. Rep. 2024, 14, 30212. [Google Scholar] [CrossRef]
  15. Hu, W.; Zhu, X.; Hu, T.; Wang, W.; Lin, G. Non-limit passive earth pressure against cantilever flexible retaining wall in foundation pit considering the displacement. PLoS ONE 2022, 17, e0264690. [Google Scholar] [CrossRef] [PubMed]
  16. Li, M.; Yi, J.; Zhang, J.; Shi, X. Numerical solution for nonlimit-state earth pressure considering interlayer shear stress and the soil arching effect. Comput. Geotech. 2023, 164, 105778. [Google Scholar] [CrossRef]
  17. Chen, L. Active earth pressure of retaining wall considering wall movement. Eur. J. Environ. Civ. Eng. 2014, 18, 910–926. [Google Scholar] [CrossRef]
  18. Mei, G.X.; Chen, R.; Liu, J. New insight into developing mathematical models for predicting deformation-dependent lateral earth pressure. Int. J. Geomech. 2017, 17, 06017003. [Google Scholar] [CrossRef]
  19. Alamdari, N.S.; Khosravi, M.H.; Katebi, H. Distribution of lateral active earth pressure on a rigid retaining wall under various motion modes. Int. J. Min. Geo Eng. 2020, 54, 15–25. [Google Scholar]
  20. Patel, S.; Deb, K. Study of active earth pressure behind a vertical retaining wall subjected to rotation about the base. Int. J. Geomech. 2020, 20, 04020028. [Google Scholar] [CrossRef]
  21. Yang, M.H.; Tang, X.C. Rigid retaining walls with narrow cohesionless backfills under various wall movement modes. Int. J. Geomech. 2017, 17, 04017098. [Google Scholar] [CrossRef]
  22. Chen, F.Q.; Zhang, Y.B.; Lin, Y.J.; Huang, M. Active earth pressure against inverted T-type retaining walls under translation mode. Int. J. Geomech. 2021, 21, 04021077. [Google Scholar] [CrossRef]
  23. Ni, P.; Mangalathu, S.; Song, L.; Mei, G.; Zhao, Y. Displacement-dependent lateral earth pressure models. J. Eng. Mech. 2018, 144, 04018032. [Google Scholar] [CrossRef]
  24. Yao, T.; Li, J.P.; Ma, Y. Lateral earth pressure considering the displacement of a rigid retaining wall. Int. J. Geomech. 2018, 18, 06018031. [Google Scholar]
  25. Liang, L.; Xu, C.; Fan, X.; Chen, Q. Hyperbolic stress-strain behaviour of sandy soil under plane strain unloading condition and its application on predicting displacement-dependent active earth pressure. Comput. Geotech. 2023, 155, 105219. [Google Scholar] [CrossRef]
  26. Yang, D.; Lai, F.; Liu, S. Earth pressure in narrow cohesive-fictional soils behind retaining walls rotated about the top: An analytical approach. Comput. Geotech. 2022, 149, 104849. [Google Scholar] [CrossRef]
  27. Khosravi, M.H.; Pipatpongsa, T.; Takemura, J. Experimental analysis of earth pressure against rigid retaining walls under translation mode. Géotechnique 2013, 63, 1020–1028. [Google Scholar] [CrossRef]
  28. Rui, R.; Ye, Y.Q.; Han, J.; Zhang, L.; Zhai, Y.X. Experimental and theoretical investigations on active earth pressure distributions behind rigid retaining walls with narrow backfill under a translational mode. Int. J. Geomech. 2020, 20, 04020178. [Google Scholar] [CrossRef]
  29. Deng, C.; Haigh, S.K. Sand deformation mechanisms mobilised with active retaining wall movement. Géotechnique 2022, 72, 260–273. [Google Scholar] [CrossRef]
  30. Deng, C.; Haigh, S.K. Earth pressures mobilised in dry sand with active rigid retaining wall movement. Géotechnique Lett. 2021, 11, 1–21. [Google Scholar] [CrossRef]
  31. Perozzi, D.; Puzrin, A.M. Experimental study of the earth pressure evolution on a model wall rotating about its base. J. Geotech. Geoenviron. Eng. 2024, 150, 04024048. [Google Scholar] [CrossRef]
  32. Jiang, M.; He, J.; Wang, J.; Liu, F.; Zhang, W. Distinct simulation of earth pressure against a rigid retaining wall considering inter-particle rolling resistance in sandy backfill. Granul. Matter 2014, 16, 797–814. [Google Scholar] [CrossRef]
  33. Nadukuru, S.; Michalowski, R. Arching in distribution of active load on retaining walls. J. Geotech. Geoenviron. Eng. 2012, 138, 575–584. [Google Scholar] [CrossRef]
  34. Sizkow, S.F.; El Shamy, U. Discrete-element method simulations of the seismic response of flexible retaining walls. J. Geotech. Geoenviron. Eng. 2021, 147, 04020157. [Google Scholar] [CrossRef]
  35. Xu, M.; Guo, J.W. DEM study on the development of the earth pressure of granular materials subjected to lateral cyclic loading. Comput. Geotech. 2021, 130, 103915. [Google Scholar] [CrossRef]
  36. Perozzi, D. Quantification of the Earth Pressure Acting on Corrosion-Damaged Cantilever Retaining Walls: An Analysis of the Soil-Structure Interaction. Ph.D. Thesis, ETH, Zurich, Switzerland, 2022. [Google Scholar]
  37. Chang, M.F. Lateral earth pressures behind rotating walls. Can. Geotech. J. 1997, 34, 498–509. [Google Scholar] [CrossRef]
  38. Jaky, J. The coefficient of earth pressure at rest. J. Soc. Hung. Archit. Eng. 1944, 78, 355–357. [Google Scholar]
  39. Brooker, E.W.; Ireland, H.O. Earth pressures at rest related to stress history. Can. Geotech. J. 1965, 2, 1–15. [Google Scholar] [CrossRef]
  40. Mtsuoka, H. Stress-strain relationships of sands based on the mobilized plane. Soils Found. 1974, 14, 47–62. [Google Scholar] [CrossRef]
  41. Sherif, M.A.; Fang, Y.S.; Sherif, R.I. Ka and K0 behind rotating and non-yielding walls. J. Geotech. Eng. 1985, 110, 41–56. [Google Scholar] [CrossRef]
  42. Abdel Aziz, E.S.M.; Taha, Y.K.; Eweada, S.N. Theoretical study of earth pressure at-rest for sandy soils. J. Eng. Sci. 2011, 39, 1–13. [Google Scholar] [CrossRef]
  43. Mayne, P.W.; Kulhawy, F.H. K0-OCR relationships in soil. J. Geotech. Eng. Div. 1982, 108, 851–872. [Google Scholar] [CrossRef]
  44. Rui, R.; Xia, R.-J.; Han, J.; Ye, Y.-Q.; Miao, X.; Elabd, M. Experimental investigations of lateral earth pressures behind rigid retaining walls under different displacement modes. Acta Geotech. 2024, 19, 2545–2562. [Google Scholar] [CrossRef]
  45. Ishibashi, I.; Fang, Y.S. Dynamic earth pressures with different wall movement modes. Soils Found. 1987, 27, 11–22. [Google Scholar] [CrossRef] [PubMed]
Figure 1. Displacement schematic diagram of retaining wall under RB mode.
Applsci 15 04202 g001
Figure 2. The variation in wall–soil interface contact pressure, sliding friction angle, and shear plastic strain increment with the rotation angle of the retaining wall from Reference [36].
Applsci 15 04202 g002
Figure 3. Relationship between critical horizontal displacement and retaining wall height.
Applsci 15 04202 g003
Figure 4. Distribution of mobilized wall–soil friction angle values under different displacements in RB mode.
Applsci 15 04202 g004
Figure 5. Schematic diagram of soil failure mechanism in RB mode.
Applsci 15 04202 g005
Figure 6. Distribution of (a) soil shear strain and (b) mobilized internal friction angles corresponding to various displacements in RB mode (α = 50°, φ = 30°).
Applsci 15 04202 g006
Figure 7. Similarity transformation for the analysis of soil rupture angle behind seismic retaining walls.
Applsci 15 04202 g007
Figure 8. Schematic diagram of force distribution on an oblique differential element in RB mode under seismic loading.
Applsci 15 04202 g008
Figure 9. Comparison between experimental and calculated (a) horizontal earth pressure distributions, (b) active earth pressure coefficients and resultant force positions in RB mode from Reference [12].
Applsci 15 04202 g009
Figure 10. Comparison between experimental and calculated (a) horizontal earth pressure distributions and (b) resultant force positions in RB mode from Reference [44].
Applsci 15 04202 g010
Figure 11. A comparison between the calculated values and the experimental values of (a) maximum horizontal dynamic earth pressure distribution and (b) minimum horizontal dynamic earth pressure distribution in the RB mode from Reference [45].
Applsci 15 04202 g011
Figure 12. Influences of internal friction angle on (a) seismic non-limit active earth pressure and (b) active earth pressure coefficient and resultant force position.
Applsci 15 04202 g012
Figure 13. Influences of soil–wall interface friction angle on (a) seismic non-limit active earth pressure and (b) active earth pressure coefficient and resultant force position.
Applsci 15 04202 g013
Figure 14. Influences of horizontal seismic acceleration on (a) seismic non-limit active earth pressure and (b) active earth pressure coefficient and resultant force position.
Applsci 15 04202 g014
Figure 15. Influences of wall top displacement on (a) seismic active earth pressure and (b) active earth pressure coefficient and resultant force position.
Applsci 15 04202 g015
Table 1. Common formulas for K0 calculation.
SourceFormulaApplicability
Jaky [38] K 0 = 1 sin φ .Sand
Brooker [39] K 0 = 0.95 sin φ Sandy soil
Matsuoka [40] K 0 = 1 1 + 2 sin φ Silty sand
Sherif et al. [41] K 0 = 1 sin φ + 5.5 γ d γ dmin 1 Sandy soil
Abdel Aziz et al. [42] K 0 = 1 sin 2 φ 1 + sin 2 φ Sandy soil
Mayne et al. [43] K 0 = ( 1 sin φ ) ( O C R O C R max 1 sin φ ) + 3 4 ( 1 O C R O C R max ) Overconsolidated soil
φ is the effective internal friction angle, γ d denotes the unit weight of undisturbed soil, γ dmin represents the minimum unit weight of soil.
Disclaimer/Publisher’s Note: The statements, opinions and data contained in all publications are solely those of the individual author(s) and contributor(s) and not of MDPI and/or the editor(s). MDPI and/or the editor(s) disclaim responsibility for any injury to people or property resulting from any ideas, methods, instructions or products referred to in the content.