Article

A Comparative Study of the Structural, Morphological, and Functional Properties of Native Potato Starch and Spray-Dried Potato Starch

by
Anna Marinopoulou
*,
Maria Zoumaki
,
Dimitrios Sampanis
,
Vassilis Karageorgiou
,
Stylianos Raphaelides
and
Athanasios Goulas
Department of Food Science and Technology, International Hellenic University, Alexandrian Campus, 57400 Thessaloniki, Greece
*
Author to whom correspondence should be addressed.
Appl. Sci. 2025, 15(8), 4566; https://doi.org/10.3390/app15084566
Submission received: 22 March 2025 / Revised: 14 April 2025 / Accepted: 19 April 2025 / Published: 21 April 2025

Abstract

:
The spray-dried potato starch was produced by gelatinizing native potato starch at two concentrations of 3% and 5% at 75 °C for 30 min, followed by drying in a pilot-scale spray dryer. X-ray diffraction (XRD), differential scanning calorimetry (DSC), Fourier transform infrared spectroscopy (FTIR), and optical microscopy were applied to characterize native potato starch and spray-dried (SD) potato starch powders. The physical properties of the starches, including moisture content, color, bulk density, tapped density, particle size parameters, water holding capacity, and hygroscopicity, were investigated. XRD, DSC, and FTIR revealed the formation of a semi-crystalline to amorphous structure in the spray-dried starch powders. Microscopic examination showed that the starch granules of native potato starch were spherical and regular in shape, while spray-dried (SD) starch powders displayed wrinkled granules. The moisture content of the spray-dried powders was significantly lower than that of the native starch, while the native starch had higher particle size values [D(4.3)] compared to the spray-dried powders. Higher water holding capacity values were also recorded in the spray-dried starches compared to the native starch. Regarding the color parameters, statistical analysis revealed similar values for lightness (L*) and yellowness (YI) indices, while significant differences were found in hue angle (H°), a*, and b* values. A principal component analysis (PCA) was carried out to investigate the relationships among the physical properties of the native potato starch and spray-dried starch powders. The findings of the present study highlight the potential application of physically modifying starch through the spray-drying process.

1. Introduction

Potatoes are considered one of the major starchy carbohydrate crops, following wheat, rice, and corn [1]. China is the world’s largest producer of potatoes, while North America and the European Union play a leading role in the global potato processing industry [2]. Potatoes are highly nutrient-rich vegetables, containing significant amounts of starch, sugar, dietary fiber, and small amounts of protein and fats, along with vitamin C [3]. However, despite these nutritional benefits, the consumption of potatoes has been reduced due to difficulties in preparation and storage [4].
Potatoes contain approximately 20% dry matter, of which 60–80% is starch [5]. Potato starch is widely used as an emulsifier, thickening agent, binder, and stabilizer [6], and its granules have a broad granule size distribution ranging from 1 to 110 μm [7]. However, native potato starch has limited industrial application, because it cannot withstand extreme processing conditions, such as high temperature, acidic environment, and high shear rate [8]. Besides, native potato starch is insoluble in cold water, easily retrograded, and exhibits poor clarity [9,10]. To address these issues, native potato starch can be modified through physical, chemical, or enzymatic methods [11]. Physical modification is an eco-friendly method, reducing the environmental impact [10]. Pregelatinized starch is a physically modified starch, which is produced through gelatinization [12]. Due to this modification, the starch can absorb and swell in cold water exhibiting improved functional and thickening properties [13]. Pregelatinized starch can be produced using techniques, such as drum-drying, spray-drying, extrusion-cooking, and microwave-heating [9].
Spray-drying is a convenient and cost-effective method for producing pregelatinized starch powder. It is highly efficient in converting liquid solutions into dry particles [14]. During this process, the solution is pumped into an atomizer, where it is converted into droplets, which are dried coming in contact with hot air [15]. Starch concentration affects the viscosity of the solution, which in turn influences the spray-drying process. The increased viscosity of the starch solution could impact droplet formation, moisture evaporation, and the formation of the microstructure during drying. As the concentration of starch increases, the starch molecules tend to arrange themselves into a crystalline form. However, during the spray-drying process, the rapid evaporation of moisture may result in the formation of an amorphous, porous structure [16,17,18,19]. In the literature, there are many studies focusing on the production and characterization of physically modified starches using the spray-drying technique, such as rice starch [20], oat starch [9], sweet potato [4,14,21], and cassava starch [22]. Besides, numerous studies have reported that starch concentration can influence the pasting and rheological properties of starch gels [23], the viscosity of cassava starch pastes during the cooking–cooling process [24], the structure and properties of freeze-dried rice starch paste [25], and the crystallinity, enthalpy, and viscosity of cassava starch [22]. While spray-dried starches from rice and cassava have been studied, the impact of starch concentration on potato starch remains underexplored. Considering that starch concentration and viscosity play a significant role in determining the structural, morphological, and physical properties of potato starch, it is crucial to assess their impact on these characteristics in order to optimize its applications in food processing, pharmaceuticals, and biodegradable packaging. Thus, a comparative study of the structural, morphological, and functional properties of native potato starch and spray dried potato starch, as well as the impact of starch concentration on the characterization of spray-dried potato starch powders, is still lacking. Therefore, the aim of the present study is to investigate, evaluate, and compare the structural, morphological, and physical properties of native potato starch and spray-dried potato starch at concentrations of 3% and 5%. These starch concentrations were chosen in order to investigate how different levels of starch concentration affect the structural, morphological, and physical properties of the spray-dried powders. It should be noted that starch concentrations higher than 5% could complicate the spray-drying process due to the increased viscosity, which makes atomization more difficult and may lead to less efficient drying and changes in the final powder quality. Thus, the starch concentrations of 3% and 5% were selected as typical and practical levels that can be used in industrial applications. By providing an in-depth analysis and new insights into the structural and physical properties of native and physically modified starches, it is believed that the present study will contribute to a better understanding of how these characteristics could affect the potential use of spray-dried potato starch in various industrial applications.

2. Materials and Methods

2.1. Materials

Native potato starch was obtained from Avebe (Veendam, The Netherlands). Potassium iodine, (purity >99%) and sodium chloride (purity >99%) were purchased from Sigma Aldrich Chemical Co. (St. Louis, MI, USA). All other reagents used were of analytical grade.

2.2. Preparation of Spray-Dried Starch Powders

Native potato starch at concentrations of 3% and 5% w/w was dispersed in water inside a 15 L stainless steel feed jacketed vessel, equipped with a stirrer rotating at a fixed speed, and heated at 75 °C for 30 min under continuous stirring. A mono pump transferred the feed solution to a spray dryer (NIRO ATOMIZER, Model Production Minor, Copenhagen, Denmark). The powders were collected from the bottom at the cyclone collector attached to the spray dryer chamber and stored for 30 days at ambient conditions before analysis. The dryer had a maximum water evaporation capacity of 50 L/h. The spray-dried system is described in more detail in our previous work [16,17,18,19].
The codification of the spray-dried potato starch powders at concentrations of 3% (w/w) [SD_3%] and 5% (w/w) [SD_5%], along with the operating conditions applied during the spray-drying process, are described in Table 1.

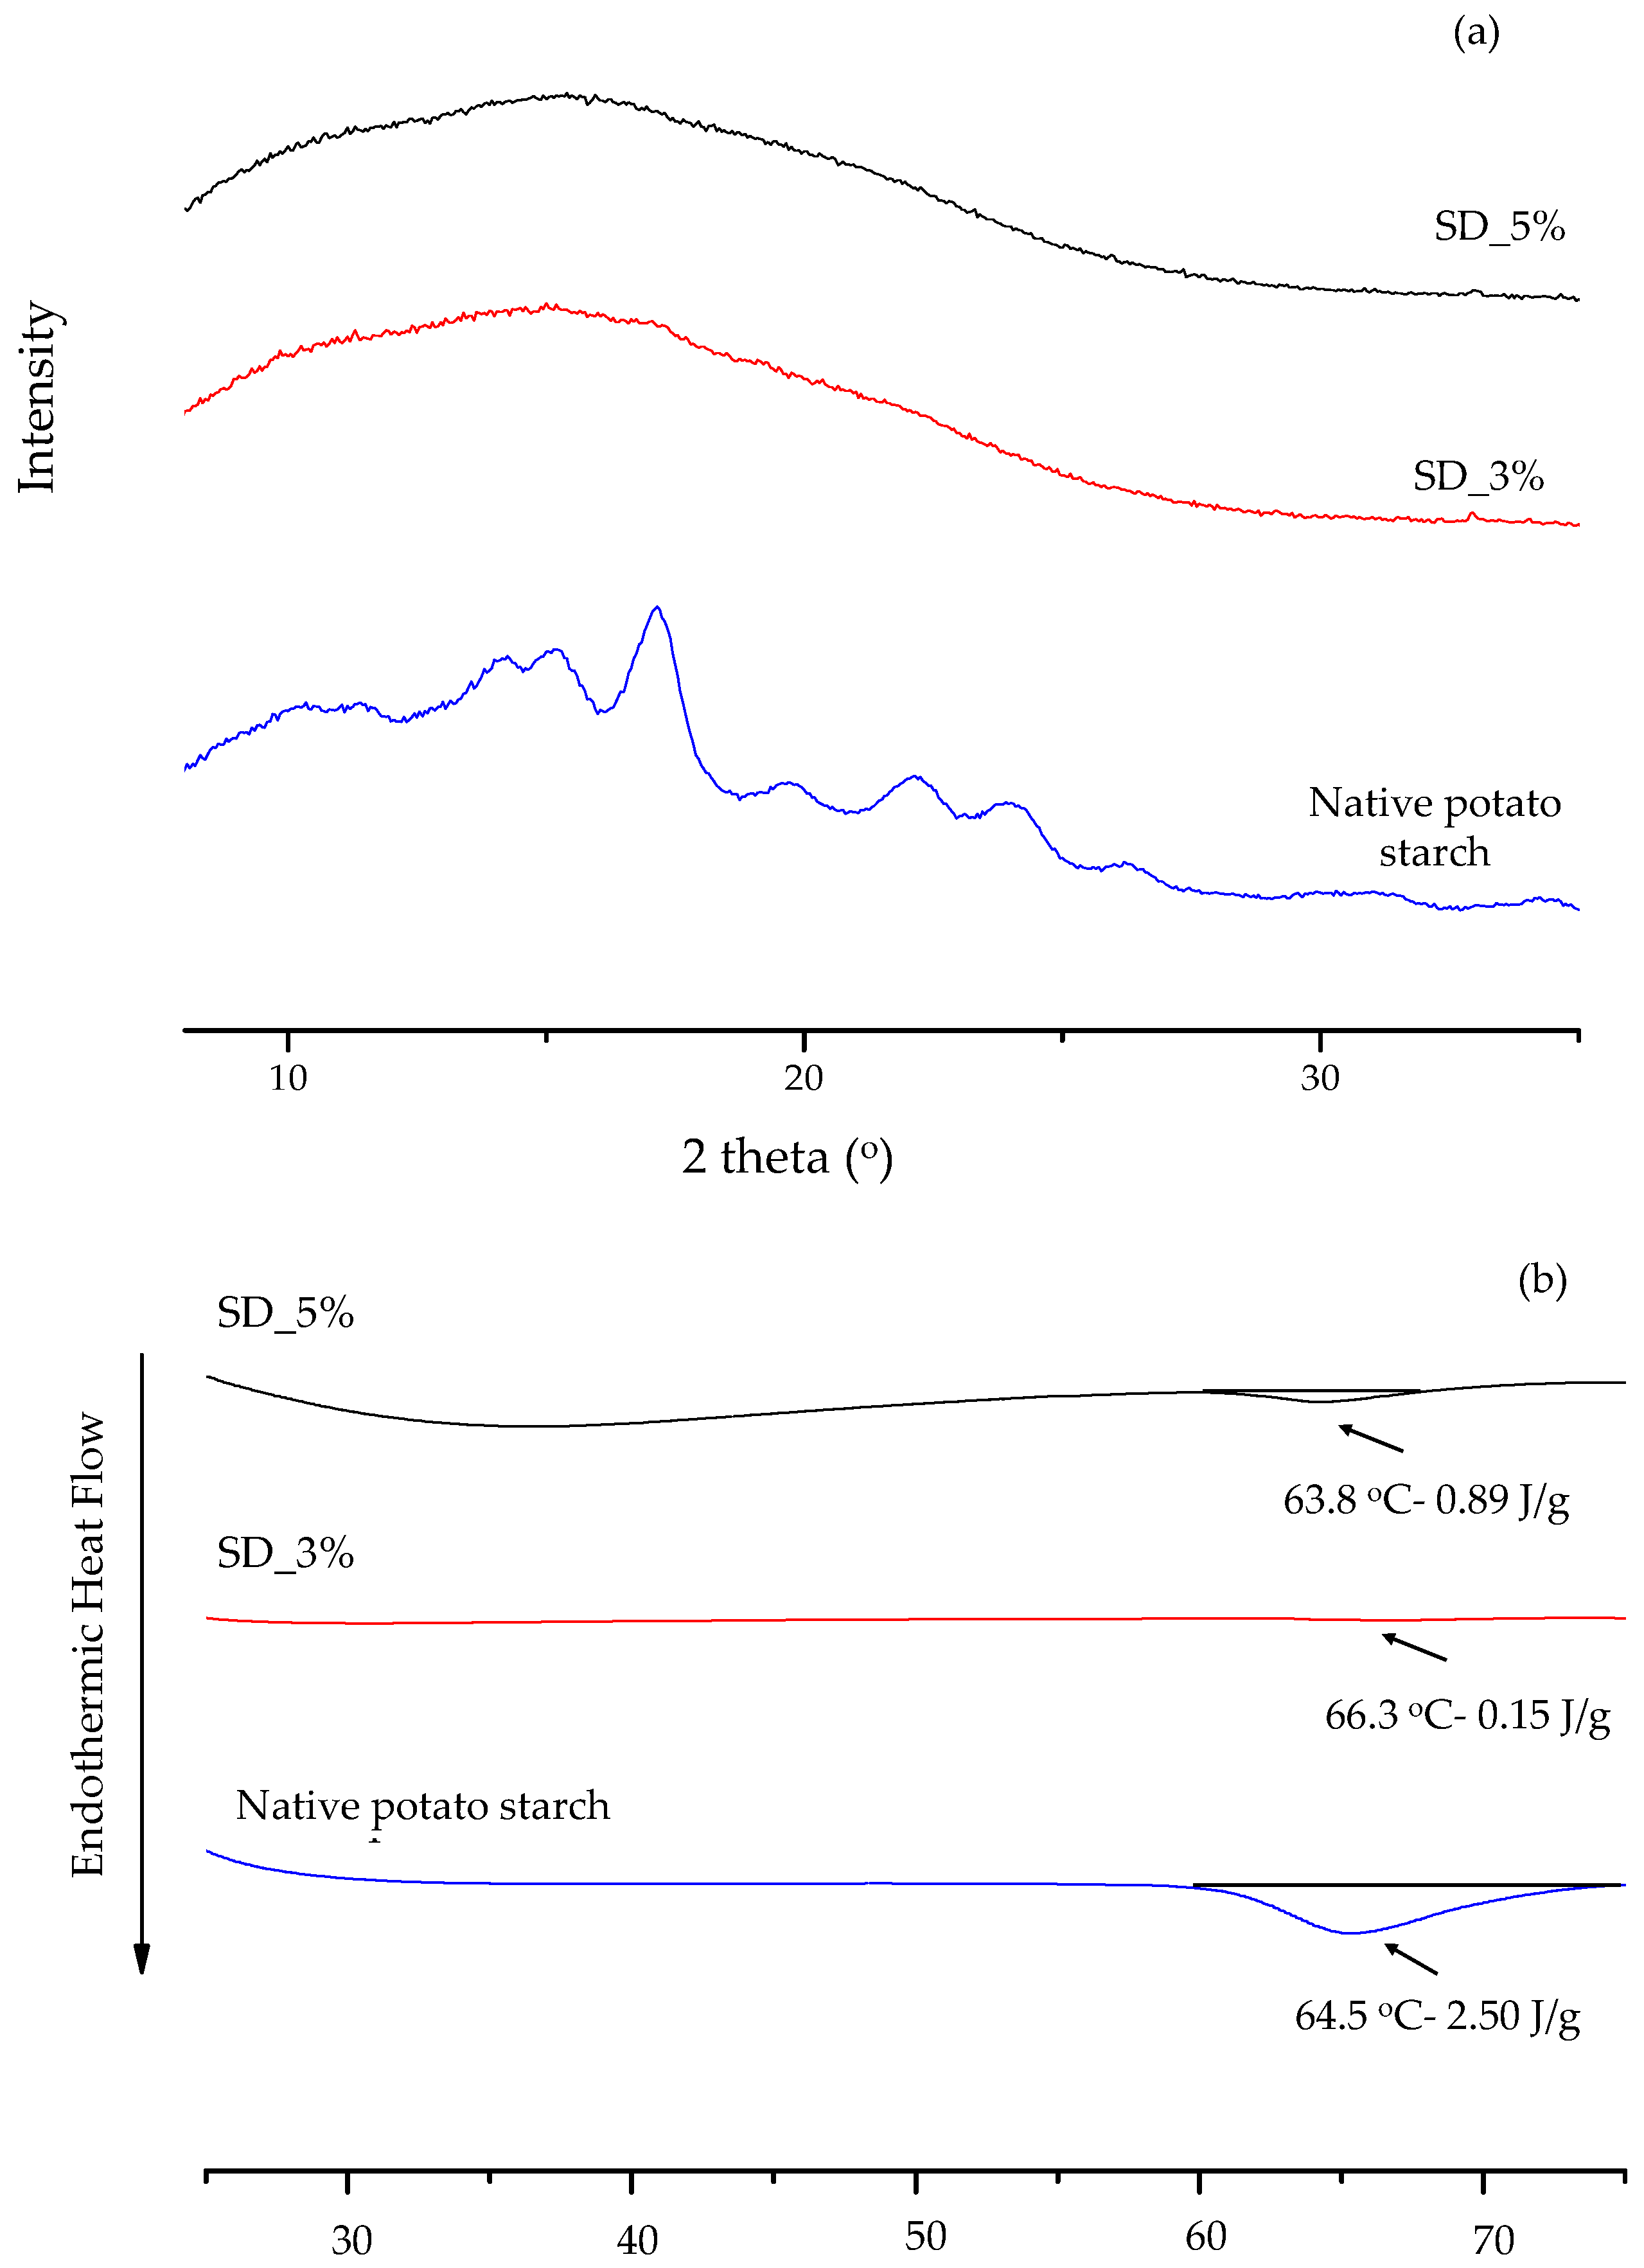
2.3. X-Ray Diffraction (XRD) and Differential Scanning Calorimetry (DSC)

X-ray analysis was carried out using a MiniFlex II XRD system (Rigaku Co., Tokyo, Japan) with Cu Ka radiation (0.154 nm), covering a 2θ range from 5° to 50° and a scanning rate of 1° min−1. Differential scanning calorimetry (DSC) was conducted using a Perkin-Elmer DSC 6 (Perkin-Elmer, Shelton, CT, USA) calorimeter, calibrated with indium as the standard. About 6 mg of the sample (dry basis) was placed into pre-weighted aluminum pans (20 μL capacity), and 12 μL of distilled water was added using a micro syringe. The samples were heated from 30 to 80 °C at a rate of 10 °C/min.

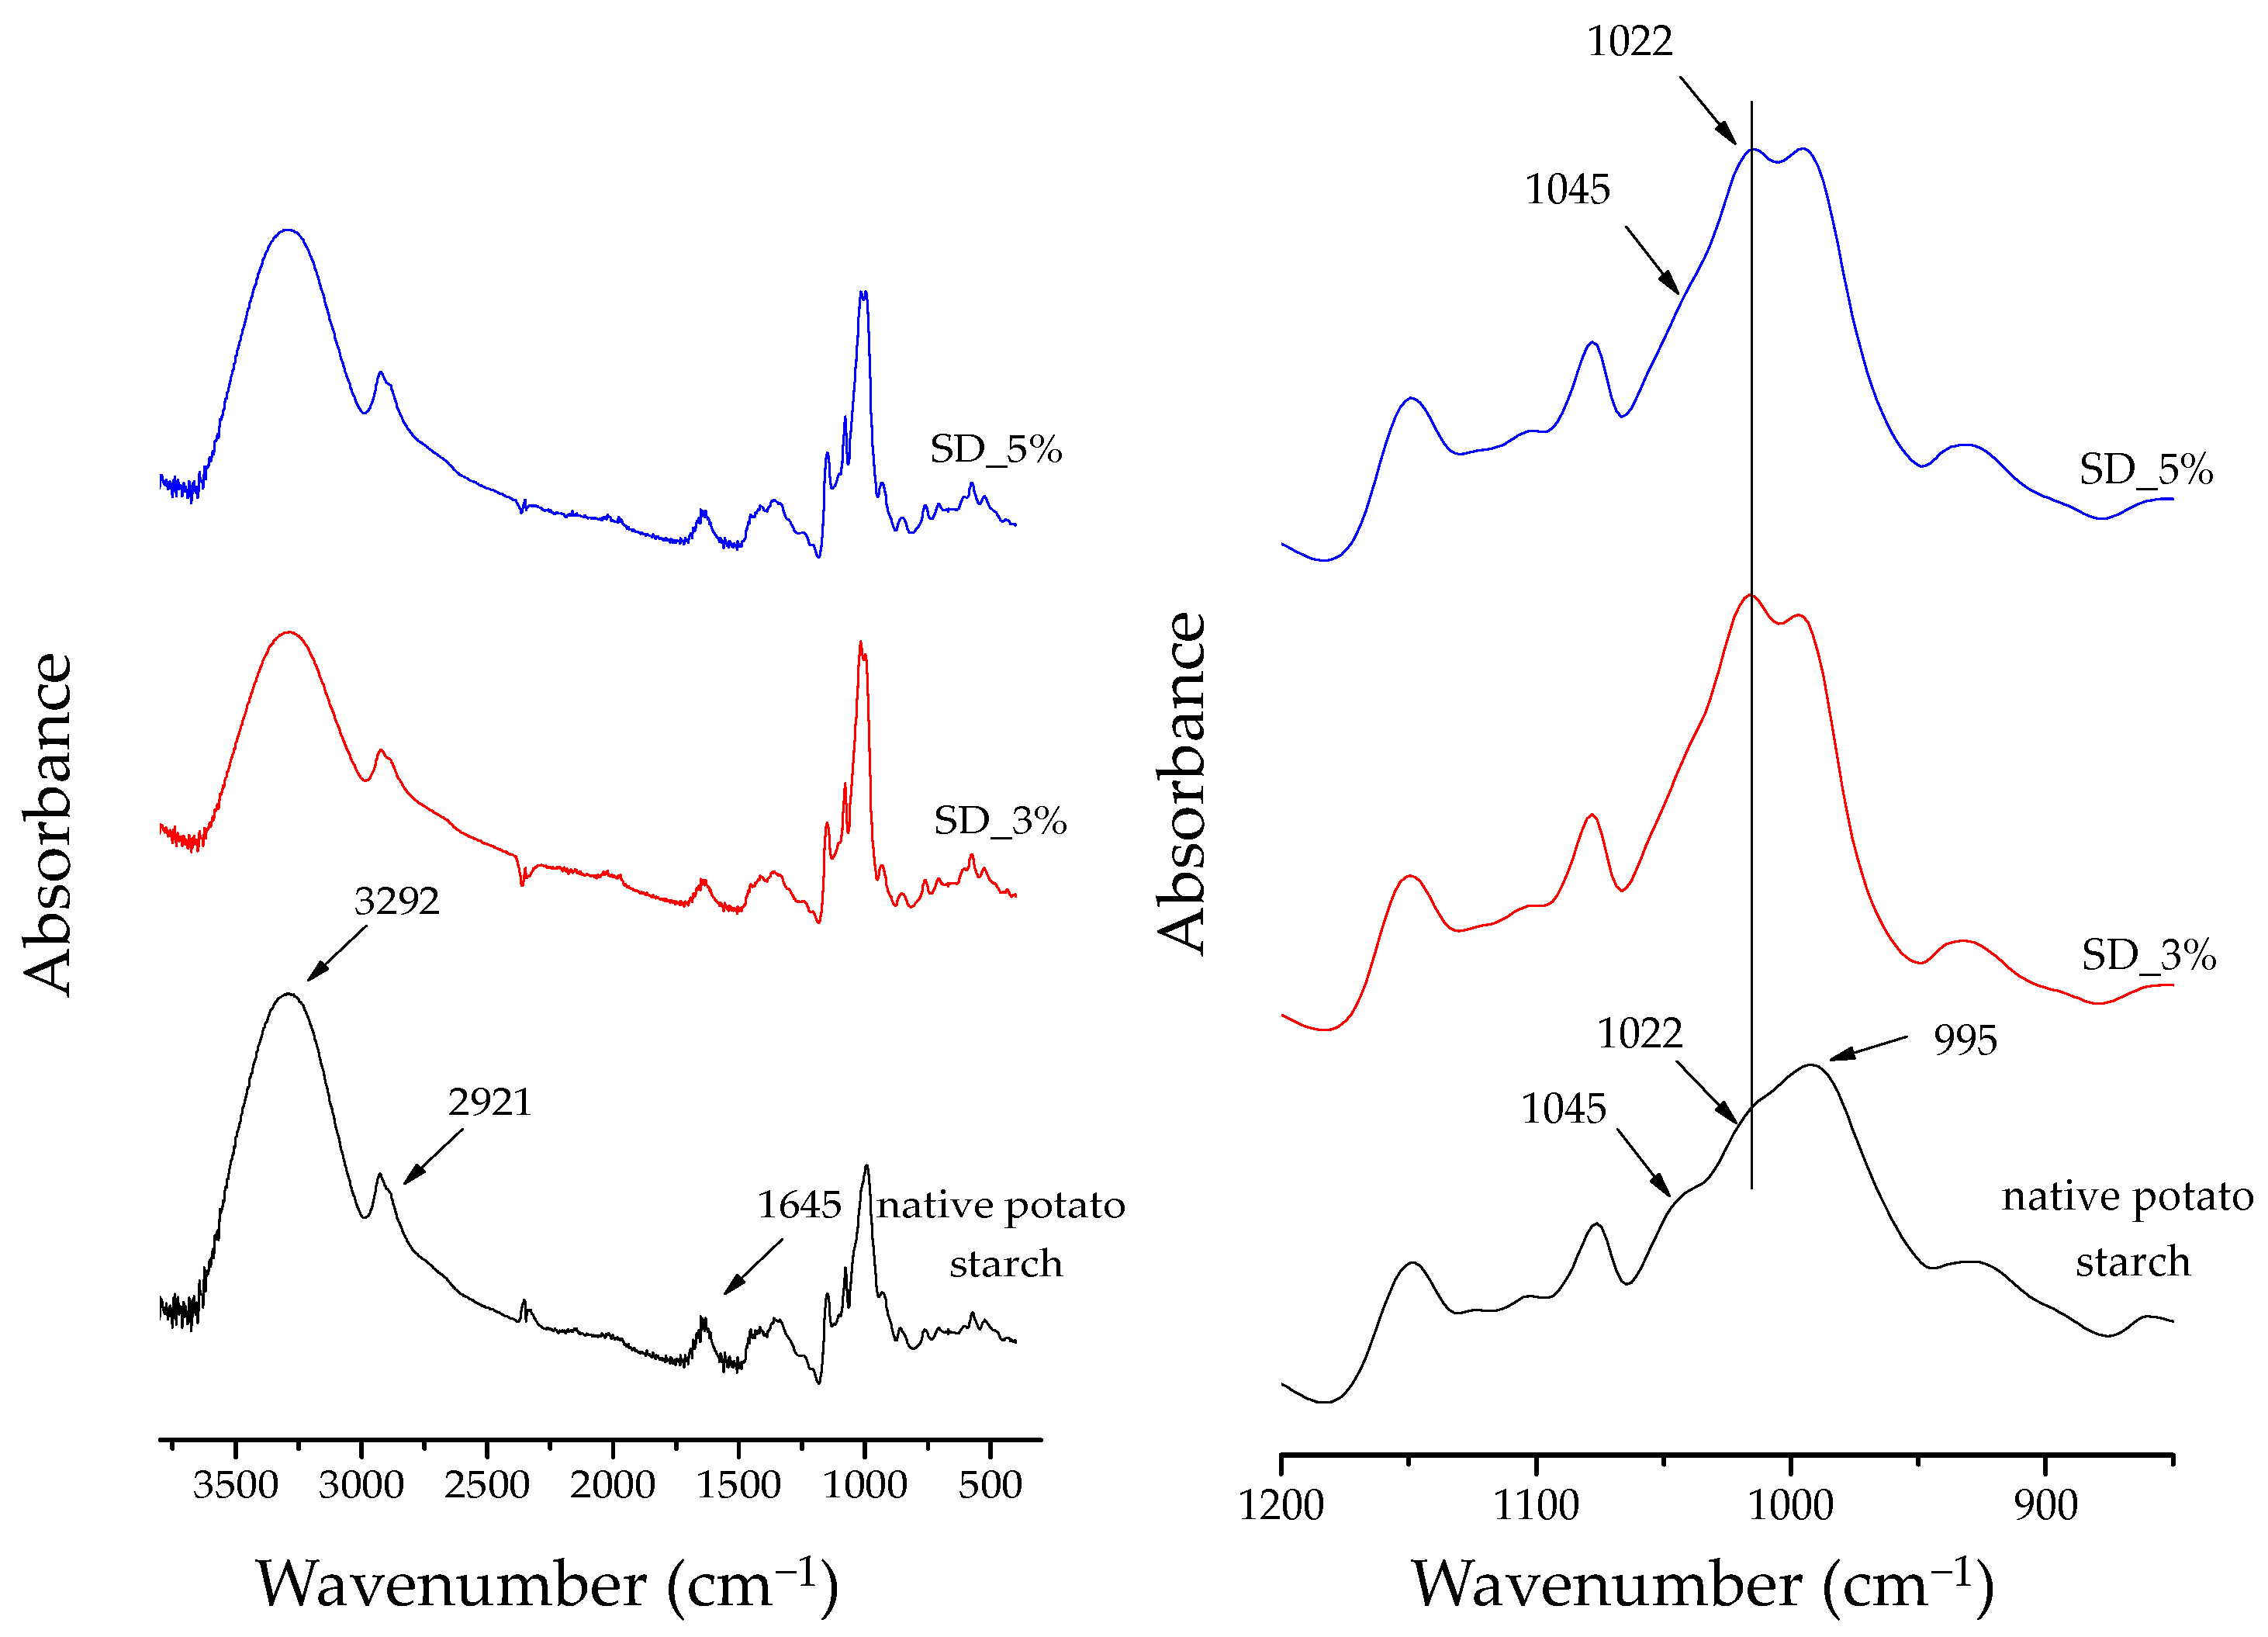
2.4. Fourier-Transform Infrared Spectroscopy (FTIR)

FTIR spectra of the powders were obtained using a Thermo Nicolet 380 IR Spectrometer, with a SmartOrbit reflection accessory (Thermo Electron Corporation, Madison, WI, USA), in the spectral range of 400 cm−1 to 4000 cm−1.

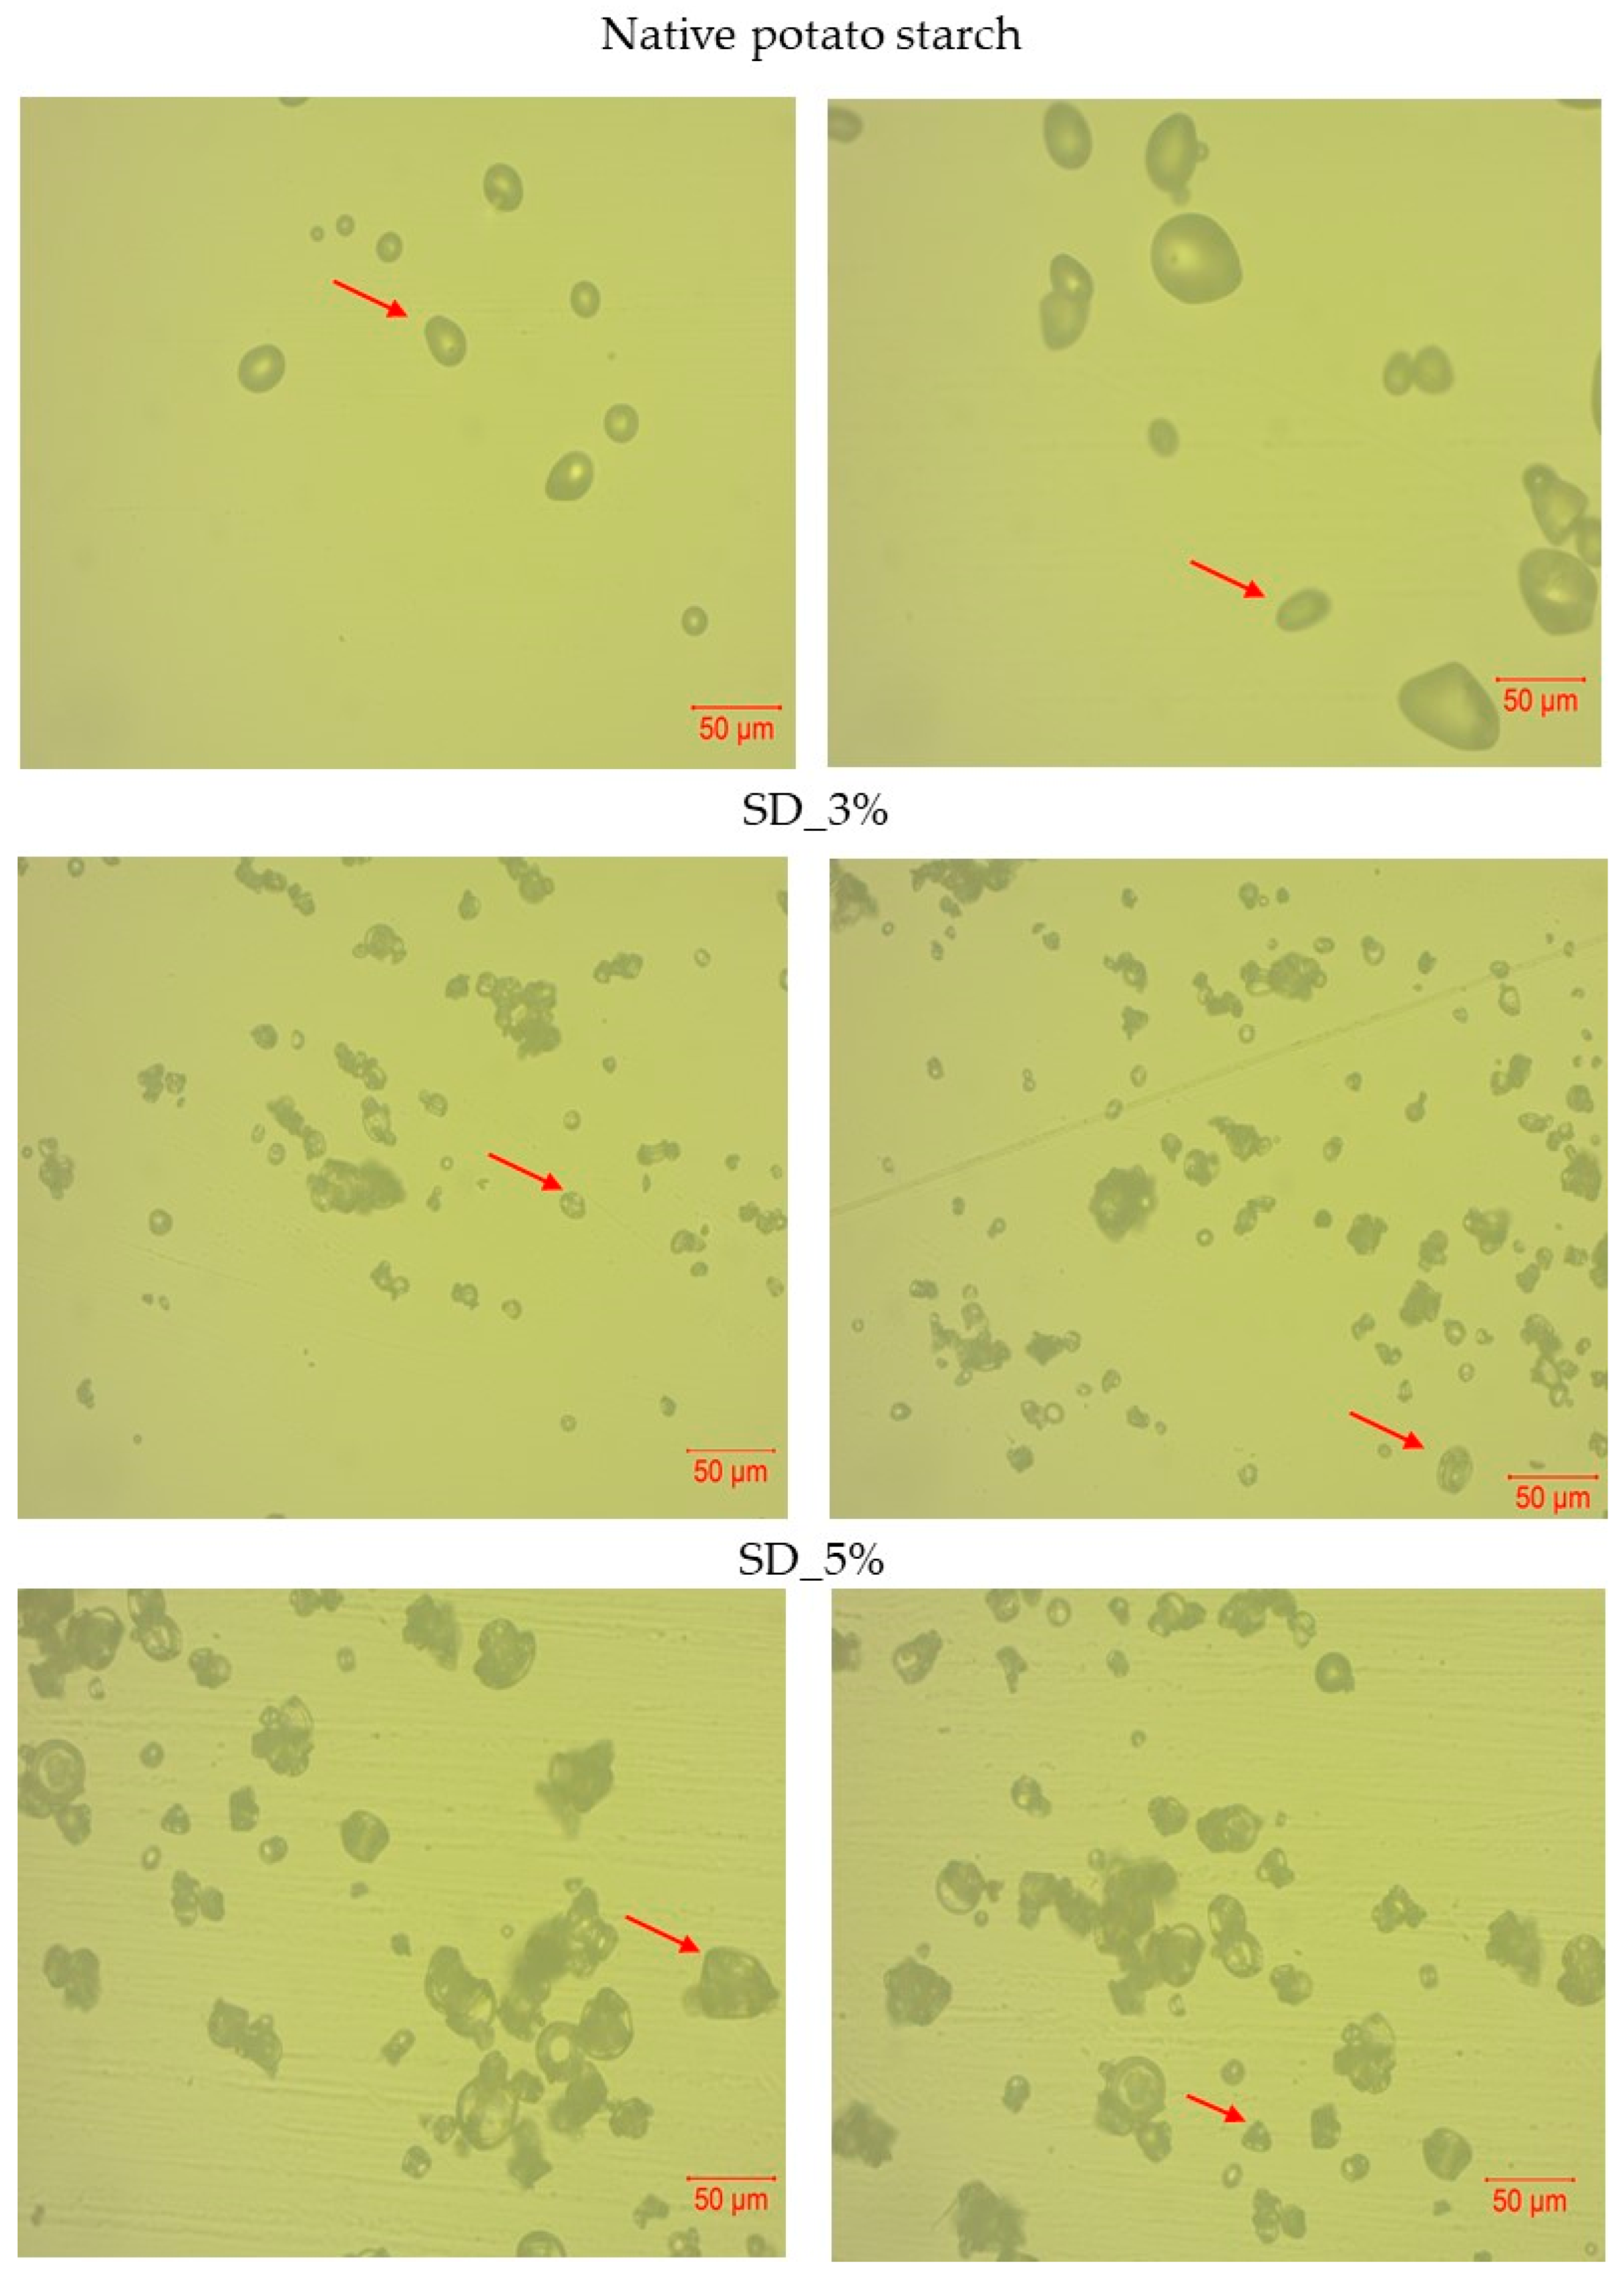
2.5. Optical Microscopy

The morphology of the powders was examined using a Zeiss LSM 700 confocal laser scanning microscope (Carl Zeiss, CZ Microscopy GmbH, Jena, Germany) in optical mode with a 20× objective lens.

2.6. Physical Properties

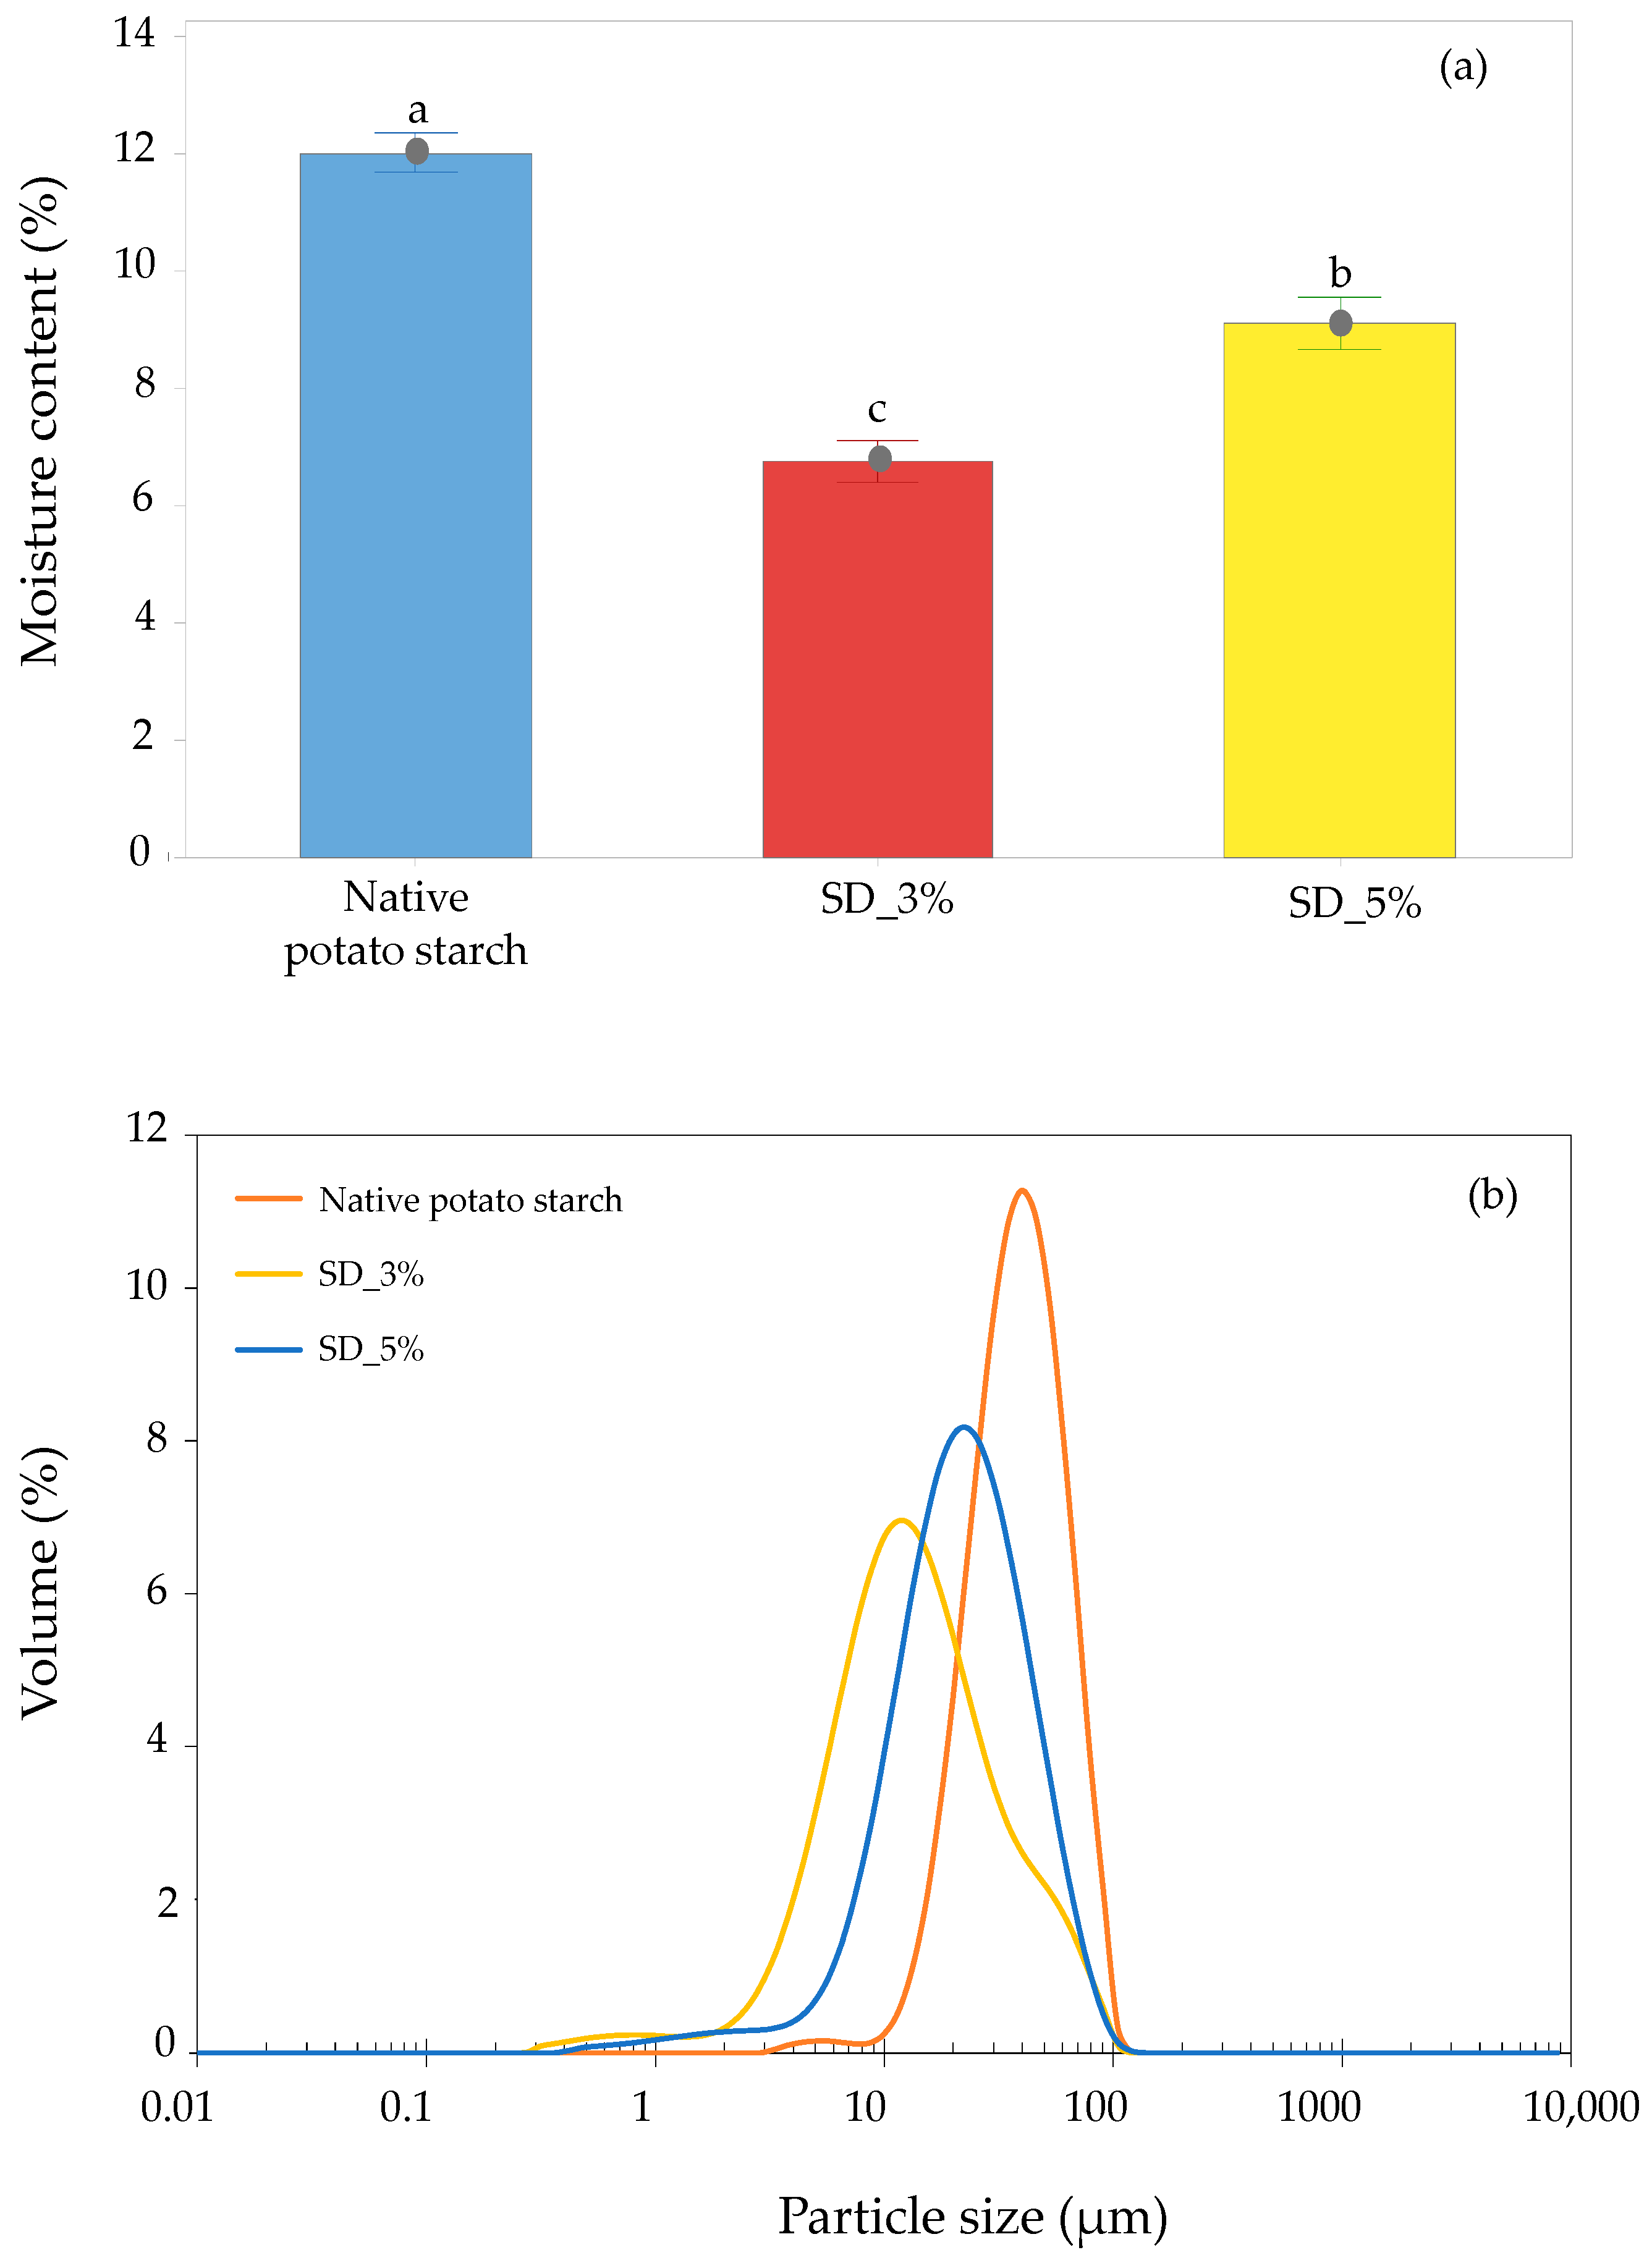
2.6.1. Moisture Content

The moisture content of the native potato starch and spray-dried starch powders at concentrations of 3% (w/w) and 5% (w/w) was measured gravimetrically following the AOAC standard method [26].

2.6.2. Particle Size Distribution

The particle size of the powders was determined using a laser diffraction particle size analyzer (Mastersizer 2000, Malvern Instruments Ltd., Worcestershire, UK) equipped with a Sirocco 2000 dry powder sample dispersion accessory. The refractive index was set to 1.53, the absorption index was 0.1, the vibration feed rate was set to 20%, and the dispersion air pressure was set at 2.0 bar to achieve efficient deagglomeration of particles. The particle size distribution parameters measured were span [width of the distribution], uniformity [absolute deviation from the median absolute deviation from the median], D(4.3) [volume mean diameter], and D(3.2) [surface area mean diameter] and D(0.1), D(0.9), and D(0.5) represent the particle sizes at which 10%, 90%, and 50% of the sample mass consists of particles smaller than these values, respectively [27,28].

2.6.3. Color Analysis

The color of the powders was determined using a non-contact imaging spectrophotometer (MetaVue VS3200, X-Rite, Grand Rapids, MI, USA). The crumb color parameters including lightness [L*], a*, b*, whiteness index (WI), yellowness index (YI), hue angle [H°], and chroma [C*] were determined. Lightness ranges from 0 (black) to 100 (white); a* ranges from −60 (greenness) to +60 (redness); and b* ranges from −60 (blueness) to +60 (yellowness). The yellowness index and the whiteness index are used to describe the color change in a sample from clear or white to yellow and the degree of whiteness, respectively. Chroma is the measure of color saturation, and hue angle is a quantitative measure of color [29,30].

2.6.4. Bulk and Tapped Density

The bulk density of the powders was measured by the volume occupied by a 5 g powder sample in a 50 mL graduated cylinder. Tapped density was calculated after tapping the same cylinder by hand 30 times [31].

2.6.5. Flowability and Cohesiveness

Flowability and cohesiveness of the powder were evaluated using the Carr index (CI) [32] and Hausner ratio (HR) [33], respectively, based on the following equations:
C a r r   i n d e x % = T a p p e d   d e n s i t y B u l k   d e n s i t y T a p p e d   d e n s i t y × 100
H a u s n e r   r a t i o = T a p p e d   d e n s i t y B u l k   d e n s i t y
Carr index >25% indicates poor flowability, while Hausner ratio >1.4 signifies high cohesiveness [34].

2.6.6. Water Holding Capacity

Water holding capacity (WHC) was measured using the method of Rana et al. [35] and Ladjevardi et al. [36], with some modification. Approximately, 5 g of powder was dispersed into 30 mL of distilled water in a centrifuge bottle. The bottles were allowed to rest for 30 min and centrifuged at 4200× g for 30 min. Then, the supernatant was discarded. The water holding capacity (WHC) was expressed as grams of water held per gram of powder.

2.6.7. Hygroscopicity

Hygroscopicity was determined following the method of Cai and Corke [37] with some modifications. Approximately, 1 g of the powder was placed in open plastic cups. Then, the plastic cups were placed in a desiccator containing water (100% RH, 25 °C), saturated in solution of NaCl (75.3% RH, 25 °C) or PI (68.8% RH, 25 °C). After 1 day of storage, the cups were weighed, and the hygroscopicity was expressed as the percentage of moisture absorption to the initial weight of the powders.

2.7. Statistical Analysis

Five measurements were made for each experimental method. The results were analyzed using one-way analysis of variance (ANOVA) and a Tukey’s multiple comparison to evaluate statistically significant differences among the means at a 95% confidence level. Principal component analysis (PCA) was applied to study the relationship among the physical properties of powders. The data were analyzed using Minitab 18 Statistical Software (Minitab Inc., State College, PA, USA).

3. Results

3.1. X-Ray Diffraction Analysis (XRD) and Differential Scanning Calorimetry (DSC)

X-ray analysis and differential scanning calorimetry were conducted out to investigate the structural characteristics of the native potato starch and spray-dried starch powders. Typical diffractograms of native potato starch and spray-dried starch powders at concentrations of 3% [SD_3%] and 5% [SD_5%] are presented in Figure 1a. XRD analysis revealed significant structural changes in the native potato starch and spray-dried starch powders. The diffractogram of native potato starch displayed reflection peaks at approximately 14, 15, 17, 22, and 24°, which correspond to the ordered-crystalline structure of B-type of starch [38]. On the contrary, in the diffractogram of spray-dried starch powders, the aforementioned peaks disappeared, and instead, a broad peak appeared at around 15°, indicating that the gelatinization and the extremely rapid (app. 10 s) drying process resulted in the formation of semi-crystalline to amorphous structure powders. This could be attributed to the heat treatment of the starch, which disrupted the molecular order by altering the intermolecular interactions [15] and to the drying process by causing rapid evaporation of water from the droplets [16,17,18,19], which inhibited the mobility of the starch molecules, preventing them from organizing into crystallites. Thus, the quick removal of water molecules from the starch solution, along with the disruption of the starch granules, resulted in the formation of an amorphous structure. Similar results were found in the case of spray-dried starch complexes, where the spray-drying process resulted in the formation of powders with limited crystallinity [16,17,18]. A decrease in the crystallinity in spray-dried samples was also reported by other researchers [20,22]. Therefore, XRD analysis revealed that the spray-drying process modified the crystalline structure of native potato starch, leading to the formation of an amorphous state.
Figure 1b shows the DSC thermograms of native potato starch and spray-dried potato starch powders at concentrations of 3% [SD_3%] and 5% [SD_5%]. The endotherms of the spray-dried powders were comparatively lower than those of the native starch. In the DSC thermogram of native potato starch, there is a peak at 64.5 °C with an enthalpy change (ΔH) of 2.50 J/g. On the other hand, the spray-dried starch potato powders exhibited a peak at 66.3 °C with ΔH values of 0.15 J/g [SD_3%] and at 63.8 °C with ΔH values of 0.89 J/g [SD_5%]. High gelatinization temperatures and ΔH values typically reflect a more ordered crystalline molecular structure [39]. Therefore, the low ΔH values in the spray-dried starch powders indicate a reduction in the crystallinity of the starches, promoting the formation of a more amorphous structure. These results are consistent with the findings obtained from other researchers [22]. Thus, DSC analysis revealed the semi-crystalline to amorphous nature of the spray-dried starch powders and further verified the results obtained from XRD analysis.

3.2. Fourier Transform Infrared Spectroscopy (FTIR)

FTIR was conducted to examine the molecular structure of the native and spray-dried potato starch powders. Figure 2 shows the FTIR spectra of native starch and of spray-dried powders at concentrations of 3% [SD_3%] and 5% [SD_5%] in 3800–300 cm−1 region and in 1200–850 cm−1 region. The FTIR spectra of native potato starch and spray-dried starch powders revealed the presence of characteristic peaks associated with specific molecular vibrations and interactions. In detail, the absorbance peak in the range of 3600–3200 cm−1 is attributed to the stretching vibration of OH groups, indicating the hydrogen bonding between starch and water molecules [40,41]. In the FTIR spectra of native potato starch, the broad OH- stretching band shows the highest intensity, reflecting the presence of stronger hydrogen bonds, compared to the other samples. A similar observation was reported by Pozo et al. [42]. The peak at 2928 cm−1 is attributed to the asymmetric C-H vibration of the methyl group [43], while the peak at 1645 cm−1 corresponds to the water molecules within the starch [44]. The peaks in the 820–1280 cm−1 region are associated with the C-O and C-C stretching vibration [44]. The peaks at 1045 cm−1 and 995 cm−1 are characteristic of the crystalline structure of starch, while the peak at 1022 cm−1 represents the amorphous region of starch [45]. As shown in Figure 2, these peaks are distinct in the FTIR spectra of all powders. However, the intensity of the peak at 1022 cm−1 is higher in spray-dried starch powders compared to native potato starch. These differences could be attributed to the gelatinization and drying process, which likely resulted in the disruption of the intermolecular bonds within the starch granules leading to a decrease in the crystalline state and an increase in the amorphous structure. Tiozon et al. [46] also reported a similar observation using synchrotron FTIR spectroscopy.

3.3. Optical Microscopy

The morphology of native potato starch and spray-dried starch powders at concentrations of 3% [SD_3%] and 5% [SD_5%] was examined using optical microscopy. Figure 3 shows the optical images of native potato starch and spray-dried starch powders. As shown in Figure 3, the starch granules of native potato starch were spherical in shape with a smooth surface [47], while in the spray-dried starch powders, the starch granules were shriveled and displayed wrinkles [48]. The size of the droplets could affect the morphology of the particles, i.e., smaller droplets tend to form wrinkled particles, while larger droplets result in a hollow structure [49]. These changes in the morphology of the samples indicate that the gelatinization and drying process likely caused a disruption of the crystalline regions in the spray-dried starch powders, leading to the formation of powders with a more amorphous structure. Many researchers have reported similar morphological characteristics in spray-dried starches [15,50]. It can be inferred that the differences in the structural and morphological characteristics between native potato starch and spray-dried starch powders are expected to affect their physical properties.

3.4. Moisture and Particle Size Analysis

Moisture content is an important factor that affects the quality and stability of the powder [51]. According to Figure 4a, native potato starch exhibited the highest moisture content values. In detail, the moisture content of native starch was significantly higher than that of the spray-dried starch powders. That is, at an inlet temperature of 220 °C, the temperature gradient between the hot air and liquid feed is increased, which in turn would reduce the final moisture content [52]. The results showed that the spray-dried powders with 5% starch concentration had a higher moisture content compared to those with 3% starch concentration. This is likely assigned to the increased viscosity of the starch solution, which affects droplet formation and the moisture evaporation during drying. Probably, the increased viscosity of the SD_5% starch solution caused the formation of larger droplets with a lower surface area, reducing moisture evaporation and resulting in greater retention in the final products. On the contrary, in the case of the SD_3% powder, smaller droplets were formed with a higher surface area, favoring the evaporation of water. During atomization, feed solutions with high viscosity generally result in the formation of larger particles, as postulated by Koc et al. [53]. However, it should be noted that the hydrophilic nature of starches prevents the evaporation of water during drying. Thus, it can be implied that the moisture content of the spray-dried powders could be affected by their particle size and hydrophilic nature.
The particle size distribution of the native potato starch and spray-dried starch powders at concentrations of 3% and 5% are presented in Figure 4b, while the particle size parameters, including span, uniformity, specific surface area, D(4.3), D(3.2), D(0.1), D(0.5), and D(0.9), are shown in Table 2. Statistical analysis revealed significant differences among the particle size parameters of the native potato starch and spray-dried powders. All samples exhibited different span and uniformity values, indicating that the gelatinization and spray-drying processes resulted in the formation of particles with non-uniform sizes. The D(4.3) and D(0.5) values showed that the native starch had the largest particles, while the SD_3% powder had the smallest particles. Similar trends were also observed in the parameters of D(0.1), D(0.5), and D(0.9). Smaller particles, as observed in the spray-dried powders, have a larger surface area, while the larger particles of native starch have a smaller surface area. This was further verified by the high surface area per unit weight values in the spray-dried samples compared to those in the native starch. Besides, SD_5% had lower span values compared to SD_3%, indicating a narrower distribution. The rapid evaporation of water during the spray-drying process likely led to the formation of granules with a wider distribution of particle sizes. The differences in particle size parameters between the native potato starch and spray-dried powders are probably related to the starch concentration and viscosity of starch solution. Thus, the increased feed viscosity could result in increased droplet size distribution and the production of larger particles [54]. A similar observation has been reported by Krishnaiah et al. [55], Jinaport et al. [56], and Ferrari et al. [51]. It should be noted that determining the particle size distribution is necessary for tailoring starch powders for various applications, particularly in the food and pharmaceutical industries. That is, smaller particles can enhance solubility, dispersion, and absorption rates, favoring the use of starch as a thickening agent or in encapsulation systems, while larger particles can improve the flowability, facilitating easier handling, storage, and transportation. As shown in Figure 4b, the native and spray-dried starch powders exhibited a unimodal size distribution, with their peaks shifting to larger particles as the concentration of the starch increased. Jinaport et al. [56] also reported similar results in soymilk powders and indicated that the solids content mainly affects the mean particle sizes, with a smaller effect on the size distribution of the spray-dried powders. Therefore, the significant changes observed among the spray-dried powders can be attributed to the viscosity of the starch solution and the operating conditions applied during the spray-drying process, indicating that the higher viscosity can affect the structural and physical properties of the starch. This was further supported by the results obtained from our previous studies on starch inclusion complexes [17,19,57].

3.5. Color Analysis

Color parameters, including lightness [L*], a*, b* values, whiteness index [WI], yellowness index [YI], C* (chroma), and H* (hue angle) values, are shown in Table 3. Native potato starch and spray-dried starch powders showed similar L* values and yellowness index, indicating that the spray-drying process did not significantly affect these color parameters. Native potato starch exhibited significantly lower b* values than the SD_3% powder, implying that the native starch has a less yellow hue. A similar trend was also found in the chroma [C*] values. Hue angle values for all samples varied from 83 to 92°. Native starch had a yellow–orange hue angle, the SD_3% had a yellow hue angle, while the SD_5% had a light-yellow hue angle, close to yellow–green [58]. These differences could be related to the moisture content in the spray-dried samples, which may affect the color properties of the starch, causing them to appear more greenish. The effect of moisture content on the color of spray-dried and freeze-dried powders has also been reported by Aryaee et al. [59].

3.6. Bulk and Particle Properties

The packaging behavior of the powder, as defined by bulk and tapped density, and the Carr index and Hausner ratio are presented in Table 4. The spray-dried powders exhibited significantly lower bulk and tapped density values compared to native potato starch. The bulk density of a powder is related to the particle size, i.e., the bulk density increases as the particle size decreases [60], but also to the morphology, i.e., particles with a hollower structure have a lower bulk density [49]. However, Rayo et al. [61] reported that powders with very small particle sizes can agglomerate due to electrostatic attraction, resulting in a reduction in bulk and tapped density. Jiang et al. [62] reported that a decrease in particle size led to lower bulk and tapped density, and that the decrease in bulk and tapped density implies an open-packed structure. Probably, the particles in native starch, with a spherical morphology, tend to form a more compact structure, leading to a higher bulk density. On the contrary, the particles in the spray-dried samples, due to their hollow morphology, exhibit a lower bulk density. Regarding the tapped density, the native starch particles can pack more efficiently under tapping due to their uniform size (as shown by span and uniformity values) and thereby more air being occluded between the particles. Nguyen et al. [63] reported that bulk density decreased due to the formation of pores within the particles during the spray-drying process. The Carr index and the Hausner ratio, which measure the flowability and cohesiveness of the powder [56], ranged from 6% to 12% and from 0.8 to 1.2, respectively. The Carr index and Hausner ratio values were lower for the SD_5% powder, indicating very good flowability and low cohesiveness compared to the SD_3%, which had the highest values. The smaller particles in the SD_3% powder probably exhibited stronger inter-particle interactions, resulting in higher cohesion between particles and reduced flowability. Fine particles tend to increase cohesiveness and reduce flowability by forming stronger inter-particle bonds due to their larger surface area. Fitzpatrick et al. [34] found that smaller particles have a larger contact surface area, leading to stronger cohesive forces between the powder particles. Similarly, Koc et al. [64] reported that the spray-dried yogurt powders exhibited poor flowability due to their smaller particle size.
A fitted line plot of the Carr index versus the Hausner ratio is depicted in Figure 5. Based on the regression equation, for every 1-unit increase in the Hausner ratio, the Carr index increases by 72.16 units. This suggests a positive linear relationship between the Carr index and Hausner ratio, indicating that the powders are more cohesive with less flowability.

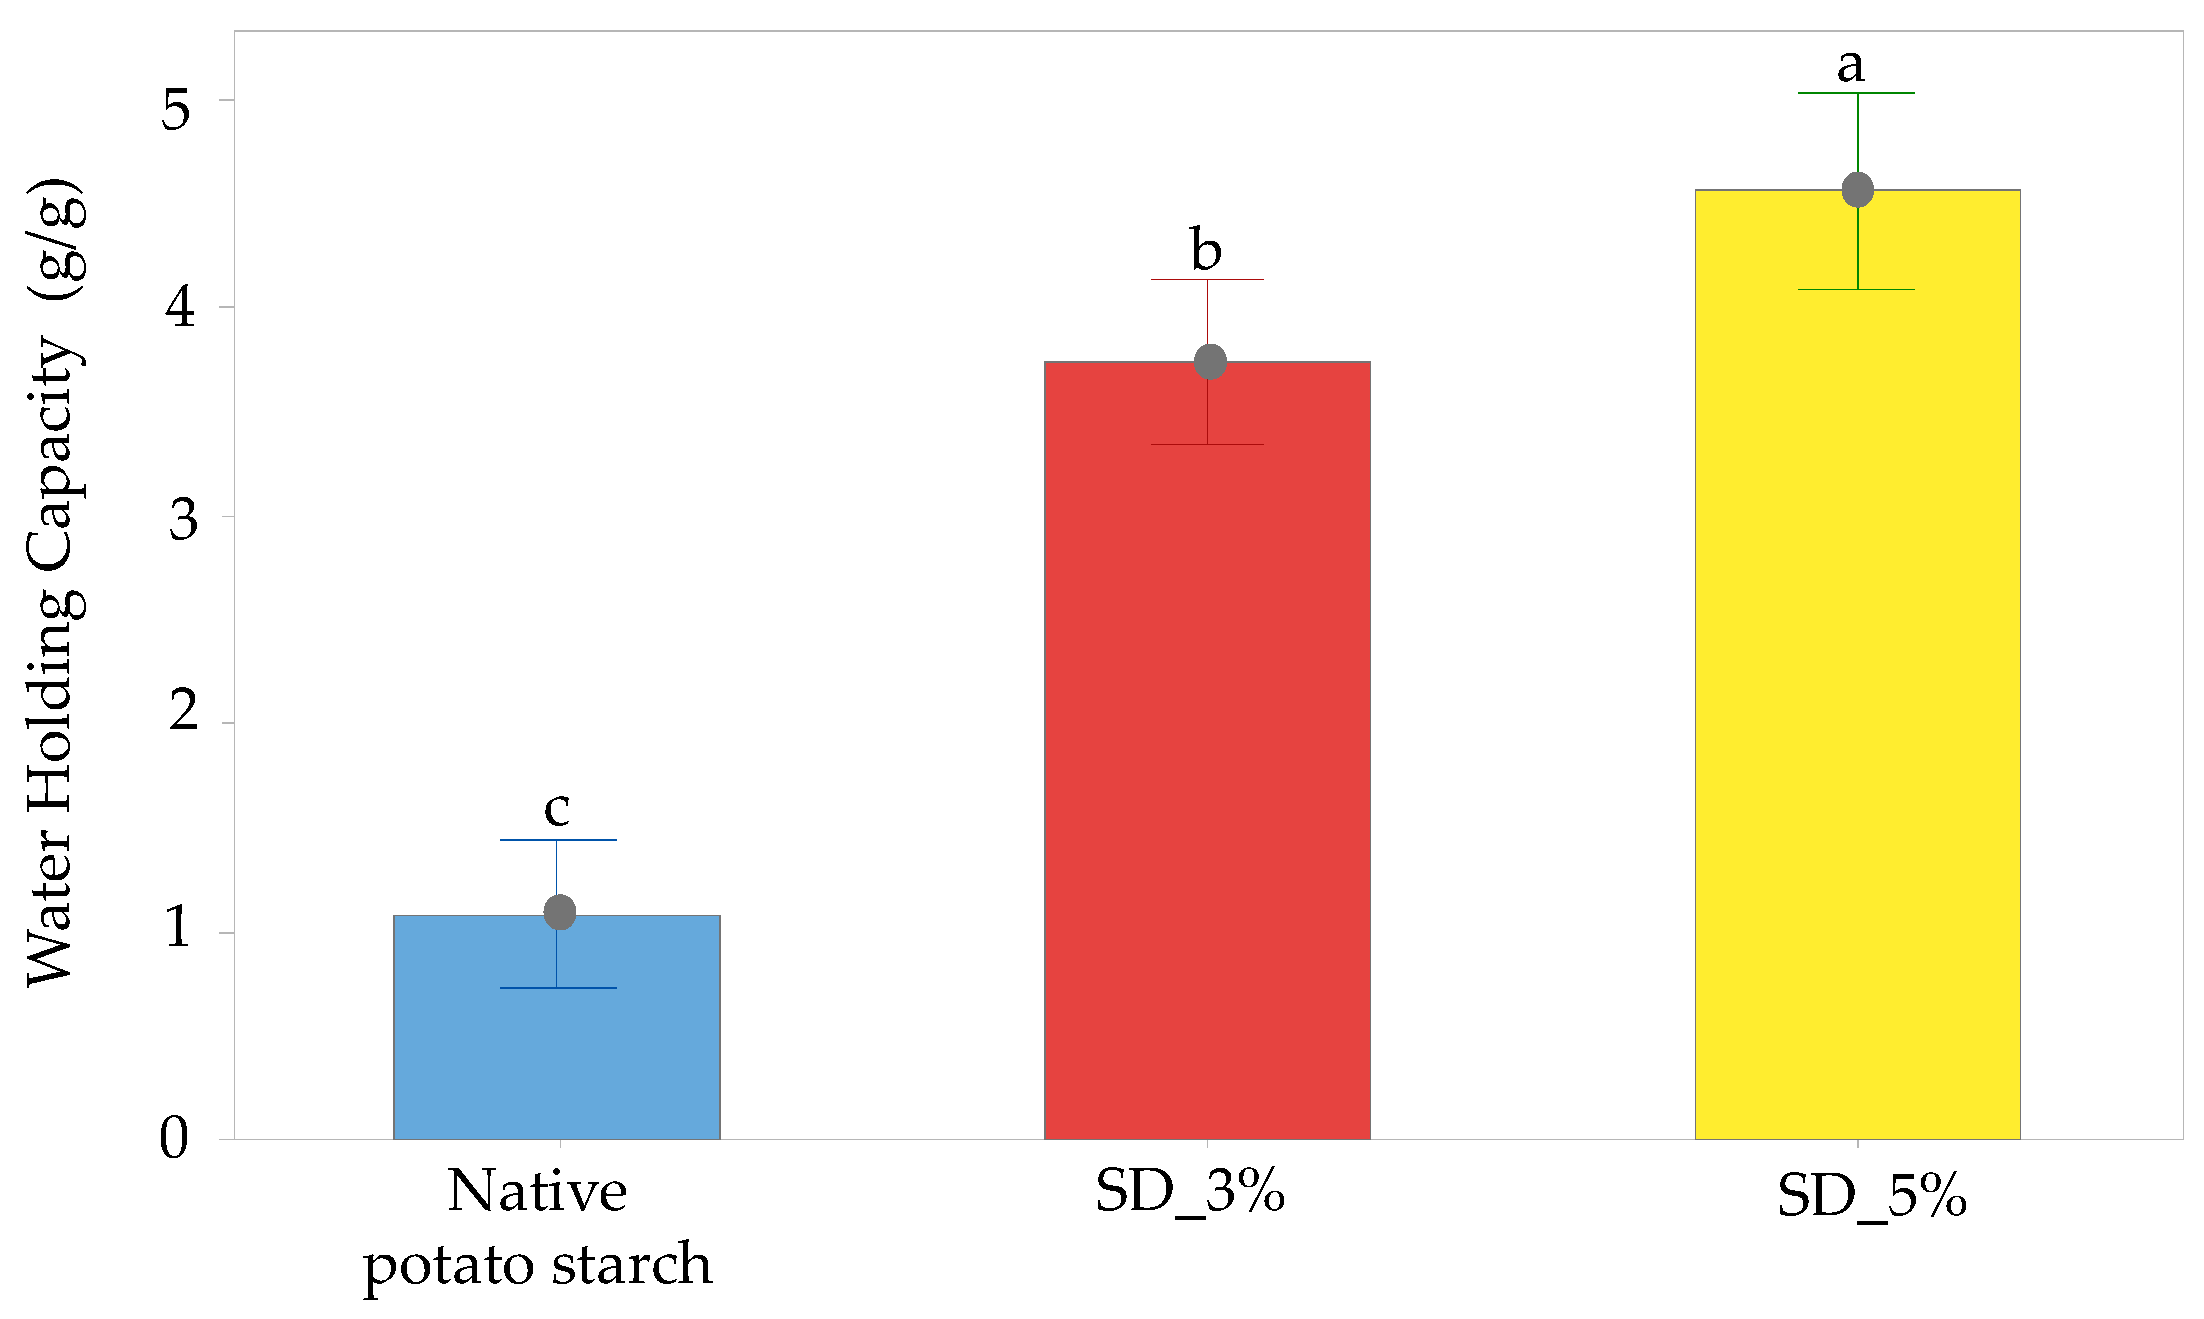
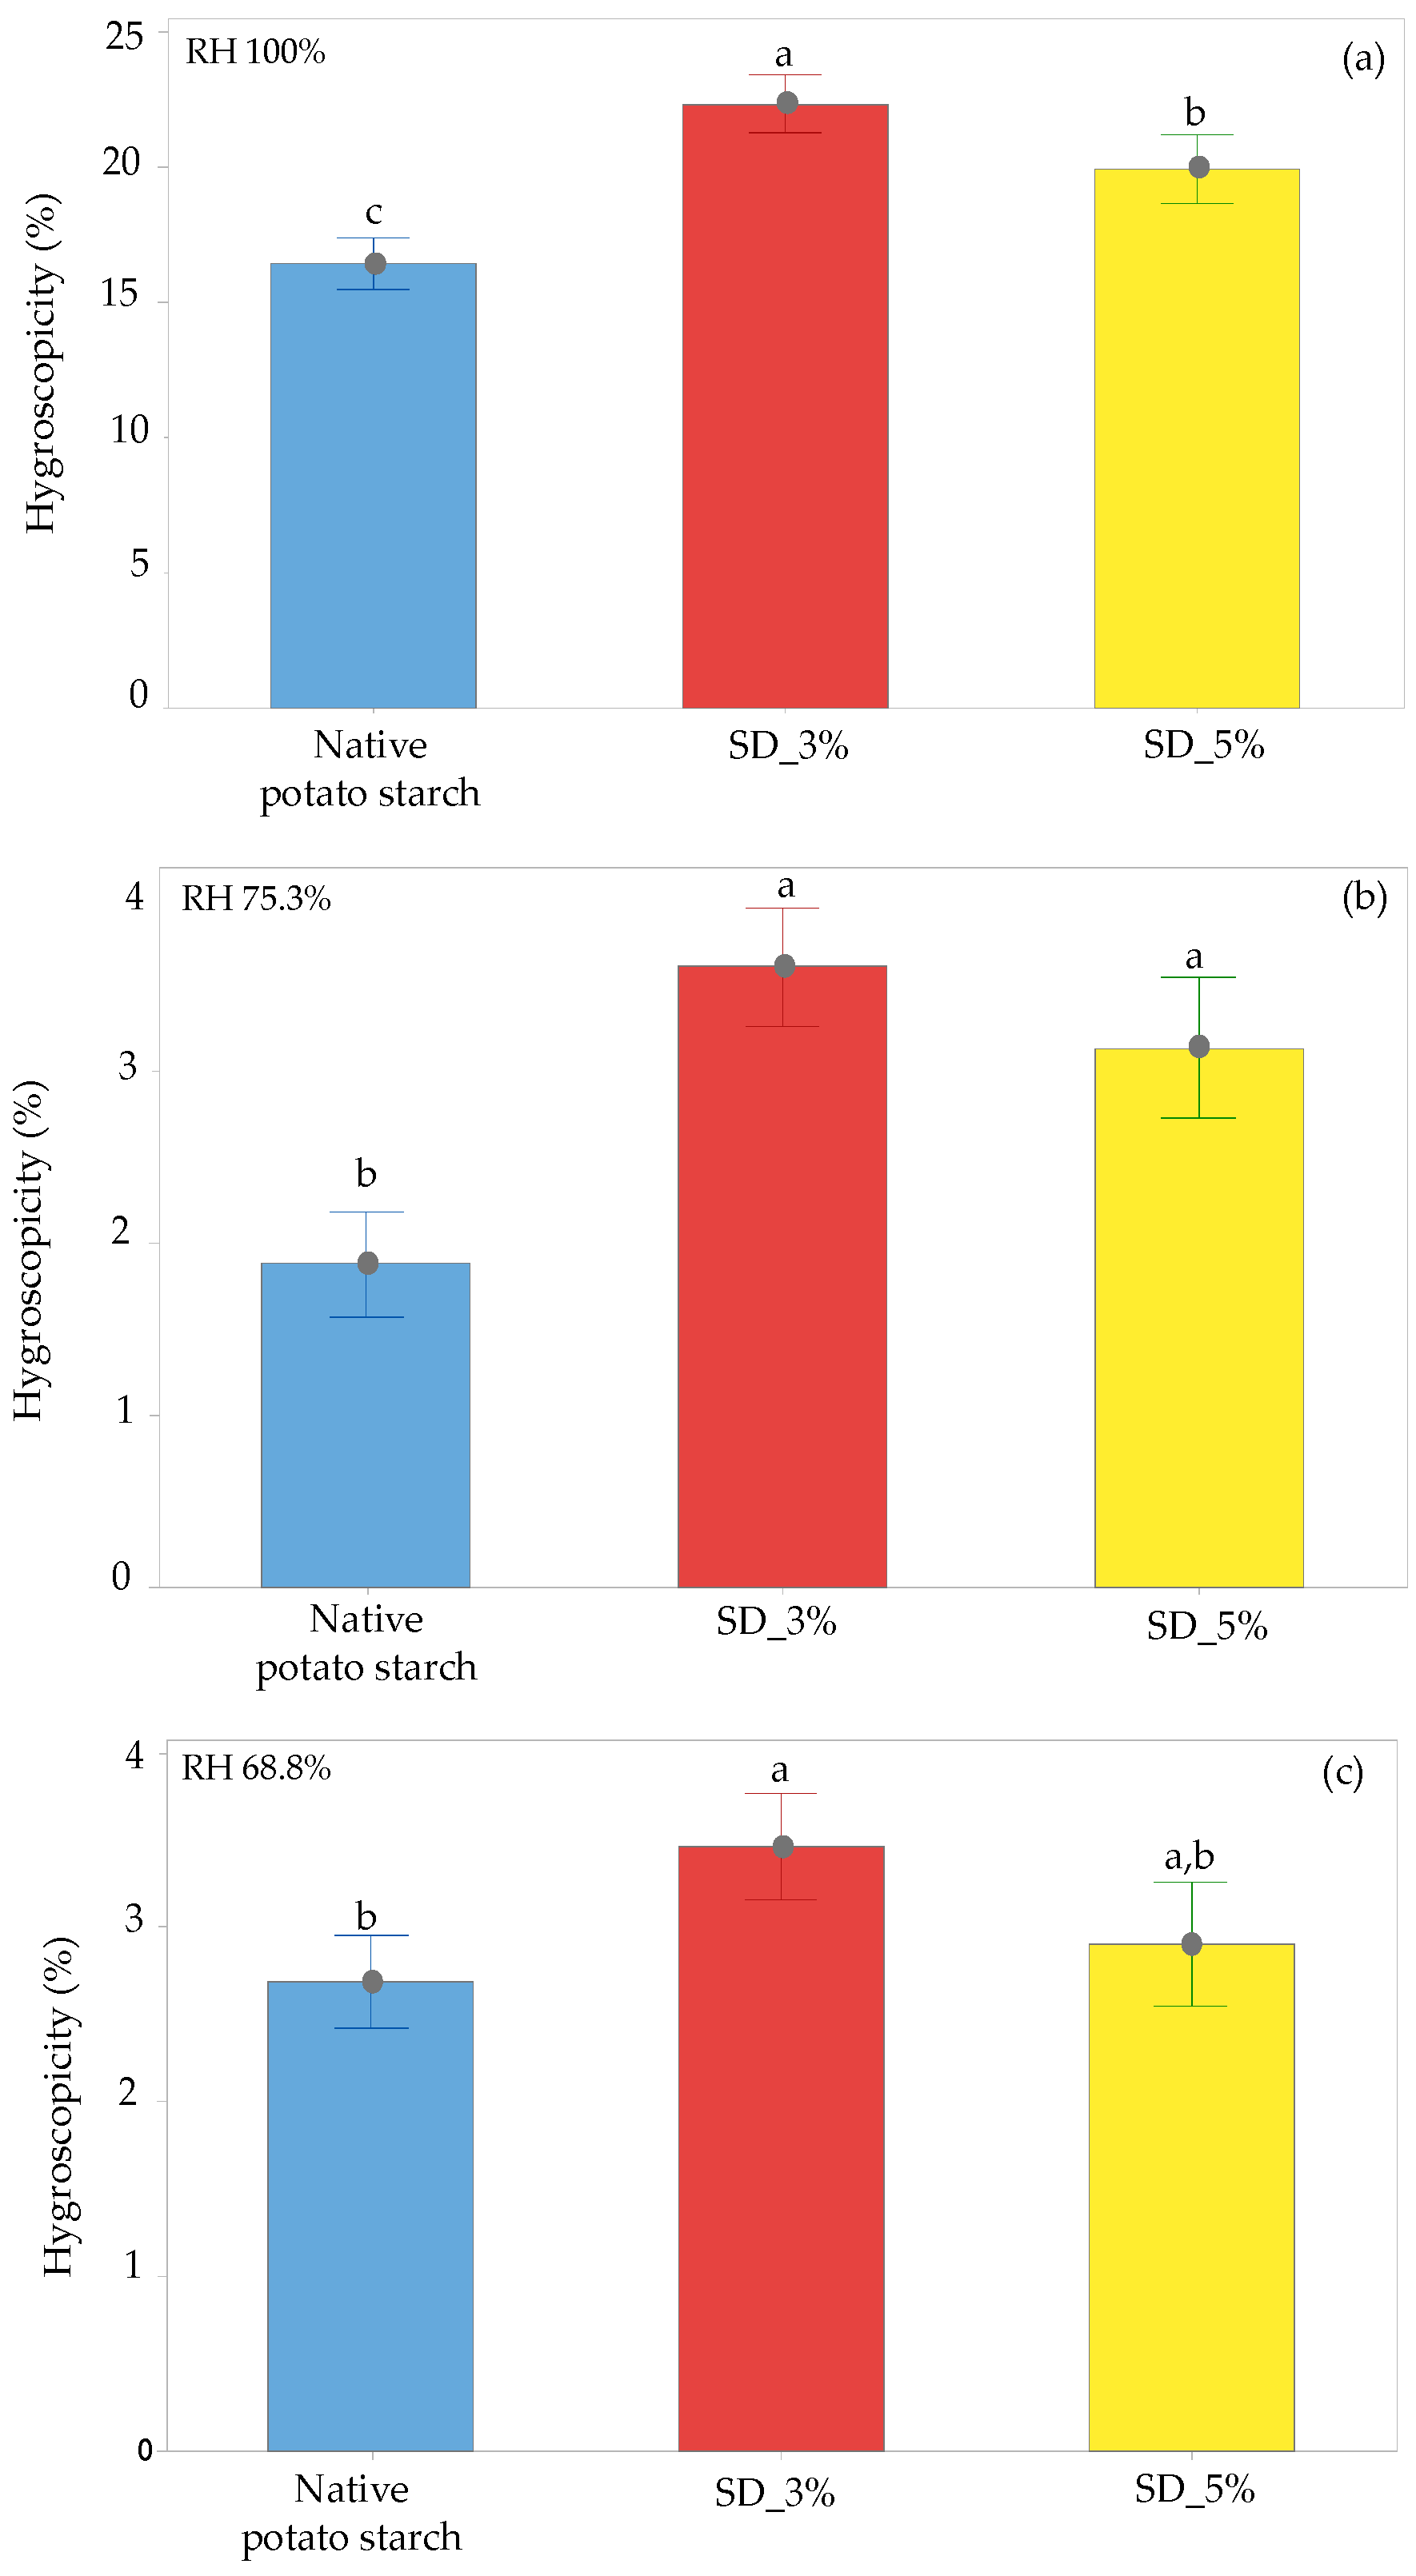
3.7. Water Holding Capacity (WHC) and Hygroscopicity

Figure 6 shows the water holding capacity (WHC) of native potato starch and spray-dried starch powders [SD_3%, SD_5%]. Significant differences were found in the WHC of native potato starch and spray-dried starch powders. In detail, the SD_5% exhibited the highest WHC values, followed by the SD_3% powder, while native potato starch showed the lowest values. The WHC values of SD_3% powder were lower than those of SD_5% powders, indicating that there are fewer available sites for water retention. On the contrary, native potato starch exhibited the lowest WHC values, which could be attributed to the semi-crystalline structure of starch. Fadimu et al. [21] reported that by increasing crystalline regions and decreasing amorphous regions, the water absorption capacity of modified sweet potato starch decreased due to limited water binding sites. Sheng et al. [65] reported that the water binding capacity of starch increased due to the disruption of secondary bonding, e.g., hydrogen bonds in the starch molecular chains during gelatinization.
The hygroscopicity values of native potato starch and spray-dried starch powders at concentrations of 3% and 5% and relative humidities of 100%, 75.3%, and 68.8% are shown in Figure 7. The SD_3% powders exhibited the highest hygroscopicity values, followed by the SD_5% powders and native potato starch. Hygroscopicity is related to the hydrophilic nature of starch and the structure, particle size, and moisture content of the powders. The spray-dried powders exhibited a semi-crystalline to amorphous structure, while native starch was more crystalline. Since amorphous polymers tend to absorb moisture more easily than crystalline ones [66], the spray-dried powders are expected to show higher moisture sorption. Besides, the spray-dried powders had a smaller particle size, a larger surface area, and a more porous structure compared to the native potato starch, resulting in more interactions with water molecules. Carpin et al. [67] reported that smaller particles of lactose powder exhibited greater moisture sorption, which is related to the larger surface area and broader span of the particle size distribution material. As for the effect of moisture content, the higher the moisture content of the powders, the lower the hygroscopicity values, due to the increased water concentration gradient between the powders and the surrounding air. These findings are consistent with the results of Tonon et al. [52], who found that powders with lower moisture content had a greater ability to absorb moisture from the air.

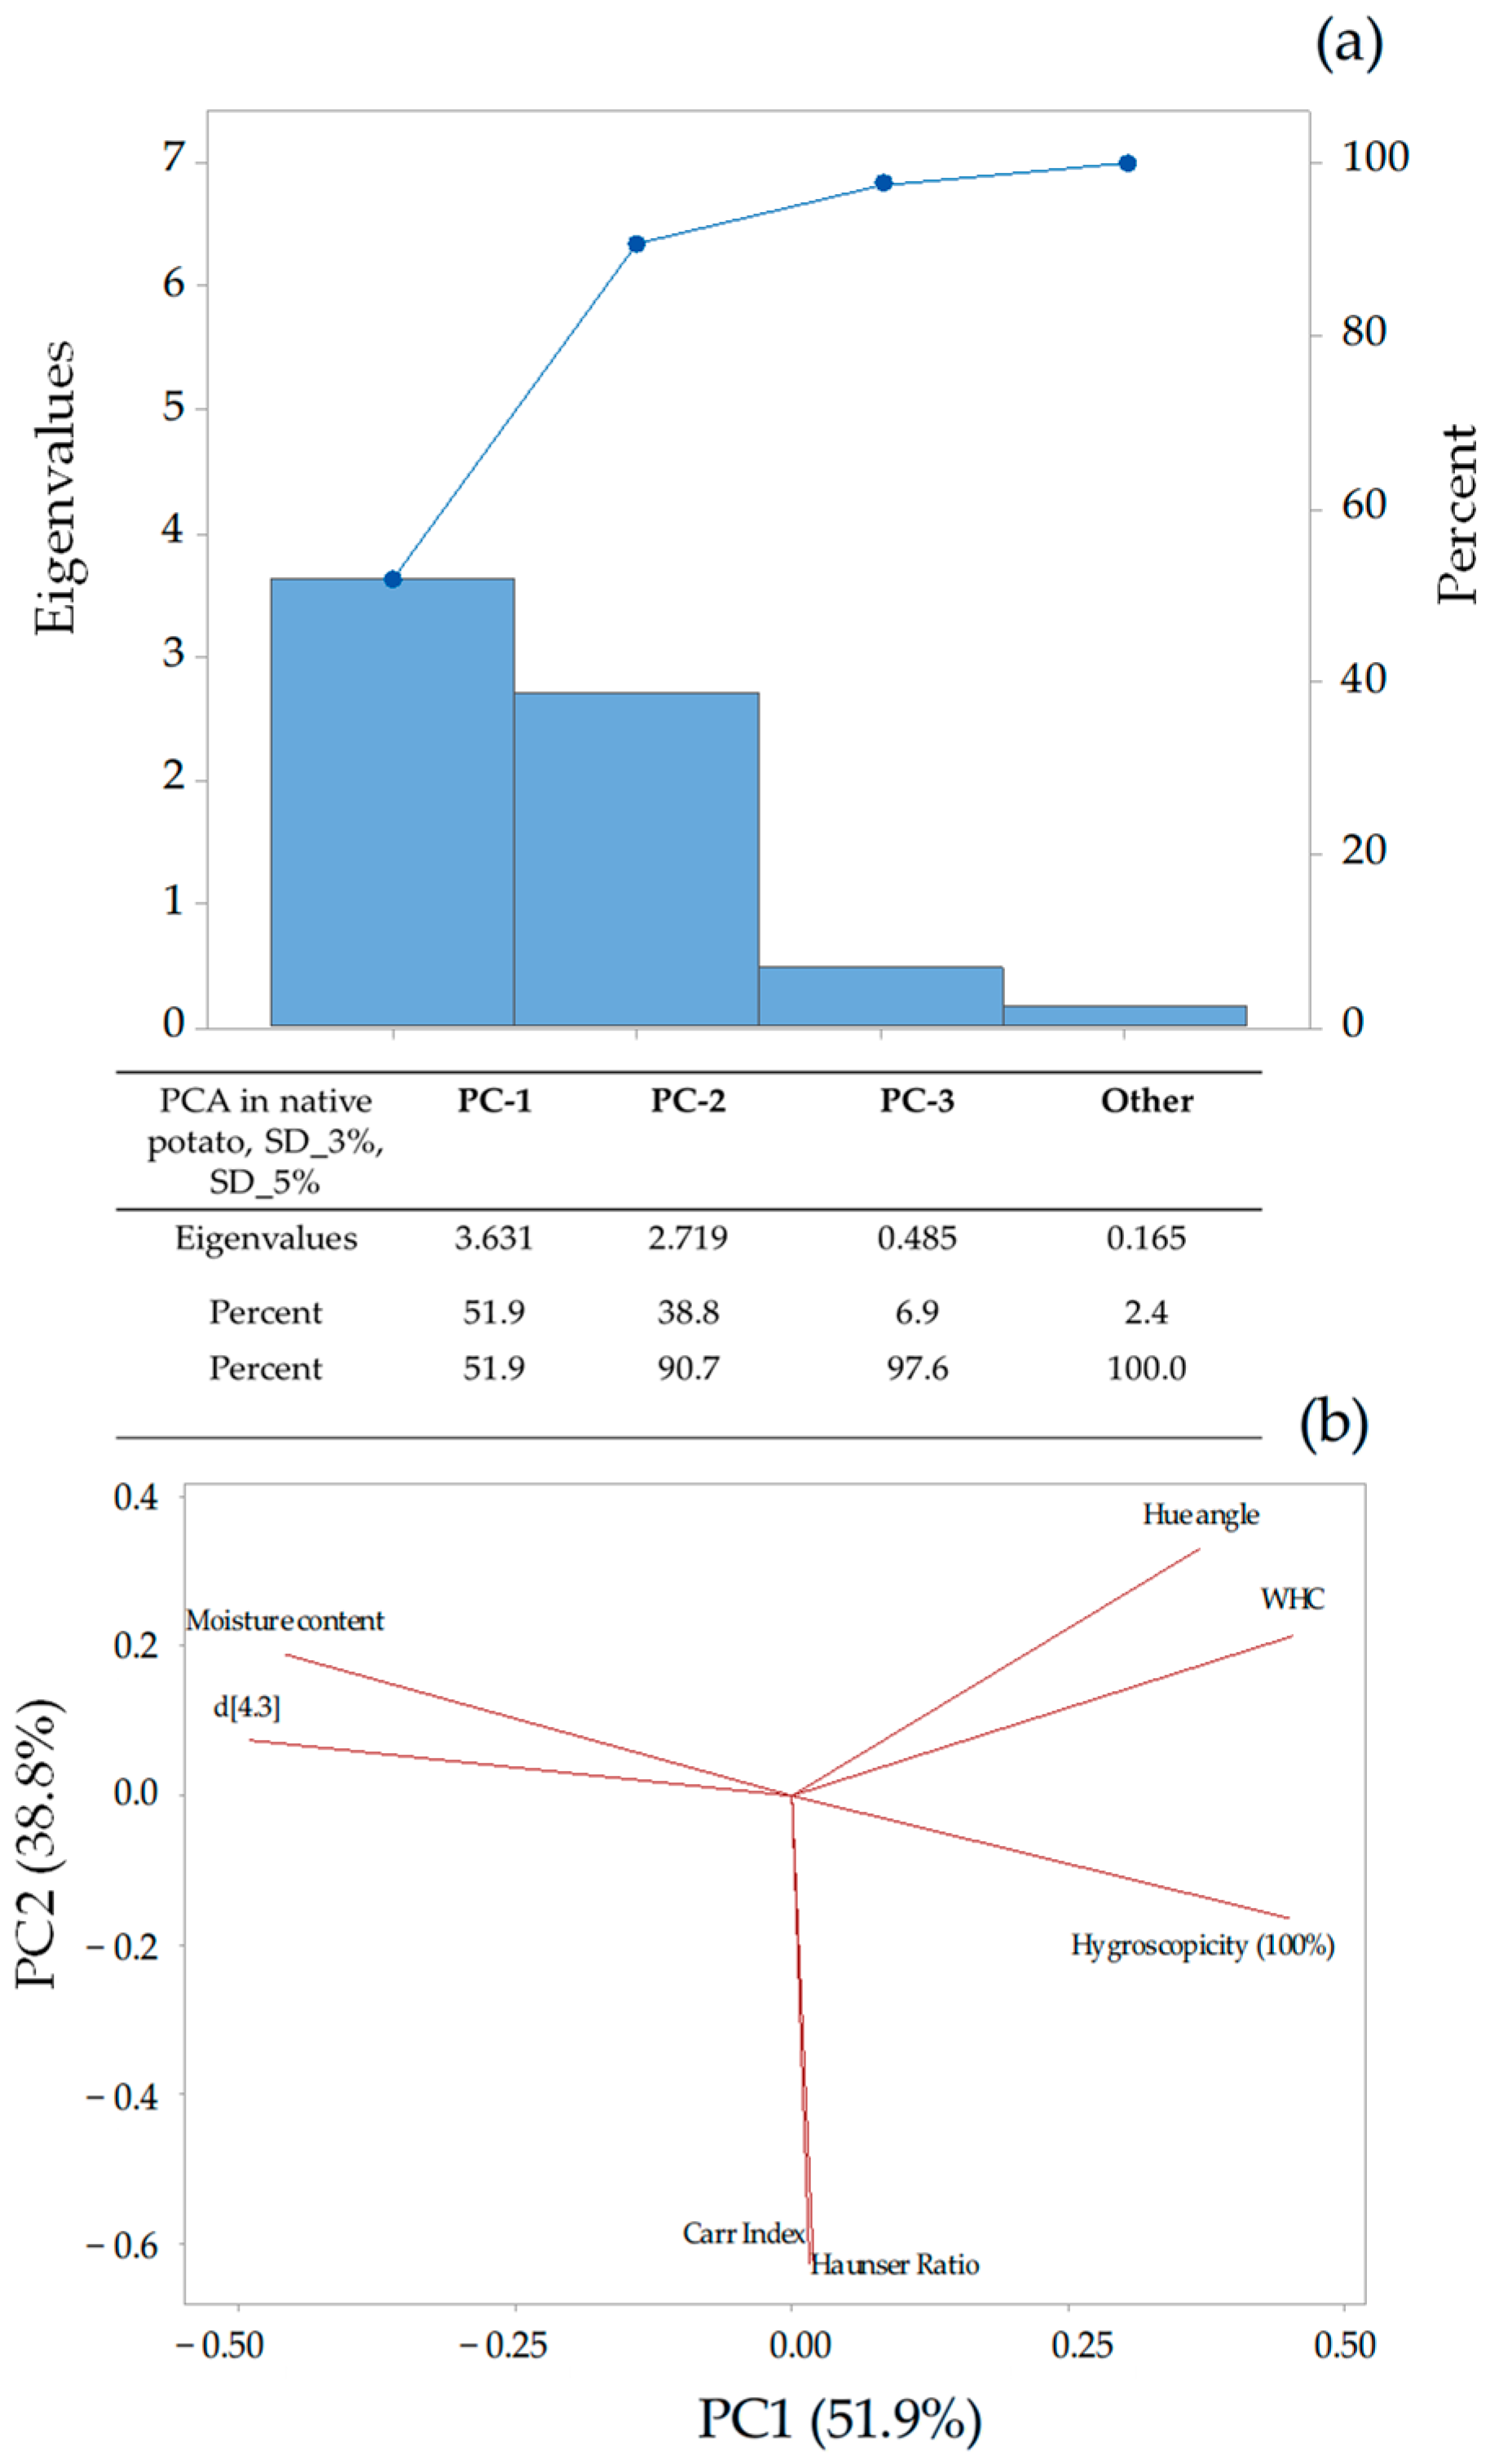
3.8. Principal Component Analysis

Principal component analysis (PCA) is a linear dimensionality reduction technique that transforms multiple correlated variables into a smaller set of uncorrelated variables, known as principal components. PCA involves the analysis of eigenvalues and eigenvectors of the data covariance matrix (or the correlation matrix). PCA diagonalizes these matrices. Each cell of the correlation matrix contains the correlation coefficient. The correlation values measure the degree of linear relationship between each pair of variables. The probability value (or p-value) is used to determine the significance of observational data. The p-value is the probability that observed results occurred randomly, assuming the null hypothesis is true. The lower p-value indicates the greater statistical significance of the linear relationship between the variables. A study result is statistically significant if the p-value is less than or equal to the significance level of the test. Pearson’s correlation coefficient is statistically significant as p < 0.05 and statistically highly significant as p < 0.001. Table 5 presents the correlation matrix across the selected physical variables (and the corresponding p-values) in native potato starch, spray-drying potato 3%, and spray-drying potato 5%. As can be seen from Table 5, most of the correlation coefficients are statistically significant.
A principal component analysis (PCA) was carried out in order to investigate the relationships among selected physical properties of the native potato starch and spray-dried starch powders. Figure 8, Figure 9 and Figure 10 show the Pareto diagrams and PCA biplot for native potato starch (Figure 8) and spray-dried starch powders at concentrations of 3% (Figure 9) and 5% (Figure 10).
Eigenvalues (characteristic roots) represent the total amount of variance that can be explained by a given principal component. The principal component analysis (PCA) decreases the number of variables by constructing principal components. The principal component corresponding to the largest eigenvalue (PC-1) is the direction along which the variance is maximized. Using the Kaiser–Guttman rule [68], only the factors with eigenvalues that are greater than 1 were retained. The Pareto chart of the PCA results in Figure 8a shows the explained and accumulated variance for each principal component in native potato starch. According to the results, the first three principal components have eigenvalues greater than 1. The first three principal components (PC-1, PC-2, and PC-3) explain 76.4% of the variation in the experimental data of the native potato starch. The principal components (PCs) are the linear combinations of the original variables that account for the variance in the data. The loading plot in Figure 8b reveals the relationships between the experimental data (original variables) in the space of the first two components (PC-1 and PC-2). The first two components explain 60.3% of the variance; component 1 and component 2 account for 32.0% and 28.3% of the variance, respectively (Figure 8a). The coefficients are the values that indicate the relative weight of each measured variable in the main principal components (Table 6). In the loading plot in Figure 8b, the variables that correlate the most with the first principal component are the Hausner ratio (0.623) and the Carr index (0.622). The first principal component is positively correlated with these two variables. Therefore, increasing values of the Hausner ratio and Carr index increase the value of the first principal component. From Figure 8b, it can also be seen that hygroscopicity (100%) has a negative correlation coefficient (−0.431) on component PC-1. Furthermore, as can be seen in Table 6, the second principal factor has a positive correlation (0.663) with moisture content, while PC-2 has a negative correlation (−0.500) with WHC. The Carr index was positively related to the Hausner ratio, while these parameters had negative correlation with hygroscopicity. Moisture content was negatively associated with the WHC and hue angle. The first four principal components explain 89.5% of the variation in the data. It should be noted that hygroscopicity (PC1), WHC, and moisture content (PC2) are physical parameters, important in industrial applications, as they affect flowability, cohesiveness, handling, shelf life, stability, and powder quality, particularly in the food and pharmaceutical industries. High cohesiveness (PC1), as indicated by the Hausner ratio and Carr index, correlates with poor flowability, limiting suitability for automated packaging systems.
The Pareto chart of the PCA results in Figure 9a shows the explained and accumulated variance for each principal component in the spray-dried potato starch at concentration of 3% [SD_3%]. According to the results presented in Figure 9a, the first two principal components (PC-1 and PC-2) have eigenvalues greater than 1. The first two components explain 76.7% of the variation in the experimental data, where component 1 and component 2 account for 57.5% and 19.3% of the variance, respectively. In the loading plot (Figure 9b and Table 7), the variables that have the highest positive correlation with the first principal component (PC-1) are the Carr index (0.418) and Hausner ratio (0.409). From Figure 9b, it can also be seen that the variables moisture content and WHC have negative correlation coefficients (−0.460 and −0.404, respectively) on the component PC-1. The second principal factor (PC-2) has a negative correlation (−0.730) with the hue angle. As shown in Figure 9, the hue angle is negatively related to hygroscopicity and D(4.3), while the Carr index and Hausner ratio are negative related to WHC and moisture content. The first three principal components explain 85.8% of the variation in the data.
The Pareto chart of the PCA results in Figure 10a shows the explained and accumulated variance for each principal component in the of spray-dried potato starch at a concentration of 5%. According to the results presented in Figure 10a, the first two principal components (PC-1 and PC-2) have eigenvalues greater than 1. The first two principal components explain 84.5% of the variation in the experimental data, where component 1 and component 2 account for 60.2% and 24.3% of the variance, respectively. In the loading plot (Figure 10b and Table 8), the variables that correlate the most with the first principal component (PC-1) are the hue angle (0.468) and WHC (0.429). The factor PC-1 is positively correlated with these two variables. PC-2 has a positive correlation (0.609) with D(4.3) and a negative correlation (−0.545) with hygroscopicity (100%) (Table 8). The Carr index and Hausner ratio parameters are negatively related to WHC, while moisture content, Carr index, and Hausner ratio are negatively correlated to hygroscopicity. The first three principal components explain 98.3% of the variation in the data.
PCA was further used to analyze all data for both native and spray-dried potato starches (3% and 5%). The Pareto chart of the PCA results in Figure 11a shows the explained and accumulated variance for each principal component. According to the results presented in Figure 11a, the first two principal components (PC-1 and PC-2) have eigenvalues greater than 1. The first two principal components explain 90.7% of the variation in the experimental data, where component 1 and component 2 account for 51.9% and 38.8% of the variance, respectively. In the loading plot (Figure 11b, and Table 9), the variables that positively correlated strongly with principal component 1 were hygroscopicity (100%) and WHC (coefficients of 0.478 and 0.409, respectively), while the variables that strongly negatively correlated were D(4.3) and moisture content (coefficients of −0.517 and −0.483, respectively). PC-2 has a positive correlation (0.446) with hue angle and negative correlations with Hausner ratio and Carr index (coefficients of −0.565 and −0.569, respectively). The first three principal components explain 97.6% of the variation in the data. A negative relationship was observed between hygroscopicity, moisture content, and D(4.3), while a positive relationship was found between the Carr index and Hausner ratio, as well as between the hue angle and water holding capacity (WHC).

4. Conclusions

The results of the present study revealed significant structural and morphological changes between native potato starch and spray-dried starch powders. X-ray analysis, DSC, and FTIR results indicated that the spray-dried starch powders exhibited a more semi-crystalline to amorphous structure compared to the native starch. Optical microscopy images showed that the starch granules in the spray-dried powders were wrinkled. The physical properties of the spray-dried powders were significantly affected by the starch concentration and the operating conditions applied during the drying process. Moisture content and particle size analysis showed that the spray-dried powders had lower moisture content and smaller particle sizes than native starch. Lower mean particle size values were observed in spray-dried starch powders with a concentration of 3%. Bulk properties indicated that spray-dried powders had lower bulk and tapped densities compared to native starch. The Carr index and Hausner ratio values were lower for the spray-dried starch powder at a concentration of 5% powder, indicating very good flowability and low cohesiveness. The reduced cohesiveness in SD_5% may stem from larger particle size and lower surface area, minimizing interparticle forces. Water holding capacity values were significantly higher in the spray-dried powders, while the hygroscopicity of the spray-dried powders was also higher than that of native starch. The relationship between the physical properties of native and spray-dried starch was further confirmed through principal component analysis (PCA). The differences between the two starch concentrations are likely due to viscosity changes, which directly influence its drying behavior and final properties.
Future work should focus on assessing the scalability and cost-effectiveness of these processes for industrial application. The structural and functional properties of starch are essential in various industrial applications in food, pharmaceuticals, and biodegradable materials, such as packaging films and inclusion complexes containing bioactive compounds. Besides, physically modified starches could be applied in food processing, where starch is used as a thickening agent or stabilizing material. In future studies, we plan to investigate a range of concentrations and drying conditions by applying other methods, such as freeze-drying and air-drying in a tray dryer, to better understand their effects on starch properties.
In conclusion, the spray-drying process significantly altered the structural, morphological, and physical properties of the potato starch, resulting in the formation of powders with improved functional properties.

Author Contributions

Conceptualization, A.M.; methodology, A.M. and A.G.; investigation, A.M., D.S., M.Z., V.K., S.R. and A.G.; writing—original draft preparation, A.M.; writing—review and editing, A.M., V.K. and S.R.; supervision, A.M. All authors have read and agreed to the published version of the manuscript.

Funding

This research received no external funding.

Institutional Review Board Statement

Not applicable.

Informed Consent Statement

Not applicable.

Data Availability Statement

Data presented in this study are available on request from the corresponding author.

Conflicts of Interest

The authors declare no conflicts of interest.

Abbreviations

The following abbreviations are used in this manuscript:
XRDX-ray diffraction
DSCDifferential scanning calorimetry
FTIRFourier transform infrared spectroscopy

References

  1. Robertson, T.M.; Alzaabi, A.Z.; Robertson, M.D.; Fielding, B.A. Starchy Carbohydrates in a Healthy Diet: The Role of the Humble Potato. Nutrients 2018, 10, 1764. [Google Scholar] [CrossRef] [PubMed]
  2. Wang, Z.J.; Liu, H.; Zeng, F.K.; Yang, Y.C.; Xu, D.; Zhao, Y.C.; Liu, X.F.; Kaur, L.; Liu, G.; Singh, J. Potato Processing Industry in China: Current Scenario, Future Trends and Global Impact. Potato Res. 2023, 66, 543–562. [Google Scholar] [CrossRef] [PubMed]
  3. Woolfe, J. Sweet Potato: An Untapped Food Resource; Cambridge University Press: Cambridge, UK, 1992. [Google Scholar]
  4. Tan, Y.; Zhao, Y.; Hu, H.; Fu, N.; Zhang, C.; Zhang, H.; Dai, X. Drying kinetics and particle formation of potato powder during spray drying probed by microrheology and single droplet drying. Food Res. Int. 2019, 116, 483–491. [Google Scholar] [CrossRef]
  5. Zeeman, S.C.; Kossmann, J.; Smith, A.M. Starch: Its Metabolism, Evolution, and Biotechnological Modification in Plants. Annu. Rev. Plant Biol. 2010, 61, 209–234. [Google Scholar] [CrossRef] [PubMed]
  6. Kaur, M.; Sandhu, K.S.; Singh, N.; Lim, S.T. Amylose Content, Molecular Structure, Physicochemical Properties and In Vitro Digestibility of Starches from Different Mungbean (Vigna radiate L.) Cultivars. Starch-Stärke 2011, 63, 709–716. [Google Scholar] [CrossRef]
  7. Fuentes, C.; Kang, I.; Lee, J.; Song, D.; Sjöö, M.; Choi, J.; Lee, S.; Nilsson, L. Fractionation and characterization of starch granules using field-flow fractionation (FFF) and differential scanning calorimetry (DSC). Anal Bioanal. Chem. 2019, 411, 3665–3674. [Google Scholar] [CrossRef]
  8. Awolu, O.O.; Olofinlae, S.J. Physico-Chemical, Functional and Pasting Properties of Native and Chemically Modified Water Yam (Dioscorea alata) Starch and Production of Water Yam Starch-Based Yoghurt. Starch-Stärke 2016, 68, 719–726. [Google Scholar] [CrossRef]
  9. Shen, H.; Yu, J.; Bai, J.; Liu, Y.; Ge, X.; Li, W.; Zheng, J. A New Pre-Gelatinized Starch Preparing by Spray Drying and Electron Beam Irradiation of Oat Starch. Food Chem. 2023, 398, 133938. [Google Scholar] [CrossRef]
  10. dos Santos, T.P.R.; Franco, C.M.L.; Leonel, M. Gelatinized Sweet Potato Starches Obtained at Different Preheating Temperatures in a Spray Dryer. Int. J. Biol. Macromol. 2020, 149, 1339–1346. [Google Scholar] [CrossRef]
  11. Chiu, W.; Solarek, D. Starch Chemistry and Technology; Bemiller, J., Whistler, R., Eds.; Academic Press: Burlington, VT, USA, 2009; pp. 629–655. [Google Scholar]
  12. Sarifudin, A.; Sholichah, E.; Setiaboma, W.; Tongta, S. Cold Water Swelling Starch: Methods to Prepare and Recent Applications. IOP Conf. Ser. Mater. Sci. Eng. 2021, 1011, 012025. [Google Scholar] [CrossRef]
  13. Din, Z.U.; Xiong, H.G.; Fei, P. Physical and Chemical Modification of Starches: A Review. Crit. Rev. Food Sci. Nutr. 2015, 57, 2691–2705. [Google Scholar]
  14. dos Santos, T.P.R.; Franco, C.M.L.; Mischan, M.M.; Leonel, M. Behavior of Sweet Potato Starch After Spray-Drying Under Different Pretreatment Conditions. Starch-Stärke 2019, 71, 1800245. [Google Scholar] [CrossRef]
  15. Fu, Z.; Wang, L.; Li, D.; Adhikari, B. Effects of Partial Gelatinization on Structure and Thermal Properties of Corn Starch after Spray Drying. Carbohydr. Polym. 2012, 88, 1319–1325. [Google Scholar] [CrossRef]
  16. Marinopoulou, A.; Karageorgiou, V.; Papastergiadis, E.; Iordanidis, C.; Dagklis, A.; Raphaelides, S.N. Production of Spray-Dried Starch Molecular Inclusion Complexes on an Industrial Scale. Food Bioprod. Process. 2019, 116, 186–195. [Google Scholar] [CrossRef]
  17. Marinopoulou, A.; Karageorgiou, V.; Petridis, D.; Raphaelides, S.N. Physical Properties of Starch-Paracetamol Molecular Inclusion Complexes Produced by the Spray Drying Process on an Industrial Scale. Dry Technol. 2020, 39, 1950–1967. [Google Scholar] [CrossRef]
  18. Marinopoulou, A.; Zoumaki, M.; Raphaelides, S.; Karageorgiou, V.; Goulas, A. Characterization of Spray-Dried Starch Systems of Natural Antioxidant Compounds. Starch-Stärke 2024, 76, 2300069. [Google Scholar] [CrossRef]
  19. Marinopoulou, A.; Zoumaki, M.; Goulas, A.; Petridis, D.; Raphaelides, S.; Aslampaloglou, A.; Tzikas, A.; Karageorgiou, V. Functional Characteristics and Physical Properties of Spray Dried Starch Inclusion Complexes with Drugs. Starch-Stärke 2021, 74, 2100176. [Google Scholar] [CrossRef]
  20. He, X.H.; Xia, W.; Chen, R.; Dai, T.; Luo, S.; Chen, J.; Liu, C. A New Pre-Gelatinized Starch Preparing by Gelatinization and Spray Drying of Rice Starch with Hydrocolloids. Carbohydr. Polym. 2020, 229, 115485. [Google Scholar] [CrossRef]
  21. Fadimu, G.J.; Adenekan, M.K.; Akinlua, O.; Al Juhaimi, F.; Ghafoor, K.; Babiker, E.E. Effect of Heat Moisture Treatment and Partial Acid Hydrolysis on the Morphological, Functional and Pasting Properties of Sweet Potato Starch. Qual. Assur. Saf. Crops Foods 2018, 10, 423–430. [Google Scholar] [CrossRef]
  22. dos Santos, T.P.R.; Franco, C.M.L.; Mischan, M.M.; Leonel, M. Improvement in Spray-Drying Technology for Preparation of Pregelatinized Cassava Starch. Food Sci. Technol. 2019, 39, 939–946. [Google Scholar] [CrossRef]
  23. Mauro, R.R.; Vela, A.J.; Ronda, F. Impact of Starch Concentration on the Pasting and Rheological Properties of Gluten-Free Gels. Effects of Amylose Content and Thermal and Hydration Properties. Foods 2023, 12, 2281. [Google Scholar] [CrossRef] [PubMed]
  24. Odigboh, E.U.; Mohsenin, N.N. Effects of concentration on the viscosity profile of cassava starch pastes during the cooking-cooling process. J. Texture Stud. 1975, 5, 441–457. [Google Scholar] [CrossRef]
  25. Lee, S.W.; Rhee, C. Effect of heating condition and starch concentration on the structure and properties of freeze-dried rice starch paste. Food Res. Int. 2007, 40, 215–223. [Google Scholar] [CrossRef]
  26. AOAC. Official Methods of Analysis of the Association of Official Analytical Chemists; Association of Official Analytical Chemists: Washington, DC, USA, 1990. [Google Scholar]
  27. Malvern. Getting Started-Manual Mastersizer 1.3; Malvern Instruments Ltd.: Malvern, UK, 1997. [Google Scholar]
  28. Stojanovic, Z.; Markovic, S. Determination of Particle Size Distribution by Laser Diffraction. Technics-New Mater. 2012, 21, 11–20. [Google Scholar]
  29. Milovanovic, B.; Djekic, I.; Miocinovic, J.; Djordjevic, V.; Lorenzo, J.M.; Barba, F.J.; Mörlein, D.; Tomasevic, I. What Is the Color of Milk and Dairy Products and How Is It Measured? Foods 2020, 9, 1629. [Google Scholar] [CrossRef] [PubMed]
  30. de Lima, P.M.; Dacanal, G.C.; Pinho, L.S.; de Sá, S.H.G.; Thomazini, M.; Favaro-Trindade, C.S. Combination of Spray-Chilling and Spray-Drying Techniques to Protect Carotenoid-Rich Extracts from Pumpkin (Cucurbita moschata) Byproducts, Aiming at the Production of a Powdered Natural Food Dye. Molecules 2022, 27, 7530. [Google Scholar] [CrossRef]
  31. Nishad, J.; Selvan, C.J.; Mir, S.A.; Bosco, S.J.D. Effect of Spray Drying on Physical Properties of Sugarcane Juice Powder (Saccharum officinarum L.). J. Food Sci. Technol. 2017, 54, 687–697. [Google Scholar] [CrossRef] [PubMed]
  32. Carr, R.L. Evaluating Flow Properties of Solids. Chem. Eng. J. 1965, 72, 163–168. [Google Scholar]
  33. Hausner, H.H. Friction Conditions in a Mass of Metal Powder. J. Powder Metall. 1967, 3, 7–13. [Google Scholar]
  34. Fitzpatrick, J.J. Food powder flowability. In Encapsulated and Powdered Foods; Onwulata, C., Ed.; CRC Press: Boca Raton, FL, USA, 2005; pp. 247–260. [Google Scholar]
  35. Rana, S.; Gupta, S.; Rana, A.; Bhushan, S. Functional properties, phenolic constituents, and antioxidant potential of industrial apple pomace for utilization as active food ingredient. Food Sci. Hum. Wellness 2015, 4, 180–187. [Google Scholar] [CrossRef]
  36. Ladjevardi, Z.; Mousavi, M.; Askari, G.; Dolati, Μ.; Kahn, C.; Arab-Tehrany, E. Structural, functional and emulsifying properties of wheat corn, chickpea and OSA-modified chickpea starches, a comparative study. J. Food Meas. Charact. 2024, 18, 4496–4513. [Google Scholar] [CrossRef]
  37. Cai, Y.Z.; Corke, H. Production and Properties of Spray-Dried Amaranthus Betacyanin Pigments. J. Food Sci. 2000, 65, 1248–1252. [Google Scholar] [CrossRef]
  38. Taguchi, T.; Onishi, M.; Katsuno, N.; Miwa, N.; Oomoto, C.; Sato, M.; Sekita, M.; Yamaguchi, H.; Imaizumi, T.; Nishizu, T. Evaluation of Starch Retrogradation by X-Ray Diffraction Using a Water-Addition Method. LWT-Food Sci. Technol. 2023, 173, 114341. [Google Scholar] [CrossRef]
  39. Rocha, T.S.; Carneiro, A.P.A.; Franco, C.M.L. Effect of Enzymatic Hydrolysis on Some Physicochemical Properties of Root and Tuber Granular Starches. Ciênc. Tec. Aliment. 2010, 30, 544–551. [Google Scholar] [CrossRef]
  40. Wu, W.; Jiao, A.; Xu, E.; Chen, Y.; Jin, Z. Effects of Extrusion Technology Combined with Enzymatic Hydrolysis on the Structural and Physicochemical Properties of Porous Corn Starch. Food Bioprocess Technol. 2020, 13, 442–451. [Google Scholar] [CrossRef]
  41. Su, Q.; Sun, L.; Chen, L.; Wang, X.; Liu, K.; Gong, K. The Influence of Different Drying Methods on the Molecular Structure and Digestive Resistance of Type 3 Resistant Starch (RS3). Food Chem. 2025, 474, 142971. [Google Scholar] [CrossRef]
  42. Pozo, C.; Rodríguez-Llamazares, S.; Bouza, R.; Barral, L.; Castaño, J.; Müller, N.; Restrepo, I. Study of the Structural Order of Native Starch Granules Using Combined FTIR and XRD Analysis. J. Polym. Res. 2018, 25, 266. [Google Scholar] [CrossRef]
  43. Cyras, V.P.; Tolosa Zenklusen, M.C.; Vazquez, A. Relationship between Structure and Properties of Modified Potato Starch Biodegradable Films. J. Appl. Polym. Sci. 2006, 101, 4313–4319. [Google Scholar] [CrossRef]
  44. Likhitkar, S.; Bajpai, A.K. Magnetically Controlled Release of Cisplatin from Superparamagnetic Starch Nanoparticles. Carbohydr. Polym. 2012, 87, 300–308. [Google Scholar] [CrossRef]
  45. Lourdin, D.; Putaux, J.-L.; Potocki-Véronèse, G.; Chevigny, C.; Rolland-Sabaté, A.; Buléon, A. Crystalline Structure in Starch. In Starch: Metabolism and Structure; Nakamura, Y., Ed.; Springer: Tokyo, Japan, 2015; pp. 61–90. [Google Scholar]
  46. Tiozon, R.N., Jr.; Bonto, A.P.; Padua, J.A.H.; Elbo, E.G.A.; Sampang, J.R.; Kamka Jon, K.; Camacho, D.H.; Thumanu, K. Investigating the Effect of Ultrasonication on the Molecular Structure of Potato Starch Using Synchrotron-Based Infrared Spectroscopy. Biointerf. Res. Appl. Chem. 2022, 12, 6686–6698. [Google Scholar]
  47. Chakraborty, I.; Pallen, S.; Shetty, Y.; Roy, N.; Mazumder, N. Advanced Microscopy Techniques for Revealing Molecular Structure of Starch Granules. Biophys. Rev. 2020, 12, 105–122. [Google Scholar] [CrossRef] [PubMed]
  48. Tonon, R.V.; Grosso, C.R.F.; Hubinger, M.D. Influence of Emulsion Composition and Inlet Air Temperature on the Microencapsulation of Flaxseed Oil by Spray Drying. Food Res. Int. 2011, 44, 282–289. [Google Scholar] [CrossRef]
  49. Both, E.M.; Siemons, I.; Boom, R.M.; Schutyser, M.A.I. The Role of Viscosity in Morphology Development During Single Droplet Drying. Food Hydrocoll. 2019, 94, 510–518. [Google Scholar] [CrossRef]
  50. dos Santos, T.P.R.; Franco, C.M.L.; do Carmo, E.L.; Jane, J.L.; Leonel, M. Effect of Spray-Drying and Extrusion on Physicochemical Characteristics of Sweet Potato Starch. J. Food Sci. Technol. 2019, 56, 376–383. [Google Scholar] [CrossRef] [PubMed]
  51. Ferrari, C.C.; Germer, S.P.M.; de Aguirre, J.M. Effects of Spray-Drying Conditions on the Physicochemical Properties of Blackberry Powder. Dry Technol. 2011, 30, 154–163. [Google Scholar] [CrossRef]
  52. Tonon, R.V.; Brabet, C.; Hubinger, M.D. Influence of Process Conditions on the Physicochemical Properties of Açaí (Euterpe oleraceae Mart.) Powder Produced by Spray-Drying. J. Food Eng. 2008, 88, 411–418. [Google Scholar] [CrossRef]
  53. Koç, B.; Koç, M.; Baysan, U. Food Powders Bulk Properties. In Food Powders: Properties and Characterization; Ermiş, E., Ed.; Springer: Cham, Switzerland, 2021; pp. 1–36. [Google Scholar]
  54. Masters, K. Spray-air Contact (Mixing and Flow). In Spray Drying Handbook, 3rd ed.; Masters, K., Ed.; Halsted Press: New York, NY, USA, 1979; pp. 286–290. [Google Scholar]
  55. Krishnaiah, D.; Bono, A.; Nandam, R.J.; Zahari, F.W. Effect of Potato Starch on the Antioxidant Properties of Morinda citrifolia Spray-Dried Microparticles. MOJ Food Process. Technol. 2015, 1, 1–4. [Google Scholar]
  56. Jinapong, N.; Suphantharika, M.; Jamnong, P. Production of Instant Soymilk Powders by Ultrafiltration, Spray Drying, and Fluidized Bed Agglomeration. J. Food Eng. 2008, 84, 194–205. [Google Scholar] [CrossRef]
  57. Marinopoulou, A.; Karageorgiou, V.; Iordanidis, C.; Dagklis, A.; Zoumakis, N.; Raphaelides, S.N. Parametric analysis of the spray drying process for the production of starch molecular inclusion complexes with fatty acids. Dry Technol. 2019, 39, 580–595. [Google Scholar] [CrossRef]
  58. Dini, M.; Raseira, M.D.C.B.; Scariotto, S.; Carra, B.; Abreu, E.D.; Mello-Farias, P.; Cantillano, R.F. Color Shade Heritability of Peach Flesh. J. Agric.Sci. 2019, 11, 236. [Google Scholar] [CrossRef]
  59. Aryaee, H.; Ariaii, P.; Zare, D.; Mirdamadi, S.; Naghizadeh Raeisi, S. Evaluation of the Physicochemical Characteristics of a Blend Fruit Juice Powder Mixed with Lactiplantibacillus plantarum: A Comparison of Spray Drying and Freeze Drying. J. Food Process. Preserv. 2023, 2023, 5597647. [Google Scholar] [CrossRef]
  60. Samborska, K.; Gajek, P.; Kamińska-Dwórznicka, A. Spray Drying of Honey: The Effect of Drying Agents on Powder Properties. Pol. J. Food Nutr. Sci. 2015, 65, 109–118. [Google Scholar] [CrossRef]
  61. Rayo, L.M.; Carvalho, L.C.; Sardá, F.A.; Dacanal, G.C.; Menezes, E.W.; Tadini, C.C. Production of instant green banana flour (Musa cavendischii, var. Nanicão) by a pulsed-fluidized bed agglomeration. LWT Food Sci. Technol. 2015, 63, 461–469. [Google Scholar] [CrossRef]
  62. Jiang, G.; Wu, Z.; Ameer, K.; Li, S.; Ramachandraiah, K. Particle size of ginseng (Panax ginseng Meyer) insoluble dietary fiber and its effect on physicochemical properties and antioxidant activities. Appl. Biol. Chem. 2020, 63, 70. [Google Scholar] [CrossRef]
  63. Nguyen, D.Q.; Nguyen, T.H.; Mounir, S.; Allaf, K. Effect of Feed Concentration and Inlet Air Temperature on the Properties of Soymilk Powder Obtained by Spray Drying. Dry Technol. 2018, 36, 817–829. [Google Scholar] [CrossRef]
  64. Koç, B.; Sakin-Yılmazer, M.; Kaymak-Ertekin, F.; Balkır, P. Physical Properties of Yoghurt Powder Produced by Spray Drying. J. Food Sci. Technol. 2012, 51, 1377–1383. [Google Scholar] [CrossRef]
  65. Sheng, Y.H.; Lu, Q.Y.; Zhang, K. Effect of Different Potato Powder on the Quality of Potato Noodles. J. Henan Univ. Technol. (Nat. Sci. Ed.) 2017, 38, 38–44. [Google Scholar]
  66. Ng, L.H.; Ling, J.K.U.; Hadinoto, K. Formulation Strategies to Improve the Stability and Handling of Oral Solid Dosage Forms of Highly Hygroscopic Pharmaceuticals and Nutraceuticals. Pharmaceutics 2022, 14, 2015. [Google Scholar] [CrossRef]
  67. Carpin, M.; Bertelsen, H.; Dalberg, A.; Bech, J.K.; Risbo, J.; Schuck, P.; Jeantet, R. How Does Particle Size Influence Caking in Lactose Powder? J. Food Eng. 2017, 209, 61–67. [Google Scholar] [CrossRef]
  68. Kaiser, H.F. The application of electronic computers to factor analysis. Educ. Psychol. Meas. 1960, 20, 141–151. [Google Scholar] [CrossRef]
Figure 1. Diffractograms (a) and DSC thermograms (b) of native potato starch and spray-dried potato starch powders at concentrations of 3% [SD_3%] and 5% [SD_5%].
Applsci 15 04566 g001
Figure 2. FTIR spectra of native potato starch and spray-dried potato starch powders at concentrations of 3% [SD_3%] and 5% [SD_5%] in 3800–300 cm−1 region and in 1200–850 cm−1 region.
Applsci 15 04566 g002
Figure 3. Optical images of native potato starch and spray-dried potato starch powders at concentrations of 3% [SD_3%] and 5% [SD_5%]. Red arrows indicate the spherical granules in the native potato starch and the wrinkled granules in spray-dried starch powders.
Applsci 15 04566 g003
Figure 4. Moisture content (a) and particle size distribution (b) of native potato starch and spray-dried potato starch powders at concentrations of 3% [SD_3%], and 5% [SD_5%]. The vertical lines indicate the 95% confidence interval of the means, derived from the error mean square of the analysis of variance. Groups labeled with different letters are significantly different according to Tukey’s pairwise comparison of means (p < 0.05).
Applsci 15 04566 g004
Figure 5. Fitted line plot of Carr index versus [CI] Hausner ratio [HR] of native potato starch and spray-dried potato starch powders at concentrations of 3% and 5%.
Applsci 15 04566 g005
Figure 6. Water holding capacity of native potato starch and spray-dried potato starch powders at concentrations of 3% [SD_3%] and 5% [SD_5%]. The vertical lines illustrate the 95% confidence intervals for the means, obtained from the error mean square in the analysis of variance. Groups that do not display the same letter are significantly different, as shown by Tukey’s pairwise comparison of means.
Applsci 15 04566 g006
Figure 7. Hygroscopicity values of native potato starch and spray-dried potato starch powders at concentrations of 3% [SD_3%] and 5% [SD_5%] stored at relative humidity of 100% (a), 75.3% (b), and 68.8% (c). The vertical lines denote the 95% confidence intervals for the means, calculated using the error mean square from the analysis of variance. Groups that do not have a common letter are significantly different, as assessed by Tukey’s pairwise comparison of means (p < 0.05).
Applsci 15 04566 g007
Figure 8. Pareto chart (a) and PCA biplot (b) of native potato starch.
Applsci 15 04566 g008
Figure 9. Pareto chart (a) and PCA biplot (b) of spray-dried potato starch at concentration of 3%.
Applsci 15 04566 g009
Figure 10. Pareto chart (a) and PCA biplot (b) of spray-dried potato starch at concentration of 5% [SD_5%].
Applsci 15 04566 g010
Figure 11. Pareto chart (a) and PCA biplot (b) of native potato starch and spray-dried potato starch powders at concentrations of 3% [SD_3%] and 5% [SD_5%].
Applsci 15 04566 g011
Table 1. Codification of the spray-dried potato starch powders at concentrations of 3% (w/w) and 5% (w/w) and the operating parameters applied during spray-drying.
CodingAir Tinlet
(°C) 1
Air Toutlet
(°C) 2
RH (%)
Ambient Air 3
Dry Bulb T (°C)-
Ambient Air 4
Wet Bulb T (°C)-
Ambient Air 5
Absolute Humidity
(Kg H2O/Kg Dry Air)
Ambient Air
Dry Bulb T (°C)
-Outlet Air 6
Wet Bulb T (°C)-Outlet Air 7Absolute Humidity
(Kg H2O/Kg Dry Air)
Outlet Air
SD_3%22010576970.0054100850.956
SD_5%220907927.524.50.018285700.306
1 Tinlet: inlet air temperature (°C). 2 Toutlet: outlet air temperature (°C). 3 RH: relative humidity of ambient air. 4 Dry bulb T-ambient air: dry bulb temperature (°C) of ambient air. 5 Wet bulb T-ambient air: wet bulb temperature (°C) of ambient air. 6 Dry bulb Τ-outlet air: dry bulb temperature (°C) of outlet air. 7 Wet bulb T-outlet air: wet bulb temperature (°C) of outlet air.
Table 2. Particle size distribution parameters [span, uniformity, specific surface, D(4.3), D(3.2), D(0.1), D(0.5), D(0.9)] of native potato starch, spray-dried potato starch powders at concentrations of 3% [SD_3%] and 5% [SD_5%] *.
SamplesSpanUniformitySpecific Surface
(m2/g)
D(4.3)
(μm)
D(3.2)
(μm)
D(0.1)
(μm)
D(0.5)
(μm)
D(0.9)
(μm)
Native
potato starch
1.31
(±0.09) c
0.40
(±0.03) c
0.18
(±0.00) c
45.25
(±1.32) a
34.18
(±0.42) a
20.56
(±1.31) a
41.87
(±1.12) a
75.42
(±4.12) a
SD_3%2.85
(±0.45) a
0.85
(±0.09) a
0.73
(±0.03) a
20.98
(±0.97) c
8.22
(±0.25) c
4.97
(±0.04) c
13.82
(±0.61) c
44.43
(±7.79) b
SD_5%1.87
(±0.08) b
0.58
(±0.03) b
0.43
(±0.00) b
26.41
(±0.23) b
13.88
(±0.06) b
9.05
(±0.04) b
23.02
(±0.24) b
52.06
(±2.42) b
* Different superscript letters within the same column signify significant differences (p < 0.05) amongst the means, based on Tukey’s multiple comparison test.
Table 3. Chroma parameters [L*, a*, b*, whiteness index, yellowness index, chroma—C*, hue angle—H*] of native potato starch, spray-dried potato starch powders at concentrations of 3% [SD_3%] and 5% [SD_5%] *.
SamplesL*a*b*Whiteness
Index
[WI]
Yellowness
Index
[YI]
Chroma
[C*]
Hue Angle [H°]
Native
potato starch
99.76
(±0.30) a
0.38
(±0.05) a
3.57
(±0.11) b
74.15
(±0.44) a
7.01
(±0.16) a
3.59
(±0.10) b
83.86
(±0.90) c
SD_3%96.07
(±1.74) a
0.16
(±0.04) b
3.83
(±0.26) a
69.37
(±2.71) b
7.30
(±0.53) a
3.83
(±0.26) a
86.91
(±1.41) b
SD_5%96.01
(±0.53) a
−0.15
(±0.04) c
3.77
(±0.15) ab
73.60
(±1.49) a
6.95
(±0.25) a
3.77
(±0.15) ab
92.24
(±0.73) a
* Different superscript letters within the same column signify significant differences (p < 0.05) amongst the means, based on Tukey’s multiple comparison test.
Table 4. Bulk density, tapped density, Carr index, and Hausner ratio of native potato starch, spray-dried potato starch powders at concentrations of 3% [SD_3%] and 5% [SD_5%] *.
SamplesBulk Density
(g/mL)
Tapped Density (g/mL)Carr Index [CI]
(%)
Hausner Ratio
[HR]
Native
potato starch
0.51
(±0.08) a
0.59
(±0.10) a
13.18
(±7.26) ab
1.16
(±0.10) ab
SD_3%0.14
(±0.01) b
0.16
(±0.01) b
17.52
(±5.43) a
1.22
(±0.08) a
SD_5%0.15
(±0.01) b
0.15
(±0.01) b
5.49
(±3.49) b
1.06
(±0.04) b
* Different superscript letters within the same column signify significant differences (p < 0.05) amongst the means, based on Tukey’s multiple comparison test.
Table 5. Correlation matrix (Pearson correlation and p-values) in native potato starch and spray-dried potato starch at concentrations of 3% [SD_3%] and 5% [SD_5%].
VariablesMoisture
Content
Hue AngleCarr IndexHausner RatioWHCHygroscopicity (100%)
Hue angle−0.223
p-value0.212
Carr index−0.355−0.473
p-value0.0420.005
Hausner ratio−0.353−0.4550.996
p-value0.0440.0080.000
WHC−0.5270.903−0.308−0.295
p-value0.0020.0000.0810.096
Hygroscopicity (100%)−0.9140.2340.3300.3350.523
p-value0.0000.1900.0610.0560.002
D(4.3)0.924−0.489−0.197−0.202−0.742−0.896
p-value0.0000.0040.2710.2600.0000.000
Table 6. Eigenvectors analysis of the correlation matrix in the native potato starch.
VariablesPC1PC2PC3PC4PC5PC6PC7
Moisture content0.0670.663−0.062−0.0780.365−0.6390.066
Hue angle−0.161−0.386−0.392−0.2560.7730.091−0.022
Carr index0.622−0.206−0.185−0.070−0.082−0.240−0.684
Hausner ratio0.623−0.195−0.219−0.028−0.060−0.0710.719
WHC−0.075−0.5000.4870.4520.194−0.5120.061
Hygroscopicity (100%)−0.431−0.263−0.442−0.263−0.471−0.5040.068
D(4.3)0.068−0.1110.572−0.806−0.009−0.0660.046
Hue angle0.0670.663−0.062−0.0780.365−0.6390.066
Table 7. Eigenvectors analysis of the correlation matrix in the spray-dried potato starch at concentration of 3%.
VariablesPC1PC2PC3PC4PC5PC6PC7
Moisture content−0.460−0.1140.102−0.1650.4570.727−0.030
Hue angle−0.081−0.730−0.441−0.480−0.144−0.122−0.003
Carr index0.418−0.3870.3290.1340.1590.1180.714
Hausner ratio0.409−0.3880.3920.1060.1820.024−0.695
WHC−0.404−0.0100.616−0.3950.149−0.5240.075
Hygroscopicity (100%)0.3710.270−0.325−0.3390.725−0.2090.015
D(4.3)0.3720.2830.222−0.665−0.4060.353−0.010
Table 8. Eigenvectors analysis of the correlation matrix in the spray-dried potato starch at concentration of 5% [SD_5%].
VariablesPC1PC2PC3PC4PC5PC6PC7
Moisture content0.3070.3490.6260.3880.0320.072−0.485
Hue angle0.468−0.153−0.199−0.0380.026−0.817−0.221
Carr index−0.4420.292−0.174−0.0880.739−0.147−0.337
Hausner ratio−0.4390.295−0.201−0.071−0.671−0.154−0.449
WHC0.429−0.125−0.445−0.2470.0440.529−0.510
Hygroscopicity (100%)−0.214−0.5450.526−0.5430.005−0.045−0.289
D(4.3)0.2620.6090.151−0.692−0.028−0.0340.238
Table 9. Eigenvectors analysis of the correlation matrix in the of native potato starch and spray-dried potato starch at concentrations of 3% [SD_3%] and 5% [SD_5%].
VariablesPC1PC2PC3PC4PC5PC6PC7
Moisture content−0.4830.1480.334−0.559−0.2460.510−0.029
Hue angle0.2810.4460.565−0.1360.613−0.086−0.021
Carr index0.108−0.5690.3930.017−0.022−0.022−0.713
Hausner ratio0.112−0.5650.420−0.049−0.018−0.0280.699
WHC0.4090.3430.3200.057−0.749−0.220−0.005
Hygroscopicity (100%)0.478−0.137−0.359−0.7800.021−0.119−0.031
D(4.3)−0.5170.0080.089−0.235−0.019−0.818−0.015
Disclaimer/Publisher’s Note: The statements, opinions and data contained in all publications are solely those of the individual author(s) and contributor(s) and not of MDPI and/or the editor(s). MDPI and/or the editor(s) disclaim responsibility for any injury to people or property resulting from any ideas, methods, instructions or products referred to in the content.

