Article

Shear Properties of the Interface Between Polyurethane Concrete and Normal Concrete

1
School of Civil Engineering and Transportation, Northeast Forestry University, Harbin 150040, China
2
Heilongjiang Transportation Investment Maintenance Technology Co., Ltd., Harbin 150000, China
*
Authors to whom correspondence should be addressed.
Appl. Sci. 2025, 15(8), 4580; https://doi.org/10.3390/app15084580
Submission received: 22 February 2025 / Revised: 9 April 2025 / Accepted: 18 April 2025 / Published: 21 April 2025

Abstract

:
Polyurethane concrete (PUC) is a promising candidate for structural repair materials due to its excellent mechanical properties and durability. However, the bonding performance between PUC and concrete interfaces may limit its broader application. This study examined the factors affecting the shear strength at the PUC–NC interface. A total of 16 oblique shear tests, varying by interface treatment methods (smooth—GH, roughened—ZM, and grooved—KC), adhesive application rates—NJJ (0, 0.2, and 0.3 kg/m2), and steel fiber contents—GXW (0%, 0.5%, 1%, and 1.5%), to evaluate their impact on the mechanical properties of the PUC–NC interface. The results demonstrated that roughening the interface significantly improved the shear strength, resulting in a 32% increase compared to a smooth interface and 15% compared to a grooved interface. A moderate adhesive application rate (0.2 kg/m2) enhanced the interface strength, while excessive adhesive did not further increase the shear strength. The optimal steel fiber content (1%) resulted in the highest shear strength, improving it by 22%, whereas excess steel fibers (1.5%) reduced the interface strength. This is due to fiber agglomeration, which weakens mechanical interlocking and introduces defects that impair interfacial bonding. Load–slip curve analysis revealed that roughened interfaces combined with the appropriate amount of steel fibers improved the interface toughness, delaying the failure process. This study presents a model for calculating the shear strength of steel fiber-reinforced PUC–NC interfaces, incorporating shear slip. Compared to existing models, it more accurately reflects the experimental data.

1. Introduction

Normal concrete (NC) is a traditional building material widely used in modern civil engineering. However, over time, concrete structures face long-term effects from loads and different, physical, chemical, and biological factors. These influences often result in varying degrees of damage and degradation, reducing the load-bearing capacity, and even structural collapse, which severely impacts safety and durability [1,2,3]. As a result, the development of new materials and technologies for efficient, durable, and low-cost concrete structure repair and reinforcement has become a key area of research.
Polyurethane concrete (PUC) has gradually been integrated into the manufacturing process to meet higher requirements for mechanical strength and durability [4,5,6]. In particular, the combination of epoxy resins and polyurethane helps to improve the mechanical properties and durability of cement-based materials. Although epoxy resin enables precise control of concrete’s physical–mechanical properties—including shrinkage deformation, density, strength, and hardness—its brittleness and high cost limit its large-scale application [7,8,9]. In contrast, PUC not only provides superior mechanical properties and durability but also features short curing times, non-toxicity, and environmental friendliness, all at a moderate cost, making it an essential material for concrete structure repair [10,11,12].
Recent studies suggest that PUC holds promising potential in the reinforcement and maintenance of reinforced concrete structures [13,14]. Wang et al. [15,16] investigated the basic mechanical properties of PUC and evaluated its feasibility in bridge expansion joint repair. Similarly, Li et al. [17] developed an innovative type of PUC, whose mechanical performance was tested to provide theoretical support for its engineering applications. Research by Han et al. focused on the performance of modified PUC at varying temperatures, offering valuable mechanical analysis for its application in steel-structured bridges [18]. PUC’s excellent mechanical properties, including high compressive strength, tensile strength, and elasticity, enable it to withstand heavy traffic loads and stress without cracking or degradation. Its corrosion resistance further makes it ideal for environments exposed to water, salts, and chemicals, such as road surfaces and industrial settings. These properties make it well suited for rapid pavement repairs, overcoming the limitations of traditional materials [19,20,21,22].
However, performance differences between polymer concrete and conventional cement concrete can lead to a weak interface transition zone, often considered a critical vulnerability in structures [23]. The effectiveness of concrete pavement repair depends not only on the performance of the polymer concrete but also on the adhesive bond strength between it and the cement concrete. Insufficient bond strength between the two materials can result in interface damage or even delamination, under external loads and environmental factors. Such issues pose serious threats to the structural integrity and safety of repaired pavement [24,25].
For PUC-reinforced PUC–NC composite components, ensuring effective synergy between the two materials is important. Poor bond performance at the interface can compromise the cracking resistance and ultimate load-bearing capacity of the repaired structure. Therefore, the adhesive reliability of the interface between PUC and NC directly influences structural integrity and safety. Accurately assessing the bond strength between these materials is critical for concrete pavement repair. Studies by Ummin and Zhong have shown that interface roughness and polyurethane density are key factors affecting bond strength [26,27]. Yang Li et al. [12], through shear and splitting tests, further elucidated the significance of roughness on the interfacial bonding performance between polyurethane mortar and concrete. Li et al. [28] confirmed a positive correlation between surface roughness and bond strength, noting that increased roughness improves bond quality. Additionally, research by Zhang and Pu Zhang et al. demonstrated that strengthening the interface adhesive material significantly improves the mechanical performance of the bonding interface, emphasizing the importance of optimizing the interface structure [17,29].
  • Research Significance
A key issue in civil engineering is the repair and reinforcement of aging concrete structures. The bond strength at the PUC–NC interface is considered a critical factor in determining the success of these interventions. This study provides a comprehensive theoretical foundation by examining the factors influencing this bond strength and offers valuable insights for practical repair and reinforcement strategies. By optimizing interface treatment methods and selecting appropriate adhesives and steel fiber content, the safety and durability of the repaired structures can be significantly enhanced. This approach not only extends the lifespan of the structures but also reduces the economic costs associated with frequent maintenance and reconstruction. In large infrastructure projects such as bridges and highways, the reliability of the PUC–NC interface ensures the smooth operation of transportation systems, safeguards public safety, and contributes to the sustainable development of the construction industry.
  • Novelty of This Research
  • A comprehensive evaluation of the influence of various factors, including interface treatment protocols, adhesive formulations, and steel fiber incorporation, on the interfacial bond strength has been carried out.
  • A generalized predictive model for the shear strength of the PUC–NC interface, applicable to a variety of concrete substrate surface treatment techniques, has been established.
  • The failure mechanisms of the PUC–NC interface under different surface treatment conditions have been systematically investigated through room-temperature oblique shear testing.
While much research has focused on the mechanical and durability properties of polyurethane additives in mortars, studies on PUC used for concrete repair are still limited. This study focuses on investigating the impact of various factors on the bond strength between PUC and NC at their interface. Inclined shear tests are conducted on cast-in-place PUC–NC specimens at ambient temperature, followed by an examination of the shear performance and failure modes of the PUC–NC interface with different surface treatments, including smooth, roughened, and grooved surfaces. The effects of interface adhesives and steel fiber content on the shear strength of the PUC–NC interface are also discussed. Using the shear strength of the PUC–NC interface, the existing models are evaluated, and an improved predictive model for the shear strength of the PUC–NC interface is proposed and validated.

2. Materials and Methods

2.1. Raw Materials

2.1.1. Polyurethane Concrete (PUC)

Polyurethane is a polymer material with strong adhesive properties. The test used a two-component PUC. According to the manufacturer’s material specifications, the chemical composition and mixing ratio of the PUC used in this study are shown in Table 1. Part 1 consists of a blend of polyether polyols (white material), made up of 90% polyether polyol and 10% crosslinking agent. The polyurethane’s mechanical strength is enhanced by the formation of urethane bonds through the polymerization reaction between polyether (Part 1) and isocyanates (Part 2). The aggregate consists of coarse aggregate, mixed in a 1:1 ratio by mass (diameters 4.75 mm and 2.36 mm). Cement (Part 3) serves as a filler, playing a key role in providing filling and compaction to form a dense skeletal structure. Molecular sieve activated powder (Part 4) acts as a desiccant, reducing polyurethane foaming due to moisture. Its physical and chemical properties are shown in Table 2.

2.1.2. Normal Concrete (NC)

This study used ordinary Portland cement with a strength grade of P.O 42.5, provided by Jiutai Building Materials Factory (Changchun City, Jilin Province, China). Its physical properties are listed in Table 3. The coarse aggregate consists of well-graded crushed stones with a particle size range of 5–25 mm. The fine aggregate is continuous-grade natural river sand with a fineness modulus of 2.6. The high-efficiency water reducer is produced by Dongfang Concrete Manufacturer (Guangzhou City, Guangdong Province, China). The NC has a strength grade of C40, with the mix ratio shown in Table 4.

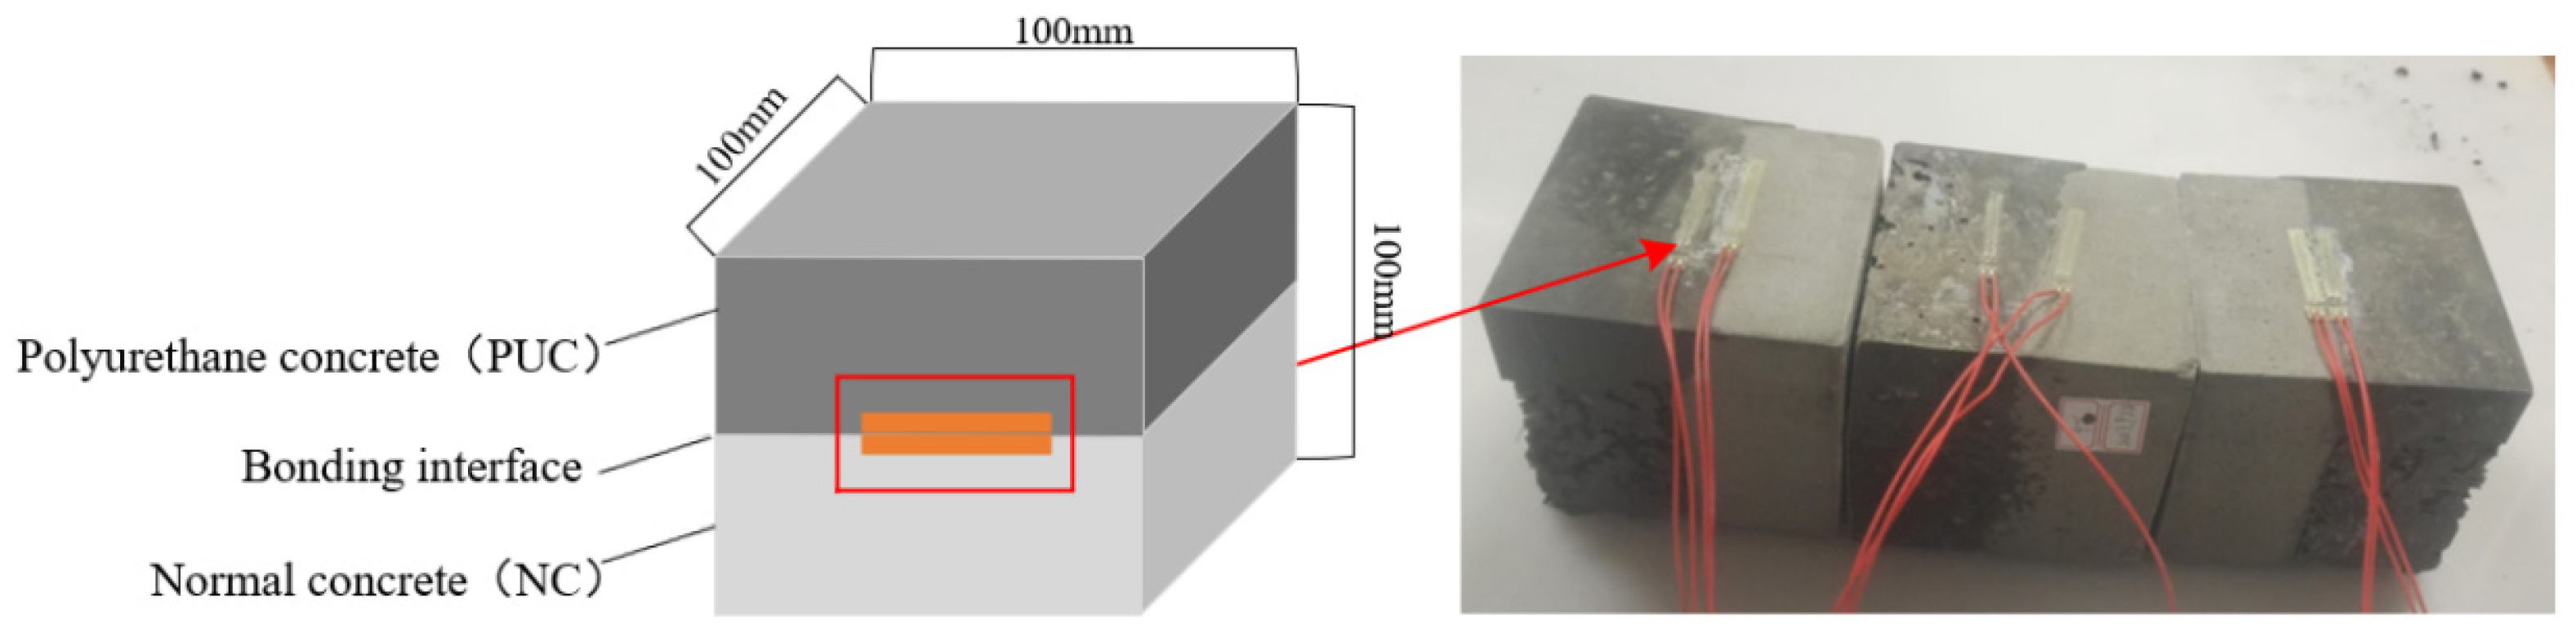
2.2. Preparation of Specimens

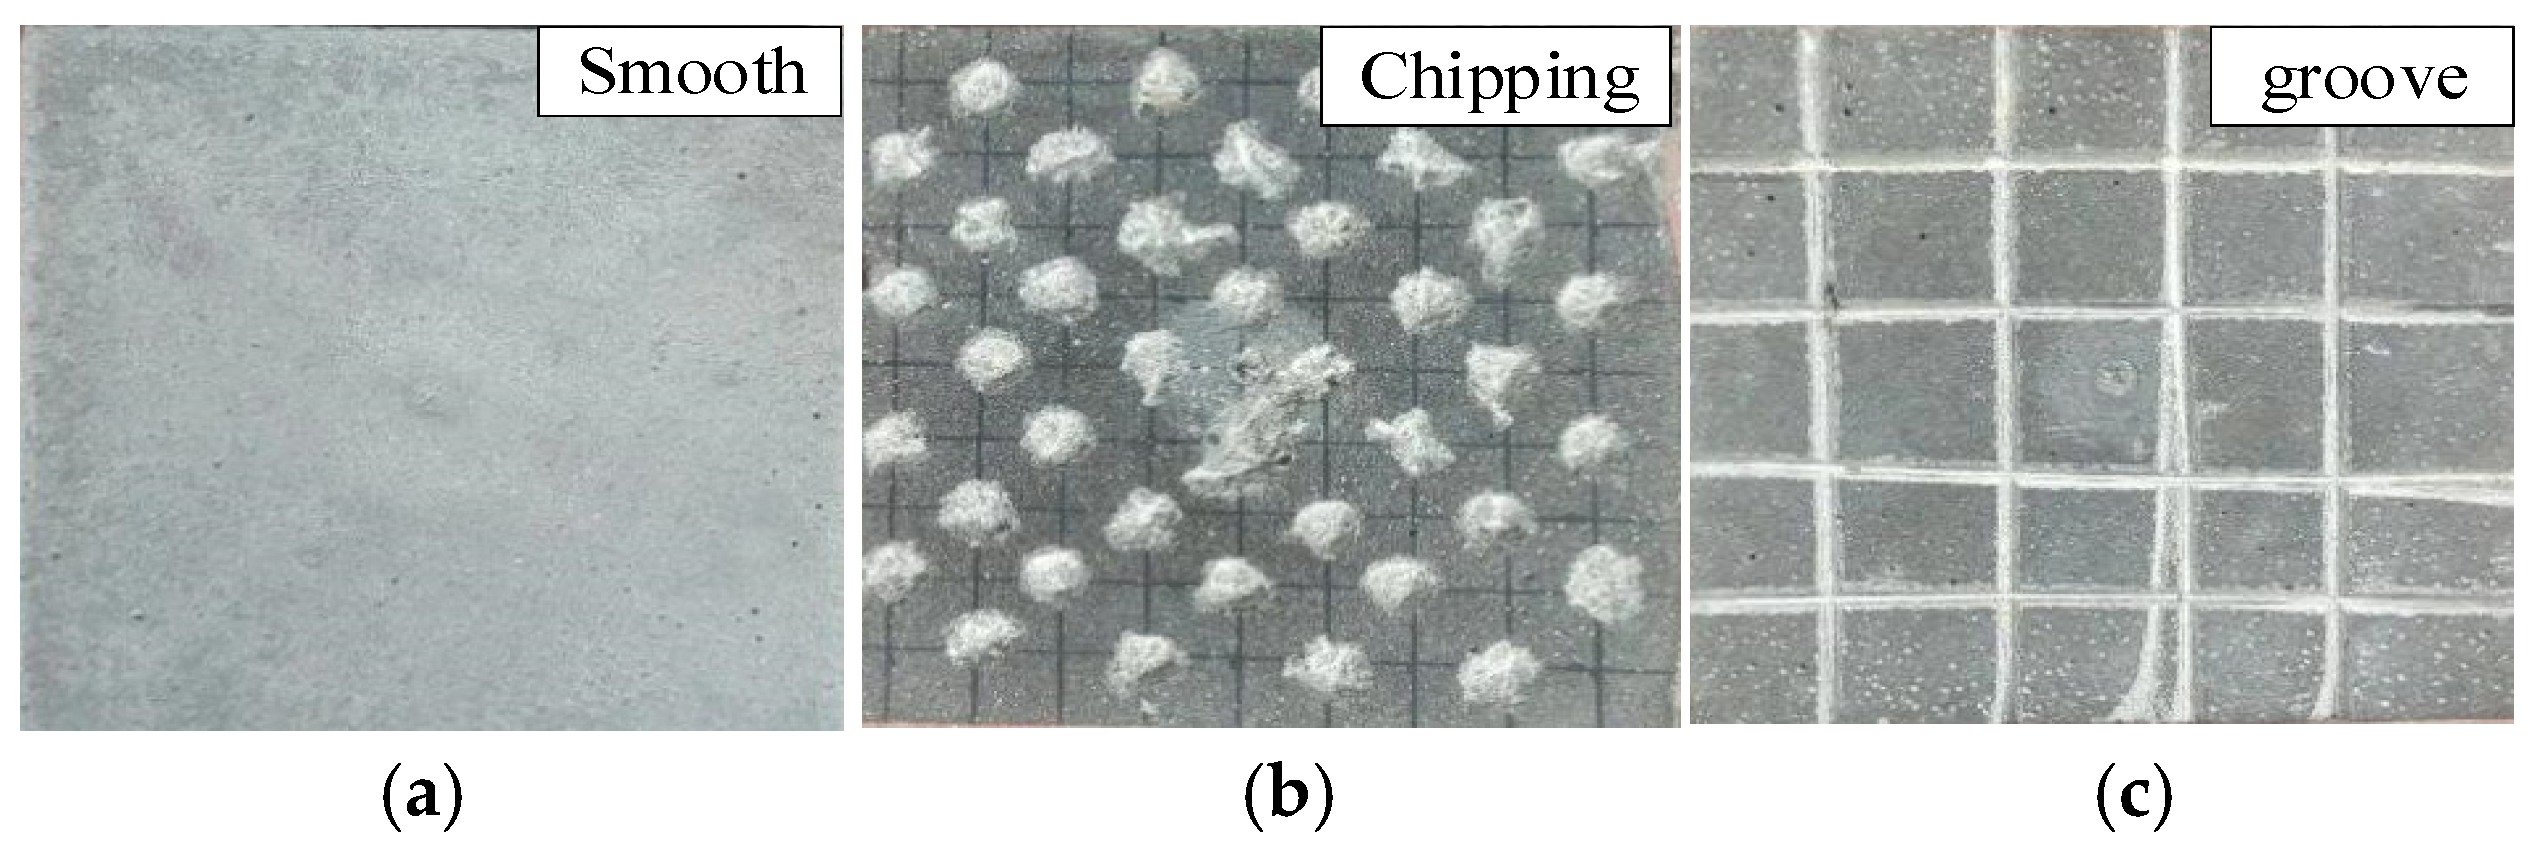
2.2.1. Treatment of Concrete Roughness

As shown in Figure 1, both the PUC and NC layers had a thickness of 50 mm. A total of 7 sets of shear test models were prepared, based on different interface treatment methods for NC. These included one smooth surface group, three roughened surface groups with depths of 2 mm, 3.5 mm, and 5 mm, and three grooved surface groups with groove depths of 2 mm, 3.5 mm, and 5 mm. Additionally, 3 groups of PUC were prepared with different mass fractions of steel fibers (2%, 4%, and 6% of the total solid mass). The PUC–NC interface was treated with adhesive in 6 different amounts (1 g, 1.5 g, 3 g, 5 g, 8 g, and 10 g). In total, 16 sets of models, consisting of 48 shear test specimens (3 specimens per group), were fabricated. The interface bonding agent was prepared by mixing Parts 1 and 2 in a 1:1 mass ratio.
The preparation procedure for the test models was as follows: First, the NC components were cast and cured at room temperature for 14 days. Then, the NC surface was subjected to the appropriate interface treatment or binder application. Finally, the PUC layer was cast over the NC surface, followed by curing at room temperature for a period before loading. In investigating the effect of different steel fiber contents, NC components were cast, and cured at room temperature for 14 days. Then, the steel fiber content in the PUC layer was adjusted before the specimens were cured and loaded. The parameters of the steel fiber are shown in Table 5.
As shown in Figure 2, three methods were used to treat the NC surface, creating different interface roughness levels—smooth (GH), roughened (ZM), and grooved (KC). The specific interface morphology for GH is shown in Figure 2a, where the surface dust was removed and wiped with acetone solution, with no surface damage. The specific morphology for ZM is shown in Figure 2b, where a drill rod and chisel were used to increase the surface roughness. The specific morphology for KC is shown in Figure 2c, where a cutting machine was used to create a 20 mm wide, 2 mm deep grid groove on the NC surface to enhance the interface roughness.

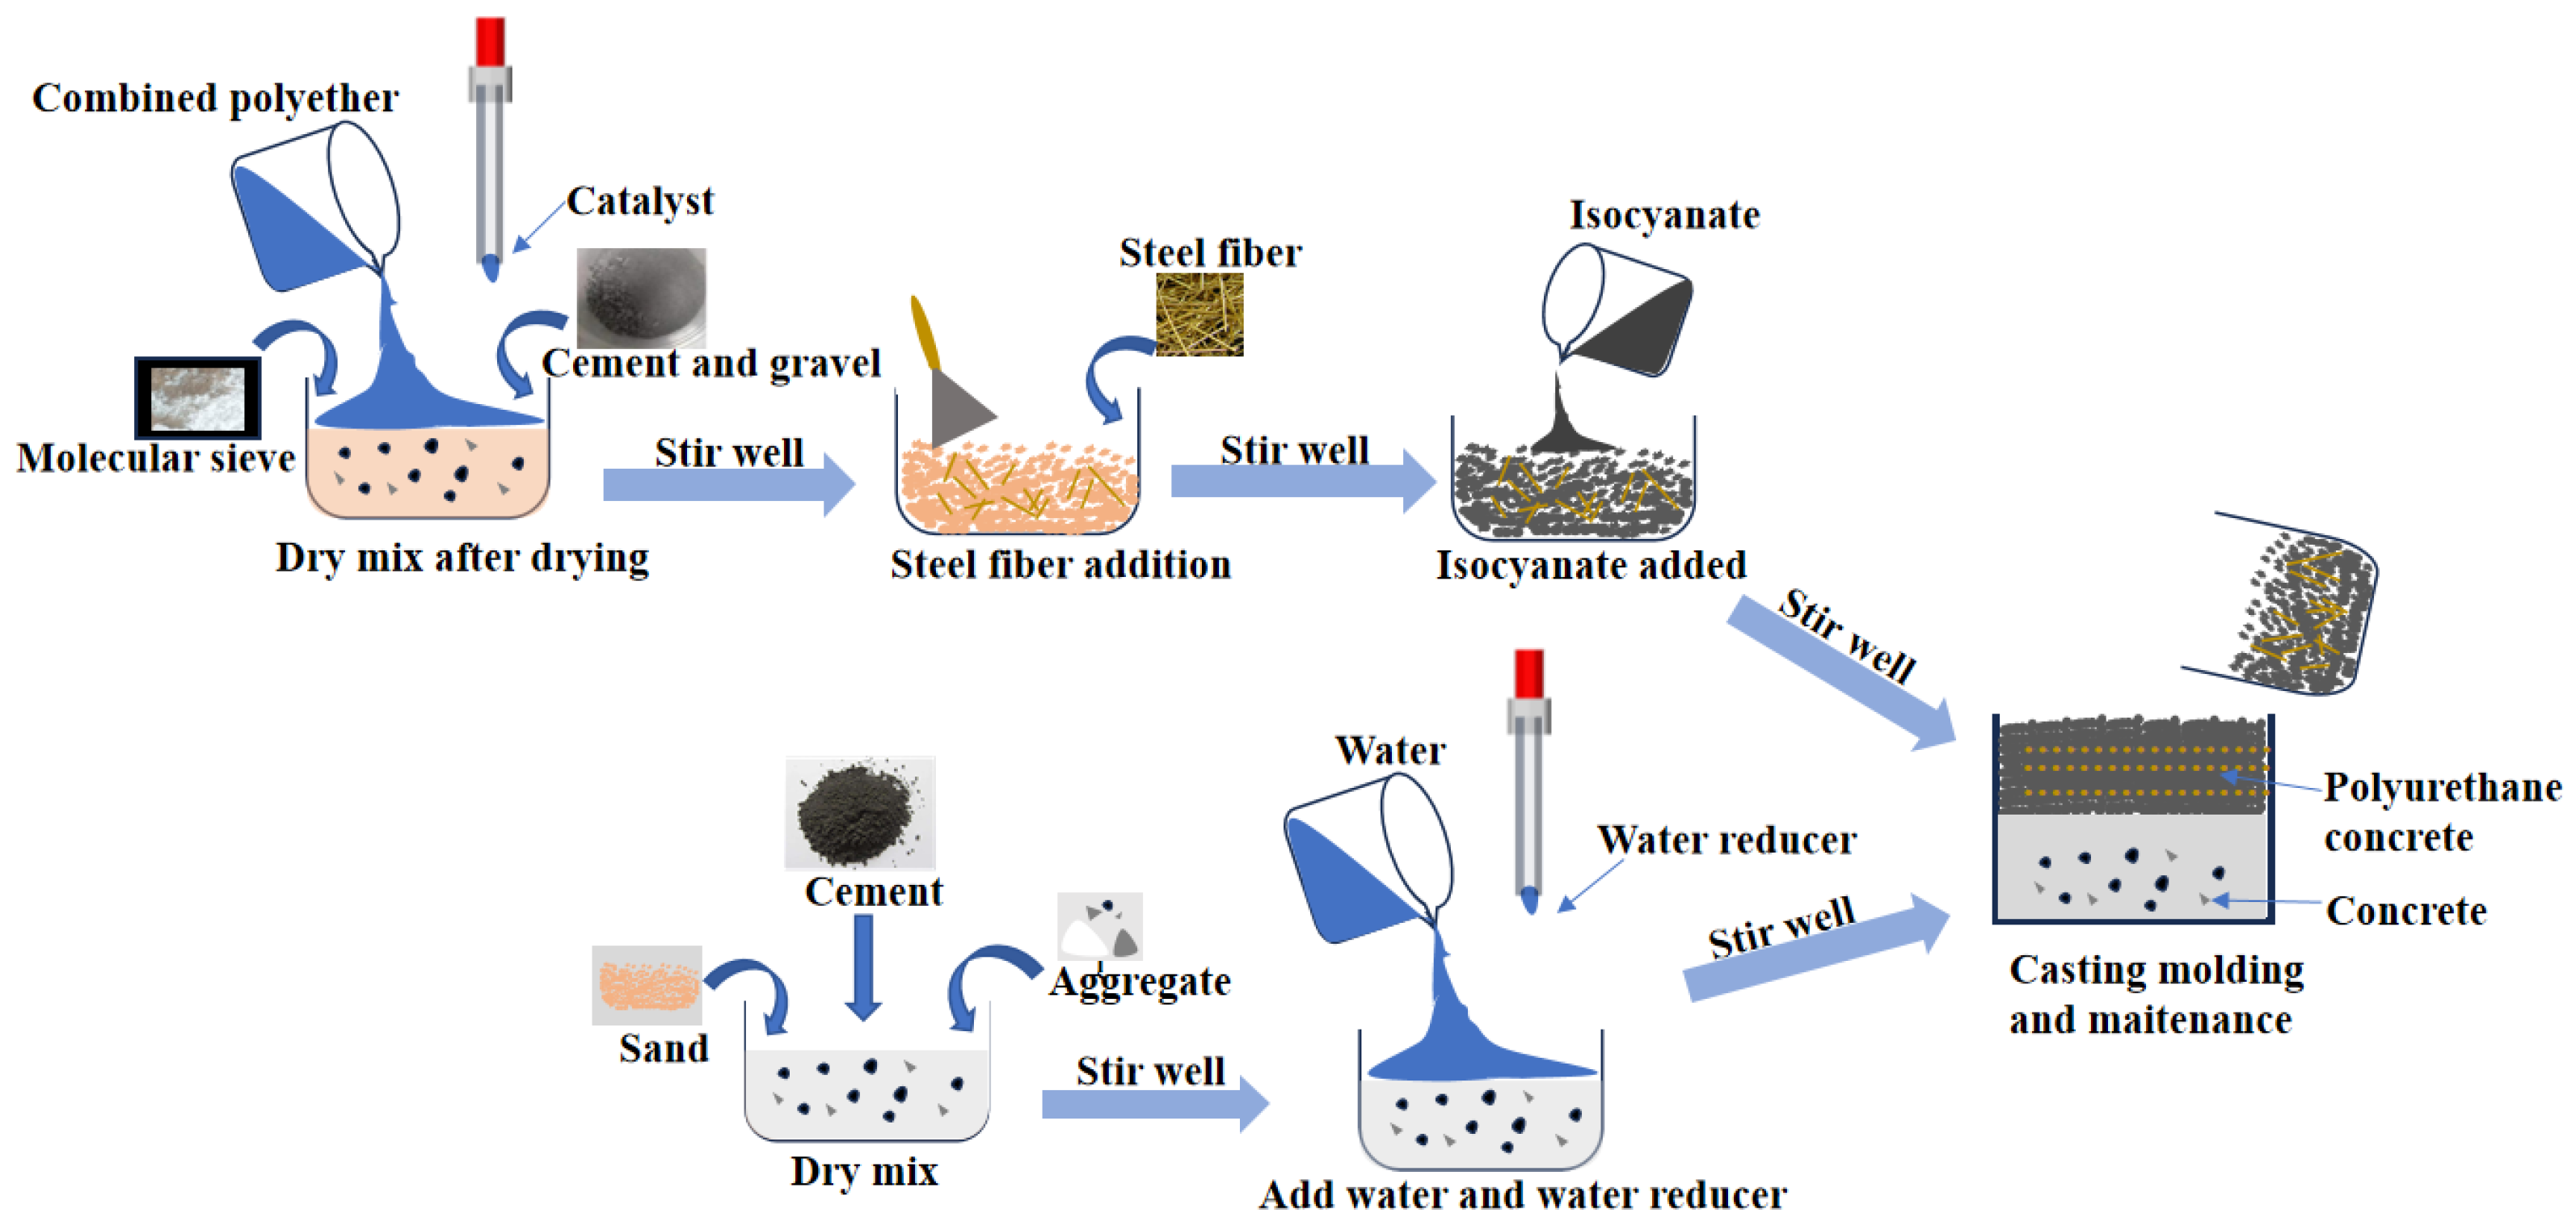
2.2.2. Preparation of Polyurethane Mortar

Before preparation, all materials were placed in an oven and dried at 120 °C for at least 3 h to avoid moisture affecting the polyurethane foaming and strength. The mix was prepared according to the ratio in Table 1. Parts 3 and 4 were first weighed and mixed thoroughly in a container. Then, Part 1 was added along with 3‰ catalyst and mixed for 5–6 min until uniform. Finally, Part 2 was added and mixed until the aggregates were evenly coated with the mortar. The specimen preparation process is shown in Figure 3.

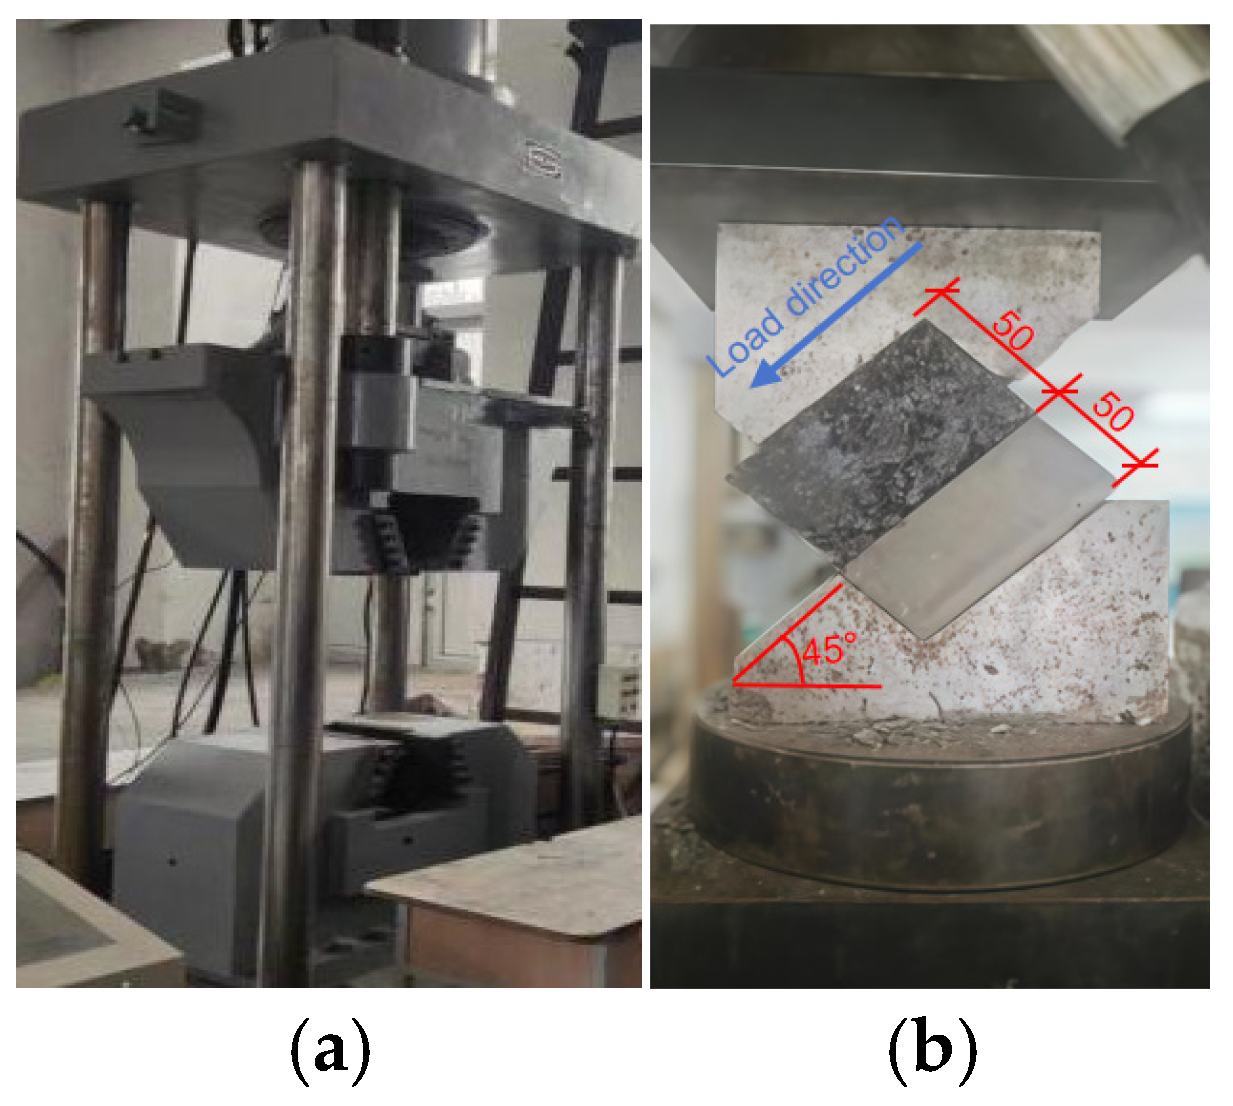
2.3. Test Loading and Measurements

Figure 4 illustrates the use of a press and shear fixture to apply a compressive shear load to the specimens. The interface inclination angle, α, was set to 45°. Strain gauges were symmetrically placed on both sides of the bond interface, with each shear test specimen equipped with two strain gauges for strain data collection. The applied load was measured using a pressure sensor, and the loading rate was set to 10 mm/min.

3. Results

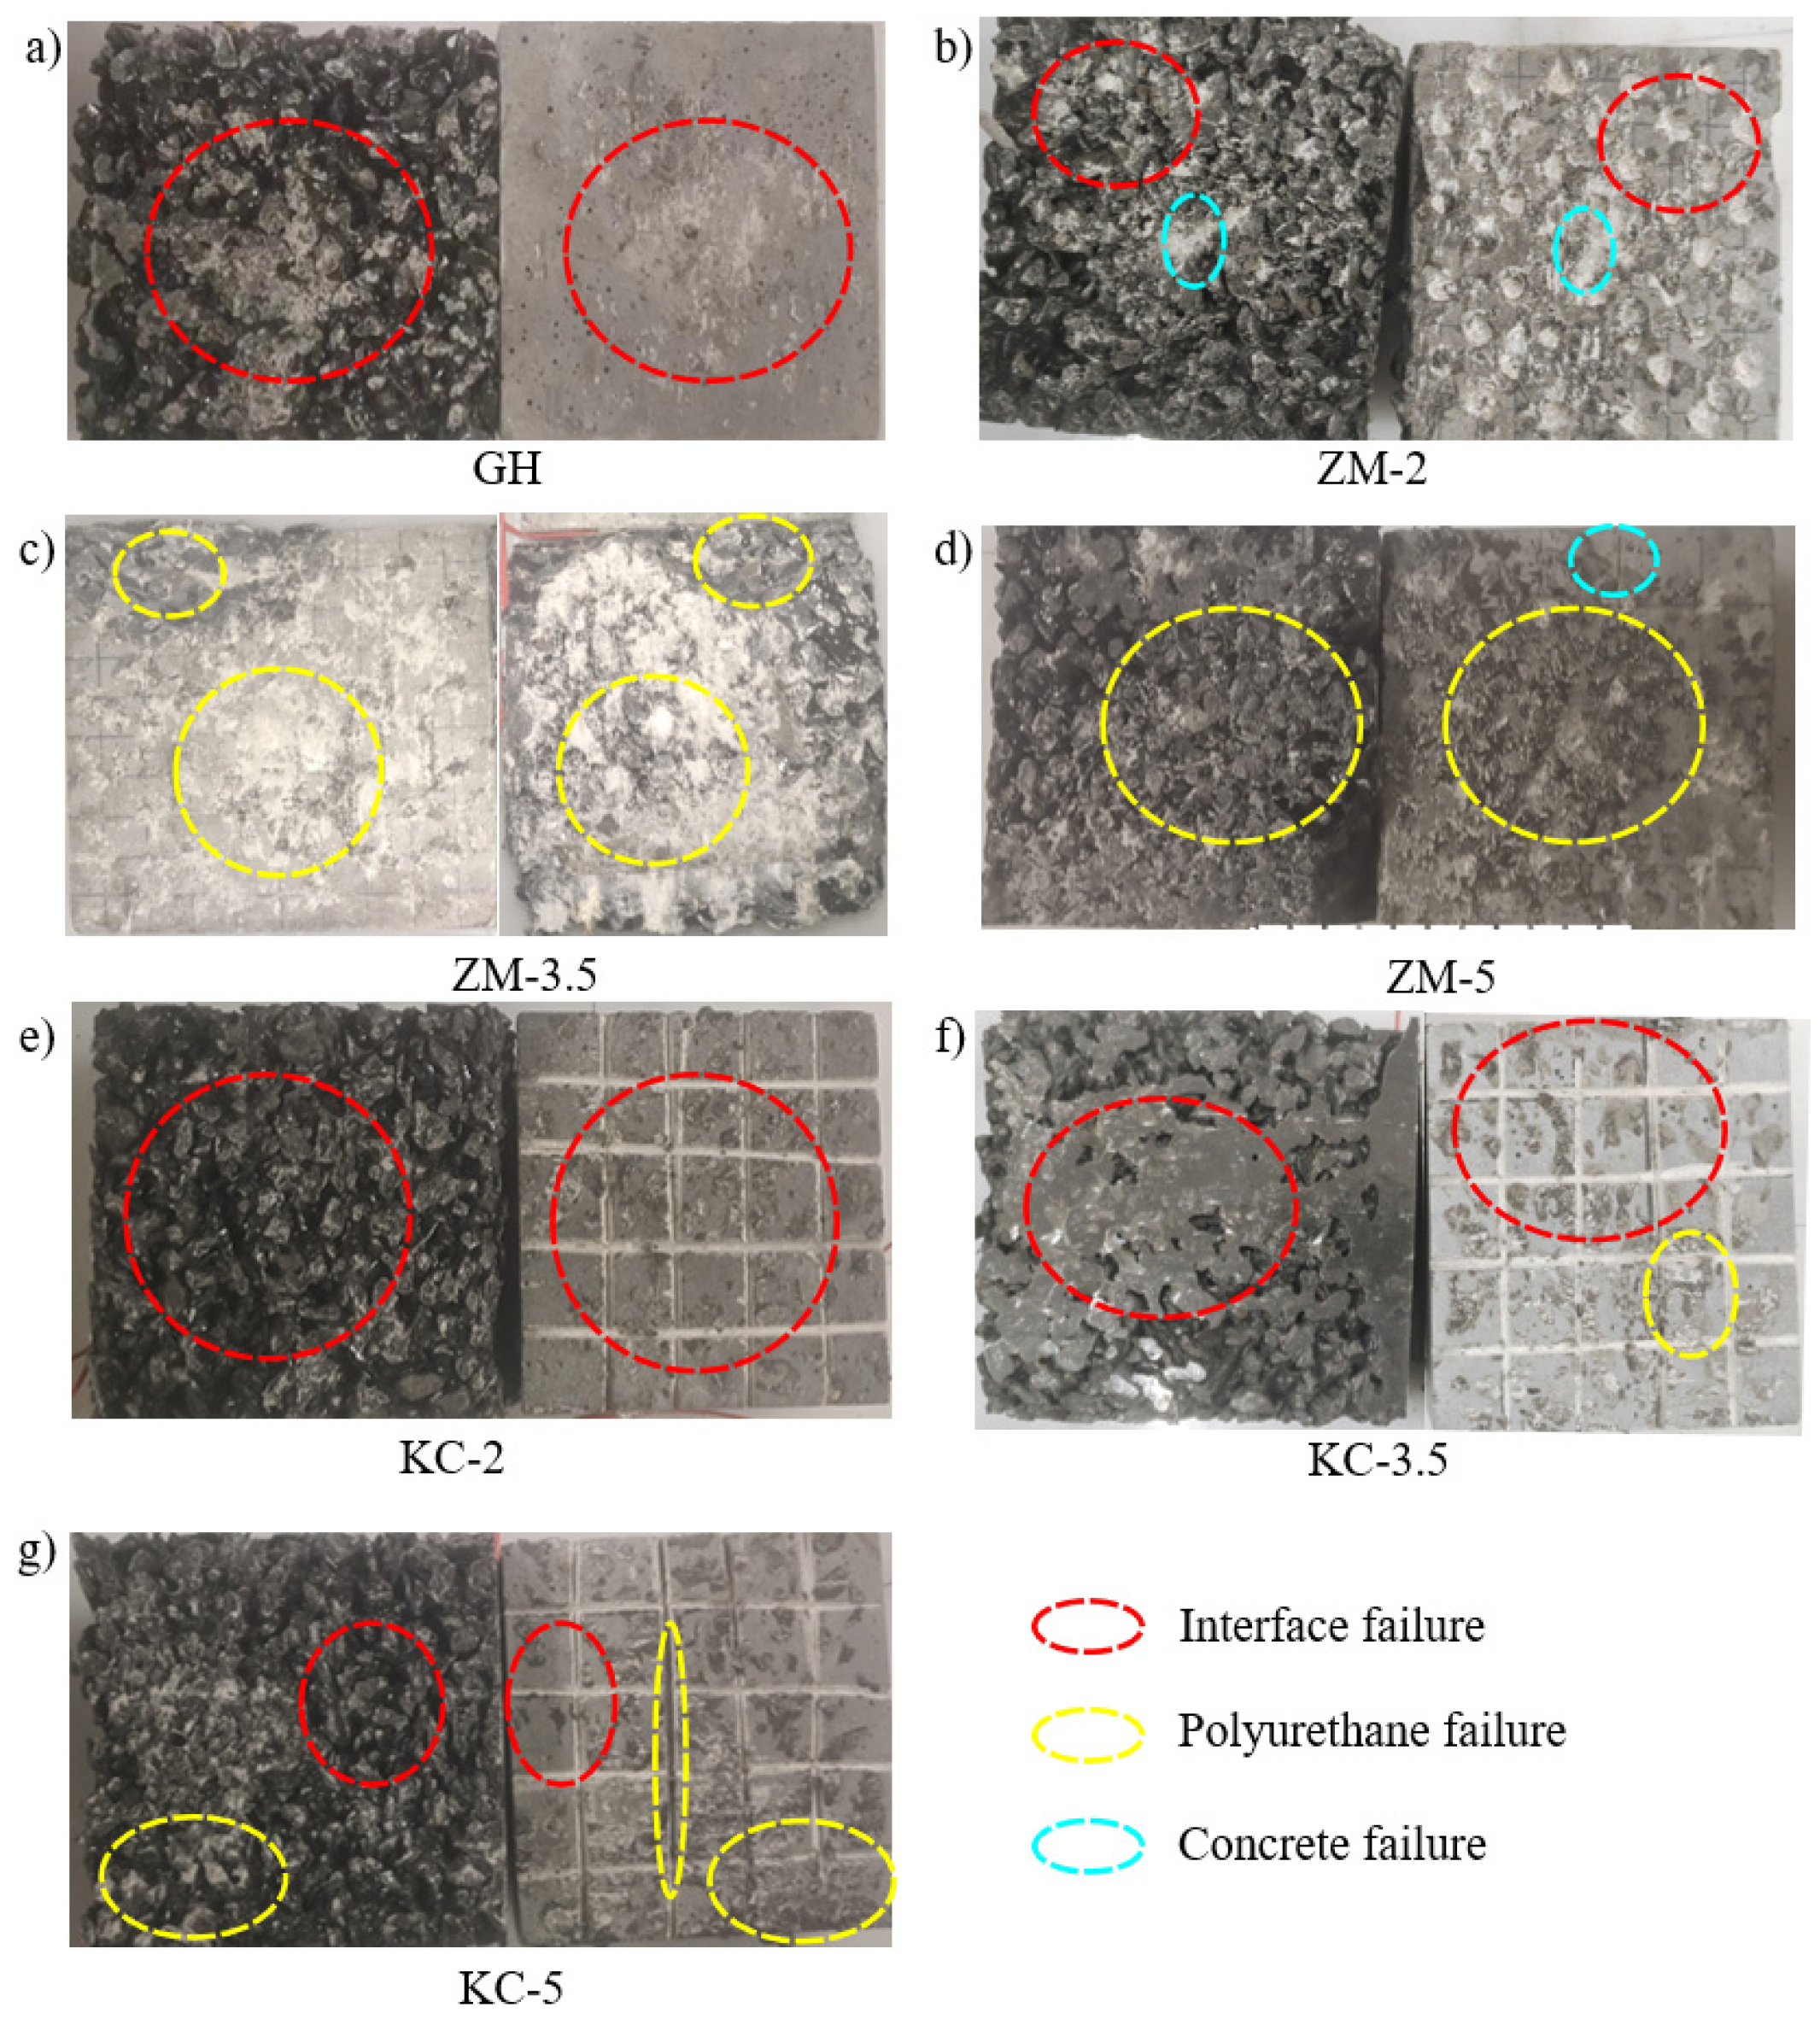
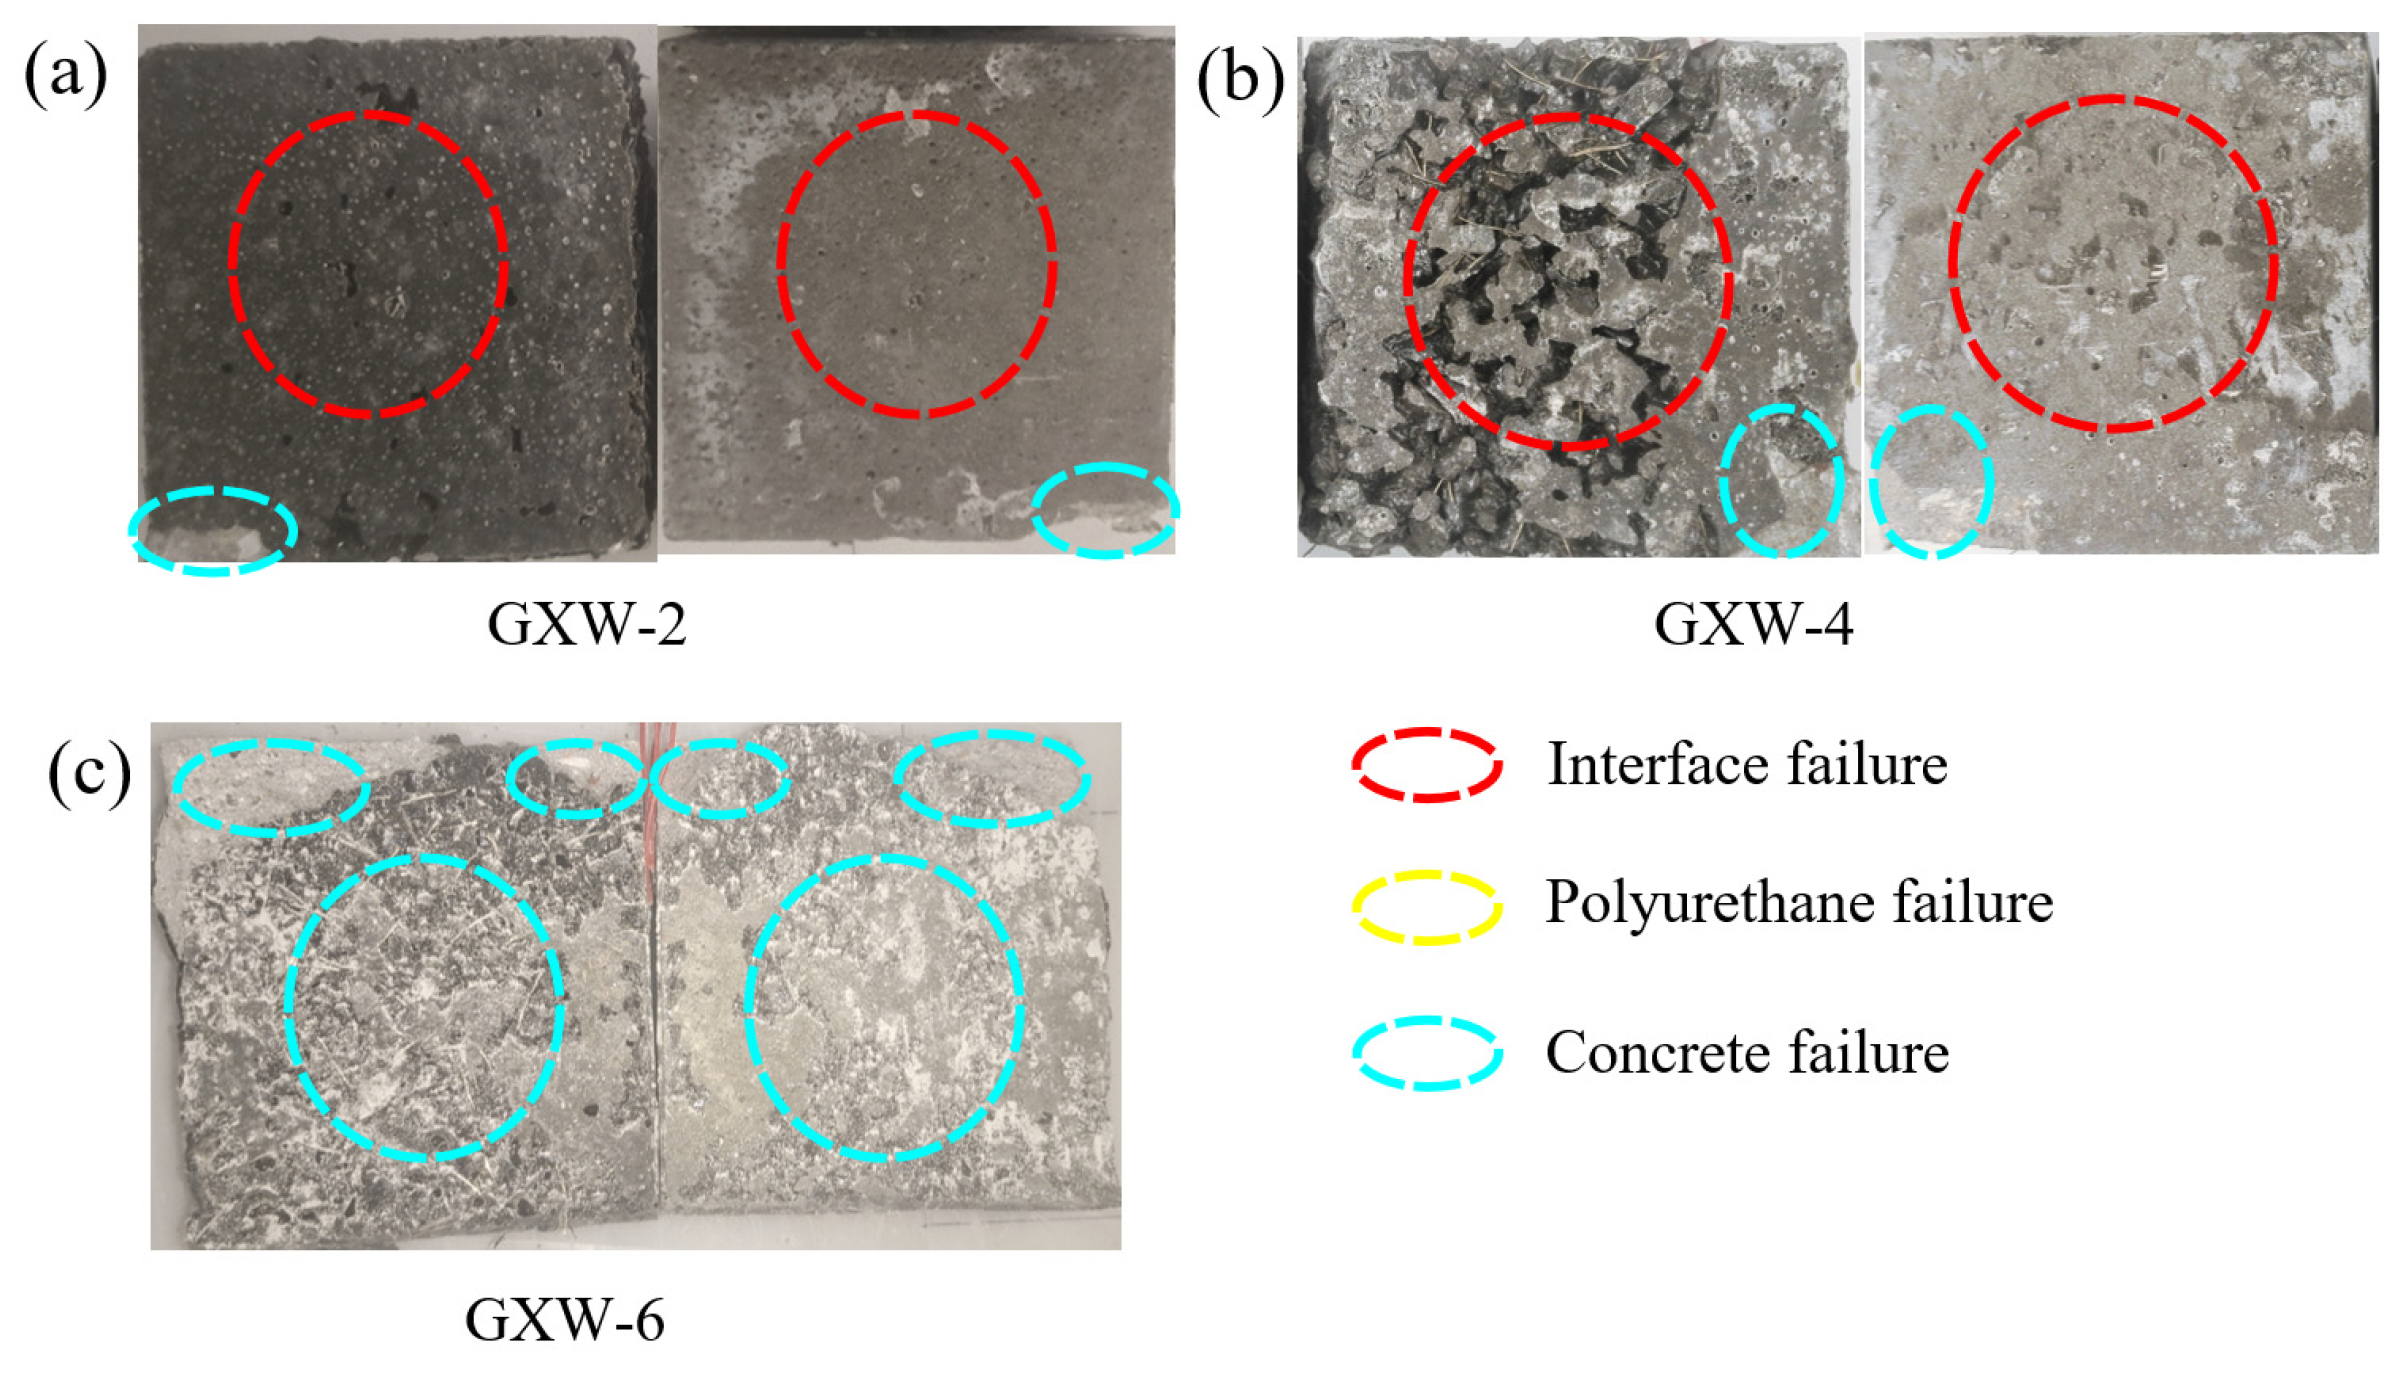
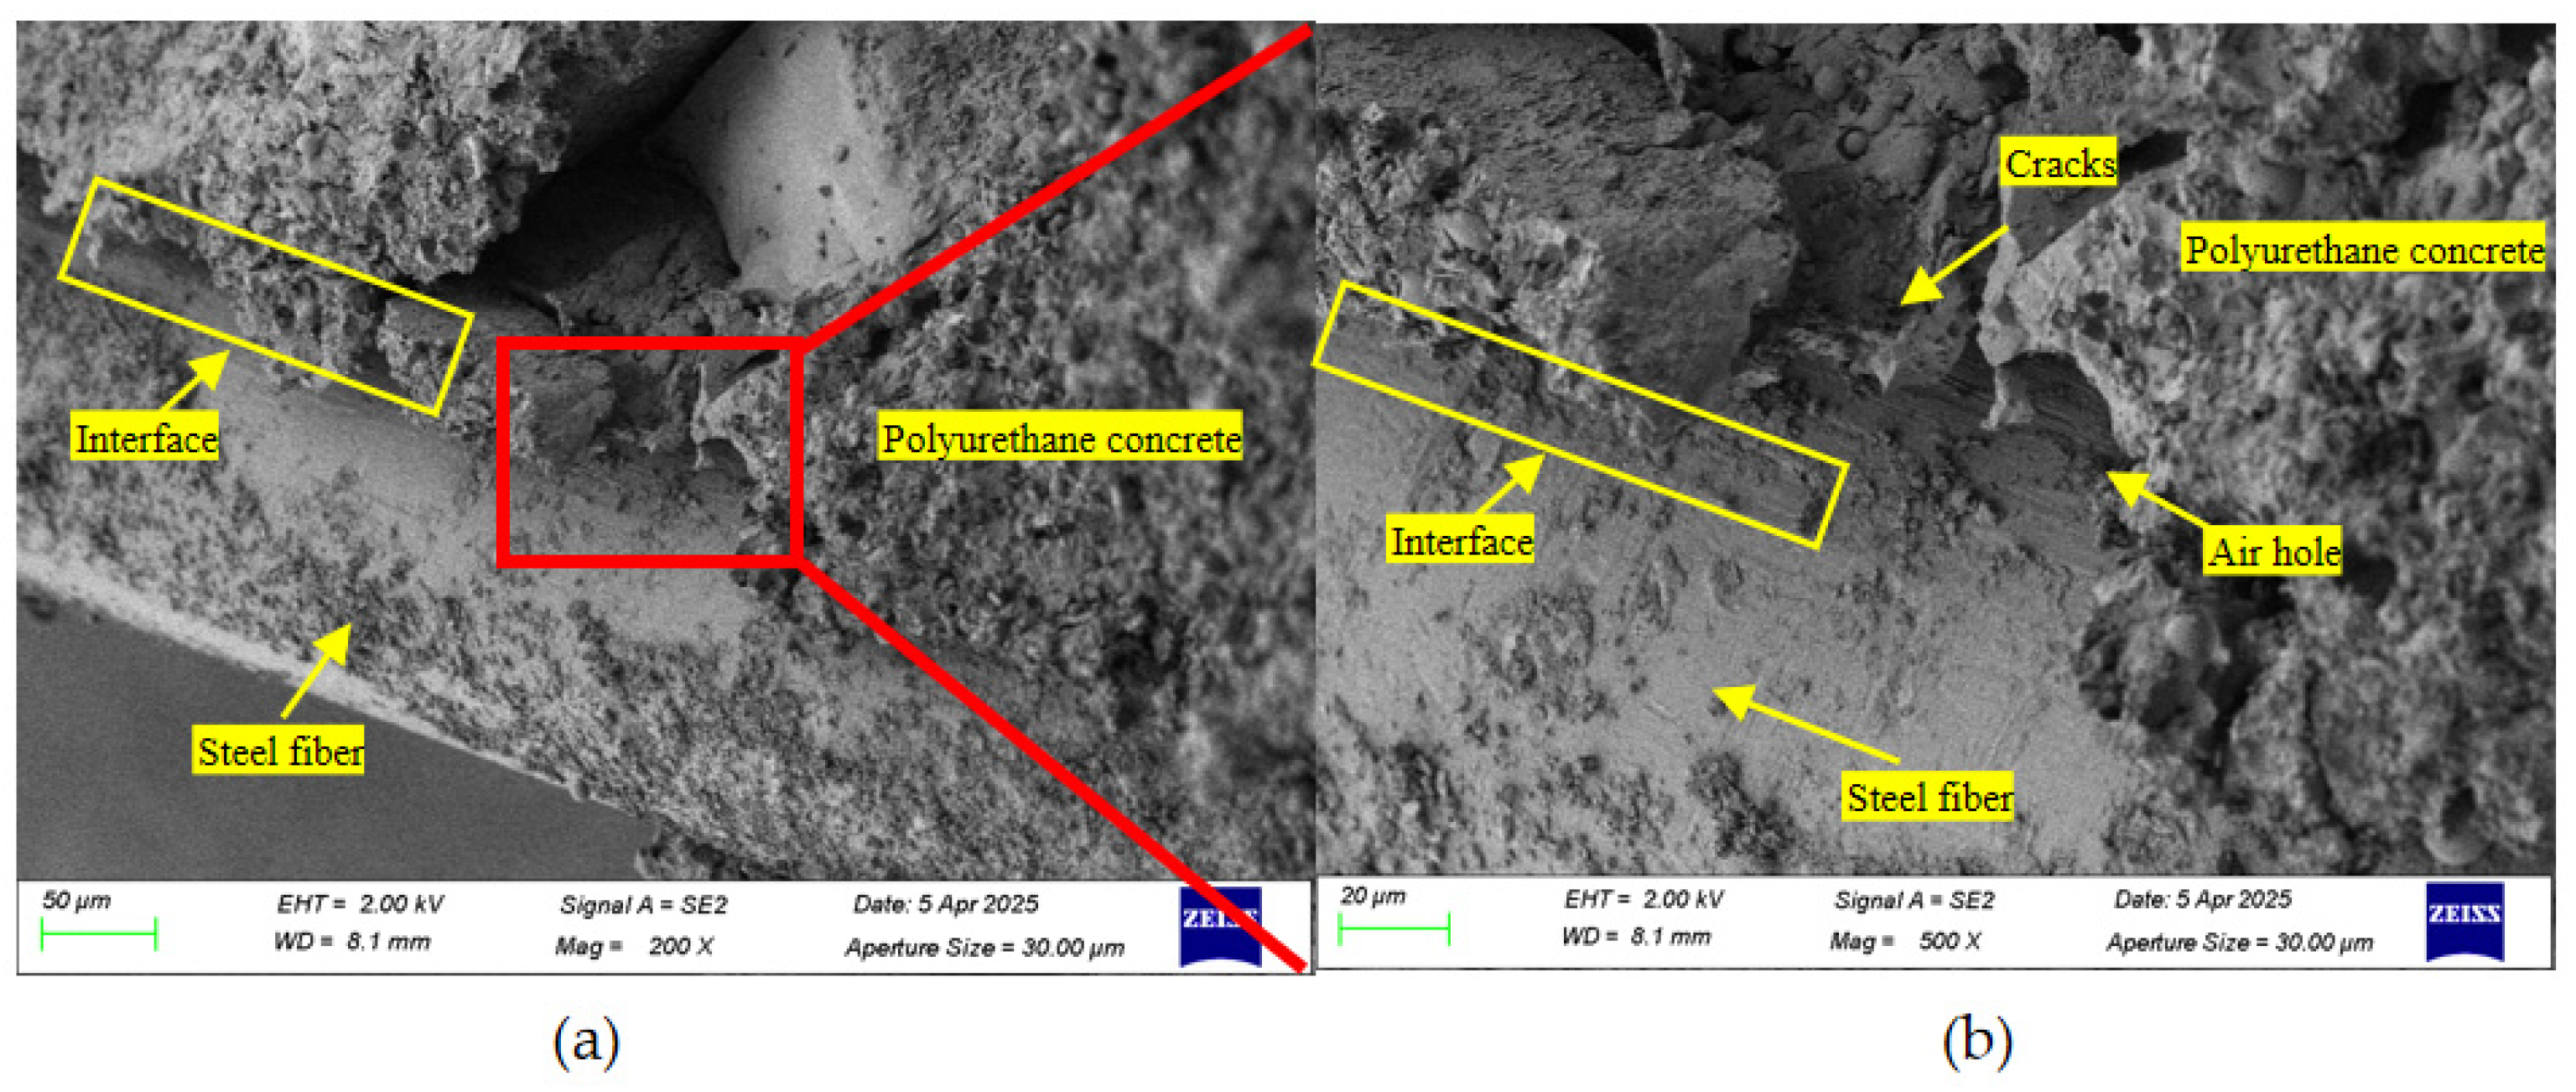
3.1. Failure Modes and Characteristic Values

Figure 5 illustrates the failure modes at the bond interface of the PUC–NC composite specimens. The failure modes of the composite specimens can be classified into four types: interface failure (Type A), PUC failure (Type B), NC shear failure (Type C), mixed failure (Type D), and partial interface failure with partial failure in the NC (Type A/C). These results align with the interface failure modes observed by Li et al. [12] in their study on composite interfaces.
(1)
Interface Failure (Type A): Shear failure occurs along the interface, with no damage or detachment of the NC. The surfaces of the two materials remain smooth or exhibit minimal bonding with NC (bonding area ratio less than 10%), indicating a low bond strength at the interface, leading to direct splitting of the composite specimen from the interface.
(2)
PUC Failure (Type B): The cohesive strength of the NC and the bond strength at the interface are higher than the cohesive strength of the PUC. The composite specimen fails on the PUC side.
(3)
NC Shear Failure (Type C): The NC matrix near the interface experiences shear damage. When failure occurs, a significant amount of NC remains adhered to the PUC surface. The PUC–NC interface remains largely intact, indicating that the cohesive strength of the PUC and the bond strength at the interface are greater than the cohesive strength of the NC, resulting in failure on the concrete side of the specimen.
(4)
Mixed Failure (Type D): This failure mode suggests that a combination of the PUC’s cohesive strength, the concrete’s cohesive strength and the adhesion between the PUC and NC contributes to the bond strength at the interface, leading to damage in both the PUC and NC.
(5)
Partial Interface Failure with Partial NC Failure (Type A/C): This mode involves partial failure of the NC substrate, with shear failure occurring in the transitional zone of the interface and the NC side. A thin layer of NC substrate remains adhered to the surface of the PUC.

3.2. Shear Failure Modes

As shown in Table 6, the ultimate shear strength at the interface indicates that the roughened group (ZM) exhibits a high interface shear performance due to its increased interface roughness. The bonding agent application group (NJJ) ranks second in terms of bond strength between interfaces, followed by the steel fiber addition group (GXW). The grooved group (KC) demonstrates the lowest shear resistance, with varying bond strengths within the groups due to different treatment extents.
Figure 6 presents the shear failure modes at the interface for untreated (GH), roughened (ZM), and grooved (KC) specimens. The left-hand side of the shear failure surface corresponds to the PUC portion, while the right-hand side corresponds to the NC portion. For the untreated GH specimens, the failure mode is characterized by interface failure (Type A), where the bonding interface is relatively smooth, resulting in complete separation between PUC and NC as shown in Figure 6a. Figure 6b–d show the shear failure modes of the ZM group. The failure mode of ZM-2 is similar to the GH group, with only a small amount of NC adhering to the interface. In contrast, ZM-3.5 and ZM-5 specimens exhibit PUC interface failure and a combination of interface failure (A/B), where the residual PUC and NC portions remain bonded at the interface, with some PUC delaminating, while the NC portion remains undamaged and the shear surface is flat. As the roughening depth increases, the bonding depth becomes greater. This is primarily due to the influence of interface roughness, where rougher interfaces result in stronger bonding and deeper bonding penetration. Figure 6e,f depict the shear failure modes for the KC group. As the grooving depth increases, the failure mode transitions from interface failure (Type A) to a combination of PUC failure and interface failure (A/B), with slight remnants of PUC within the grooves, while the NC portion remains smooth.
Figure 7 illustrates the failure modes for specimens with a low steel fiber content (GXW-2 and GXW-4), where the failure mode is classified as (A/C), with a relatively flat shear failure surface and minimal NC adhesion. As the steel fiber content increases, the GXW-6 group exhibits a failure mode where polyurethane partially adheres to a substantial amount of NC matrix or aggregate. The NC portion shows exposed sand and gravel, with a roughened surface, transitioning to a NC failure mode (C), as shown in Figure 7c.
Figure 8 shows the shear failure modes for the bonding agent application group (NJJ). When the application amount of the bonding agent is low (NJJ-1 and NJJ-1.5), the failure mode is characterized by interface failure and NC failure (A/C), with NC delamination. As the amount of bonding agent increases, the shear failure mode gradually transitions from interface failure to a mixed failure (D), with deeper bonding and an increasing bonding area. This indicates that after applying the bonding agent between the two interfaces, the bond strength between the PUC and NC increases, and the interface shear strength can even surpass the material strength of the NC itself. When considering the strain at the point of ultimate load, the shear behavior of the bonding agent application group (NJJ) shows notable ductility, reaching a strain of up to 0.805 mm at complete interface delamination. In contrast, the other groups exhibit interface slip ranging from 0.081 to 0.463 mm at failure, with relatively small strains during the shear failure process.

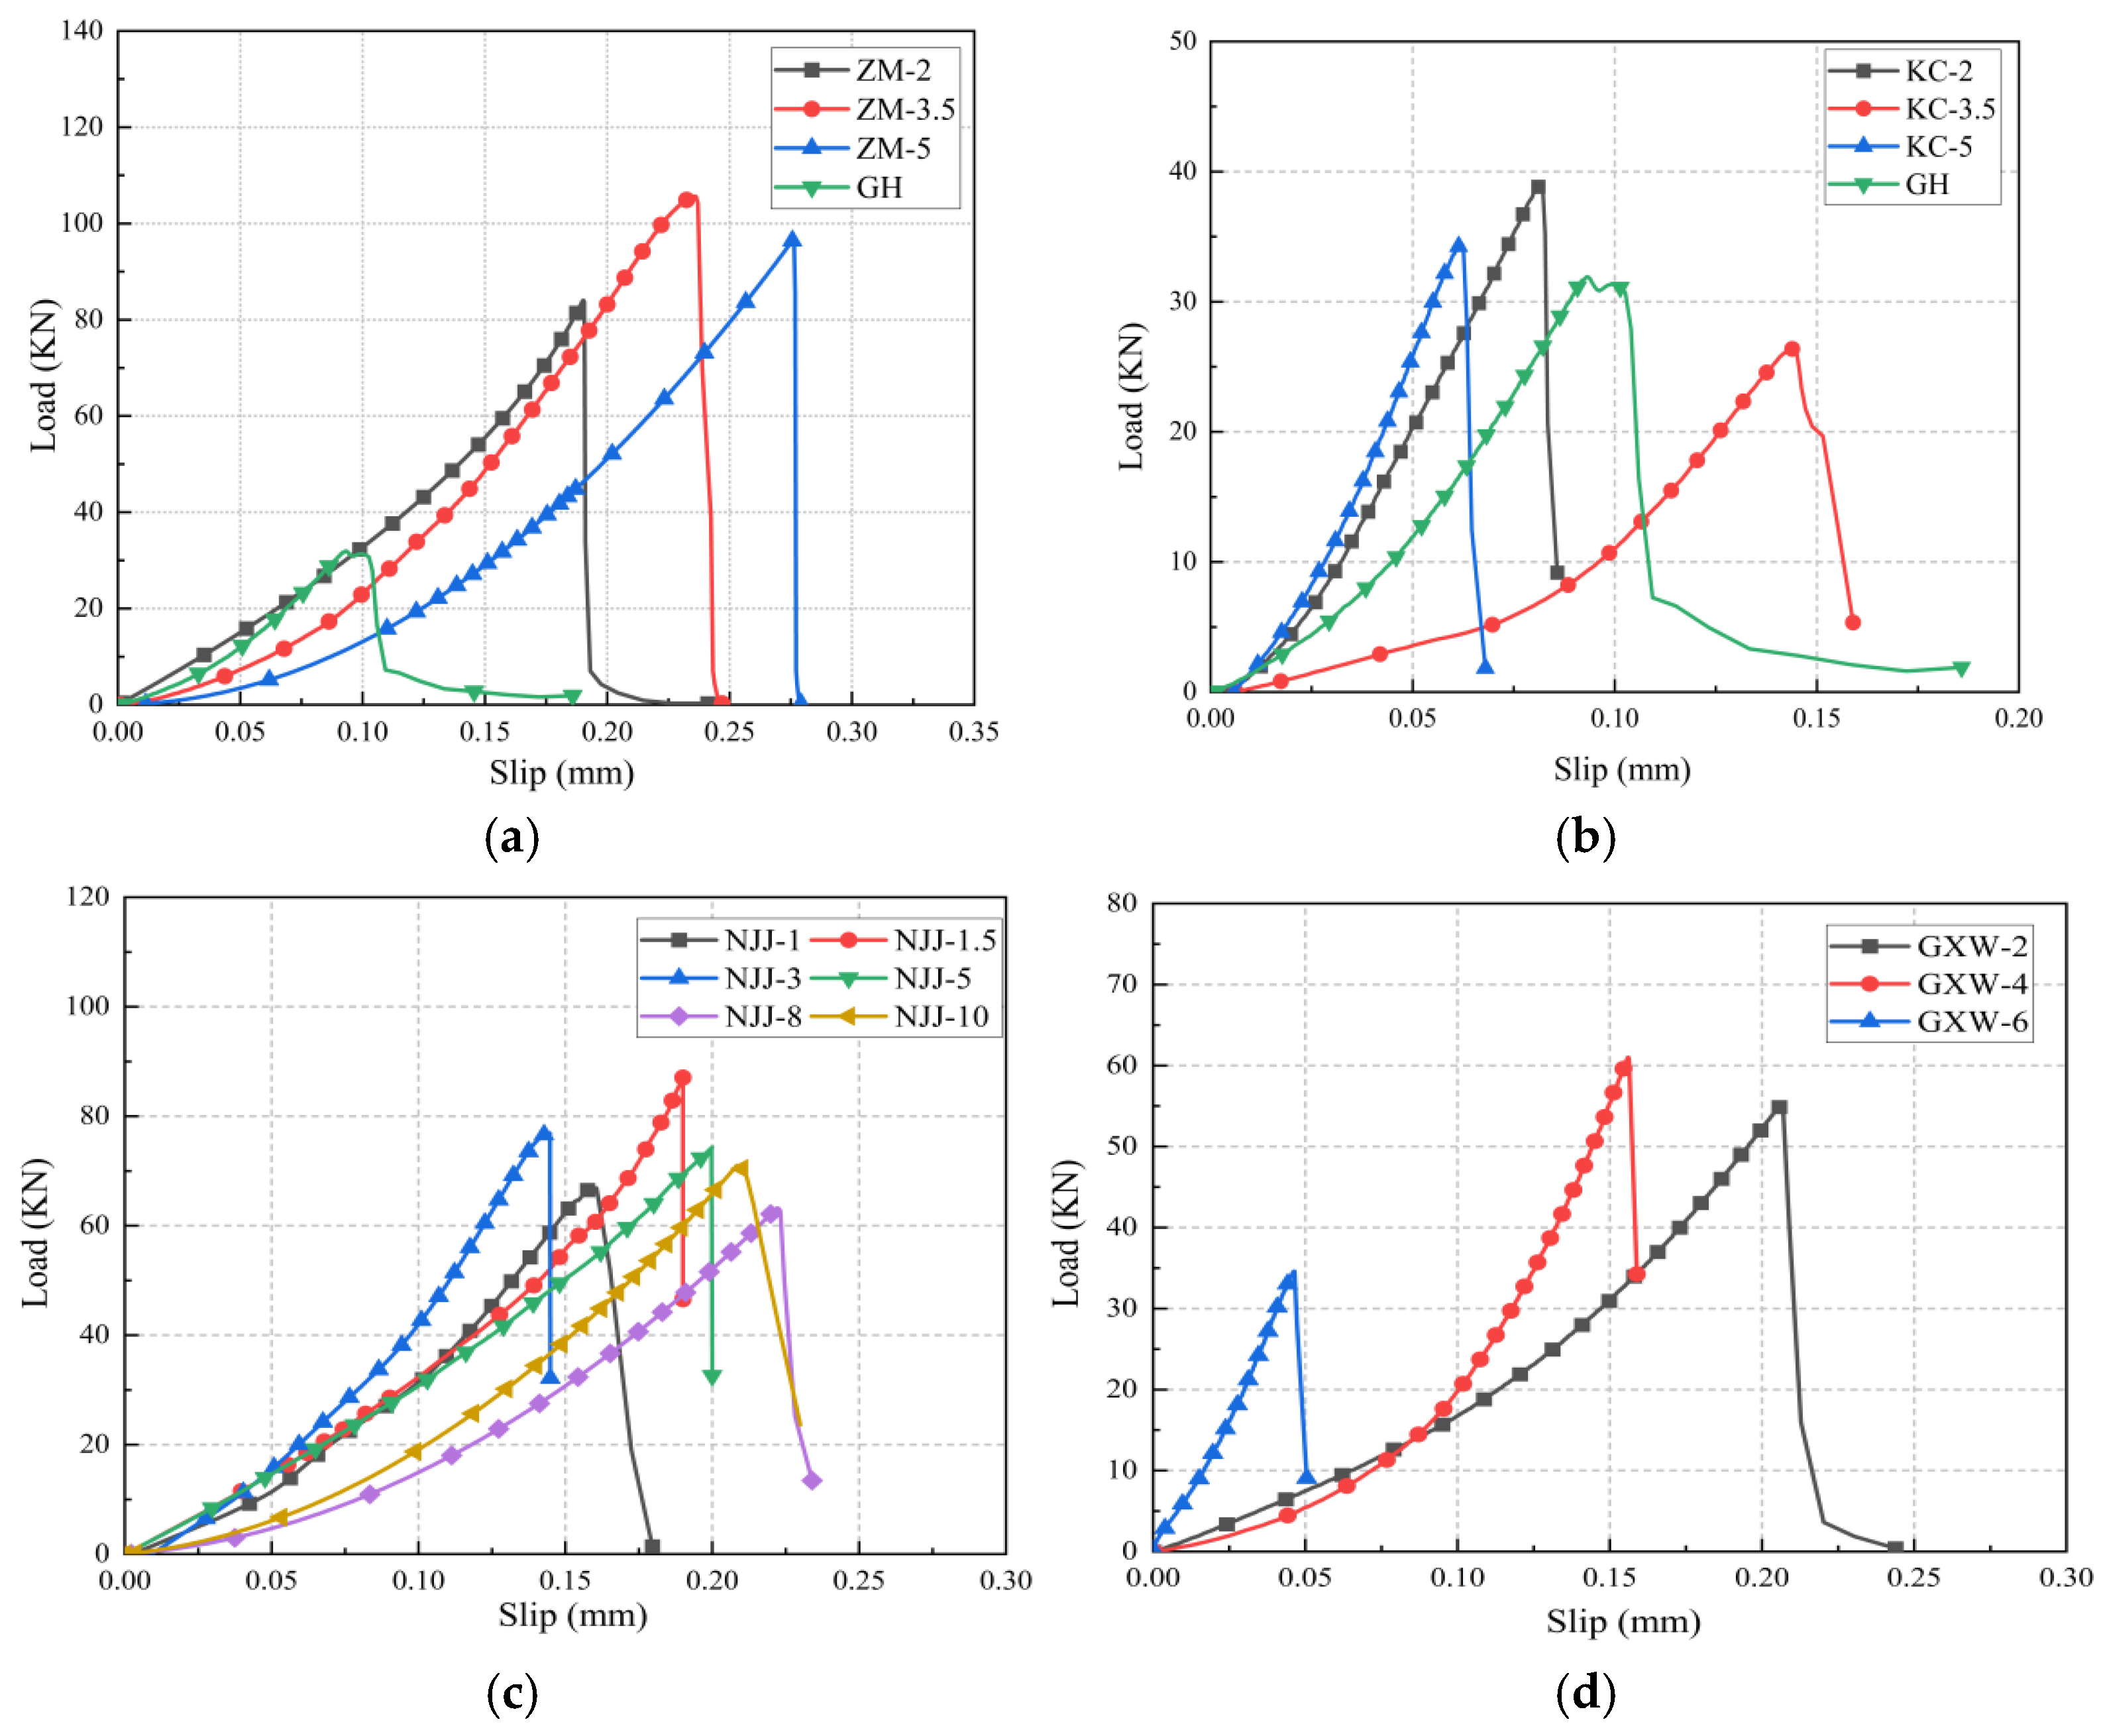
3.3. Load–Displacement Curve

The interface strain values at two locations of the oblique shear specimen were measured using strain gauges at the failure interface. The average of three test results was taken as the strain measurement for the specimen. The load–displacement curve of the PUC–NC interface is shown in Figure 9. Typically, brittle (sudden) interface failure is defined as the abrupt shear of the PUC–NC interface, accompanied by minimal interface slip at failure, with the load–displacement curve showing no horizontal yield or descending phase. In contrast, ductile interface failure is characterized by significant interface slip at the PUC–NC interface failure, exhibiting a certain shear resistance beyond the ultimate load, with a prolonged yield or descending phase in the load–displacement curve.
Figure 9 illustrates that the shear load–displacement curves for all PUC and ordinary NC specimens are similar. The response of the shear load–displacement curve is generally linear until the applied load reaches its maximum value. After reaching the maximum load, the shear load sharply decreases to zero. The entire failure process is brittle, and the interface load–strain curves for all groups essentially do not exhibit a yielding or descending phase, as failure occurs at the PUC–NC interface or the substrate.
The oblique shear strength (τ) of the PUC–NC interface can be calculated using Equation (1):
τ = P u S × sin α
In the equation, S is the specimen’s surface area (mm2), P u is the ultimate load value (N), and α is the angle between the shear plane and the horizontal plane, where α = 45° in this study.
The method for determining the shear stiffness of the PUC–NC interface follows the secant modulus approach used in calculating the shear stiffness of bolt connections. Specifically, an appropriate interface shear force is selected from the linear region of the load–displacement curve for each specimen, and the shear stiffness is approximated by dividing the selected shear force by the corresponding displacement. According to the load–displacement curves shown in Figure 9, the interface load–displacement curves for all groups exhibit an approximately linear behavior before reaching 75% of the ultimate load ( P u ). Therefore, the secant modulus corresponding to 0.7 Pu is used to calculate the shear stiffness of the PUC–NC interface, i.e., 0.7 Pu divided by the corresponding interface displacement ( S 0.7 P u ), as shown in the following equation:
K = 0.7 P u 2 S 0.7 P u
The average values of the measured interface shear strength and shear stiffness for each group of specimens are summarized in Table 7. For ease of comparison, the interface shear strength and shear stiffness for each group are presented as bar charts in Figure 10.
Table 7 presents the shear strength of the PUC–NC interfaces for specimens with different surface treatments. Ranked from the highest to the lowest interface shear strength, the groups are ZM, NJJ, GXW, and KC. The ZM and NJJ groups exhibit higher interface shear strengths, with average values exceeding 4 MPa. Among them, the ZM group performs the best, primarily due to the high interface roughness, which increases the contact area and frictional resistance at the interface. The maximum bond strength reaches 5.28 MPa, representing a 230% increase compared to the GH control group. When the surface roughness increases from 0 mm to 2 mm, the bond strength rapidly increases by 162.5%. However, when the roughness value increases from 2 mm to 3.5 mm, the growth in bond strength becomes relatively smaller, with a corresponding growth rate of 25.71%. Conversely, the KC group shows the lowest interface shear strength (less than 2 MPa) because the large coarse aggregate in the PUC, which affects the flow of colloidal material into the grooves, results in poor interface bonding. This is a key factor influencing the PUC–NC interface shear strength. For the KC group, the relatively smooth interface or lower roughness, combined with the absence of bonding agents, results in lower interface shear strength. When the groove depth is 2 mm, the shear strength increases by 21.25%. From these results, substrate roughness significantly affects bond strength. However, increasing roughness only substantially enhances interface performance within a certain range. Beyond this range, further roughness increases do not result in significant bond strength improvements. This is attributed to the change in the relative contribution of mechanical interlocking and chemical bonding forces as the roughness increases, which results in a reduced enhancement of bond strength beyond a certain roughness level. Similar phenomena have been reported in the study by Li et al. [12], who observed that bond strength first increases with roughness before decreasing. A critical roughness value exists where bond strength reaches its maximum. At low temperatures, interface bonding performance typically improves with increasing roughness. This is likely because bond strength at low temperatures is primarily provided by mechanical interlocking forces. Therefore, increasing surface roughness is an important method to improve shear bond strength.
The NJJ group utilizes the bonding agent to enhance the bond performance between the PUC and the adjacent NC materials. Generally, the contact area, mechanical interlocking, and frictional resistance are increased for both the ZM and NJJ groups. The maximum interface bond strength of the NJJ-1.5 group is 4.35 MPa, a 190.6% increase compared to the GH group. However, when the amount of bonding agent exceeds 1.5 g, the bond strength decreases. The GXW group has a lower interface bond strength, but the average strength still exceeds 2.5 MPa, mainly due to the adhesion of steel fibers, which enhances the bond strength and mechanical interlocking at the interface. At a steel fiber content of 4%, the shear strength reaches its maximum value of 3.05 MPa, an increase of 90.06% compared to the GH group. For steel fiber contents between 0% and 2%, the shear strength increases by 71.8%; from 2% to 4%, the increase slows, with a corresponding growth rate of 10.71%; however, when the steel fiber content increases from 4% to 6%, the shear strength decreases by 43.28%. Therefore, within a certain range of interface agents and steel fiber content, interface performance can be significantly improved. Excessive fibers may lead to agglomeration, diminish effective mechanical interlocking, and introduce defects (such as voids) that impair interfacial bonding, altering the shear load–displacement behavior by reducing the peak strength and stiffness. Figure 11 shows a scanning electron microscope image of PUC reinforced with steel fibers. Irregular voids around the steel fibers were observed, likely resulting from air entrapment during fiber placement or insufficient infiltration of the matrix slurry into the fiber gaps. Figure 11b presents a high-magnification SEM image, revealing distinct gaps and small voids at the fiber–matrix interface, with localized cracks propagating along the fiber axis. In regions of fiber agglomeration, the rough surface texture is obscured due to fiber-to-fiber compression, preventing complete matrix coverage of the fibers and reducing the effective mechanical interlocking area. These microscopic defects significantly impact the interfacial performance: the voids around agglomerates act as initial stress concentrators, promoting rapid crack propagation under shear loading, which leads to a reduction in peak interfacial strength; the gaps and voids between the fibers and the matrix shorten the effective bond length, weakening the shear load transfer capability at the interface.
The shear strength of the NJJ group reaches 82.44% of that of the ZM group, while the GXW group reaches 57.7% of the ZM group’s interface shear strength. Finally, the KC group only reaches 36.74% of the ZM group’s shear strength, representing a significant gap.
From the perspective of interface shear stiffness, the KC-5 group, with a low surface roughness and smaller groove dimensions, shows the smallest elastic slip and the highest interface stiffness (268.29 kN/mm). This indicates that the KC-5 and NJJ-3 specimens possess relatively poor interface shear ductility under normal use conditions. The ZM, NJJ, and KC groups exhibit a relatively high interface shear stiffness in their elastic stages. The interface shear stiffness of the GXW group ranges from 13.93% to 72.8% of that of the KC group. Furthermore, comparison reveals that the higher the roughness of the NC surface, the lower the shear stiffness of the PUC–NC interface. Although the use of interface adhesives enhances the shear stiffness of the PUC–NC interface, it results in a lower shear strength and significantly higher brittleness under normal use conditions.

4. Constitutive Model for PUC–NC Interface Bonding Performance

The constitutive model for bonding performance plays a crucial role in the microstructural analysis of structures or components. The current interface bond–slip constitutive relationship can be obtained through two methods: placing strain gauges on the bonding interface to calculate the bond stress and slip at the interface through axial strain, which then allows the derivation of the bond–slip constitutive relationship; or by obtaining the load–slip curve through testing equipment or auxiliary instruments, from which the bond–slip curve can be further deduced.
Table 8 presents four bonding constitutive models for analyzing the bond–slip relationship between PUC and NC in this study. The models by Neubauer et al., Nakaba et al., and Savoia et al. all assume that the failure of the bonding interface is brittle in these models, meaning the interface fails suddenly after reaching the maximum load and can no longer transmit stress. The Nakaba et al. model effectively characterizes this process using a simplified bond–slip relationship, while the Savoia et al. model improves upon the Nakaba model by introducing empirical constants to enhance its applicability, particularly under varying materials and geometries. In contrast, the bilinear model assumes plastic failure dividing the bond–slip relationship into two stages: an initial linear increase, followed by a plastic stage, where the interface retains some load-bearing capacity after failure, exhibiting characteristics of partial plastic failure. Overall, the first two models focus on simulating brittle failure mechanisms, while the bilinear model considers the post-failure plastic behavior.
Figure 12 presents the simulation results of shear strength between PUC and NC using four bond constitutive models, along with a comparison to experimental data. The error plot assesses the agreement between the simulation results and experimental data based on the diagonal line. The results indicate that the models by Neubauer et al. and the bilinear model underestimate the shear strength of the PUC–NC interface, while the models by Nakaba et al. and Savoia et al. exhibit significant scatter in their predictions. In this study, the failure mode observed in the experimental load–slip curve was brittle, which closely matches the model by Nakaba et al. This model is fundamentally based on the assumption of brittle failure and effectively captures the failure mechanism of the bond interface after reaching the failure load.
The proposed model is still developed within the framework of Nakaba et al. The Nakaba model provides a concise and effective linear relationship that reveals the correlation between initial bond strength and slip displacement, particularly in terms of interface stiffness and load-bearing capacity at small slip displacements. Although the interface between PUC and NC may exhibit some nonlinear behavior, the Nakaba model is considered a reasonable starting point for analyzing the bond–slip relationship. The model demonstrates strong adaptability, allowing for adjustments based on varying material properties and geometric configurations, and thus has broad potential for application in the analysis of various bond interfaces. The expression of the model by Nakaba et al. is as follows:
τ = τ m a x S B A 1.86 + S / B A
τ m a x = 3.5 f c 0.19
S 0 = B m m
In this study, the experimental data were analyzed using the nonlinear Levenberg–Marquardt fitting algorithm to determine new coefficients (i.e., A = 5.82, B = 0.33) for the performance evaluation of the proposed model. The expression of the fitted model is as follows:
τ = τ m a x S S 0 5.82 1.8 + S / S 0 5.82
τ m a x = 3.5 f c 0.19
S 0 = 0.33   m m
Figure 13 compares the predicted model with the actual experimental data, indicating that the error between the predicted shear strength and the experimental values is within ±10%. The root mean square error (RMSE) and the coefficient of determination (R2) for predicting the shear strength of the PUC–NC bond interface are 2.1% and 0.937. These metrics indicate that the model effectively captures the main trends in the experimental data. However, the model is developed based solely on the data from this study, it may not be able to capture the behavior of specimens with different types of reinforcement materials. Further research is needed to validate the model’s applicability.

5. Conclusions

This study systematically analyzes the factors influencing the shear strength at the interface between PUC and NC through inclined shear testing. The effects of interface treatment methods, adhesive application rates, and steel fiber content on the mechanical properties of the interface are specifically examined. A total of 16 specimen groups were tested, featuring different combinations of variables, including three interface treatment methods (smooth, roughened, and grooved), varying adhesive application rates, and steel fiber contents (0%, 0.5%, 1%, and 1.5%). The results demonstrate that interface treatment methods, adhesive use, and steel fiber addition significantly affect the shear strength at the interface.
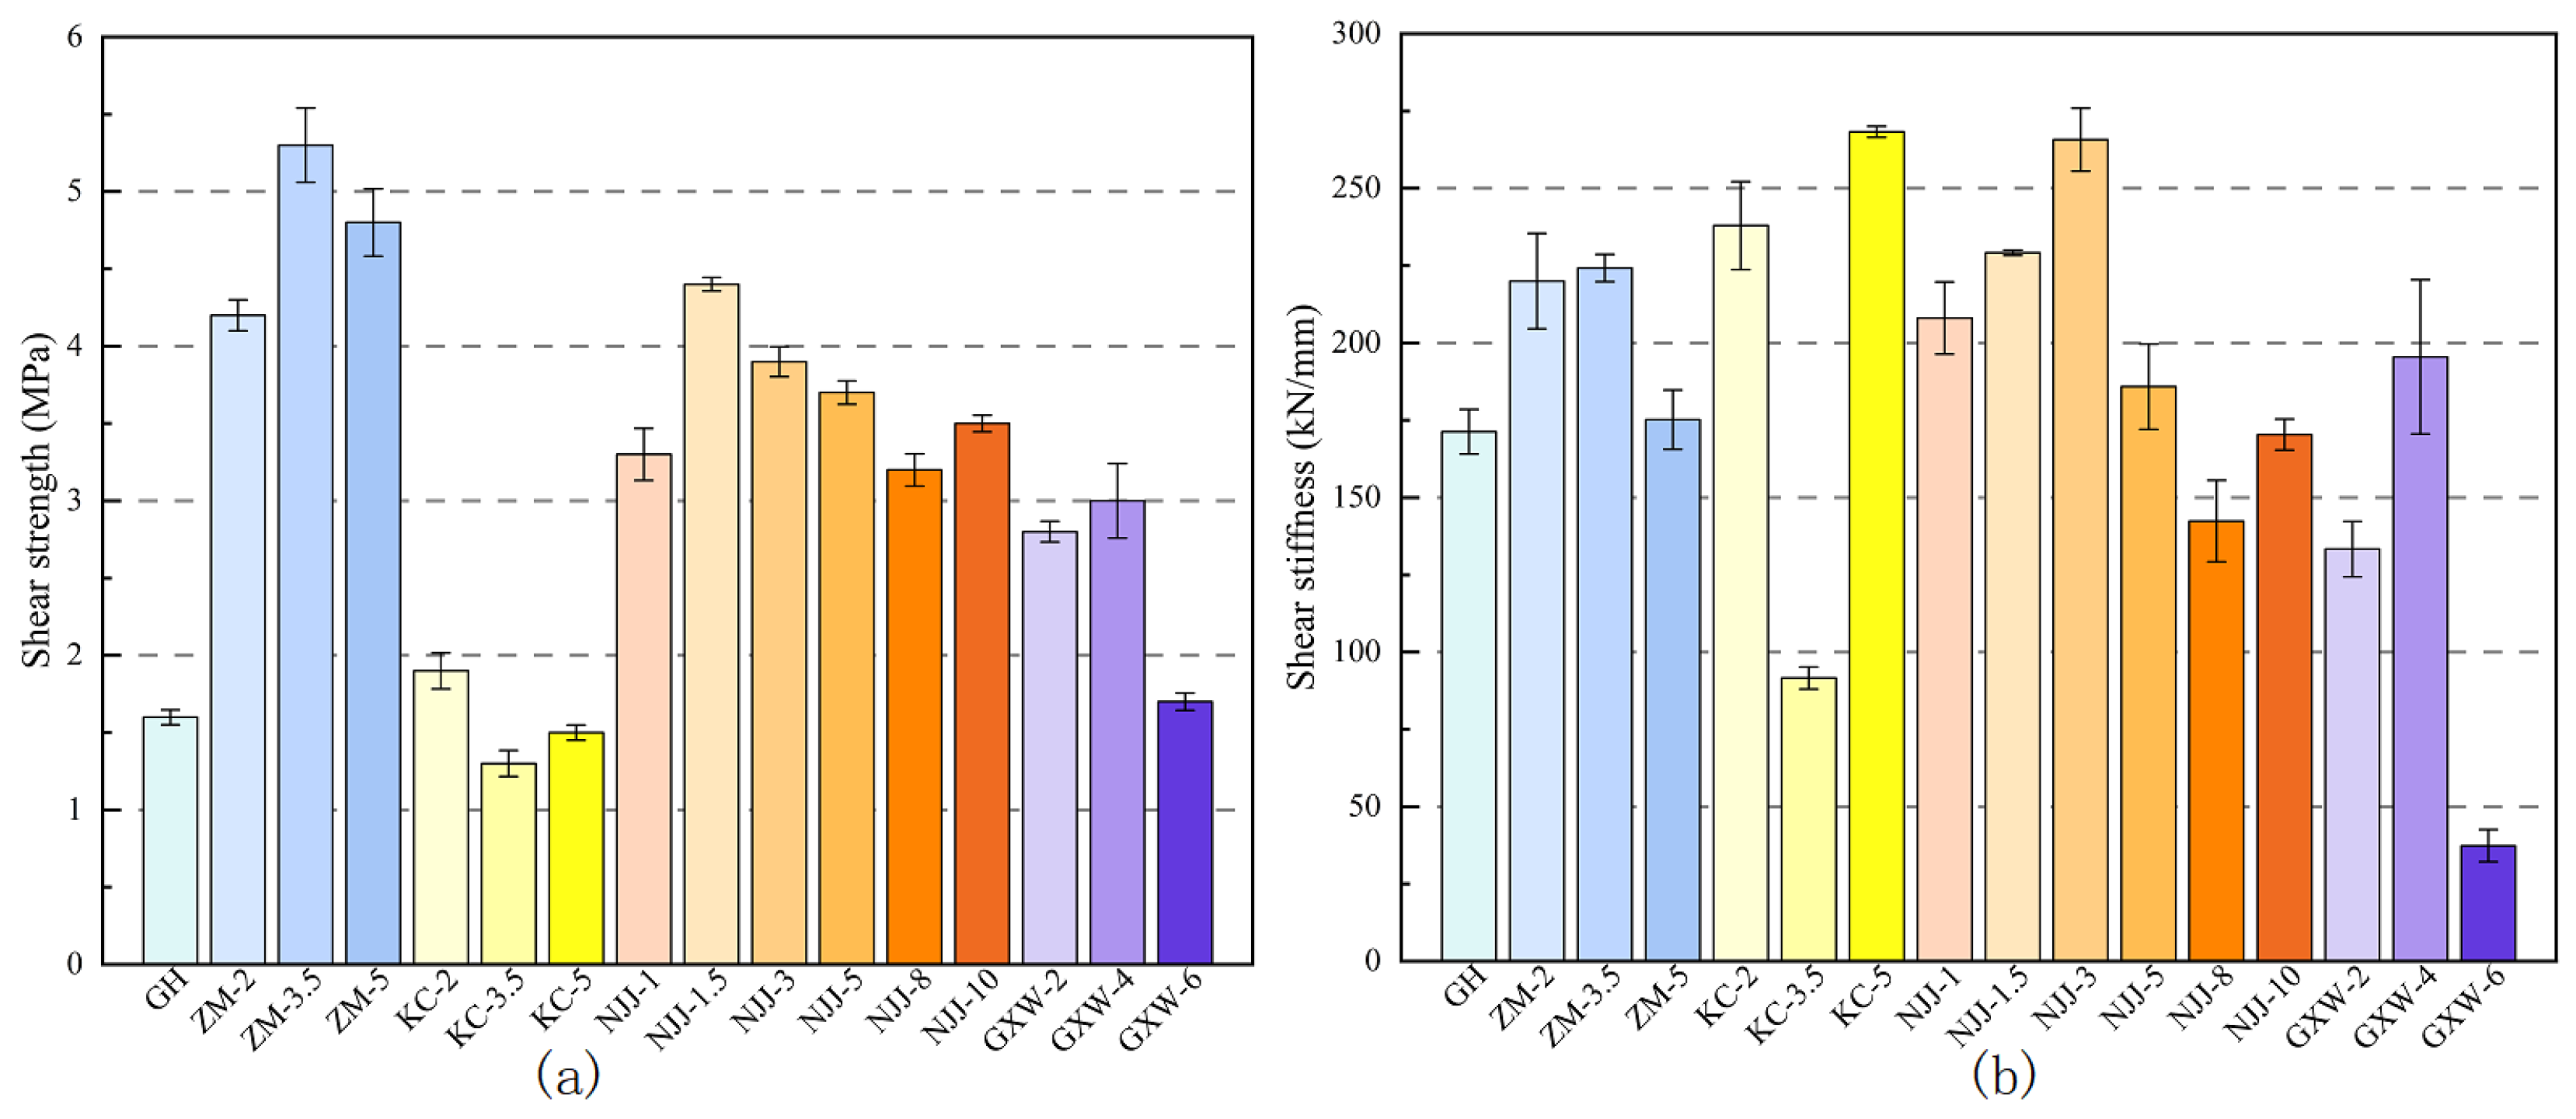
  • Effect of Surface Roughness on Shear Performance: The surface roughness of the interface has a significant impact on the shear strength of the PUC–NC interface. The roughened interface exhibited the highest shear strength, approximately 32% higher than the smooth interface and 15% higher than the grooved interface. Roughening significantly increased the surface roughness, enhancing the bonding strength between polyurethane and concrete, thus improving the shear performance. In contrast, the smooth interface showed the lowest shear strength (3.5 MPa), indicating insufficient mechanical bonding.
  • Effect of Adhesive Application Rate: The application rate of the adhesive had a notable effect on enhancing shear strength. An appropriate adhesive application rate (approximately 0.2 kg/m2) resulted in an 18% increase in shear strength, reaching 4.6 MPa, compared to the interface without adhesive. Excessive adhesive (application rate greater than 0.3 kg/m2) did not further improve the shear strength. The brittle layered structure formed by excess adhesive could even reduce the interface toughness.
  • Effect of Steel Fiber Content: The addition of steel fibers had a complex impact on the shear performance of the interface. At low fiber contents (e.g., 0.5% and 1%), steel fibers effectively improved the shear strength, with the highest shear strength of 5.3 MPa observed at 1% steel fiber content, which was a 22% increase compared to the interface without steel fibers.
  • Load–Displacement Behavior: The load–displacement curves of all specimens exhibited typical brittle failure characteristics, with the curves approximately linear up to the ultimate load. The interface treatment group (ZM) and adhesive application group (NJJ) showed a superior bonding performance, with significantly higher maximum displacement and shear strength compared to the other treatments. This confirms the importance of interface design in enhancing structural repair effectiveness.
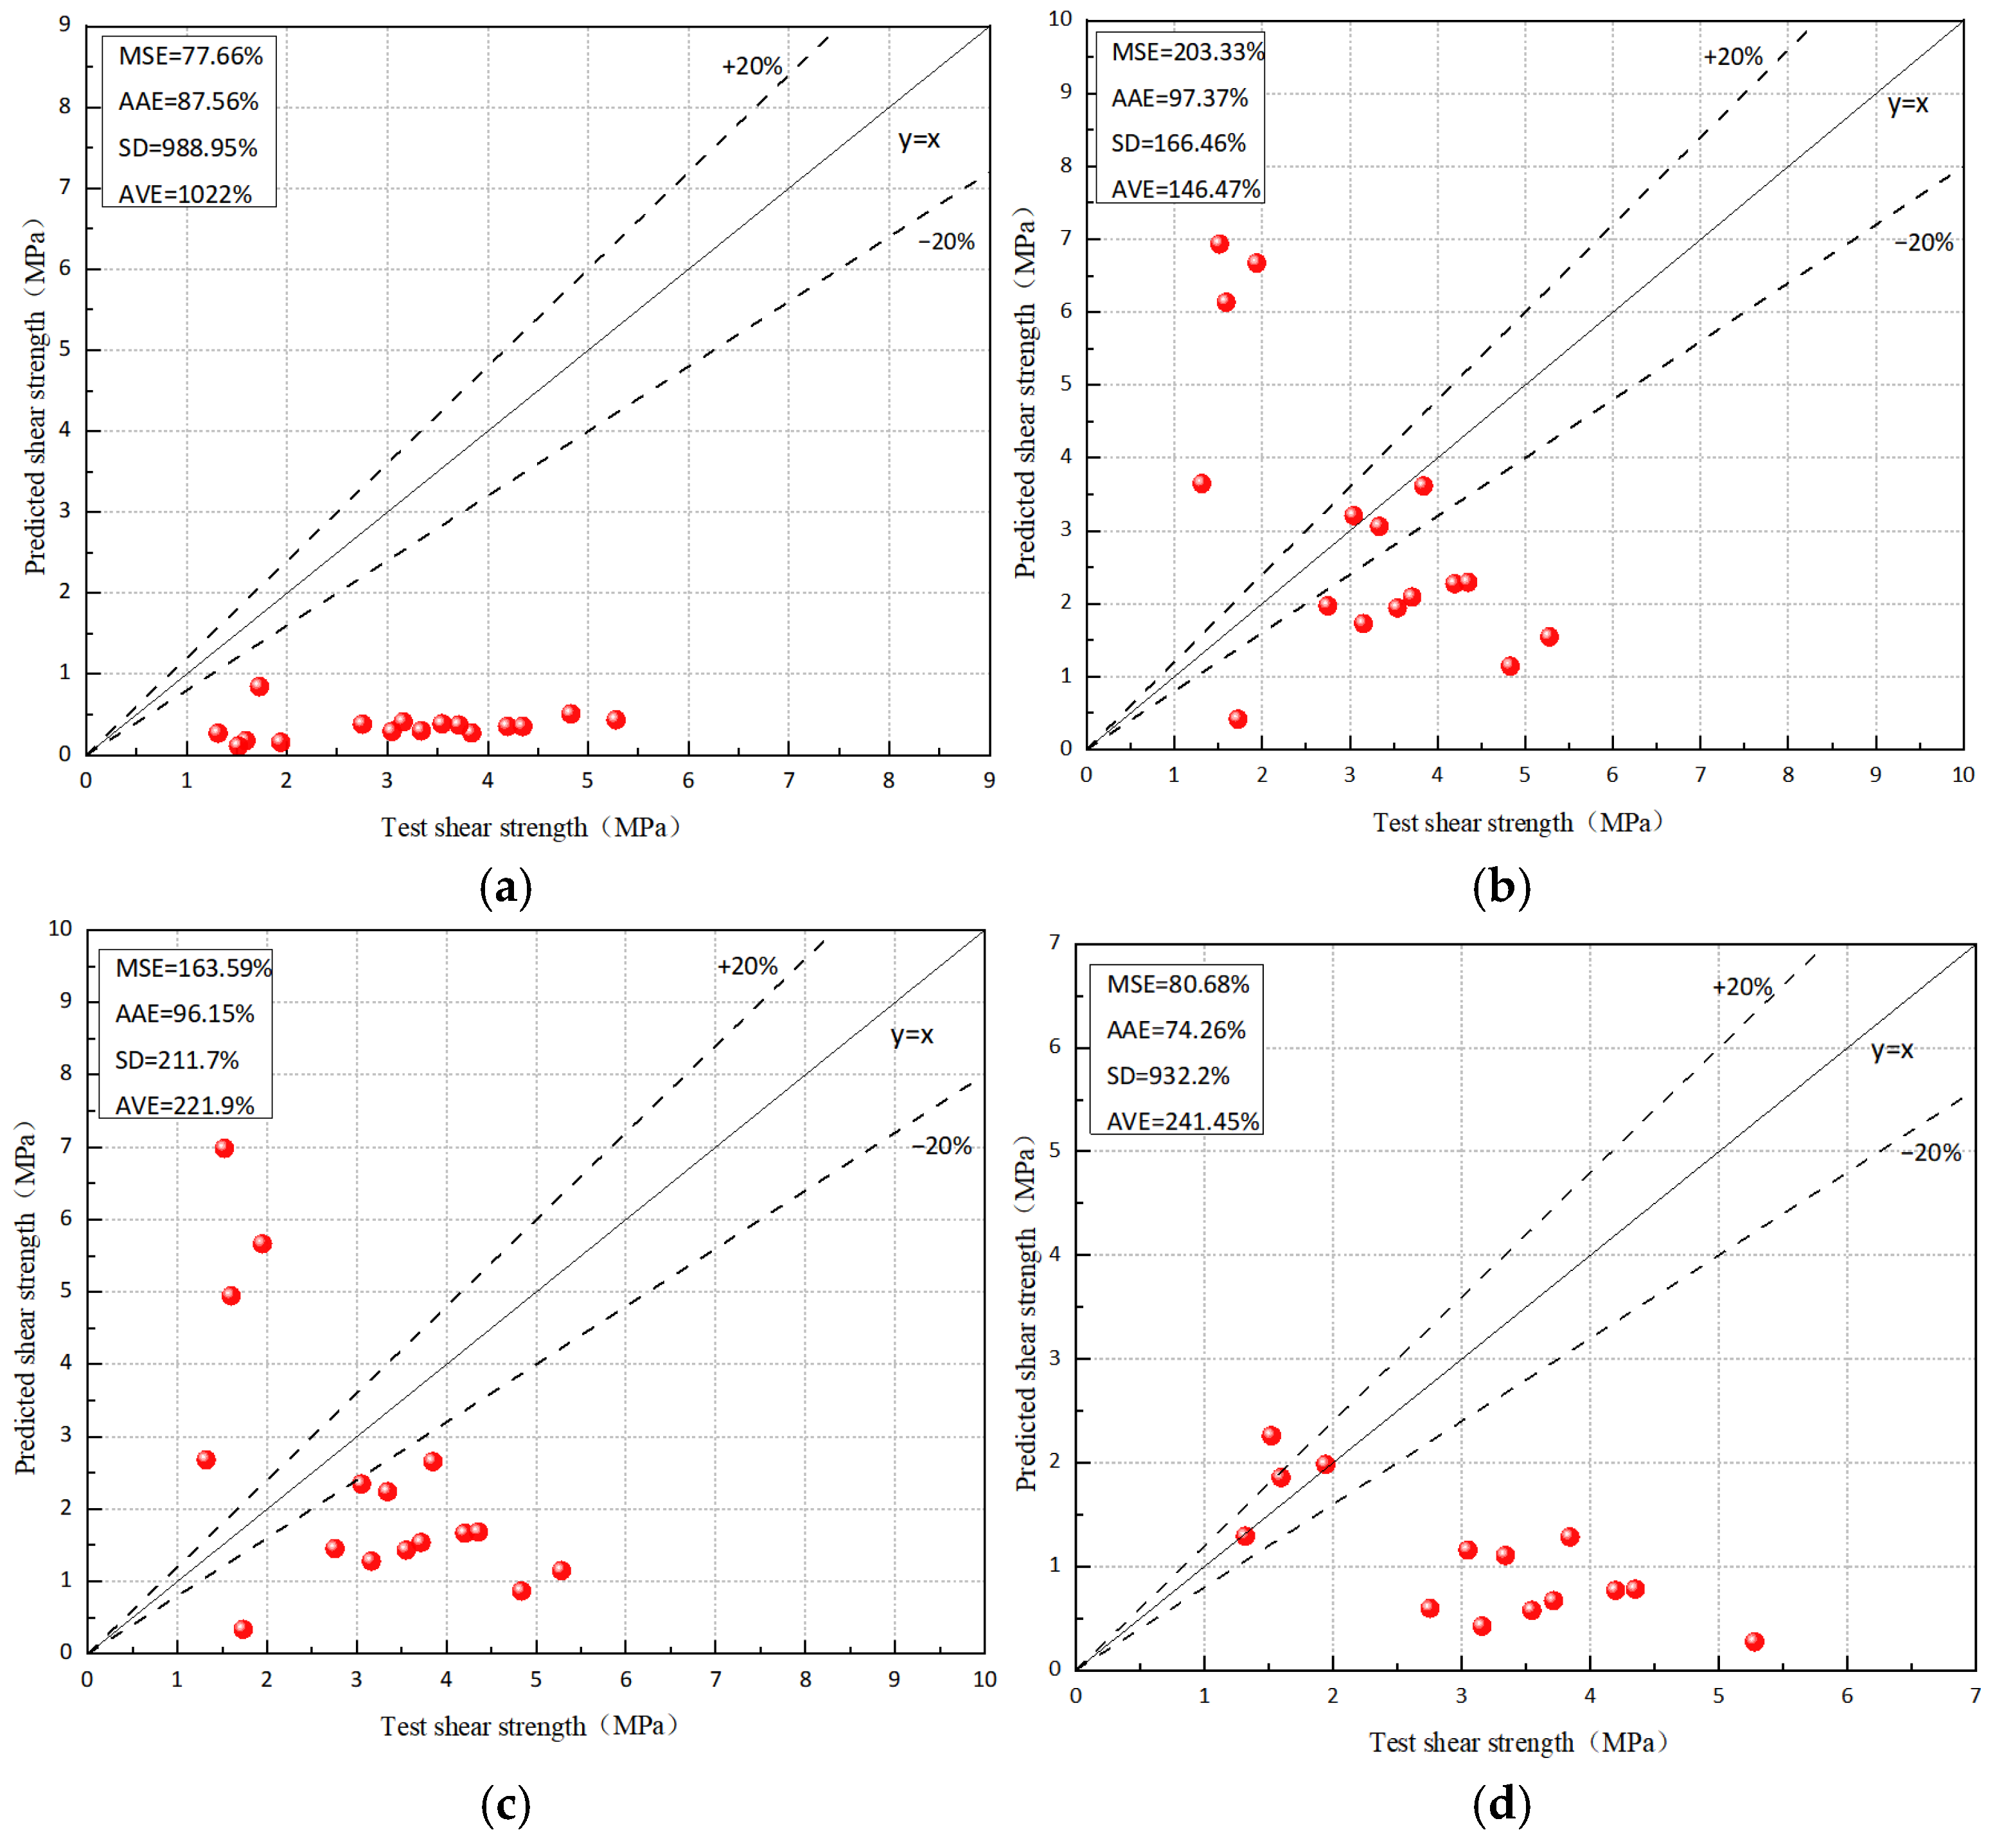
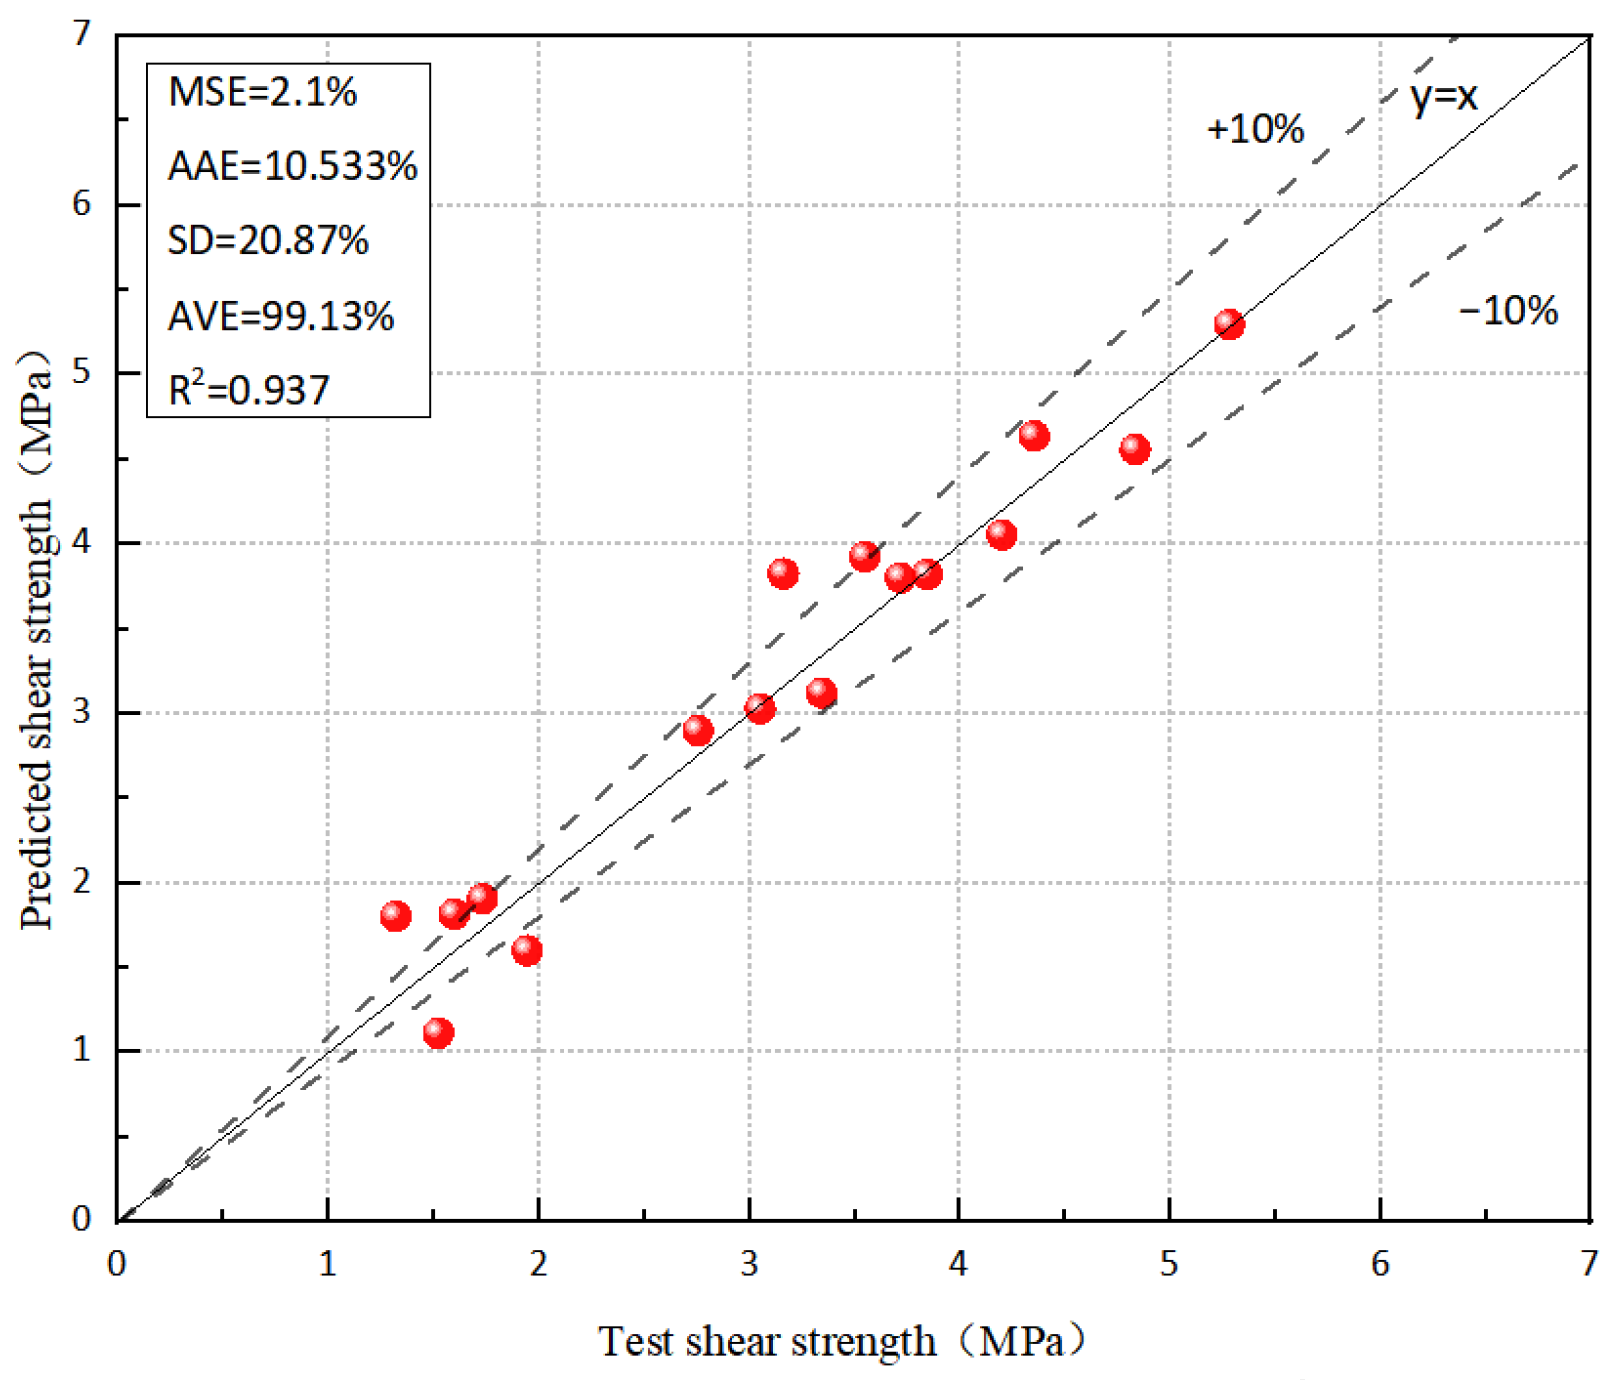
  • Prediction Model for Shear Strength: Based on the adhesive test data, a predictive model for the shear strength of the PUC–NC interface is proposed. Through nonlinear regression analysis, the model can accurately predict shear strength under various interface treatment conditions, providing a theoretical basis for future interface design in engineering applications.
This study demonstrates that the shear strength and shear stiffness between PUC and NC can be effectively improved by designing appropriate interface treatments, selecting the optimal steel fiber content, and controlling the adhesive application rate. These improvements can, in turn, enhance the effectiveness of concrete structure repair and reinforcement. Future research should focus on the mechanical behavior of interfaces under more complex interface conditions as well as the evolution of interface performance under long-term loading and environmental effects.

Author Contributions

Y.Z.: Writing—original draft, visualization, software, data curation. X.Y.: Methodology, formal analysis, data curation. Z.L.: Writing—review and editing, supervision, project administration. B.M.: Validation, resources. L.W.: Writing, data curation. Q.S.: Review and editing, supervision, project administration, funding acquisition, conceptualization. X.W.: Validation, supervision. Z.D.: Visualization, supervision. All authors have read and agreed to the published version of the manuscript.

Funding

This research was funded by Heilongjiang Natural Science Foundation project (Grant No. PL2024E010), the ‘National College Students’ Entrepreneurship Training Program Project’ of Northeast Forestry University (Grant No. 202410225249), and Heilongjiang Transportation Investment Maintenance Technology Co., Ltd. (Grant No. JTYHKJ2023KJ05).

Institutional Review Board Statement

Not applicable.

Informed Consent Statement

Not applicable.

Data Availability Statement

The raw data supporting the conclusions of this article will be made available by the authors on request.

Conflicts of Interest

Authors Xu Wang and Zhongnan Dai were employed by the company Heilongjiang Transportation Investment Maintenance Technology Co., Ltd. The remaining authors declare that the research was conducted in the absence of any commercial or financial relationships that could be construed as a potential conflict of interest.

References

  1. Hooton, R.D. Future directions for design, specification, testing, and construction of durable concrete structures. Cem. Concr. Res. 2019, 124, 105827. [Google Scholar] [CrossRef]
  2. Tian, X.; Zhu, N. Durability prediction method of concrete soil based on deep belief network. Adv. Civ. Eng. 2022, 2022, 4338306. [Google Scholar] [CrossRef]
  3. Yi, Y.; Zhu, D.; Guo, S.; Zhang, Z.; Shi, C. A review on the deterioration and approaches to enhance the durability of concrete in the marine environment. Cem. Concr. Compos. 2020, 113, 103695. [Google Scholar] [CrossRef]
  4. Hu, D.; Sun, Q.; Yan, B. Experimental study on the interface shear performance of elastic polyurethane concrete–steel plate. Structures 2022, 45, 2306–2317. [Google Scholar] [CrossRef]
  5. Jiang, Z.; Tang, C.; Yang, J.; You, Y.; Lv, Z. A lab study to develop polyurethane concrete for bridge deck pavement. Int. J. Pavement Eng. 2022, 23, 1404–1412. [Google Scholar] [CrossRef]
  6. Zhang, K.; Sun, Q. The use of Wire Mesh-Polyurethane Cement (WM-PUC) composite to strengthen RC T-beams under flexure. J. Build. Eng. 2018, 15, 122–136. [Google Scholar] [CrossRef]
  7. Aliha, M.R.M.; Kouchaki, H.G.; Mohammadi, M.H.; Haghighatpour, P.J.; Choupani, N.; Asadi, P.; Akbari, M.; Darvish, M.G.; Sadowski, T. Fracture toughness determination for epoxy-based polymer concrete mixtures: Applicability of different rectangular beam and circular disc specimens. Compos. Part C Open Access 2024, 14, 100446. [Google Scholar] [CrossRef]
  8. Ferdous, W.; Manalo, A.; Wong, H.S.; Abousnina, R.; AlAjarmeh, O.S.; Zhuge, Y.; Schubel, P. Optimal design for epoxy polymer concrete based on mechanical properties and durability aspects. Constr. Build. Mater. 2020, 232, 117229. [Google Scholar] [CrossRef]
  9. Wang, Q.; Ma, Y.; Li, C.; Hu, Z.; Lv, H.; Zhang, J.; Meng, X. Preparation and application research of hybrid alkali-resistant glass fiber reinforced cement grout. Case Stud. Constr. Mater. 2023, 19, e02674. [Google Scholar] [CrossRef]
  10. Al-kahtani, M.S.M.; Zhu, H.; Ibrahim, Y.E.; Haruna, S.I.; Al-qahtani, S.S.M. Study on the Mechanical Properties of Polyurethane-Cement Mortar Containing Nanosilica: RSM and Machine Learning Approach. Appl. Sci. 2023, 13, 13348. [Google Scholar] [CrossRef]
  11. Haruna, S.I.; Ibrahim, Y.E.; Al-shawafi, A. Evaluation of Bond Strength of Concrete Repaired Using Polyurethane Grout Material under Static and Impact Loads Coupled with Statistical Analysis. Polymers 2024, 16, 2729. [Google Scholar] [CrossRef] [PubMed]
  12. Li, Y.; Chai, J.; Li, Y.; Wang, R.; Qin, Y.; Cao, Z. Experimental investigation of the interfacial bonding properties between polyurethane mortar and concrete under different influencing factors. Constr. Build. Mater. 2023, 408, 133800. [Google Scholar] [CrossRef]
  13. Niu, S.; Wang, Z.; Wang, J.; Wang, D.; Sun, X. Experimental investigation on flexural performance of polyester polyurethane concrete steel bridge deck composite structure. Case Stud. Constr. Mater. 2023, 18, e01915. [Google Scholar] [CrossRef]
  14. Zhai, D.; Sun, Q. Molecular dynamics and experimental study of the interfacial adhesion mechanism of polyurethane-based repair materials. Constr. Build. Mater. 2025, 459, 139796. [Google Scholar] [CrossRef]
  15. Wang, Y.; Sun, Q.; Ding, H.; Leng, S.; Cui, H.; Xu, B.; Cui, H. Investigation of interfacial bonding properties of polyurethane concrete and cement concrete/steel reinforcement. Adv. Mater. Sci. Eng. 2022, 2022, 5644468. [Google Scholar] [CrossRef]
  16. Wang, Y.; Sun, Q.; Liu, Y.; Rim, C.; Kim, C. Preparation of polyurethane concrete and its novel application in bridge expansion joint anchorage zone. J. Reinf. Plast. Compos. 2024, 43, 1356–1374. [Google Scholar] [CrossRef]
  17. Li, L.; Yu, T.; Wu, Y.; Wang, Y.; Guo, C.; Li, J. Research on the Properties of a New Type of Polyurethane Concrete for Steel Bridge Deck in Seasonally Frozen Areas. Coatings 2022, 12, 1732. [Google Scholar] [CrossRef]
  18. Han, Y.; Meng, X.; Feng, F.; Song, X.; Huang, F.; Wen, W. Study on Temperature-Dependent Uniaxial Tensile Tests and Constitutive Relationship of Modified Polyurethane Concrete. Materials 2023, 16, 2653. [Google Scholar] [CrossRef]
  19. Chen, J.; Ma, X.; Wang, H.; Xie, P.; Huang, W. Experimental study on anti-icing and deicing performance of polyurethane concrete as road surface layer. Constr. Build. Mater. 2018, 161, 598–605. [Google Scholar] [CrossRef]
  20. Hassani Niaki, M. Fracture mechanics of polymer concretes: A review. Theor. Appl. Fract. Mech. 2023, 125, 103922. [Google Scholar] [CrossRef]
  21. Ibrahim Haruna, S.; Zhu, H.; Jiang, W.; Shao, J. Evaluation of impact resistance properties of polyurethane-based polymer concrete for the repair of runway subjected to repeated drop-weight impact test. Constr. Build. Mater. 2021, 309, 125152. [Google Scholar] [CrossRef]
  22. Karimi, H.R.; Khedri, E.; Aliha, M.R.M.; Shaker, H.; Jafari Haghighatpour, P. Repair efficiency evaluation for cracked asphalt mixture pavement in different ambient temperatures using bitumen and polymer concrete as repair materials. Constr. Build. Mater. 2023, 369, 130556. [Google Scholar] [CrossRef]
  23. Guo, C.; Pei, L.; Guan, H.; Chu, X.; Wang, H.; Shi, F.; An, Z.; Qin, L. Experimental study on interfacial damage mechanisms of polymer-concrete composite structure. J. Build. Eng. 2023, 75, 106968. [Google Scholar] [CrossRef]
  24. Qin, L.; Guo, C.; Sun, W.; Guan, H.; Yan, W.; Wang, F. Experimental investigation on the interfacial shear bond performance of non-water reacting polymer and concrete. Constr. Build. Mater. 2022, 331, 127351. [Google Scholar] [CrossRef]
  25. Shen, Y.; Wang, Y.; Yang, Y.; Sun, Q.; Luo, T.; Zhang, H. Influence of surface roughness and hydrophilicity on bonding strength of concrete-rock interface. Constr. Build. Mater. 2019, 213, 156–166. [Google Scholar] [CrossRef]
  26. Ummin, O.; Li, Y.; Li, K.; Chen, Y.; Jia, H.; Zuo, J. Influence of surface roughness and interfacial agent on the interface bonding characteristics of polyurethane concrete and cement concrete. J. Build. Eng. 2024, 91, 109596. [Google Scholar] [CrossRef]
  27. Zhong, Y.; Xu, S.; Chi, J.; Zhang, B.; Shen, G.; Yang, Z.; Cheng, H.; Wang, B. Experimental study on the interface bonding characteristic of polyurethane and pavement materials. Constr. Build. Mater. 2023, 397, 132390. [Google Scholar] [CrossRef]
  28. Li, X.; Wang, F.; Fang, H.; Zheng, D.; Fu, Y. Bond Behavior between Concrete and Self-Expansion Polymer Material under Normal Pressures. Adv. Civ. Eng. 2021, 2021, 6675102. [Google Scholar] [CrossRef]
  29. Zhang, P.; Wu, G.; Zhu, H.; Meng, S.P.; Wu, Z.S. Mechanical performance of the wet-bond interface between FRP plates and cast-in-place concrete. J. Compos. Constr. 2014, 18, 04014016. [Google Scholar] [CrossRef]
  30. Neubauer, U.; Rostasy, F. Bond failure of concrete fiber reinforced polymer plates at inclined cracks—Experiments and fracture mechanics model. Spec. Publ. 1999, 188, 369–382. [Google Scholar]
  31. Nakaba, K.; Kanakubo, T.; Furuta, T.; Yoshizawa, H. Bond behavior between fiber-reinforced polymer laminates and concrete. Struct. J. 2001, 98, 359–367. [Google Scholar]
  32. Savoia, M.; Ferracuti, B.; Mazzotti, C. Non linear bond-slip law for FRP-concrete interface. In Fibre-Reinforced Polymer Reinforcement for Concrete Structures: (In 2 Volumes); World Scientific: Singapore, 2003; pp. 163–172. [Google Scholar]
  33. Lu, X.Z.; Teng, J.G.; Ye, L.P.; Jiang, J.J. Bond-slip models for FRP sheets/plates bonded to concrete. Eng. Struct. 2005, 27, 920–937. [Google Scholar] [CrossRef]
Figure 1. Shear test specimen model.
Applsci 15 04580 g001
Figure 2. NC surface treatment methods: (a) smooth; (b) chipping; (c) groove.
Applsci 15 04580 g002
Figure 3. Specimen preparation process.
Applsci 15 04580 g003
Figure 4. PUC–NC interface oblique shear test device: (a) loading test instrument; (b) schematic diagram of specimen model loading.
Applsci 15 04580 g004
Figure 5. Failure modes at the bond interface of PUC–NC composite specimens.
Applsci 15 04580 g005
Figure 6. Shear failure interfaces under different surface treatments: (a) untreated (GH); (bd) grooved group (ZM); (eg) notched group (KC).
Applsci 15 04580 g006
Figure 7. Shear failure interface of steel fiber (GXW) group, the steel fiber content are: (a) 2%; (b) 4%; (c) 6% respectively.
Applsci 15 04580 g007
Figure 8. Shear failure interface of adhesive coating group (NJJ), the contents of the iadhesive coating are: (a) 1%; (b) 1.5%; (c) 3%; (d) 5%; (e) 8%; (f) 10%.
Applsci 15 04580 g008
Figure 9. Load–displacement curves for PUC–NC interface: (a) grooved group; (b) notched group; (c) adhesive coating; (d) steel fiber.
Applsci 15 04580 g009
Figure 10. Comparison of shear strength and shear stiffness at the interface: (a) shear strength; (b) shear stiffness.
Applsci 15 04580 g010
Figure 11. SEM micrograph of PUC mixed with steel fiber: (a) between steel fiber and matrix; (b) high rate between steel fiber and matrix.
Applsci 15 04580 g011
Figure 12. Prediction of shear strength at the PUC–NC interface: (a) Neubauer and Rostasy [30]; (b) Nakaba et al. [31]; (c) Savoia et al. [32]; (d) bilinear model [33].
Applsci 15 04580 g012
Figure 13. Proposed prediction model in this study.
Applsci 15 04580 g013
Table 1. Chemical composition of PUC.
ComponentMain Chemical CompositionsMixing Mass Ratio/(kg)
Part 190% polyether polyols and 10% chain extender crosslinkers1
Part 2MDI-based isocyanate group1
Part 3Stone and cement5:1
Part 4Molecular sieve activated powder0.3
Table 2. Physical and chemical properties of molecular sieve activated powder.
Name Particle Size
(μm)
Bulk Density
(g/mL)
Static Water Adsorption
(%)
PH Value
Molecular sieve
activated powder
2−4≥0.45≥25.09−11
Table 3. Physical properties of common Portland cement.
Density
(g/m3)
Initial Setting Time (min)Final Setting Time (min)Compressive Strength at 3 Days (MPa) Compressive Strength at 28 Days (MPa)
3.2820024018.342.6
Table 4. Proportions of mixed NC.
Water–Cement RatioWater (kg/m3)Cement (kg/m3)Coarse Aggregate (kg/m3)Fine Aggregate (kg/m3)Superplasticizer (%)
0.3817542010837220.27
Table 5. Steel fiber parameters.
Steel Fiber Type Length
(mm)
Length-Diameter
Ratio
Density
(t/m3)
Elastic Modulus
(GPa)
End hooked steel fiber30407.8210
Table 6. Summary of oblique shear test results.
Sample NumberPu (kN)S0.7Pu (mm)Failure Mode
GH31.92 0.093 A
ZM-284.03 0.191A
ZM-3.5105.64 0.236 A/B
ZM-596.680.276 A/B
KC-238.90 0.082 A
KC-3.526.38 0.144 A
KC-530.44 0.057 B
NJJ-166.85 0.161 A/C
NJJ-1.587.08 0.190 A/C
NJJ-376.92 0.145 D
NJJ-574.34 0.200 D
NJJ-863.22 0.222 D
NJJ-1070.98 0.208 D
GXW-255.11 0.207 A/C
GXW-461.01 0.156 A/C
GXW-634.61 0.463 C
Note: Pu and S0.7Pu represent the ultimate load and the corresponding strain.
Table 7. Shear strength and shear stiffness of the interface.
SpecimenPu
(KN)
S0.7Pu
(mm)
Shear Strength
(MPa)
Shear Stiffness
(kN/mm)
Average Shear
Strength (MPa)
Average Shear
Stiffness (kN/mm)
GH31.440.06301.6174.11.6171.3
33.250.07201.7161.4
31.090.06101.6178.4
ZM-283.220.12654.1231.14.2220.0
86.000.15094.3198.0
82.850.12594.1230.3
ZM-3.598.260.14934.9230.35.3224.2
109.520.17405.4220.3
109.150.17215.4221.9
ZM-599.930.18654.9187.54.8175.3
100.590.21465.0164.1
89.360.17954.5174.2
KC-236.500.05121.8249.51.9237.9
38.300.06151.9217.9
41.950.05962.1246.3
KC-3.526.010.10011.390.91.391.7
24.930.09051.296.4
28.080.11191.487.8
KC-531.240.04091.6267.31.5268.3
30.080.03951.5266.5
30.000.03881.5270.6
NJJ-167.910.12153.3195.63.3208.0
61.860.09683.1223.6
70.840.12113.5204.7
NJJ-1.588.440.13464.4230.04.4229.2
87.090.13364.4228.1
86.60.13204.3229.6
NJJ-375.50.09853.8268.23.9265.7
75.980.09613.8276.7
79.820.11084.0252.1
NJJ-575.420.15013.8175.93.7185.9
75.390.14963.8176.4
72.220.12313.6205.3
NJJ-866.100.18423.3125.63.2142.4
61.140.13563.1157.8
62.560.15233.1143.8
NJJ-1071.330.15153.6164.83.5170.4
70.250.1453.5169.6
71.240.14093.6177.0
GXW-254.120.13652.7138.82.8133.3
57.010.16542.9120.6
54.220.13512.7140.5
GXW-460.250.09873.0213.73.0195.5
66.140.14453.3160.2
54.360.08952.7212.6
GXW-636.050.4151.830.41.737.4
33.30.30011.738.8
34.480.28041.743.0
Table 8. Existing constitutive models for interface bonding behavior.
Model
Neubauer et al. [30] τ = τ m a x s s 1 i f   s < s 0 τ = 0 i f   s > s 0 τ m a x = 1.8 β w × 0.202
β w = 1.125 2 b f / b c 1 + b f / 400
Nakaba et al. [31] τ = τ m a x s s 0 3 2 + ( s / s 0 ) 3 τ m a x = 3.5 f c 0.19
s 0 = 0.065   m m
Savoia et al. [32] τ = τ m a x s s 0 2.86 1.86 + ( s / s 0 ) 2.86 τ m a x = 3.5 f c 0.19
s 0 = 0.051   m m
Bilinear constitutive model [33] τ = τ m a x s s 1 α i f   s < s 1 τ = τ m a x s 2 s s 2 s 1 i f   s 1 < s < s 2 τ = 0 i f   s > s 2 τ m a x = 1.5 β w f t
α = 1
s 1 = 0.0195 β w f t
s 2 = 0.616 β w 2 f t τ m a x
β w = 2 b f / b c 1 + b f / b c
where τ is the bond stress (MPa); s is the slip displacement of the specimen (mm); τmax is the maximum bond stress of the bonding specimen (MPa); S0 is the maximum slip displacement of the specimen before failure (mm); βw is the width correction factor, which is related to the specimen’s dimensions; ft is the tensile strength of concrete (MPa); bc is the bond surface width of the base concrete (mm); bf is the bond surface width of the PUC (mm); fc is the compressive strength of concrete (MPa); α is the calculation coefficient.
Disclaimer/Publisher’s Note: The statements, opinions and data contained in all publications are solely those of the individual author(s) and contributor(s) and not of MDPI and/or the editor(s). MDPI and/or the editor(s) disclaim responsibility for any injury to people or property resulting from any ideas, methods, instructions or products referred to in the content.

