Article

Deep Learning-Driven Geospatial Modeling of Elderly Care Accessibility: Disparities Across the Urban-Rural Continuum in Central China

School of Architecture and Arts, Central South University, Changsha 410075, China
*
Author to whom correspondence should be addressed.
Appl. Sci. 2025, 15(9), 4601; https://doi.org/10.3390/app15094601
Submission received: 11 March 2025 / Revised: 15 April 2025 / Accepted: 20 April 2025 / Published: 22 April 2025

Abstract

:
With the intensification of aging, the imbalance between the supply and demand of elderly care services has become increasingly prominent. Taking Changsha as a case study, this research constructs an accessibility evaluation system based on the 15-min life circle theory, utilizing multi-source data. Spatial weighting characteristics of elderly care facility locations were analyzed through machine learning algorithms, and service coverage disparities between urban districts and suburban towns were assessed under 5-, 10-, and 15-min walking thresholds. Street view semantic segmentation technology was employed to extract street environmental elements in central urban areas, and a multiple regression model was established to elucidate the impact mechanisms of the built environment on walking accessibility. Key findings include: (1) Significant urban-rural service disparities exist, with 91.4% of urban core facilities offering seven service categories within 15-min walking catchments compared to 26.86% in township areas, demonstrating suburban infrastructure’s heavy reliance on administrative resource allocation. (2) Street environmental factors exhibit significant correlations with walking accessibility scores. At the 15-min walking threshold, building space ratio and transportation infrastructure coverage positively influenced walking convenience, while sky view ratio showed a negative correlation. (3) A random forest-based location prediction framework identified multiple service gaps in existing facilities. Suburban service deficiencies (e.g., 59.8% medical facility coverage within walkable catchments) emerge as critical equity barriers, prompting recommendations for integrated “micro-clinic + smart pharmacy” networks and prioritized mixed-use zoning in new urban planning. This research advances a data-driven framework for reconciling urbanization-aging conflicts, offering practical insights for developing nations in creating age-friendly urban environments.

1. Introduction

The accelerating global population aging process is reshaping the supply patterns of urban public services [1,2]. According to the United Nations 2024 Population Report, the growth rate of the population aged 65 and above has substantially surpassed that of younger demographics [3], with their global proportion projected to reach 16% by 2050. According to the United Nations classification based on the proportion of population aged 65 and above, population aging is categorized into three stages: (1) Aging society (≥7%); (2) Aged society (≥14%); and (3) Super-aged society (≥20%). Global aging demonstrates two key characteristics: First, developed countries show concentrated aging patterns, with Japan (29.1%), Italy (24.3%), and Germany (23.6%) ranking as the top three super-aged societies. Second, significant regional heterogeneity exists in aging progression [4], particularly with accelerated growth in developing countries. Asia has emerged as the fastest-growing aging region, with China representing a notable case: transitioning from an aging society (7.1%) in 2001 to an aged society (14.2%) within two decades and projected to surpass 20% by 2032 (United Nations projection). This trajectory positions China to become the fastest nation globally to transition from an aged to a super-aged society, requiring merely 11 years. This process highlights that aging has become a global challenge that transcends development stages.
Driven by the concepts of “active aging” and “healthy aging,” the demand for elderly care services has transitioned from basic survival guarantees to multidimensional quality-of-life enhancements, imposing compound requirements on the spatial supply quality of care facilities [5,6]. However, existing studies reveal that China’s elderly care infrastructure faces the dual challenges of insufficient supply and imbalanced spatial allocation [6,7,8]. As a developing country undergoing rapid urbanization, the spatiotemporal mismatch between facility distribution and elderly population agglomerations has become particularly pronounced [6].
In recent years, accessibility studies under the lens of spatial justice have gained increasing academic attention [9]. The planning paradigm epitomized by the “15-Min City” advocates achieving walkable access to essential services through compact spatial configurations [10]. How to rationally plan and allocate elderly care facilities within limited spatial resources, balancing efficiency and social equity, has emerged as a critical challenge in urban development [11].

1.1. Spatial Accessibility and Distribution Optimization of Elderly Care Facilities from a Spatial Justice Perspective

Academic research on elderly care facilities has predominantly focused on three domains: management models [12,13], economic benefits [14,15], and service quality [16]. However, spatial accessibility—a critical metric for evaluating the convenience of accessing public service resources—remains underexplored [17]. When analyzing spatial accessibility, it is essential to consider not only the geographic distance affecting older adults but also the alignment between facility service provision and the heterogeneous demands of aging populations.
Regarding elderly service facility systems, while no unified classification standard exists, existing literature widely acknowledges essential functional requirements for older adults, including community interaction [18], medical care [19,20], recreational and cultural activities [21,22], daily living support [23], commercial amenities [24], and administrative services [25]. These facilities play a vital role in fulfilling the daily needs of aging populations.
In accessibility studies, Wang et al. [26] examined time-varying accessibility demands of facilities across different daily periods in Wuhan, while Liu et al. [27] identified service accessibility as a key determinant of elderly social engagement. Mao et al. [28] further emphasized that the built environment and accessibility of urban services significantly impact mental health, particularly for older adults, where convenient access alleviates psychological stress and enhances life satisfaction.
Nevertheless, existing research reveals pronounced disparities in the spatial distribution of elderly care facilities, especially in developing countries. The urban-rural divide in facility allocation remains stark, with rural areas facing acute supply-demand imbalances due to inadequate daily service infrastructure [29]. This spatiotemporal mismatch between facility distribution and elderly population agglomerations aligns with Ogburn’s cultural lag theory [30], where rapid demographic aging (material culture) outpaces corresponding institutional innovations (adaptive culture). The urban-rural disparities in elderly care facility allocation not only reflect infrastructural inadequacies but also directly impact older adults’ quality of life and living standards [31]. To address these complex inequities, now recognized as spatial manifestations of cultural lag, urban planners and policymakers must prioritize spatial justice in elderly care provision. This requires integrating older adults’ practical needs, urban development contexts, and social equity principles to address spatial inequities and foster inclusive urban environments [32,33].
Building upon this foundation, this study develops an evaluation framework comprising 8 primary indicators and 23 secondary indicators. Leveraging machine learning, we assess walkability scores for elderly care facilities in urban and rural areas, exploring their spatial differentiation patterns through an urban-rural dichotomy.

1.2. The 15-Min City and Walkable Life Circles for Older Adults

The “15-Min City”, as a pivotal practical theory in New Urbanism, provides urban planners with a theoretical framework to evaluate and enhance urban accessibility [34]. Existing research on spatial identification and measurement methodologies primarily focuses on accessibility and proximity. Mainstream studies employ census tracts [35], postal code zones [36], or regular geographic grids [37] as basic analytical units. These studies often construct idealized pedestrian service radii by extracting geometric centroids, emphasizing facility types [38] and walkability capacity [39] at the service coverage areas. Derived from the 15-Min City concept, the concept of “15-min walkable life circles for the senior” has emerged as a research frontier in sustainable urban planning.
Furthermore, traditional accessibility measurement methods, such as the Gaussian Two-Step Floating Catchment Area (2SFCA) method and multi-level search radii, have been further developed in 15-Min City studies [40,41]. Notably, recent studies increasingly prioritize spatial equity for vulnerable groups. Due to reduced walking capacity and tolerance distances among older adults, research confirms a substantial contraction effect in their effective walking thresholds [42].
To address the growing aging population, scholars have integrated the 15-Min City model with elderly walking capacity to explore its applicability and benefits for older adults. Jiang et al. [11] investigated the suitability of the 15-min CLC (Community Life Circle) for older adults, analyzing facility accessibility across different walking life circles in Suzhou. Xu et al. [42] assessed elderly-friendly 15-min walkable life circles, identifying 500 m as the maximum comfortable walking distance for seniors. Their work underscores the importance of incorporating elderly walking capacity into planning to ensure accessible services within reasonable distances. Similarly, Yang et al. [43] examined the current status of elderly care facilities and usage patterns in Xi’an, integrating life circle theory with the diverse needs of older adults.
In-depth exploration of the 15-Min City at varying scales, particularly from the walkability perspective of mobility-constrained populations, is critical for Chinese cities. Such research can guide urban planners and policymakers in formulating equitable strategies. This study evaluates the accessibility of elderly care facilities and their ancillary services under 5-, 10-, and 15-min walking thresholds, focusing on the elderly pedestrian perspective.

1.3. Walkability Score and Quantitative Analysis of Street-Level Environments Factory

Under the 15-min city conceptual framework, research on pedestrian suitability is undergoing a paradigm shift from “destination accessibility” to “process experientiality”. Existing studies predominantly employ Walking Score algorithms, which evaluate neighborhood walkability potential through a linear combination of facility density (D_f) and distance decay functions (f (d) = e{−λd}). While some researchers have developed amenity-weighted systems to calculate composite 15-min city indices or accessibility scores [44], computational complexity constraints have limited their focus to urban core areas. Consequently, these analyses fail to holistically represent citywide accessibility patterns or reveal gradient differences in accessibility between central and suburban zones. Furthermore, such macro-level accessibility approaches exhibit limitations in capturing micro-scale street-built environment characteristics, with scant exploration of spatial interdependencies between walkability metrics and street-built environment features within the 15-min city context. Notably, systematic investigations into mutual influences between these dimensions remain underdeveloped.
Emerging street view imagery (SVI) technologies provide transformative solutions to these methodological constraints. Deep learning-based geo-parsing enables automated extraction of granular street-built environment elements from street-level visual data. Numerous scholars have leveraged SVI-derived features to assess walking environments or investigate their impact on pedestrian behavior [45,46]. Integrating such street-built environment quantifications with walkability scoring allows nuanced analysis of intrinsic facility accessibility-walkability relationships. Nagata et al. [47] developed an automated quantification of SVI functionality using Google Street View to evaluate population-specific walkability, while Koo et al. [48] demonstrated SVI factors’ significant contributions to walking mode choice through Atlanta-based analyses. Lee et al. [49] established empirical links between perceived walkability, urban landscape features, and public health outcomes through comprehensive SVI-based modeling. Recent extensions include gerontologically oriented street-built environment assessments: Chen et al. [50] employed TrueSkill algorithms to characterize elderly-friendly street configurations, and He et al. [51] identified pedestrian-oriented SVI elements that disproportionately enhance senior mobility in suburban contexts.
Therefore, the analysis of walkability scores and street-built environments could be incorporated into urban planning to enhance pedestrian infrastructure, thereby promoting health and well-being among older adults [52,53]. In this study, we employed the ordinary least squares method to identify significant correlational factors between walkability scores and street environmental characteristics. Subsequently, a geographically weighted regression model was applied to spatially visualize the geographically varying relationships between street environmental factors across different urban locations.

1.4. Literature Review

Scholars worldwide have conducted extensive research on elderly care facilities, primarily focusing on three dimensions: 1. Moon et al. employed expert scoring to assess service models and quality [54], while Cheng’s team adopted questionnaire surveys to capture geriatric demand profiles [55]. 2. Balboa-Castillo et al. [56] identified walking as the predominant travel mode for Spanish seniors aged 65 and over, a finding corroborated by Li et al. [57] in rural Jintang, China, where walking remains central to elderly mobility. 3. Studies by Cheng and Baldwin et al. [55,58] evaluated facility performance through service quality metrics and management models.
Despite growing academic attention to population aging [59], existing studies present three main limitations: 1. Methodological Limitations: Traditional methods like expert scoring [11,58] and questionnaires [60,61] face challenges in capturing the dynamic evolution of elderly care demands during aging processes. Their reliance on static datasets and geographically constrained sampling frameworks limits cross-regional comparative analyses, particularly in disentangling urban-rural differentiation patterns of facility allocation [62]. 2. Spatial Synergy Neglect: Baldwin et al.’s research [58] over-relies on static built environment analyses of care facilities themselves, with insufficient investigation into spatial synergies with surrounding functional facilities. 3. Behavior-Environment Mismatch: Current studies inadequately address behavioral characteristics of the elderly. Despite the urgent need for a comprehensive 15-min walkability assessment system for urban and suburban seniors, existing evaluation frameworks insufficiently incorporate both elderly walking capacity and street-built environment considerations.
This study investigates elderly care facilities in Changsha through machine learning and multi-source data fusion, establishing a multidimensional walkability assessment system: 1. Spatial pattern analysis: The Random Forest algorithm was employed to decode spatial weight characteristics of facility locations in both urban and rural areas. This approach not only captures locational features of existing facilities but also effectively reveals urban-rural differentiation patterns, overcoming traditional methods’ over-reliance on expert experience. 2. Spatial synergy evaluation: Walkability scores and static decay functions were integrated to analyze spatial coordination between elderly care facilities and surrounding service infrastructure from pedestrian accessibility perspectives. 3. Micro-environment analysis: Streetscape semantic segmentation techniques were applied to extract urban streetscape elements, with regression analyses quantifying micro-scale impacts of built environments on walkability scores. Combined with Random Forest predictions, streetscape and demographic data enabled optimization simulations for facility distribution under urban-rural divergence scenarios.
Methodologically, this framework enhances spatiotemporal adaptability in facility assessment, identifies supply-demand mismatch hotspots, and provides scientific references for future facility siting. Theoretically, it enriches healthy city theories by incorporating elderly mobility constraints. Practically, the findings provide actionable insights for designing age-friendly urban-rural landscapes, optimizing equitable resource distribution, and enhancing societal well-being—offering critical policy pathways to address spatial inequities in aging societies.

2. Study Area and Data
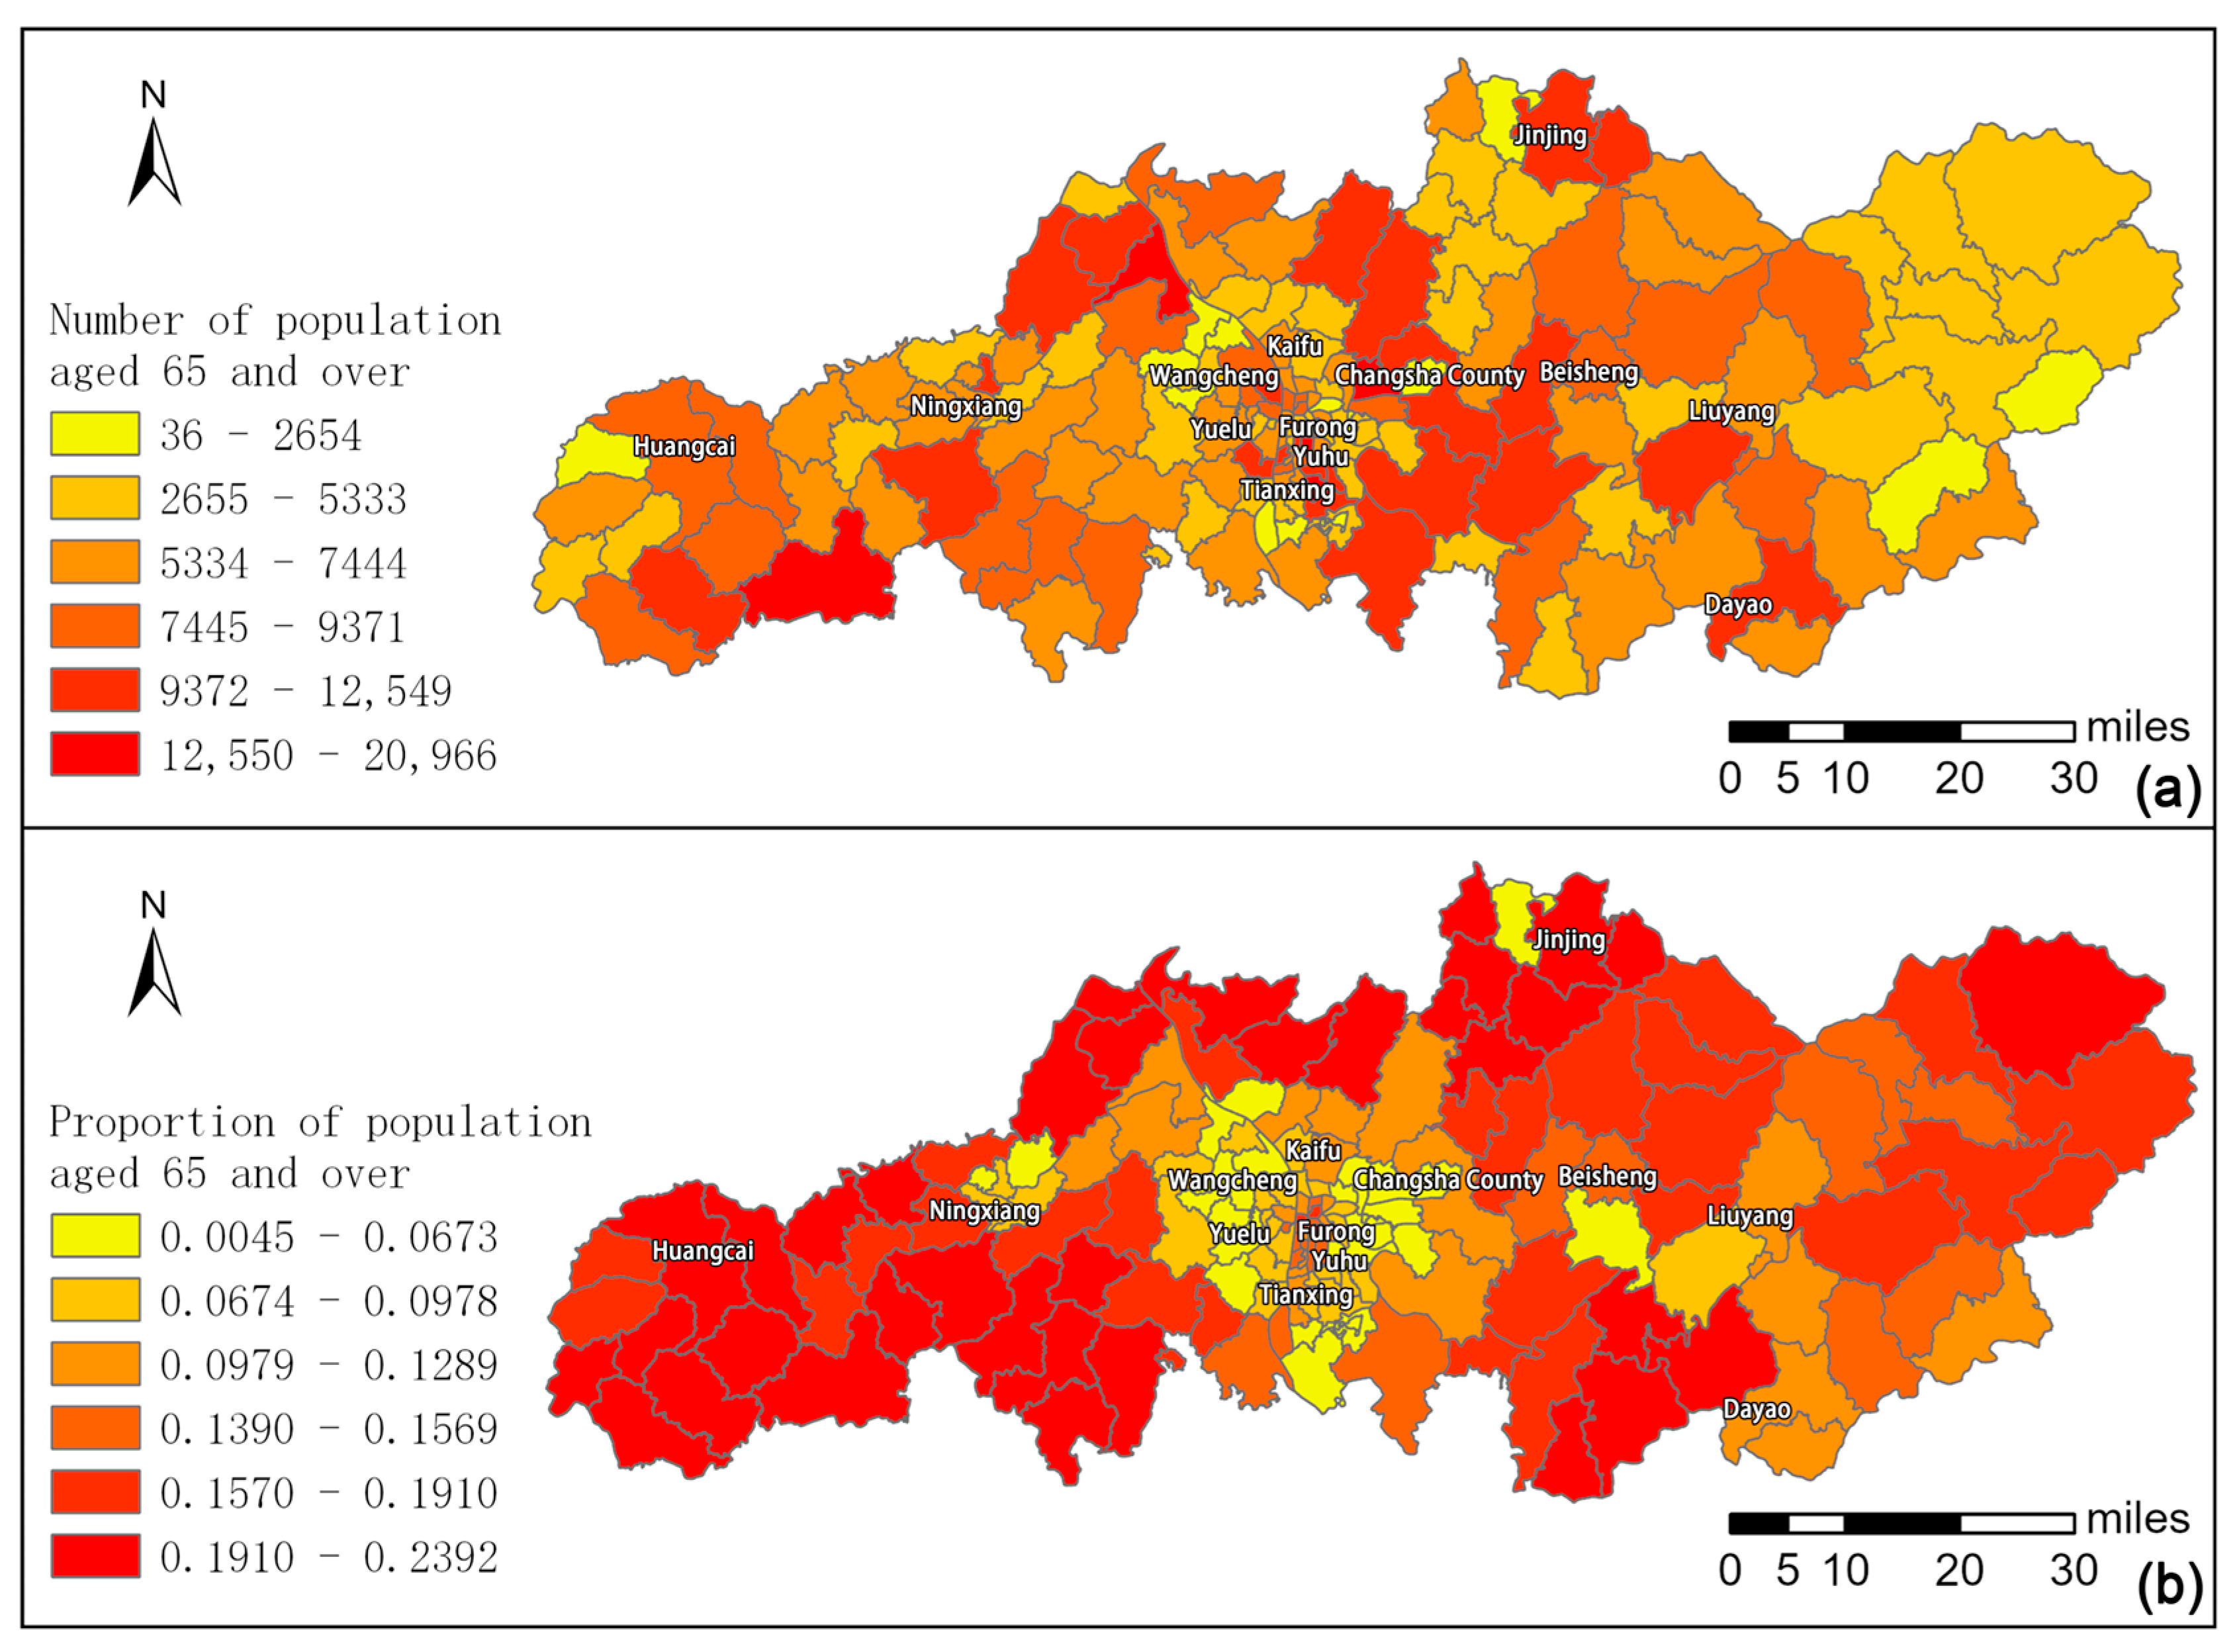
2.1. Study Area

This research focuses on Changsha City, Hunan Province, China, representing a critical case for investigating aging society challenges. As a megacity, Changsha faces intensifying population aging pressures [63]. According to Changsha Municipal Government statistics [64], by the end of 2023, the permanent population aged 60 and above in Changsha reached 1.8946 million, accounting for 18.02% of the total permanent population; the permanent population aged 65 and above was 1.1992 million, accounting for 11.41% of the total permanent population. Both indicators exceed the World Health Organization’s aging society baseline [3] thresholds by a substantial margin, indicating that Changsha has fully entered an aging society. Notably, the age structure of the elderly population in the city shows a trend of gradual upward shift, with the proportion of the oldest-old population continuously increasing [4]. This demographic shift has had a profound impact on the economic and social development of Changsha and poses serious challenges to the pension security system, urgently requiring collaborative efforts from the government and various sectors of society to explore effective coping strategies.
In the face of the severe situation of population aging, the contradiction between the supply and demand of elderly care services in Changsha has become increasingly prominent. According to data from the Hunan Provincial Bureau of Statistics [65], the aging rates in the five central urban districts with higher urbanization rates (Furong District 15.8%, Kaifu District 14.8%, Tianxin District 14.7%, Yuelu District 13.2%, and Yuhua District 12.7%) are all lower than the city’s average (16.8%). In contrast, the aging rates in suburban counties (21.4%), Wangcheng District (20.1%), and Liuyang City (19.3%) are substantially higher than the city’s average. There are also considerable disparities between urban and rural areas in terms of infrastructure, public services, social security, industrial development, and resident income. The economic gravitational effect of the urban areas continues to attract the working-age population to migrate in, resulting in relatively lower levels of population aging in the urban districts.

2.2. Data

The research framework of this study is illustrated in Figure 1. To measure the 15-min walking range, Point of Interest (POI) data was adopted as one of the core data types. POI data refers to a collection of specific geographic locations that hold significant value or attraction for individuals, with attribute information typically including names, latitude and longitude coordinates, etc. [17,66]. The POI data used in this study was obtained from the Baidu Map API (Application Programming Interface) for developers in 2024, collected through a Python-based program (version 3.9.7), totaling 387,109 entries. The POI data used in this study was sourced from the Baidu Map API (Application Programming Interface) provided for developers in 2024, collected via a Python-based program, totaling 387,109 entries. From this dataset, eight POI categories closely aligned with the needs of older adults were filtered, encompassing catering, shopping, healthcare, transportation, and other daily living service facilities. After manual cleaning and deduplication, 711 service facility POI entries related to elderly care facilities were obtained, including types such as nursing homes, elderly care centers, senior apartments, and elderly service centers [11,30]. The 2024 road network data of Changsha City was downloaded from OpenStreetMap [17].
To quantify the environmental characteristics of 15-min life circles at the neighborhood scale, this study integrates Baidu Street View images with semantic segmentation technology. Baidu Street View images were collected for specified latitude and longitude coordinates, capturing urban scenes in four cardinal directions (0°, 90°, 180°, and 270°). For the semantic segmentation algorithm, we employed the DeepLab-V3 model [67], a high-performance architecture developed by Google using the TensorFlow framework and Convolutional Neural Networks (CNNs). The model’s robustness for complex urban scene parsing was rigorously validated on the Cityscapes benchmark [68], which provides pixel-level annotations across 30 semantic categories in diverse street environments. This study utilized the Cityscapes dataset for semantic parsing of street view imagery. Drawing upon established research methodologies, ten critical street-level elements relevant to pedestrian environments were identified and analyzed: road surfaces, sidewalks, building facades, walls, fences, vegetation, terrain features, sky visibility, pedestrians, and traffic vehicles.
The population data were derived from China’s 2020 Seventh National Population Census [69], covering 172 subdistricts (townships) within Changsha’s administrative boundaries. Our analysis revealed notable aging population patterns: 18 subdistricts contained elderly populations (>65 years) exceeding 10,000 individuals; 98 subdistricts (56.97% of the total) had elderly populations surpassing 6000.The research data and sources are shown in Table 1.
As shown in Figure 2a, the spatial distribution of elderly residents demonstrates a distinct diffusion pattern from the main urban area to peripheral regions. Notably, Liuyang and Ningxiang emerged as substantial growth poles with concentrated elderly populations. These high-density areas, primarily located in central urban zones and selected rural peripheries, face substantial elderly care pressure.
Figure 2b illustrates two distinct aging patterns: absolute numbers peak in central urban districts and remote townships, while higher proportions of elderly residents cluster in surrounding townships. The pronounced growth poles in Liuyang and Ningxiang highlight regions requiring prioritized attention for elderly care facility placement due to intensified service demands.

3. Method

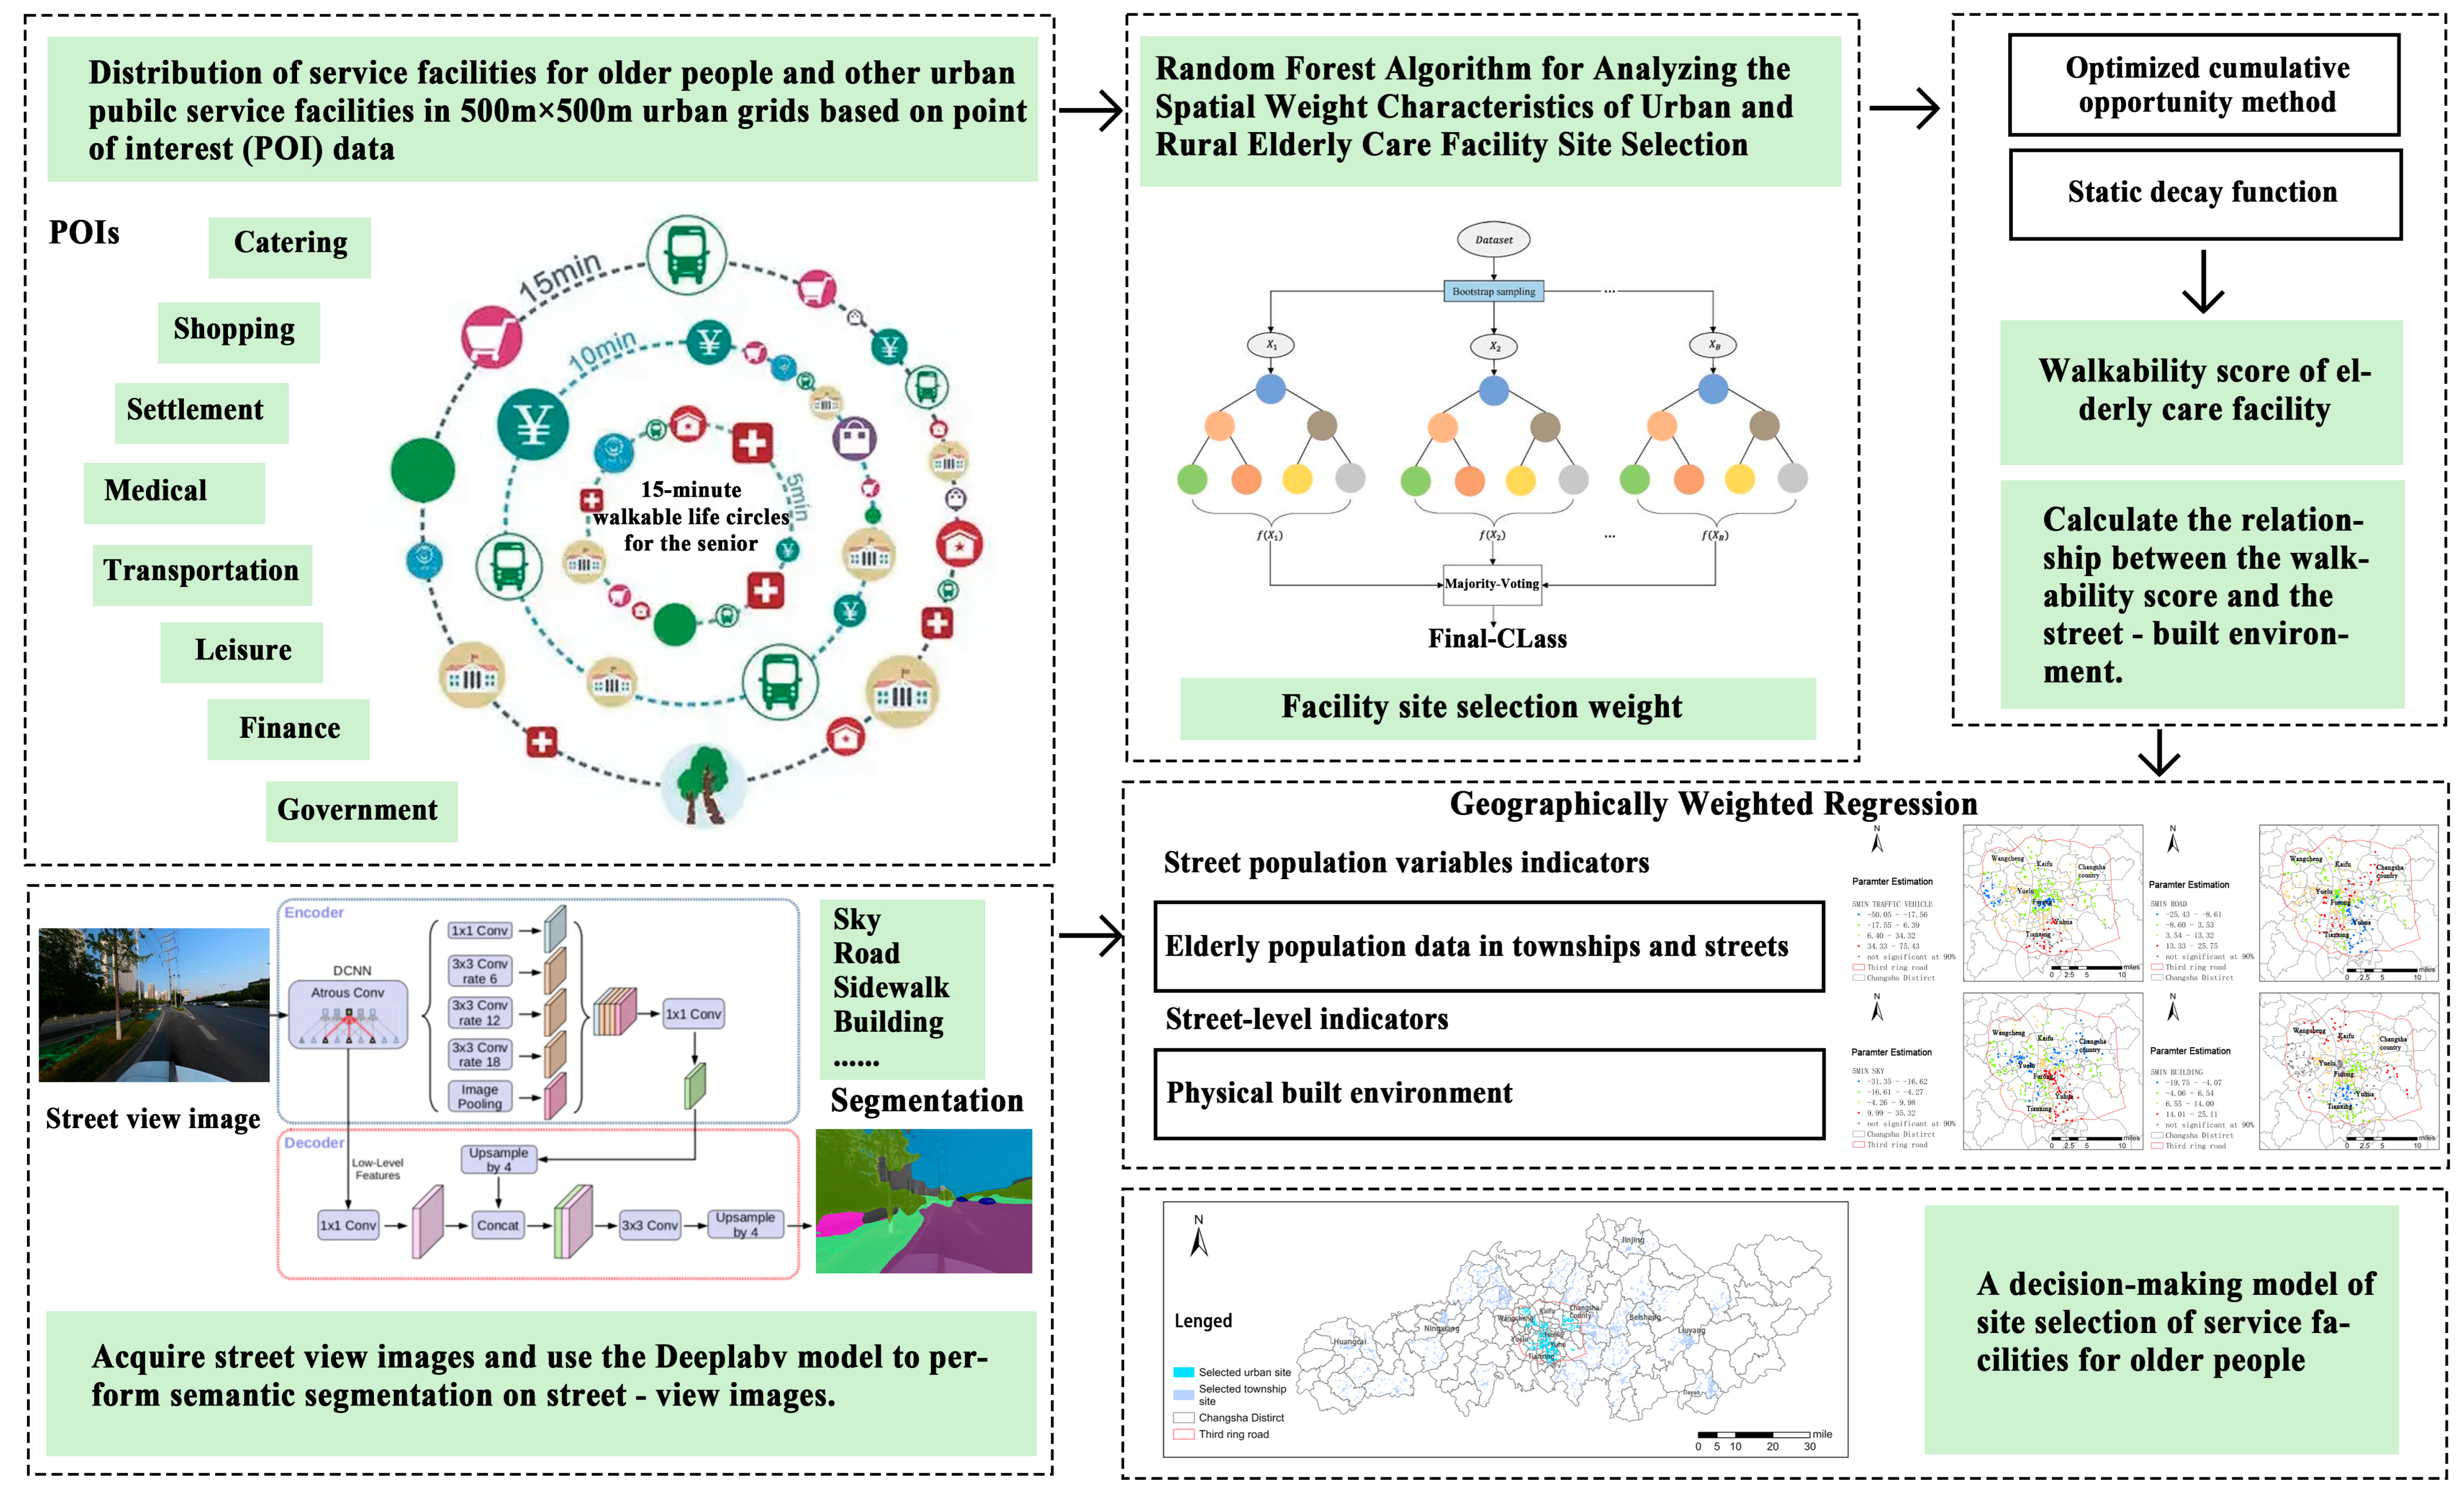
3.1. Selection of POI Facilities and Establishment of the Indicator System

To construct a comprehensive 15-min living circle indicator system centered on elderly care facilities, this study systematically reviewed China’s key planning guidelines [70] and relevant literature [71,72]. The research design employed a hierarchical modeling strategy:
1. Indicator System Development: Based on the Urban Elderly Facilities Planning Standards and Community Elderly Care Service Facilities Design Standards, an evaluation framework is established, encompassing 8 primary indicators and 23 secondary indicators. These include catering services [11,73], medical facilities [17,61,73], shopping services [11,17,56], and others. Detailed specifications are provided in Table 2.
2. Spatial Segmentation and Modeling: Leveraging Changsha’s spatial structure characteristics, the study area was divided into two units using the Third Ring Road as a boundary. Region-specific machine learning models are developed for each unit.
This differentiated modeling approach provides decision-making support that balances machine learning objectivity with spatial adaptability, addressing the heterogeneous demands of urban and peri-urban environments.

3.2. Facility Grid Division and Walking Time Calculation

In the classification of urban facilities, the first step is to filter and categorize a total of 387,109 POI points based on their relevance to elderly care services, using the established indicator system. These data cover 9 municipal districts and 172 streets (townships) in Changsha City.
To analyze the spatial distribution of facilities in greater detail, Changsha was divided into 48,445 grid cells (500 m × 500 m) based on typical service radii of elderly care facilities and optimal walking distances for older adults [42]. The Intersect tool in ArcGIS was employed to statistically aggregate facility counts per grid cell by category, generating a decision feature matrix for spatial modeling.
The walkable life circle was calculated using road network data of Changsha City, based on the Network Dataset module within ArcGIS., to evaluate the distribution of service facilities or resources accessible within specific walking time thresholds. This study uses the average walking speed of the elderly (1.8 miles/h) as the benchmark [74,75] to calculate the POI facilities accessible within 5-min, 10-min, and 15-min walking time thresholds. This approach quantifies the service coverage level of the living circle around elderly care facilities.

3.3. Evaluation of 15-min Walkability to Elderly Care Facilities

3.3.1. Machine Learning-Based Analysis of Facility Importance Weights

This study employs a random forest algorithm to construct a computational model for determining indicator weights, achieving methodological innovation compared to traditional questionnaire-based approaches. Existing research often relies on resident or expert surveys to derive POI facility attribute weights. While this method effectively captures subjective perceptions of 15-min living circles, it suffers from spatial representativeness: geographically uneven sampling distributions risk compromising the reliability of findings.
To address the challenge, we computationally quantified facility weights through decision tree recursive partitioning within the Random Forest framework, analyzing 8 primary indicators and 23 secondary indicators. The feature importance evaluation incorporated dual dimensions: spatial accessibility and service coverage. Furthermore, stratified analyses were conducted for urban core areas and peri-urban townships to objectively quantify the heterogeneous impact weights of facilities on elderly care location suitability across distinct geographic contexts.
This study utilized a Random Forest classifier with the following configurations: A balanced dataset was constructed through equal sampling of grid units containing elderly care facilities and control units, followed by stratified random splitting into training (70%) and testing (30%) subsets to preserve distributional characteristics. For node splitting, the Gini impurity criterion was adopted due to its robustness in handling class-imbalanced data. To prevent overfitting, tree depth was constrained to 8 layers, and a minimum of 15 samples per node was required for splitting. The ensemble comprised 300 decorrelated decision trees to enhance prediction stability via variance reduction. Model performance (Table 3) was assessed using accuracy (overall correctness), precision (positive predictive value), recall (sensitivity), and the F1-score (harmonic mean of precision and recall).
The proposed Random Forest classifier demonstrated robust and consistent predictive capabilities across both urban and rural study areas, as evidenced by comparable accuracy (0.792 vs. 0.793) and recall (0.792 vs. 0.793) values. The marginally higher precision in urban areas (0.814) suggests enhanced reliability in identifying elderly care facilities with fewer false positives. In contrast, the rural region achieved a slightly superior F1-score (0.791), indicating a more balanced trade-off between precision and recall.
As evidenced in Table 4 and Table 5, marked disparities exist in the weighting influences of various facilities on elderly care facility location selection between urban and township areas. In Changsha’s central urban districts, the top three primary indicators were catering services (0.3273), medical facilities (0.1790), and government institutions (0.1663), with secondary indicators prioritizing Chinese restaurants (0.16046), government agencies (0.14259), and residential zones (0.09495). These findings demonstrate that lifestyle-supporting infrastructure substantially impacts senior care facility siting in urban cores, suggesting planners should emphasize such amenities during site selection processes. The strong correlation between elderly care facilities and residential clusters likely reflects aggregated demand stemming from population concentration effects.
In contrast, township areas exhibited a distinct prioritization pattern, with catering services, government institutions, and retail establishments comprising the top three primary indicators. Secondary indicators revealed the highest weights for government agencies (0.21532), Chinese restaurants (0.17109), and convenience stores (0.12842). This spatial preference pattern implies rural elderly care facilities tend to cluster near administrative centers (e.g., village committees), potentially due to enhanced access to integrated public services, including administrative processing and community activities. Such colocation advantages may better satisfy seniors’ social support needs and daily living requirements through improved service accessibility.
Notably, medical service facilities maintain prominent weighting across both urban and rural contexts, highlighting the urgent demand for healthcare management and medical support among elderly populations. This phenomenon primarily stems from two interrelated factors: 1. The elderly population generally experiences compromised health status with elevated prevalence of chronic diseases and underlying health conditions; 2. Functionally impaired seniors constitute a substantial proportion of institutional care residents, demonstrating heightened dependency on medical services. Consequently, urban planners and policymakers should prioritize spatial configurations that ensure either immediate proximity to medical facilities or integrated co-location strategies when determining elderly care facility locations. Such deliberate spatial planning would effectively safeguard seniors’ access to essential medical care and nursing support services. Figure 3 shows the service function of different facilities in urban and township areas.

3.3.2. Calculation of Walkability Score Based on Optimization Cumulative Opportunity Method

The walkability assessment method is rooted in the theory of cumulative opportunity accessibility, a framework pioneered by Hansen [76] in the mid-20th century. With advancements in spatial analysis technology, scholars have proposed various improved models: Miller [77] explored the measurement and application of accessibility in transportation planning [78], Kelobonye et al. [79] introduced a spatial equity correction coefficient, and Singh and Sarkar [80] validated the method’s universality in public service evaluation through empirical research. Building on the classic cumulative opportunity method, this study integrates a static decay function to construct a spatial decay correction model. Based on research on the walking behavior characteristics of the elderly [58], a segmented decay function is designed:
F ( m ) = 1                   0 < m 5     0.6             5 < m 10       0.25       10 < m 15
The variable m denotes the walking time from a senior care facility to a nearby amenity. The decay function parameters are designed to reflect the walking tolerance characteristics of elderly populations: No decay (full-service zone) within 5 min, partial decay (transition zone) between 5 and 10 min, rapid decay beyond 10–15 min, which aligns with the nonlinear decline in walking speed as distance increases, a physiological pattern observed in older adults.
A multi-level weighted evaluation model is established as follows:
O j = k = 1 n i = 1 m W k × N i × F ( m )
O = j = 1 m O j × W j × O j O j m i n O j m a x O j m i n × 100
In Equation (2), O j represents the score of the category of primary indicator facilities,   N i is the number of ith category secondary indicator facilities, W k is the local weight of the kth category service facilities, and F ( m ) is the attenuation coefficient corresponding to the walking time distance.
In Equation (3), O is the total standardized walkability score of the senior care facility, W j is the global weight of the jth category primary indicator, O j m i n and O j m a x are the global maximum and minimum scores of the jth category service, respectively.
This standardization process effectively eliminates dimensional differences, ensuring the comparability of multi-source indicators.

3.4. Regression Model

To elucidate the mechanistic relationships between street-level built environments and walkability scores, this study employed Ordinary Least Squares regression to analyze their statistical associations, complemented by Geographically Weighted Regression to visualize spatial variations in how street-level environmental factors influence walkability scores.
The spatial integration of multi-source datasets was implemented as follows: Within 5-, 10-, and 15-min walking catchment areas surrounding each elderly care facility, we systematically established street view image sampling points at 50-m intervals along road networks. Street View imagery was captured via Baidu Map’s API. The DeepLabv3+semantic segmentation model is used to extract the pixel proportions of elements such as sky, buildings, and vegetation. By calculating the average results of observation points that meet the conditions, the average proportions of various street view elements are obtained as the street built environment dataset. Table 6 summarizes the statistical characteristics and definitions of these variables.

3.4.1. Ordinary Least Squares

The OLS model was employed to examine the global linear relationships among variables:
y i = β 0 + k = 0 j β k x i k + i
In this equation: y i represents the walkability score of senior care facility i in this study; x i k denotes the kth built environment indicator around the ith senior care facility; β k is the global regression coefficient for the independent variable k, and β 0 is the intercept; i is the error term for the ith senior care facility, assumed to be independently and identically distributed. The Variance Inflation Factor (VIF < 5) was used to test and exclude multicollinearity interference.

3.4.2. Geographically Weighted Regression (GWR)

To extend the OLS model for analyzing relationships between variables across different geographical locations and capturing spatial non-stationarity, a GWR model was constructed:
y i = β 0 ( u i , v i ) + k = 0 j β i k ( u i , v i ) x i k + i
In this equation: ( u i , v i ) represents the spatial coordinates of the location of senior care facility i; β i k ( u i , v i ) is the local regression coefficient for the kth independent variable, which varies with spatial location.
An adaptive bi-square kernel function was used to determine the spatial weight matrix:
ω i j = 1 d i j d i ( q ) 2 2 ( d i j d i ( q ) )
In this equation: d i j is the Euclidean distance between sample points i and j; d i ( q ) is the distance threshold for the qth nearest neighbor. The optimal bandwidth was determined using the golden section search method (based on the AICc minimization criterion). The specific computational procedure followed the spatial calibration algorithm proposed by Fotheringham et al. [81].

4. Results

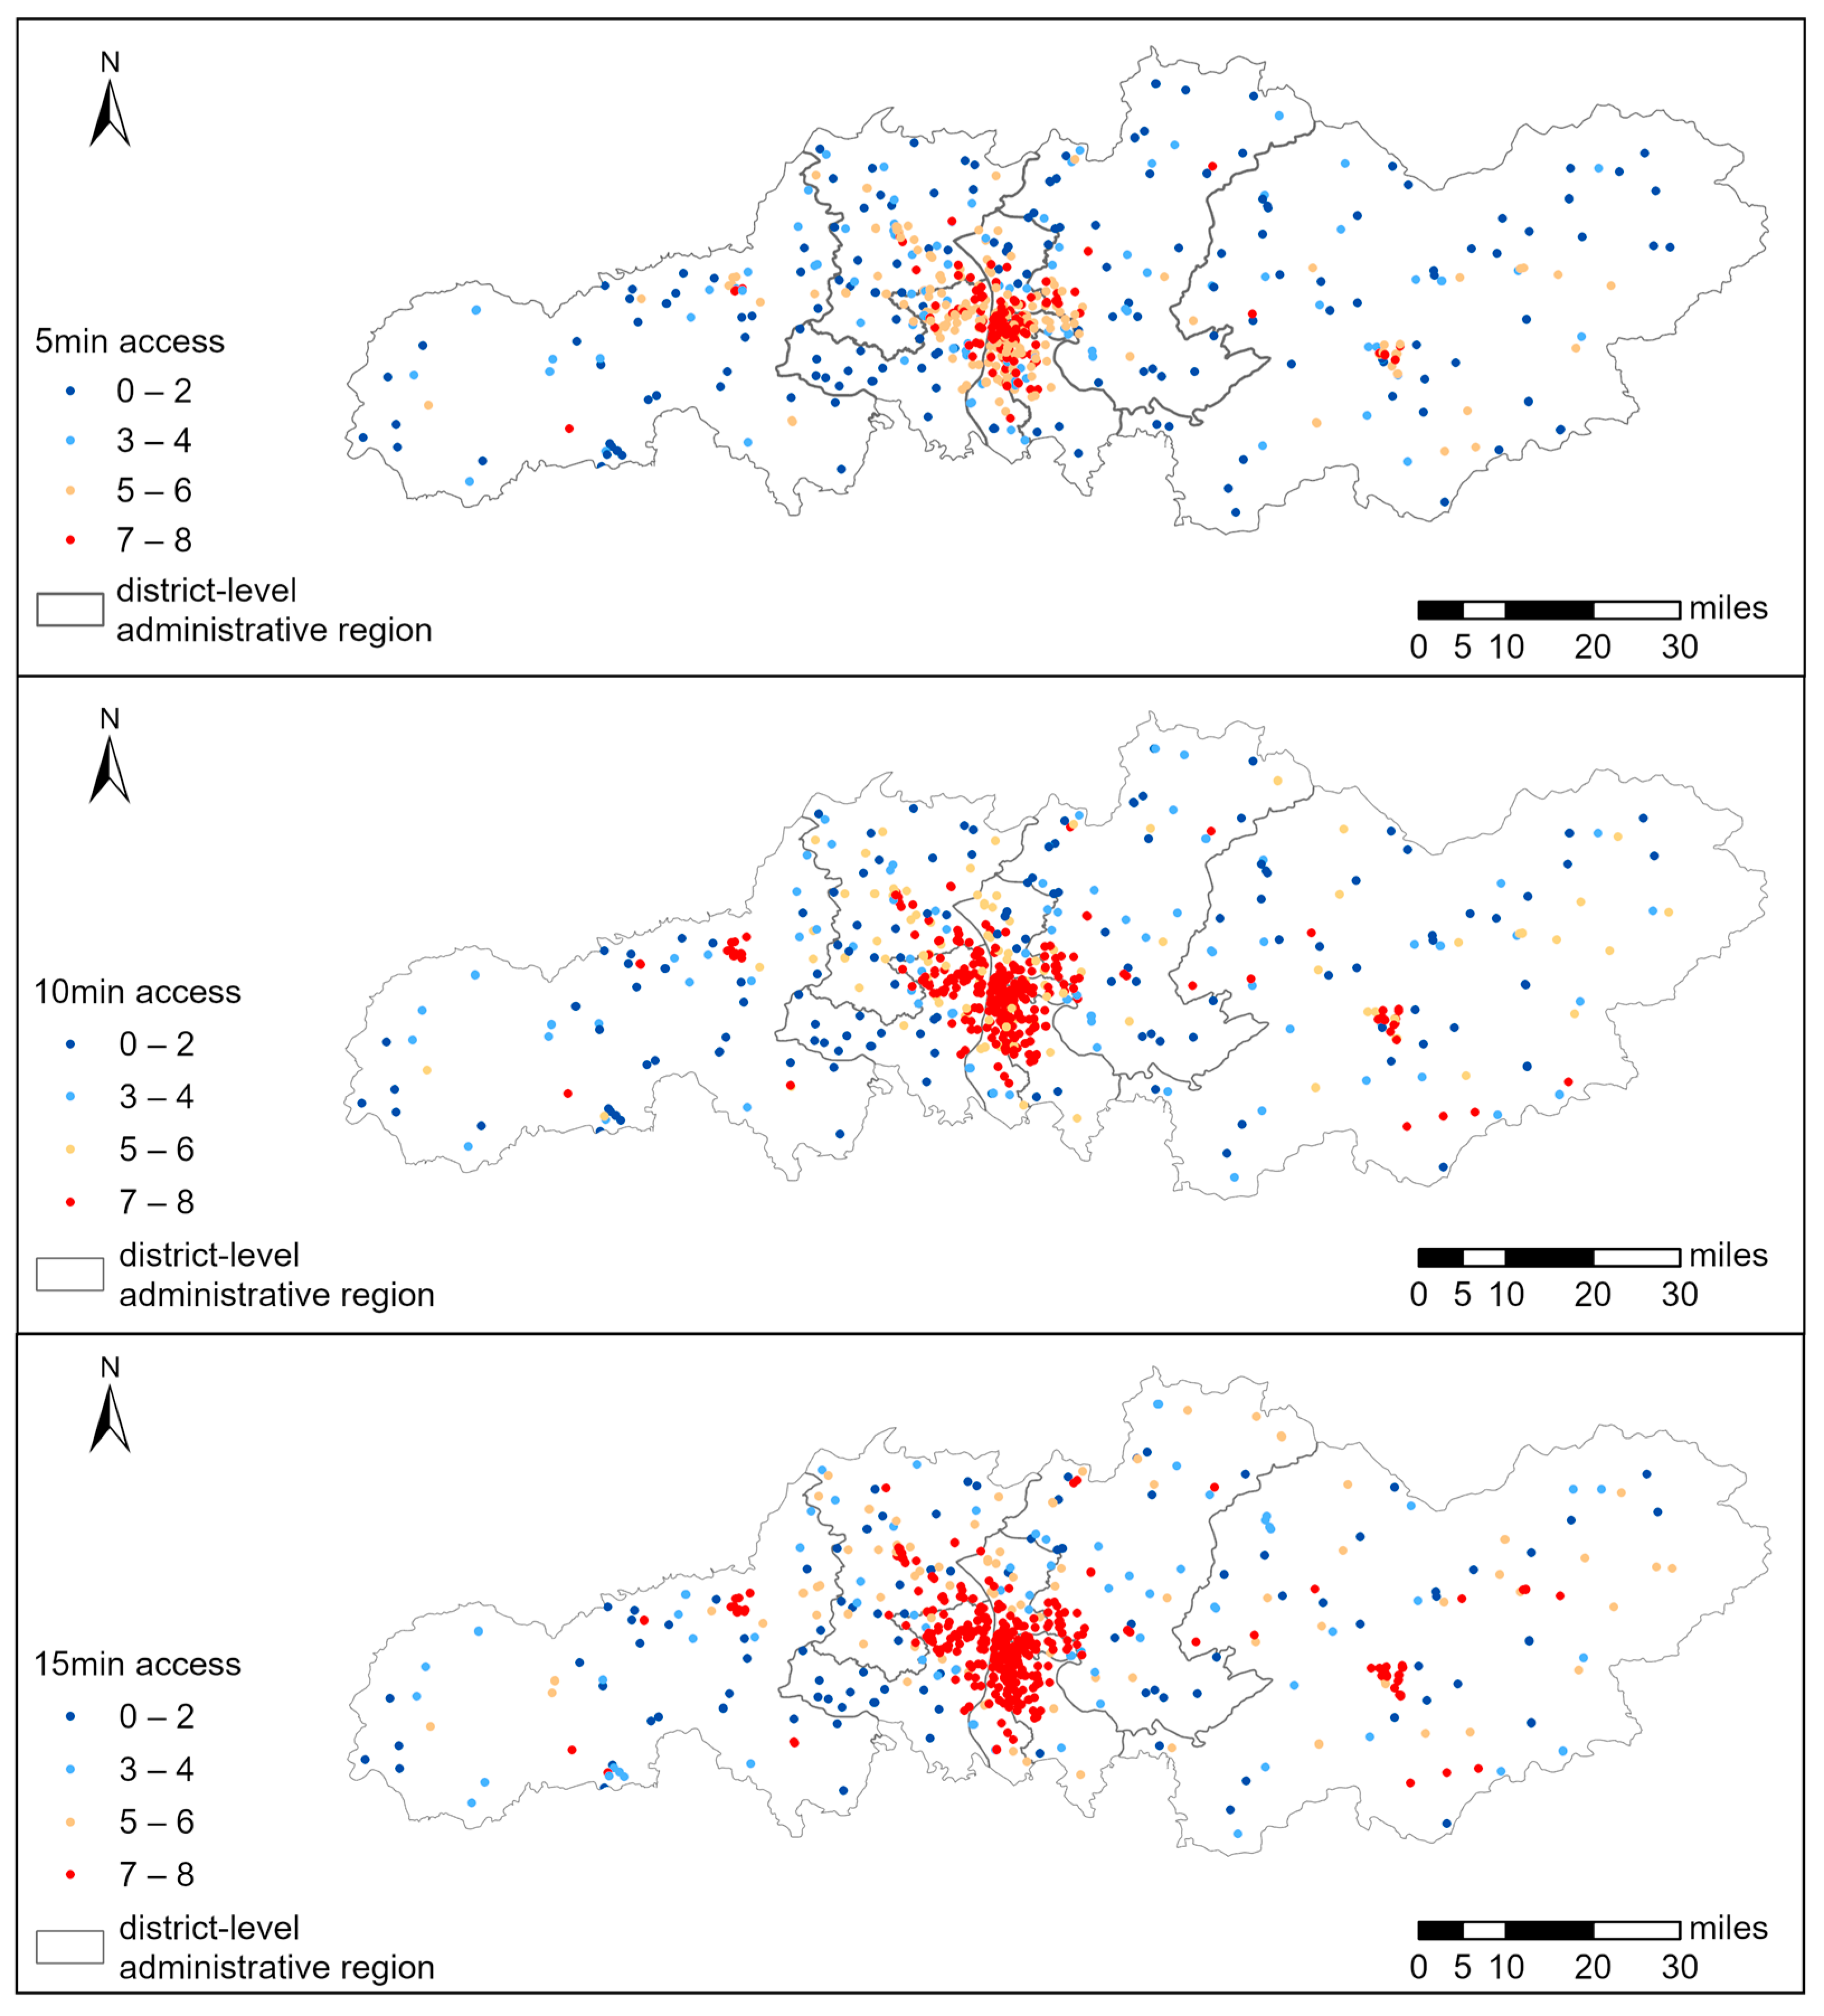
4.1. Service Accessibility for the Elderly Within 5-min, 10-min, and 15-min CLCs

For each elderly care facility, the accessibility of POI categories within walking time thresholds (5-, 10-, and 15-min) was systematically quantified. A facility is deemed to have access to a specific service type if at least one corresponding amenity of that category is reachable within the designated walking duration. Theoretically, an elderly care facility can achieve a maximum coverage of eight service types.
Figure 4 illustrates the types of Points of Interest (POIs) accessible to elderly residents across 711 senior care facilities within three-tier walking catchment areas in Changsha. The spatial analysis reveals pronounced urban-rural disparities in walkability performance. Under the 15-min walking threshold, central urban facilities demonstrate superior accessibility: 91.4% of institutions access seven or more types of services, with 70.25% reaching 8 categories, forming high-accessibility clusters centered in Tianxin, Yuhua, and Furong Districts along the east bank of the Xiangjiang River. This spatial pattern is closely associated with the high-density built environment and compact land use in older urban areas, demonstrating substantially improved accessibility metrics compared to newer West Bank developments. Notably, emerging secondary accessibility hubs in the Liuyang and Ningxiang regions manifest a “core-satellite” spatial configuration, potentially aligning with Changsha’s polycentric development strategy.
In contrast, township facilities exhibit markedly reduced accessibility—merely 26.86% achieve seven or more types of services within 15-min walks, displaying dispersed spatial distribution. When thresholds tighten to 10 min, 81.81% of urban facilities can still access seven types of services versus 18.89% in townships, where most facilities cover fewer than five types of services. Although spatial patterns resemble 15-min results, urban core service areas contract substantially. Crucially, the 10-min walking radius—representing seniors’ high-frequency activity range—reveals acute service deficiencies in township areas.
Further analysis under the 5-min walking threshold reveals that 42.32% of the facilities in the central urban area can access seven types of services, but 11.65% of the facilities still cover fewer than four types of services. In rural townships, service gaps are widespread, as service resources have not kept pace with suburban development, and most facilities can only cover one to two types of services. Spatial comparisons show that the 5-min walkability in the newly developed areas on the west bank of the Xiangjiang River is substantially lower than that in the older urban areas on the east bank, reflecting the insufficient density of life-service facilities in newly developed regions. This phenomenon suggests that planners need to prioritize optimizing the 5-min coverage network for frequently used facilities (such as medical services and convenience stores), particularly by establishing micro-living circles with basic service facilities in newly developed urban areas and rural townships.
This study further identifies deficiencies in facility allocation by analyzing the accessibility of service categories under different walking time thresholds (Table 7). The data reveals that urban senior care facilities demonstrate substantial advantages in accessing three fundamental services (catering, medical care, and shopping) within central urban areas: over 90% of institutions can reach these facilities within a 10-min walking radius. Notably, the coverage rate of medical facilities reaches 90.37% under the 5-min walking threshold, highlighting the highly efficient distribution of urban healthcare resources. However, a noticeable gap persists in recreational facility accessibility, with only 57.2% of institutions having access to such services within a 15-min walking range, reflecting an insufficient supply of age-friendly cultural and sports facilities.
In contrast, rural township areas require improvement in medical service coverage—merely 59.8% of senior care institutions can access medical facilities within a 15-min walking radius. Considering the essential demands for chronic disease management and emergency medical care, it is recommended to enhance basic healthcare provision for rural elderly through strategic deployment of micro-medical nodes such as community health stations and smart pharmaceutical cabinets.

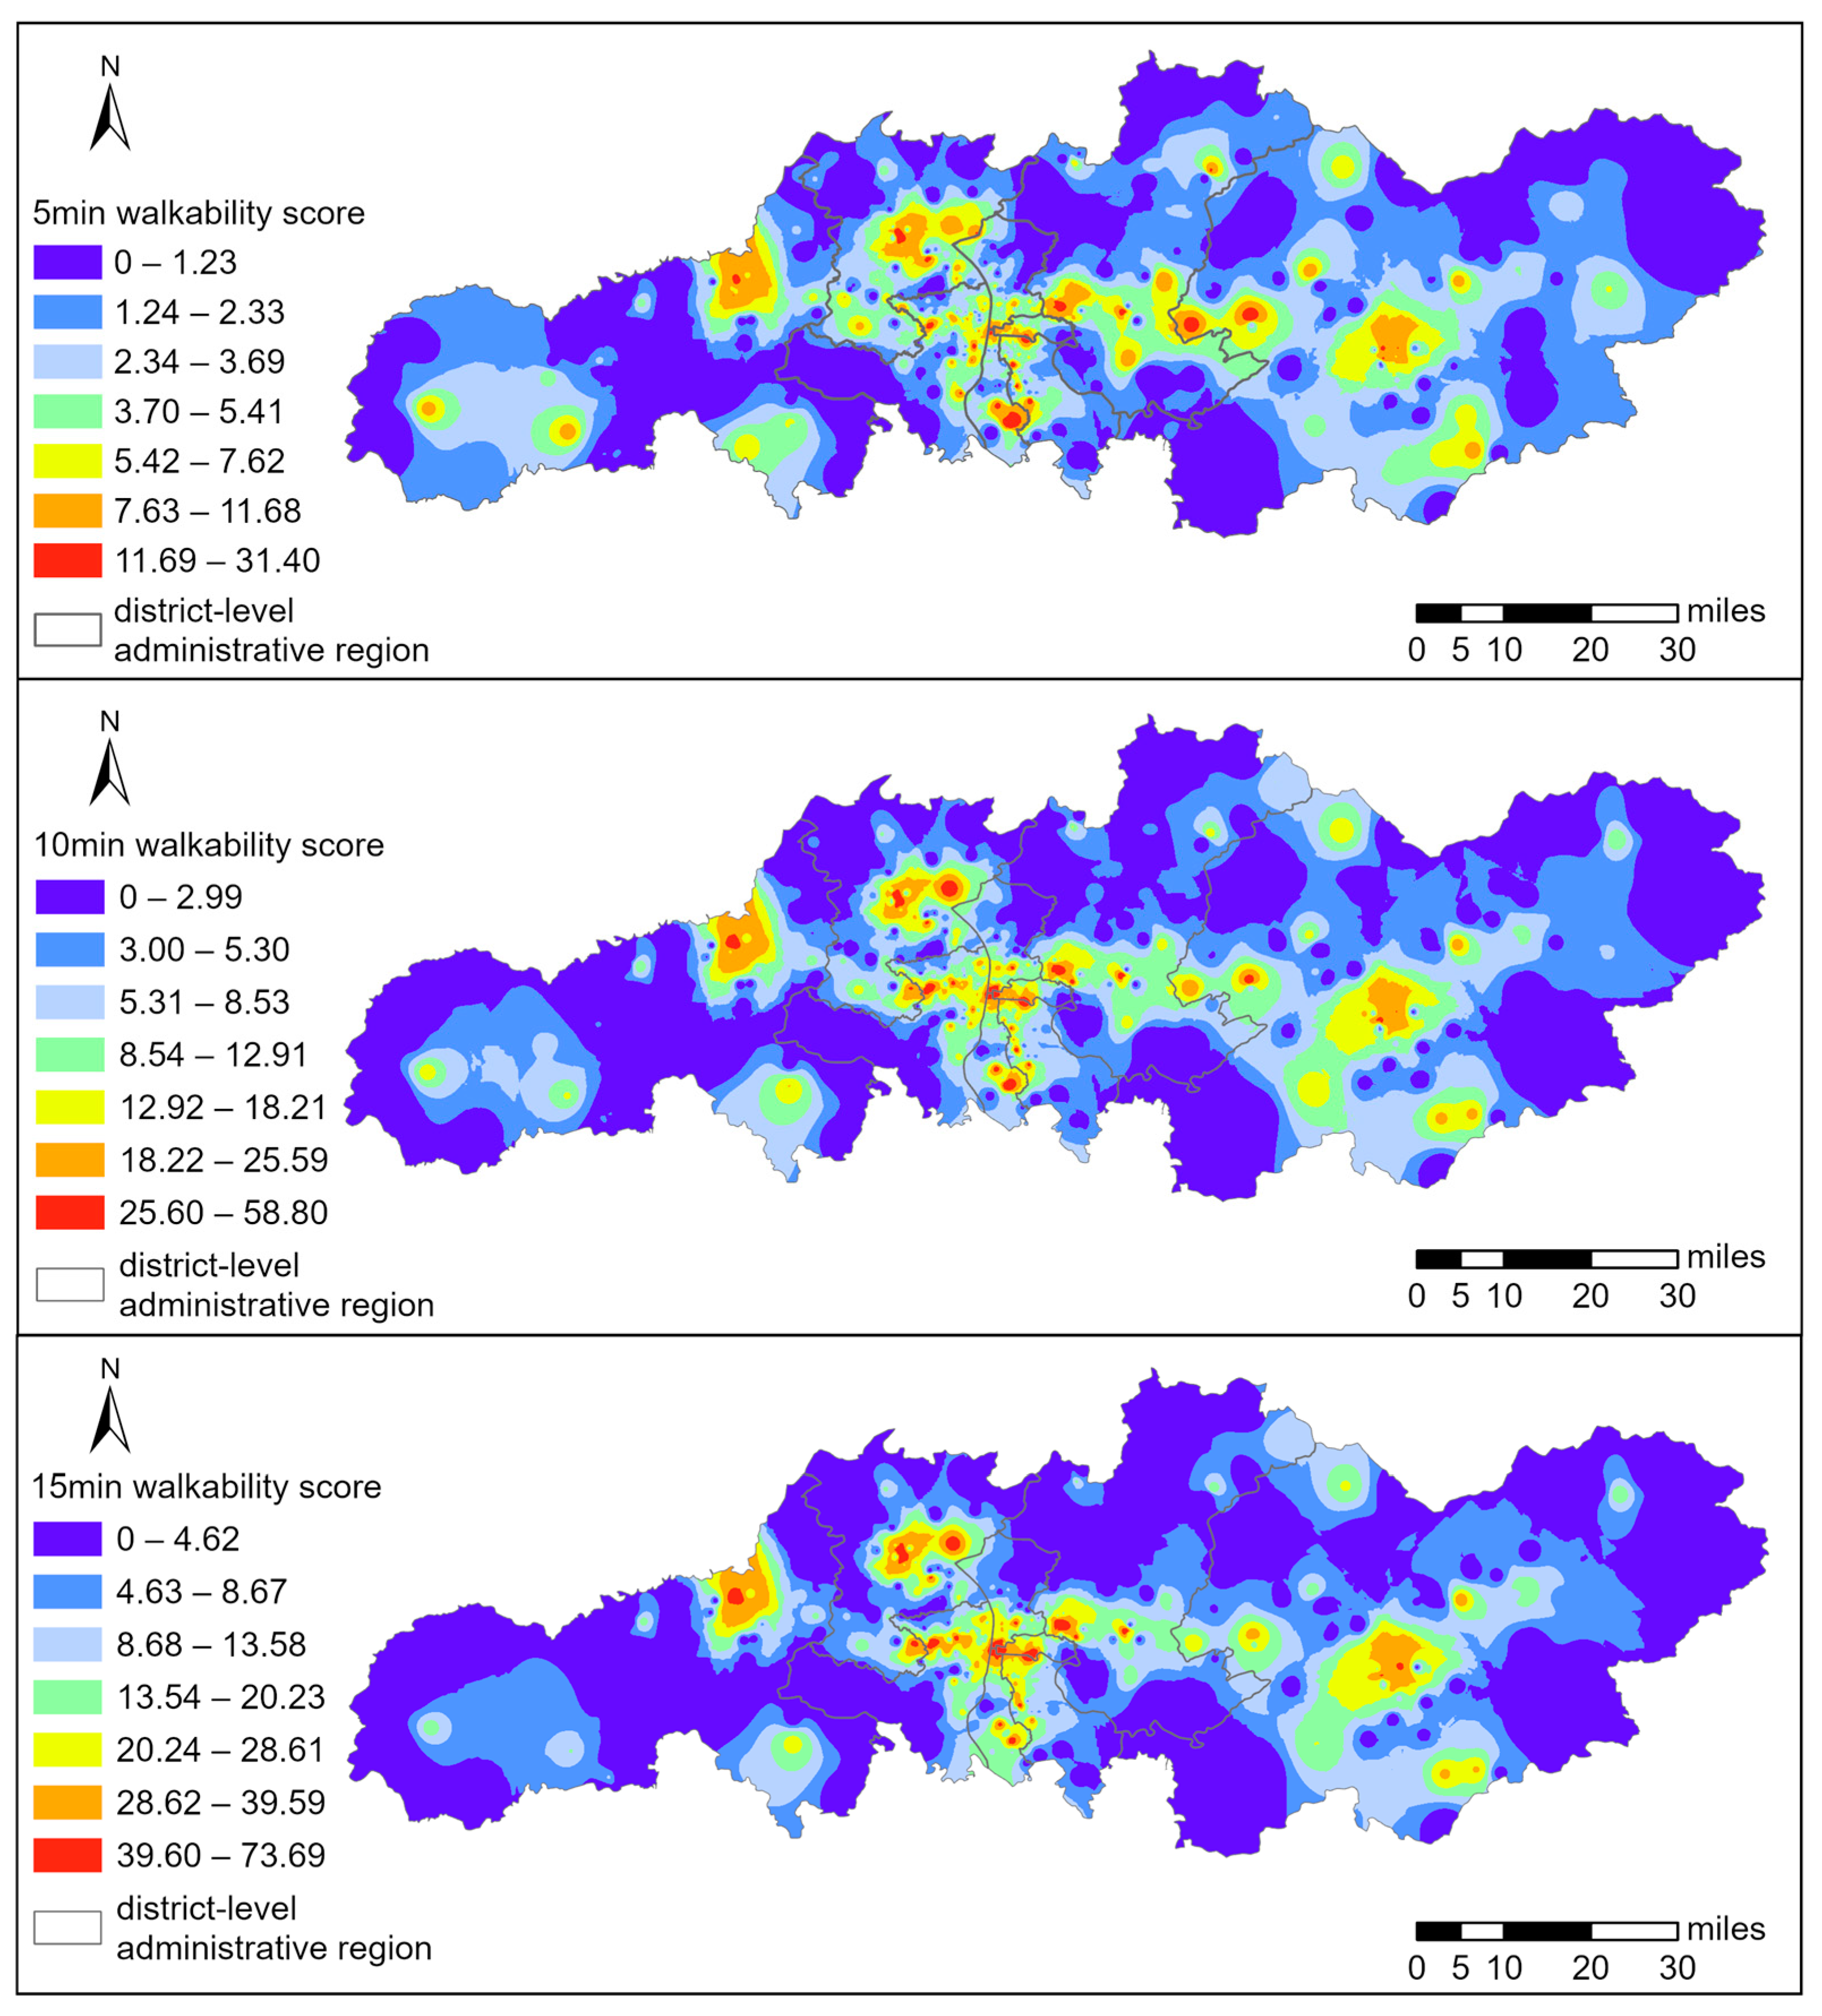
4.2. Walkability Scores of Senior Care Facilities Within 5-min, 10-min, and 15-min Living Circles

This study quantitatively evaluated the spatial service efficiency of senior care facilities under 5-min, 10-min, and 15-min walking thresholds by constructing a multi-scale living circle walkability evaluation system. The spatial distribution map of comprehensive walkability scores, generated using the Inverse Distance Weighting (IDW) interpolation method in ArcGIS (Figure 5), reveals substantial gradient differences and multi-core clustering characteristics in the walkability of senior care facility living circles in Changsha City. The core high-value areas are concentrated in mature urban districts on the east bank of the Xiangjiang River, such as Yuhua District and Tianxin District, with secondary cores forming in Liuyang and Ningxiang. This spatial pattern aligns with the distribution of accessible service types discussed in the previous section.
Notably, quantitative analysis shows that although the highest score for the 15-min living circle reaches 71 points, 56% of senior care facilities score below 15 points. Facilities with low scores (30 points) are primarily distributed in urban areas on the west bank of the Xiangjiang River and rural townships, reflecting spatial imbalances in the allocation of service resources. Furthermore, as the walking time threshold expands, both the mean walkability scores (5 min: 4.28 → 10 min: 10.51 → 15 min: 17.07) and the range of scores (5 min: 31 → 10 min: 58 → 15 min: 73) show an increasing trend. This indicates that spatial inequality is more pronounced in the 15-min and 10-min living circles compared to the 5-min living circle.

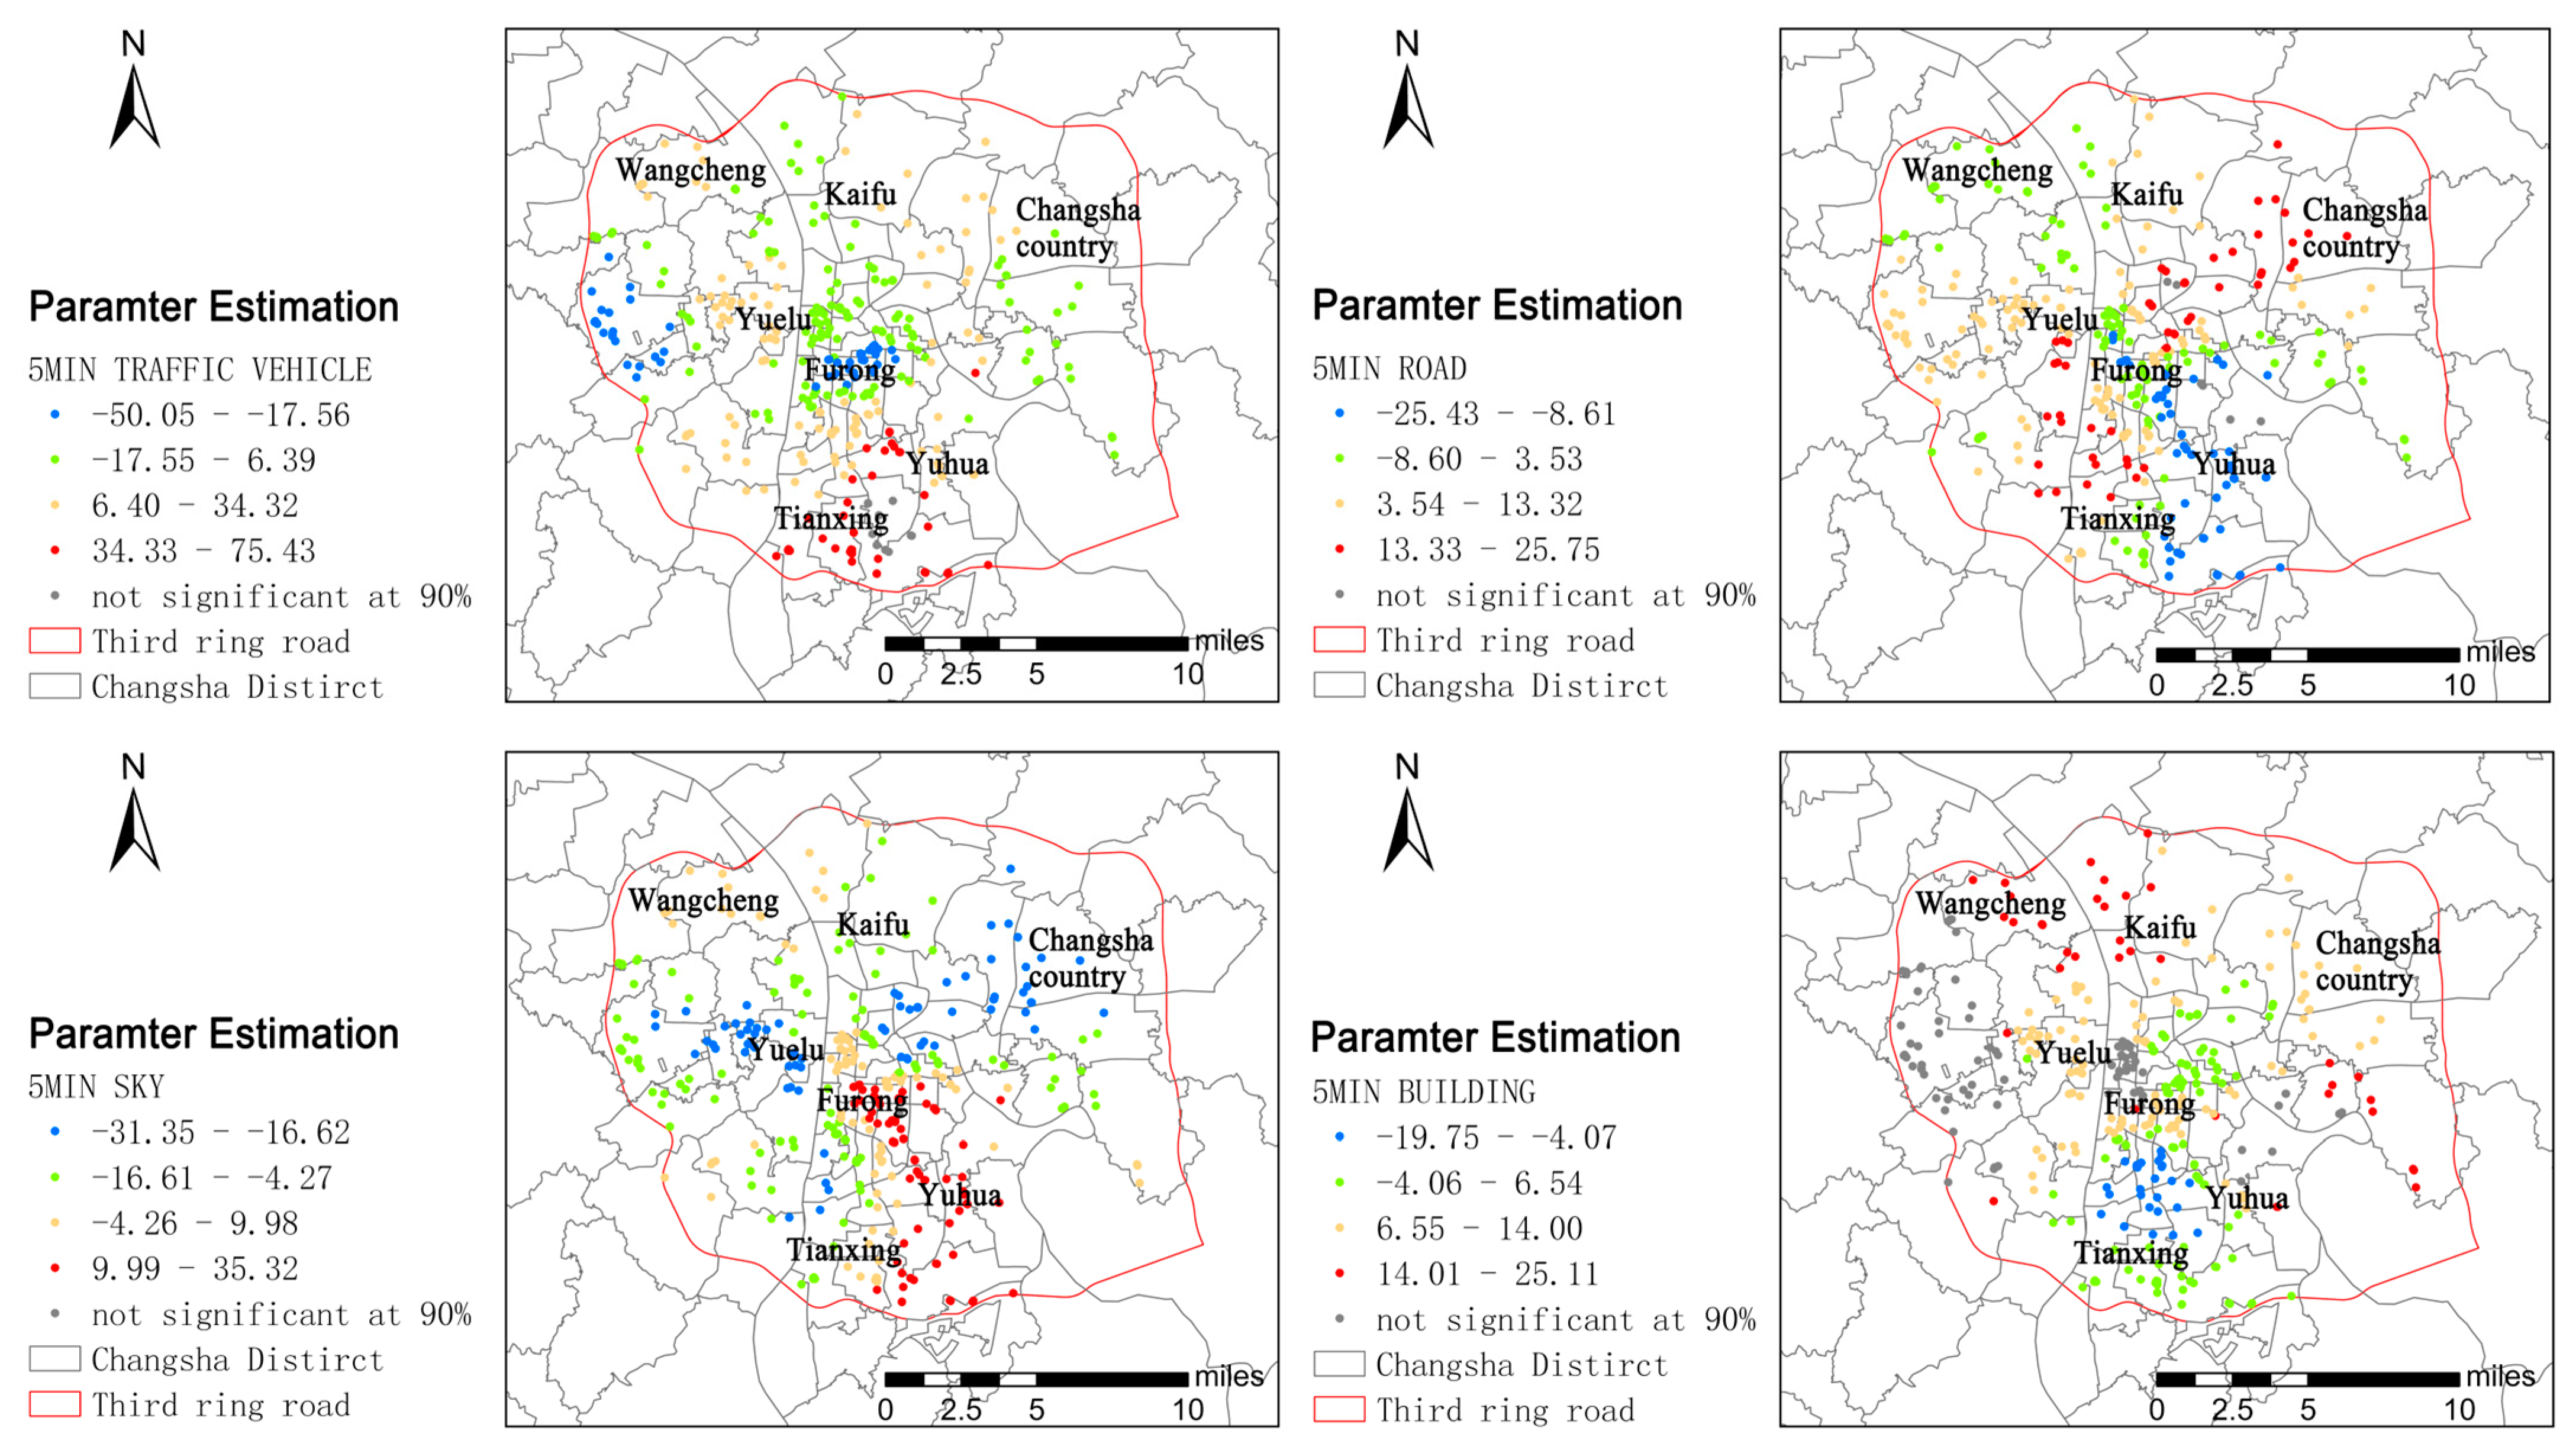
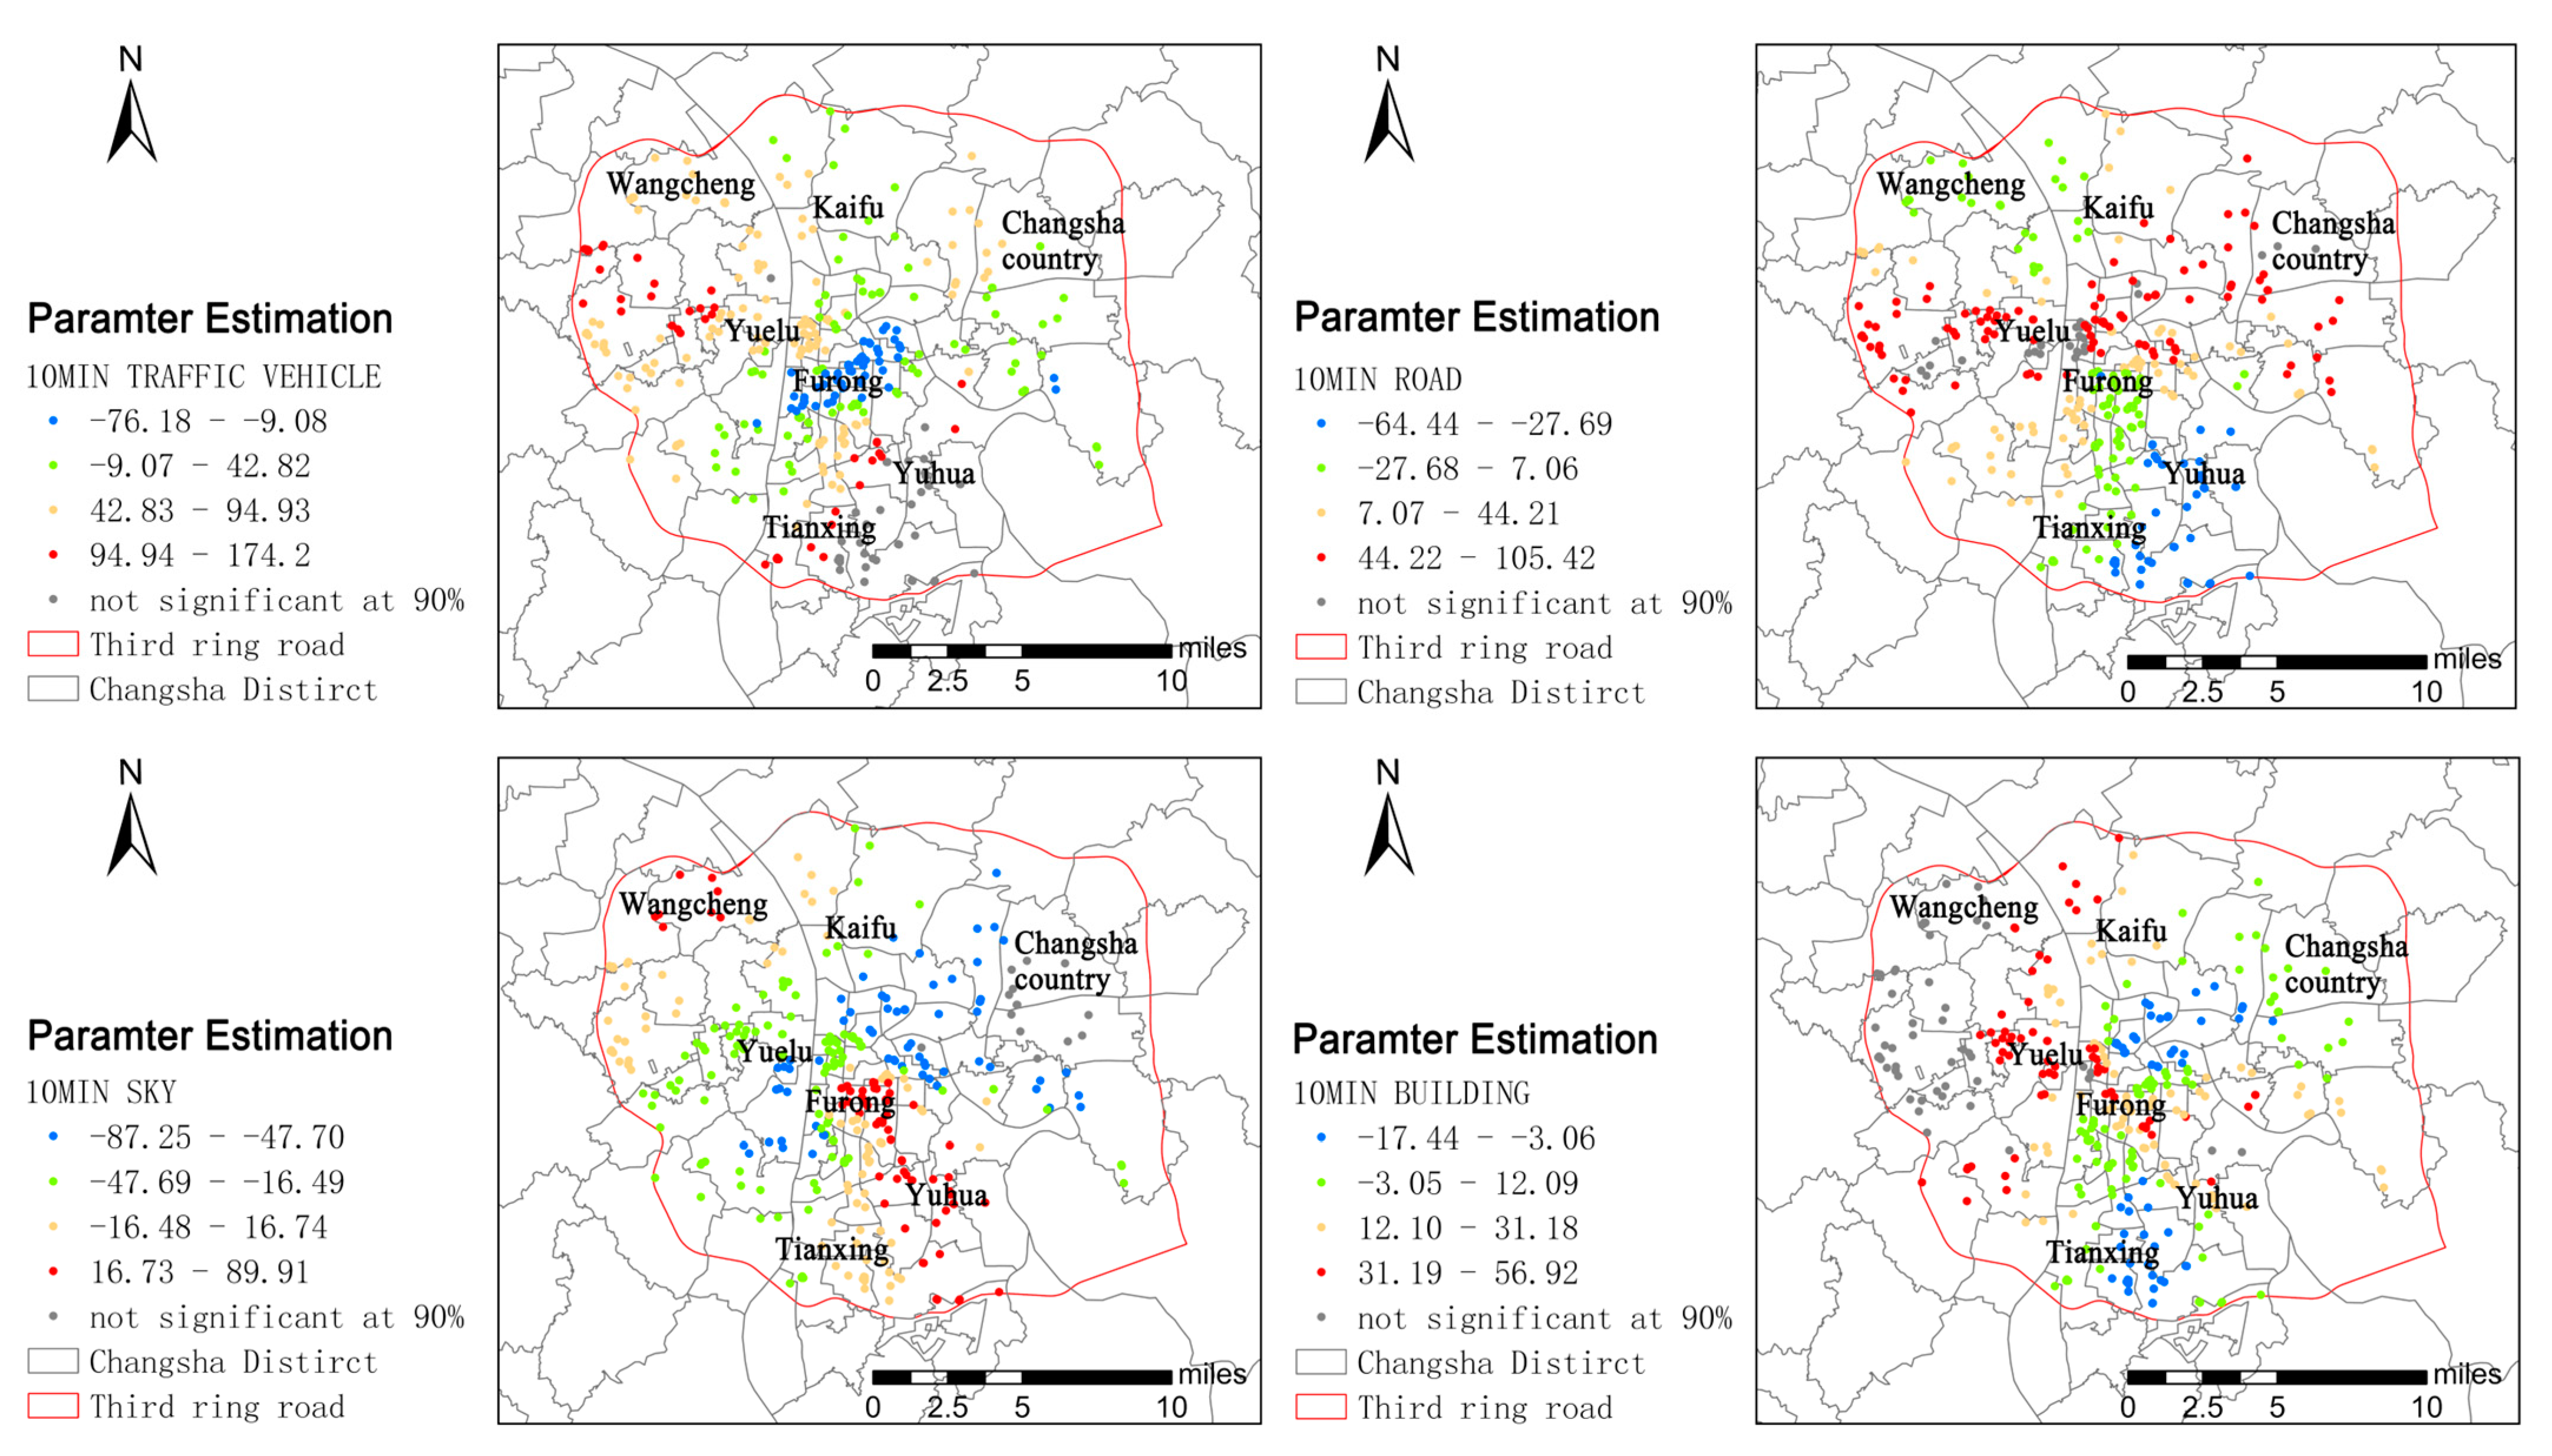
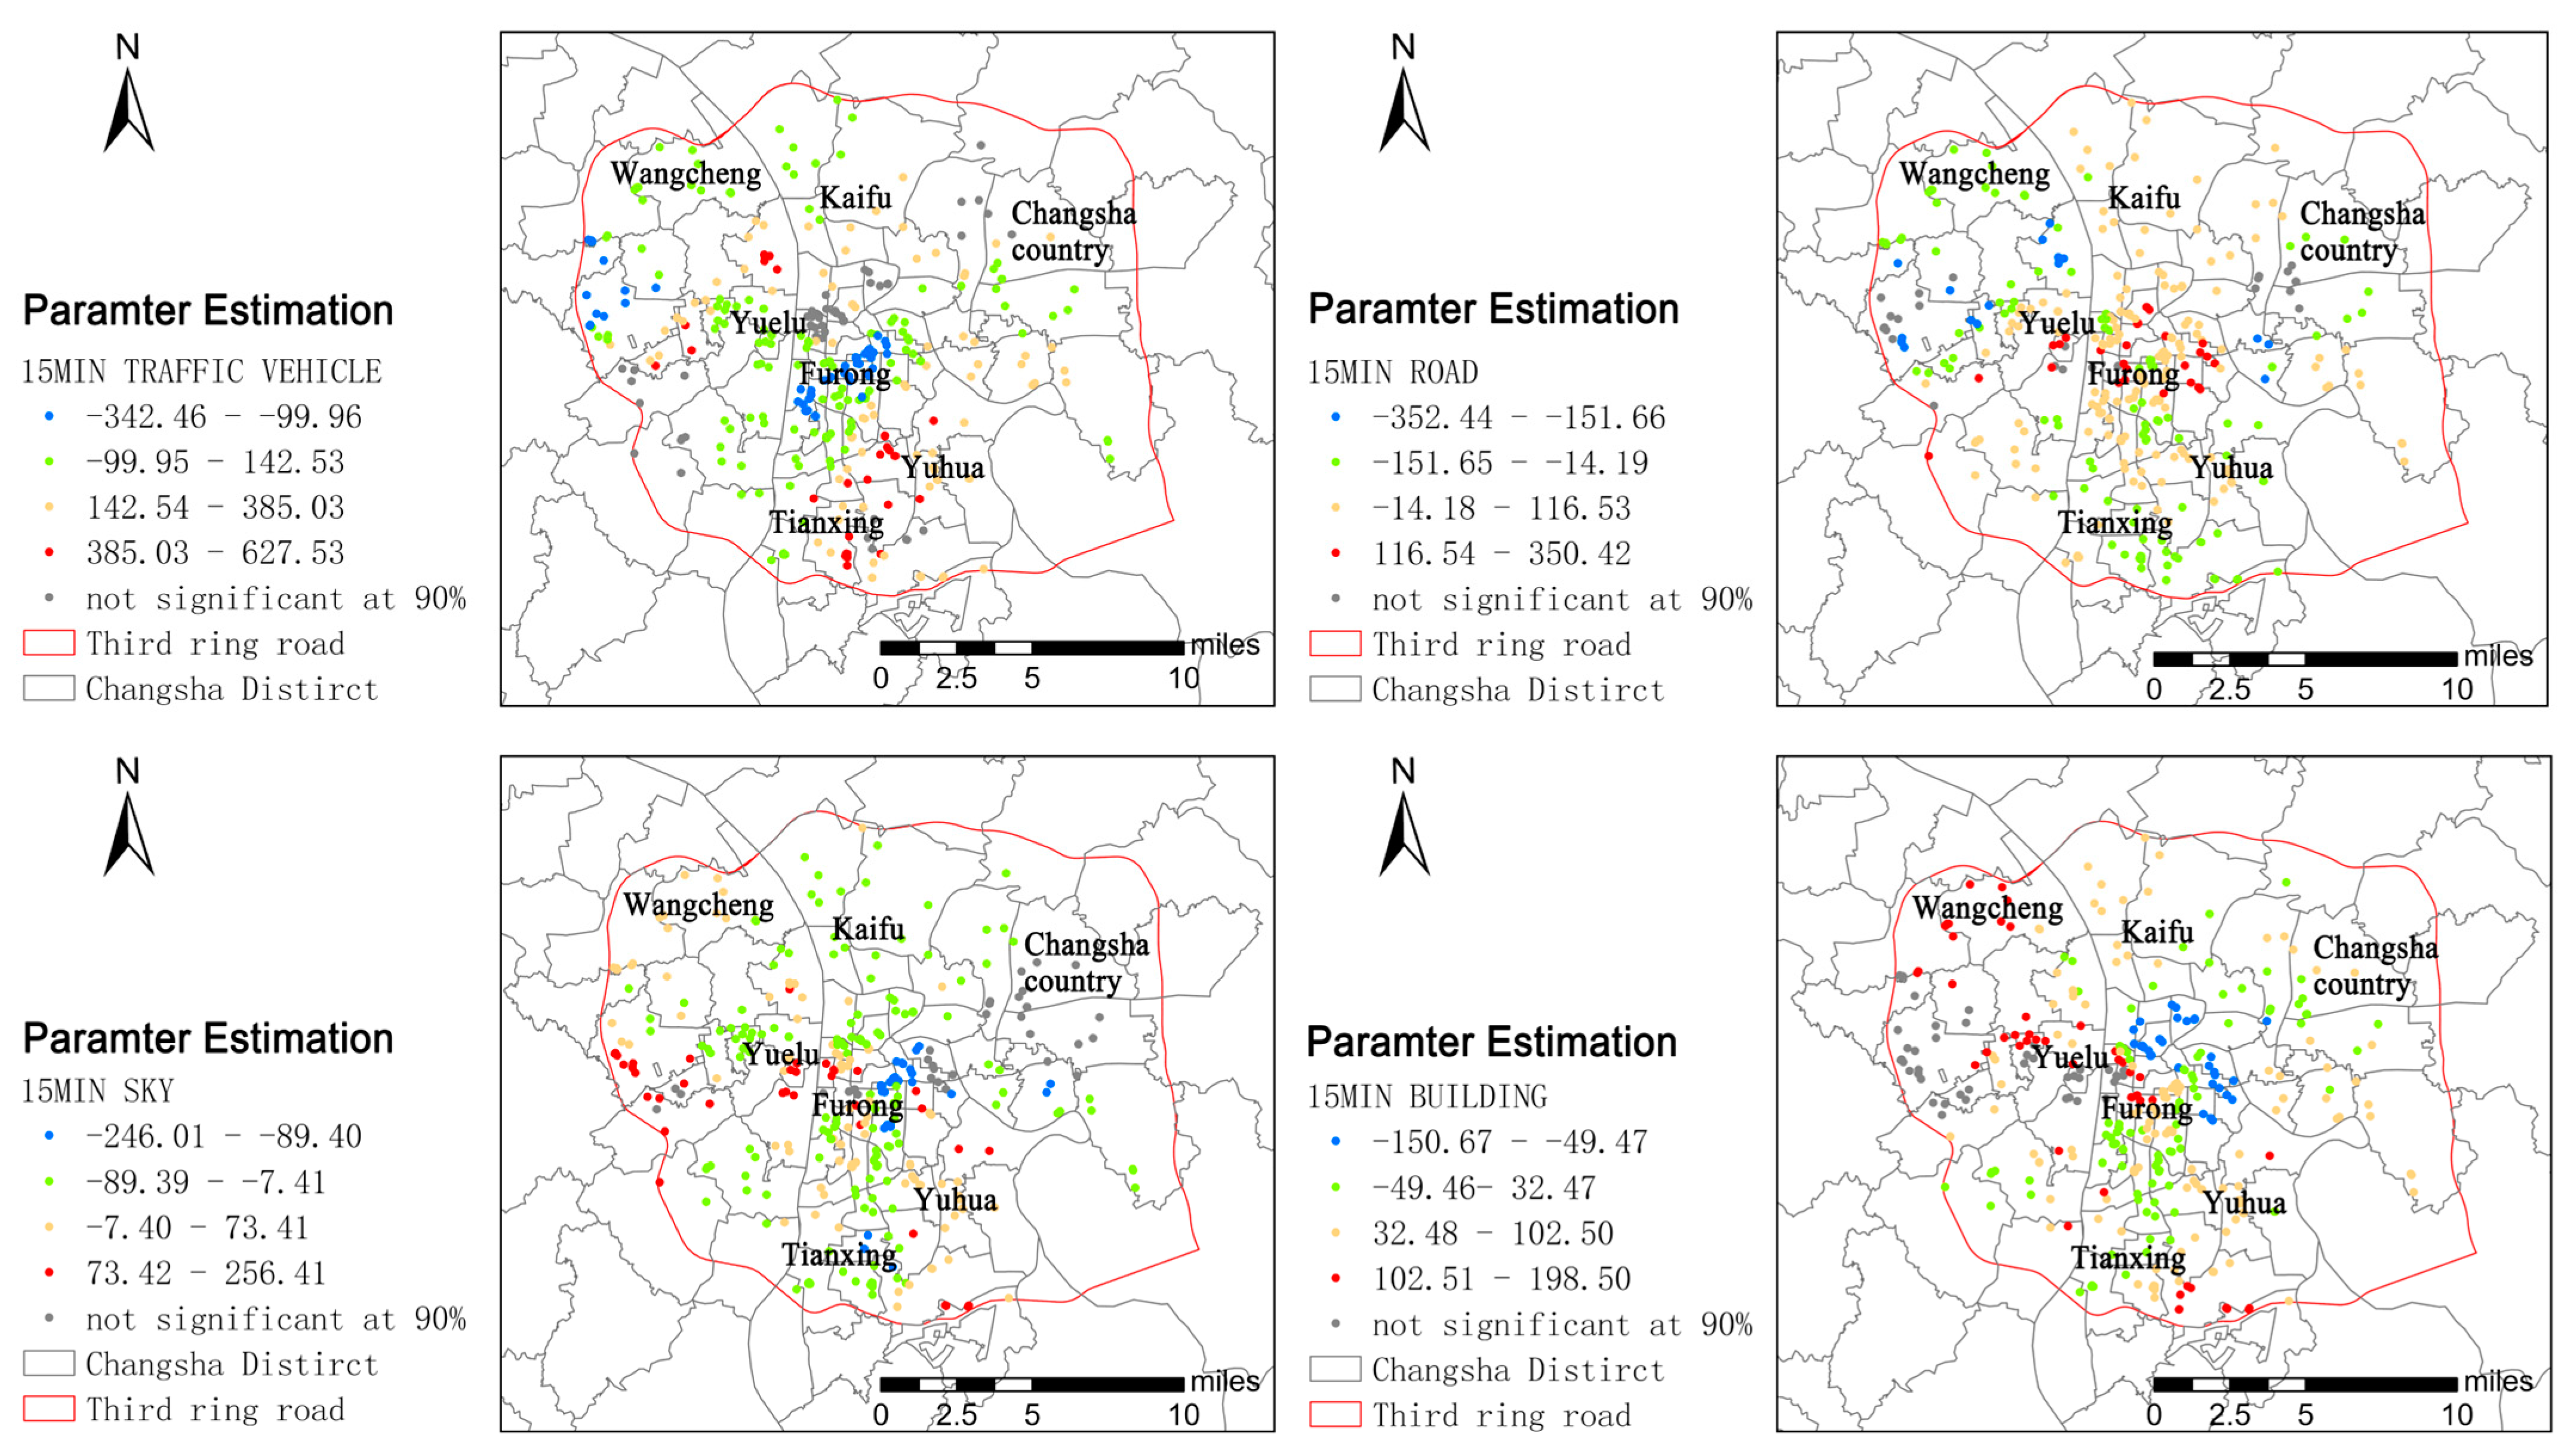
4.3. Multiple Regression Models

This section employs OLS and GWR models to explore the mechanisms linking walkability scores in the central urban area to the elderly population and street-level environmental factors. First, a multicollinearity diagnosis was conducted. By calculating the Variance Inflation Factor, we found that all independent variables had VIF values below 5 (Table 8), indicating no significant multicollinearity issues. Thus, all independent variables were retained for subsequent analysis.
Notably, the Sky View Factor (SVF) shows a significant negative correlation with walkability scores (p < 0.05). This phenomenon may reflect the dual impact of urban spatial form on the walking environment: while a higher SVF typically indicates a more open visual experience and a more aesthetically pleasing walking environment, such spatial characteristics are often found in suburban areas with lower building space ratios, where land use intensity and the concentration of public service facilities are relatively insufficient, thereby reducing walking comfort and convenience.
Furthermore, the study finds that road space ratio and pedestrian density show positive associations with walkability scores (p < 0.05), particularly in the 15-min living circle. This result confirms that good road infrastructure and higher pedestrian density are often spatially coupled with well-distributed service facilities, thereby enhancing regional walkability. These findings provide important empirical evidence for optimizing urban walking environments and improving the quality of life for the elderly population.
Based on the OLS results and previous research findings on walkability [81], we employed GWR to further analyze how the relationships between the four significant variables—building space ratio, SVF, road space ratio, and pedestrian density—vary across geographic regions and their spatial impacts on walkability scores. The coefficients of these independent variables were spatially visualized to examine their effects in different regions. Figure 6, Figure 7 and Figure 8 vividly depict the spatial variations of these local parameter estimates for walkability scores within the 5-min, 10-min, and 15-min living circles.
The research findings reveal a substantial spatial heterogeneity in the relationship between transportation facility density and walkability scores. In regions such as Yuhua District and Wangcheng District, a positive correlation between transportation facility density and walkability scores is observed, reflecting the positive association between transportation convenience, regional prosperity, and the completeness of service facilities. However, in Furong District and the southwestern part of Wangcheng District, the density of transportation facilities within the 5-min and 15-min walking thresholds shows a significant negative correlation with walkability scores (p < 0.01). This anomaly may stem from these areas’ greater emphasis on non-walking transportation modes, leading to reduced land use density and dispersed service facilities, thereby negatively impacting the quality of the walking environment.
The relationship between road proportion and walkability scores demonstrates substantial scale dependency. At the 5-min living circle scale, road proportion shows a substantial positive association with walkability scores in Kaifu District, the western part of Changsha County, and Yuelu District, while it shows a negative impact in Tianxin District. Within a 10-min walking range, Wangcheng District and Kaifu District display distinct spatial clustering characteristics. Notably, within a 15-min walking range, the areas with a negative correlation between road proportion and walkability significantly increase and become more spatially dispersed, indicating that merely increasing road proportion does not necessarily enhance walkability. This phenomenon may arise from the expansion of motor vehicle lanes compressing pedestrian space, thereby reducing walking comfort and safety.
The relationship between SVF and walkability scores also exhibits a complex spatial differentiation pattern. Within a 5-min walking threshold, Tianxin District shows a significant positive correlation, while Wangcheng District, Changsha County, and Kaifu District display negative correlations. This phenomenon may stem from the fact that in areas with lower facility density, increased SVF (indicating more open spaces) extends walking distances for older adults, thereby negatively impacting walkability scores. As the walking range expands, the negative correlation areas tend to spread from the city center to the periphery, particularly in central urban areas such as Furong District, under the 15-min threshold. This spatial configuration reveals an inherent contradiction between high-density urban development and open space provision: In hyper-intensive urban centers, sufficient open spaces often conflict with dense service facility distribution, ultimately constraining their potential to enhance pedestrian environments.
At the 5-min walking threshold, the building space ratio in Furong District does not show a significant correlation with walkability scores (p > 0.05), which may be related to the district’s unique attributes as a traditional old urban area of Changsha. As the city’s core area, Furong District boasts relatively well-developed infrastructure and service facilities, resulting in an overall high-quality walking environment. This generally superior walking condition may mitigate the impact of building space ratio on walkability at short-distance scales. However, as the spatial scale expands, a significant positive correlation between building space ratio and walkability scores emerges at the 10-min walking threshold (p < 0.05). This suggests that, within a moderate walking range, an increased building space ratio contributes to the formation of a more comprehensive walking environment.
Notably, the urban area on the west side of the Xiangjiang River exhibits significant spatial heterogeneity, with building space ratio and walkability scores showing a clear positive association. This phenomenon may reflect the characteristics of the area as an emerging development zone: in the context of incomplete service facilities, a higher building space ratio often signifies more vibrant commercial activities and concentrated public services, thereby enhancing the area’s walkability.

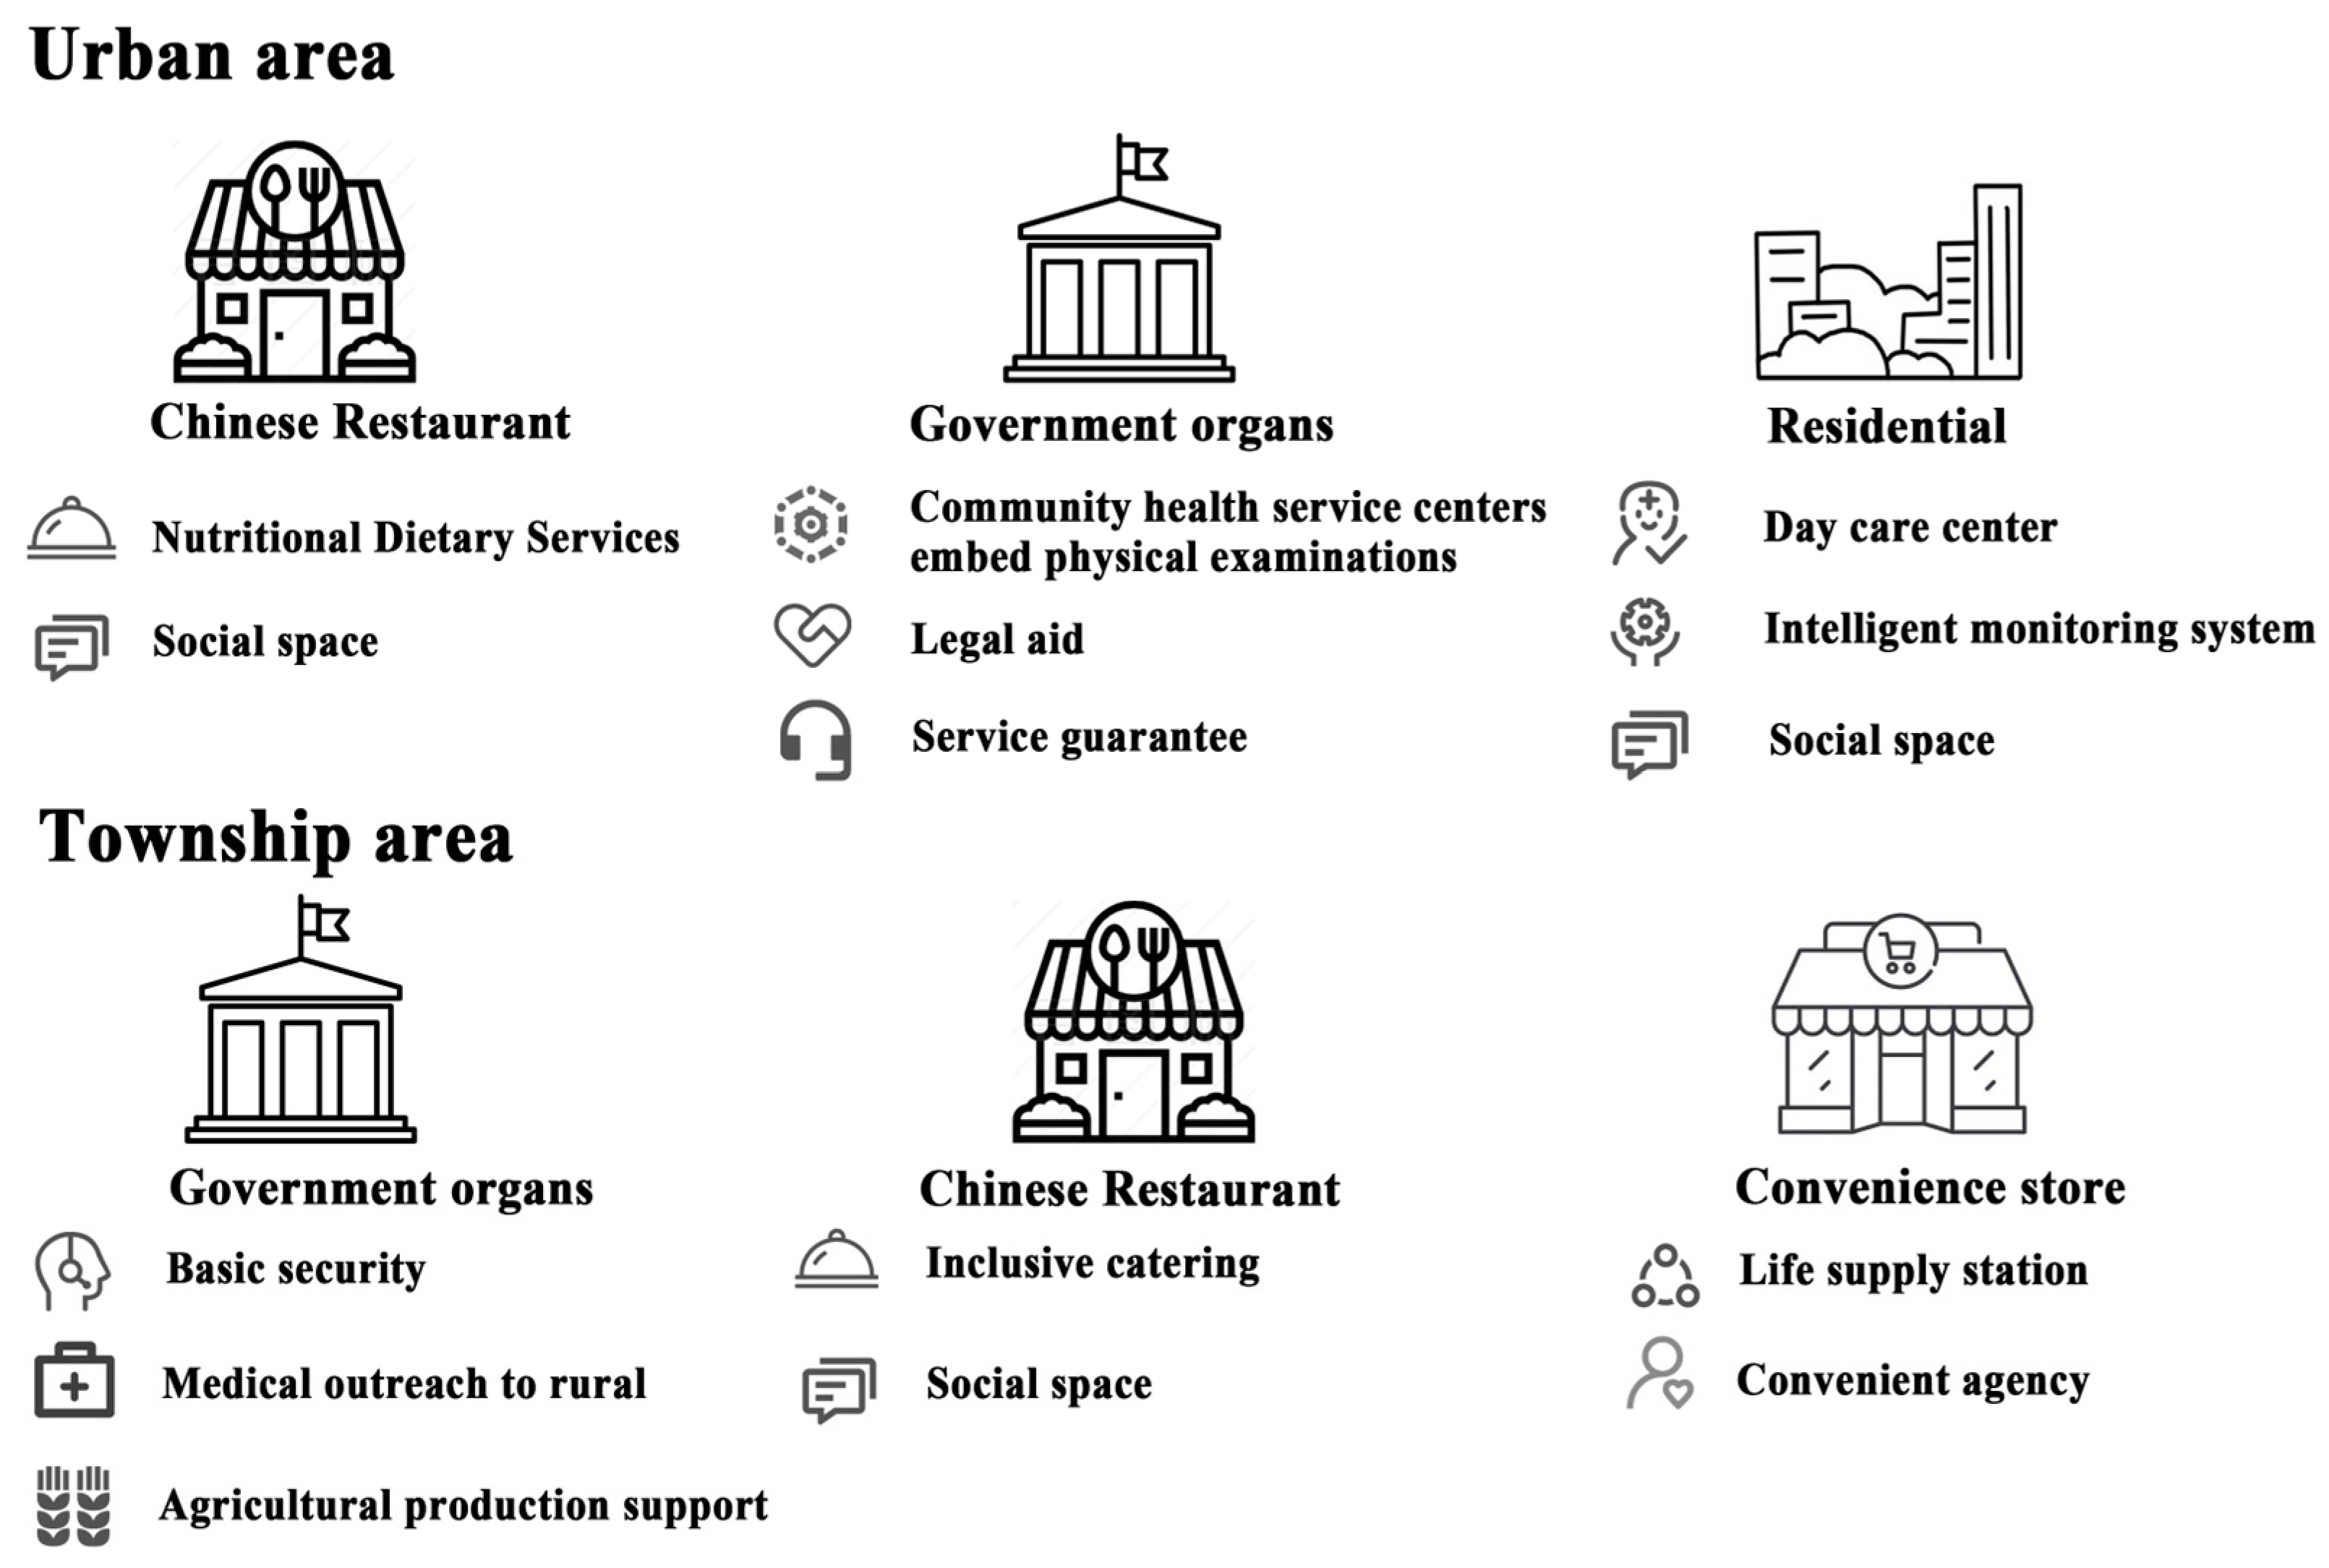
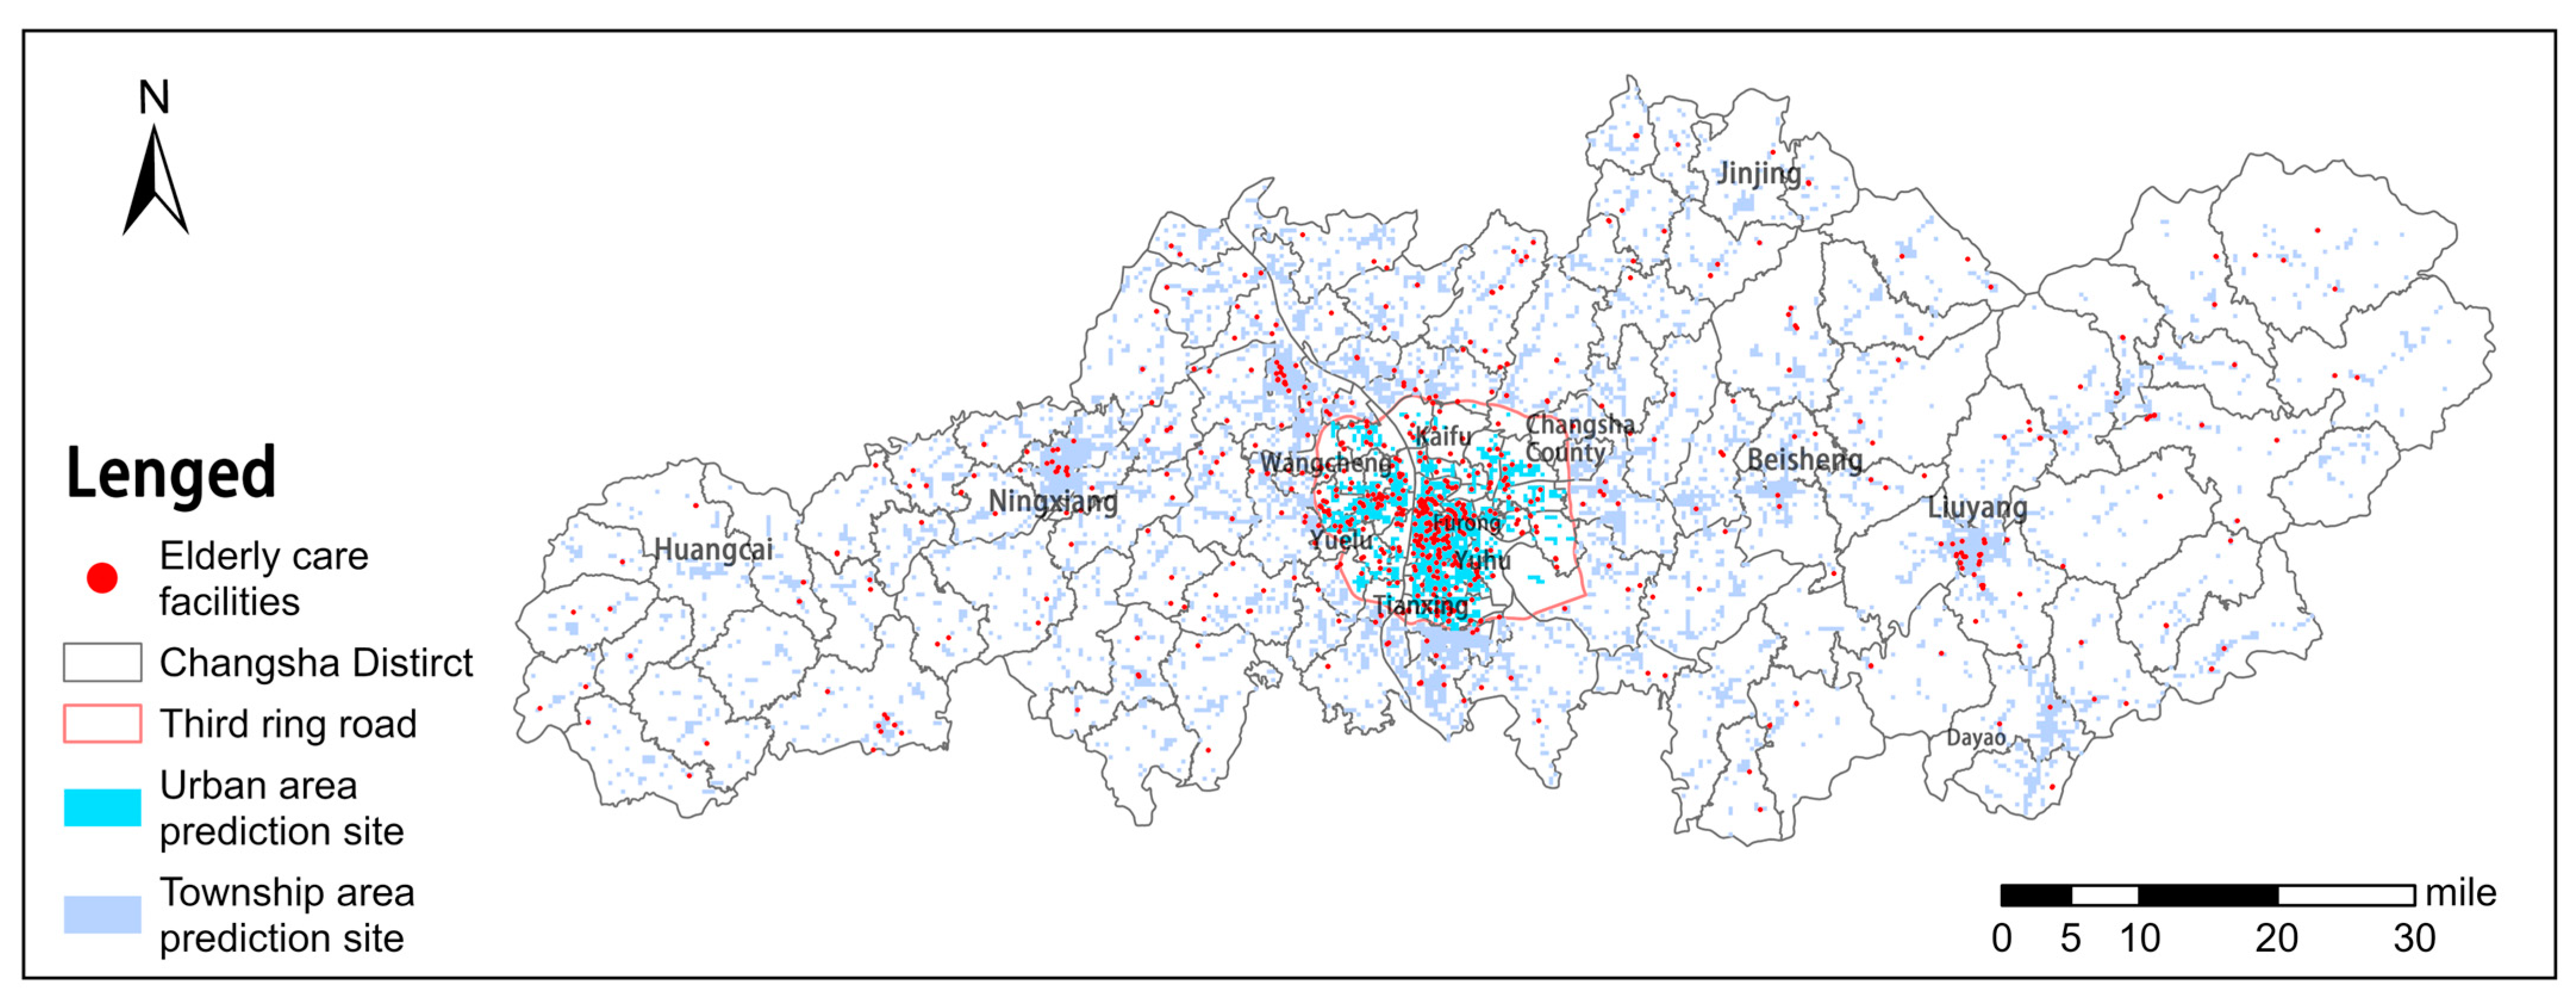
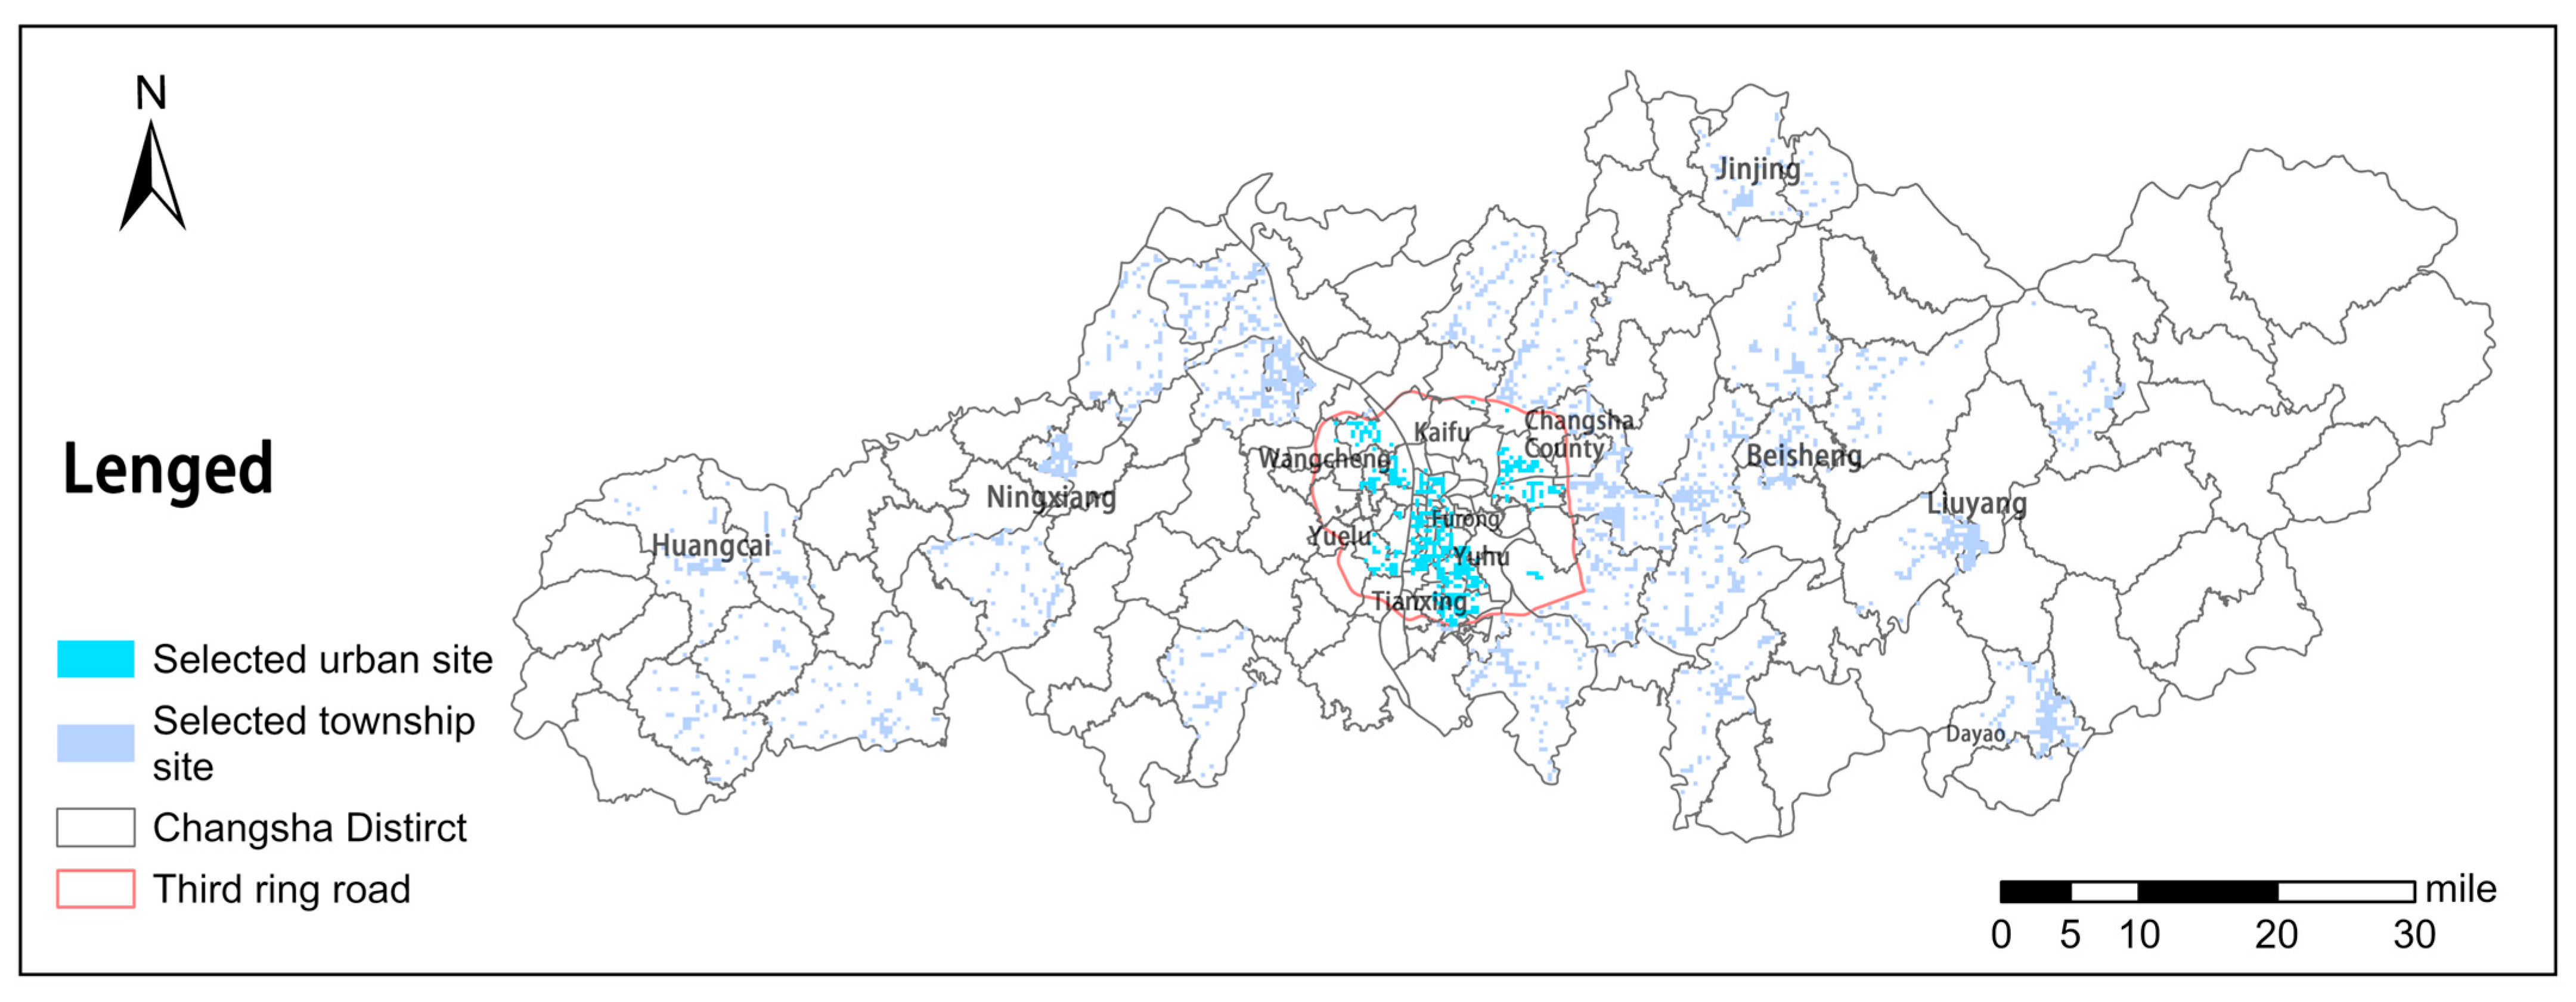
4.4. Prediction of Elderly Care Facility Locations

This study employed a fine-grained grid scale to conduct quantitative simulations for the siting and layout of elderly care facilities. The Random Forest algorithm was utilized to predict 5839 potential suitable locations. The prediction results were subsequently imported into the ArcGIS platform for spatial visualization.
The preliminary prediction results (Figure 9) reveal that the spatial distribution of existing elderly care facilities in Changsha City exhibits substantial clustering characteristics. These facilities are predominantly concentrated in central urban districts, including Yuhua District, Tianxin District, and Furong District, demonstrating a distinct decreasing gradient from the center to the periphery.
Spatial pattern analysis indicates that the predicted suitable locations on the east bank of the Xiangjiang River substantially outnumber those on the west bank. Multiple concentrated distribution zones were identified in peripheral regions such as Liuyang City and Ningxiang City. Notably, while most existing facilities are located within predicted suitable grid cells, a substantial number of suitable grid cells remain underutilized. Particularly prominent clusters were observed in Dayao Town (Liuyang City), Huangcai Town (Ningxiang City), and Jinjing Town (Changsha County), which could be prioritized as key areas for future development of elderly care facilities.
Given that the preliminary selection of 5839 candidate locations substantially exceeds Changsha City’s near-term planning requirements, this study developed a refined three-stage screening mechanism: First, based on data from the Seventh National Population Census, streets with a population aged 65 and above exceeding 13% were identified. These areas, where the elderly population proportion is substantially higher than the average level in Changsha City (13%), are deemed priority areas for construction. Second, considering the scale effect and service capacity of elderly care facilities, a second-level screening criterion was applied to select areas with an elderly population (aged 65 and above) exceeding 7000 people. This threshold aligns with the average elderly population size at the street level in Changsha City. Finally, within the streets meeting the above criteria, spatial overlay analysis was conducted to exclude areas where elderly care facilities have already been established. This ensures that new facilities can effectively fill service gaps and optimize the spatial distribution efficiency of elderly care facilities. This multi-tiered screening approach not only enhances the scientific rigor of site selection but also provides valuable reference for government decision-making in near-term construction planning.The final result is shown in Figure 10.
Within the ring expressway of Changsha City, the aging phenomenon is pronounced, with a large number of streets. Although existing elderly care facilities are relatively concentrated, the number of predicted sites remains substantial. Further analysis of the built environment along inner-ring streets reveals that GWR results show a significant positive correlation between building density and walkability scores within a 10-min walking threshold. Therefore, prioritizing high-density areas for elderly care facility placement is advisable, as these zones typically offer better access to commercial, medical, and service infrastructure, enhancing convenience for older adults. To optimize planning, the model-predicted high-density zones could be overlaid with existing facility distributions to identify ”10-min walking coverage blind spots”, where compact elderly care service centers should be prioritized. For example: In older urban districts with high building density (e.g., Yuhua, Tianxin, and Furong Districts), efforts should focus on expanding the service radius of existing facilities. And in emerging urban areas west of the Xiang River, these zones could be targeted for new facility construction to improve walkability and service quality.
Furthermore, existing public facility resources should be fully utilized to develop different types of elderly care facilities based on the unique characteristics and needs of each region. For example, Yuhua District and Tianxin District, with their abundant medical resources, can leverage this advantage to establish integrated medical and elderly care service centers. Meanwhile, Yuelu District can utilize its educational resources to establish senior universities and social welfare centers, enriching the cultural and spiritual lives of the elderly.
Beyond the central urban areas of Changsha, particularly in remote suburban regions such as Changsha County, Liuyang City, and Ningxiang City, there are also numerous streets with severe aging populations. Although these areas are relatively less developed economically, they benefit from lower land prices and beautiful natural environments. During the site selection process, the unique characteristics and advantages of these regions should be fully considered. In addition to constructing ordinary elderly care facilities suitable for local residents to meet basic needs, commercial elderly care institutions could be introduced to develop high-end facilities that attract seniors for vacation-style retirement, thereby boosting local economic development. This strategy not only addresses the diverse needs of the elderly but also promotes balanced regional economic growth.

5. Discussion

This study innovatively proposes a spatiotemporal adaptive assessment method, which not only precisely identifies supply-demand imbalances in elderly infrastructure between urban and rural areas but also provides a scientific basis for optimizing existing facilities and selecting new locations. Theoretically, it expands the healthy city theoretical framework, while practically establishing an elderly-friendly urban-rural planning model to facilitate equitable resource allocation, promote social justice, and enhance public well-being, combining both scholarly significance and application value.
Leveraging POI data, this study quantifies service accessibility within 5-, 10-, and 15-min walking thresholds around elderly care facilities in Changsha, employing both OLS and GWR models to examine multi-factor impacts on walkability scores. This methodology offers a replicable framework for analyzing existing elderly-oriented service infrastructure in urban and suburban contexts while providing evidence-based guidance for future facility siting.
Regarding evaluation metrics for elderly care institutions, prior scholars have established foundational frameworks: Li et al. [63] developed a composite indicator system for rural Chinese eldercare facilities, revealing spatiotemporal patterns and coupling characteristics of rural nursing home development; Lin et al. [59] assessed service capacity metrics for community-based eldercare facilities. However, existing research lacks a unified evaluation system comparing urban and rural institutional contexts. Addressing this gap, our study conducts a comparative analysis of elderly care facility disparities between urban core areas and township regions. The findings confirm significant accessibility gradients, with urban cores achieving 91.4% service type coverage within 15-min walking circles compared to only 26.86% in townships. This disparity partially reflects the phenomenon of “excessive reliance on administrative resources in government-driven facility siting for rural elderly care”. Specifically, spatial weighting analysis reveals that township facility allocation prioritizes government institutions (weight = 0.215), whereas urban areas emphasize lifestyle-supporting amenities such as catering (weight = 0.160). This pattern aligns with Ogburn’s “cultural lag” theory, demonstrating the spatial manifestation of institutional innovation lagging behind demographic aging [30]. Furthermore, the significant negative correlation between sky view factor (SVF) and walking accessibility underscores the inherent conflict between high-density development and open space provision, deepening our understanding of the complex mechanisms shaping built environments.
The walkability score in this study, calculated through an enhanced cumulative opportunity approach [76], quantifies comprehensive accessibility to diverse amenities within defined walking catchments. Crucially, this metric exclusively reflects facility diversity and quantity rather than streetscape characteristics. This methodological distinction justifies our regression analysis exploring correlations between walkability performance and both facility-level attributes and streetscape factors. While prior research has examined built environment linkages to 15-min city concepts in Swiss urban contexts [82], our work advances this discourse by systematically quantifying the interplay between streetscape variables and walkability outcomes in Chinese urban cores. These findings inform optimized facility siting strategies and equitable resource allocation frameworks. This study further quantifies the synergistic effects between facility diversity (e.g., 90.37% medical facility coverage in urban 5-min walking zones) and micro-scale street environments (e.g., building space ratio, transportation facility density). Guided by these findings, the optimization of elderly care facility siting provides valuable references for promoting equitable allocation of public resources.
Concurrently, the Random Forest algorithm modeling reveals fundamental differences in location drivers between urban and rural elderly care facilities: urban areas prioritize lifestyle convenience (e.g., proximity to amenities), while townships rely heavily on administrative resources (e.g., government institutions). The model demonstrates robust reliability in complex spatial decision-making, achieving prediction accuracies exceeding 0.79 for both urban and rural regions (Table 3).
Moreover, the DeepLab-V3-based street view parsing technology quantifies the impacts of micro-environmental elements, including road space ratio (mean = 0.067) and pedestrian density (mean = 0.0019). These data-driven insights offer critical support for designing aging-friendly streetscapes with precision. Collectively, these methodologies enhance the scientific rigor of urban planning by integrating multi-scale spatial analytics with machine intelligence.
The findings of this study indicate that the current allocation of elderly care service facilities in Changsha may be insufficient to meet the demands of its aging population. According to the 2020 Seventh National Population Census, Changsha faces a pronounced aging population issue, with individuals aged 60 and above accounting for approximately 15.8% of the total population and those aged 65 and above making up about 9.5%. The increase in the elderly population and the rising expectations for quality of life have had profound impacts on Changsha’s socioeconomic development, exerting additional pressure on the elderly care support system. Consequently, there is an urgent need for future urban planning to prioritize the construction of more elderly care service facilities, particularly in areas with a high concentration of elderly residents.

6. Conclusions

Through geographic spatial analysis, machine learning, and urban planning across disciplines, this investigation elucidates the distribution patterns of urban-rural elderly care facilities and the relationship between facility accessibility and street-level environmental factors in central urban areas. Key conclusions are as follows:
1. Spatial Distribution Characteristics
Substantial urban-rural heterogeneity was observed in facility distribution. Township areas demonstrated substantially lower public service coverage rates than central urban areas within 5-, 10-, and 15-min living circles (16.63% administrative resource-dependent site selection weighting). Market-driven allocation mechanisms proved insufficient, revealing spatial justice deficiencies through urban-rural resource disparities and inadequate spatial rights protection systems, particularly the “spatial deprivation” phenomenon among rural left-behind elderly populations.
2. Accessibility Disparities
A distinct urban-rural gradient emerged in walking accessibility. Under the 15-min walking threshold, central urban areas exhibited substantially higher facility accessibility diversity and walkability scores than township regions, displaying a center-periphery decreasing spatial differentiation pattern.
3. Built Environment Mechanisms
Street-level built environment factors showed significant correlations with walkability scores. Within 15-min walking isochrones, street building interface density (β = 38.015, p < 0.01) and transportation facility proportion (β = 117.292, p < 0.01) positively influenced walkability, while sky view factor demonstrated negative associations (β = −77.853, p < 0.01), reflecting complex relationships between high-density development and pedestrian friendliness. At the same time, this research also reveals that new town development needs to focus on the degree of function mixing.
4. Facility Layout Optimization
The random forest algorithm-based siting prediction framework identified multiple elderly care service blind zones, effectively quantifying regional service pressures and facility deficiencies, and highlighted the decision-making value of AI technology in the precise allocation of resources. This provides data-driven decision support for addressing spatial equity challenges under urban-rural dual structures.
The developed “multi-scale evaluation-machine learning prediction-spatial optimization” technical framework offers methodological references for aging societies. The spatial prediction model identifies critical construction areas through facility concentration hotspots, proposing science-based solutions for central urban area siting and suburban equity improvement. Using Changsha as a case study, this research establishes an adaptable quantitative model for urban-rural differential governance under population aging, integrating supply-demand perspectives for site optimization. This framework holds particular significance for developing countries confronting dual urbanization-aging challenges, with technical pathways transferable to other regions through parameter localization.

7. Limitation

This study has several limitations that require further refinement in future research:
First, the accuracy and completeness of point-of-interest (POI) data may partially influence the findings. Although data cleaning procedures were implemented, undetected duplicate entries may persist due to the massive dataset and the prevalence of small-scale facilities. Additionally, the POI dataset’s coverage might not fully represent the real-world distribution of all amenities, potentially leading to analytical biases.
Second, the walkable service areas calculated via ArcGIS spatial network analysis may deviate from actual pedestrian environments. Such discrepancies could arise from algorithmic oversimplifications of real-world factors—such as terrain slope, sidewalk width, and traffic signal waiting times—which may compromise the precision of walkability assessments. To address this, walking time calculations could be enhanced through integration with Baidu Maps API route-planning functions [11]. Furthermore, the streetscape analysis was confined to central urban areas within Changsha’s Third Ring Road due to limited Baidu Street View coverage in peripheral township regions. Future studies could supplement missing streetscape imagery through manual photographic surveys.
While the finalized site selection predictions identify concentrated areas lacking senior care infrastructure—providing a scientifically grounded reference—subsequent analyses should incorporate additional metrics, such as regional elderly care demand pressures, to prioritize zones for urgent facility deployment.
Finally, due to limitations in data collection, this study primarily focuses on the environmental characteristics of streets in central urban districts and does not fully account for other factors influencing elderly care facilities. Future research could incorporate approaches from existing literature, such as examining the relationship between socioeconomic factors and the distribution of elderly care facilities; analyzing the spatial correlation between facility attributes (e.g., number of beds, floor area, service categories) and surrounding amenities [58]; integrating housing price data and social media check-in data (e.g., Weibo) to evaluate disparities in equitable access to elderly care resources, particularly by applying the Gini coefficient to quantify spatial inequalities from a social justice perspective [82]; and conducting online and offline questionnaires to gather older adults’ needs and provide targeted recommendations for improving facility services [60,83]. These multidimensional considerations could better capture seniors’ actual usage experiences and refine existing analytical frameworks.

Author Contributions

Conceptualization, Y.Y. and T.D.; methodology, Y.Y.; software, Y.Y.; validation, Y.Y., T.D.; formal analysis, Y.Y.; investigation, Y.Y.; resources, Y.Y.; data curation, Y.Y.; writing—original draft preparation, Y.Y. and T.D.; writing—review and editing, Y.Y. and T.D.; visualization, Y.Y.; supervision, T.D.; project administration, T.D.; funding acquisition, T.D. All authors have read and agreed to the published version of the manuscript.

Funding

This research received no external funding.

Institutional Review Board Statement

Not applicable.

Informed Consent Statement

Not applicable.

Data Availability Statement

The data used in this study were obtained from public databases and can be found in Table 1.

Conflicts of Interest

The authors declare no conflicts of interest.

References

  1. Bloom, D.E.; Canning, D.; Lubet, A. Global Population Aging: Facts, Challenges, Solutions & Perspectives. Daedalus 2015, 144, 80–92. [Google Scholar] [CrossRef]
  2. Shie, A.J.; Wu, W.F.; Yang, M.; Wan, X.J.; Li, H.L. Design and process optimization of combined medical and elderly care services: An integrated service blueprint-TRIZ model. Front. Public Health 2022, 10, 965443. [Google Scholar] [CrossRef] [PubMed]
  3. United Nations Department of Economic and Social Affairs, Population Division. World Population Prospects 2024: Summary of Results (UN DESA/POP/2024/TR/NO. 9). United Nations. 2024. Available online: https://www.un.org/development/desa/pd/content/world-population-prospects-2024-summary-results (accessed on 3 February 2025).
  4. United Nations, Department of Economic and Social Affairs, Population Division. World Population Ageing 2020 Highlights. United Nations. 2020. Available online: https://www.un.org/development/desa/pd/content/world-population-ageing-2020-highlights (accessed on 3 February 2025).
  5. Wood, G.E.R.; Pykett, J.; Stathi, A. Active and healthy ageing in urban environments: Laying the groundwork for solution-building through citizen science. Health Promot. Int. 2022, 37, daac126. [Google Scholar] [CrossRef] [PubMed]
  6. Zhang, L.; Ren, H.N.; Li, C. Study on the development characteristics and spatial and temporal patterns of population ageing in 31 central cities in China. Front. Public Health 2024, 12, 1341455. [Google Scholar] [CrossRef]
  7. Li, H.Y.; Li, R.; Cai, J.; Wang, S.L. The Spatial Equilibrium Model of Elderly Care Facilities with High Spatiotemporal Sensitivity and Its Economic Associations Study. ISPRS Int. J. Geo-Inf. 2024, 13, 268. [Google Scholar] [CrossRef]
  8. Wang, C.Y.; Geng, X.L. Assessing the spatial equity of the aged care institutions based on the improved potential model: A case study in Shanghai, China. Front. Public Health 2024, 12, 1428424. [Google Scholar] [CrossRef]
  9. Póczosová, V.; Risová, K. Considering the Preferences of Adults and Elderly Individuals While Examining the Spatial Justice of the Distribution of Urban Facilities: A Case Study of the Small Town of Fiľakovo (Slovakia). Sociologia 2023, 55, 411–433. [Google Scholar] [CrossRef]
  10. Moreno, C.; Allam, Z.; Chabaud, D.; Gall, C.; Pratlong, F. Introducing the "15-Minute City": Sustainability, Resilience and Place Identity in Future Post-Pandemic Cities. Smart Cities 2021, 4, 93–111. [Google Scholar] [CrossRef]
  11. Jiang, Z.H.; Wu, C.L.; Chung, H.Y.C. The 15-minute community life circle for older people: Walkability measurement based on service accessibility and street-level built environment—A case study of Suzhou, China. Cities 2025, 157, 105587. [Google Scholar] [CrossRef]
  12. Shan, J.-t.; Wu, Y.-m.; Yang, X.-l. Three-dimensional stability of two-step slope with crack considering temperature effect on unsaturated soil. Journal of Central South University 2025, 32, 1060–1079. [Google Scholar] [CrossRef]
  13. Yuan, J.F.; Li, L.Z.; Wang, E.D.; Skibniewski, M.J. Examining sustainability indicators of space management in elderly Facilities-a case study in China. J. Clean. Prod. 2019, 208, 144–159. [Google Scholar] [CrossRef]
  14. Grabowski, D.C.; Mor, V. Nursing Home Care in Crisis in the Wake of COVID-19. Jama-J. Am. Med. Assoc. 2020, 324, 23–24. [Google Scholar] [CrossRef] [PubMed]
  15. Park, H.-B.; Hwan-Yong, P. A Study on the Overcrowding Distribution and Location Influence Factors of Elderly Care Facilities in Seoul Metropolitan Area. J. Korean Urban Manag. Assoc. 2019, 32, 21–43. [Google Scholar] [CrossRef]
  16. Li, X.; Krumholz, H.M.; Yip, W.; Cheng, K.K.; De Maeseneer, J.; Meng, Q.Y.; Mossialos, E.; Li, C.; Lu, J.P.; Su, M.; et al. Quality of primary health care in China: Challenges and recommendations. Lancet 2020, 395, 1802–1812. [Google Scholar] [CrossRef]
  17. Li, M.Y.; Peng, P.Y.; Zhu, H.; Ao, Y.B.; Zhou, Z.L. Exploring the equitable spatial planning on the accessibility of institutional elderly care in megacity: A study based on Chengdu, China. Sustain. Cities Soc. 2024, 117, 105998. [Google Scholar] [CrossRef]
  18. Waterworth, S.; Raphael, D.; Gott, M.; Arroll, B.; Benipal, J.; Jarden, A. An exploration of how community-dwelling older adults enhance their well-being. Int. J. Older People Nurs. 2019, 14, e12267. [Google Scholar] [CrossRef]
  19. Ahaddour, C.; van den Branden, S.; Broeckaert, B. Institutional Elderly Care Services and Moroccan and Turkish Migrants in Belgium: A Literature Review. J. Immigr. Minor. Health 2016, 18, 1216–1227. [Google Scholar] [CrossRef]
  20. Kalicki, A.V.; Moody, K.A.; Franzosa, E.; Gliatto, P.M.; Ornstein, K.A. Barriers to telehealth access among homebound older adults. J. Am. Geriatr. Soc. 2021, 69, 2404–2411. [Google Scholar] [CrossRef]
  21. Wen, C.; Albert, C.; von Haaren, C. Nature-based recreation for the elderly in urban areas: Assessing opportunities and demand as planning support. Ecol. Process. 2022, 11, 44. [Google Scholar] [CrossRef]
  22. Feng, S.; Chen, L.D.; Sun, R.H.; Feng, Z.Q.; Li, J.R.; Khan, M.S.; Jing, Y.C. The Distribution and Accessibility of Urban Parks in Beijing, China: Implications of Social Equity. Int. J. Environ. Res. Public Health 2019, 16, 4894. [Google Scholar] [CrossRef]
  23. Guida, C.; Carpentieri, G. Quality of life in the urban environment and primary health services for the elderly during the Covid-19 pandemic: An application to the city of Milan (Italy). Cities 2021, 110, 103038. [Google Scholar] [CrossRef] [PubMed]
  24. Liu, D.; Kwan, M.P.; Wang, J.Y. Developing the 15-Minute City: A comprehensive assessment of the status in Hong Kong. Travel Behav. Soc. 2024, 34, 100666. [Google Scholar] [CrossRef]
  25. Guo, J.; Ling, W.H. The relationship between the mental health status and social support of the lonely elderly with government participation in the Internet context. Front. Public Health 2022, 10, 1013069. [Google Scholar] [CrossRef] [PubMed]
  26. Wang, Y.F.; Chen, B.Y.; Yuan, H.; Wang, D.G.; Lam, W.H.K.; Li, Q.Q. Measuring temporal variation of location-based accessibility using space-time utility perspective. J. Transp. Geogr. 2018, 73, 13–24. [Google Scholar] [CrossRef]
  27. Liu, B.Y.; Chen, Y.; Xiao, M. The Social Utility and Health Benefits for Older Adults of Amenity Buildings in China’s Urban Parks: A Nanjing Case Study. Int. J. Environ. Res. Public Health 2020, 17, 7497. [Google Scholar] [CrossRef]
  28. Mao, S.; Lu, N.; Xiao, C.H. Perceived neighborhood environment and depressive symptoms among older adults living in Urban China: The mediator role of social capital. Health Soc. Care Community 2022, 30, E1977–E1990. [Google Scholar] [CrossRef]
  29. Li, C.; Wu, J.J.; Huang, Y. Spatial-Temporal Patterns and Coupling Characteristics of Rural Elderly Care Institutions in China: Sustainable Human Settlements Perspective. Sustainability 2023, 15, 3286. [Google Scholar] [CrossRef]
  30. Leigh, R.; Ogburn, W. Social Change. With Respect to Culture and Original Nature. J. Philos. 1923, 20, 526. [Google Scholar] [CrossRef]
  31. Cheng, T.; Liu, C.H.; Yang, H.W.; Wang, N.; Liu, Y.S. From service capacity to spatial equity: Exploring a multi-stage decision-making approach for optimizing elderly-care facility distribution in the city centre of Tianjin, China. Sustain. Cities Soc. 2022, 85, 104076. [Google Scholar] [CrossRef]
  32. Enssle, F.; Kabisch, N. Urban green spaces for the social interaction, health and well-being of older people-An integrated view of urban ecosystem services and socio-environmental justice. Environ. Sci. Policy 2020, 109, 36–44. [Google Scholar] [CrossRef]
  33. Cheng, L.; Yang, M.; De Vos, J.; Witlox, F. Examining geographical accessibility to multi-tier hospital care services for the elderly: A focus on spatial equity. J. Transp. Health 2020, 19, 100926. [Google Scholar] [CrossRef]
  34. Weng, M.; Ding, N.; Li, J.; Jin, X.F.; Xiao, H.; He, Z.M.; Su, S.L. The 15-minute walkable neighborhoods: Measurement, social inequalities and implications for building healthy communities in urban China. J. Transp. Health 2019, 13, 259–273. [Google Scholar] [CrossRef]
  35. Logan, T.M.; Hobbs, M.H.; Conrow, L.C.; Reid, N.L.; Young, R.A.; Anderson, M.J. The x-minute city: Measuring the 10, 15, 20-minute city and an evaluation of its use for sustainable urban design. Cities 2022, 131, 103924. [Google Scholar] [CrossRef]
  36. Dunning, R.J.; Dolega, L.; Nasuto, A.; Nurse, A.; Calafiore, A. Age and the 20-min city: Accounting for variation in mobility. Appl. Geogr. 2023, 156, 103005. [Google Scholar] [CrossRef]
  37. Willberg, E.; Fink, C.; Toivonen, T. The 15-minute city for all?-Measuring individual and temporal variations in walking accessibility. J. Transp. Geogr. 2023, 106, 103521. [Google Scholar] [CrossRef]
  38. Wu, W.; Divigalpitiya, P. Availability and Adequacy of Facilities in 15 Minute Community Life Circle Located in Old and New Communities. Smart Cities 2023, 6, 2176–2195. [Google Scholar] [CrossRef]
  39. Yang, Y.; Qian, Y.; Zeng, J.; Wei, X.; Yang, M. Walkability measurement of 15-minute community life circle in Shanghai. Land 2023, 12, 153. [Google Scholar] [CrossRef]
  40. Song, L.; Kong, X.S.; Cheng, P. Supply-demand matching assessment of the public service facilities in 15-minute community life circle based on residents’ behaviors. Cities 2024, 144, 104637. [Google Scholar] [CrossRef]
  41. Jin, M.J.; Deng, Q.T.; Wang, S.Y.; Wei, L.T. Equity Evaluation of Elderly-Care Institutions Based on Ga2SFCA: The Case Study of Jinan, China. Sustainability 2023, 15, 16943. [Google Scholar] [CrossRef]
  42. Xu, Z.; Shang, Z.Q.; Zhong, Y.F.; Han, L.Y.; Li, M.Y.; Yang, Y.H. Evaluating 15-minute walkable life circles for the senior: A case study of Jiande, China. J. Asian Archit. Build. Eng. 2024, 1–17. [Google Scholar] [CrossRef]
  43. Yang, Y.J.; Li, C.X.; Zhou, D. Study on the Characteristics of Community Elderly Care Service Facilities Usage and Optimization Design Based on Life Cycle Theory. Buildings 2024, 14, 3003. [Google Scholar] [CrossRef]
  44. Gaglione, F.; Cottrill, C.; Gargiulo, C. Urban services, pedestrian networks and behaviors to measure elderly accessibility. Transp. Res. Part D-Transp. Environ. 2021, 90, 102687. [Google Scholar] [CrossRef]
  45. Zhang, L.H.; Wang, L.; Wu, J.; Li, P.B.; Dong, J.L.; Wang, T.R. Decoding urban green spaces: Deep learning and google street view measure greening structures. Urban For. Urban Green. 2023, 87, 128028. [Google Scholar] [CrossRef]
  46. Hall, C.M.; Ram, Y. Walk score® and its potential contribution to the study of active transport and walkability: A critical and systematic review. Transp. Res. Part D-Transp. Environ. 2018, 61, 310–324. [Google Scholar] [CrossRef]
  47. Nagata, S.; Nakaya, T.; Hanibuchi, T.; Amagasa, S.; Kikuchi, H.; Inoue, S. Objective scoring of streetscape walkability related to leisure walking: Statistical modeling approach with semantic segmentation of Google Street View images. Health Place 2020, 66, 102428. [Google Scholar] [CrossRef]
  48. Koo, B.W.; Guhathakurt, S.; Botchwey, N. How are Neighborhood and Street-Level Walkability Factors Associated with Walking Behaviors? A Big Data Approach Using Street View Images. Environ. Behav. 2022, 54, 211–241. [Google Scholar] [CrossRef]
  49. Lee, J.; Kang, Y.; Kim, J.; Park, J. Analysis of Street View Image Object Affecting Perceived Walkability Using Machine Learning. J. Assoc. Korean Geogr. 2022, 11, 375–391. [Google Scholar] [CrossRef]
  50. Chen, Y.N.; Huang, X.R.; White, M. A study on street walkability for older adults with different mobility abilities combining street view image recognition and deep learning—The case of Chengxianjie Community in Nanjing (China). Comput. Environ. Urban Syst. 2024, 112, 102151. [Google Scholar] [CrossRef]
  51. He, X.; He, S.Y. Decoding the spatial effects of walkability on walking behavior among older adults by integrating big data and small data. Cities 2025, 156, 105537. [Google Scholar] [CrossRef]
  52. Marquet, O.; Hipp, J.A.; Miralles-Guasch, C. Neighborhood walkability and active ageing: A difference in differences assessment of active transportation over ten years. J. Transp. Health 2017, 7, 190–201. [Google Scholar] [CrossRef]
  53. Thielman, J.; Rosella, L.; Copes, R.; Lebenbaum, M.; Manson, H. Neighborhood walkability: Differential associations with self-reported transport walking and leisure-time physical activity in Canadian towns and cities of all sizes. Prev. Med. 2015, 77, 174–180. [Google Scholar] [CrossRef] [PubMed]
  54. Yoon, M.O.; Moon, H.K.; Jeon, J.Y.; Sohn, C.M. Nutritional Management by Dietitian at Elderly Nursing Homes in Gyeonggi-do. J. Korean Diet. Assoc. 2013, 19, 400–415. [Google Scholar] [CrossRef]
  55. Cheng, M.; Cui, X. Spatial Optimization of Residential Care Facility Configuration Based on the Integration of Modified Immune Algorithm and GIS: A Case Study of Jing’an District in Shanghai, China. Int. J. Environ. Res. Public Health 2020, 17, 8090. [Google Scholar] [CrossRef] [PubMed]
  56. Balboa-Castillo, T.; Guallar-Castillón, P.; León-Muñoz, L.M.; Graciani, A.; López-García, E.; Rodríguez-Artalejo, F. Physical Activity and Mortality Related to Obesity and Functional Status in Older Adults in Spain. Am. J. Prev. Med. 2011, 40, 39–46. [Google Scholar] [CrossRef]
  57. Li, H.M.; Li, M.Y.; Peng, P.Y.; Long, Y.; Ao, Y.B.; Bahmani, H. Exploring non-linear effects of walking accessibility on well-being in rural older adults of Jintang County: A random forest analysis. Front. Public Health 2024, 12, 1333510. [Google Scholar] [CrossRef]
  58. Baldwin, R.; Chenoweth, L.; dela Rama, M.; Wang, A.Y. Does size matter in aged care facilities? A literature review of the relationship between the number of facility beds and quality. Health Care Manag. Rev. 2017, 42, 315–327. [Google Scholar] [CrossRef]
  59. Lin, L.J.; Zhang, L.; Geng, S.; Zhao, Y.L.; Tian, Y.Y. Research on Multi-Stage Post-Occupancy Evaluation Framework of Community Comprehensive Elderly Care Service Facilities under the Public-Private Partnership Mode-A Case Study of China. Buildings 2024, 14, 1343. [Google Scholar] [CrossRef]
  60. Li, Y.H.; Ran, Q.C.; Yao, S.; Ding, L.K. Evaluation and Optimization of the Layout of Community Public Service Facilities for the Elderly: A Case Study of Hangzhou. Land 2023, 12, 629. [Google Scholar] [CrossRef]
  61. Song, S.; Wang, D.; Zhu, W.; Wang, C. Study on the spatial configuration of nursing homes for the elderly people in Shanghai: Based on their choice preference. Technol. Forecast. Soc. Change 2020, 152, 119859. [Google Scholar] [CrossRef]
  62. Li, M.; Ao, Y.; Peng, P.; Bahmani, H.; Han, L.; Zhou, Z.; Li, Q. Resource allocation of rural institutional elderly care in China’s new era: Spatial-temporal differences and adaptation development. Public Health 2023, 223, 7–14. [Google Scholar] [CrossRef]
  63. Li, J.; Gao, X.; Qiu, Y.; Ling, Y.T. Aging-friendly cities: Investigating the effects of street usage on the psychological satisfaction of older adults in megacities. Front. Psychol. 2022, 13, 942301. [Google Scholar] [CrossRef] [PubMed]
  64. Changsha Municipal People’s Government (2024, October) The Changsha Home and Community Basic Elderly Care Service Improvement Action Project Has Achieved Its Expected Goals. Available online: http://www.changsha.gov.cn/zsszzzq2023/wxk/zsxw/202410/t20241021_11626786.html (accessed on 3 February 2025).
  65. Hunan Provincial Bureau of Statistics. (2016, September 9). Coordinated Development of Population Aging and Socio-Economy in Changsha. Hunan Statistical Information Network. Available online: https://tjj.hunan.gov.cn/tjfx/sxfx/zss_3489/201609/t20160909_3802221.html (accessed on 3 February 2025).
  66. McKenzie, G.; Janowicz, K.; Adams, B. A weighted multi-attribute method for matching user-generated Points of Interest. Cartogr. Geogr. Inf. Sci. 2014, 41, 125–137. [Google Scholar] [CrossRef]
  67. Chen, L.C.; Zhu, Y.; Papandreou, G.; Schroff, F.; Adam, H. Encoder-Decoder with Atrous Separable Convolution for Semantic Image Segmentation. In Proceedings of the European Conference on Computer Vision (ECCV), Munich, Germany, 8–14 September 2018. [Google Scholar] [CrossRef]
  68. Cordts, M.; Omran, M.; Ramos, S.; Rehfeld, T.; Enzweiler, M.; Benenson, R.; Franke, U.; Roth, S.; Schiele, B. The cityscapes dataset for semantic urban scene understanding. In Proceedings of the IEEE Conference on Computer Vision and Pattern Recognition, Las Vegas, NV, USA, 27–30 June 2016. [Google Scholar]
  69. National Bureau of Statistics of China. Results of the 7th National Population Census. 2021. Available online: https://www.stats.gov.cn/sj/pcsj/rkpc/7rp/indexch.htm (accessed on 4 October 2024).
  70. Ministry of Civil Affairs of the People’s Republic of China. Planning Specification for Urban Elderly Facilities. 2017. Available online: https://www.mca.gov.cn/zt/history/18aqgly/20170500891239.html (accessed on 4 October 2024).
  71. Sun, X.X.; Cheng, Y.; Tao, Z.L. Spatial accessibility and equity of residential care facilities in Beijing from 2010 to 2020. Health Place 2024, 86, 103219. [Google Scholar] [CrossRef] [PubMed]
  72. Zuo, J.; Fan, J.H.; Huang, X.Y.; Li, C.; Luo, J.C. Classification and Spatial Differentiation of Subdistrict Units for Sustainable Urban Renewal in Megacities: A Case Study of Chengdu. Land 2024, 13, 164. [Google Scholar] [CrossRef]
  73. Feng, H.C.; Tang, X.X.; Zou, C. Optimizing the Layout of Service Facilities for Older People Based on POI Data and Machine Learning: Guangzhou City as an Example. Land 2024, 13, 700. [Google Scholar] [CrossRef]
  74. Busch, T.D.; Duarte, Y.A.; Nunes, D.P.; Lebrao, M.L.; Naslavsky, M.S.; Rodrigues, A.D.; Amaro, E. Factors associated with lower gait speed among the elderly living in a developing country: A cross-sectional population-based study. BMC Geriatr. 2015, 15, 35. [Google Scholar] [CrossRef]
  75. Gutiérrez-Misis, A.; Sánchez-Santos, M.T.; Banegas, J.R.; Castell, M.V.; González-Montalvo, J.I.; Otero, A. Walking speed and high blood pressure mortality risk in a spanish elderly population. J. Hum. Hypertens. 2015, 29, 566–572. [Google Scholar] [CrossRef]
  76. Nilsson, L. Network-Based Urban Growth-How Centrality and Accessibility to Places Shape Land Use. Ph.D. Dissertation, ProQuest Dissertations Publishing, Ann Arbor, MI, USA, 2022. [Google Scholar]
  77. Miller, E.J. Accessibility: Measurement and application in transportation planning. Transp. Rev. 2018, 38, 551–555. [Google Scholar] [CrossRef]
  78. Yang, X.L.; Huang, F. Collapse mechanism of shallow tunnel based on nonlinear Hoek-Brown failure criterion. Tunn. Undergr. Space Technol. 2011, 26, 686–691. [Google Scholar] [CrossRef]
  79. Kelobonye, K.; Zhou, H.; McCarney, G.; Xia, J.H. Measuring the accessibility and spatial equity of urban services under competition using the cumulative opportunities measure. J. Transp. Geogr. 2020, 85, 102706. [Google Scholar] [CrossRef]
  80. Singh, S.S.; Sarkar, B. Cumulative opportunity-based accessibility measurement framework in rural India. Transp. Policy 2022, 117, 138–151. [Google Scholar] [CrossRef]
  81. Fotheringham, A.S.; Brunsdon, C.; Charlton, M. Geographically weighted regression: The analysis of spatially varying relationships. Am. J. Agric. Econ. 2004, 86, 554–556. [Google Scholar] [CrossRef]
  82. Elldér, E. Built environment and the evolution of the " 15-minute city: A 25-year longitudinal study of 200 Swedish cities. Cities 2024, 149, 104942. [Google Scholar] [CrossRef]
  83. Xing, L.J.; Chen, Q.; Liu, Y.L.; He, H.G. Evaluating the accessibility and equity of urban health resources based on multi-source big data in high-density city. Sustain. Cities Soc. 2024, 100, 105049. [Google Scholar] [CrossRef]
Figure 1. Research Framework.
Applsci 15 04601 g001
Figure 2. Research area and distribution of elderly population. (a) Number of population aged 65 and over; (b) Proportion of population aged 65 and over.
Applsci 15 04601 g002
Figure 3. Facility Service Diagram.
Applsci 15 04601 g003
Figure 4. Available service types within 5-, 10- and 15-min life circle for older people.
Applsci 15 04601 g004
Figure 5. Interpolation of walkability rating score.
Applsci 15 04601 g005
Figure 6. Spatial distributions of local coefficients (5 min life circle) and t-value with significantly <90%.
Applsci 15 04601 g006
Figure 7. Spatial distributions of local coefficients (10 min life circle) and t-value with significantly <90%.
Applsci 15 04601 g007
Figure 8. Spatial distributions of local coefficients (15 min life circle) and t-value with significantly <90%.
Applsci 15 04601 g008
Figure 9. Preliminary Site Selection.
Applsci 15 04601 g009
Figure 10. Selected Site Selection.
Applsci 15 04601 g010
Table 1. Data sources.
DataSourceUrl
The Seventh National Population Census [17,22]National Bureau of Statisticshttps://www.stats.gov.cn/ (accessed on 4 October 2024)
Point of interest
[11,65]
Baidu Mapshttps://lbsyun.baidu.com/index.php?component=index&docid=22 (accessed on 2 October 2024)
Street view [11]Baidu Mapshttps://map.baidu.com/ (accessed on 22 November 2024)
Road network data [17]Openstreetmaphttps://www.openstreetmap.org/relation/3202711 (accessed on 2 October 2024)
Table 2. POI type selection.
First Level IndicatorsSecond Level IndicatorsExample
Catering
[11,73]
Chinese Restaurant [11]Hengdong Tu Cai Restaurant, Northeast iron pot stew
Dessert and beverage [11]Modern China Tea Shop, Tea Space, Tang Dynasty Palace Peach Crispy
Fast restaurant [73]KFC, RICE MR
Bakery [73]Rosa Cake
Shopping
[11,17,56,73]
Supermarket [73]Wal-mart, Le’erle Discount Wholesale Supermarket
Shopping mall [11]Changsha IFS, Wanda Plaza
Convenience store [17]Lawson,7-ELEVEn
Integrated market [56]Fruit Store, Food market
Bird and flower market [73]Pet shop, Flower shop
Settlement [72]Resident [73]Jinyuan Community
Transportation
[17,61]
Bus station [17]Xihu Bridge Bus Station
Subway station [61]Orange Island Subway Station
Medical care
[11,17,19,61]
General hospital [17]Hunan Provincial People’s Hospital
Specialized hospital [19]Carnation Geriatric Hospital
Clinic [19]Wangping Clinic
Pharmacy [11]People’s Pharmacy
Leisure
[11,21,22]
Park and square [21,22]Meixi Lake Park, Jiangwan Cultural Square
Landscape [11]Orange County
Finance
[17,73]
Bank [17]the People’s Bank of China, postal savings bank
ATMs [17]China Construction Bank 24-h self-service banking
Insurance [73]China Life Insurance Company
Government
[11,17,73]
Government [11]Xifu Village Committee
Tianxin District Government Service Center
Social organization [73]Nursery Planting Professional Cooperative
Table 3. Statistical analysis of the RF model’s performance.
Study AreaAccuracyPrecisionRecallF1-Score
Urban area0.7920.8140.7920.785
Rural area0.7930.7970.7930.791
Table 4. The weight of amenities is calculated by random forest in the central urban area.
First Level IndicatorsSecond Level IndicatorsFirst-Level WeightLocal WeightGlobal Weight
CateringChinese Restaurant0.32730.490210.16046
Dessert and beverage0.272630.08924
Fast restaurant0.137240.04492
Bakery0.099920.03271
ShoppingSupermarket0.15390.250230.03852
Shopping mall0.070640.01087
Convenience store0.377320.05808
Integrated market0.183850.02830
Bird and flower market0.117960.01816
SettlementResident0.0950 0.09495
TransportationBus station0.02340.875390.02049
Subway station0.124610.00292
Medical careGeneral hospital0.17900.215250.03854
Specialized hospital0.097760.01750
Clinic0.236710.04238
Pharmacy0.450280.08062
LeisurePark and square0.01480.236190.00351
Landscape0.763810.01133
FinanceBank0.04020.371710.01495
ATMs0.408270.01642
Insurance0.220020.00885
GovernmentGovernment0.16630.857440.14259
Social organization0.142560.02371
Table 5. The weight of amenities is calculated by random forest in rural areas.
First Level IndicatorsSecond Level IndicatorsFirst-Level WeightLocal WeightGlobal Weight
CateringChinese Restaurant0.2921 0.58565 0.17109
Dessert and beverage0.33632 0.09825
Fast restaurant0.06644 0.01941
Bakery0.01159 0.00339
ShoppingSupermarket0.1877 0.12869 0.02416
Shopping mall0.00025 0.00005
Convenience store0.68406 0.12842
Integrated market0.17449 0.03276
Bird and flower market0.01251 0.00235
SettlementResident0.01332 0.01332
TransportationBus station0.0436 0.96038 0.04183
Subway station0.03962 0.00173
Medical careGeneral hospital0.1575 0.16530 0.02604
Specialized hospital0.02918 0.00460
Clinic0.36262 0.05713
Pharmacy0.44290 0.06978
LeisurePark and square0.0028 0.23619 0.00187
Landscape0.76381 0.00095
FinanceBank0.0174 0.76686 0.01335
ATMs0.14601 0.00254
Insurance0.08712 0.00152
GovernmentGovernment organs0.2855 0.75423 0.21532
Social organization0.24577 0.07016
Table 6. Summary statistics of the dependent variables and the independent variables.
VariablesDefinitionMeanStandard
Deviation
Dependent variables
5 min life circleWalkability score of 5-min Elderly care facilities life circle for older people4.85554.3594
10 min life circleWalkability score of 10-min Elderly care facilities life circle for older people7.68029.8110
15 min life circleWalkability score of 15-min Elderly care facilities life circle for older people21.734115.4122
Street level environmental variables
RoadThe average proportion of road pixels to total pixels0.06740.0852
SidewalkThe average proportion of sidewalk pixels to total pixels0.01950.0259
BuildingThe average proportion of building pixels to total pixels0.10410.1359
WallThe average proportion of wall pixels to total pixels0.01520.0270
FenceThe average proportion of fence pixels to total pixels0.01920.0278
VegetationThe average proportion of vegetation pixels to total pixels0.10390.1305
TerrainThe average proportion of terrain pixels to total pixels0.03050.0436
SkyThe average proportion of sky pixels to total pixels0.09810.1177
PersonThe average proportion of person pixels to total pixels0.00190.0039
Traffic vehicleThe average proportion of traffic vehicle pixels to total pixels0.04500.0707
Street population variable
Elderly populationPopulation aged 65 and above6499.243029.149714
Table 7. The percentage (%) of walking access to different service types for older people.
5-min10-min15-min
DowntownTownship AreasDowntownTownship AreasDowntownTownship Areas
Catering98.87%54.57%98.58%67.87%99.43%75.35%
Shopping89.80%52.08%96.32%67.04%97.45%74.24%
Settlement86.69%19.67%90.65%24.93%92.07%32.96%
Transportation70.26%27.98%81.87%47.09%88.95%55.96%
Medical care90.37%43.49%90.94%55.68%92.92%59.83%
Leisure31.45%6.37%46.46%11.36%57.22%17.73%
Finance50.71%18.56%65.44%26.87%74.50%36.84%
Government86.97%47.92%85.27%59.83%86.97%68.70%
Table 8. The results of global regression.
Variables5 min Life Circle10 min Life Circle15 min Life CircleVIF
Coefp-ValueCoefp-ValueCoefp-Value
Intercept1.4210.0595.8440.0102.1530.635
Street-level environmental variables
Road8.5200.05728.0540.01380.4590.0004.08
Sidewalk−1.5690.924−29.4860.533−124.3150.1491.60
Building7.0130.01016.9190.03038.0150.0062.88
Wall−5.5430.782−65.1460.246−88.0080.2941.23
Fence8.4310.56634.1520.44729.5760.7351.46
Traffic18.3150.898−386.2990.393−336.5880.6831.70
Vegetation−4.4570.148−5.6060.436−15.4660.2241.72
Terrain−3.6490.780−57.5770.059−14.3620.7571.68
Sky−9.9050.030−29.6300.006−77.8530.0003.89
Person151.5640.107517.6890.0811458.7790.0181.98
Vehicle17.3590.01060.3980.001117.2920.0001.90
Street population variables
Elderly population0.0000.0630.0001.0000.0000.8901.18
R20.241 0.320 0.449
Adjusted R20.214 0.296 0.429
AICc/AIC1972.266 2505.905 2750.737
Disclaimer/Publisher’s Note: The statements, opinions and data contained in all publications are solely those of the individual author(s) and contributor(s) and not of MDPI and/or the editor(s). MDPI and/or the editor(s) disclaim responsibility for any injury to people or property resulting from any ideas, methods, instructions or products referred to in the content.

