Article

Service Management of Employee Shuttle Service Under Inhomogeneous Fleet Constraints Using Dynamic Linear Programming: A Case Study

by
Metin Mutlu Aydin
1,
Edgar Sokolovskij
2,*,
Piotr Jaskowski
3 and
Jonas Matijošius
4
1
Engineering Faculty, Department of Civil Engineering, Ondokuz Mayıs University, Samsun 55270, Türkiye
2
Department of Automobile Engineering, Faculty of Transport Engineering, Vilnius Gediminas Technical University, Plytinės g. 25, LT-10105 Vilnius, Lithuania
3
Faculty of Transport, Warsaw University of Technology, Koszykowa 75, 00-662 Warszawa, Poland
4
Mechanical Science Institute, Vilnius Gediminas Technical University, Plytinės g. 25, LT-10105 Vilnius, Lithuania
*
Author to whom correspondence should be addressed.
Appl. Sci. 2025, 15(9), 4604; https://doi.org/10.3390/app15094604
Submission received: 1 February 2025 / Revised: 29 March 2025 / Accepted: 20 April 2025 / Published: 22 April 2025

Abstract

:
Traffic congestion is becoming an increasing problem due to the rapid growth of the population. In the current situation, the mode choice of the people has a direct impact on traffic density. For this reason, many studies have been carried out by researchers and planners to reduce the number of vehicles on the road. Various strategies have been proposed, such as incentives for public transport, parking restrictions, parking pricing and car sharing. It is very important that these strategies are implemented by the institutions in order to reduce traffic during the commuting hours, which coincide with the rush hour. Especially in areas such as shipyards and industrial zones, which are far from the city center and relatively difficult to reach but which provide employment opportunities for thousands of people, a shuttle service is one of the most preferred strategies to discourage employees from using private cars. However, in companies with thousands of employees, this situation generates costs that cannot be ignored. The examined case study similarly needs to optimize and reduce operational costs related to fuel consumption, maintenance and tax expenses by optimizing the number of two different types of service vehicles required for employee transportation at the Yalova Shipyard. For this aim, a dynamic linear programming (DLP) model was used to achieve a cost-effective, sustainable and demand-responsive shuttle service. According to the analysis results, it was concluded that the annual fuel cost of the vehicles will be reduced by 33.9%, the maintenance cost by 35.2% and the annual tax cost by 49.3% by disposing of the unneeded vehicles (27%) in the studied Yalova Shipyard. Taking all these positive improvements into account, it is clear that the optimization study significantly reduces the costs incurred by the service.

1. Introduction

There is a significant increase in the number of vehicles on the road due to the growing urban population. According to the World Health Organization (WHO), more than 55% of the world’s population lives in urban areas, and this figure is expected to rise to 68% by 2050 [1]. An analysis of recent research reports shows that the number of vehicles on the road has increased by 95.7% compared to March of the previous year [2]. This increase not only causes traffic congestion but also brings many negative effects, such as environmental and economic impacts. Currently, the transport sector is the second most responsible sector for greenhouse gas emissions released in a year, and 74% of greenhouse gas emissions are caused by road transport [3].
The employment opportunities offered by cities are an important reason for the increase in traffic density that accompanies population growth. There are millions of workers in countries who have to commute every working day of the week to their jobs in the city center or far from the city center. As the distance to work increases, the increase in the rate of commuting by private car leads to an increase in traffic density, especially during the commuting hours [4]. At this point, it is assumed that the provision of a staff shuttle service to facilitate the commuting of employees of institutions and companies to work will both provide more comfortable, safer and cheaper transport by relieving employees from the stress of traffic and reduce the tendency to use private cars. In large public institutions, companies and factories, the provision of shuttle services for employees is seen as a serious cost. These costs can include expenses such as vehicle purchase or rental, fuel, insurance, maintenance and repair and driver salaries. The aim of the organizations is to create their own efficient and fast service networks at minimum cost. For this reason, different objectives can be adopted, such as minimizing the distance and the number of vehicles to be used during the service on the route created to minimize costs and the optimal use of capacity [5]. Achieving these objectives is a major problem because it depends on many different parameters. This is where the concept of optimization comes into play and is of great importance to service providers. Optimization studies, carried out according to the defined purpose in systems constrained by different parameters, play a role in solving the complexity of the system and achieving the most appropriate result.
To minimize these operational costs and improve efficiency, companies must strategically optimize their shuttle service networks. This requires balancing various constraints, such as fleet composition, scheduling, demand fluctuations and environmental considerations. In this context, optimization techniques play a crucial role in enhancing mobility solutions by streamlining operations, improving service reliability and reducing financial burdens on organizations. Dynamic optimization models can help mitigate inefficiencies by minimizing redundant trips, allocating resources effectively and responding to varying demand patterns. First of all, the management of heterogeneous transport fleets requires the application of complex models and algorithms to ensure optimal service quality and resource allocation. The autonomous intersection management model proposed by Jiang et al. [6], although focused on pedestrian and vehicle movement at autonomous intersections, reveals the possibilities of applying spatiotemporal network models to other situations, such as employee transportation services. The advantage of this model lies in its ability to reduce waiting times and optimize traffic flows. But such a solution calls for specialized algorithms, such as the shuttle-by-shuttle planning (SBSP) method, which partitions and iteratively finds suboptimal solutions by means of computer resources. Applying mixed-mode linear programming (MILP) models helps one most effectively manage a heterogeneous vehicle fleet—that is, one using several vehicle kinds or capacities. The model proposed by Wu et al. [7], which includes trip coordination, speed regulation and stop skipping, is a significant example of how to reduce both passenger waiting time and vehicle operating costs. Dynamically applied planning models allow for more flexible responses to passenger needs and transport infrastructure capabilities. Large industrial sites, where staff transportation flows may be erratic and dependent on work shift schedules, find this method very appropriate.
Second, the modernization of transportation networks depends much on autonomous and semi-autonomous technologies. Dai et al. [8] propose a semi-autonomous (SAE level 4) transport system that allows for the formation of bus platoon services, adjusting dynamic capacity and autonomous driving in certain geographical areas. The advantage of this model is the ability to reduce passenger waiting times and transport operating costs by avoiding empty buses. The results of the study showed that such technologies can significantly improve service efficiency and ensure vehicle utilization. For instance, the availability and future aims of autonomous vehicles (car, bus, truck, etc.) could be a good example of this issue. According to Oikonomou et al. [9]’s study, higher percentage of autonomous vehicle networks (MPR) can greatly lower traffic congestion and pollution, as well as raising the average speed of the network. This model underlines that improving both transport efficiency and environmental sustainability depends on well-tuned transportation speeds and planning decisions.
Third, being a particular kind of transportation service, employee transportation services call for certain kind of planning. Lv et al. [10]’s study on urban air mobility (UAM) highlights the importance of route optimization and vehicle capacity in order to reduce passenger travel times and maintain service availability. Although UAM solutions are currently more adapted to air transport, their methodological principles could also be applied in the context of land transport, especially in complex work environments, such as shipyards.
Fourth, mobility as a service (MaaS) is another promising direction for optimizing employee transportation. Xu and Zheng [11] emphasize that the quality and accessibility of transport services directly influence passenger choices. In this context, not only network development is important but also research into the behavior of real users, which would allow the alignment of technological solutions with practical needs. Furthermore, Jędrzejczyk [12]’s study on the sharing economy shows that automobile sharing systems might help lower transportation costs and environmental pollution.
Finally, one should take into account the social and legal consequences of implementing fresh mobility technologies. As Annund et al. [13] underline, the effective integration of autonomous vehicles depends on the collaboration of local authorities, precise legal rules and social acceptance. Moreover, the policy and regulatory environment surrounding urban mobility must evolve to accommodate emerging transport innovations. Implementing intelligent fleet management solutions requires collaboration between government authorities, industry leaders and research institutions. Social acceptance of mobility shifts, safety concerns regarding autonomous shuttles and legal frameworks governing shared transport systems are crucial aspects that influence adoption and scalability [13]. The study focuses on optimizing employee shuttle services using dynamic linear programming (DLP) to address cost inefficiencies and improve sustainability at the Yalova Shipyard. By applying a structured optimization model, this research aims to
  • Reduce fleet operational costs by optimizing the number and type of service vehicles.
  • Improve vehicle utilization rates by adjusting routes and schedules based on demand fluctuations.
  • Enhance environmental sustainability by decreasing fuel consumption and lowering emissions.
  • Provide a flexible, scalable transport model applicable to other industrial and corporate mobility networks.
This study differs from others by using dynamic linear programming (DLP) explicitly tailored to manage an inhomogeneous fleet of shuttle vehicles in an industrial context at the Yalova Shipyard. Unlike previous studies, this research integrates a dynamic, user-friendly software interface designed for real-time operational planning, allowing for continuous adjustments to meet the fluctuating transport demands of the workforce. In addition, the study quantifies significant reductions in operational costs, specifically fuel consumption, maintenance and taxes, providing practical and directly measurable benefits beyond the theoretical efficiency and sustainability improvements typically emphasized in previous literature. The study also serves as a practical framework for optimizing employee transport networks, with potential applications in urban planning, corporate mobility management and smart transportation systems. Future research could explore the integration of electric and autonomous shuttle fleets into optimization models, further aligning workforce mobility with global sustainability initiatives.

2. Literature Review

2.1. Impact of Demand and Service Management on Traffic Density

Traffic density is a serious problem today with the increasing number of vehicles. This density has negative effects in many ways. The transport sector accounts for 29% of global energy consumption and 65% of oil product consumption [14]. At the same time, the fact that the transport sector accounts for 24% of global CO2 emissions indicates its significant impact on global climate change [15]. These findings show that the transport sector is of great importance, both economically and environmentally. One of the ways to reduce this impact is to reduce the number of vehicles on the road. There are many studies that show that reducing the number of vehicles reduces harmful gas emissions and energy consumption [16,17,18,19].
The fact that employees prefer to use private cars is one of the factors influencing the intensity of traffic during working hours. In his study, Downs [20] found that 45.4% of morning traffic and 49% of evening traffic was caused by commuting. Therefore, in order to reduce the use of private cars, institutions around the world use a technique known as travel planning in the UK, mobility management in continental Europe and transport demand management in the USA [21,22]. Some important studies on transport demand management in the literature are summarized in detail according to their content and strategic objectives (Table 1).
Studies that have used this technique include approaches such as the use of public transport discount cards, bicycle facilities, car sharing and shuttle buses. A review of the studies shows that the most widely used transport demand management methods are car sharing, public transport incentives and car parking pricing [34]. Among these, car sharing aims to reduce the rate of solo travel by establishing communication between people traveling in the same direction. In particular, shuttle services for employees in institutions and organizations with a large number of employees can be evaluated under this heading.
Unfortunately, the use of private cars is a common mode of transport today. One of the negative effects of private car use is undoubtedly the parking problem. Some of the strategies created to prevent this situation are the provision of limited parking spaces by institutions, the creation of a reward system and the pricing of parking spaces [34,35,36]. On the other hand, efforts are being made to encourage people to use public transport, such as fare discounts, the distribution of applications that provide route information and the provision of transfer points [37,38]. The expected effect of these strategies is to reduce private car use. Petrunoff [39] found that the use of travel plans reduced the proportion of car trips to work from 83% to 70%. Following the implementation of the application, it was observed that the psychology of employees was positively affected, as well as a reduction in use of individual vehicles during commuting [40]. Reducing the use of private cars also has a positive impact on the environment. Carapellucci et al. [41], in a study on the effects of a home-to-work shuttle service, determined that it had a significant impact on air pollutants and greenhouse gas emissions, with a 97% reduction in volatile organic compounds, a 72% reduction in particulate matter and a 60% reduction in carbon dioxide. Among these approaches used in many different countries, the method most widely used by institutions, organizations, companies, factories, etc., where a large number of employees work in the same place, is the shuttle service, which reduces the use of private cars by employees and ensures punctuality at work. With such service applications, institutions and organizations provide a public transport service that allows employees to travel between home and work using their own means of transport. By discouraging the use of private cars by employees, the service helps protect the environment by reducing harmful exhaust emissions, as well as helping to reduce traffic congestion.

2.2. Overview of Previous Studies

In order to ensure the transport mobility of staff working in the institutions, it is important to manage the transport demand process by using the capacity of the staff shuttle service offered to them efficiently in terms of cost to the institutions. The existence of many parameters that influence the costs makes the problem complex. For this reason, many optimization methods are now used today to provide the service at the lowest cost. In the literature, there are many optimization studies aimed at minimizing costs. The most commonly used optimization methods are grouped in Figure 1. In the literature, optimization problems are generally divided into four main categories. The first category includes constrained and unconstrained problems. These types of problems are grouped according to the set of spaces in which the solution is sought. If the problem has certain constraints, the search space is limited by these constraints, while the opposite is true for unconstrained problems [42]. The second category includes continuous and discrete problems. If there are situations where the decision variables can only take certain values, this means that there is a discrete optimization problem. In continuous optimization problems, the decision variables can take any real value. Linear programming and non-linear programming problems fall into this category. In the literature, different methods are proposed to reach the solution in the case of discrete and continuous problems [43,44]. Another category is analyzed in two groups as single-objective problems and multi-objective problems. In single-objective optimization problems, an objective is set, and the best solution that makes the function a minimum or a maximum is sought. In multi-objective problems, there is more than one objective to optimize. When the studies on optimization problems are examined, it is found that the studies focus on cost minimization or profit maximization [45,46]. Finally, the fourth category consists of static and dynamic problems. Static optimization problems aim to find the best solution based on an instantaneous period of time. In such problems, the values of the variables are assumed to be constant, and the situation is analyzed instantaneously. The goal of dynamic programming is to find the best solution when variables and conditions change unexpectedly. In such problems, the process must first be analyzed by considering a given time interval. In this technique, the optimization process is performed by considering how the variables change over time. A review of the literature clearly shows that various methods, such as time series analysis, regression analysis, artificial neural networks, clustering analysis and classification, are widely used in the analysis of data changes over time in dynamic programming.
One of the areas where optimization techniques are widely used in the literature is transport. It is basically concerned with optimizing the transport of goods or people from one location to another. Studies generally focus on optimizing the road network used during transport and minimizing the time spent in traffic and transport costs. For example, Islam et al. [47] aim to minimize transport costs by optimizing transport planning in supply chain management using chemical reaction optimization (CRO), a metaheuristic approach. Mirzahossein and Zargari [48] propose a combined optimization model to estimate travel time and congestion charges in a transport network. Gibson et al. [49] conduct an optimization study to minimize delays caused by demand variability in the transport of medical specimens using an optimization-based solution approach. In another study, Aydın [50] modeled bus passenger boarding using the artificial bee colony (ABC) method. Based on the results, it can be concluded that boarding times are shorter depending on the quality and characteristics of bus stops. In addition to studies aimed at minimizing travel time and transport costs, there are also studies aimed at minimizing the environmental impact of transport by introducing green procurement policies in transport. For example, Jiang et al. [51] aim to minimize energy consumption and total CO2 emissions with a Pareto-based multi-objective tabu search algorithm for multi-vehicle and single-cargo green transport planning. Zhao et al. [52] propose a multi-modal public transport optimization model using a genetic algorithm method to minimize carbon emissions. They aim to reduce distribution costs, vehicle fuel consumption and carbon emissions in a vehicle routing optimization problem by using evolutionary algorithms.
Unlike the existing studies in the literature, which aim to minimize travel time, comfort, safety, cost and environmental impact, this study is a new optimization study to minimize fuel costs as a function of the number of vehicles allocated to shipyard employees for commuting. The dynamic linear programming problem (DLPP), which is similar to the dynamic programming structure due to the fact that it contains non-constant variables and has a capacity constraint, was proposed as a macro that provides a solution according to the data obtained by predicting future data using past data. For this new application, a dynamic, user-friendly interface was designed to be actively used by the company. In this way, the model’s data infrastructure, created by inputting new and current data, is dynamically and instantly updated and aims to present the most appropriate number of vehicles to be allocated to the operator for minimum fuel consumption over the next week. With this proposal, developed as part of the study, users will be able to provide a shuttle service to the maximum number of passengers with the minimum number of vehicles, resulting in significant gains in cost items, such as fuel, maintenance, number of staff, taxes, etc. In addition, with fewer vehicles on the road, significant gains can be made both in terms of traffic and in terms of reducing harmful gases emitted into the air.
In the context of this research, optimization methods play an important role in solving the problems of transport network management and cost minimization. Figure 1 illustrates the most commonly used optimization methods, which are divided into two main groups: exact solution methods and metaheuristic solution methods.
Exact solution methods give the best answers when problems have clear rules and limits. Linear programming, as the first method, is used to find optimal solutions when the problem can be stated in terms of linear equations and constraints [53]. Dynamic programming is employed in step-by-step decision-making processes to address issues that evolve over time [54]. Integer programming and mixed-integer programming are employed to solve problems in which some parameters must be whole numbers (integers) and others can be any number (real numbers). Branch-and-price and branch-and-cut algorithms are also widely used, which allow for efficient solution of large-scale optimization problems, especially in the field of transportation and logistics [55].
Managing employee shuttle services under inhomogeneous fleet constraints involves optimizing routes and schedules for a diverse set of vehicles to meet employee transportation needs efficiently. This challenge intersects with various research areas, including vehicle routing problems, demand-responsive transport systems and fleet scheduling under mixed-vehicle configurations [50]. For example, Yalçındağ [56] examined the employee shuttle bus routing problem to design optimal routes for shuttles to transport employees between their residences and workplaces. He developed mathematical models that extend the traditional school bus routing problem. The study introduced unified and area-based solution methods, demonstrating significant cost reductions and improved efficiency in shuttle operations. In another study, Xiong et al. [57] proposed demand-responsive transport (DRT) systems to adopt passenger demands by offering flexible routing and scheduling, which is particularly beneficial when dealing with variable employee schedules and diverse fleet compositions. The study employed metaheuristic algorithms to solve the model, highlighting the effectiveness of demand-responsive services in enhancing operational efficiency. In a similar study, Yan and Tseng [58] developed a model to assist carriers in simultaneously determining optimal fleet routes and schedules. Their approach formulated the problem as an integer multiple-commodity network flow and applied a Lagrangian relaxation-based algorithm to achieve efficient solutions. This methodology is particularly relevant for managing inhomogeneous fleets in shuttle services. The 2004 report of FHWA [59] aimed at maximizing traveler choices and managing demand to improve transportation system efficiency, providing travelers with effective choices to enhance travel reliability. Implementing travel demand management strategies, such as flexible work hours and ride-sharing incentives, can complement shuttle services by reducing peak demand pressures and optimizing fleet utilization. Planning for a zero-emission mixed-fleet public bus system requires the consideration of various operational constraints and environmental goals, which are also important for bus schedule planning and operations. In the study of Frieß and Pferschy [60], they proposed integer linear programming models that utilize comprehensive input databases, allowing for customized solutions tailored to specific operational contexts. These models facilitate effective scheduling and routing decisions in mixed-vehicle fleets, aligning with sustainability objectives.
In summary, effectively managing employee shuttle services under inhomogeneous fleet constraints necessitates the integration of advanced routing algorithms, demand-responsive strategies and comprehensive scheduling models. By leveraging these approaches, organizations can enhance the efficiency and sustainability of their transportation services. The application of all these methods in the optimization of transport systems allows for the effective modeling and solution of problems related to route planning, vehicle allocation and cost reduction.

2.3. Study Objective and Expectations

In recent years, the optimization of employee shuttle services has been extensively studied, with a focus on enhancing efficiency and reducing costs. Traditional approaches often employ static models, which may not adequately address the dynamic nature of transportation demands. A notable advancement in this field is the integration of dynamic linear programming (DLP) techniques, which consider the temporal evolution of systems and allow for multi-stage decision-making processes. This approach provides a more comprehensive framework for optimizing shuttle services over time, accommodating fluctuations in demand and operational conditions [61].
Moreover, the application of robust optimization methods has gained traction, particularly in scenarios where passenger arrival rates are uncertain. By incorporating robust optimization into dynamic bus dispatching models, planners can develop departure schedules that minimize total passenger waiting time while accounting for variability in demand. This results in more resilient and reliable shuttle services, capable of maintaining performance even under uncertain conditions [62].
Another significant development is the use of multi-objective mixed-integer linear programming (MILP) models in dynamic environments. These models simultaneously optimize multiple objectives, such as minimizing total ride time, waiting time and transfer distances for passengers. By considering time-varying demand and travel times across different periods, MILP models offer a holistic approach to shuttle service optimization, ensuring that solutions are both efficient and adaptable to changing conditions [61].
In summary, the integration of dynamic linear programming, robust optimization and multi-objective MILP models represents a significant advancement in the optimization of employee shuttle services. These approaches address the limitations of static models by incorporating temporal dynamics, uncertainty and multiple performance criteria, leading to more efficient and resilient transportation solutions. Unlike other studies, the flexible dynamic linear programming (DLP) model proposed in this study is based on some of these methods and aims to optimize the transport network for the transportation of Yalova Shipyard employees. The application of this flexible model shows that it is possible to significantly reduce transport costs, increase service efficiency and at the same time contribute to environmental goals by reducing carbon dioxide emissions from the transport sector.
This work introduces three new algorithms (Algorithms 1–3) to describe the flexibility of the DLP model employed for east and west directions. These proposed algorithms provide a scientific novelty to the research conducted by offering flexible optimization and sustainability for the scheduling process. A flexible optimization model is provided that enables efficiency for the optimization of vehicles (numbers, routes etc.) utilizing the dynamic linear programming (DLPP) technique. The study also proposes a new simple software interface to provide efficiency and flexibility to the service schedule planning authorities of the Yalova Shipyard. Thus, operators can easily carry out planning and scheduling operations with the proposed software interface that includes the recommended flexible model. In this respect, the study differs from other studies by proposing both a flexible and effective new modified method and a user-friendly new software interface that includes the proposed modified method. Thus, planners and operators can easily use this proposed modified method in practice and see the performance results in practice. The practical deployment of the proposed method in the Yalova Shipyard results in a reduction in annual transport taxes of 49.3%, maintenance costs of 35.2% and fuel consumption of 33.9%, thereby demonstrating its economic value. The study also helps sustainability by means of improving the surroundings by reducing pollution and traffic congestion, optimizing vehicle demand and thus minimizing carbon dioxide emissions. Dynamic updating of optimization solutions is made possible by the innovative interactive platform and real-time data analysis, which help increase productivity and reduce the need for additional human resources in planning operations. The real data from the studies show that the model is helpful and show how it can lower costs and simultaneously enhance the running of the transportation system. By producing fresh ideas for a range of sectors and disciplines, the outcomes of this study help to further transportation knowledge. When these factors are taken into account, this research helps significantly by including useful solutions, supporting sustainable practices and maximizing transportation systems.

3. Materials and Methods

3.1. Study Site: Yalova Shipyard

The fact that shipyards, warehouses, logistics centers, factories, etc., are located far from the city center can lead to mobility problems for employees between work and home. In such business and industrial areas, where many workplaces are clustered together, the tendency of employees to use private cars brings with it the problem of parking space, as well as traffic density. For this reason, the transport service provided by such workplaces to their employees is of great importance in many respects.
The study was carried out at the Yalova Shipyard in Türkiye, which is one of the most important ship repair yards in the world and Europe. The Yalova Shipyard, nestled in the strategic heart of Türkiye’s Marmara region, is a symbol of maritime excellence and innovative craftsmanship. With a rich legacy rooted in Türkiye’s longstanding naval tradition, the shipyard has evolved into a modern hub for both shipbuilding and repair, catering to a diverse range of vessels from agile coastal boats to robust commercial ships. The Yalova Shipyard has been serving the world’s leading foreign ship owners and ship management companies based in Greece, Italy, Germany, Denmark, Hong Kong, Singapore and Japan since its establishment. The shipyard has 700 m of seafront, 2.5 km of ship repair docks and a shipyard area of 216,000 m2 located in the Altınova region of Yalova city. The location and visual appearance of the yard are shown in Figure 1.
In addition to having one of the largest floating drydocks in the world, with a recently added 382 m2 drydock, the Yalova Shipyard operates with three drydocks, one of which is a stone drydock and the other a floating drydock. It has the infrastructure and more than 2000 experienced workers and the necessary manpower to carry out repairs of 15 vessels simultaneously, including Aframax/Suezmax tankers, Capesize/Newcastlemax bulkers, Q Max size LNG tankers and containers up to 15,000 TEU. Although the yard’s working hours are set at eight hours during the day, additional shifts may be required at night when workloads are high. This situation creates a continuous and dynamic cycle in terms of service transport at the yard. Due to Türkiye’s geopolitical position in freight transport and the increasing number of international merchant vessels favoring Turkish shipyards, the sector continues to grow, and the employment rate is steadily increasing. This growth creates a need for new service vehicles for the new personnel coming into the shipyards. This situation once again highlights the importance of continuous and dynamic optimization of the service network designed for the employees. Additionally, the Yalova Shipyard plays a crucial role in boosting the local economy by creating high-skilled employment opportunities and fostering collaborations with leading maritime experts. Its commitment to excellence and continuous improvement underscores its position as a leader in Türkiye’s vibrant maritime sector.

3.2. Present Shuttle System

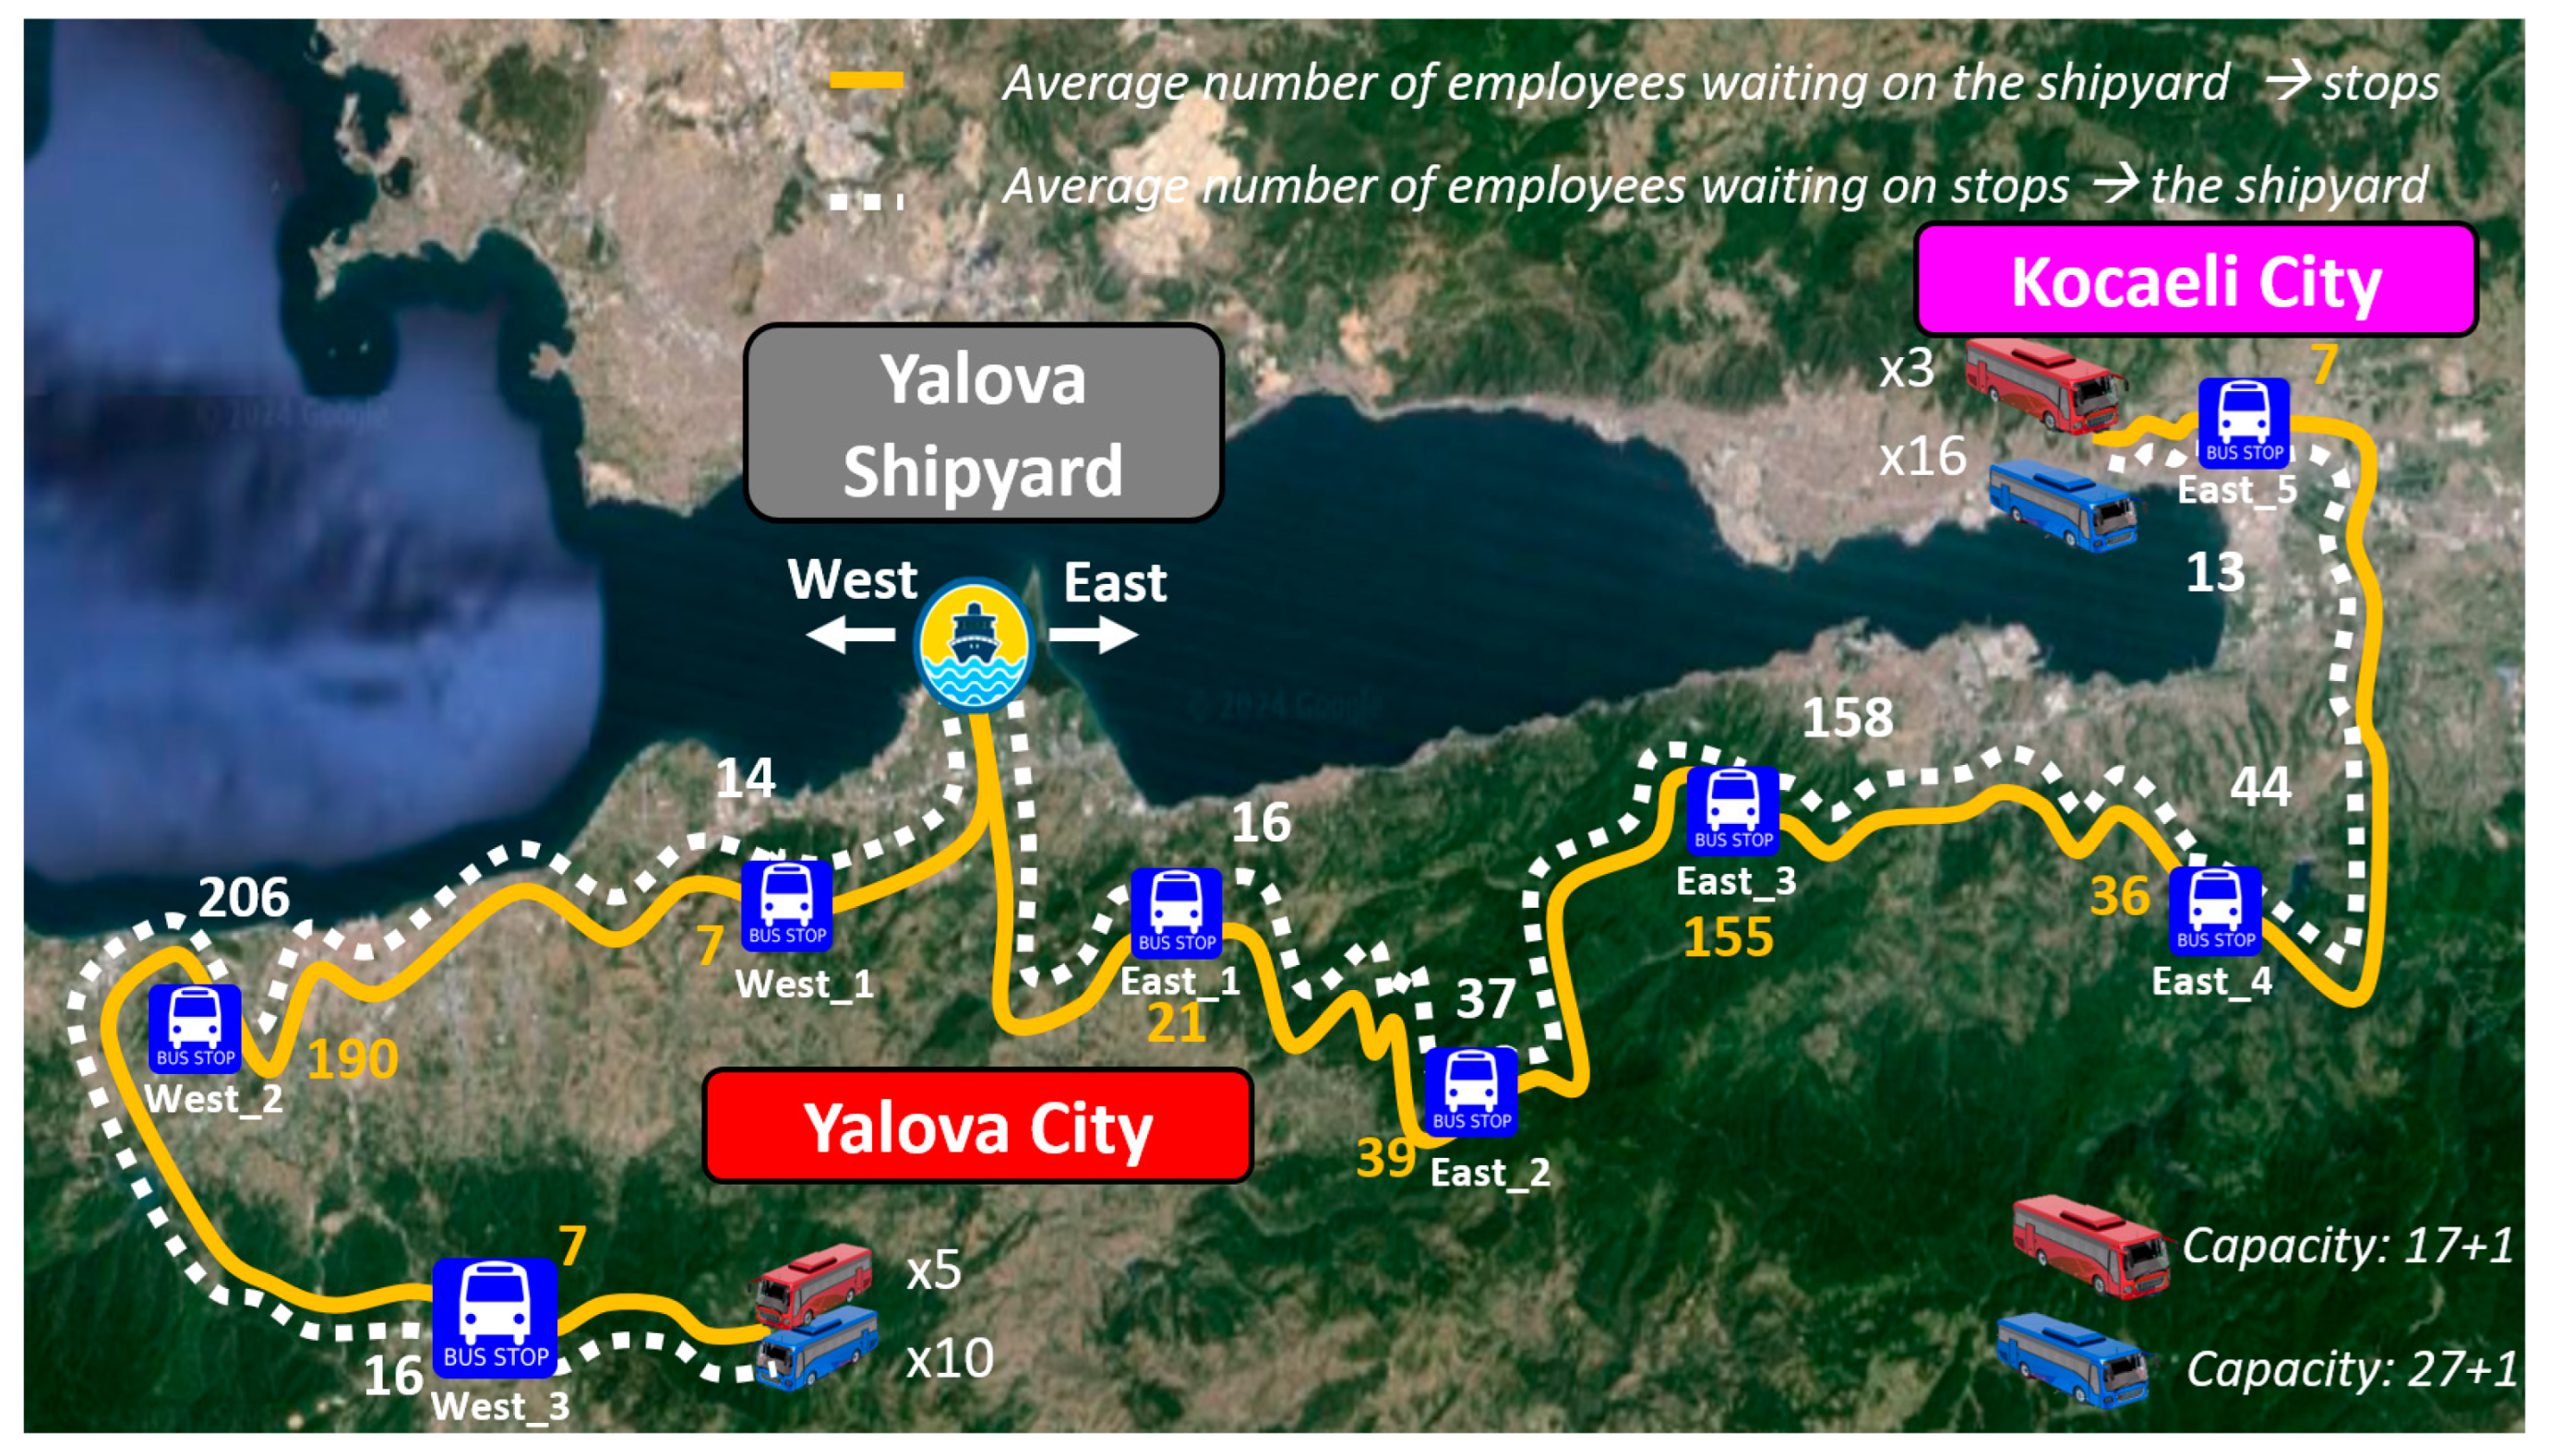
At the Yalova Shipyard, a network of shared shuttle buses, which is financed by the shipyard companies, is used to transport employees between home and work. The shipyard’s passenger shuttle service consists of a total of 34 vehicles of two types with different capacities (17 + 1 and 27 + 1 seats). The shuttle buses operate in two different directions in the cities of Yalova and Kocaeli. There are a total of eight bus stops in these two main directions, three in the west and five in the east, as shown in Figure 2. The meeting points (bus stops) and service routes were usually determined depending on the location of the regions where employees live. Intermodal transfer opportunity was also considered during the meeting points determination process.
A shuttle service is provided to the shipyard in the morning and at the end of the shift in the evening between Yalova city and Kocaeli city. The total length of Route 1 from the center of Yalova city to the entrance of Yalova Shipyard (west direction) is 50 km. The total duration of Route 1 (west direction) is on average 45 min (varies depending on morning and evening traffic density). The total length of Route 2 from the center of Kocaeli city to the entrance of Yalova Shipyard (east direction) is 56 km. The total duration of Route 2 (west direction) is on average 50 min (varies depending on morning and evening traffic density). The departure schedule from the two ends (to the shipyard) is 7:00 am, and the departure from the shipyard to the centers of the two cities (east and west) is 17:00 pm; the arrival of each employee at the Yalova Shipyard meeting point is 8:00 am, and the arrival of each employee at the meeting points in the city centers is around 18:00 pm. In case of additional shifts in the evening, additional shuttle services are provided. Employees wishing to use the shuttle service should wait at the designated bus stops and use the cards issued by the company for employees using the shuttle service when boarding. This digitally records, on a daily basis, how many employees take the respective shuttle service from the respective stop. The demand for shuttle services can fluctuate for reasons such as overtime, transfers between units and the need for additional labor. These fluctuations in demand can lead to situations where the services available, i.e., the existing capacity, are not used effectively. This unfavorable situation causes the company to maintain surplus shuttle buses, which creates unnecessary costs. Therefore, in order to minimize the cost of using shuttle services, the company needs regular and dynamic modeling to regulate the number and frequency of shuttle services.

3.3. Data Collection and Extraction

In the scheduling process of employee shuttle service for the Yalova Shipyard, monthly data for December 2023 were used because of the monthly travel planning procedure of shipyard management administration. To calculate the necessary vehicle numbers, total capacities, monthly costs, total passenger numbers, etc., monthly travel planning is conducted at the shipyard. For this reason, one of the months with highest data density was chosen and used in the study analysis. The dataset shows how many employees are picked up from each stop in the morning and how many are dropped off at each stop in the evening over one month. The data are collected by entering the information regarding how many employees get into the respective vehicle with the respective number plate into the system using the service boarding pass cards that employees use when they board the service. In a company with approximately two thousand employees, each service boarding card used by an employee during a round trip creates a separate data line, resulting in a very dense and complex digital dataset in the online server system of the operator. Some of the records in the dataset for a sample day are shown in Table 2.
The raw data obtained digitally from the service boarding pass were cleaned and systematically prepared to ensure accuracy and robustness prior to the proposed model input. First, exploratory data analysis (EDA) was performed to identify data distributions, missing values and potential outliers. In examining the missing values of the data obtained, it was found that the missing values were limited. Therefore, the data were treated by calculating the mean, median and imputation for numerical variables with limited missingness.
Outliers were also carefully identified using z-scores and interquartile ranges (IQRs), supplemented by visual methods including scatter plots and box plots. Once identified, outliers were treated by limiting extreme values (Winsorization) to defined percentile limits. Observations clearly identified as erroneous were excluded from the analysis. Finally, data standardization and normalization ensured consistency across variables, and categorical data were appropriately coded to facilitate their use in the proposed model. These thorough data cleaning procedures ensured reliable, high-quality inputs for the analysis, essential for effective DLP modeling.
  • Analysis Results
Based on the data obtained, a dataset of 29,257 trips recorded over a month, for which the data were fully collected, was obtained (Figure 3). The dataset, which was transferred to the system via the card system and used in the analyses, included the stop name, date, time, vehicle number plate and vehicle capacity information.
Using this dataset obtained after the data pre-processing phase, data were organized to analyze vehicle use, and data for a weekday sample are summarized in Table 3.
There are currently eight buses with a capacity of 17 + 1 and twenty-six buses with a capacity of 27 + 1. The unit costs of vehicle types for the company are shown in Table 4. The shuttles depart from a designated stop at the shipyard and travel west and east. The shuttles stop at a total of eight stops, three in the west and five in the east, to pick up or drop off passengers (Figure 2).
Within the shuttle service, the number of employees to be picked up or dropped off at stops for home–work–home trips may vary for reasons such as shift changes, additional labor requirements due to work intensity, employees working overtime and employees being directed to other units when needed. For this reason, the analysis of the data shows that the number of services and trips required in the transport network varies from day to day. As this change cannot be foreseen in the current active shuttle system, the provision of all shuttles owned by the company leads to inefficient capacity management. According to the information obtained from the available data, the change in the number of passengers at the stops for a sample period of one week is shown in Figure 4.
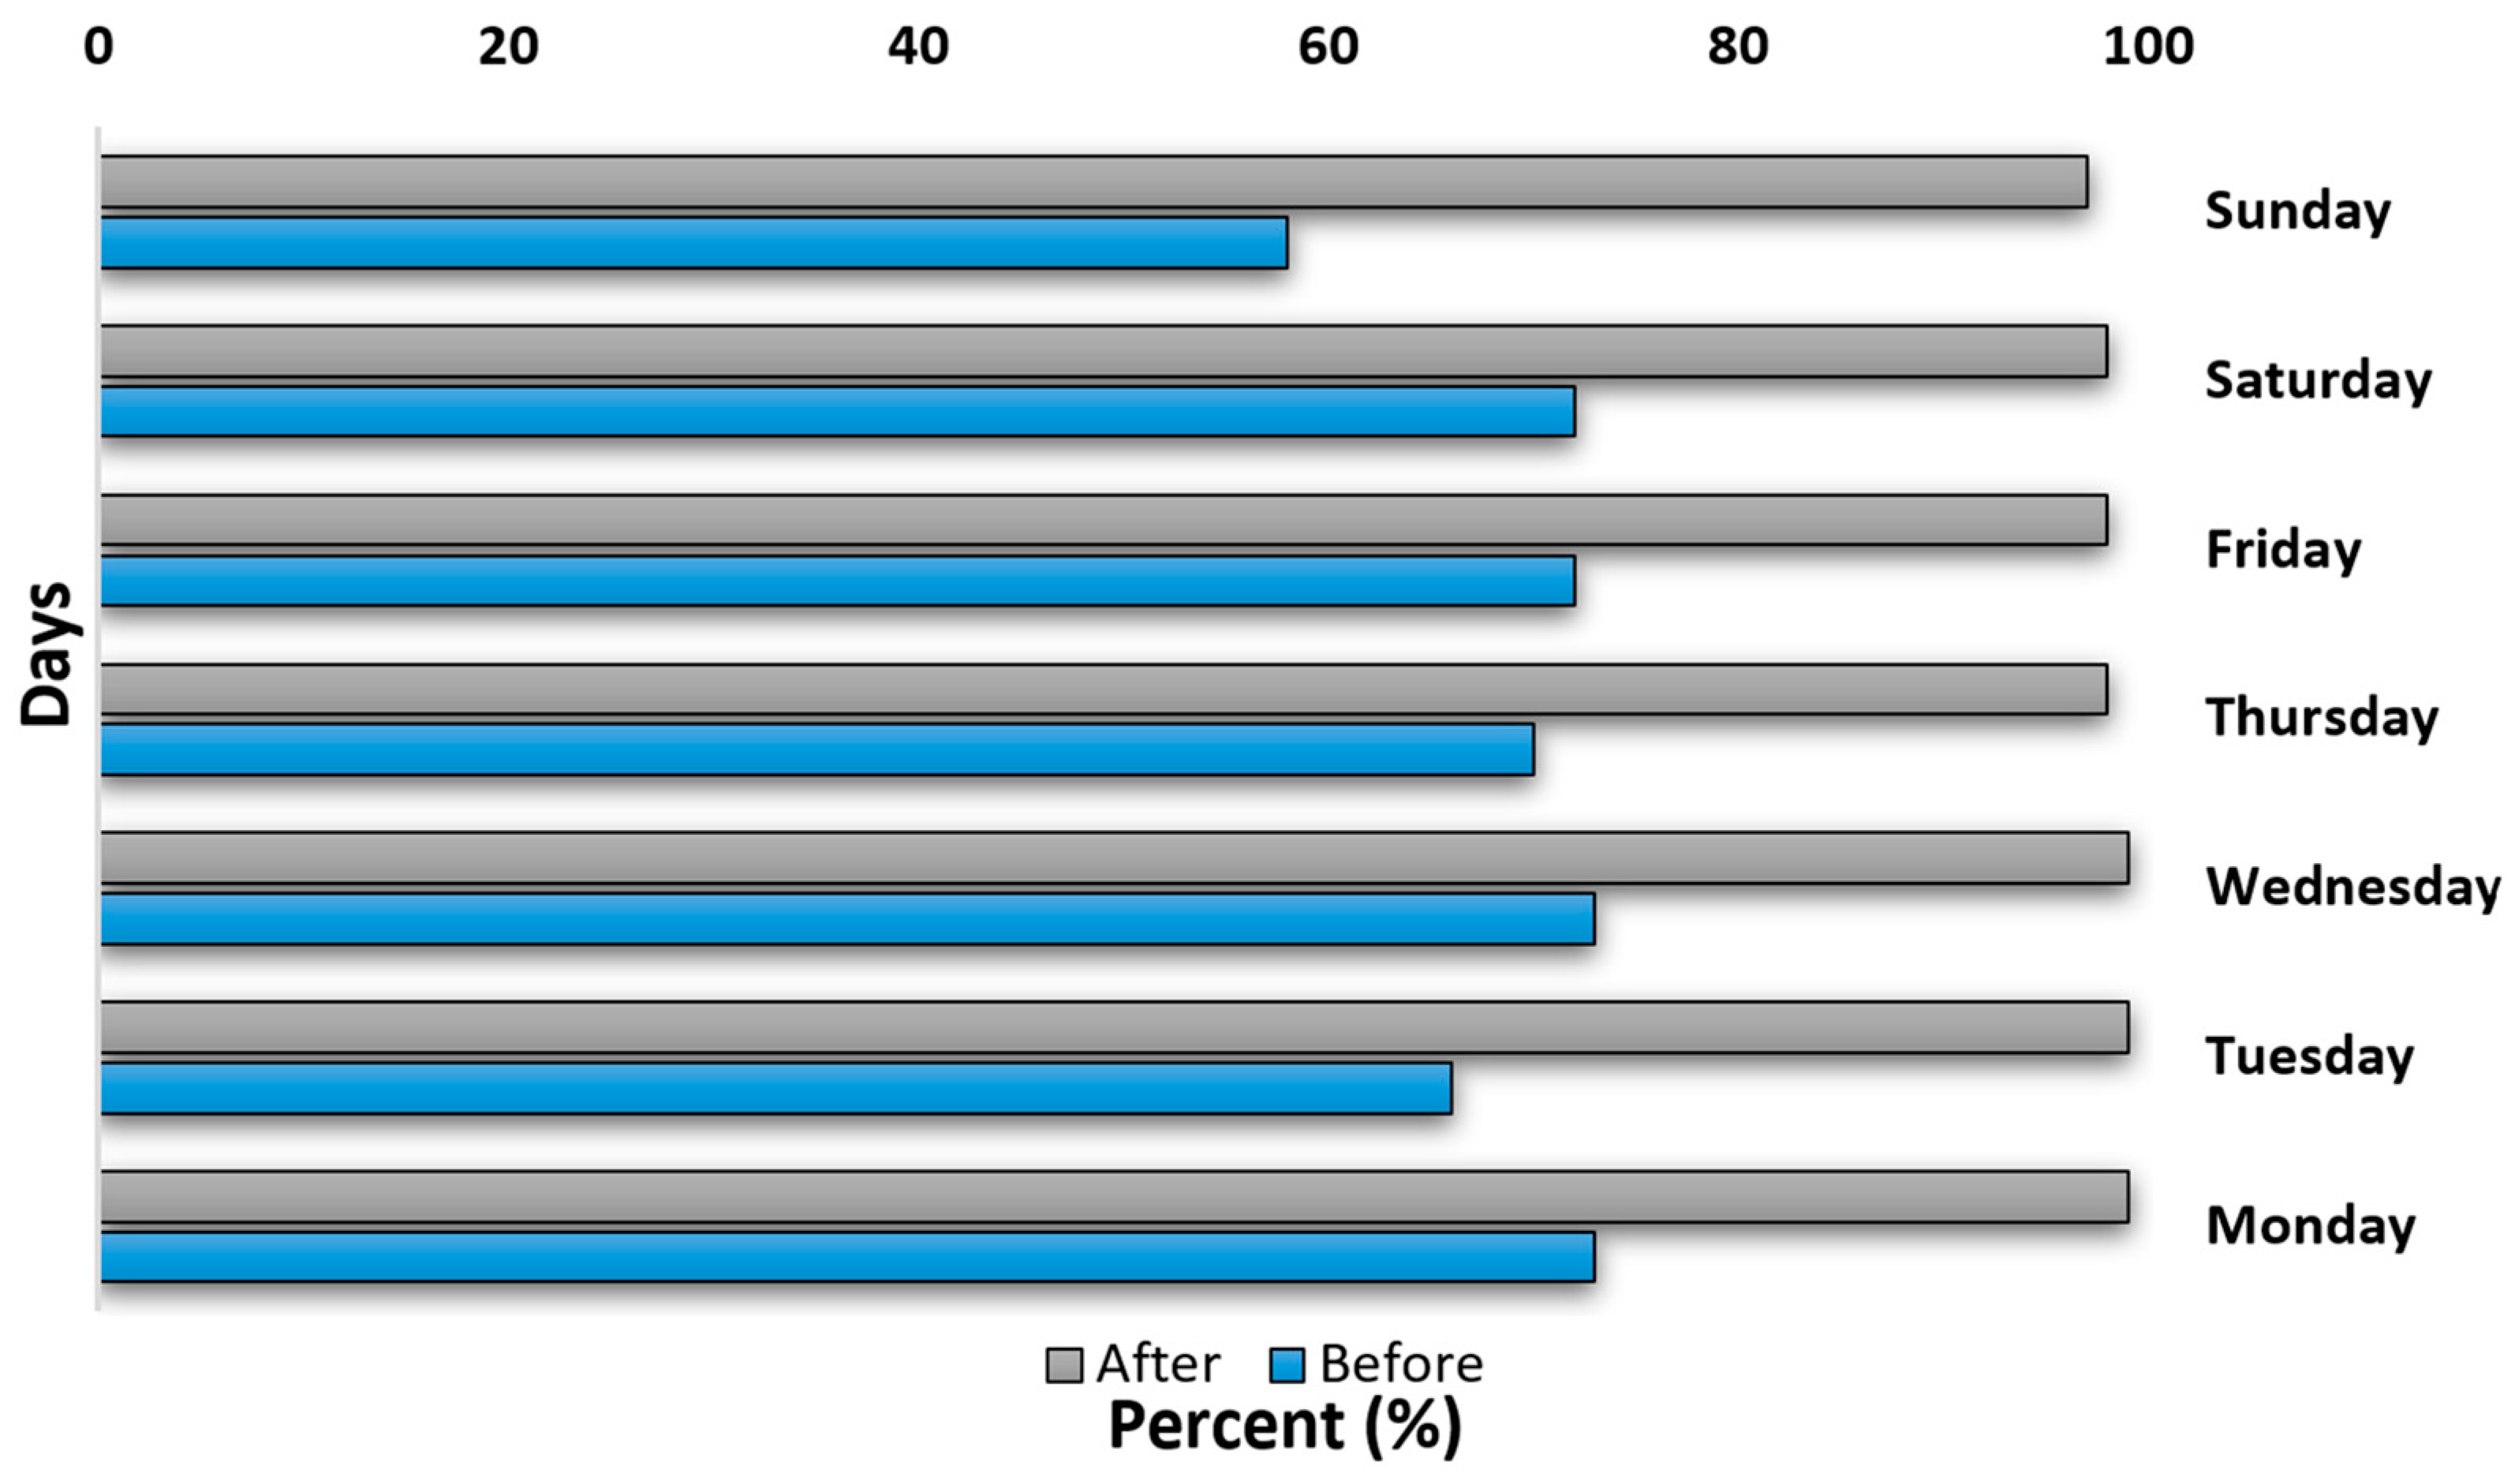
Analysis of the data shows that the capacity of the shuttles used to transport employees to and from work is not being used effectively [63,64]. The random distribution of employees from the shipyard stop to the shuttles results in some shuttles being full and passengers having to stand, while other shuttles run with a number of passengers below capacity. For this reason, in the designed transport network, the services that are put into service without numerical service planning are reflected as additional costs. When analyzing the data obtained from the existing system, the occupancy rates of the shuttles, calculated by taking into account the total capacity of the shuttles used for morning and evening transport during the week, are as shown in Figure 5.
An analysis of Figure 5 shows that almost half of the service capacity is not used on Sundays, when the number of employees using the shuttle service is lower than on other days, and there is a gap of around 30–40% on other days. It is assumed that by optimizing the number of shuttle services, the capacity can be used optimally, and the company can provide the shuttle service at minimum cost. The study proposes a model that minimizes the number of trips and suggests a cost-effective service.

4. Model Selection and Development

4.1. Model Selection

In the study, a linear programming (specifically DLP) model was used to achieve a cost-effective, sustainable and demand-responsive shuttle service at the Yalova Shipyard. Dynamic linear programming (DLP) is an optimization method where complex problems are broken down into simpler stages solved sequentially, and optimality is preserved throughout. It is particularly suited for problems that involve sequential decision making and clearly defined stages and states [65]. It is the most suitable optimization method for the study because it provides guaranteed optimal solutions, efficiently manages structured and linear constraints and aligns closely with the sequential decision-making nature inherent in fleet scheduling and vehicle allocation problems. DLP is particularly effective for problems involving clearly defined linear constraints, such as vehicle types, capacities, scheduling restrictions, driver availability and route feasibility. Because employee shuttle services involve sequential and interconnected decisions, such as assigning appropriate vehicles, designing schedules and routing, DLP’s structured approach efficiently identifies globally optimal solutions. Moreover, DLP offers predictability and consistent results, making it highly reliable for real-world operational decision making where accuracy and stability are critical [66].
Unlike metaheuristic approaches, such as genetic algorithms (GAs), simulated annealing (SA), tabu search (TS) and ant colony optimization (ACO), which explore solutions stochastically and typically deliver approximate or near-optimal outcomes without guarantees, DLP ensures precise and globally optimal solutions. This is especially crucial in shuttle fleet management, where constraints such as vehicle type limitations, passenger capacities, route assignments and scheduling are rigid, clearly defined and linear. Furthermore, DLP’s deterministic and predictable performance provides reliable and stable solutions required for operational implementation, whereas heuristic and metaheuristic methods can introduce variability and uncertainty due to their stochastic nature and complex parameter tuning. Therefore, considering the need for reliable, optimal and structured management solutions in shuttle service scenarios, DLP clearly emerges as the best choice over alternative optimization and metaheuristic methods. A performance comparison of the DLP and other optimization methods is summarized in Table 5 below.
In conclusion, DLP stands out as the most suitable optimization method for managing an employee shuttle service under complex yet clearly defined inhomogeneous fleet constraints. Its capacity to guarantee optimal solutions, effectively manage structured constraints, support sequential decisions and provide stable, predictable results aligns precisely with the operational demands and precision required by this specific service management scenario.

4.2. Model Development

In the study, a DLP model was used to examine a case study, which needs to reduce operational costs related to fuel consumption, maintenance and tax expenses by optimizing the number of service vehicles required for employee transportation. Also, the examined shuttle service consists of vehicles with different capacities (17 + 1 and 27 + 1), and DLP helps allocate the right number of each type of vehicle to meet demand while minimizing waste. On the other hand, the study implements dynamic linear programming (DLP) to adjust to changing workforce transportation needs, optimizing the routes and fleet size weekly. Lastly, the study proposes fleet scheduling under variable demand, and DLP is the most suitable method to ensure that the shuttle fleet is used efficiently, considering variations in shift patterns, overtime and demand fluctuations.
Linear programming is a mathematical modeling technique that helps achieve the optimum outcome through efficient use of limited resources. The method has three basic components: objective function, constraint function and decision variables [53]. The objective function of a general linear programming structure is given in Equations (1)–(6), and the constraint function is given in Equations (7)–(10) [54].
Z m a x / m i n = j = 1 n c j x j = c 1 x 1 + c 2 x 2 + c 3 x 3 + + c n x n
a 11 x 1 + a 12 x 2 + a 13 x 3 + + a 1 n x n ; = ; b 1
a 21 x 1 + a 22 x 2 + a 23 x 3 + + a 1 n x n ; = ;   b 2
a 31 x 1 + a 32 x 2 + a 33 x 3 + + a 3 n x n ; = ;   b 3
.
a m 1 x 1 + a m 2 x 2 + a m 3 x 3 + + a m n x n ; = ;   b m x 1 , x 2 , , x n 0
j = 1 n a j x n ; = ; b i ( i = 1 , 2 , 3 , , m )
  • where
  • Z m a x / m i n : The objective function (either maximization or minimization).
  • c j : The coefficients of decision variables x j .
  • a i j : The coefficients in the constraints.
  • b i : The right-hand-side values of constraints.
  • x j 0 : The non-negativity constraints.
The matrices for the objective function (Equation (7)) and the constraints (Equations (8)–(10)) of a general linear programming model are shown as follows [54,69]:
Z m a x / m i n = ( c 1 c 2 c 3 c n ) 1 × n
x 1 x 2 . . x n x n + 1 . . x n + m n × 1
a 11 a 12 a 1 n a 21 a 22 a 2 n . . . a m 1 . . . a m 2 . . . . . . a m n m × n
x 1 x 2 . . . . x n n × 1 = b 1 b 2 . . . . b m m × 1
Dynamic linear programming (DLP) is an optimization framework that extends classical linear programming into a multi-period setting, where decisions at one stage affect future stages. The general form of dynamic linear programming, as formulated in Equation (11), includes the objective function, which maximizes the total profit (or minimizes the total cost) over T time periods.
m a x = t = 1 T c t T x i A t x t + B t x t 1 b t ,     t = 1 , , T x t 0 ,       t = 1 , , T ( state   transition   constraints ) x t 0 ,       t = 1 , , T   ( n o n - n e g a t i v i t y   c o n s t r a i n t )
  • where
  • T : The number of time periods (stages).
  • x t : The vector of decision variables at time t .
  • c t : The cost/reward vector at time t .
  • A t : The constraints matrix at time t .
  • B t : Captures the inter-period dependencies between decisions at different stages.
  • b t : The resource availability vector at time t .
Since the models created in optimization problems contain a large number of variables and equations, their solution creates complexity. For this reason, many software programs have been developed to facilitate solution [68,70]. In this study, an interface was developed by using Microsoft® VBA 16.0 and solver plug-ins together. In this way, the constraint values are obtained for the dynamic linear programming problem (DLPP) model by recording the number of employees who use the shuttle service provided by the company each day and taking into account the number of passengers over the last four weeks using the moving average method. The next step is to determine the number of vehicles required to minimize fuel costs according to the constraint values updated each week.
For the problem, which resembles a dynamic structure due to the variable constraint values in the problem and which is transformed into an instantaneous static problem using estimation methods, a solution was obtained using the linear programming method. The objective function of the model was obtained as shown in Equation (12), and the decision variables were obtained as shown in Equation (13). The coefficients ( Z i j , B i j , Y i j and A i j ) were obtained by the model analyzing the number of employees who use the shuttle service provided by the company each day and taking into account the number of passengers.
M i n Z = j = 1 2 i = 1 7 112.7 Z i j + 64 B i j + 99.3 Y i j + 56 A i j
  • where
  • i : Day ( i = 1 , 2 , , 7 ).
  • j : Time ( j = 1 , 2 , n ) .
  • V i j : i . day j . time. The number of employees going west.
  • X i j : i . day j . time. The number of employees going east.
  • Y i j : i . day j . time. The number of vehicles with 17 capacity required for east direction.
  • Z i j : i . day j . time. The number of vehicles with 27 capacity required for east direction.
  • A i j : i . day j . time. The number of vehicles with 17 capacity required for west direction.
  • B i j : i . day j . time. The number of vehicles with 27 capacity required for west direction.
X i j 17   Y i j + 27   Z i j   i ,   j   i = 1 , 2     j = 1 , 2 , 3 , , 7 V i j 17   B i j + 27   Z i j   i ,   j   i = 1 , 2     j = 1 , 2 , 3 , , 7 Y i j + A i j 8                   i ,   j   i = 1 , 2     j = 1 , 2 , 3 , , 7 Z i j + B i j 26                 i ,   j   i = 1 , 2     j = 1 , 2 , 3 , , 7 X i j ,   Y i j ,   Z i j ,   V i j ,   A i j ,   B i j 0     i ,   j   i = 1 , 2     j = 1 , 2 , 3 , , 7
In the model, the objective function expressed in Equations (1)–(6) expresses the desire to minimize the cost of fuel consumed as a function of the number of vehicles used in the service network during a week. The constant values given here are calculated according to Table 1 and represent the cost per trip of the vehicle types. In the system constraints, Equation (2) states that the number of passengers traveling in the east direction should be equal to or less than the total capacity of the vehicles to be used in that direction. Equation (3) states that the number of passengers traveling in the west direction should be equal to or less than the vehicle capacity. Equation (12) states that the number of 17 + 1 vehicles to be used in the service network during the day should be less than or equal to 8, while Equations (7)–(10) state that the number of 27 + 1 vehicles should be less than or equal to 26. Finally, the positivity constraint for all variables is expressed in Equations (7)–(10).
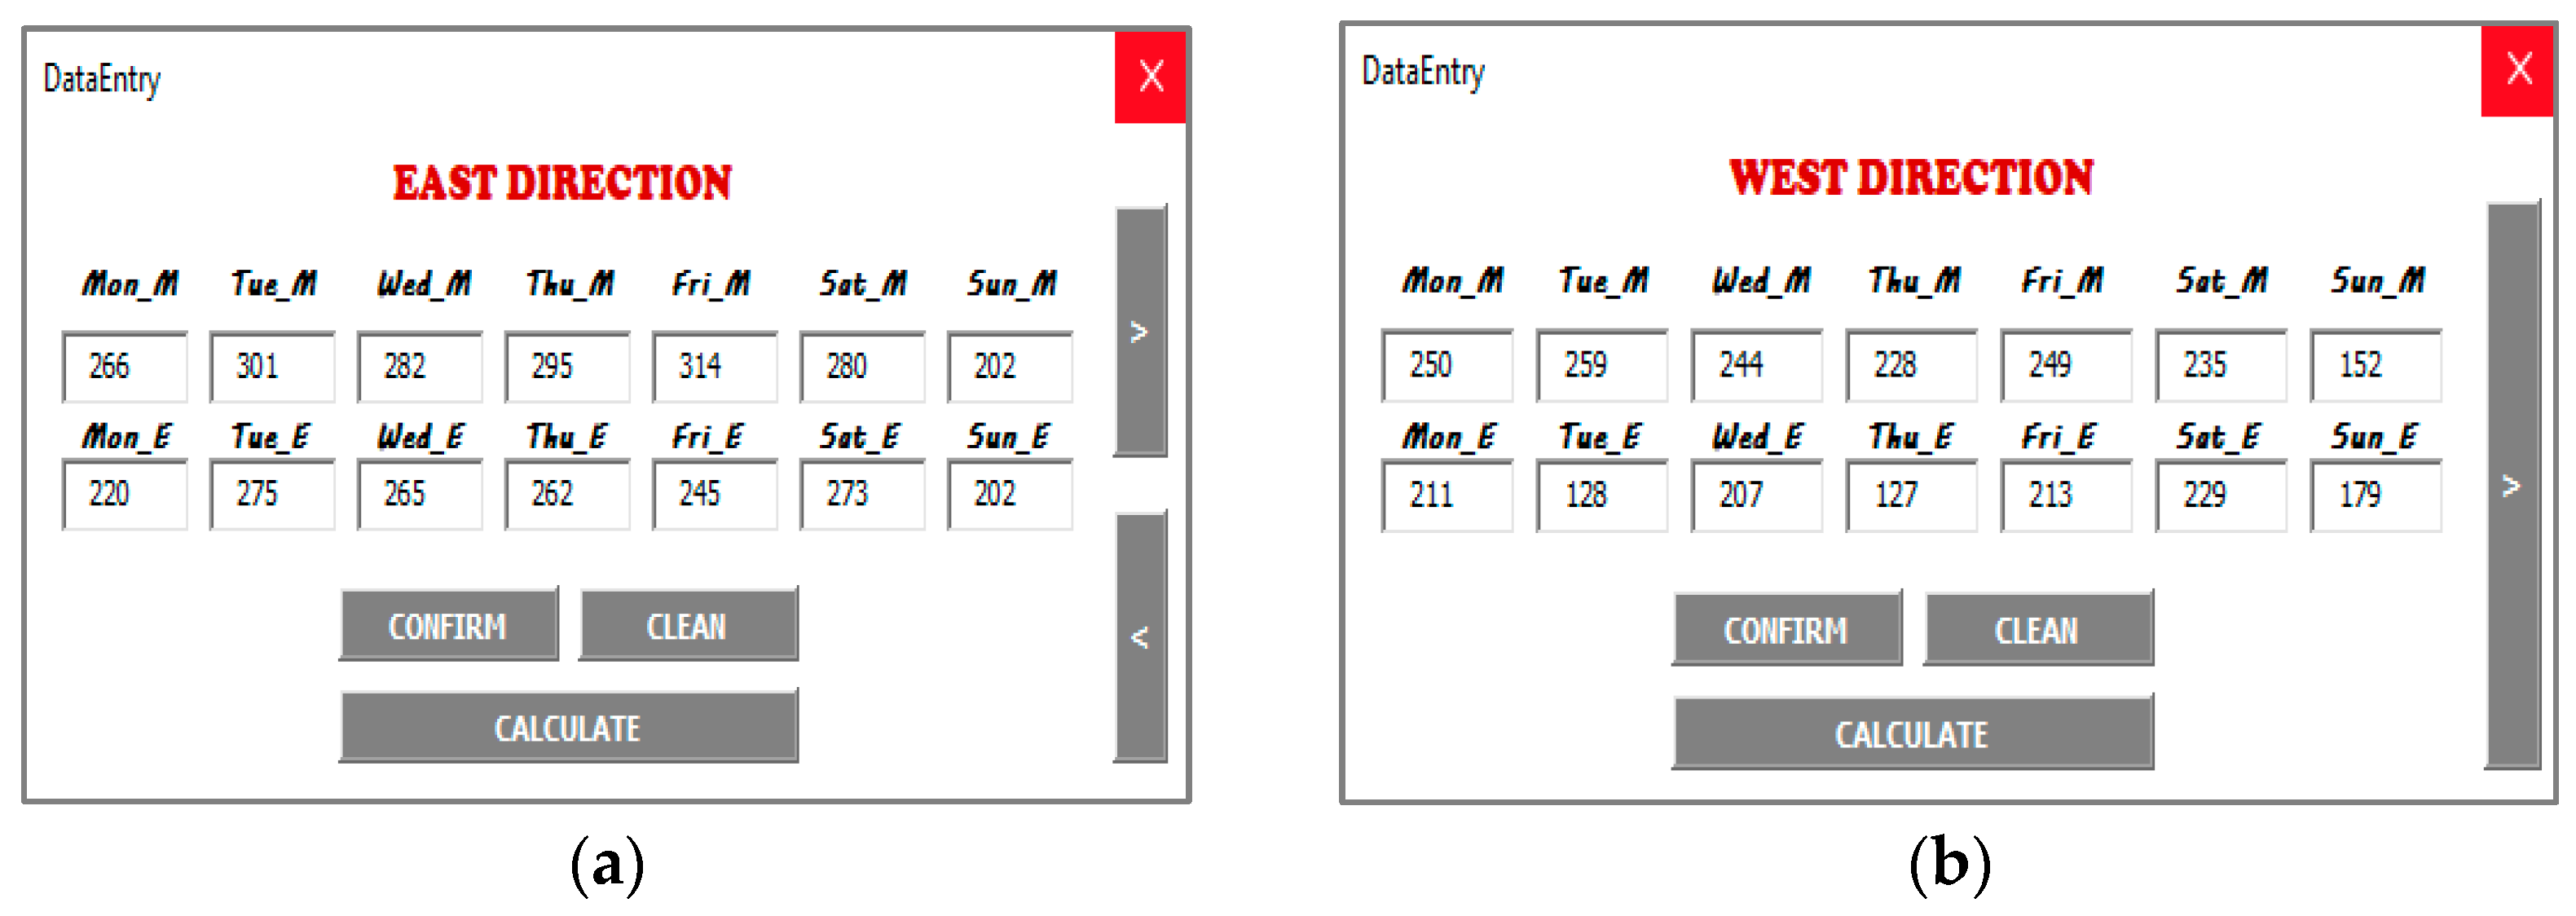
In solving the dynamic linear programming problem, an interface was designed to determine the constraint variables by estimating them for each week to be used by the company on a sustainable basis. When the user accesses the interface shown in Figure 6, he/she is first asked to enter the information regarding the number of employees traveling west into the form. The information entered is transferred to the data page by pressing the ‘Confirm’ button. In order to avoid the lack of information in the data obtained in the current situation, it is limited to confirming the cells without filling them in. A summary scheme of the codes written in the background of the ‘Validate’ button is shown for Algorithm 1 in Figure 7a.
The moving average method is used to determine the variable constraint values. For this reason, the dataset is constantly updated thanks to the data entered using the form, and it contains data for the last four weeks. Using the ‘Calculate’ button on the user form, the average of the data is calculated and transferred to the page where the necessary parameters are defined. The codes written in the background of the ‘Calculate’ button are shown for Algorithm 2 in Figure 7b.
The mathematical model written to solve the problem is written in the background of the ‘Calculate’ button, as shown for Algorithm 3 in Figure 7c. After this stage, the necessary data for the solver are obtained. When the ‘Calculate’ button is clicked on the form, which opens after the data entry forms have been filled in, the solver updates the constraint values according to the last entered data and presents the user with the optimum number of vehicles required for the service network.
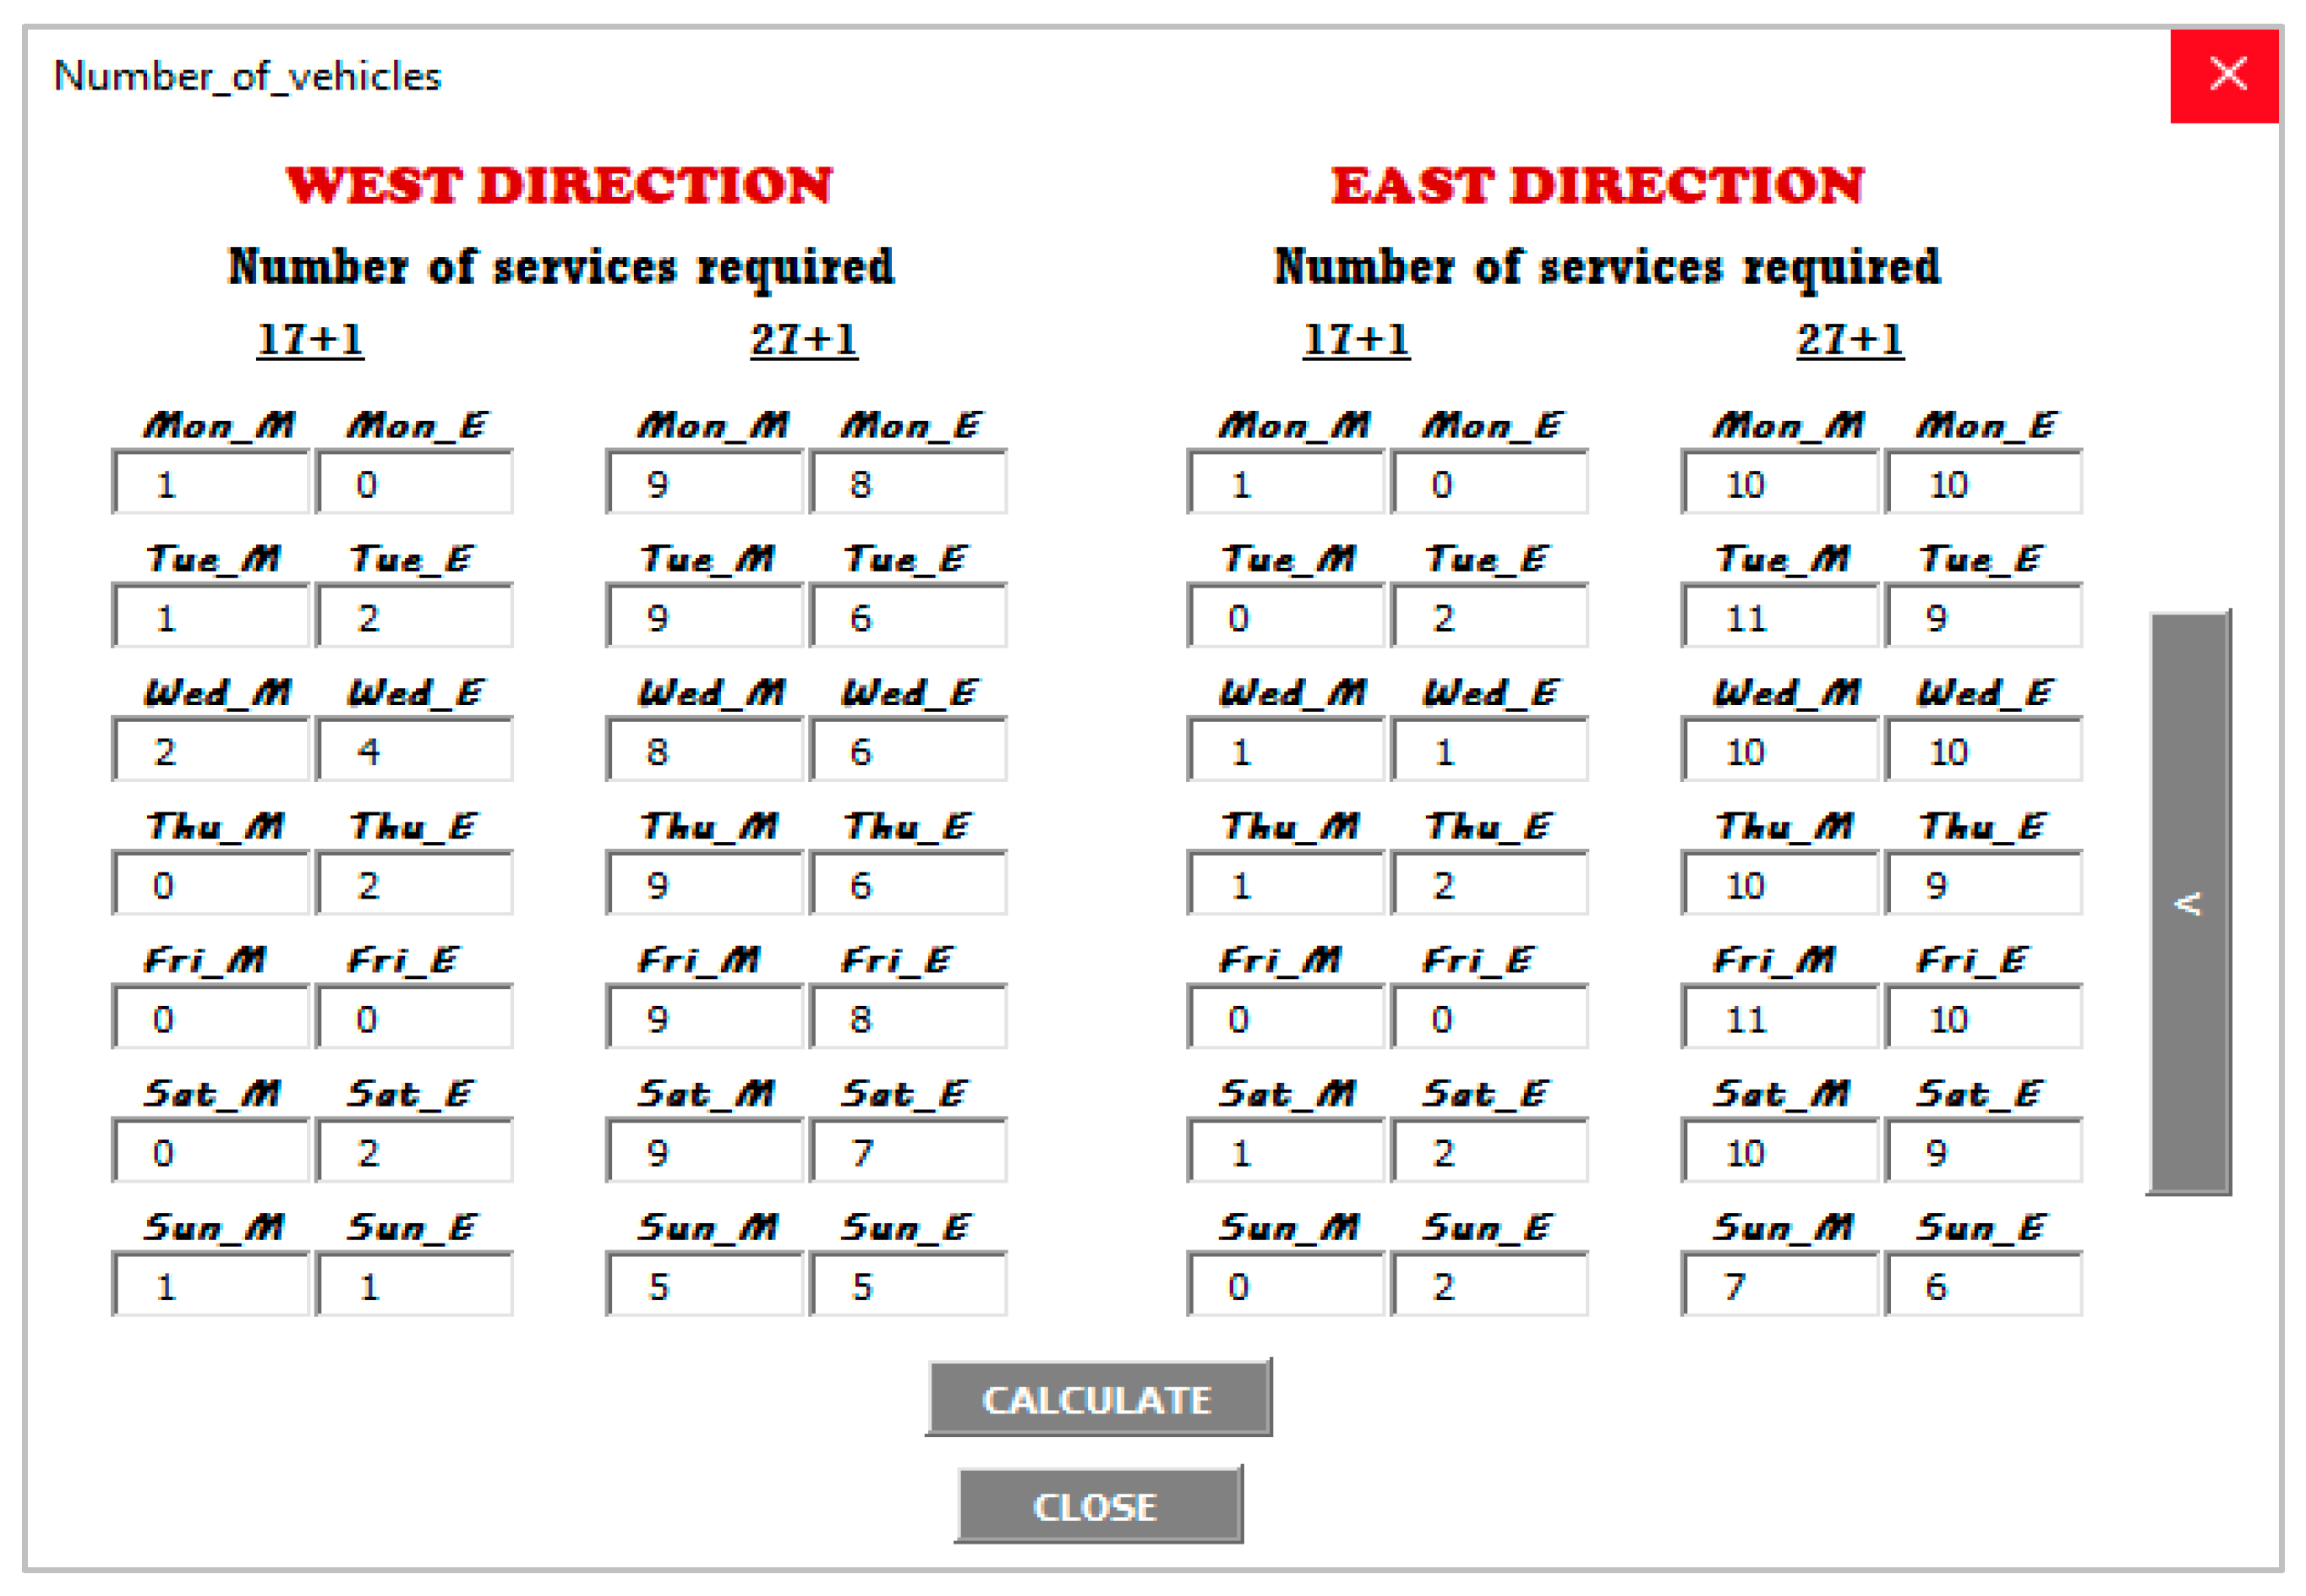
Using the interface visualized in Figure 8, the number of vehicles required to travel in the east and north directions is calculated according to demand after the user has entered the specified parameters.

5. Model Results and Discussion

Examining the results of the proposed model, the average occupancy rate of the company, which currently has thirty-four vehicles, is obtained as shown in Figure 8. It can be seen that this rate increases up to 99% after the optimization carried out with the model proposed in the study.
The maximum number of vehicles to be accommodated in the company was determined by taking into account the maximum number of vehicles needed in the east and west directions in the same period of time—in other words, the maximum number of vehicles operating simultaneously. When analyzing Figure 9, this value for the 17 + 1 capacity vehicle gives the maximum number of 17 + 1 capacity vehicles that should be accommodated within the facility as four westbound vehicles and one eastbound vehicle on Wednesday evening when the maximum demand is at its peak. The maximum number of 27 + 1 capacity vehicles required is determined as a total of twenty vehicles, nine westbound on Tuesday morning and eleven eastbound at the same time. In this case, nine of the thirty-four vehicles allocated to the service network are wasted. This represents a gain of approximately 27% for this case study. Based on the results of the analysis, the value of the objective function as a result of the optimization was found to be USD 1695. This shows that the existing service achieves a 33.9% reduction in fuel costs (Figure 10).
In addition to fuel costs, there are other costs that vary depending on the number of vehicles. One of these is the annual maintenance cost of the vehicles, and another is the annual tax expense. As a result of the optimization, the reduction in the number of vehicles required for the service leads to a reduction in these cost items. According to the results of the analyses, the annual maintenance cost of the vehicles is reduced by 35.2%, while the annual tax cost of the vehicles is reduced by 49.3%. Taking all these positive improvements into account, it is clear that the optimization study leads to a significant reduction in service costs.
It is also clearly seen from the model results that the proposed DLP model significantly enhanced the efficiency and cost effectiveness of the shuttle service at the Yalova Shipyard. The study revealed that the existing shuttle fleet was substantially underutilized, with vehicle occupancy rates averaging between 60 and 70% and sometimes falling below 50%. After implementing the DLP optimization, the occupancy rates improved dramatically, reaching up to almost maximum, demonstrating optimal utilization of the available shuttle capacities. This substantial improvement highlights the DLP model’s effectiveness in aligning shuttle service offerings closely with actual employee transportation needs, thereby eliminating unnecessary costs and ensuring resource-efficient operations. Figure 9 and Figure 10 emphasize the significant economic value provided by the optimized model through the reduction in excess vehicle use. In addition to the economic benefits, the optimized shuttle service contributes to sustainability goals by reducing traffic congestion and lowering carbon emissions, thereby promoting environmental responsibility. Overall, these findings confirm that DLP provides a robust, scalable solution that could be replicated across various industries facing similar logistical and transportation challenges.

6. Conclusions and Suggestions

This study demonstrates the potential of optimizing employee shuttle services through dynamic linear programming (DLP) to enhance transportation efficiency, reduce operational costs and support sustainability. The findings highlight that optimizing fleet composition and scheduling at the Yalova Shipyard significantly reduces fuel consumption (33.9%), maintenance costs (35.2%) and annual tax expenses (49.3%). By removing excess vehicles and improving fleet utilization, the proposed model offers a scalable and adaptable approach to managing large-scale employee transportation networks. Beyond the immediate financial benefits, the research underscores the broader impact on the regional transportation ecosystem. Reducing the number of vehicles on the road contributes to lower traffic congestion, leading to improved commute times and decreased stress for employees. Additionally, a more efficient shuttle service minimizes the reliance on private vehicles, which in turn reduces parking demand and urban sprawl related to transport infrastructure. By lowering fuel consumption and CO2 emissions, the study aligns with global sustainability goals, enhancing air quality and mitigating environmental degradation.
Furthermore, the model presented in the study has strong potential applicability beyond the shipyard context. It can be adapted effectively to various industries facing similar transportation challenges, such as manufacturing plants, corporate campuses, logistics centers and other large-scale employment hubs. The flexibility and scalability of the dynamic linear programming (DLP) method enable it to accommodate diverse fleet compositions, scheduling complexities and dynamic demand fluctuations, making it suitable for broader applications in urban planning and smart transportation systems.
Nevertheless, the implications of this research extend beyond employee mobility. In the field of transportation planning, the study contributes to a growing body of work that advocates for data-driven optimization to improve operational efficiency and reduce environmental impact. Municipal governments and urban planners could adapt similar models to enhance public transit systems, reduce congestion and promote sustainable transport alternatives. Furthermore, the research holds implications for corporate mobility management, offering insights into how businesses can improve employee transportation while simultaneously reducing costs and carbon footprint. Industries with large workforce mobility requirements, such as manufacturing, logistics and construction, could leverage similar approaches to optimize fleet utilization and create cost-effective transport solutions.
From a policy perspective, the proposed methodology could further benefit industries that aim to integrate sustainable practices, including the adoption of electric or autonomous vehicle fleets, thereby supporting broader sustainability and environmental objectives. It may provide empirical evidence supporting incentives for shared transportation, smart mobility integration and fleet electrification. Policymakers could use these findings to design urban mobility strategies that prioritize efficiency and sustainability, potentially influencing tax incentives, emissions regulations and transport funding allocations. Additionally, this research intersects with sustainability studies, as it highlights how optimizing transport services contributes to reducing the environmental impact.
For future work, expanding the dataset and incorporating predictive analytics could further refine demand forecasting, ensuring even greater efficiency. The integration of autonomous and electric vehicle fleets presents another promising direction, aligning employee transportation with emerging green mobility trends. Additionally, exploring mobility as a service (MaaS) integration with other public and private transport options could enhance accessibility and optimize regional transport networks.
In conclusion, this research provides a replicable and sustainable transport model that not only improves cost efficiency but also contributes to the broader objectives of environmental responsibility, traffic reduction and enhanced urban mobility. By implementing similar optimization strategies, industries and municipalities can create more intelligent and sustainable transport solutions, ultimately benefiting both local communities and the global ecosystem.

Author Contributions

Conceptualization, M.M.A., E.S., P.J. and J.M.; methodology, M.M.A., E.S., P.J. and J.M.; software, M.M.A., E.S., P.J. and J.M.; validation, M.M.A., E.S. and J.M.; formal analysis, M.M.A., E.S. and J.M.; investigation, M.M.A., E.S. and J.M.; resources, M.M.A., E.S., P.J. and J.M.; data curation, M.M.A., E.S., P.J. and J.M.; writing—original draft preparation, M.M.A., E.S. and J.M.; writing—review and editing, M.M.A., E.S. and J.M.; visualization, M.M.A., E.S., P.J. and J.M.; supervision, M.M.A., E.S. and J.M.; project administration, J.M.; funding acquisition, E.S. All authors have read and agreed to the published version of the manuscript.

Funding

This research received no external funding.

Institutional Review Board Statement

Not applicable.

Informed Consent Statement

Not applicable.

Data Availability Statement

The data that support the findings of this study are available from the corresponding author upon reasonable request. The data are not publicly available due to privacy.

Acknowledgments

The authors would like to thank the Yalova Shipyard for sharing the employee shuttle service data. The authors would also like to thank T.Erşad ÖKSÜZ and Başak BIYIK for their support with the study.

Conflicts of Interest

The authors declare no conflicts of interest.

References

  1. World Health Organization (WHO). Available online: https://www.who.int (accessed on 28 January 2025).
  2. Türkiye Raporu. Toplumsal Bir Yara: Türkiye’de Trafik Kazaları Raporu 2022. Available online: https://turkiyeraporu.com/arastirma/toplumsal-bir-yara-turkiyede-trafik-kazalari-8929 (accessed on 19 November 2024).
  3. Alzard, M.H.; Maraqa, M.A.; Chowdhury, R.; Khan, Q.; Albuquerque, F.D.B.; Mauga, T.I.; Aljunadi, K.N. Estimation of Greenhouse Gas Emissions Produced by Road Projects in Abu Dhabi, United Arab Emirates. Sustainability 2019, 11, 2367. [Google Scholar] [CrossRef]
  4. Naess, B.; Seppanen, C.; Arunachalam, S.; Dowling, R.G.; Wu, Z.; Fordham, D.; Rouphail, N.M.; Zamurs, J.; The Cadmus Group, Inc. Evaluation of Methods for Modeling Vehicle Activity at Signalized Intersections for Air Quality Hot-Spot Analyses; Federal Highway Administration, Office of Natural Environment: Washington, DC, USA, 2020.
  5. Cui, H.; Qiu, J.; Cao, J.; Guo, M.; Chen, X.; Gorbachev, S. Route Optimization in Township Logistics Distribution Considering Customer Satisfaction Based on Adaptive Genetic Algorithm. Math. Comput. Simul. 2023, 204, 28–42. [Google Scholar] [CrossRef]
  6. Jiang, H.; Yao, Z.; Zhang, Y.; Jiang, Y.; He, Z. Pedestrian Shuttle Service Optimization for Autonomous Intersection Management. Transp. Res. Part C Emerg. Technol. 2024, 163, 104623. [Google Scholar] [CrossRef]
  7. Wu, M.; Yu, C.; Ma, W.; An, K.; Zhong, Z. Joint Optimization of Timetabling, Vehicle Scheduling, and Ride-Matching in a Flexible Multi-Type Shuttle Bus System. Transp. Res. Part C Emerg. Technol. 2022, 139, 103657. [Google Scholar] [CrossRef]
  8. Dai, Z.; Cathy Liu, X.; Li, H.; Wang, M.; Ma, X. Semi-Autonomous Bus Platooning Service Optimization with Surrogate Modeling. Comput. Ind. Eng. 2023, 175, 108838. [Google Scholar] [CrossRef]
  9. Oikonomou, M.; Sekadakis, M.; Katrakazas, C.; Hillebrand, J.; Vlahogianni, E.; Yannis, G. Traffic & Environmental Impact Assessment under Distinct Operational Speeds for Automated Shuttle Bus Services. Transp. Res. Procedia 2023, 72, 517–524. [Google Scholar] [CrossRef]
  10. Lv, D.; Zhang, W.; Wang, K.; Hao, H.; Yang, Y. Urban Aerial Mobility for Airport Shuttle Service. Transp. Res. Part A Policy Pract. 2024, 188, 104202. [Google Scholar] [CrossRef]
  11. Xu, Z.; Zheng, N. Integrating Connected Autonomous Shuttle Buses as an Alternative for Public Transport—A Simulation-Based Study. Multimodal Transp. 2024, 3, 100133. [Google Scholar] [CrossRef]
  12. Jędrzejczyk, W. Sharing Economy—Access Is Better Than Ownership: Owning a Car vs. Using the Services of Companies Providing Passenger Transport. Procedia Comput. Sci. 2024, 246, 5205–5213. [Google Scholar] [CrossRef]
  13. Anund, A.; Ludovic, R.; Caroleo, B.; Hardestam, H.; Dahlman, A.; Skogsmo, I.; Nicaise, M.; Arnone, M. Lessons Learned from Setting up a Demonstration Site with Autonomous Shuttle Operation—Based on Experience from Three Cities in Europe. J. Urban Mobil. 2022, 2, 100021. [Google Scholar] [CrossRef]
  14. Solaymani, S. CO2 Emissions Patterns in 7 Top Carbon Emitter Economies: The Case of Transport Sector. Energy 2019, 168, 989–1001. [Google Scholar] [CrossRef]
  15. Caban, J.; Vrabel, J.; Górnicka, D.; Nowak, R.; Jankiewicz, M.; Matijošius, J.; Palka, M. Overview of Energy Harvesting Technologies Used in Road Vehicles. Energies 2023, 16, 3787. [Google Scholar] [CrossRef]
  16. Characterizing CO2 and NOx Emission of Vehicles Crossing Toll Stations in Highway. Available online: https://colab.ws/articles/10.1016%2Fj.trd.2023.104024 (accessed on 28 January 2025).
  17. Lu, C.; Xie, D.-F.; Zhao, X.-M.; Qu, X. The Role of Alternative Fuel Buses in the Transition Period of Public Transport Electrification in Europe: A Lifecycle Perspective. Int. J. Sustain. Transp. 2022, 17, 626–638. [Google Scholar] [CrossRef]
  18. Caban, J.; Małek, A.; Šarkan, B. Strategic Model for Charging a Fleet of Electric Vehicles with Energy from Renewable Energy Sources. Energies 2024, 17, 1264. [Google Scholar] [CrossRef]
  19. Roy, A.; McCabe, B.Y.; Saxe, S.; Posen, I.D. Review of Factors Affecting Earthworks Greenhouse Gas Emissions and Fuel Use. Renew. Sustain. Energy Rev. 2024, 194, 114290. [Google Scholar] [CrossRef]
  20. Downs, A. Still Stuck in Traffic: Coping with Peak-Hour Traffic Congestion; Brookings Institution Press: Washington, DC, USA, 2005; ISBN 978-0-8157-9655-8. [Google Scholar]
  21. Wu, X.; Zhang, Y.; Chen, Y. A Dynamic Programming Model for Joint Optimization of Electric Drayage Truck Operations and Charging Stations Planning at Ports. IEEE Trans. Intell. Transp. Syst. 2023, 24, 11710–11719. [Google Scholar] [CrossRef]
  22. Kim, S.; Kwak, M. Customer Complaint Analysis via Review-Based Control Charts and Dynamic Importance–Performance Analysis. Appl. Sci. 2023, 13, 5991. [Google Scholar] [CrossRef]
  23. Rotaris, L.; Danielis, R. Commuting to College: The Effectiveness and Social Efficiency of Transportation Demand Management Policies. Transp. Policy 2015, 44, 158–168. [Google Scholar] [CrossRef]
  24. Batur, I.; Koç, M. A Review of System Dynamics Applications in Sustainable Urban Transportation. In Proceedings of the European Conference on Sustainability, Energy & the Environment 2017 Official Conference Proceedings, Brighton, UK, 7–9 July 2017; pp. 1–11. [Google Scholar]
  25. Piras, F.; Sottile, E.; Meloni, I. Modal Share Change Following Implementation of Travel Demand Management Strategies. Transp. Res. Rec. 2018, 2672, 731–741. [Google Scholar] [CrossRef]
  26. Cumming, I.; Weal, Z.; Afzali, R.; Rezaei, S.; Idris, A.O. The Impacts of Office Relocation on Commuting Mode Shift Behaviour in the Context of Transportation Demand Management (TDM). Case Stud. Transp. Policy 2019, 7, 346–356. [Google Scholar] [CrossRef]
  27. Rosenfield, A.; Attanucci, J.P.; Zhao, J. A Randomized Controlled Trial in Travel Demand Management. Transportation 2020, 47, 1907–1932. [Google Scholar] [CrossRef]
  28. Bahrami, S.; Vignon, D.; Yin, Y.; Laberteaux, K. Parking Management of Automated Vehicles in Downtown Areas. Transp. Res. Part C Emerg. Technol. 2021, 126, 103001. [Google Scholar] [CrossRef]
  29. Ku Do Kim, J.; Yu, Y.; Kim, S.; Lee, S.; Lee, S. Assessment of Eco-Friendly Effects on Green Transportation Demand Management. Chem. Eng. Trans. 2021, 89, 121–126. [Google Scholar] [CrossRef]
  30. Farahmand, Z.H.; Gkiotsalitis, K.; Geurs, K.T. Mobility-as-a-Service as a Transport Demand Management Tool: A Case Study among Employees in the Netherlands. Case Stud. Transp. Policy 2021, 9, 1615–1629. [Google Scholar] [CrossRef]
  31. Bucchiarone, A.; Bassanelli, S.; Luca, M.; Centellegher, S.; Cipriano, P.; Giovannini, L.; Lepri, B.; Marconi, A. An End-to-End Solution for Facilitating Urban Cyclability. Trans. Intell. Transport. Syst. 2023, 24, 15830–15843. [Google Scholar] [CrossRef]
  32. Ghafelebashi, A.; Razaviyayn, M.; Dessouky, M. Congestion Reduction via Personalized Incentives. Transp. Res. Part C Emerg. Technol. 2023, 152, 104153. [Google Scholar] [CrossRef]
  33. Vega-Gonzalo, M.; Gomez, J.; Christidis, P.; Manuel Vassallo, J. The Role of Shared Mobility in Reducing Perceived Private Car Dependency. Transp. Res. Part D Transp. Environ. 2024, 126, 104023. [Google Scholar] [CrossRef]
  34. Zong, F.; Zeng, M.; Yu, P. A Parking Pricing Scheme Considering Parking Dynamics. Transportation 2024, 51, 1349–1371. [Google Scholar] [CrossRef]
  35. Maghrour Zefreh, M.; Torok, A. Theoretical Comparison of the Effects of Different Traffic Conditions on Urban Road Traffic Noise. J. Adv. Transp. 2018, 2018, 7949574. [Google Scholar] [CrossRef]
  36. Maghrour Zefreh, M.; Torok, A. Single Loop Detector Data Validation and Imputation of Missing Data. Measurement 2018, 116, 193–198. [Google Scholar] [CrossRef]
  37. Ribeiro, P.J.G.; Dias, G.; Mendes, J.F.G. Public Transport Decarbonization: An Exploratory Approach to Bus Electrification. World Electr. Veh. J. 2024, 15, 81. [Google Scholar] [CrossRef]
  38. Chen, G.; Zhang, Q.; He, Q.; Shi, Y.; Wang, B.; Dong, R.; Sun, Y.; Zhang, X.; Xu, Z.; Liu, B. Unveiling the Heterogeneity of Commuters’ Travel Mode Change in Different Cities and Their Sensitivity to Incentives. ATS 2024, 62, 139–158. [Google Scholar]
  39. Petrunoff, N.; Wen, L.M.; Rissel, C. Effects of a Workplace Travel Plan Intervention Encouraging Active Travel to Work: Outcomes from a Three-Year Time-Series Study. Public Health 2016, 135, 38–47. [Google Scholar] [CrossRef] [PubMed]
  40. Eriksson, L.; Friman, M.; Gärling, T. Perceived Attributes of Bus and Car Mediating Satisfaction with the Work Commute. Transp. Res. Part A Policy Pract. 2013, 47, 87–96. [Google Scholar] [CrossRef]
  41. Carapellucci, F.; Conti, V.; Lelli, M.; Liberto, C.; Orchi, S.; Valenti, G.; Valentini, M.P. Tools and Methodologies for the Analysis of Home-to-Work Shuttle Service Impacts: The ENEA “Casaccia” Case Study. Future Transp. 2023, 3, 901–917. [Google Scholar] [CrossRef]
  42. Yang, L.; Li, X.; Zhong, N. Omnichannel Retail Operations with Mixed Fulfillment Strategies. Int. J. Prod. Econ. 2022, 254, 108608. [Google Scholar] [CrossRef]
  43. Wang, F.; Zhang, H.; Zhou, A. A Particle Swarm Optimization Algorithm for Mixed-Variable Optimization Problems. Swarm Evol. Comput. 2021, 60, 100808. [Google Scholar] [CrossRef]
  44. Alimoradi, M.; Azgomi, H.; Asghari, A. Trees Social Relations Optimization Algorithm: A New Swarm-Based Metaheuristic Technique to Solve Continuous and Discrete Optimization Problems. Math. Comput. Simul. 2022, 194, 629–664. [Google Scholar] [CrossRef]
  45. Altekin, F.T.; Bukchin, Y. A Multi-Objective Optimization Approach for Exploring the Cost and Makespan Trade-off in Additive Manufacturing. Eur. J. Oper. Res. 2022, 301, 235–253. [Google Scholar] [CrossRef]
  46. Ha, Q.M.; Deville, Y.; Pham, Q.D.; Hà, M.H. On the Min-Cost Traveling Salesman Problem with Drone. Transp. Res. Part C Emerg. Technol. 2018, 86, 597–621. [Google Scholar] [CrossRef]
  47. Islam, M.R.; Mahmud, M.R.; Pritom, R.M. Transportation Scheduling Optimization by a Collaborative Strategy in Supply Chain Management with TPL Using Chemical Reaction Optimization. Neural Comput. Appl. 2020, 32, 3649–3674. [Google Scholar] [CrossRef]
  48. Mirzahossein, H.; Zargari, S.A. A Combined Model of Congestion Toll Pricing Based on System Optimization with Minimum Toll. Teh. Vjesn. 2018, 25, 1162–1168. [Google Scholar] [CrossRef]
  49. Gibson, E.; Deo, S.; Jónasson, J.O.; Kachule, M.; Palamountain, K. Redesigning Sample Transportation in Malawi Through Improved Data Sharing and Daily Route Optimization. Manuf. Serv. Oper. Manag. 2023, 25, 1209–1226. [Google Scholar] [CrossRef]
  50. Aydın, M.M. The Modeling of Effective Parameters on Public Bus Passengers’ Boarding Time Prediction. J. Eng. Res. 2021, 10, 1–16. [Google Scholar] [CrossRef]
  51. Jiang, Z.; Chen, Y.; Li, X.; Li, B. A Heuristic Optimization Approach for Multi-Vehicle and One-Cargo Green Transportation Scheduling in Shipbuilding. Adv. Eng. Inform. 2021, 49, 101306. [Google Scholar] [CrossRef]
  52. Zhao, C.; Tang, J.; Gao, W.; Zeng, Y.; Li, Z. Many-Objective Optimization of Multi-Mode Public Transportation under Carbon Emission Reduction. Energy 2024, 286, 129627. [Google Scholar] [CrossRef]
  53. Dantzig, G.B. Linear Programming and Extensions; Princeton University Press: Princeton, NJ, USA, 1998; 656p, ISBN 978-0-691-05913-6. Available online: https://press.princeton.edu/books/paperback/9780691059136/linear-programming-and-extensions?srsltid=AfmBOooXVS9g5koilVcXR-1vM3eLID5k8XvnnDd0letMo7fulNB3g0qO (accessed on 19 April 2025).
  54. Panneerselvam, R. Operations Research, 3rd ed.; PHI Learning: Delhi, India, 2023; 640p, ISBN 978-93-5443-789-2. Available online: https://www.phindia.com/Books/BookDetail/9789354437892/operations-research-panneerselvam?srsltid=AfmBOoo5gWZgZWArNULm_Y3wGmGxBmhvPn2G-52Zoue8rO1yLTqiwXrC (accessed on 19 April 2025).
  55. Lähdeaho, O.; Hilmola, O.-P. An Exploration of Quantitative Models and Algorithms for Vehicle Routing Optimization and Traveling Salesman Problems. Supply Chain Anal. 2024, 5, 100056. [Google Scholar] [CrossRef]
  56. Yalçındağ, S. Employee shuttle bus routing problem. Mugla J. Sci. Technol. 2020, 6, 105–111. [Google Scholar] [CrossRef]
  57. Xiong, J.; Chen, B.; Li, X.; He, Z.; Chen, Y. Demand responsive service-based optimization on flexible routes and departure time of community shuttles. Sustainability 2020, 12, 897. [Google Scholar] [CrossRef]
  58. Yan, S.; Tseng, C.H. A passenger demand model for airline flight scheduling and fleet routing. Comput. Oper. Res. 2002, 29, 1559–1581. [Google Scholar] [CrossRef]
  59. Federal Highway Administration (FHWA). Mitigating Traffic Congestion-The Role of Demand-Side Strategies; Report No. FHWA-HOP-05-001; The Association for Commuter Transportation: Washington, DC, USA, October 2004. Available online: https://ops.fhwa.dot.gov/publications/mitig_traf_cong/index.htm (accessed on 19 April 2025).
  60. Frieß, N.M.; Pferschy, U. Planning a zero-emission mixed-fleet public bus system with minimal life cycle cost. Public Transp. 2024, 16, 39–79. [Google Scholar] [CrossRef]
  61. Wei, M.; Yang, C.; Liu, T. An integrated multi-objective optimization for dynamic airport shuttle bus location, route design and departure frequency setting problem. Int. J. Environ. Res. Public Health 2022, 19, 14469. [Google Scholar] [CrossRef]
  62. Liu, Y.; Luo, X.; Wei, X.; Yu, Y.; Tang, J. Robust optimization model for single line dynamic bus dispatching. Sustainability 2021, 14, 73. [Google Scholar] [CrossRef]
  63. Čižiūnienė, K.; Matijošius, J.; Liebuvienė, J.; Sokolovskij, E. Comparison of the Relative Importance of Factors Affecting the Conveyance of Bulk and Liquid Cargo. Appl. Sci. 2024, 14, 1151. [Google Scholar] [CrossRef]
  64. Matijošius, J.; Čižiūnienė, K.; Liebuvienė, J.; Sokolovskij, E. Research Determining the Priority Order of Forces Acting on a Vehicle Transporting Logs. Appl. Sci. 2023, 13, 6174. [Google Scholar] [CrossRef]
  65. Bertsekas, D. Dynamic Programming and Optimal Control: Volume I; Athena Scientific: Nashua, NH, USA, 2012; Volume 4. [Google Scholar]
  66. Toth, P.; Vigo, D. (Eds.) Vehicle Routing: Problems, Methods, and Applications, 2nd ed.; SIAM: Philadelphia, PA, USA, 2014; Available online: https://epubs.siam.org/doi/book/10.1137/1.9781611973594 (accessed on 19 April 2025).
  67. Ghaemi, Z.; Tran, T.T.; Smith, A.D. Comparing classical and metaheuristic methods to optimize multi-objective operation planning of district energy systems considering uncertainties. Appl. Energy 2022, 321, 119400. [Google Scholar] [CrossRef]
  68. Kozłowski, E.; Antosz, K.; Sęp, J.; Prucnal, S. Integrating Sensor Systems and Signal Processing for Sustainable Production: Analysis of Cutting Tool Condition. Electronics 2023, 13, 185. [Google Scholar] [CrossRef]
  69. Majerek, D.; Rymarczyk, T.; Wójcik, D.; Kozłowski, E.; Rzemieniak, M.; Gudowski, J.; Gauda, K. Machine Learning and Deterministic Approach to the Reflective Ultrasound Tomography. Energies 2021, 14, 7549. [Google Scholar] [CrossRef]
  70. Gill, A. Optimisation of the Technical Object Maintenance System Taking Account of Risk Analysis Results. EiN 2017, 19, 420–431. [Google Scholar] [CrossRef]
Figure 1. Location and real site image of the Yalova Shipyard.
Applsci 15 04604 g001
Figure 2. Current passenger service system in the Yalova Shipyard.
Applsci 15 04604 g002
Figure 3. Content and size of the dataset.
Applsci 15 04604 g003
Figure 4. Daily change in passenger numbers at the stops over a week.
Applsci 15 04604 g004
Figure 5. Average occupancy rate of services by days.
Applsci 15 04604 g005
Figure 6. Data entry form: (a) East direction; (b) West direction.
Applsci 15 04604 g006
Figure 7. Algorithms for data inputs and calculations: (a) Algorithm 1, (b) Algorithm 2 and (c) Algorithm 3.
Applsci 15 04604 g007
Figure 8. Number of vehicles required for the service network.
Applsci 15 04604 g008
Figure 9. Comparison of vehicle occupancy rate after optimization.
Applsci 15 04604 g009
Figure 10. Cost analysis for the suggested system.
Applsci 15 04604 g010
Table 1. Some studies on transportation demand management in the literature.
ReferenceContent of the StudyStrategy
Rotaris and Danielis [23]Reducing private car use at university using transport demand management
  • Parking pricing
  • Annual parking permit
  • Public transport promotion
  • Service usage
Batur and Koç [24]Simulation of the change in traffic density with the implementation of selected travel management strategies
  • Workplace travel planning
  • Personalized travel planning
  • School travel planning
  • Car sharing
Piras et al. [25]Developing voluntary travel behavior change programs for urban mobility using transport demand management
  • Personalized travel plans
  • Promoting public transport
  • Mass communication
Cumming et al. [26]Reducing traffic congestion and parking pressure caused by commuting to work
  • Carpooling programs
  • Public transport promotion
  • Non-motorized transportation
Rosenfield et al. [27]Aims to reduce parking demand in an urban workplace
  • Informational campaign
  • Monetary incentives
Wu et al. [21]Dynamic optimization strategies for ride services
  • Surge pricing
  • Commission rate
  • Incentives
Bahrami et al. [28]Parking management of automated vehicles in downtown areas
  • Automated vehicles
  • Wardrop equilibrium
  • Time-based toll
Ku et al. [29]A public-transport-focused study for an environmentally friendly city
  • Increasing parking fees
  • Expanding shared bicycles
  • Restricting the operation of fifth-grade vehicles
Farahmand et al. [30]A case study in transport demand management policy for employees in the Netherlands
  • Car sharing
  • E-bike sharing
  • Mobility as a service
Bucchiarone et al. [31]A study on sustainable mobility from home to work targeting public and private employees
  • BIKE2WORK
  • End-to-end solution,
Ghafelebashi et al. [32]Congestion reduction via personalized incentives
  • Price plans
  • Personalized incentives
Vega-Gonzalo et al. [33]Examining the role of shared mobility in reducing private vehicle dependency
  • Shared mobility
  • Car sharing
  • Moped sharing
Table 2. Part of the dataset for a random date.
Data Registration NumberObserved DateObserved TimeLicensed Plate NoBus Stop IDBus Capacity
11 December 2023Morning0034West_127
2Morning4268East_427
3Morning4052East_427
4Morning0034West_127
5Morning4052East_427
6Morning4052East_427
7Morning0034West_127
8Morning0034West_127
9Morning4132East_227
10Morning4090East_227
11Morning4100East_327
12Morning4262East_527
13Morning4100East_327
14Morning4090East_227
15Morning4013East_327
16Morning4125West_317
17Morning4048East_127
18Morning4125West_317
19Morning4187East_327
20Morning4054East_317
21Morning0111West_327
22Morning4048East_127
23Morning4268West_327
24Morning4262East_527
7711 December 2023Evening0034West_127
772Evening4217East_327
773Evening4052East_527
774Evening0102West_227
775Evening0034West_127
776Evening0208West_227
777Evening4098East_127
778Evening4025East_117
779Evening0034West_127
780Evening4052East_127
781Evening4262East_427
782Evening4098East_127
783Evening0250West_227
784Evening4268East_427
785Evening4013East_327
786Evening4100East_327
787Evening4013East_327
Table 3. An example shuttle service for a random day.
Time of DayWest DirectionEast Direction
Plate NoBus CapacityOccupancy/(%)Plate NoBus CapacityOccupancy/(%)
Morning00342714/(52)40251714/(52)
00022717/(63)4054177/(41)
00202728/(104)40902716/(59)
00821716/(94)41322715/(56)
01022727/(100)42891712/(71)
01112722/(81)40132727/(100)
02082723/(85)4022275/(19)
0250279/(33)40482716/(59)
02981712/(71)40522719/(70)
03262726/(96)40982718/(67)
03701717/(100)41002726/(96)
50901717/(100)4168275/(19)
41251716/(94)41872716/(59)
42172710/(37)
42622717/(63)
42682720/(74)
Evening00342712/(71)40251711/(65)
00022712/(71)4054175/(29)
00202724/(89)40902721/(78)
00821714/(82)41322710/(37)
01022727/(100)42891716/(94)
01112727/(100)40132720/(74)
02082728/(104)40222717/(63)
02502717/(63)40482720/(74)
02981715/(88)40982722/(81)
03262717/(63)41002725/(93)
03701710/(59)41682724/(89)
50901717/(100)41872712/(44)
4125173/(18)42172718/(67)
4262277/(26)
40522720/(74)
42682725/(93)
Table 4. Costs per vehicle used in the shuttle system.
Vehicle TypeFuel Consumption
(per km)
Monthly Maintenance and Repair Expenses (TL)All Other Annual Expenses (TL)
17 + 1USD 0.13USD 71.5USD 668.3
27 + 1USD 0.16USD 92.7USD 899.4
Table 5. The performance comparison of DLP and other optimization methods [65,66,67,68].
CriteriaMethod
Dynamic Linear ProgrammingOptimization Methods
OptimalityExcellentApproximate
Sequential decision-making suitabilityExcellentModerate
Handling linear/structured constraintsExcellentLimited
Robustness in fleet allocation problemsHighModerate
Computational predictabilityHighMedium/low
Ease of parameter tuningSimpleModerate/complex
Disclaimer/Publisher’s Note: The statements, opinions and data contained in all publications are solely those of the individual author(s) and contributor(s) and not of MDPI and/or the editor(s). MDPI and/or the editor(s) disclaim responsibility for any injury to people or property resulting from any ideas, methods, instructions or products referred to in the content.