Article

Evaluation of Achillea millefolium var. Paprika Extract with Antioxidant, Antimicrobial, and Skin Protection Potential in Topical Application

by
Monika Michalak
1,*,
Martyna Zagórska-Dziok
2,
Paulina Żarnowiec
3,
Anita Bocho-Janiszewska
4,
Małgorzata Stryjecka
5,
Dorota Kostrzewa
6,
Natalia Dobros
7 and
Katarzyna Paradowska
7
1
Department of Pharmaceutical Sciences, Collegium Medicum, Jan Kochanowski University, IX Wieków Kielc 19, 35-317 Kielce, Poland
2
Department of Technology of Cosmetic and Pharmaceutical Products, Medical College, University of Information Technology and Management in Rzeszów, Sucharskiego 2, 35-225 Rzeszów, Poland
3
Department of Microbiology, Faculty of Natural Sciences, Jan Kochanowski University, Uniwersytecka 7, 25-406 Kielce, Poland
4
Faculty of Apfplied Chemistry, Casimir Pulaski Radom University, ul. Chrobrego 27, 26-600 Radom, Poland
5
Department of Dietetics, The University College of Applied Sciences in Chełm, Pocztowa 54, 22-100 Chełm, Poland
6
Łukasiewicz Research Network—New Chemical Syntheses Institute, Al. Tysiąclecia Państwa Polskiego 13A, 24-110 Puławy, Poland
7
Department of Organic and Physical Chemistry, Faculty of Pharmacy, Medical University of Warsaw, Banacha 1, 02-097 Warsaw, Poland
*
Author to whom correspondence should be addressed.
Appl. Sci. 2025, 15(9), 4631; https://doi.org/10.3390/app15094631
Submission received: 8 March 2025 / Revised: 8 April 2025 / Accepted: 18 April 2025 / Published: 22 April 2025

Abstract

:
Yarrow has long been known as a medicinal plant and has recently been gaining in importance as a cosmetic plant. The purpose of the study was to perform a phytochemical evaluation of extracts from yarrow herb of the Paprika cultivar, which has not previously been studied in this regard, and to determine its protective, antioxidant, and antimicrobial properties. Comparative analysis of two types of extracts, obtained by ultrasound-assisted extraction (UAE) and supercritical fluid extraction (SFE), showed that the former had higher content of bioactive compounds, including polyphenols, flavonoids, phenolic acids, and condensed tannins, as well as better antioxidant properties, as determined by spectrophotometric methods (DPPH and FRAP). The biological properties of the water–ethanol yarrow herb extract obtained by UAE was tested in vitro on 15 microbial strains (14 bacterial strains and one fungal strain), as well as on two lines of skin cells: HaCaT keratinocytes and HDF fibroblasts. In addition, the sun protection factor and rheological characteristics of a model cosmetic cream based on the extract were determined. Yarrow extract was shown to exhibit a number of important activities for cosmetic ingredients, including antimicrobial, antioxidant, photoprotective, and anti-ageing activity. The results of the study indicate that this material has potential applications in cosmetics, e.g., in products for mature skin with signs of ageing such as wrinkles or hyperpigmentation.

1. Introduction

Yarrow is a perennial of the family Asteraceae that grows to a height of 80 cm. It is native to regions with a temperate climate in the northern hemisphere (Europe, Asia, and North America). It blooms from June to October [1,2]. Its umbrella-shaped inflorescence consists of white, yellow, orange, pink, red, or purple flowers, depending on the variety. The “Paprika” cultivar has bright red flowers with yellow centres, which change colour during their development (Figure 1).
Yarrow contains essential oil (containing compounds such as camphene, α- and β-pinene, limonene, camphor, and linalool), flavonoids (e.g., caffeic acid, quercetin, apigenin, rutin, lutein, morin, myricetin, naringin, naringenin, achillinin A, and millifolide A, B, and C), coumarin, sesquiterpene lactones, polyacetylenes, triterpenes, tannins, sterols, and organic acids [1,2,3]. Therapeutic effects are attributed to both the herb (Millefolii herba) and its flower (Millefolii flos), and the raw plant parts exhibit multi-faceted biological activity. Various parts of the plant have been used in traditional medicine as material with diaphoretic, astringent, tonic, stimulating, hepatoprotective, antimicrobial, and anti-inflammatory effects [1,3,4]. It has been recommended for conditions such as cough, flu, kidney stones, hypertension, menstrual disorders, rheumatoid arthritis, gout, degenerative joint disease, cystitis, diabetes, and indigestion [3,4,5]. Decoctions have been used to treat haemorrhoids and headaches. This application is associated with the content of alkaloids in yarrow leaves, as they exhibit anti-inflammatory and analgesic activity [1]. Antioxidant and anti-aggregation effects are ascribed to the flavonoid glycosides contained in yarrow [2]. A standardized aqueous herb extract exerts antispasmodic effects and can be used to treat stomach problems [6]. Externally, it can be used as a sitz bath for gynaecological disorders [1]. Yarrow is also an interesting material for external skin care and medicinal applications. According to the Cosmetic Ingredient Review Expert Panel, A. millefolium flower extract and flower/leaf/stem extract are safe for use in hypoallergenic cosmetics [7]. According to the current database of cosmetic ingredients (CosIng) [8], A. millefolium is one of the two species of the genus Achillea used as an active ingredient in cosmetic formulations, along with A. asiatica. Yarrow is used as a skin-rejuvenating, anti-seborrheic, cleansing, refreshing, soothing, and tonic agent, as well as a skin conditioner, humectant, and fragrance ingredient [3,7]. The European Medicines Agency (EMA) monograph on Millefolii herba describes therapeutic indications for its topical use in small superficial epidermal excoriation, as well as in the symptomatic treatment of minor skin inflammations, such as sunburn and mucosal lesions, and in the healing of minor wounds [9]. In addition, literature reports indicate that A. millefolium is recommended for slow-healing wounds and for dermatological conditions such as eczema, psoriasis, and boils [4,5,8].
The aim of the present study was to analyse the chemical composition and the protective, antioxidant, and antimicrobial properties of extracts of yarrow herb of the “paprika” cultivar, which has not previously been studied in this regard. In addition, the sun protection factor of a model formulation based on the extract, as well as the rheological characterisation of the formulation, which determines its potential applications, was conducted.

2. Materials and Methods
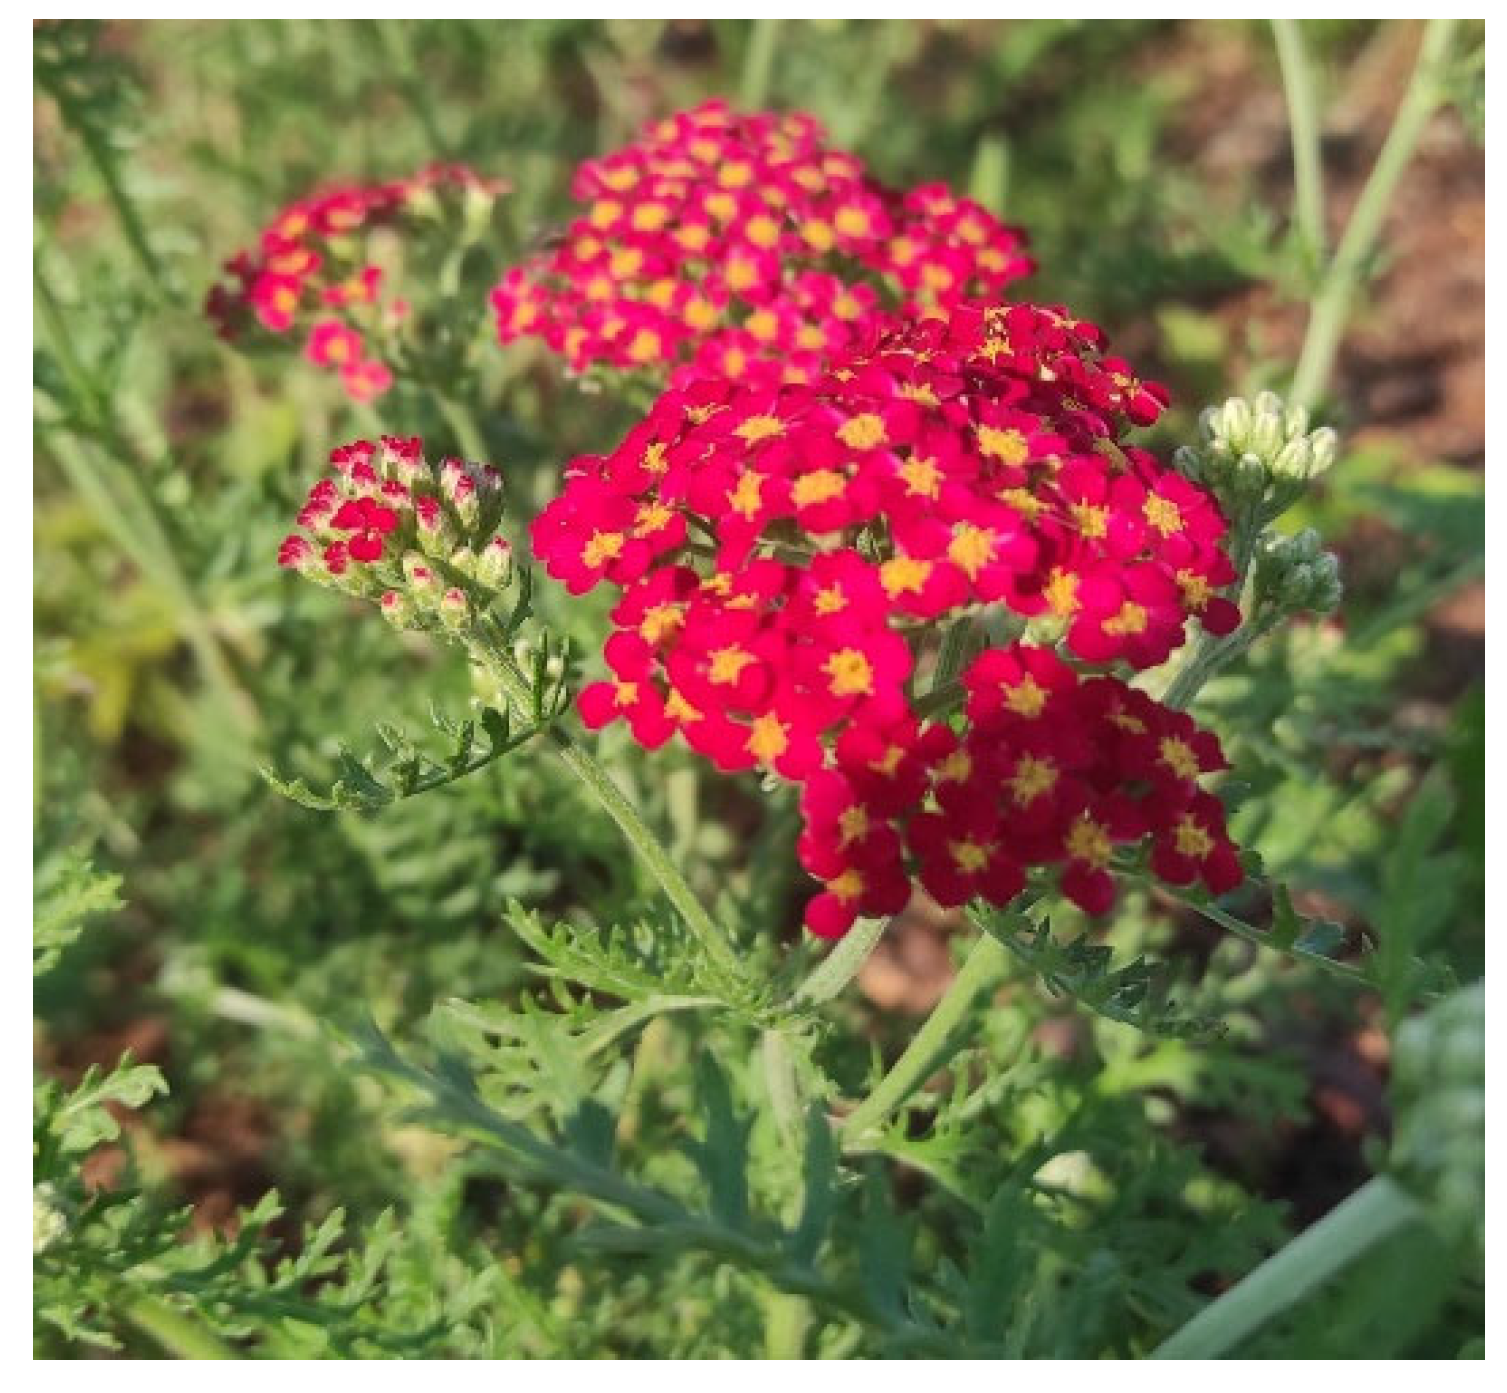
2.1. Plant Material

The research material consisted of the aerial parts of yarrow (Achillea millefolium L. var. paprika) collected from the Botanical Garden in Kielce (51°7′ N, 23°28′ E, Poland) in July 2024. A voucher specimen was deposited in the Herbarium KPC of Jan Kochanowski University (Kielce, Poland). The raw material was dried at 35 °C in a convection oven (Binder FD 53, Tuttlingen, Germany) and then ground with a cutting mill (Retsch SM 100, Haan, Germany) using 1.5 mm mesh sieves.

2.2. Preparation of Plant Extracts

For ultrasound-assisted extraction (UAE), a ground sample of yarrow (2 g) was mixed with 60 mL of 50/50 ethanol/water solution (v/v). The extraction was performed using an ultrasonic bath (Polsonic 5, Warsaw, Poland) set at 30 °C. The extraction procedure was repeated twice for 60 min, and the resulting extracts were filtered through Whatman filter paper.
Extraction of the ground yarrow herb with supercritical carbon dioxide (purity 99.9%, Grupa Azoty Zakłady Azotowe, Puławy, Poland) was conducted using a high-pressure micronization unit (SITEC-Sieber Engineering, Maur, Switzerland). The conditions for extraction from the material (100 g) were as follows: temperature 60 °C, pressure 40 MPa, and time 45 min. The carbon dioxide flow rate was maintained at a constant level of 10 kg/h.

2.3. Phytochemical Constituents of Achillea millefolium Extract

2.3.1. Total Polyphenol Content

The colorimetric method with the use of Folin–Ciocâlteu reagent was used to ascertain the total polyphenol content according to Agbor et al. [10]. The determination was performed three times at a wavelength of 765 nm using a spectrophotometer (UV-1900i UV-Vis, Shimadzu, Kyoto, Japan). Each sample was analysed on three separate occasions. The results obtained were presented in milligrams of gallic acid equivalents (GAE) per milliliter of extract [mg GAE/mL].

2.3.2. Total Flavonoid Content

The colorimetric method was used to ascertain the total flavonoid content according to Kim et al. [11]. The determination was performed three times at a wavelength of 510 nm using a spectrophotometer (UV-1900i UV-Vis, Shimadzu, Japan). Each sample was analysed on three separate occasions. The results obtained were presented in milligrams of catechin equivalents (CE) per milliliter of extract [mg CE/mL].

2.3.3. Total Phenolic Acid Content

The method described by Jain et al. [12] was used to assess the total phenolic acid (TPA) content. Each sample was analysed on three separate occasions, and the results were expressed as milligrams of caffeic acid equivalents (CAE) per milliliter of extract. Absorbance was measured at 490 nm using the spectrophotometric method (UV-1900i UV-Vis spectrophotometer, Shimadzu, Japan).

2.3.4. Condensed Tannin Content

The method described by Tlili et al. [13] was utilised to evaluate the condensed tannin (CT) content. Each sample was analysed on three separate occasions, and the results were expressed as milligrams of delphinidin equivalents (DpE) per milliliter of extract. Absorbance was measured at 550 nm using the spectrophotometric method (UV-1900i UV-Vis spectrophotometer, Shimadzu, Japan).

2.4. Antioxidant Activity Evaluation

2.4.1. FRAP Assay

The spectrophotometric method (UV-1900i UV-Vis spectrophotometer, Shimadzu, Japan) described by Benzie and Strain [14] was utilised to determine the Ferric-Reducing Antioxidant Power (FRAP). In each instance, the FRAP reagent was mixed with a specific volume of the analysed plant extract, thermostated for 4 min, and then the absorbance was measured at a wavelength of 593 nm. The analysis was conducted on three separate occasions for each sample, and the results were expressed in millimoles of Trolox equivalent (TE) per liter of extract [mmol TE/L].

2.4.2. DPPH Assay

A significant component of the analysis of antioxidant activity involves the reaction with a stable radical, such as 2,2-diphenyl-1-picrylhydrazyl (DPPH). A spectrophotometric method was utilised for the determinations (UV-1900i UV-Vis spectrophotometer, Shimadzu, Japan). The DPPH stock solution (with a concentration of 12.5 mg/25 mL) was added to the plant extract or ethanol as a blank sample (in fixed proportions). Then, after being stored for 5 min in the dark at room temperature, the absorbance was measured at a wavelength of 517 nm. Each sample was analysed on three separate occasions. Then, the obtained values were converted into a percentage of DPPH radical inhibition using the following formula: (A0 − A1)/A0] × 100, where A0 is the control’s DPPH radical and A1 is the sample’s DPPH radical.

2.5. Evaluation of the Antimicrobial Activity of Achillea millefolium Extract

2.5.1. Test Microorganisms

The antimicrobial properties of the tested extract were assessed against 15 microorganisms, including fungal strain Candida albicans ATCC10231 and bacteria strains Streptococcus agalactiae PCM 2683, Enterococcus faecalis PCM 2784, Proteus mirabilis ATTC 29906, Streptococcus mutans ATTC 25175, Staphylococcus epidermidis ATTC 8853, Streptococcus pyogenes ATTC 19615, Escherichia coli UPEC PCM 176, Enterococcus hirae ATCC 10541, Bacillus subtilis PCM 486, Staphylococcus aureus 6538P, Staphylococcus epidermidis PCM 2118, Escherichia coli ATCC 8739, Pseudomonas aeruginosa PAO1, and Ralstonia solanacearum Z1.

2.5.2. Minimal Inhibitory Concentration (MIC)

The minimum inhibitory concentration (MIC) was assessed using a broth microdilution assay, following the recommendations of the Clinical and Laboratory Standards Institute (CLSI) [15]. Overnight cultures of bacterial and fungal strains were diluted 1:10 in fresh Mueller–Hinton broth. An initial 100 µL of the extract at 33 mg/mL was added to the first well of a sterile 96-well microplate, and a series of two-fold dilutions was performed using inoculated broth, yielding final extract concentrations ranging from 0.25 to 16 mg/mL. Plates were incubated aerobically at 35 °C for 18–20 h. Following incubation, 0.1 µg/mL resazurin was added to each well. A blue color shift indicated inhibition of microbial growth, while pink coloration denoted viable cells. This method was adapted from the protocol by Sarker et al. [16].

2.5.3. Determination of Minimum Bactericidal and Fungicidal Concentrations (MBC/MFC)

The evaluation of the minimum bactericidal and fungicidal concentrations (MBC/MFC) involved selecting three wells from the MIC assay, specifically those exhibiting no visible microbial growth. Subsequently, aliquots of 100 µL from each selected well were transferred onto the surface of Mueller–Hinton agar plates. Plates were then incubated at 35 °C for approximately 18 to 20 h. The MBC or MFC value was established as the lowest extract concentration responsible for eliminating ≥99.9% of the viable microbial population. Each assay was independently replicated three times to ensure reproducibility.

2.5.4. Evaluation of Biofilm Formation Inhibition

The extracts’ capacity to inhibit biofilm formation was assessed using a modified version of the protocol originally described by Merritt et al. [17]. Briefly, microbial suspensions were incubated in flat-bottomed 96-well microplates containing 100 µL of Mueller–Hinton broth supplemented with various extract concentrations ranging between 0.25 and 16 mg/mL. Following incubation at 37 °C for 24 h, non-adherent cells were carefully removed, and the wells were gently rinsed with sterile distilled water. Biofilms adhering to the surface were stained using 0.1% crystal violet solution for 15 min. Excess stain was removed by washing gently with water, and the remaining bound crystal violet was solubilized using 95% ethanol with brief agitation. The absorbance of each well was quantified at a wavelength of 595 nm utilizing an Infinite M200 PRO microplate reader (Tecan, Männedorf, Switzerland). Each experiment was performed in triplicate. The biofilm inhibition was expressed in percentage terms using the formula provided by O’Toole [18].
%biofilm inhibition = (control OD value − treated OD value/control OD value) × 100

2.6. Cell Culture

The normal human keratinocyte HaCaT and fibroblast HDF cell lines were obtained from CLS Cell Lines Service (Eppelheim, Germany). Both cell lines were maintained in DMEM (Dulbecco’s Modified Eagle’s Medium, Biological Industries, Cromwell, CO, USA). The media used in the experiments contained phenol red, sodium pyruvate, L-glutamine, and glucose (4.5 g/L). In addition, the cell culture media were supplemented with 10% FBS and 1.0% antibiotics (100 U/mL penicillin and 1000 μg/mL streptomycin, Thermo Fisher Scientific, Waltham, MA, USA). Cells were maintained in an incubator at 37 °C in a humidified atmosphere with 5% CO2. For ROS measurements and estimation of resazurin reduction and neutral red uptake, cells were seeded into 96-well culture plates at a density of 1 × 10⁴ per well and initially cultured for 24 h before the experiment. Then, cells were exposed to individual concentrations of the tested extract dissolved in DMEM medium.

2.7. Assessment of Cytotoxicity—Alamar Blue (AB) and Neutral Red (NR) Uptake Assays

Cytotoxicity of yarrow extracts was assessed by measuring the reduction of water-soluble and non-toxic to cells sodium salt of resazurin (Alamar blue test, Merck KGaA, Darmstadt, Germany) and by assessing the storage capacity of neutral red dye in lysosomes of tested skin cells in vitro (Neutral red test, Merck KGaA, Darmstadt, Germany) according to the previously described methodology [19]. Cell viability tests after exposure to the tested extract were performed in sterile 96-well flat-bottom plates. The AB assay was performed on black plates, and the NR test was performed on transparent plates (Googlab Scientific, Rokocin, Poland). After 24 h from the cells being plated, the cells were treated with yarrow extracts in the concentration range of 0.01–10.0% for the next 24 h. Dilutions of the tested extract were prepared in DMEM culture medium. Control cells were cells (both HaCaT and HDF) cultured in DMEM (without the addition of individual concentrations of extract). In the case of the AB test, after 24 h of incubation, the extracts dissolved in DMEM were aspirated, and 60 µM of resazurin solution were added to the wells. The cells were incubated with the dye for 2 h at 37 °C. In the NR assay, the individual dilution of the extract was replaced with a 40 µg/mL neutral red solution, and the cells were incubated for 2 h at 37 °C. After this time, the cells were washed twice with phosphate-buffered saline (PBS, Genos, Łódź, Poland), and then a destaining buffer (C2H5OH/CH3COOH/H2O, 50.0%/1.0%/49.0%) was added. The prepared plates were shaken for 15 min at room temperature. Then, the fluorescence of cells in individual wells (AB test) was measured at 570 nm using a microplate reader (ThermoFisher Scientific, Waltham, MA, USA), and the absorbance of samples (NR test) was measured at 540 nm. The control cells were HDF and HaCaT cells grown separately in DMEM medium without the addition of extract. The viability of these cells was assumed as 100%. Cytotoxicity studies were conducted in three independent experiments, in which each extract concentration was tested in triplicate.

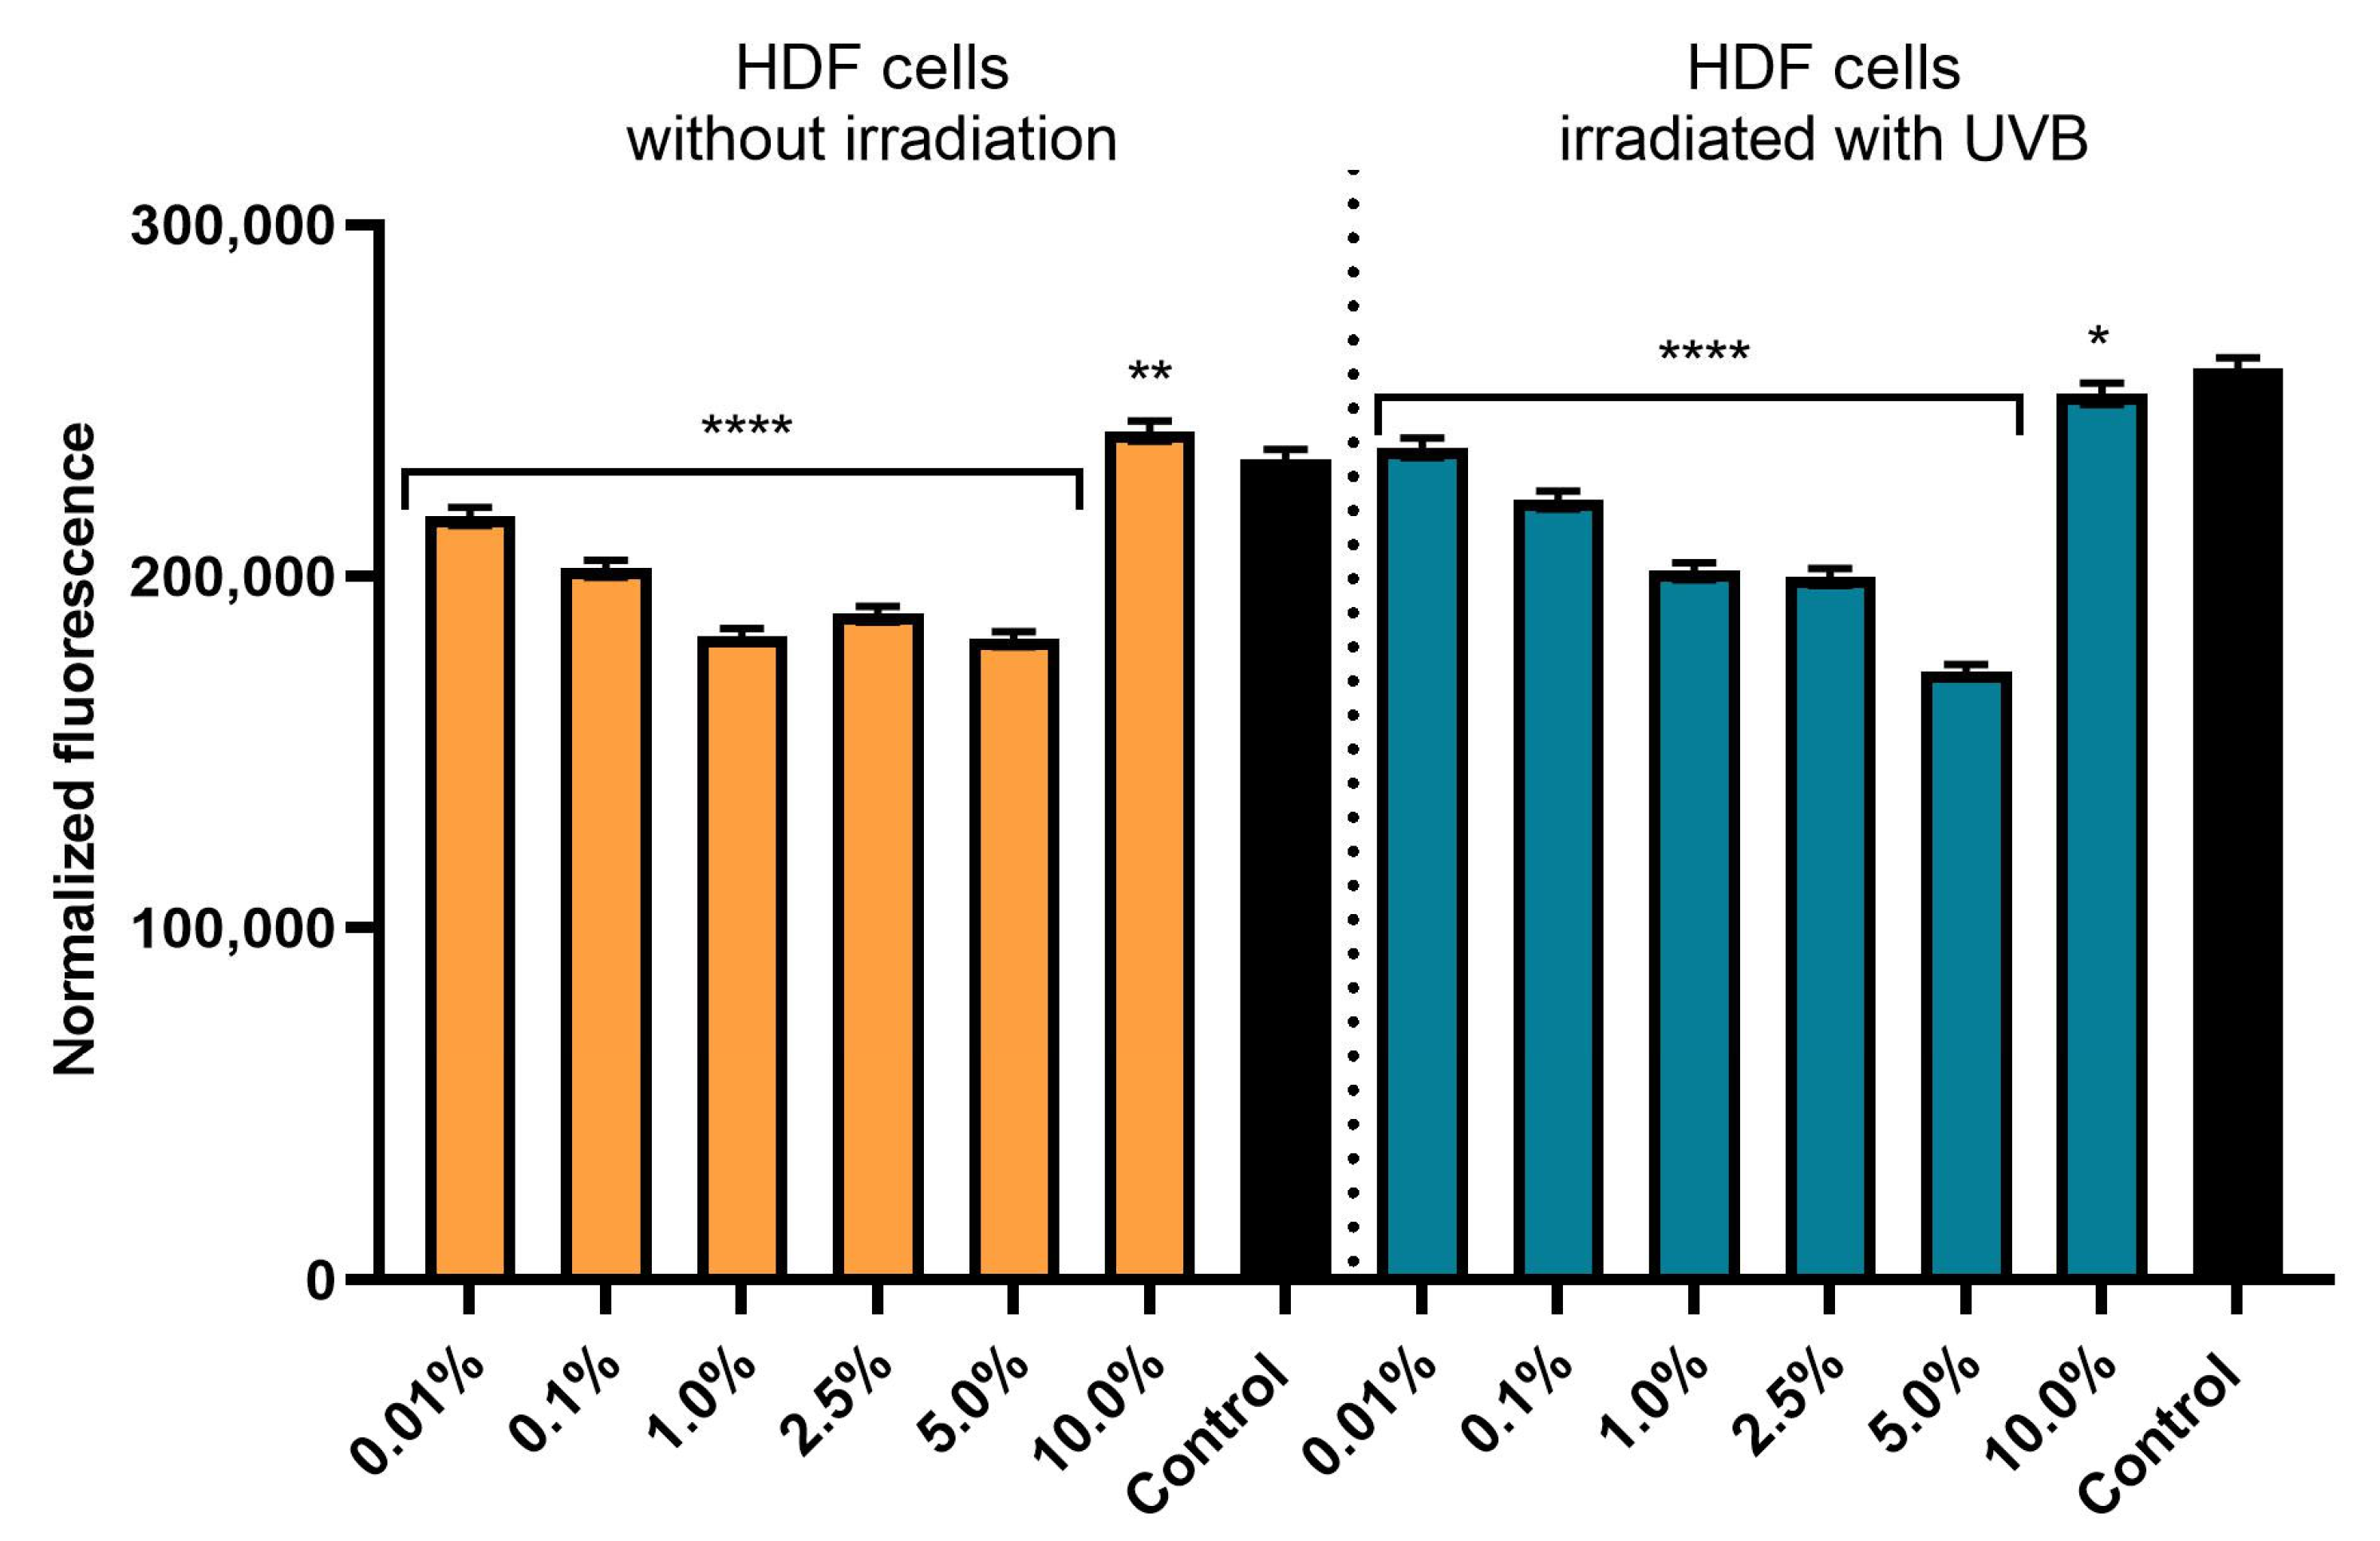
2.8. Evaluation of Intracellular Reactive Oxygen Species (ROS) Levels in Skin Cells Without and After UVB Radiation Exposure

To assess the ability of the tested yarrow extract to reduce intracellular production of ROS in human skin cells in vitro, the fluorogenic probe 2′,7′-dichlorodihydrofluoresceindiacetate (H2DCFDA) (Thermo Fisher Scientific, Waltham, MA, USA) was used according to Zagórska–Dziok et al. [20]. First, HaCaT and HDF cells were seeded separately on two black 96-well plates and incubated for 24 h. Then, the culture medium was replaced with individual concentrations of the tested extract (from 0.01 to 10.0%) prepared in DMEM medium (VWR International, Radnor, PA, USA) and incubated for another 24 h. After incubation, the plates were aspirated and the cells were washed twice in sterile PBS. Cells from one plate were additionally exposed to UVB radiation (0.5 J/cm2) in a Crosslinker UVP CL-3000M (Analytik Jena, Jena, Germany). After UVB irradiation of the cells, the PBS was aspirated from both plates and replaced with 200 μL of a 10 μM H2DCFDA probe solution dissolved in DMEM without FBS. In both irradiated and non-irradiated cells, the control cells were fibroblasts and keratinocytes untreated with yarrow extract. DCF fluorescence was measured using a microplate reader (FilterMax F5, Thermo Fisher Scientific, Waltham, MA, USA) with excitation and emission spectra peaking at 485 and 535 nm, respectively.

2.9. Assessment of Inhibition of Collagenase, Elastase, and Tyrosinase Activity

2.9.1. Determination of Anti-Collagenase and Anti-Elastase Activity

To assess the anti-ageing effect of the tested extract, the levels of collagenase and elastase were measured in fibroblasts (HDF) exposed to A. millefolium extracts at a concentration of 1.0 and 5.0%. Incubation of cells (at a density of 1 × 10⁴ cells/well) with individual concentrations of extracts was conducted in 6-well plates for 24 h. In the next step, the cells were washed twice with sterile PSB, and then 150 μL of RIPA lysis buffer were added to each well. The cell lysates obtained in this way were used to determine the levels of collagenase and elastase in cells using commercially available ELISA kits (HumanCOL2α1 ELISA kit and a Human Ne/ELA2 ELISA kit, Elabscience Biotechnology Inc., Houston, TX, USA). Experiments were conducted according to the manufacturer’s instructions. Succinyl–alanyl–alanyl–prolyl–valine–chloromethyl ketone (SPCK, Adooq Bioscience, Irvine, CA, USA) was used as a control inhibitor for elastase, and 1,10-phenanthroline (Abcam, Cambridge, UK) was used for collagenase. A microplate reader (FilterMax F5, Thermo Fisher Scientific, Waltham, MA, USA) was used to measure absorbance at 450 nm. Each A. millefolium extract concentration was analysed in triplicate.

2.9.2. Determination of Anti-Tyrosinase Activity

The ability of A. millefolium extract to inhibit melanin formation was assessed according to Krochmal–Marczak et al. [21]. First, 20 μL of dilutions of the tested extract (1.0 and 5.0%) were added to each well on a 96-well plate. In the next step, a tyrosinase solution from a mushroom (Sigma–Aldrich, Poznań, Poland) was added at a concentration of 500 U/mL, while 120 μL of phosphate buffer (100 mM, pH = 6.8) were added to the extracts and incubated in the dark (10 min, 22–24 °C) while shaking. Then, 40 μL of L-DOPA substrate (4 mM, Merck KGaA, Darmstadt, Germany) were added. The control sample, for which 100% tyrosinase activity was assumed, was the solvent (distilled water), together with tyrosinase, substrate, and buffer. The samples prepared in this way were incubated for 20 min in the dark. The measurement of dopachrome formation was performed spectrophotometrically at a wavelength of λ = 475 nm using a FilterMax F5 microplate reader (FilterMax F5 Molecular Devices, San Jose, CA, USA). Kojic acid was used as a control tyrosinase inhibitor (at a concentration of 500 μg/mL). All obtained absorbance values of the tested samples were corrected for the absorbance value of the sample without fungal tyrosinase and L-DOPA. Each tested sample was analyzed three times. The inhibitory effect was expressed as a percentage of inhibition of tyrosinase activity and melanin formation according to the formula:
% t y r o s i n e   i n h i b i t i o n = c o n t r o l s a m p l e t e s t e d s a m p l e c o n t r o l s a m p l e x 100 %

2.10. Determination of Model Cosmetics Containing Achillea millefolium Extract

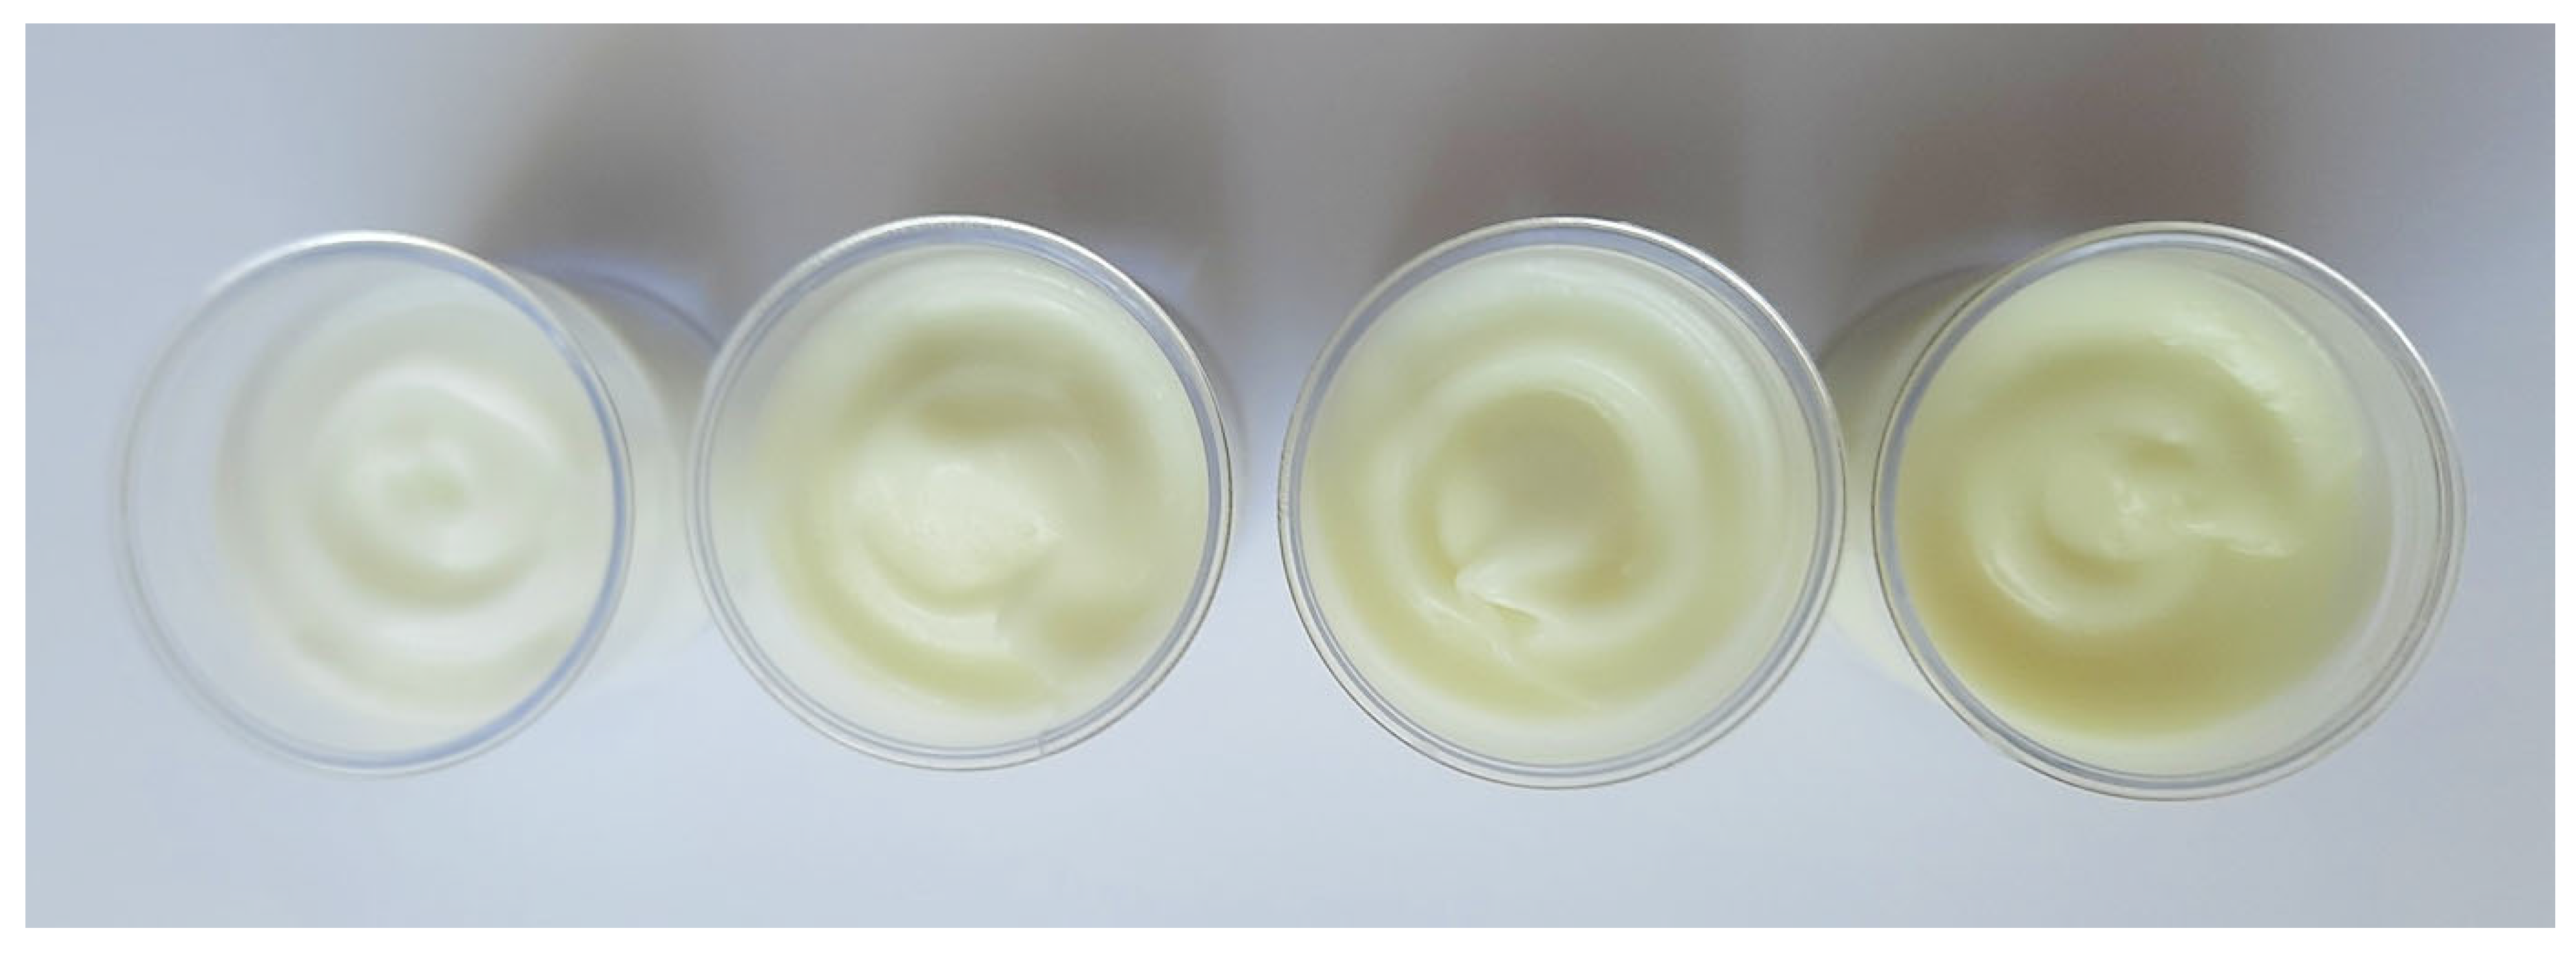
2.10.1. Preparation of the Cosmetic Cream

The creams were prepared using the following raw materials: Capric/Caprylic Triglycerides (trade name: Crodamol GTCC, supplier: Croda Inc., Yorkshire, UK); Cetearyl Alcohol (trade name: Sabowax AO, supplier: SABO S.p.A, Rome, Italy); Ceteareth-20 (trade name: Eumulgin B2, supplier: BASF Personal Care); Glyceryl Stearate (trade name: Cithrol GMS 0402, supplier: Croda Inc.,Yorkshire, UK); Butyrospermum Parkii Butter (Seatons Refined Shea Nut Butter, supplier: Croda Inc., Yorkshire, UK); Isopropyl Palmitate (trade name: Crodamol IPP, supplier: Croda Inc., Yorkshire, UK); Glycerin (trade name Glycerine, supplier: Brenntag, Warsaw, Poland); Sodium Benzoate and Potassium Sorbate (supplier: Akema Fine Chemicals, Rome, Italy); and distilled water.
Four cosmetic creams were prepared, differing in their composition only in extract content. The base cream without extract is designated as E0. Creams E1, E5, and E10 contain extract in concentrations of 1%, 5%, and 10%, respectively. The exact composition of the samples is provided in Table 1.
Cream samples (Figure 2) were obtained using the classic hot emulsification method. The method consists of heating the oil and aqueous phases separately and combining both phases at high temperatures. Then, the entire system is simultaneously mixed and cooled. Both phases of the prepared creams (oil, containing Capric/Caprylic Triglycerides, Cetearyl Alcohol, Ceteareth-20, Glyceryl Stearate, Butyrospermum Parkii Butter and Isopropyl Palmitate, and aqueous, containing water and Glycerin) were heated to 70 °C. Then, the oil phase was poured into the water phase and mixed until complete homogenisation. After lowering the cream temperature to 40 °C, the preservative (as an aqueous solution) and Achillea millefolium extract were added.
The samples were stored for 2 months after production to observe their stability. No signs of instability were observed during storage. The pH values measured at that time (using the multifunctional field-laboratory meter CX-401 Elmetron, Poland) of the creams were in the range of 5.6–5.9. No significant differences were noted between the pH values of the samples differing in extract content.

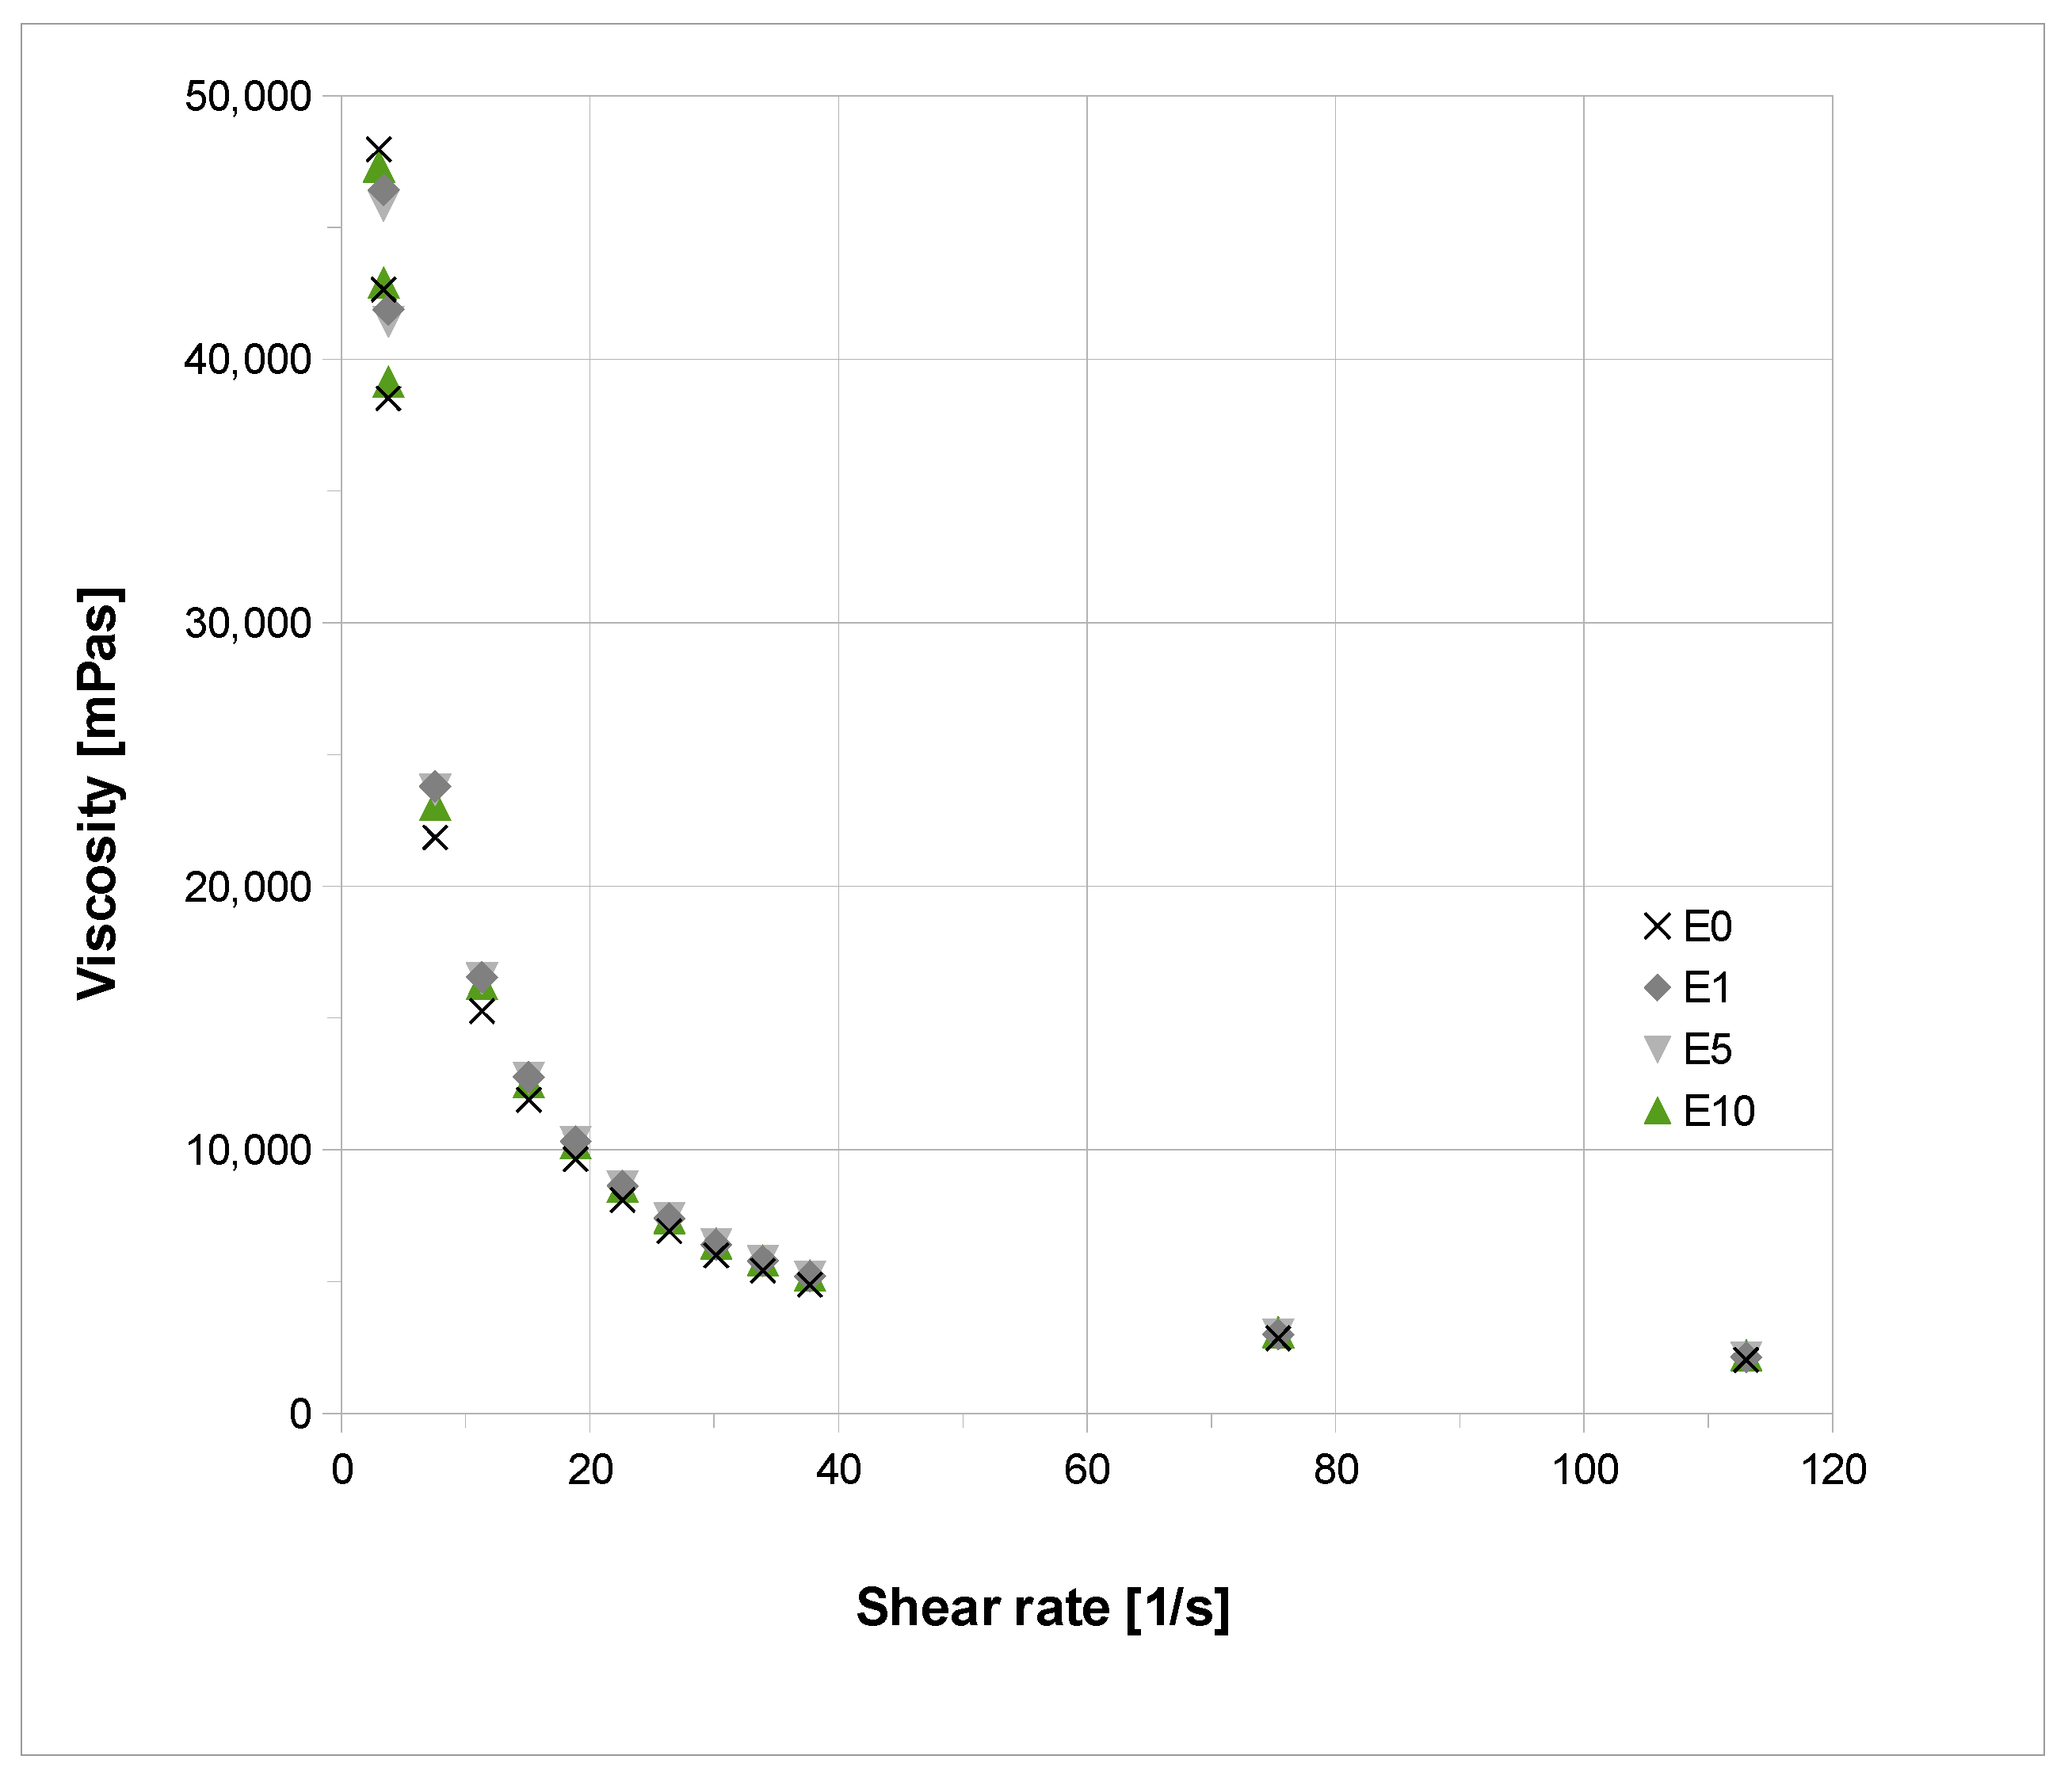
2.10.2. Rheological Properties of Extract-Based Cosmetic Cream

Rheological properties were determined using a Brookfield HADV—III Ultra rheometer (manufacturer: Brookfield Engineering Laboratories, INC., Middleboro, MA, USA), in a plate-cone system. The dependence of viscosity on the shear rate was measured. Measurements were conducted at 20 °C. The tests were conducted using the RheoCalc program, which allows for the automatic measurement of viscosity at particular shear rates and the recording of the obtained results. The results presented are averaged from three independent measurements.

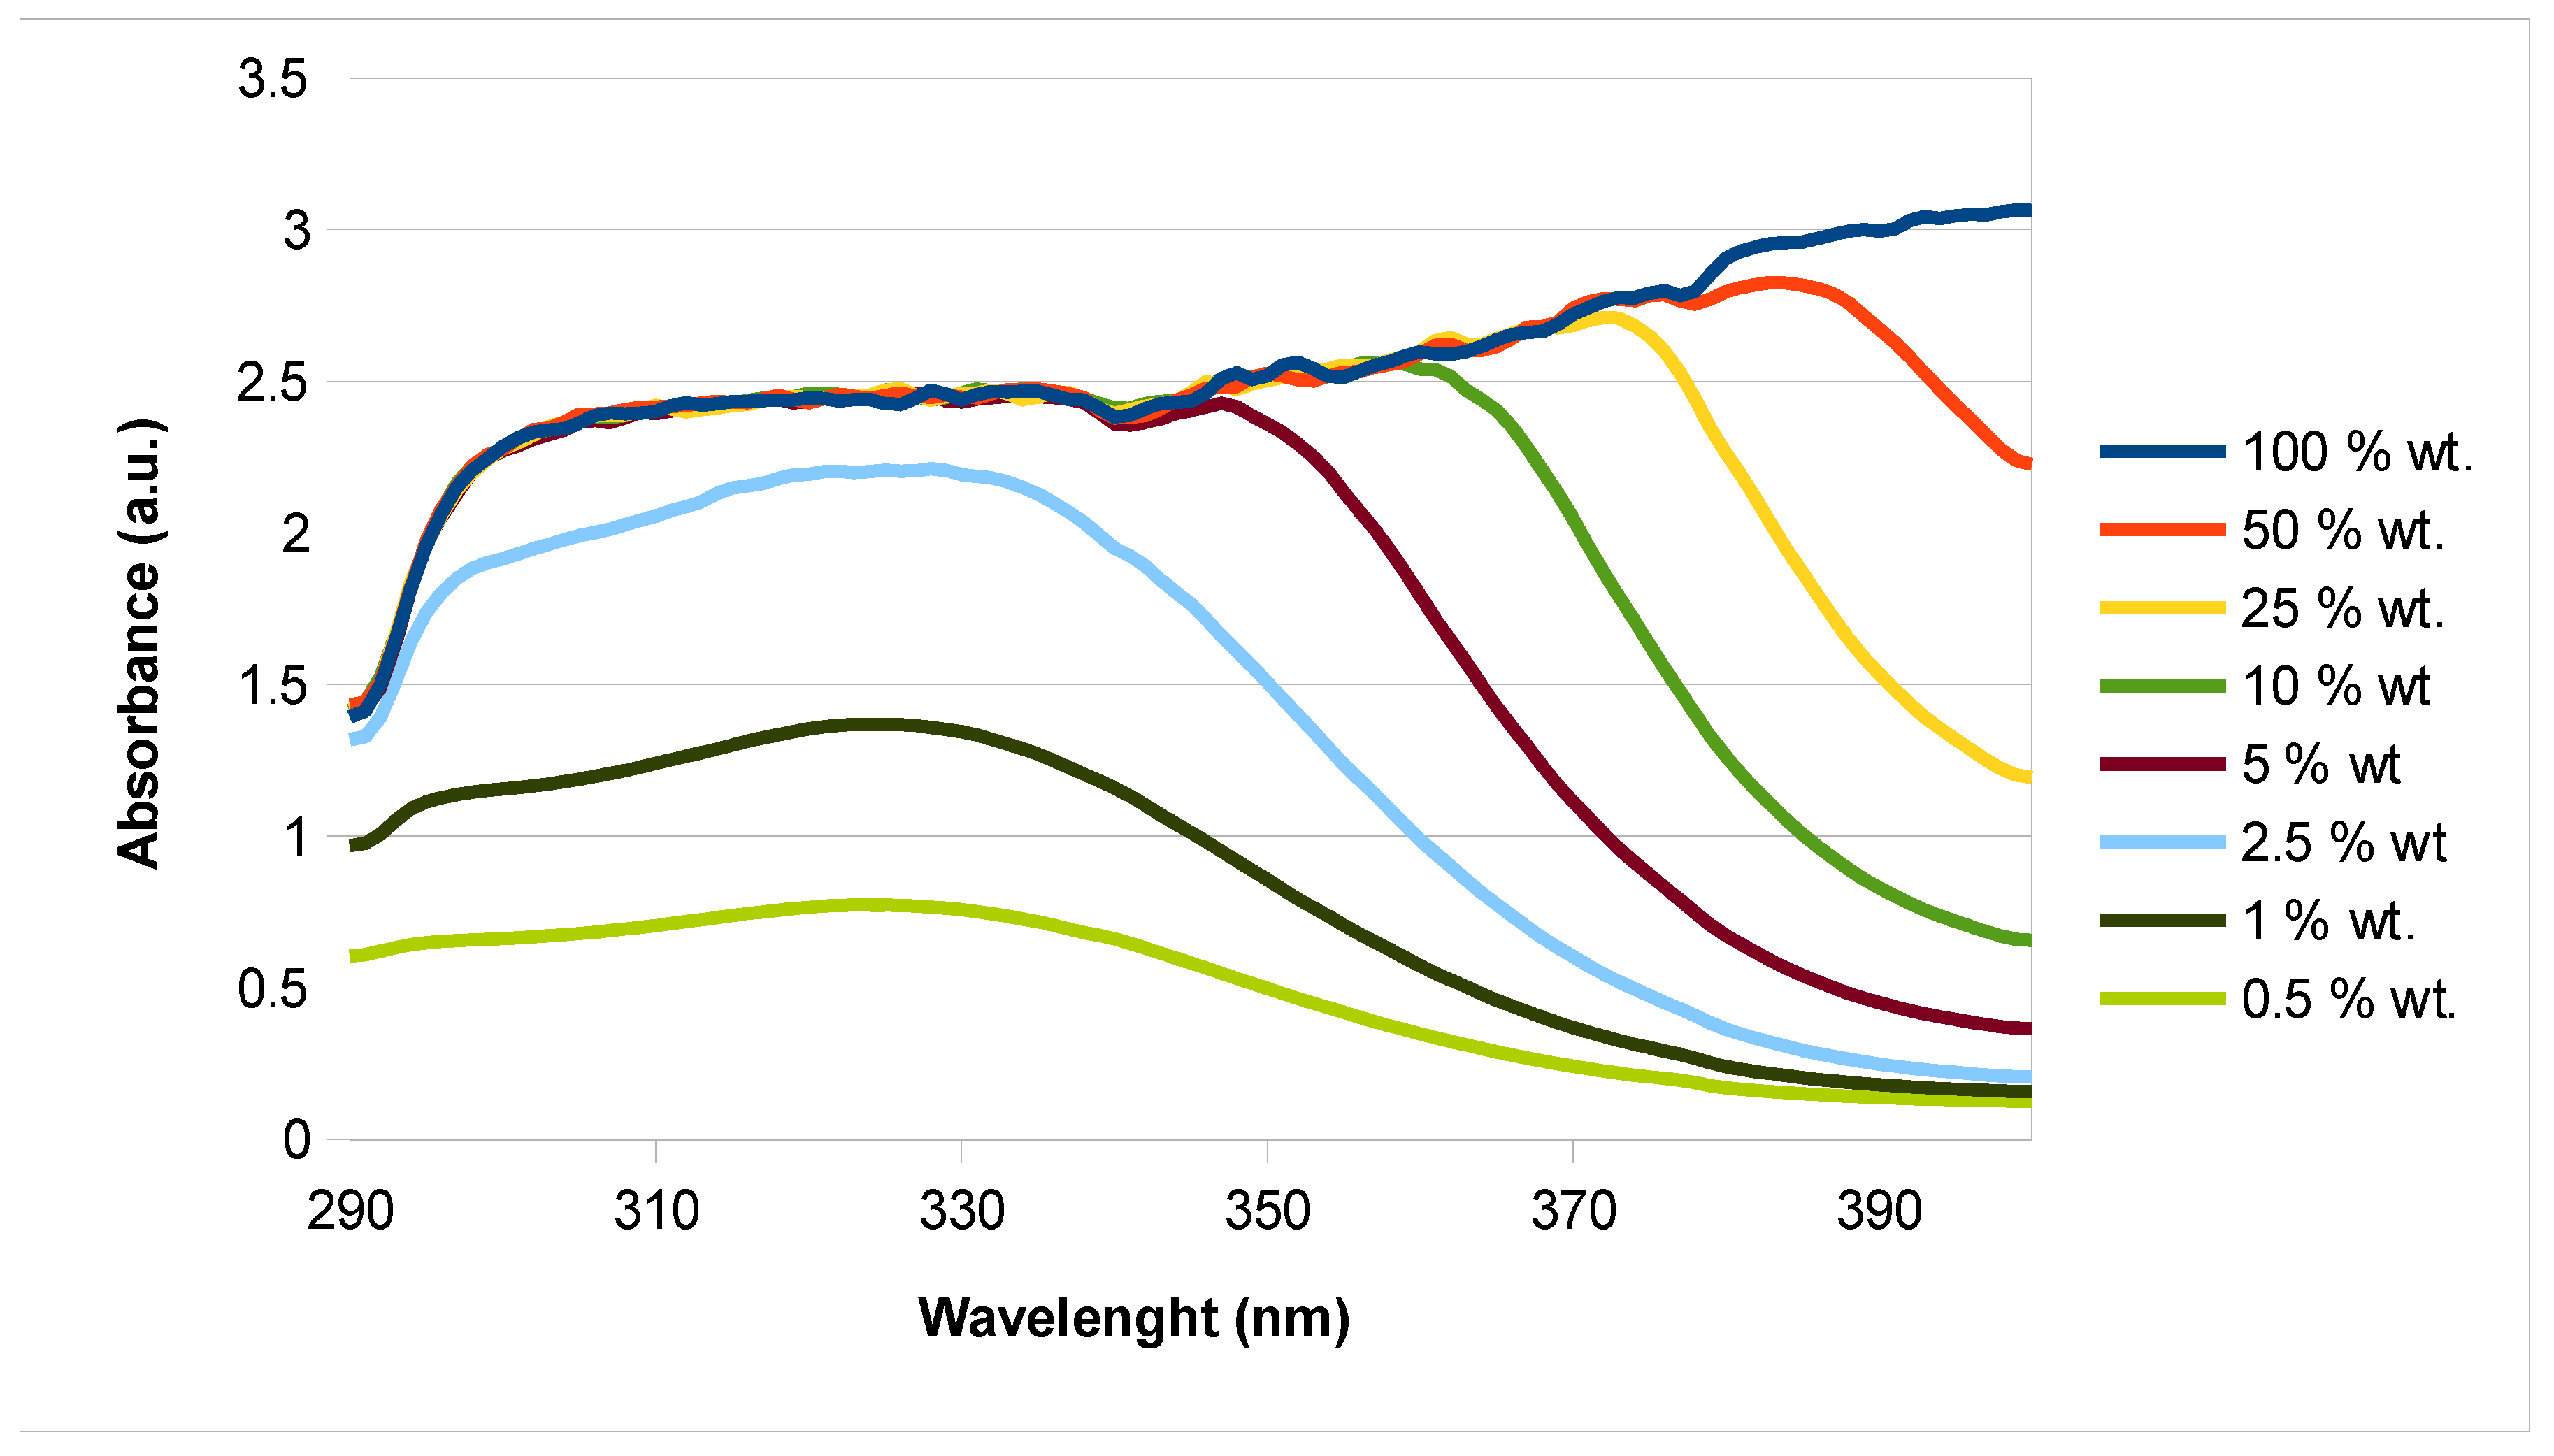
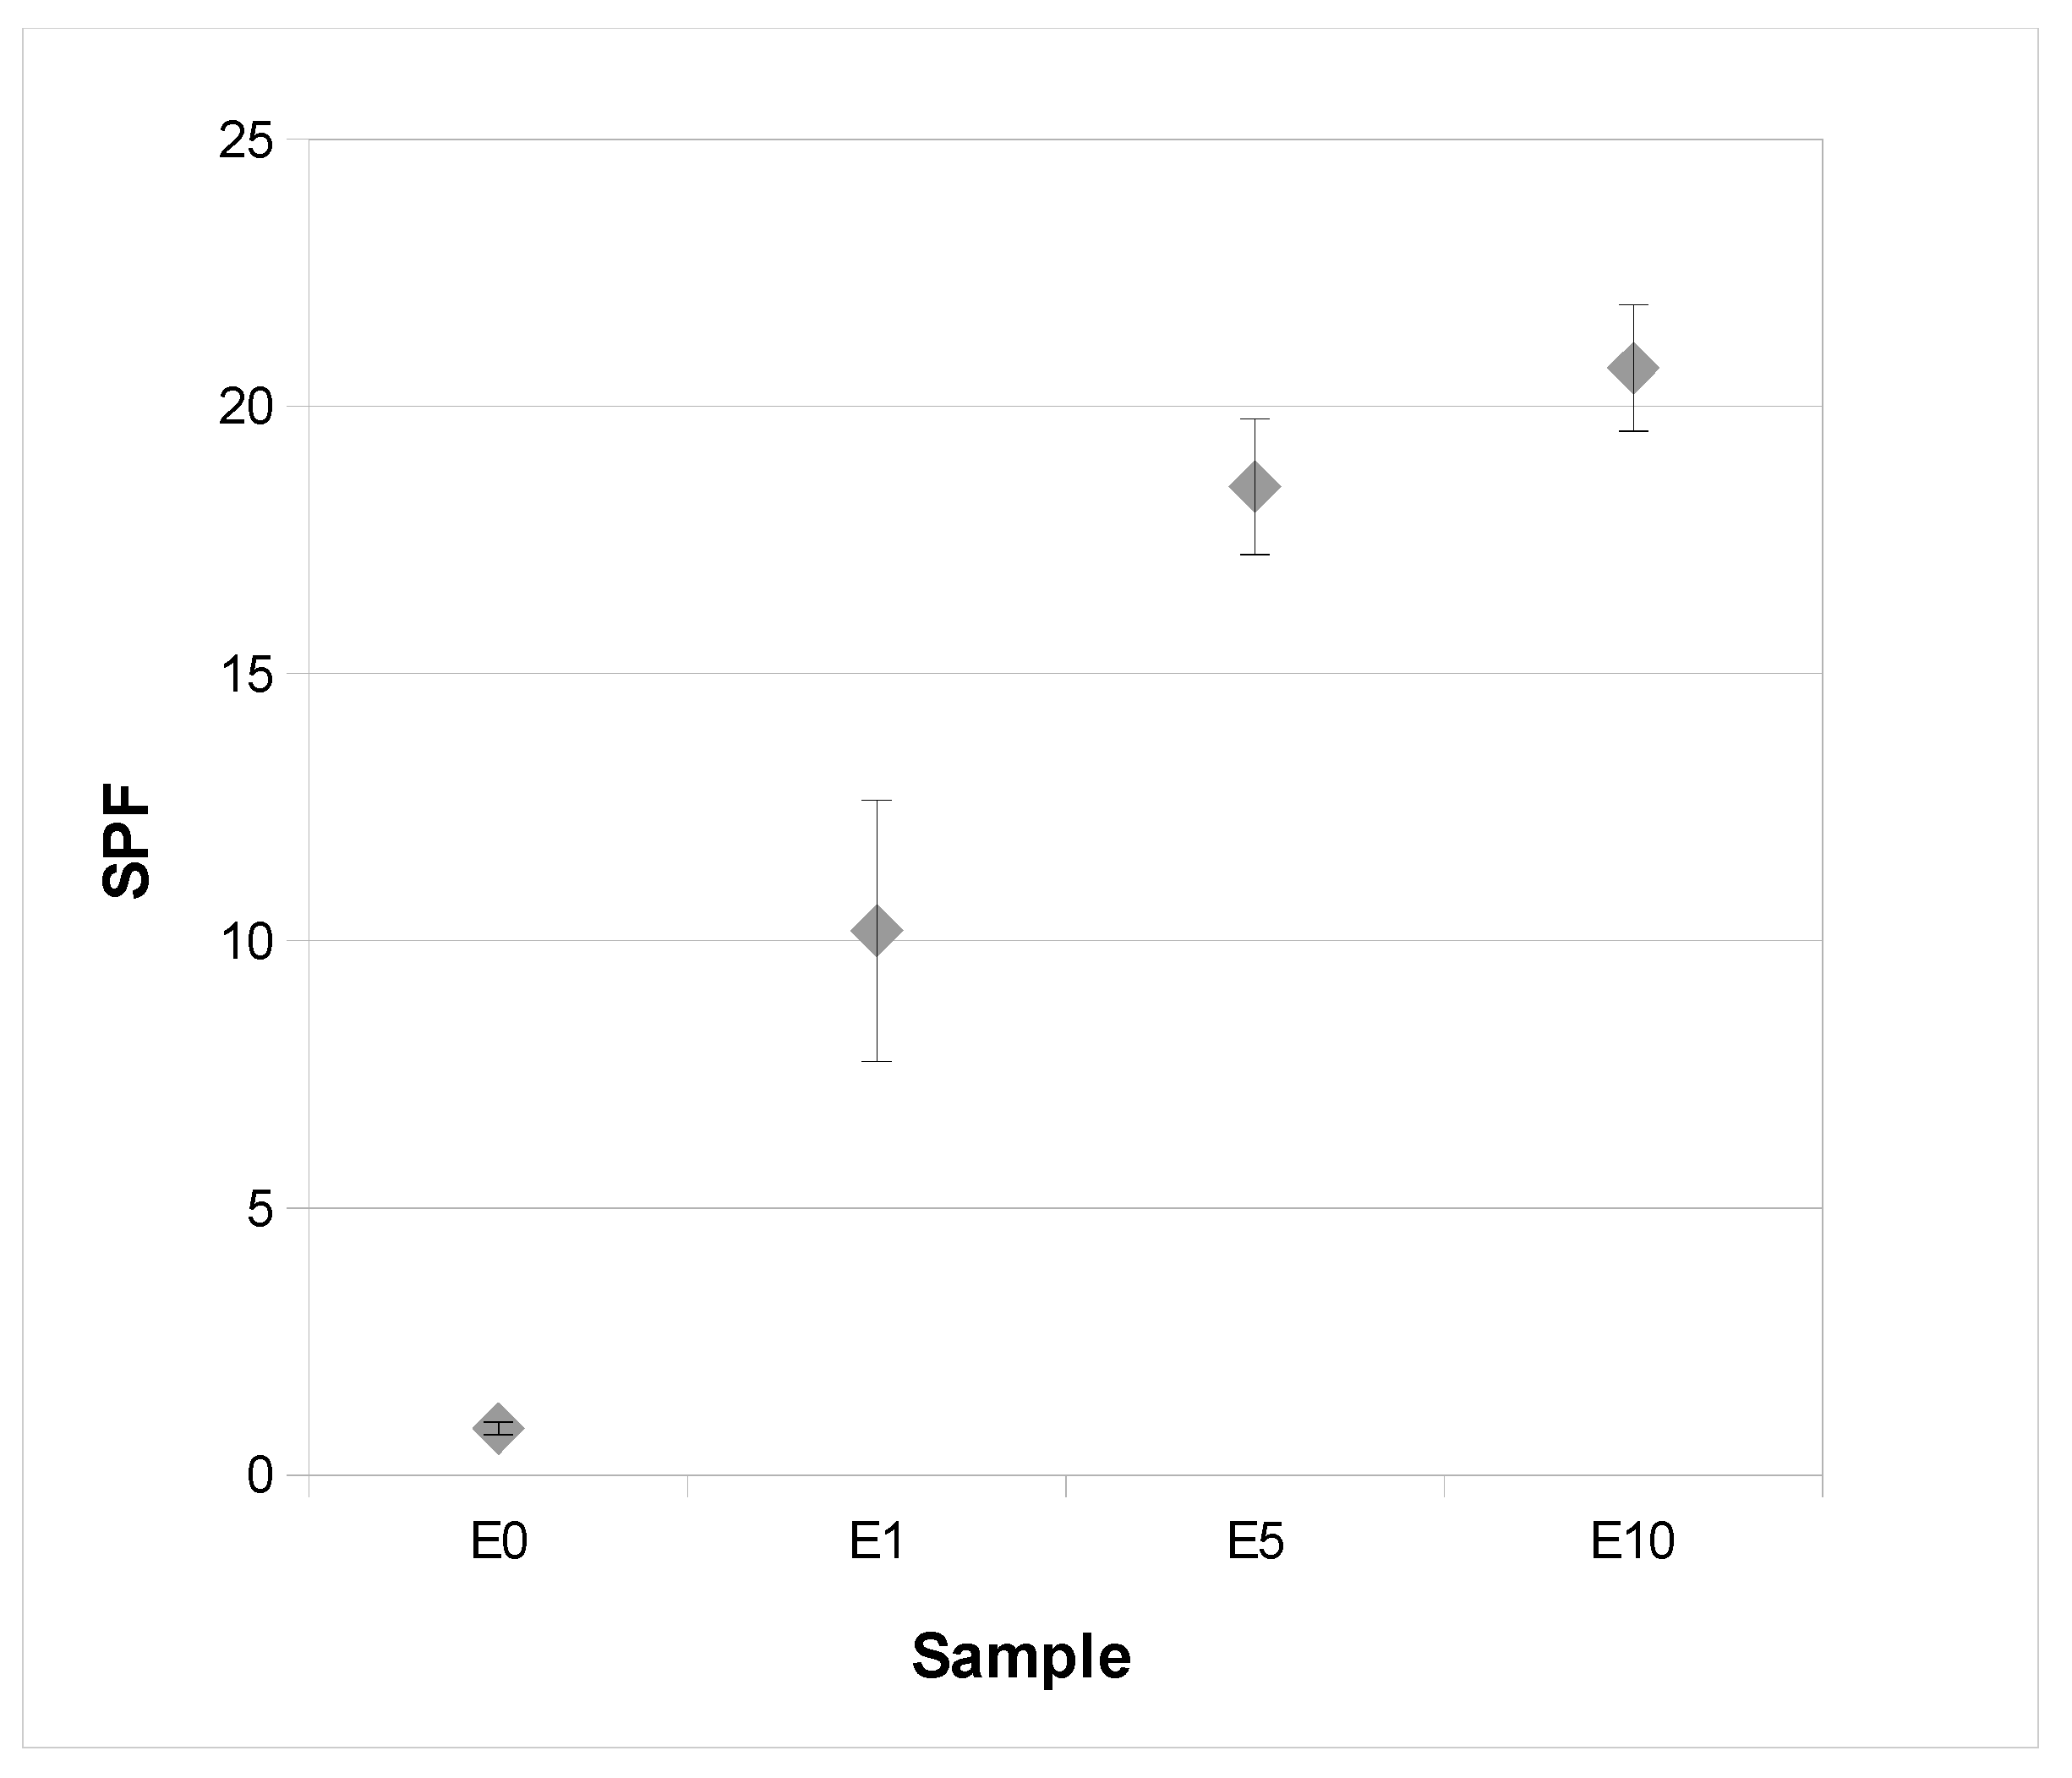
2.10.3. Determination of Sun Protection Factor (In Vitro) of Cosmetic Cream

UV-VIS absorbance using a Hitachi U-2900 spectrophotometer was measured. The measurement was conducted in the UVB (290–320 nm) and UVA (320–400 nm) range every 1 nm. Five independent measurements were performed for each sample. The results are the mathematical average of five measurements. Based on the results, SPF using the Mansur equation [22] was calculated:
S P F = C F 290 320 E E λ I λ λ
where:
CF—correction factor is 10,
EE (λ)—erythemogenic effect of radiation on wavelength λ,
I(λ)—intensity of solar light with wavelength λ,
Abs (λ)—sample spectrophotometric absorbance value at wavelength λ.
EE x I (λ) values are constants determined by Sayre et al. [23].

2.11. Statistical Analysis

Statistical analysis was conducted using TIBCO Statistica 13.3 (StatSoft, Krakow, Polska). One-way analysis of variance (ANOVA) was used to compare data and identify means with significant differences (p < 0.05).
For analyses using cell lines, first, the Shapiro–Wilk test was used to check whether the data obtained during analyses met the assumption of normality and were normally distributed. Then, statistical significance was assessed using a two-way analysis of variance (ANOVA) and Dunnett’s post-hoc test for group comparisons. Statistical significance was indicated by **** p < 0.0001, *** p < 0.001, ** p < 0.01, and * p < 0.05 compared to the control group. Analyses were performed using GraphPad Prism 8.4.3 (GraphPad Software, Inc., San Diego, CA, USA).
The experimental results of the SPF of the tested creams are provided as the mean and standard deviation of the mean. The points on the graphs represent the mean values from a series of five measurements. The Student’s t-distribution was used to calculate the confidence intervals for the mean values. Confidence intervals representing measurement error were determined at the 0.95 confidence level. The data were analysed using R software version 4.3.3.

3. Results and Discussion

3.1. Phytochemical Constituents and Antioxidant Activity of Achillea millefolium Extract

Achillea millefolium is one of the oldest known plants, used by people for centuries, and one of the most important plants in pharmacy. It also has multi-faceted potential for topical application on the skin [3]. The skin care potential of yarrow is determined by its content of secondary metabolites, such as flavonoids, phenolic acids, and tannins. The popular yarrow variety with white flowers is the best-researched, but in the present study, we determined the content of these compounds in water-ethanol extracts of the herb with red flowers (Table 2). Spectrophotometric methods were used to compare the content of bioactive compounds in two types of extract, obtained by ultrasound-assisted extraction (UAE) and supercritical fluid extraction (SFE).
Polyphenolic compounds are divided into several groups due to their diverse structure, including flavonoids, phenolic acids, and tannins. Extracts obtained by UAE had significantly higher total polyphenol content (50.06 mg GAE/mL) and total flavonoid content (14.58 mg CE/mL) than those obtained by SFE (2.44 mg GAE/mL and 0.041 mg CE/mL, respectively). The UAE also contributed to a better extraction of phenolic acids and tannins. Total phenolic acid content was 3.31 mg CAE/mL for UAE and 0.91 mg CAE/mL for SFE, while condensed tannin content was 4.93 mg DpE/mL for UAE and 0.79 mg DpE/mL for SFE, respectively. Significant differences between the two types of extracts were also observed for antioxidant activity determined by the DPPH method (70.00% for UAE and 20.04% for SFE) and the FRAP method (1.53 mmol TE/L for UAE and 0.77 mmol TE/L for SFE) (Table 2). A similar relationship for extracts from A. millefolium flowers and leaves was obtained by Villalva et al. [24], who reported a total polyphenolic content of 106 mg GAE/g extract for 50% EtOH extracts obtained by ultrasound-assisted extraction, but only 14 mg GAE/g for extracts obtained by supercritical fluid extraction. In the same study, antioxidant activity determined by the ABTS method was 0.52 mmol TE/g extract for UAE and 0.08 mmol TE/g extract for SFE, while antioxidant activity determined by the ORAC method was 2.16 and 0.73 mmol TE/g extract, respectively. The results confirm that ultrasound-assisted extraction is useful for the extraction of polar compounds, while supercritical carbon dioxide extraction is better suited for the extraction of nonpolar compounds. The water–ethanol extract from yarrow herb obtained by UAE, with a higher content of free radical scavenging compounds and with better antioxidant potential, was used for further analysis.

3.2. Antimicrobial and Antibiofilm Activity of Achillea millefolium Extract

The Achillea millefolium extract exhibited antimicrobial activity in the range of 2–16 mg/mL (MIC). The highest sensitivity (MIC = 2 mg/mL) was observed for Candida albicans, Pseudomonas aeruginosa, Bacillus subtilis, and Ralstonia solanacearum, and the lowest for Escherichia coli UPEC and Enterococcus faecalis (MIC = 16 mg/mL). The MBC/MFC values were generally higher than the MIC values, suggesting a bacteriostatic effect (Table 3).
These findings are in general agreement with the literature data. Several studies have reported that the antimicrobial efficacy of A. millefolium extracts is strongly influenced by the choice of solvent and extraction technique. For example, Terzić et al. demonstrated that acetone and ethyl acetate extracts were active against Gram-positive bacteria at a concentration of 10 mg/mL, while Gram-negative bacteria were mostly resistant, with only a few Pseudomonas aeruginosa strains showing sensitivity [18].
Importantly, recent work has highlighted that the antimicrobial activity of A. millefolium extracts can be further enhanced through combination strategies. Several studies have demonstrated that when the extract is combined with other bioactive agents, such as silver nanoparticles, nanoemulsion carriers, or even conventional antibiotics, a synergistic effect can be achieved, leading to a reduction in the effective MIC and a broader spectrum of activity. This approach not only improves the stability and bioavailability of the active compounds but also helps overcome the limitations of the use of the extract alone [25,26].
The anti-biofouling activity of Achillea millefolium herb was also investigated in the present study. The antibiofilm properties of Achillea millefolium herb (more than 50% biofilm reduction) were only observed for four strains of Streptococcus agalactiae, Enterococcus faecalis, and Streptococcus mutans at concentrations of 4–8 mg/mL and for Proteus mirabilis at a concentration of 8 mg/mL. These findings are partially consistent with literature reports; for example, Terzić et al. [18] observed significant inhibition of biofilm formation, especially among Gram-positive bacteria. However, the extent of biofilm disruption appears to be both strain- and concentration-dependent. Variability in antibiofilm activity may be attributed to differences in the cell wall structure and the intrinsic biofilm-forming capabilities of the microorganisms, as well as the unique chemical profile of the extract, determined by the extraction solvent. Such factors likely influence the diffusion and efficacy of bioactive compounds within the biofilm matrix [18].

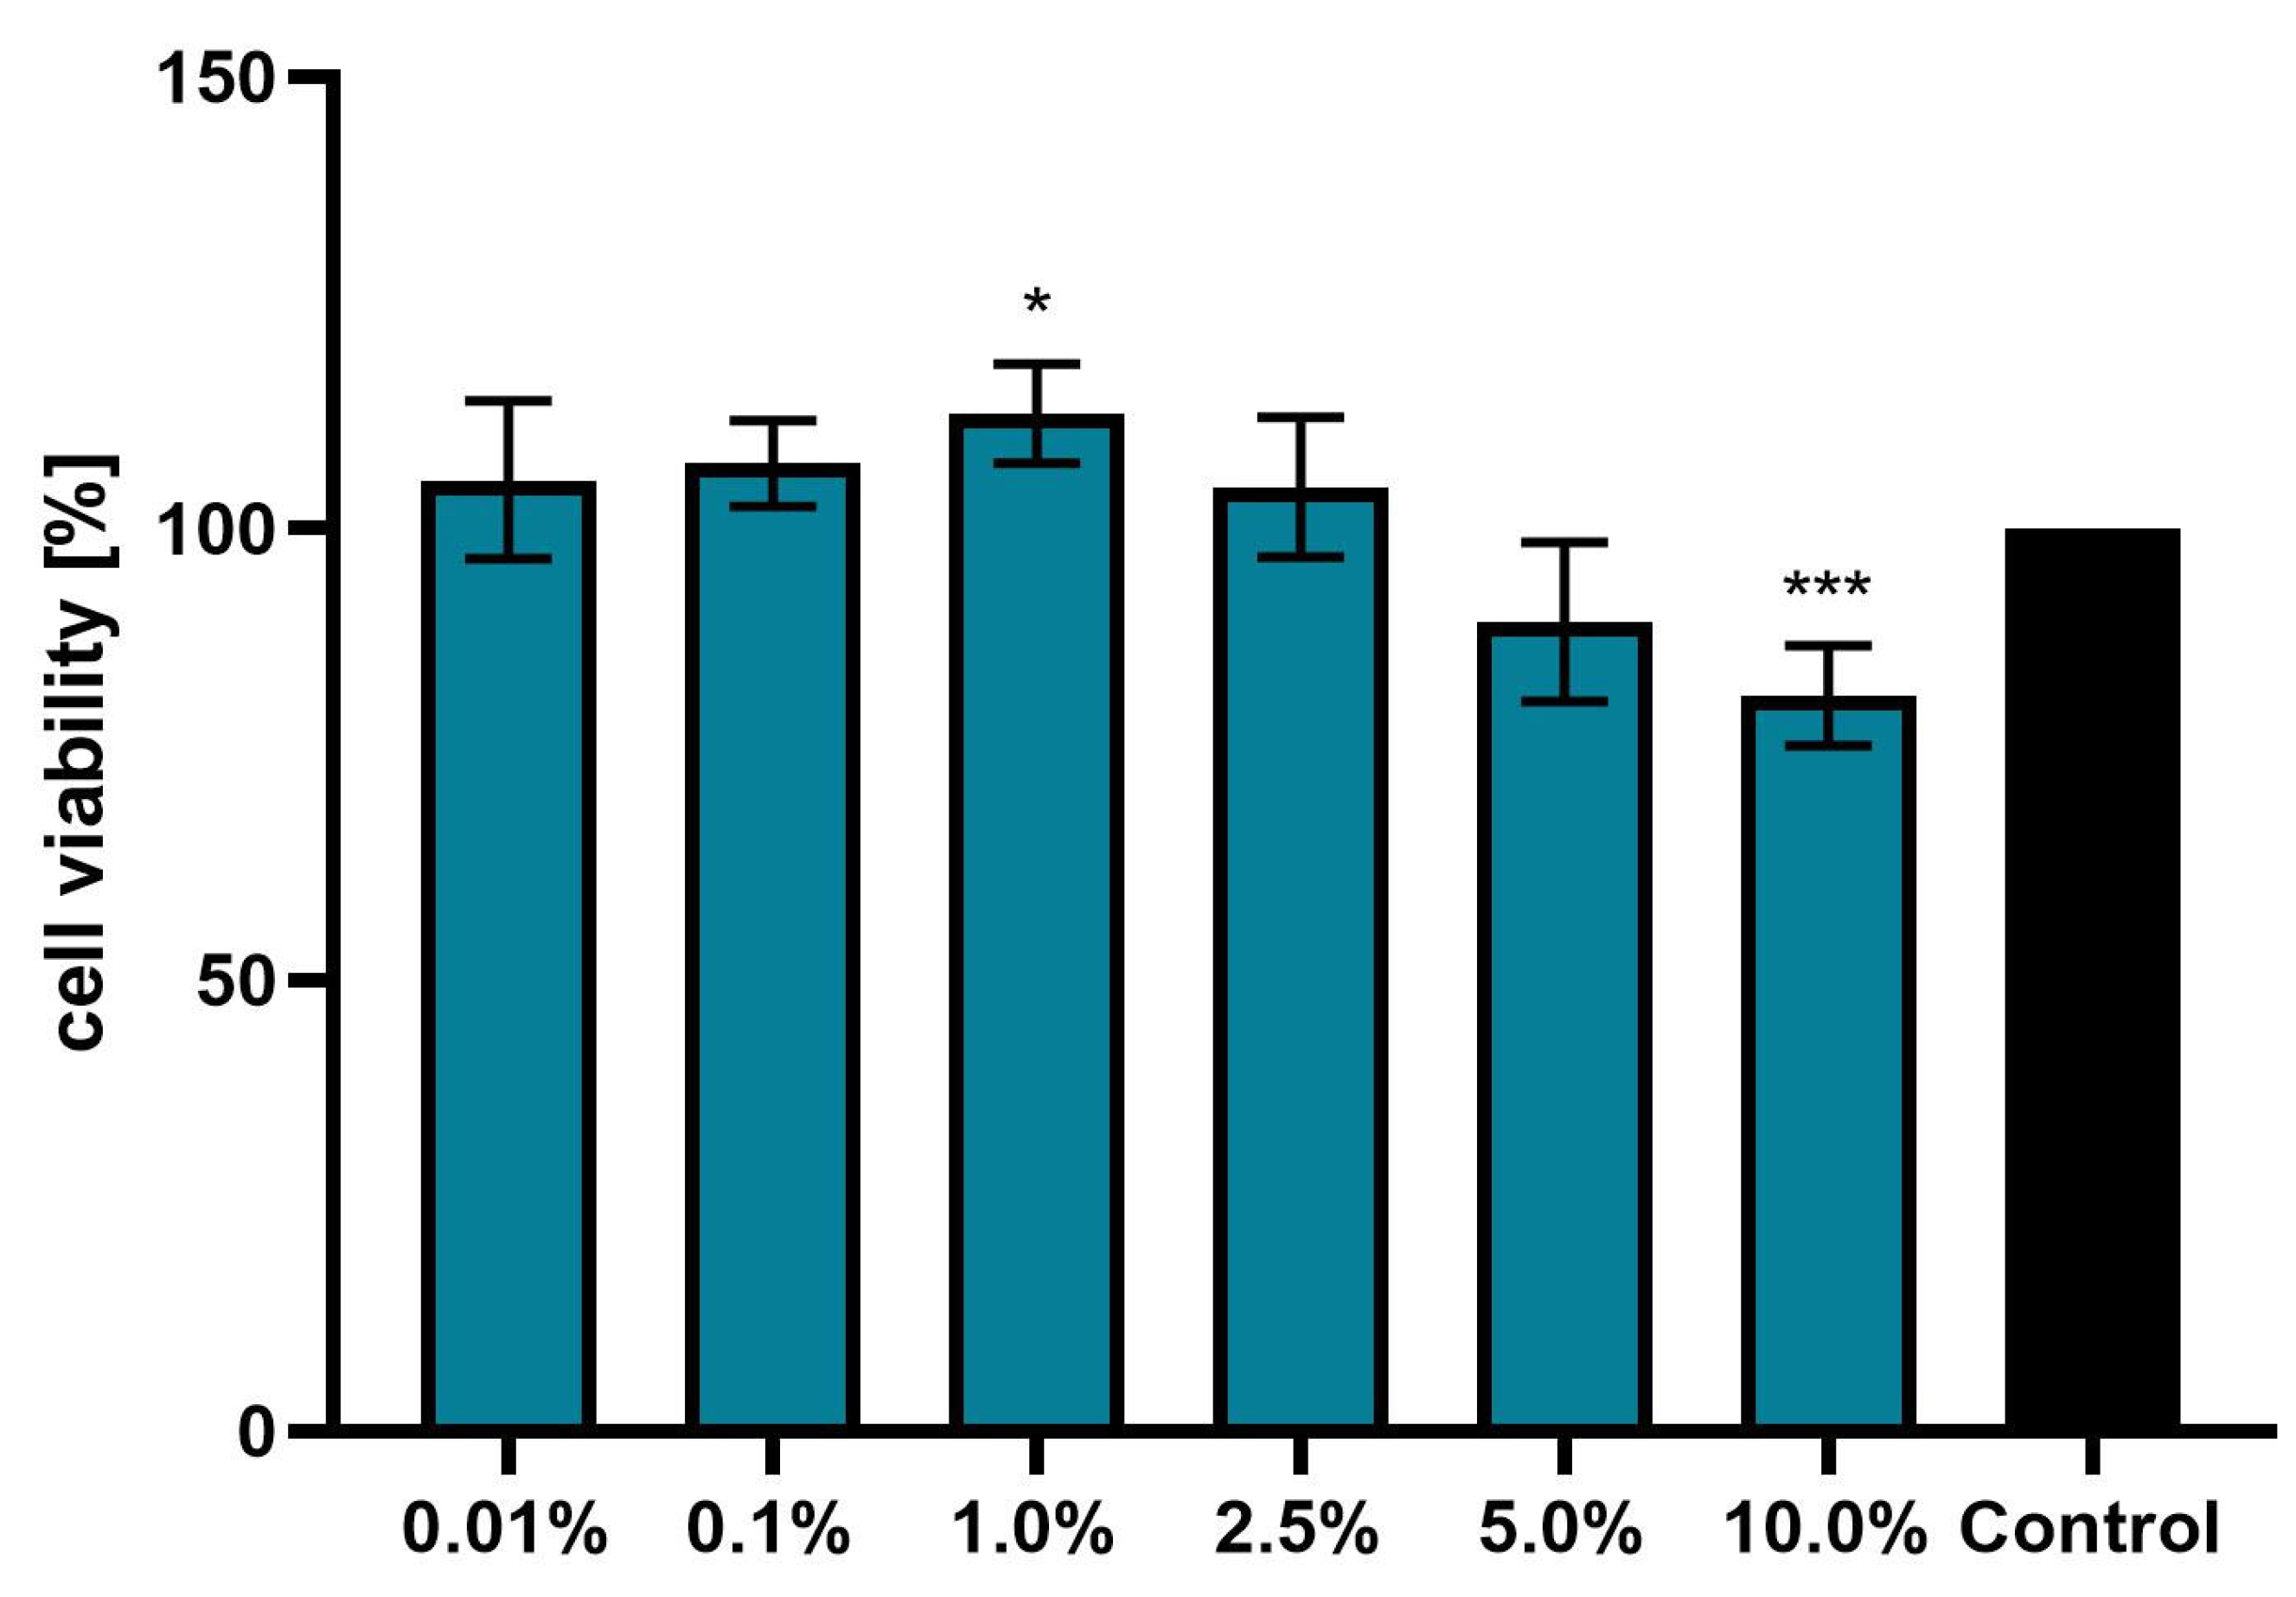
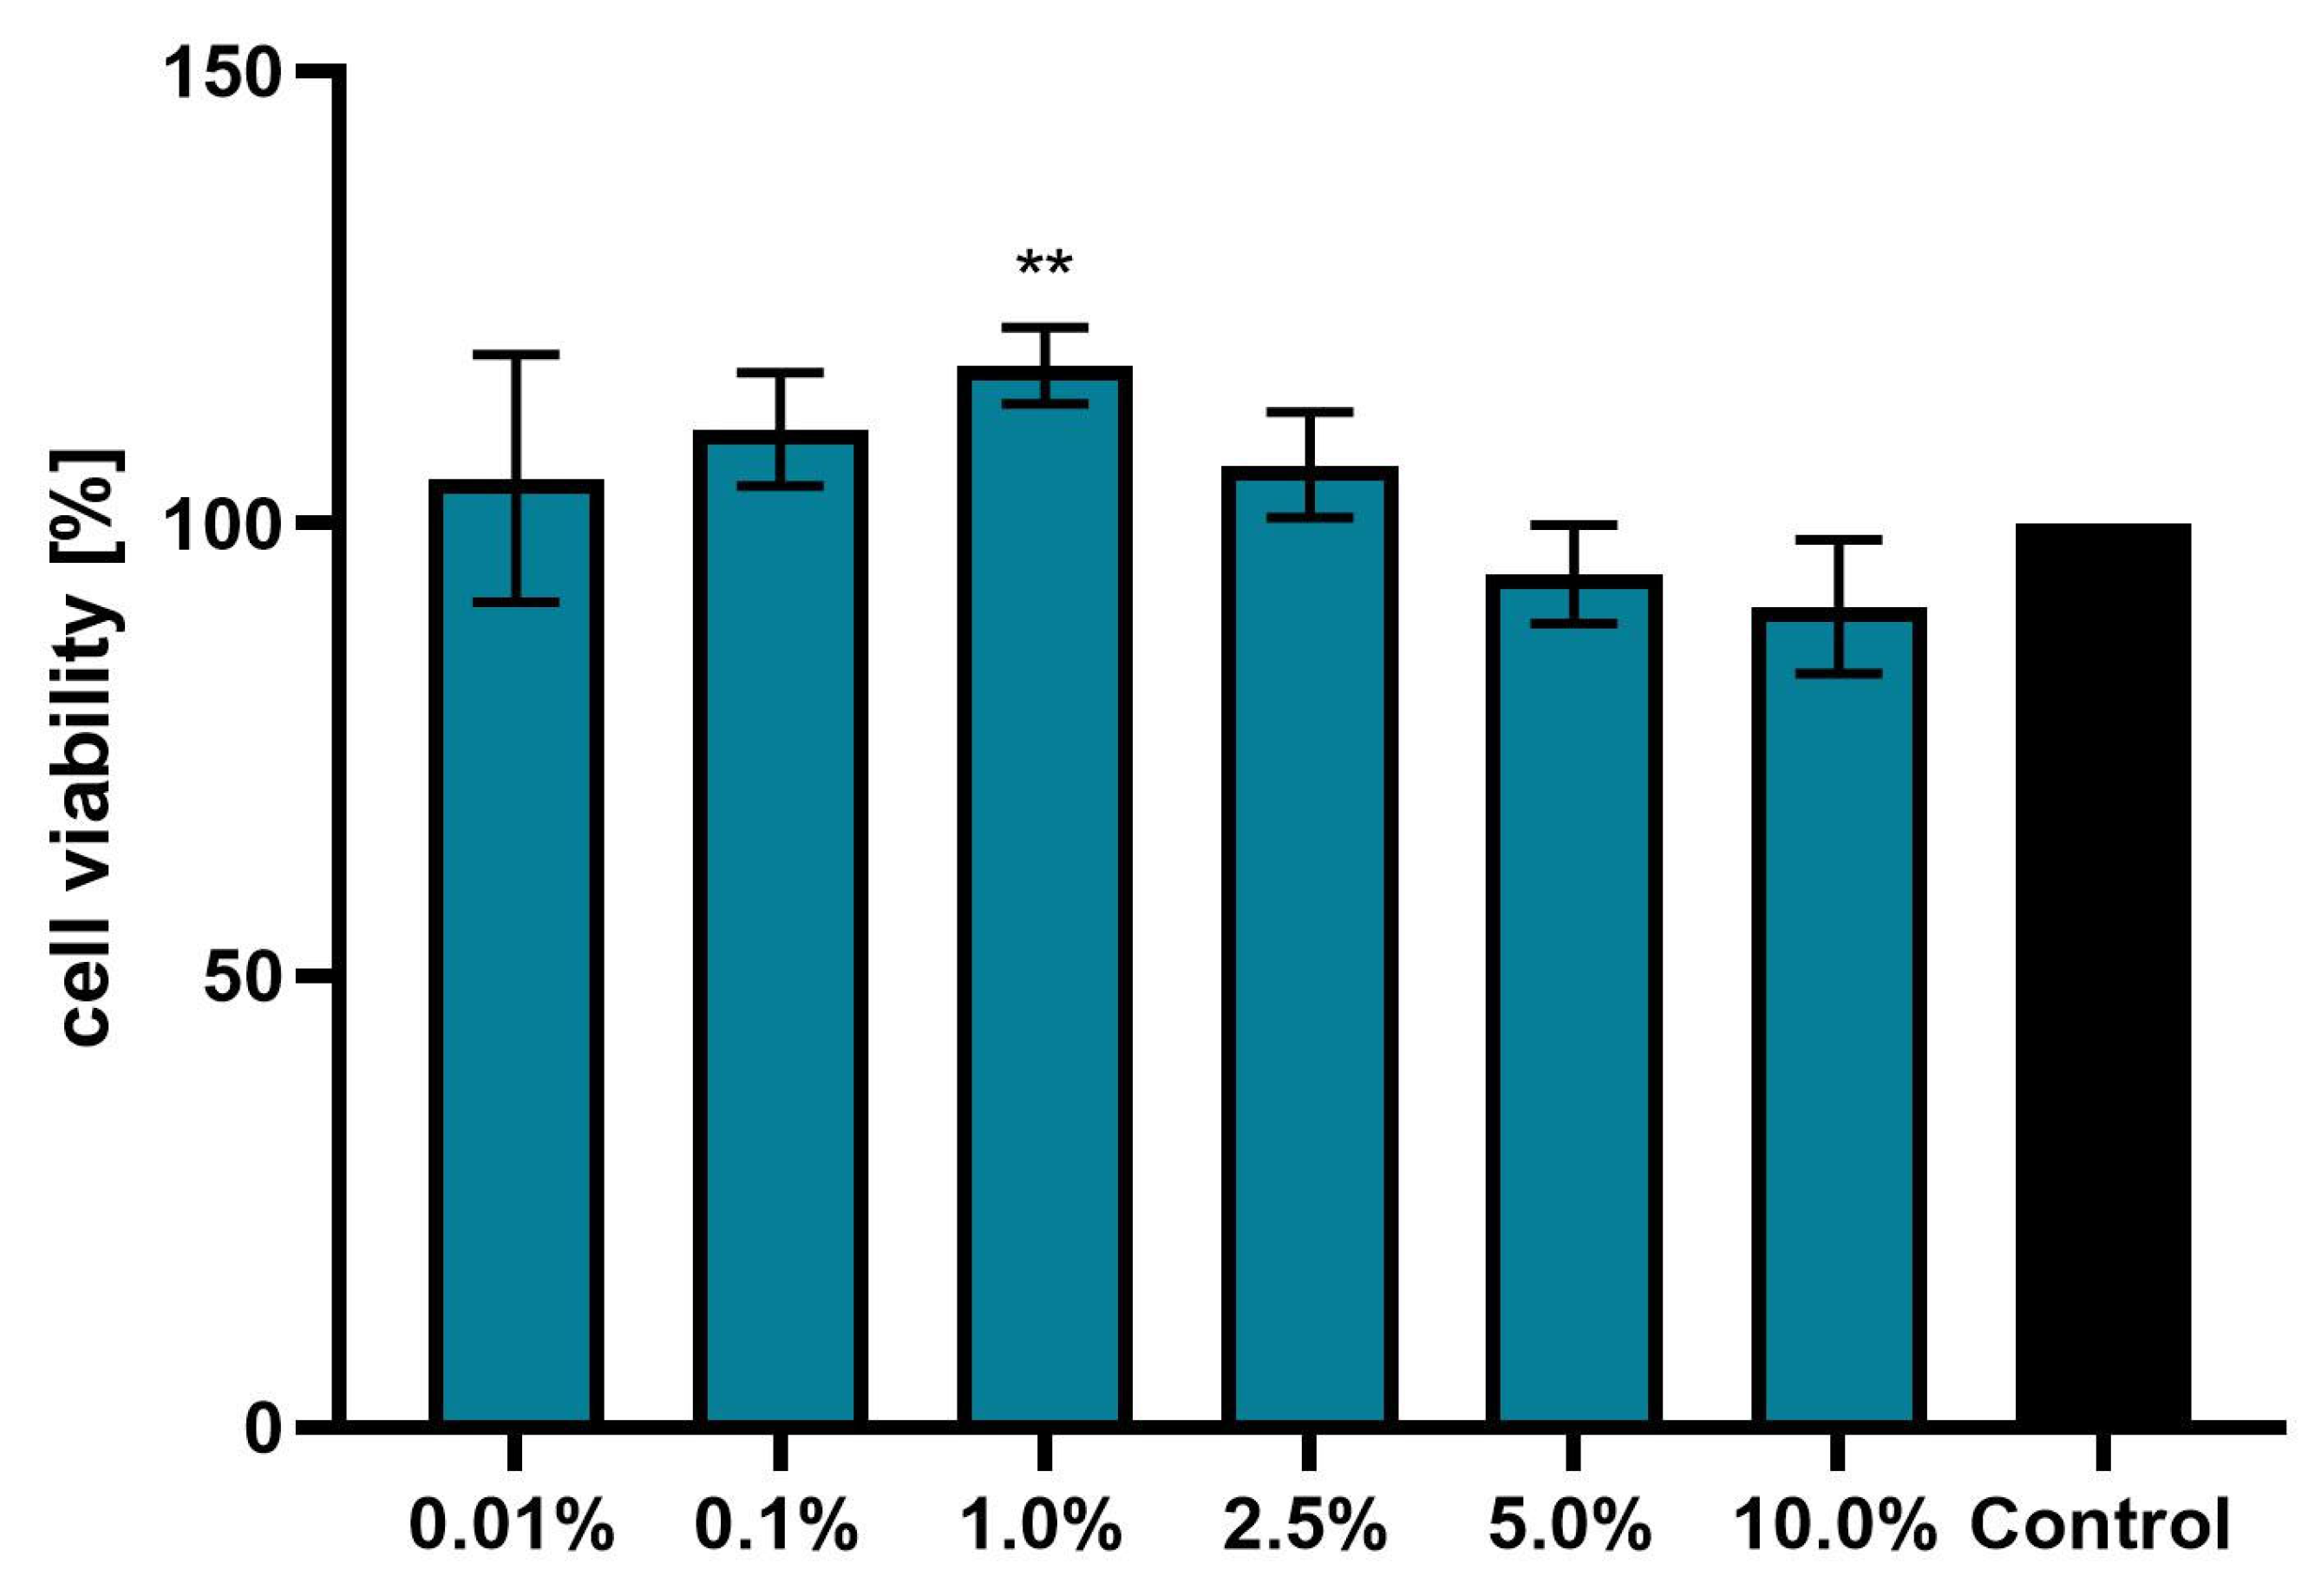
3.3. Effect of Achillea millefolium Extract on Skin Cell Viability

To assess the cytotoxicity of the extract on skin cells, the metabolic activity and integrity of cell membranes were assessed in HaCaT and HDF cells exposed to the extract for 24 h at concentrations from 0.01% to 10.0%. The effect of the extract was shown to depend on both the concentration and the type of cells. In the test assessing resazurin reduction (AB assay), a positive effect of the yarrow extract was observed in the concentration range of 0.01% to 2.5% in the case of keratinocytes, and in the range of 0.01% to 5% in the case of fibroblasts. The greatest increase in the metabolic activity of both cell types was observed for the concentration of 1.0%, at which the viability of HaCaT cells was 112.7% and that of HDF cells was 116.9%. In both cell types, the extract at a concentration of 10% inhibited cell viability, especially in the case of keratinocytes, with 18.5% inhibition of viability (Figure 3 and Figure 4).
The results obtained using neutral red dye (NR assay) also showed the most beneficial effect of the A. millefolium extract in the concentration range of 0.01–2.5%. The greatest accumulation of neutral red in the lysosomes was observed at a concentration of 1.0%, which resulted in keratinocyte viability of 117.5% and HDF cell viability of 114.8%. In the case of HaCaT cells, 5.0% and 10.0% concentrations of the extract reduced viability to 94.3% and 90.7%, respectively. In the case of fibroblasts, the NR assay showed no significant cytotoxic effect at any of the concentrations used (Figure 5 and Figure 6).
The plant studied in this work contains several bioactive plant compounds that can have a beneficial effect on the viability of skin cells through antioxidant, anti-inflammatory, cell proliferation-stimulating, and protective effects against oxidative stress and UV radiation [27,28]. The polyphenols contained in the extract can neutralize free radicals, thus protecting skin cells from oxidative damage. This action supports the integrity of cell membranes and mitochondrial homeostasis, increasing the viability of keratinocytes and fibroblasts [27,29]. The literature data also indicate that polyphenolic compounds reduce the effects of UV on skin cells by reducing the expression of collagen- or elastin-degrading metalloproteinases and increasing the level of endogenous antioxidant enzymes such as superoxide dismutase, catalase, and glutathione peroxidase. This results in a reduction of DNA damage, apoptosis, and oxidative stress [30,31,32]. As shown by the results obtained in this work, the lower concentrations of the extract used have a positive effect on the viability of the tested skin cells in vitro. An increase in the concentration of biologically active compounds affecting the tested cells causes a successive increase in their metabolic activity and proliferation, reaching maximum viability at a concentration of extract equal to 1%. A slight decrease in viability after exceeding this concentration may be the result of too many biologically active plant compounds, which in excess may reduce cell viability by increasing intracellular oxidative stress [33,34].

3.4. Anti-Ageing Activity of Achillea millefolium Extract

Skin ageing processes are often associated with the degradation of collagen and elastin fibres present in the skin, which results in the loss of its elasticity and firmness. The ageing process is also accompanied by the development of various types of pigmentation disorders, which result in the appearance of mottled pigmentation (senile lentigo) and melasma on the skin surface [35]. Therefore, the next stage of the study was to assess the ability of the A. millefolium extract to inhibit the activity of collagenase and elastase, whose enzymatic activity is closely linked to the degradation of extracellular matrix proteins such as collagen and elastin. The results of the analyses indicated that the extracts showed a concentration-dependent ability to inhibit the activity of both endopeptidases. At a concentration of 5.0%, the extract inhibited elastase activity by 19.2%, while inhibition of collagenase was stronger and reached 43.8%. In the evaluation of the potential ability of the extract to inhibit hyperpigmentation disorders, 15.5% and 23.4% inhibition of tyrosinase activity was observed for 1% and 5% concentrations, respectively (Figure 7).
Reactive oxygen species are an important factor negatively affecting skin cell function. Free radical reactions lead to the disruption of defence and repair mechanisms in the skin. ROS is also produced by UV radiation on the skin, and signs of photo-ageing include a reduction in the number of skin fibroblasts, collagen breakdown, or elastotic changes in the dermis [36].
In light of the above, the effect of yarrow extract in vitro on intracellular ROS levels in both UVB-irradiated and non-irradiated keratinocytes and fibroblasts was assessed. A. millefolium extracts, in the concentration range 0.01–5.0%, were shown to reduce ROS levels in both UVB-exposed and non-exposed cells. This effect was observed on both keratinocytes and fibroblasts. In most cases (except UVB-irradiated HDF cells), ROS levels were higher in cells treated with 10.0% extract than in control cells (untreated with extracts) (Figure 8 and Figure 9).
The results indicate that the yarrow extract can reduce oxidative stress in skin cells exposed to UVB radiation, protecting them from the negative effects of excessive ROS production in these cells. A slight increase in the number of free radicals in cells after exposure to a 10% concentration of the tested extract may be the result of a large number of phenolic compounds, such as flavonoids or phenolic acids. The literature data indicate that these phytochemicals act as antioxidants at lower concentrations, neutralizing free radicals. However, at higher concentrations, they may exhibit prooxidant activity and intensify oxidative stress by activating the Fenton reaction, autoxidation of phenolic compounds, disruption of redox homeostasis, and inducing a cytotoxic effect [33,34,37,38,39,40]. As reported by Valko et al., the introduction of a large amount of plant compounds with a strong redox potential may disturb this balance and cause oxidative stress instead of reducing it. In this way, an excess of antioxidants may suppress the cell’s natural defense mechanisms [38]. On the other hand, autoxidation of phytochemicals contained in extracts may lead to the production of peroxides and other reactive oxygen species, which may result in cell damage [34].

3.5. Rheological Properties and Sun Protection Factor (SPF) of an Extract-Based Cream

In this part of the study, the A. millefolium extract was incorporated into a base cream developed by the authors. Rheological tests were conducted for the cream, and its SPF was determined by comparing it with the UV protection factor of yarrow extract.
Rheological properties have a major impact on the quality of a cosmetic. An appropriate viscosity enables convenient dosing of the product and affects sensory parameters, such as spreadability and the cushion effect, ensuring comfort of use. In the case of skin care cosmetics, viscosity also significantly affects the effectiveness of the product. Previous studies show that the release of active substances from the cosmetic is more effective at low viscosity values [41]. The viscosity of the formulation as a function of shear rate is shown in Figure 10.
For all samples tested, the viscosity curves have a similar shape typical of non-Newtonian fluids thinned by shear. The viscosity of such fluids decreases as the shear rate increases. This shape of the viscosity curve is typical for emulsion formulations [42]. This is highly advantageous in terms of application. High viscosity at low shear rates enables dosing of the product. However, reduced viscosity in combination with high shear force facilitates the release of active particles from the formulation as it is spread over the skin.
Chronic exposure of the skin to UV radiation leads to many adverse effects, such as sunburn, premature skin ageing, and in extreme cases, even skin cancer. The task of sunscreen cosmetics is to counteract these unfavourable processes. The main ingredient in cosmetic formulas is UV filters, which are responsible for radiation protection properties. Currently, two types of filters are commercially used: inorganic (physical) and organic (chemical). The mechanism of action of inorganic filters is based on typical physical reflection and scattering of radiation, while organic filters act mainly as radiation absorbers [43,44,45]. Both types of filters have their limitations, associated with low efficiency, potential phototoxicity, or photosensitization. They can also adversely affect the natural environment. Therefore, intensive searches for effective and ecological UV filters are ongoing.
Due to the current trend of sustainable development and care for the natural environment, plant materials are the most suitable alternative to synthetic UV filters. One proposal that fits into this ecological trend is the use of plant extracts both as stand-alone filters and as substances supporting photoprotection. Plant extracts have many compounds containing aromatic rings and other functional groups, which usually have a wider absorption spectrum, covering a wavelength range of 200–400 nm [44,46]. Plant ingredients used as UV filters usually also exhibit strong antioxidant properties. In addition, phytochemicals, which are considered non-toxic and pharmacologically safe, have been shown to have genoprotective and anticancer properties. They can prevent cell mutations associated with skin cancer and ageing by regulating UV-induced mutations [47,48,49,50].
The UV absorption of A. millefolium extract was analysed. To select the optimal concentration of the extract for the cosmetic cream, the absorption of aqueous solutions of extracts was tested at various concentrations, from 100%wt. to 0.5%wt. The initial extract solution of 2 g of dry matter dissolved in 60 mL of water–ethanol solvent was assigned a value of 100%. The UV absorption spectra for the aqueous solutions are presented in Figure 11.
The A. millefolium extract showed a high absorption capacity in the UV range, which indicates potential protection against both UVB (280–320 nm) and UVA (320–400 nm). Reducing the concentration to 5% did not reduce the absorption in the shorter wavelength range, including the UVB region (290–320 nm). However, in the UVA region (320–400 nm), the absorption value decreased together with the extract concentration. The absorption of UV radiation is mainly due to flavonoids present in the extract [47,48,51]. Available literature data [43,48,51] indicate that most flavonoids show absorption in the range from 240 to 280 nm and from 300 to 400 nm. The range of absorption bands closely corresponds to the structure of the polyphenol molecule, both the degree of conjugation and the number and position of substituents and OH groups. Spectral analysis (UV) of flavanols provides absorption bands in the range of 270–290 nm. Epicatechin provides an absorption band at 278 nm, catechin at 280 nm, and chrysin, hesperetin, eriodictyol, and taxifolin at 288 nm [51]. The range of absorption bands, both the position of the peaks and their value, is strictly dependent on the composition of the extract itself and can be very diverse even among extracts obtained from the same plant [48].
The results of the UV absorption tests of the A. millefolium extract influenced the decision regarding the composition of the cosmetic cream, in particular, the content of the extract. Four cosmetic creams were prepared: E0, without extract, and E1, E5, and E10 containing 1%, 5%, and 10% extract, respectively. The SPF factor of the creams was calculated based on measurement of UV absorption.
SPF is a measure of the amount of solar energy needed to induce redness on protected skin relative to the amount of solar energy needed to induce redness on unprotected skin. The higher the SPF value, the better the sun protection of the cosmetic. The recommended method for assessing SPF is based on in vivo tests with the participation of volunteers. The methodology was developed and published by Colipa [52] and has been introduced into standardized measurement systems in Europe, Japan, and South Africa [45]. However, the use of in vivo methods is very difficult and time-consuming. Therefore, scientists are continually proposing more convenient in vitro methods using laboratory equipment. One of these is the Mansur method [22], which was used in this study. The Mansur method is distinguished by simplicity and good repeatability. It also shows good correlation with in vivo tests [46].
The SPF designation is based on the relationship between the erythematogenic effect (EE) and the radiation intensity at each wavelength. A detailed description of the method and calculations is presented in the section on research methodology.
Based on the absorbance measurements, SPF was determined for individual samples (Figure 12).
The SPF was lowest for the base sample without the extract (E0), amounting to 0.9. This value is not classified as protecting against the sun [45]. Higher SPF values were obtained for the remaining samples: 10.2 for E1 (classified as low protection), 18.5 for E5, and 20.7 for E10 (both classified as medium protection).
In summary, it can be stated that many authors are undertaking research on A. millefolium [2,24,29], some of them also pointing to cosmetic and dermatological aspects of the use of this plant [7,53,54]. The study presents an evaluation of the cosmetic potential of extracts from Achillea millefolium herb of the “paprika” cultivar, which has previously not been studied in this regard. Research on evaluating the antimicrobial and anti-ageing properties of water–ethanol extracts of yarrow complements and extends the existing knowledge in this field. Another novel aspect of the research was the determination of the sun protection factor of a model formulation based on the extract, as well as the rheological characteristics of the formulation, which determine its potential applications.

4. Conclusions

In present paper, a phytochemical comparative analysis of two extracts was conducted, which confirmed that the extract obtained using ultrasound had a higher content of polar compounds—polyphenols—with antioxidant properties than that obtained using supercritical carbon dioxide.
In addition, the water–ethanol extract obtained by UAE was tested for biological properties of importance for potential cosmetic applications. The antimicrobial tests against 14 bacterial strains and one fungal strain showed the highest sensitivity for C. albicans, P. aeruginosa, B. subtilis, and R. solanacearum and the lowest for E. coli and E. faecalis. The extract exhibited antibiofilm properties against only four strains of S. agalactiae, E. faecalis, S. mutans, and P. mirabilis.
The cytotoxicity study showed that the extract caused the greatest increase in metabolic activity in both keratinocytes and fibroblasts at a concentration of 1.0%. The assessment of inhibition of collagenase, elastase, and tyrosinase activity showed that the extracts (at 1% and 5%) inhibited the activity of these enzymes in a concentration-dependent manner. The results of the protective activity test showed that the A. millefolium extract in the concentration range of 0.01–5.0% reduced the intracellular level of ROS in both UVB-irradiated and non-irradiated cells, both keratinocytes and fibroblasts.
The rheological tests of the cosmetic creams based on the extract at concentrations of 1%, 5%, and 10% showed that the viscosity curves for all samples had a similar shape typical of non-Newtonian fluids thinned by shear. The A. millefolium extract showed a high absorption capacity in the UV range, which indicates potential protection against both UVB (280–320 nm) and UVA (320–400 nm) radiation. The sun protection factor (SPF) of the creams was 10.2, 18.5, or 20.07, depending on the extract concentration (1%, 5%, and 10%, respectively), which is classified as medium sun protection. The data presented indicate that A. millefolium extract can be a valuable material in the cosmetics industry, with antioxidant, antimicrobial, anti-ageing, and sun protective activity.

Author Contributions

Conceptualization, M.M.; methodology, M.Z.-D., P.Ż., M.S., D.K., A.B.-J., K.P. and M.M.; formal analysis, M.Z.-D., P.Ż., A.B.-J., M.S., M.M. and N.D.; investigation, M.M., M.Z.-D., P.Ż., A.B.-J., M.S., N.D. and K.P.; resources, M.M. and D.K.; writing—original draft preparation, M.M., M.Z.-D., A.B.-J., P.Ż. and N.D.; writing—review and editing, M.M. and K.P.; visualization, M.M., M.Z.-D. and A.B.-J.; supervision, M.M.; project administration, M.M.; funding acquisition, M.M. and P.Ż. All authors have read and agreed to the published version of the manuscript.

Funding

This study was supported by a grant from the Jan Kochanowski University SUPB.RN.25.019, 2025 and co-financed by the Minister of Science (Poland) under the “Regional Excellence Initiative” program (project no.: RID/SP/0015/2024/01).

Institutional Review Board Statement

Not applicable.

Informed Consent Statement

Not applicable.

Data Availability Statement

The data presented in this study are available on request from the corresponding author.

Conflicts of Interest

The authors declare no conflicts of interest.

Abbreviations

The following abbreviations are used in this manuscript:
EMAEuropean Medicines Agency
CosIngCosmetic ingredient database
F-CFolin–Ciocalteu
TPTZ2,4,6-tripyridyl-s-triazine
DMEMDulbecco’s Modified Eagle’s Medium
UAEUltrasound-assisted extraction
SFESupercritical fluid extraction
TPTotal polyphenol
GAEGallic acid equivalents
TFTotal flavonoid
CECatechin equivalents
TPATotal phenolic acid
CAECaffeic acid equivalents
CTCondensed tannin
DpEDelphinidin equivalents
FRAPFerric Reducing Antioxidant Power
TETrolox equivalent
DPPH2,2-diphenyl-1-picrylhydrazyl
MICMinimal Inhibitory Concentration
CLSIClinical and Laboratory Standards Institute
MBCMinimum Bactericidal Concentration
MFCMinimum Fungicidal Concentration
ABAlamar Blue
NRNeutral Red
ROSReactive Oxygen Species
CFCorrection factor
EEErythemogenic effect
ABTS2,2′-azino-bis-(3-ethylbenzothiazoline-6-sulfonic) acid)
ORACOxygen radical absorbance capacity
MDPIMultidisciplinary Digital Publishing Institute
DOAJDirectory of open access journals
TLAThree letter acronym
LDLinear dichroism

References

  1. Lakshmi, T.; Goetha, R.V.; Roy, A.; Kumar, A. Yarrow (Achillea millefolium Linn.) a herbal medicinal plant with broad therapeutic use—A review. Int. J. Pharm. Sci. Rev. Res. 2011, 9, 136–141. [Google Scholar]
  2. Vitalini, S.; Beretta, G.; Iriti, M.; Orsenigo, S.; Basilico, N.; Dall’Acqua, S.; Iorizzi, M.; Fico, G. Phenolic compounds from Achillea millefolium L. and their bioactivity. Acta Biochim. Pol. 2011, 58, 203–207. [Google Scholar] [CrossRef] [PubMed]
  3. Far, B.F.; Behzad, G.; Khalili, H. Achillea millefolium: Mechanism of action, pharmacokinetic, clinical drug-drug interactions and tolerability. Heliyon 2023, 9, e22841. [Google Scholar] [CrossRef]
  4. Ali, S.I.; Gopalakrishnan, B.; Venkatesalu, V. Pharmacognosy, Phytochemistry and Pharmacological Properties of Achillea millefolium L.: A Review. Phytother. Res. 2017, 8, 1140–1161. [Google Scholar] [CrossRef]
  5. Akram, M. Minireview on Achillea millefolium Linn. J. Membr. Biol. 2013, 9, 661–663. [Google Scholar] [CrossRef]
  6. Borrelli, F.; Romano, B.; Fasolino, I.; Tagliatatela-Scafati, O.; Aprea, G.; Capasso, R.; Coppola-Bottazzi, E.; Izzo, A.A. Prokinetic effect of a standardized yarrow (Achillea millefolium) extract and its constituent choline: Studies in the mouse and human stomach. Neurogastroenterol. Motil. 2012, 24, 164–171. [Google Scholar] [CrossRef]
  7. Becker, L.C.; Bergfeld, W.F.; Belsito, D.V.; Hill, R.A.; Klaassen, C.D.; Liebler, D.C.; Marks, J.G., Jr.; Shank, R.C.; Slaga, T.J.; Snyder, P.W.; et al. Safety Assessment of Achillea millefolium as Used in Cosmetics. Int. J. Toxicol. 2016, 35, 5–15. [Google Scholar] [CrossRef]
  8. Cosmetic Ingredient Database (CosIng). Available online: https://ec.europa.eu/growth/tools-databases/cosing/ (accessed on 3 January 2025).
  9. European Medicines Agency (EMA). Available online: https://www.ema.europa.eu/en/search?search_api_fulltext=achillea&f%5B0%5D=ema_search_entity_is_document%3ADocument (accessed on 4 January 2025).
  10. Agbor, G.A.; Vinson, J.A.; Donnelly, P.E. Folin-Ciocalteau Reagent for Polyphenolic Assay. Int. J. Food Sci. Nutr. Diet. 2014, 3, 147–156. [Google Scholar] [CrossRef]
  11. Kim, D.-O.; Jeong, S.W.; Lee, C.Y. Antioxidant capacity of phenolic phytochemicals from various cultivars of plums. Food Chem. 2003, 81, 321. [Google Scholar] [CrossRef]
  12. Jain, R.; Rao, B.; Tare, A.B. Comparative analysis of the spectrophotometry based total phenolic acid estimation methods. J. Anal. Chem. 2017, 72, 972–976. [Google Scholar] [CrossRef]
  13. Tlili, H.; Hanen, N.; Ben Arfa, A.; Neffati, M.; Boubakri, A.; Buonocore, D.; Dossena, M.; Verri, M.; Doria, E. Biochemical profile and in vitro biological activities of extracts from seven folk medicinal plants growing wild in southern Tunisia. PLoS ONE 2019, 14, e0213049. [Google Scholar] [CrossRef] [PubMed]
  14. Benzie, I.F.F.; Strain, J.J. The Ferric Reducing Ability of Plasma (FRAP) as a Measure of “Antioxidant Power”: The FRAP Assay. Anal. Biochem. 1996, 239, 70–76. [Google Scholar] [CrossRef] [PubMed]
  15. CLSI. Methods for Dilution Antimicrobial Susceptibility Tests for Bacteria That Grow Aerobically; Approved Standard—Ninth Edition, CLSI Document M07-A9; Clinical and Laboratory Standards Institute: Wayne, PA, USA, 2012. [Google Scholar]
  16. Sarker, S.D.; Nahar, L.; Kumarasamy, Y. Microtitre plate-based antibacterial assay incorporating resazurin as an indicator of cell growth, and its application in the in vitro antibacterial screening of phytochemicals. Methods 2007, 42, 321–324. [Google Scholar] [CrossRef] [PubMed]
  17. Merritt, J.H.; Kadouri, D.E.; O’Toole, G.A. Growing and analyzing static biofilms. Curr. Protoc. Microbiol. 2005, 22, 1B.1.1–1B.1.18. [Google Scholar] [CrossRef]
  18. Terzić, J.; Stanković, M.; Stefanović, O. Extracts of Achillea millefolium L. inhibited biofilms and biofilm-related virulence factors of pathogenic bacteria isolated from wounds. Microb. Pathog. 2025, 199, 107219. [Google Scholar] [CrossRef]
  19. Ziemlewska, A.; Zagórska-Dziok, M.; Mokrzyńska, A.; Nizioł-Łukaszewska, Z.; Szczepanek, D.; Sowa, I.; Wójciak, M. Comparison of Anti-Inflammatory and Antibacterial Properties of Raphanus sativus L. Leaf and Root Kombucha-Fermented Extracts. Int. J. Mol. Sci. 2024, 25, 5622. [Google Scholar] [CrossRef]
  20. Zagórska-Dziok, M.; Mokrzyńska, A.; Ziemlewska, A.; Nizioł-Łukaszewska, Z.; Sowa, I.; Feldo, M.; Wójciak, M. Assessment of the Antioxidant and Photoprotective Properties of Cornus mas L. Extracts on HDF, HaCaT and A375 Cells Exposed to UVA Radiation. Int. J. Mol. Sci. 2024, 25, 10993. [Google Scholar] [CrossRef]
  21. Krochmal-Marczak, B.; Zagórska-Janiszewska, M.; Michalak, M.; Kiełtyka-Dadasiewicz, A. Comparative assessment of phenolic content, cellular antioxidant, antityrosinase and protective activities on skin cells of extracts from three sweet potato (Ipomoea batatas (L.) Lam.) cultivars. J. King Saud Univ. Sci. 2021, 33, 6. [Google Scholar] [CrossRef]
  22. Mansur, J.D.S.; Breder, M.N.R.; Mansur, M.C.D.A.; Azulay, R.D. Determinaçäo do fator de proteçäo solar por espectrofotometria. An. Bras. Dermatol. 1986, 61, 121–124. [Google Scholar]
  23. Sayre, R.M.; Agin, P.P.; LeVee, G.J.; Marlowe, E. A comparison of in vivo and in vitro testing of sunscreening formulas. Photochem. Photobiol. 1979, 29, 559–566. [Google Scholar] [CrossRef]
  24. Villalva, M.; Santoyo, S.; Salas-Pérez, L.; Nieves Siles-Sánchez, M.; Rodríguez García-Risco, M.; Fornari, T.; Reglero, G.; Jaime, L. Sustainable Extraction Techniques for Obtaining Antioxidant and Anti-Inflammatory Compounds from the Lamiaceae and Asteraceae Species. Foods 2021, 10, 2067. [Google Scholar] [CrossRef] [PubMed]
  25. Abu Safe, F.A.; Badr, A.N.; Shehata, M.G.; El-Sayyad, G.S. Antimicrobial and anti-aflatoxigenic activities of nanoemulsions based on Achillea millefolium and Crocus sativus flower extracts as green promising agents for food preservatives. BMC Microbiol. 2023, 23, 289. [Google Scholar] [CrossRef] [PubMed]
  26. Barbinta-Patrascu, M.-E.; Nichita, C.; Enculescu, M.; Maraloiu, V.-A.; Bacalum, M.; Ungureanu, C.; Negrila, C.C.; Zgura, I. Bioactive Hybrids Containing Artificial Cell Membranes and Phyto-Gold–Silver Chloride Bio-Nanoparticles. Int. J. Mol. Sci. 2024, 25, 11929. [Google Scholar] [CrossRef] [PubMed]
  27. Petruk, G.; Del Giudice, R.; Rigano, M.M.; Monti, D.M. Antioxidants from plants protect against skin photoaging. Oxidative Med. Cell. Longev. 2018, 2018, 1454936. [Google Scholar] [CrossRef]
  28. Benetis, R.; Radušienė, J.; Jakštas, V.; Janulis, V.; Malinauskas, F. Development of an RP-HPLC Method for the Analysis of Phenolic Compounds in Achillea millefolium L. J. Liq. Chromatogr. Relat. Technol. 2008, 31, 596–610. [Google Scholar] [CrossRef]
  29. Villalva, M.; Silvan, J.M.; Alarcón-Cavero, T.; Villanueva-Bermejo, D.; Jaime, L.; Santoyo, S.; Martinez-Rodriguez, A.J. Antioxidant, Anti-Inflammatory, and Antibacterial Properties of an Achillea millefolium L. Extract and Its Fractions Obtained by Supercritical Anti-Solvent Fractionation against Helicobacter pylori. Antioxidants 2022, 11, 1849. [Google Scholar] [CrossRef]
  30. Ghazi, S. Do the polyphenolic compounds from natural products can protect the skin from ultraviolet rays? Res. Chem. 2022, 4, 100428. [Google Scholar] [CrossRef]
  31. D’Orazio, N.; Gammone, M.A.; Gemello, E.; De Girolamo, M.; Ficoneri, C.; Riccioni, G. Skin protection against UV rays: A review of in vivo and in vitro studies. Int. J. Mol. Sci. 2013, 14, 12222–12248. [Google Scholar] [CrossRef]
  32. Farjadmand, F.; Karimpour-Razkenari, E.; Nabavi, S.M.; Ardekani, M.R.S.; Saeedi, M. Plant Polyphenols: Natural and Potent UV-Protective Agents for the Prevention and Treatment of Skin Disorders. Mini. Rev. Med. Chem. 2021, 21, 576–585. [Google Scholar] [CrossRef]
  33. Rajashekar, C.B. Dual Role of Plant Phenolic Compounds as Antioxidants and Prooxidants. Am. J. Plant Sci. 2023, 14, 15–28. [Google Scholar] [CrossRef]
  34. Halliwell, B. Are polyphenols antioxidants or pro-oxidants? What do we learn from cell culture and in vivo studies? Arch. Biochem. Biophys. 2008, 476, 107–112. [Google Scholar] [CrossRef] [PubMed]
  35. Michalak, M. Plant Extracts as Skin Care and Therapeutic Agents. Int. J. Mol. Sci. 2023, 24, 15444. [Google Scholar] [CrossRef]
  36. Michalak, M. Plant-Derived Antioxidants: Significance in Skin Health and the Ageing Process. Int. J. Mol. Sci. 2022, 23, 585. [Google Scholar] [CrossRef] [PubMed]
  37. Galati, G.; O’Brien, P.J. Potential toxicity of flavonoids and other dietary phenolics: Significance for their chemopreventive and anticancer properties. Free Radic. Biol. Med. 2004, 37, 287–303. [Google Scholar] [CrossRef] [PubMed]
  38. Valko, M.; Leibfritz, D.; Moncol, J.; Cronin, M.T.D.; Mazur, M.; Telser, J. Free radicals and antioxidants in normal physiological functions and human disease. Int. J. Biochem. Cell Biol. 2007, 39, 44–84. [Google Scholar] [CrossRef]
  39. Kandaswami, C.; Lee, L.T.; Lee, P.P.; Hwang, J.J.; Ke, F.C.; Huang, Y.T.; Lee, M.T. The antitumor activities of flavonoids. In Vivo 2005, 19, 895–909. [Google Scholar]
  40. Farhan, M.; Rozvi, A. Understanding the Prooxidant Action of Plant Polyphenols in the Cellular Microenvironment of Malignant Cells: Role of Copper and Therapeutic Implications. Front. Pharmacol. 2022, 13, 929853. [Google Scholar] [CrossRef]
  41. Isaac, V.L.B.; Chiari-Andréo, B.G.; Marto, J.M.; Moraes, J.D.D.; Leone, B.A.; Corrêa, M.A.; Ribeiro, H.M. Rheology as a tool to predict the release of alpha-lipoic acid from emulsions used for the prevention of skin aging. BioMed. Res. Int. 2015, 1, 818656. [Google Scholar] [CrossRef]
  42. Kwak, M.S.; Ahn, H.J.; Song, K.W. Rheological investigation of body cream and body lotion in actual application conditions. Korea-Aust. Rheol. J. 2015, 27, 241–251. [Google Scholar] [CrossRef]
  43. Fuentes, J.L.; Pedraza Barrera, C.A.; Villamizar Mantilla, D.A.; Flórez González, S.J.; Sierra, L.J.; Ocazionez, R.E.; Stashenko, E.E. Flower Extracts from Ornamental Plants as Sources of Sunscreen Ingredients: Determination by In Vitro Methods of Photoprtective Efficacy, Antigenotoxicity and Safety. Molecules 2022, 27, 5525. [Google Scholar] [CrossRef]
  44. Liyan, L.; Chong, L.; Huang, T.; Ma, Y.; Li, Y.; Ding, H. Natural products and extracts from plants as natural UV filters for sunscreens: A review. Anim. Models Exp. Med. 2023, 6, 183–195. [Google Scholar] [CrossRef]
  45. Lionetti, N.; Rigano, L. The New Sunscreens among Formulation Strategy, Stability Issues, Changing Norms, Safety and Efficacy Evaluations. Cosmetics 2017, 4, 15. [Google Scholar] [CrossRef]
  46. Mansur, M.C.P.; Guimarães Leitãoa, S.; Cerqueira-Coutinhoa, C.; Vermelhob, A.B.; Silvac, R.S.; Octávio, A.F.; Presgravec Leitãod, A.A.C.; Leitãoe, G.G.; Ricci-Júniora, E.; Santosaa Faculdade, E.P. In vitro and in vivo evaluation of efficacy and safety of photoprotective formulations containing antioxidant extracts. Rev. Bras. Farmacog. 2016, 26, 251–258. [Google Scholar] [CrossRef]
  47. Misra, B.B.; Dey, S. Comparative phytochemical analysis and antibacterial efficacy of in vitro and in vivo extracts from East Indian sandalwood tree (Santalum album L.). Lett. Appl. Microbiol. 2012, 55, 476–486. [Google Scholar] [CrossRef]
  48. Ng, S.Y.; Eh Suk, V.R.; Gew, L.T. Plant polyphenols as green sunscreen ingredients: A systematic review. J. Cosmet. Dermatol. 2022, 21, 5409–5444. [Google Scholar] [CrossRef]
  49. Santha, S.; Dwivedi, C. Anticancer effects of sandalwood (Santalum album). Anticancer Res. 2015, 35, 3137–3145. [Google Scholar]
  50. Santhra Krishnan, P.; Salian, A.; Dutta, S.; Mandal, S. A roadmap to UV-protective natural resources: Classification, characteristics, and applications. Mater. Chem. Front. 2021, 5, 7696–7723. [Google Scholar] [CrossRef]
  51. Singh, K. Determination of Phenolics and Flavonoids in Ethanolic Extract of Rosa centifolia Using UV-Visible Spectroscopy. NVEO J. 2024, 11, 1–6. [Google Scholar] [CrossRef]
  52. Colipa. International sun protection factor test method. In The European Cosmetic; Toiletry and Perfumery Association: London, UK, 2006. [Google Scholar]
  53. Strzępek-Gomółka, M.; Gaweł-Bęben, K.; Kukula-Koch, W. Achillea Species as Sources of Active Phytochemicals for Dermatological and Cosmetic Applications. Oxidative Med. Cell. Longev. 2021, 2021, 6643827. [Google Scholar] [CrossRef]
  54. Gaweł-Bęben, K.; Strzępek-Gomółka, M.; Czop, M.; Sakipova, Z.; Głowniak, K.; Kukula-Koch, W. Achillea millefolium L. and Achillea biebersteinii Afan. Hydroglycolic Extracts–Bioactive Ingredients for Cosmetic Use. Molecules 2020, 25, 3368. [Google Scholar] [CrossRef]
Figure 1. Achillea millefolium L. var. paprika (photo M. Michalak).
Applsci 15 04631 g001
Figure 2. The prepared cosmetic creams; from the left: E0, the base cream; E1, cream with extract in concentrations of 1%; E5, cream with extract in concentrations of 5%; E10, cream with extract in concentrations of 10%.
Applsci 15 04631 g002
Figure 3. Reduction of resazurin by yarrow extract in the concentration range of 0.01% to 10.0% in HaCaT cells. Data are presented as the mean ± SD of three independent experiments, in which each extract concentration was tested in triplicate. *** p = 0.0008, * p = 0.0275 versus the control.
Applsci 15 04631 g003
Figure 4. Reduction of resazurin by yarrow extract in the concentration range of 0.01% to 10.0% in HDF cells. Data are presented as the mean ± SD of three independent experiments, in which each extract concentration was tested in triplicate.
Applsci 15 04631 g004
Figure 5. Neutral red dye uptake by yarrow extract in the concentration range of 0.01% to 10.0% in HaCaT cells. Data are presented as the mean ± SD of three independent experiments, in which each extract concentration was tested in triplicate. ** p = 0.0041 versus the control.
Applsci 15 04631 g005
Figure 6. Neutral red dye uptake by yarrow extract in the concentration range of 0.01% to 10.0% in HDF cells. Data are presented as the mean ± SD of three independent experiments, in which each extract concentration was tested in triplicate. *** p = 0.0002, * p = 0.0442 versus the control.
Applsci 15 04631 g006
Figure 7. Evaluation of the ability of yarrow extract at concentrations of 1.0% and 5.0% to inhibit the activity of collagenase, elastase, and tyrosine. **** p < 0.0001.
Applsci 15 04631 g007
Figure 8. Effect of yarrow extract at concentrations of 0.01–10.0% on intracellular reactive oxygen species (ROS) levels in non-irradiated and UVB-irradiated HaCaT cells. The control was HaCaT cells not treated with the extract. Data are presented as the mean ± SD of three independent experiments, in which each extract concentration was tested in triplicate. **** p < 0.0001, ** p = 0.0019 versus the control.
Applsci 15 04631 g008
Figure 9. Effect of yarrow extract at concentrations of 0.01–10.0% on intracellular reactive oxygen species (ROS) levels in non-irradiated and UVB-irradiated HDF cells. The control was HDF cells not treated with the extract. Data are presented as the mean ± SD of three independent experiments, in which each extract concentration was tested in triplicate. **** p < 0.0001, ** p = 0.0095, * p = 0.0302 versus the control.
Applsci 15 04631 g009
Figure 10. Viscosity of samples vs shear rate. E0, base cream; E1, cream with 1% extract; E5, cream with 5% extract; E10, cream with 10% extract.
Applsci 15 04631 g010
Figure 11. UV absorption spectra of yarrow extracts.
Applsci 15 04631 g011
Figure 12. SPF of cosmetic creams. E0, base cream; E1, cream with 1% extract; E5, cream with 5% extract; E10, cream with 10% extract.
Applsci 15 04631 g012
Table 1. Formulation of cosmetic creams with yarrow extract.
Ingredients (INCI)Composition [%w/w]
E0E1E5E10
Oil phase
Capric/Caprylic Triglycerides8.08.08.08.0
Cetearyl Alcohol7.07.07.07.0
Ceteareth-203.03.03.03.0
Glyceryl Stearate2.02.02.02.0
Butyrospermum Parkii Butter1.01.01.01.0
Isopropyl Palmitate1.01.01.01.0
Aqueous phase
Glycerin2.02.02.02.0
Sodium Benzoate0.50.50.50.5
Potassium Sorbate0.50.50.50.5
A. millefolium extract-1.05.010.0
Aquaup to 100up to 100up to 100up to 100
INCI, International Nomenclature of Cosmetic Ingredients; E0, the base cream; E1, cream with extract in concentrations of 1%; E5, cream with extract in concentrations of 5%; E10, cream with extract in concentrations of 10%.
Table 2. Phytochemical composition of yarrow extract.
ExtractTP
(mg GAE/mL ± SD)
TF
(mg CE/mL ± SD)
TPA
(mg CAE/mL ± SD)
CT
(mg DpE/mL ± SD)
DPPH
(%)
FRAP (mmol/L ± SD)
UAE50.06 ± 0.09 a14.58 ± 0.09 a3.31 ± 0.04 a4.93 ± 0.06 a70.00 ± 0.14 a1.53 ± 0.03 a
SFE2.44 ± 0.02 b0.041 ± 0.00 b0.91 ± 0.04 b0.79 ± 0.03 b20.04 ± 0.44 b0.77 ± 0.04 b
UAE, ultrasound-assisted extraction; SFE, supercritical fluid extraction; TP, total polyphenols expressed as gallic acid equivalent (GAE); TF, total flavonoids expressed as catechin equivalent (CE); TPA, total phenolic acids expressed as caffeic acid equivalent (CAE); CT, condensed tannins expressed as delphinidin equivalent (DpE); DPPH, 1,1-diphenyl-2-picrylhydrazyl; FRAP, ferric-reducing antioxidant potential; SD, standard deviation. The letters a and b indicate statistically significant differences at the level of p < 0.05 according to ANOVA.
Table 3. MIC and MBC/MFC values of yarrow extract in mg/mL.
MBC/MFCMICTest Microorganism
162Candida albicans ATCC10231
88Streptococcus agalactiae PCM 2683
>16>16Enterococcus faecalis PCM 2784
168Proteus mirabilis ATTC 29906
88Streptococcus mutans ATTC 25175
88Staphylococcus epidermidis ATTC 8853
168Streptococcus pyogenes ATTC 19615
1616Escherichia coli UPEC PCM 176
88Enterococcus hirae ATCC 10541
162Bacillus subtilis PCM 486
88Staphylococcus aureus 6538P
84Staphylococcus epidermidis PCM 2118
168Escherichia coli ATCC 8739
82Pseudomonas aeruginosa PAO1
42Ralstonia solanacearum Z1
MIC, minimum inhibitory concentration; MBC, minimum bactericidal concentration; MFC, minimum fungicidal concentration; UPEC, uropathogenic E. coli.
Disclaimer/Publisher’s Note: The statements, opinions and data contained in all publications are solely those of the individual author(s) and contributor(s) and not of MDPI and/or the editor(s). MDPI and/or the editor(s) disclaim responsibility for any injury to people or property resulting from any ideas, methods, instructions or products referred to in the content.

