Article

Stability and Degradation Issues of Manganese Violet Pigment in Polymeric Paints: Morphological and Chemical Changes Under SO2 and Humidity Exposure

1
Department of Environmental Sciences, Informatics, and Statistics, Ca’ Foscari University of Venice, 30173 Venice, Italy
2
Academy of Fine Arts Vienna, Institute for Natural Sciences and Technology in the Art, A-1010 Vienna, Austria
3
Academy of Fine Arts Vienna, Institute for Conservation-Restoration, Modern and Contemporary Art, A-1010 Vienna, Austria
4
Department of Molecular Sciences and Nanosystems, Ca’ Foscari University of Venice, 30173 Venice, Italy
5
Institute for Conservation and Restoration, University of Applied Arts Vienna, A-1090 Vienna, Austria
*
Authors to whom correspondence should be addressed.
These authors contribute equally to this work.
Appl. Sci. 2025, 15(9), 4630; https://doi.org/10.3390/app15094630
Submission received: 25 March 2025 / Revised: 18 April 2025 / Accepted: 19 April 2025 / Published: 22 April 2025

Abstract

:
This study focuses on investigating the stability of modern and contemporary paints based on manganese violet pigment PV16 (NH4MnP2O7) when exposed to atmospheric pollutants, specifically sulfur dioxide (SO2) in the presence of high relative humidity. In particular, this study aims to investigate the role of PV16 in increasing the degradation processes of various modern binders. Therefore, the objectives of this research can be divided into (i) evaluating the chemical modifications involving PV16, (ii) investigating the degradation processes that occur in different organic matrices (i.e., drying oil, alkyd resin, and acrylic and styrene–acrylic emulsions), and (iii) comparing the chemical stability of model and commercial paints. The paints were analyzed by 3D Optical Microscopy, Attenuated total Reflection–Fourier-Transform Infrared spectroscopy (ATR-FTIR) and μ-Raman Spectroscopy, Scanning Electron Microscope coupled with Energy Dispersive X-Ray spectroscopy (SEM-EDX), X-Ray Powder Diffraction (XRPD), Fiber Optic Reflectance Spectroscopy (FORS), Pyrolysis–Gas Chromatography–Mass Spectrometry (Py-GC/MS), and Thermally assisted Hydrolysis and Methylation (THM) of Py-GC/MS (THM-Py-GC/MS). The results show that when exposed to high relative humidity and SO2, PV16 presents a colorimetric change from violet to grey; several compounds crystallize on the surface; and, depending on the binder, various degradation reactions occur. This study highlights the susceptibility of manganese violet pigment PV16 under certain environmental conditions, which may be considered to define adequate conservation strategies for works of art containing this specific pigment. Additionally, the results obtained within this investigation point out the need to expand the chemical knowledge of this material for engineering, sensing, and industrial applications.

1. Introduction

This study aims to expand the knowledge of the degradation behavior of painting materials used in modern and contemporary art under selected environmental pollutants. Paintings are usually preserved in museums, galleries, and deposits. However, one of the main problems of these locations is related to the presence of polluting gases and high relative humidity values, as reported in the European Standard EN 16798. In fact, various outdoor pollutants can enter a building through its natural ventilation or by the presence of a high number of visitors, posing a risk to the collections [1]. An example of this phenomenon was observed in the Refectory of Santa Maria delle Grazie (Milan, Italy), where the Last Supper by Leonardo Da Vinci was conserved [2]. Specifically, the results confirmed the correlation between the presence of tourists inside the museum and the variation in air pollutant values during visits and closure of the museum. Further problems arise from the fact that, although monitoring of environmental conditions is carried out in museums, the conservation parameters chosen are not always suitable for every artwork under examination. In other cases, it is often difficult to control these environmental parameters, especially for historic buildings, which usually are not insulated and for which implementation of building structures is not always allowed [3,4].
The major outdoor pollutants detected inside museums are sulfur dioxide (SO2); nitrogen dioxide (NO2); ozone (O3); and reduced sulfur gases, such as hydrogen sulfide (H2S) [1]. As is known, SO2 is produced during the combustion of fossil fuels, the metal-refining process, and pulp and paper production. Comparing the SO2 concentration values detected from the 1960s and 1980s to recent times in Europe, they have drastically decreased, but some areas in the Mediterranean and Asian countries, including Southern Italy, China, and India, still exceed the limits recommended by the World Health Organization (WHO) [5,6,7]. It is important to consider the impact of SO2 in the artistic field because it can be catalytically converted to highly corrosive sulfuric acid (H2SO4) under high humidity conditions (from 60% of relative humidity onwards) [8], causing the chemical and physical degradation of a wide variety of materials, such as leather, parchments, stones, paper, textiles, and paintings—in this case, both the binder and the pigments present in the mixture [1,6]. A recent study by Pozo-Antonio et al. [6] reported the precipitation of sulfate salts causing the whitening of the paint surfaces; it can be observed especially with acid-sensitive types of pigments, leading to color changes that are usually irreversible [1].
Thus, the study of the interaction of these environmental factors with the artworks is of crucial importance in developing suitable conservation strategies and mitigation policies for preventive conservation plans.
In this study, the impact of SO2 and high relative humidity on the degradation behavior of modern and contemporary paints mixed with manganese violet pigment (PV16, C.I. 77742, and NH4MnP2O7) was investigated. The samples were artificially aged under a stream of SO2 in 80% relative humidity for 168 h. These specific aging conditions were chosen to simulate accelerated aging in museum environments, where works of art are usually exhibited and where it is often difficult to monitor and keep environmental parameters below recommended limits.
Although PV16 is a modern pigment not as widely used as titanium white or cobalt blue, it can be found in various fields, ranging from art to cosmetics, sensor technology, and construction [9,10]. According to previous studies, it was chosen as pigment by several artists, such as Claude Monet (1840–1926) in the Rouen Cathedral series [11]; George Seurat (1859–1891) in The Channel of Gravelines, Grand Fort-Philippe [12]; Henri Matisse (1869–1954) in The Red Studio [13]; the Brazilian painter Rodolfo Amoedo (1857–1941) in Bad News [14]; and the Spanish artist Joaquin Sorolla (1863–1923) in the paintings Vision of Spain [15]. It was also present in Gli stati d’animo I-Quelli che vanno and Gli stati d’animo I-Gli addii by Umberto Boccioni (1882–1916) [16]; in David B. Milne’s paintings [17]; in Alchemy by Jackson Pollock (1912–1956) [18]; in Sam Francis’s paintings [19]; in Composizione-Superficie Lunare by Giulio Turcato (1912–1995) [20]; and in the original materials used by Edvard Munch (1863–1944) [21].
Nevertheless, there are only a few studies on its stability and conservation in the field of cultural heritage. Preliminary investigations showed that when exposed to high relative humidity and SO2, PV16 changes color from violet to grey and forms crystals on the surface [22,23,24,25]. Nevertheless, these studies mainly focused on the stability of the binder and did not extensively investigate what occurred with this specific pigment. The crystals formed were not analyzed, as the techniques used were mainly related to the study of the organic fraction. Moreover, the influence of PV16 pigment on the degradation processes of modern binders was not fully understood. Therefore, considering the questions left open by previous studies and the future scientific implications not only in the artistic field but also for the industrial and engineering sector, these degradation behaviors occurred in PV16, and those involving the organic component of the paints under examination are the core of this study. In particular, the aims were as follows:
  • To assess any changes in the morphology of the samples;
  • To study and evaluate chemical changes involving the inorganic fraction;
  • To investigate the degradation of the organic matrices and compare the stability of model and commercial paints.
For these purposes, complementary analytical techniques were chosen to obtain information on both the inorganic and organic components. Specifically, the morphological features and changes before and after the accelerated aging were observed and evaluated by 3D Optical Microscopy. For the chemical evaluation of the degradation processes, Attenuated Total Reflection–Fourier-Transform Infrared spectroscopy (ATR-FTIR) was employed. This technique allows for qualitative analysis by providing information on both the organic and inorganic components of the samples under examination. μ-Raman spectroscopy, Scanning Electron Microscope coupled with Energy Dispersive X-ray Spectroscopy (SEM-EDX), and X-Ray Powder Diffraction (XRPD) were chosen to better investigate the inorganic component. Fiber Optic Reflectance Spectroscopy (FORS) was employed to evaluate the effect of accelerated weathering on the color of the pigment. Finally, Pyrolysis–Gas Chromatography/Mass Spectrometry (Py-GC/MS), as well as Thermally assisted Hydrolysis and Methylation (THM) of Py-GC/MS (THM-Py-GC/MS), was adopted to obtain more detailed information on the organic part.

2. Materials and Methods

2.1. Sample Preparation

For the study, ten model paints were prepared (two replicas of samples). The four model samples were made by mixing PV16 in powder form, i.e., ammonium manganese-(III) pyrophosphate MnNH4P2O7 (45350 Manganese Violet, Kremer Pigmente, Aichstetten, Germany), with different organic binders, using a pigment/binder (P/BM) ratio of 1:3. This ratio was selected to obtain a homogeneous mixture with optimal consistency, similar to the commercial formulations and based on previous studies [22,24,25]. The binding media selected were an acrylic emulsion (Plextol® D498, Kremer Pigmente, Germany), a styrene–acrylic emulsion (Acronal S790, BASF, Ludwigshafen, Germany), an alkyd resin (Alkyd Medium 4, Lukas, Leipzig, Germany), and a stand linseed oil (Leinöl Stand oil 450 P, Kremer Pigmente, Germany). The materials were weighed, placed in a mortar, and mixed with a muller until a smooth and uniform consistency was reached.
They were spread on glass slides using the so-called doctor-blade technique [26], providing a film thickness of approximately 150 μm. The samples were then dried under room conditions (ca. 21 °C and 30% relative humidity) for 3 months before starting the artificial aging. The fifth sample is represented by a commercial manganese oil paint (Schmincke, Erkrath, Germany) selected to compare the stability of model paints and commercial oil formulations. The materials employed and the samples prepared are summarized in Table 1.

2.2. Weathering Experiment

The weathering system used for the accelerated aging experiment consists of two main parts: the weathering chamber and the system for mixing the synthetic air with the selected gas. The weathering chamber used is made of a co-polyester glass (Bel-Art™ SP Scienceware™, Vienna, Austria), capable of blocking 99% of UV radiation and equipped with a gas inlet and outlet to allow continuous gas circulation (total volume of 30 cm3). Synthetic air (Messer Griesheim Austria, O2 20.5%, rest N2) is humidified using double-distilled water and mixed with the selected gas. The obtained acidic gas is then made to flow through a valve into the weathering chamber (flow rate 100 L/h). Gas concentration values were monitored daily with a specified sensor (Aeroqual Limited, Auckland, New Zealand, model AQL S200). During the aging experiment, the gas flow value varies by ±1–1.5 ppm. The paint samples were artificially aged using 15 ppm of SO2 in 80% relative humidity (RH) for a short-term exposure time (168 h). These specific aging conditions were chosen based on previous studies [22,23] and to simulate accelerated aging in museum environments. In particular, the RH value was chosen to simulate an extreme condition that can occur in museums when mitigation of moisture levels is difficult due to the characteristics of the museum structure (e.g., historic building) or the specific geographical area in which the museum is located [3,4]. The selected SO2 value was chosen by considering the annual mean concentration of SO2 measured experimentally in several European museums, from Northern to Southern Europe [8,27,28]. Specifically, the gas concentration monitored in museums is around 2.4 ppb. If the experimental gas concentration used (15 ppm) for 168 h is converted to one year, the corresponding annual experimental value is 287 ppb. Therefore, the aging exposure time used in the experiment is approximately equal to 120 years of aging in a museum environment [8,22,27,28].

2.3. Optical Microscopy

The digital optical microscope used in this study is a Keyence VHX-6000 microscope (Keyence, Osaka, Japan). Specifically, the images were acquired with a VH-Z100 R objective at different magnifications (100×, 200×, 300×, 500×, and 700×). The microscope is equipped with an LED light source (5700 K). The selected lighting was fully coaxial, suitable to analyze slight cracks or evaluate surface quality.
For each sample, images were recorded before accelerated aging; immediately after the end of accelerated aging; and later, at 6 days, 10 days, 20 days, 30 days, and 45 days after the end of accelerated aging. This image-acquisition time was useful for monitoring morphological changes over time due to the aging process.

2.4. Attenuated Total Reflection–Fourier Transform Infrared Spectroscopy (ATR-FTIR)

A portable ALPHA II (Bruker Optics®, Ettlingen, Germany) spectrometer was employed for the ATR-FTIR investigations. The instrument is equipped with an ATR modulus with a single-bounce diamond. Spectra were obtained by collecting 64 scans with 4 cm−1 of resolution, in the spectral range between 4000 and 480 cm−1. The resulting spectra were collected and evaluated by the software OPUS® 8.0 (Bruker Optics®, Ettlingen, Germany). Five ATR-FTIR measurements were acquired per sample and then averaged, baseline-corrected, and vector-normalized. A semi-quantitative evaluation of the treated spectra was performed to better support the observations made after accelerated aging. For the integration of the bands, the peak at 3694 cm−1 relative to kaolinite was taken as the reference peak for samples Oil_V_COMM, Alk_V, Acr_V, and Sty_V, as it was the most stable during accelerated aging. The reference peak for Oil_V is the one at 1416 cm−1. The analyses were carried out on the pigment powder and the samples before and after the accelerated aging.

2.5. μ-Raman Spectroscopy

µ-Raman analysis was conducted using a Thermo ScientificTM DXR3 Raman Microscope by Thermo Fischer Scientific (Waltham, MA, USA). The instrument can be equipped with two different lasers (532 and 785 nm). The measurements were performed with both lasers, with a real output power of 10 and 15 mW, and an aperture of 25 and 50 μm. The laser spot size was 1 μm, and the grating was 400 lines/mm. The samples were observed with objectives of 10× and 50×. Spectra were collected in the spectral range between 3500 and 50 cm−1, with 2 cm−1 of resolution. Data were treated with the software OMNICTM (Thermo Fischer Scientific, USA). The analyses were carried out on the pigment powder and the paint samples before and after the accelerated aging.

2.6. Scanning Electron Microscopy–Energy Dispersive X-Ray Analysis (SEM-EDX)

The analysis of the uncoated altered samples was performed with a JEOL JSM-IT200 scanning electron microscope (Tokyo, Japan) equipped with a JEOL SDD EDS and a JEOL LVSED detector (Tokyo, Japan) in a low vacuum. The analytical conditions selected are a 15 kV accelerating voltage, a counting time of 30 s, and a working distance of approx. 10 mm. Backscattered and secondary electron images were obtained at different magnifications (i.e., 250×, 300×, 1100×, 1300×, 1900×, and 3000×), and spot analysis was carried out to obtain information on the elemental composition of the degradation products formed after accelerated aging. Elemental semi-quantitative weight percentages were calculated by EDX analysis according to the ZAF matrix correction.

2.7. X-Ray Powder Diffraction (XRPD)

XRPD was used to perform a qualitative analysis of the pigment powder before accelerated aging and of any crystals formed on the paint samples after the aging. In particular, the measurements were performed employing a PANalytical Empyrean Series 3 diffractometer (Malvern, United Kingdom) equipped with a Cu anode X-ray tube, Bragg–Brentano HD incident-beam optic, and a PIXcel3D detector. No sample preparation was required, as the glass slides were placed directly into the instrument.

2.8. Fiber Optic Reflectance Spectroscopy (FORS)

The reflectance measurements were performed using a reflection probe coupled with the QEPro spectrometer (Ocean Optics, Ostfildern, Germany) and a DH-2000 light source (Ocean Optics, Ostfildern, Germany). BaSO4 was used as standard for calibration. FORS was used to assess the effect of accelerated aging on pigment color, so the spectra were collected before and after aging.

2.9. Pyrolysis–Gas Chromatography/Mass Spectrometry (Py-GC/MS) and Thermally Assisted Hydrolysis and Methylation (THM) of Py-GC/MS (THM-Py-GC/MS)

Before and after accelerated aging, small fragments of each sample (ca. 100–110 µg) were weighed using a microanalytical balance (0.001 mg) and placed in a sample cup (ECO-CUP Frontier Lab, Nagoya, Japan). All samples were investigated with a pyrolizer type PY-2020iD of Frontier Lab (Japan) and a gas chromatograph/mass spectrometer, GC/MS-QP2010 Plus of Shimadzu (Kyoto, Japan), with a quadrupole mass analyzer. The interface pyrolizer and the injector temperature were set at 280 °C. The GC/MS unit was equipped with a capillary column SLB-5ms Supelco (30 m length × 0.25 mm internal diameter × 0.25 μm film thickness), using bonded and highly crosslinked 5% diphenyl/95% dimethyl siloxane. Helium was used as carrier gas (constant flow at 0.60 mL/min, split mode).
The experimental conditions were slightly different depending on the type of sample. For instance, for the samples containing the acrylic and styrene–acrylic emulsion (Acr_V, Sty_V), no pre-treatment was necessary, and pyrolysis analysis was performed at 600 °C. The chromatographic conditions for Py-GC/MS for acrylic and styrene–acrylic samples were as follows: the oven initial temperature was set at 40 °C for 2 min, followed with a gradient of 16 °C/min up to 220 °C and 10 °C/min up to 315 °C for 2 min. The column was directly coupled to the ion source of the mass spectrometer. The MS interface and ion source temperature were at 280 °C and 200 °C, respectively. Ions were generated by electron impact (EI) ionization in positive mode at 70 eV. The mass spectrometer was set from m/z 50 to 650, with a cycle time of 0.2 s.
For the alkyd and oil samples (Alk_V, Oil_V, and Oil_V_COMM), THM-Py-GC/MS analytical mode was employed. This method was chosen to improve the detection of high-polarity compounds, such as large acids, which are mainly present in drying oils. The use of the tetramethylammonium hydroxide TMAH (25 wt.% aqueous solution, Sigma-Aldrich, St. Louis, MI, USA) reagent reduces the polarity of these compounds. TMAH reacts in contact with the sample and during pyrolysis, converting carboxylic acids and their esters into their respective methyl esters. Therefore, a pre-treatment with TMAH was used for Alk_V, Oil_V, and Oil_V_COMM. In particular, 5 μL of TMAH was added to the sample for one hour. Moreover, to perform a semi-quantitative analysis, 5 μL of a 1 mmol/mL FA-C19 solution in methanol was added to each sample cup before placing it in the pyrolizer. The single-shot pyrolysis was performed at 650 °C.
The GC oven-temperature program for the THM-Py-GC/MS analysis of alkyd and oil samples was set as follows: 35 °C (held 1 min)–30 °C/min up to 110 °C–15 °C/min up to 240 °C and 5 °C/min up to 315 °C (held 2 min). For the THM-Py-GC/MS, a solvent cut time of 5 min by turning off the filament in the ion source was used. This mode prevents the sharp decrease in the vacuum inside the ion source due to the entrance of the TMAH reagent, which has a detrimental effect on the filament and other components. All the other conditions were the same as used for the acrylic and styrene–acrylic samples.
For collecting and processing mass spectral data, Chromeleon 7 (Thermo Fischer Scientific, Waltham, MA, USA) software was used. The qualitative interpretation of the results was achieved with NIST 05 and 05s Libraries of mass spectra and F-search 3.5.0 software, plus an ad hoc library from the literature [24,25,29,30].

3. Results and Discussion

3.1. Before Aging: Pigment Characterization

With the ATR-FTIR and the μ-Raman analysis performed on the pigment powder, it was possible to identify the main bands of PV16 (Figure 1a,b and Supplementary Table S1).
As shown in Figure 1a, PV16 has two typical IR bands related to the stretching of the ammonium group (NH4+) at 3203 and 3066 cm−1 [31]. Moreover, peaks attributed to the stretching of the PO3 group (1233, 1183, and 1072 cm−1 in the IR spectrum; 1194 and 1161 cm−1 in the Raman spectrum [32,33]) and of the P-O bond (1031, 992, and 905 cm−1 in the IR spectrum [25]; 884 cm−1 in the Raman spectrum [34,35]) are noticeable. Additionally, a peak around 760 cm−1 in both spectra can be associated with the symmetric stretching of the P-O-P bond [31,33]. Absorptions due to bending of the O-P-O bond at 591, 564, and 490 cm−1 (Figure 1a) [25] and at 561 and 507 cm−1 were detected as well (Figure 1b) [33].
In addition to the main functional groups of PV16, both ATR-FTIR and μ-Raman analysis reveal the presence of silicates, possibly ascribable to kaolinite (Al2Si2O5(OH)4). This latter compound is often added as a whitener and/or filler in the pigment formulation [36]. In particular, in the IR spectrum, the presence of kaolinite is highlighted by the peaks at 3691 and 3618 cm−1 (stretching of O-H bond); at 695 cm−1 (Al-OH bond); and at 479 and 441 cm−1 (Si-O bond bending) [37]. In the μ-Raman spectrum, on the other hand, the typical absorption bands of kaolinite were detected at 432, 247, and 221 cm−1 [38].
Additional identification of the constituent materials in the pigment powder was provided by XRPD results. The XRPD results in Figure 1c confirm the presence of NH4MnP2O7 and kaolinite, in agreement with previous studies carried out on this pigment [16,31]. However, by considering the crystal structures proposed by Begum et al. [39] for the α-NH4MnP2O7 and β-NH4MnP2O7 polymorphs, the comparison between the XRPD pattern and the simulations allows to identify the pure α-NH4MnP2O7 phase as the only polymorph present in the pigment investigated (Figure 1c). Therefore, this result differs slightly from that of Anselmi et al. [16], who also detected the β polymorph and the stewartite mineral. This is probably due to a change in the commercial formulation during the years [16]. The α-NH4MnP2O7 crystalline structure is characterized by a space group P21/c in which a single type of distorted Mn3+O6 octahedron is present [39].
SEM-SE images (Figure 1d) revealed that the selected PV16 is a fine-grained pigment with an average particle diameter of approx. 2 μm. Observing Figure 1d, kaolinite grains are mixed with those of the violet pigment, with an average particle diameter of approx. 9 μm. Indeed, kaolinite usually exhibits anhedral particles with an average diameter of 10 μm [40].
Figure 1. Analyses carried out on the manganese violet pigment PV16 powder before accelerated aging. (a) IR spectrum; (b) μ-Raman spectrum obtained with a 532 nm laser; (c) XRPD pattern compared with the simulated α-NH4MnP2O7 phase reported in the literature [39]; and (d) SEM-SE image.
Applsci 15 04630 g001

3.2. Before Aging: Paints Characterization

Figure 2 shows the images of the surfaces of each sample before aging obtained by 3D Optical Microscopy.
The samples containing oil and alkyd resin appear to have a more compact surface with the presence of micropores (diameter in the range of 12–4 μm). On the other hand, the samples containing acrylic and styrene–acrylic emulsion have a less compact surface characterized by larger pores (diameter in the range of 100–45 μm), especially in the styrene–acrylic sample. These surface differences can be attributed to the different drying and film formation mechanisms of the binders. In fact, radical polymerization reactions take place in oil and alkyd resin, whereas evaporation of water and coalescence in acrylic and styrene–acrylic emulsions are the main drying processes [41,42,43].
Observing the SEM images (Figure 3), the pigment seems to be uniformly distributed over the surface in all sample types. This indicates that the dispersion of the pigment in the binder was homogeneous. Moreover, it appears that even in the commercial oil-based sample, the pigment particle size (1.5 μm) is very similar to the model samples.

3.2.1. Oil-Based Samples

Two oil-based samples were studied: a model paint containing linseed stand oil (a pre-heated oil) mixed with PV16 (Oil_V), and a commercial oil paint by Schmincke containing PV16 (Oil_V_COMM). Comparing the IR spectra of the two different samples (Supplementary Figure S1), it can be observed that in the model sample, the peaks of the binder are more evident than the pigment ones, while in the commercial sample, the pigment peaks are more defined and intense in the fingerprint region with ones (see Supplementary Table S2). In both spectra, however, the typical absorption peaks related to oil are visible. Specifically, the symmetric and asymmetric stretching of the methylene group (CH2) in the range of 2916–2850 cm−1, the stretching of the carbonyl group (C=O) at 1739 cm−1, and the symmetric bending of the C-H bond at 1377 cm−1 are present [44,45]. In the model sample, additional oil-related bands are present, such as the C-H stretching at 2954 cm−1, the C-H asymmetric bending at 1464 cm−1, the C-O stretching at 1178 and 1097 cm−1, and the rocking of the CH2 group at 720 cm−1 [44,45].
µ-Raman analysis confirmed the IR findings, identifying characteristic drying oil bands in both samples (Supplementary Figure S2): C-H stretching (2925–2860 cm−1), C=O stretching (1748 cm−1), CH2 scissoring (1440 cm−1), and CH2 in-phase twisting (1305 cm−1) [46,47]. The model sample showed an additional band at 1660 cm−1, possibly corresponding to the C=C double-bond stretching [47].
THM-Py-GC/MS analysis confirmed that the binding medium in the two samples was a drying oil. Supplementary Table S3 lists all the compounds detected with their retention times (RT, min) and significant mass-to-charge (m/z) values. The obtained TIC (Total Ion Current) pyrograms (see Figure 4) show saturated monocarboxylic (such as caprylic, capric, lauric, myristic, palmitic, and stearic), dicarboxylic (such as suberic, azelaic, and sebacic), and unsaturated (palmitoleic, arachidonic, oleic, and linoleic) fatty acids (such as methyl and dimethyl esters, according to the derivatization) [48,49].
In addition to the main fatty acids mentioned, both pyrograms revealed behenic acid (RT 19.74 min), a saturated fatty acid, which is detected both in linseed and sunflower oil [48]. This fatty acid is typically present in sunflower oil in higher concentrations; being detected in low concentrations in the samples under investigation suggests the absence of sunflower oil [48].
However, the coexistence of the two oils cannot be excluded with certainty. Considering the calculated molar ratio between palmitic and stearic acids, both paints seem to contain linseed oil [48,50]. In particular, the ratio between palmitic and stearic acids (P/S) in the model sample is equal to 0.90, and in the commercial one, it is equal to 1.96. Moreover, the azelaic-to-suberic ratio (A/Sub = 3.08) confirmed that the oil used to prepare the samples has undergone a pre-heating treatment [48,49,50]. Whereas, the oil employed in the commercial paint may be identified as raw, as the A/Sub ratio is equal to 9.29 [48,49,50]. In both paints, three unusual peaks are present at the initial RT identified as glycine, N,N/dimethyl/methyl ester, [2-(N,N-Dimethyl)]-1,2-propanediamine, and phosphoric acid trimethyl ester, respectively. These three compounds could be related to the pigment and could have been formed during pyrolysis, as the final result of reactions with the TMAH derivatization [49]. From the ATR-FTIR, μ-Raman, and THM-Py-GC/MS analysis, it was not possible to identify any additives in the commercial sample, and the technical datasheet does not indicate any possible addition. This could be ascribable to the experimental parameters chosen for this specific study. Nevertheless, this aspect could be taken into consideration for future experiments.

3.2.2. Alkyd-Based Samples

ATR-FTIR and μ-Raman analyses of alkyd paints (Alk_V) show the characteristic bands of both the oil and phthalate components. The IR spectrum (Supplementary Figure S3 and Table S4) identifies a strong C=O stretching peak (1722 cm−1) that is common to both components [22]. The phthalate component can be detected by the bands of the C=C stretching (1600–1581 cm−1), C-O stretching (1261–1115–1069 cm−1), and C-H bending (742–710 cm−1) [22]. The oil component is characterized by the CH2 and CH3 symmetric and asymmetric stretching at 2925 and 2854 cm−1; and CH3 bending at 1462, 1447, and 1388 cm−1 [22,25]. Raman analysis (Figure 5a) identifies the following characteristic bands of alkyd resin: the C=O stretching vibration at 1727 cm−1, the C=C stretching at 1601 cm−1, the C-O stretching at 1163 cm−1, the ring breathing at 1041 and 1003 cm−1, and the C=O wagging at 650 cm−1 [51].
THM-Py-GC/MS analyses allowed the identification of the polybasic acid and the polyol constituting the binder and provided further information on the oil component present.
Supplementary Figure S4 shows the TIC pyrogram obtained for the alkyd samples, and in Supplementary Table S5, all the compounds detected are listed. Polyol has been identified as pentaerythritol (PE), a five-carbon tetraol widely used in commercial formulations since the 1960s, as it allows the resin to dry faster [52]. The identification was possible due to the presence of PE dissociation products obtained from the TMAH derivatization and pyrolysis, such as pentaerythritol tetramethyl ester at RT 8.23 min and pentaerythritol trimethyl ester at RT 8.78 min. The identification of phthalic acid (as dimethyl ester) can indicate that the type of polybasic acid present is phthalic anhydride. This pyrolysis product was detected at RT 10.64 min. However, the presence of phthalic anhydride at RT 9.61 min was also detected, although in a lower concentration. This may be due to the incomplete derivatization of phthalic anhydride.
Regarding the oil fraction, peaks related to saturated monocarboxylic acids (myristic, palmitic, stearic, and arachidic acids), dicarboxylic saturated acids (suberic, azelaic, and sebacic acids), and unsaturated fatty acids (oleic and linoleic acids) were detected. These fatty acids are the most commonly detected to characterize siccative oils [48]. Moreover, according to the calculated molar ratio between palmitic and stearic acids (P/S = 1.48), the oil component was identified as linseed oil [49,50]. Considering the ratio of azelaic and suberic acids (A/Sub = 7.17), it appears that the oil had not undergone any pre-heating processes [49,50]. There are also two peaks at RT 17.33 min and RT 17.78 min that are related to the oxirane octanoic acid 3-octyl-methyl ester and hexadecanoic acid 9,10,16-trimethoxy-methyl ester, respectively. These two compounds can be considered oxidation products of unsaturated fatty acids formed during drying and curing [48]. The most intense peak is the benzoic acid (BA) at RT 7.54 min. Considering its high concentration, it was likely added in the formulation as a stopping agent rather than being a pyrolysis product of polybasic acid [25]. Additionally, a phthalate-based additive, i.e., allyl methyl phthalate (m/z 220, 163, 164, and 104), is present which is often added to commercial formulations as a plasticizer [25]. Finally, as for oil samples and the commercial samples, peaks related to [2-(N,N-dimethyl)]-1,2-propane-diamine and phosphoric acid (as trimethyl ester) were detected.

3.2.3. Acrylic-Based Samples

According to the commercial datasheet, the acrylic emulsion used to prepare the samples (Acr_V) was a copolymer of n-butyl acrylate (nBA) and methyl methacrylate (MMA). In Supplementary Figure S5 and Table S6, it is possible to identify the presence of the nBA-MMA copolymer by the IR bands related to the stretching of the C-H bond (2956–2872 cm−1); the stretching of the carbonyl group (1727 cm−1); and the additional bands at 1436, 1164, and 842 cm−1, corresponding to the C-H bending, the C-O stretching, and the C-H rocking, respectively [22]. Furthermore, the spectral signal of a surfactant, namely PEO (polyethylene oxide), was identified by the characteristic bands at 1341 and 1114 cm−1 of the CH2 wagging and the C-O-C stretching [22,53,54,55]. PEO is a non-ionic surfactant that is usually added to stabilize acrylic emulsion [54]. µ-Raman analysis supported the results obtained with ATR-FTIR spectroscopy, as shown in Figure 5b, where the characteristic bands of the acrylic emulsion are visible. In particular, bands related to the C-H stretching (2939 and 2873 cm−1) and the C=O stretching vibration (1733 cm−1) are distinguishable [51]. Other bands associated with this binder are those corresponding to the C-H bending (1449 cm−1), the C-H twisting/rocking (1296 cm−1), the C-H rocking (844–807 cm−1), and the C=O bending (612 cm−1) [51].
Py-GC/MS analysis confirmed that the acrylic emulsion used is a copolymer of nBA/MMA. The TIC (Total Ion Current) pyrogram in Supplementary Figure S6 shows the most intense peaks of MMA at RT 4.23 min and nBA at RT 6.70 min. Additionally, a peak corresponding to n-butyl methyl acrylate (nBMA) at RT 7.71 min was recorded, and peaks related to the pyrolysis products of butyl acrylate were detected as 1-butene, n-butyl acetate, and n-butyl tiglate. At higher retention time, several peaks were detected, indicating dimeric and trimeric fractions, which are formed due to the depolymerization process occurring during the pyrolysis phase [24,52]. Specifically, as listed in Supplementary Table S7, it was possible to identify the nBA-MMA sesquimer and dimer at RT 12.12 min and RT 12.37 min, respectively. Moreover, the nBA sesquimer, dimer, and trimer were detected. Finally, the nBA-nBA trimers are present at RT 17.21 min, RT 17.39 min, and RT 18.16 min. Py-GC/MS analysis revealed no additives other than PEO, which was identified only by IR analysis. This may be due to the use of high temperatures in the Py-GC/MS analysis.
With ATR-FTIR analysis, it is possible to distinguish the functional groups belonging to the acrylate part and the phenyl group in the styrene–acrylic emulsion samples (Supplementary Figure S7 and Table S8). The acrylate fraction is characterized by the stretching of the C-H bond at 2957, 2931, and 2872 cm−1; the stretching of the C=O bond at 1728 cm−1; and the stretching of the C-O bond at 1163 cm−1 [22,24]. On the other hand, the bands ascribable to the C-H stretching (3082–3061–3028 cm−1), the C=C stretching (1602 cm−1), the C-C vibration (1494–1450 cm−1), and the C-H bending (758–698 cm−1) are characteristic of the phenyl group [22,24]. As can be observed in Figure 5b, the main styrene–acrylic emulsion bands can be found also in the Raman spectrum. The styrene–acrylic copolymer is characterized by the C-H stretching at 2916 and 2879 cm−1, and C=O stretching at 1735 cm−1 [51,56]. Furthermore, additional bands at 1602, 1449, and 1002 cm−1, attributable to C=C stretching and C-C vibrations, are also present [51,56].
Py-GC/MS analysis provides more detailed information on the organic fraction. From the evaluation of the TIC pyrogram in Supplementary Figure S8, the styrene–acrylic emulsion can be identified as a terpolymer of styrene, detected at RT 6.73 min; n-butyl methacrylate (nBMA), detected at RT 7.73 min; and butyl acrylate (BA), detected by its oligomers. Consequently, the presence of polyester-related pyrolysis products, such as α-methyl styrene and α-ethyl-styrene, is observed. Peaks corresponding to 2-butene, butyl alcohol, and butyl acrylate (BA) trimer are also visible as pyrolysis products of nBMA, as usually described in the literature [24]. Additional peaks related to the combination and fragmentation of the monomers during the pyrolysis were detected, such as BA–styrene dimers, styrene–styrene dimers, and BA-BA styrene trimers (Supplementary Table S9). Compounds related to benzene derivatives (i.e., ethylbenzene, benzene-2-propenyl, benzaldehyde, and benzene-3-butenyl) and polycyclic aromatic hydrocarbons (naphthalene and naphthalene-1,2-dihydro) were detected as well. These compounds may be associated with the industrial use of organic solvents in the formulation of polymer products [57]. Finally, a peak was characterized as 1-benzyl-1,2,3-triazole at RT 14.31 min; this compound may have been used as an additive with biocide and antifungal properties in the manufactured resin [58,59].

3.3. After Aging: Evaluation of Paint Samples

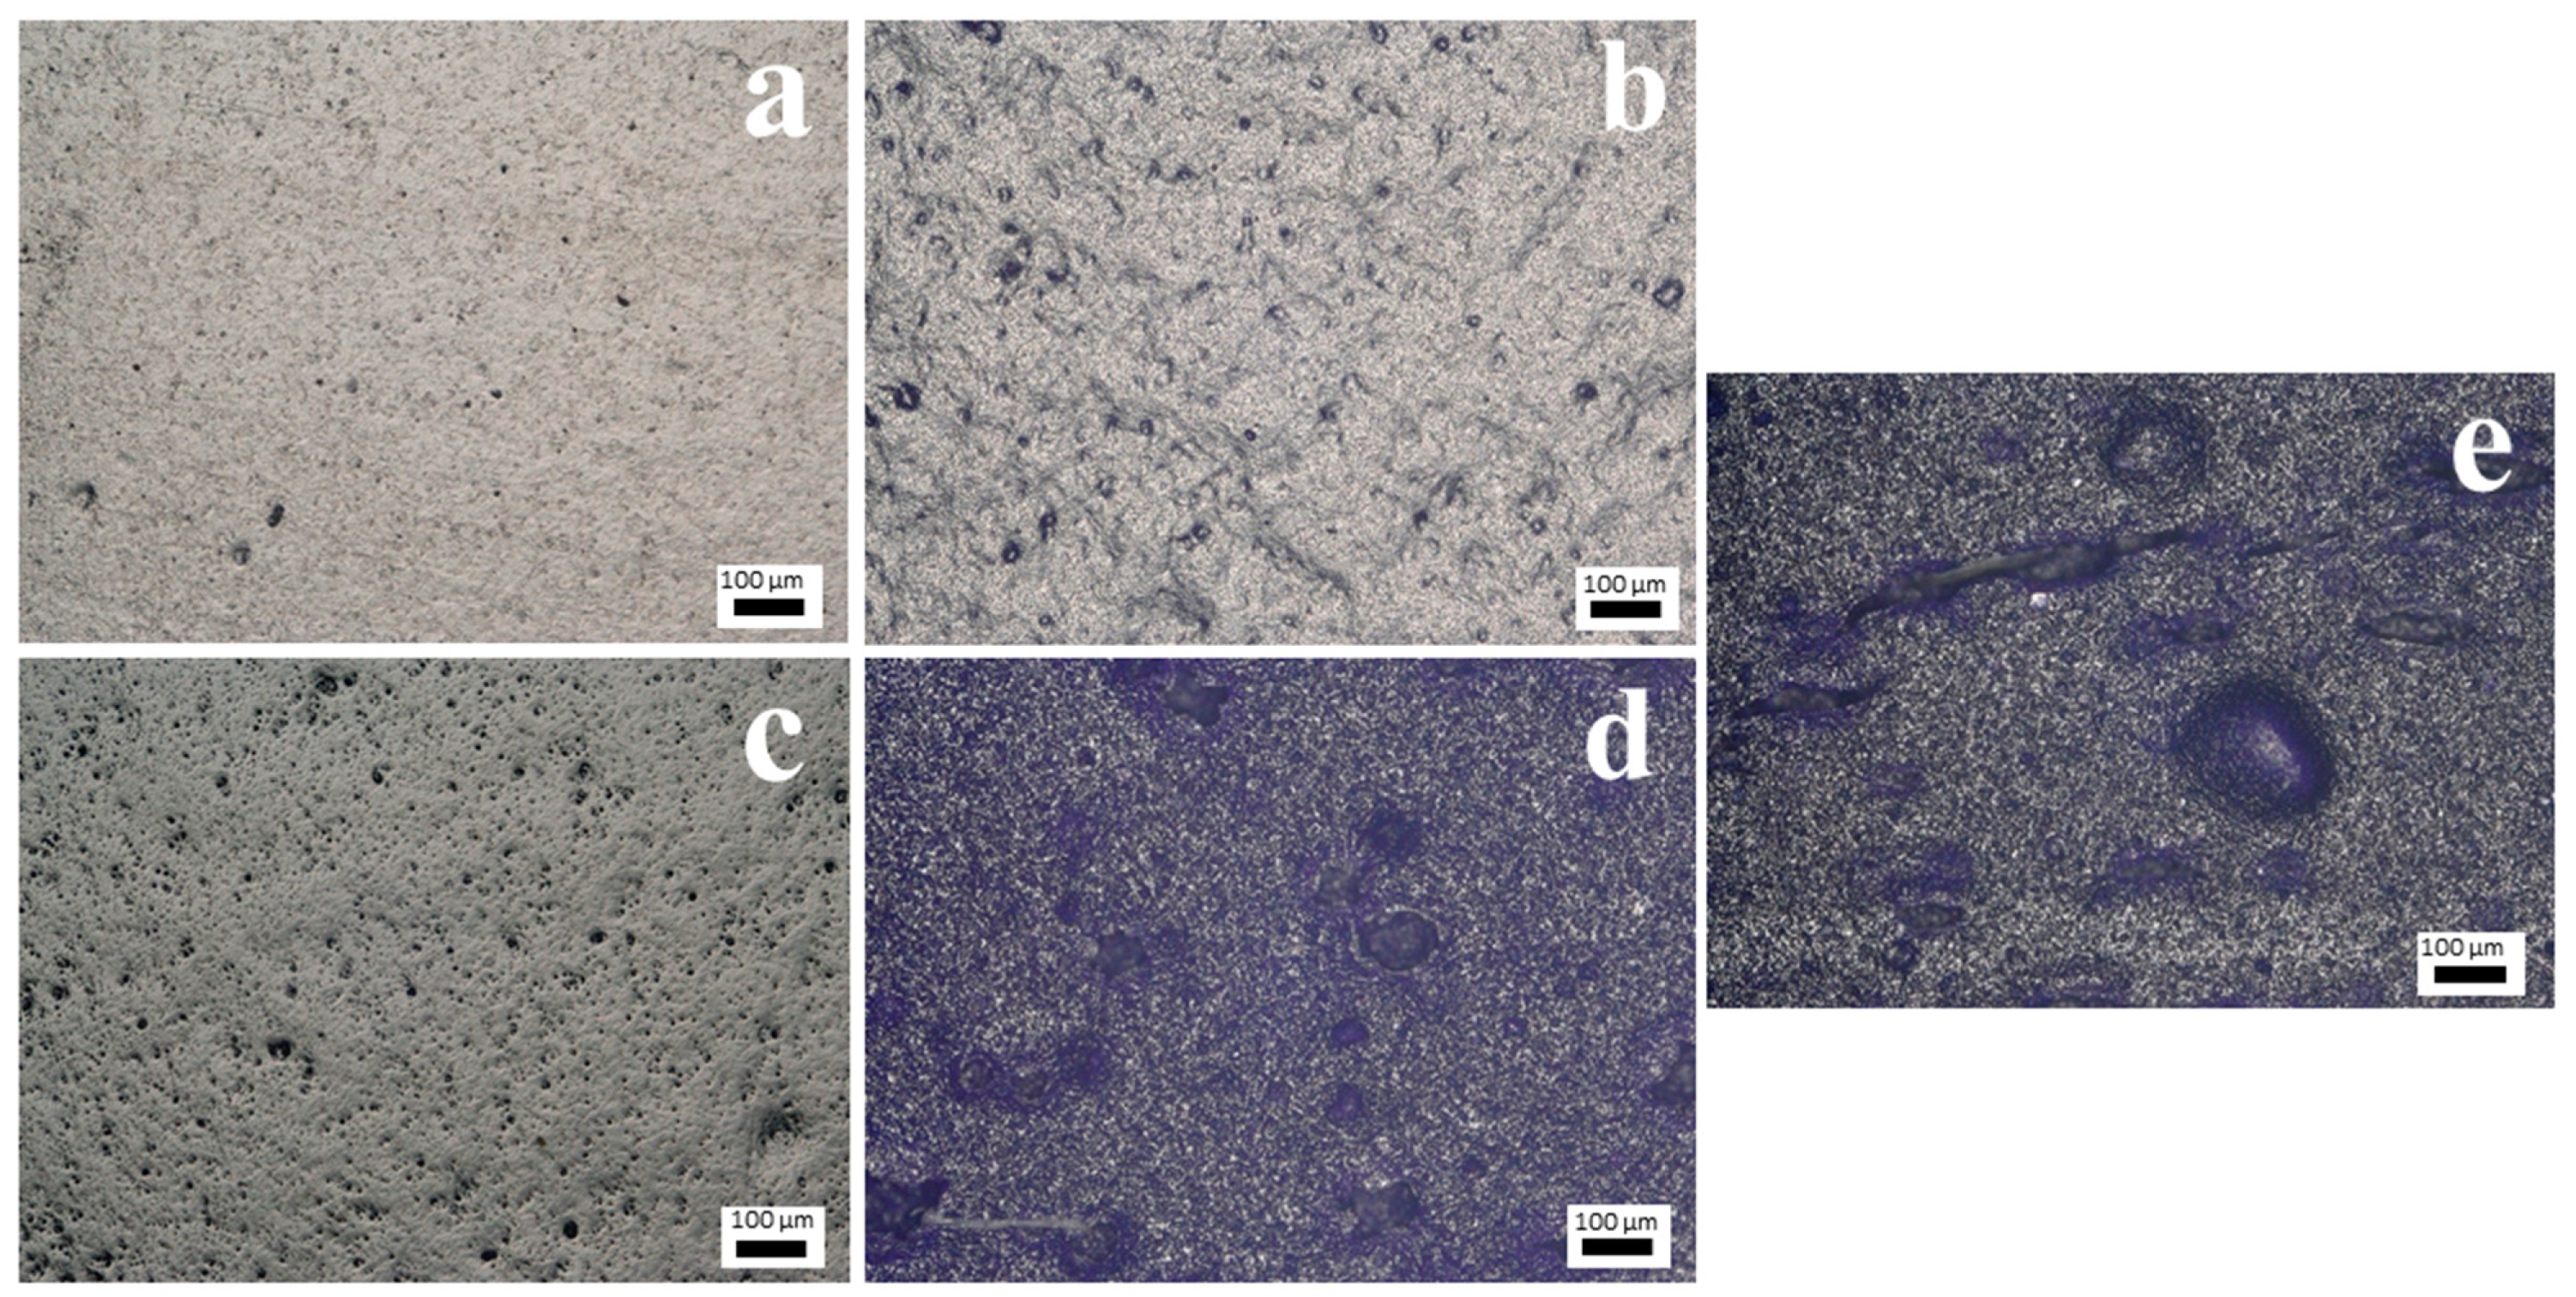
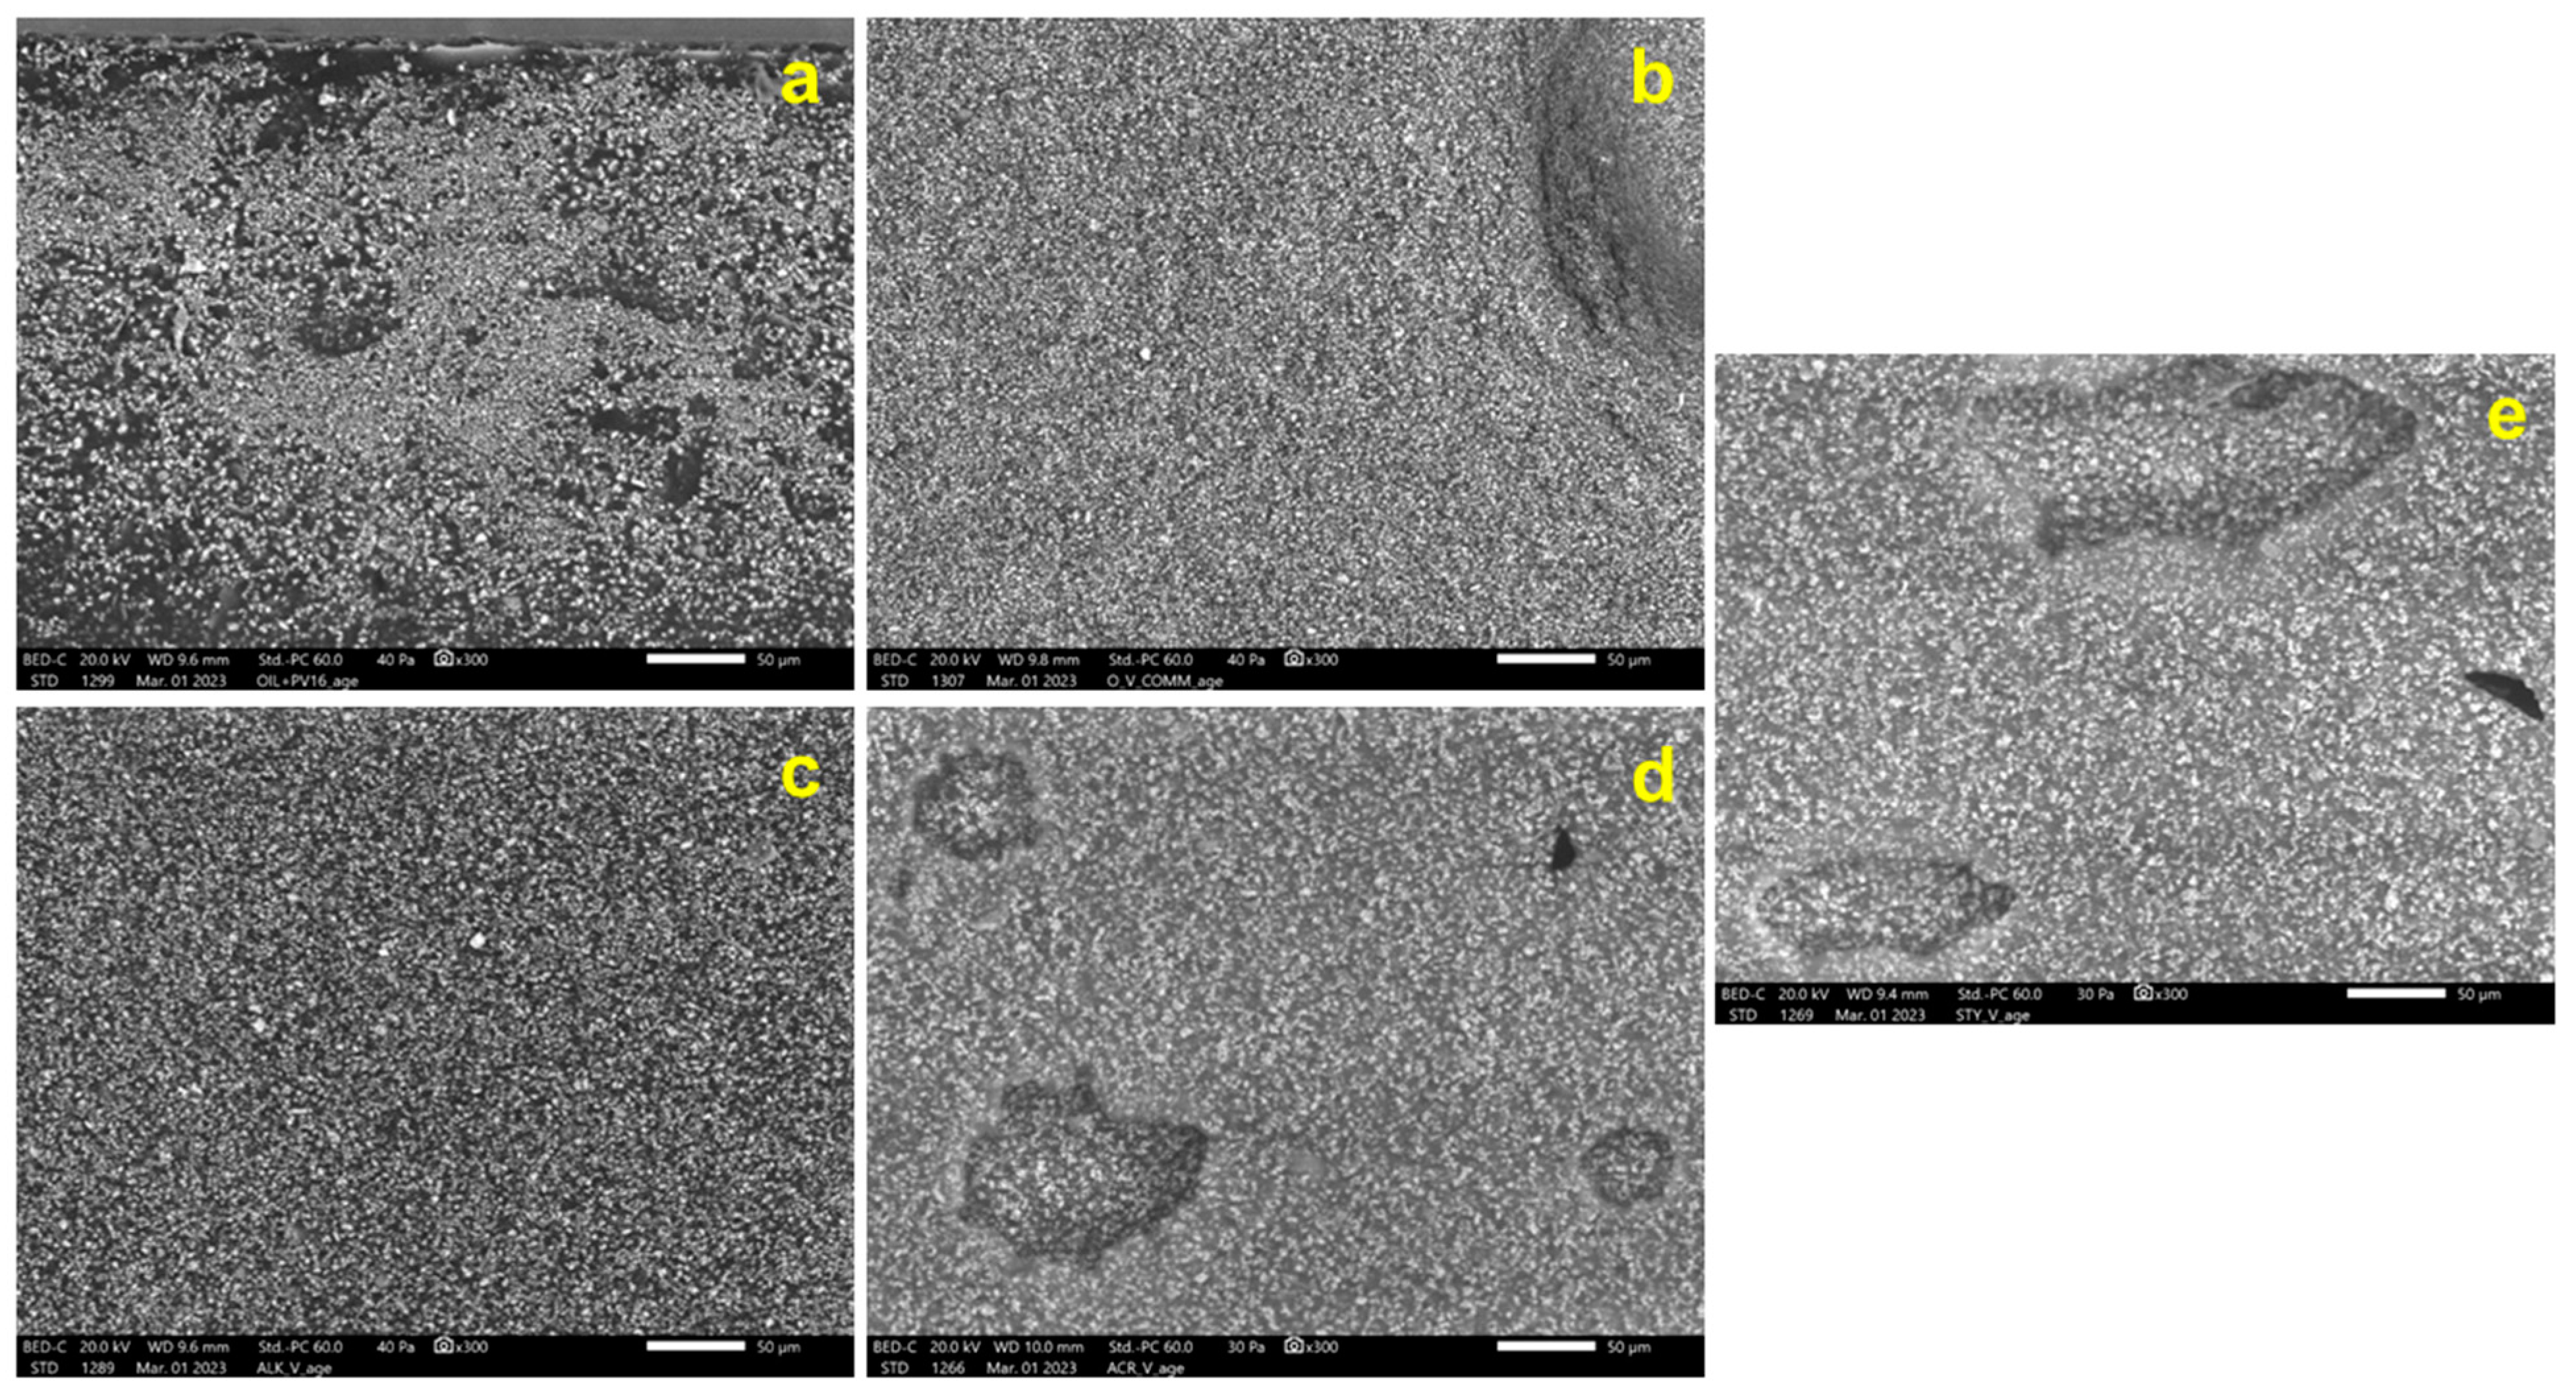
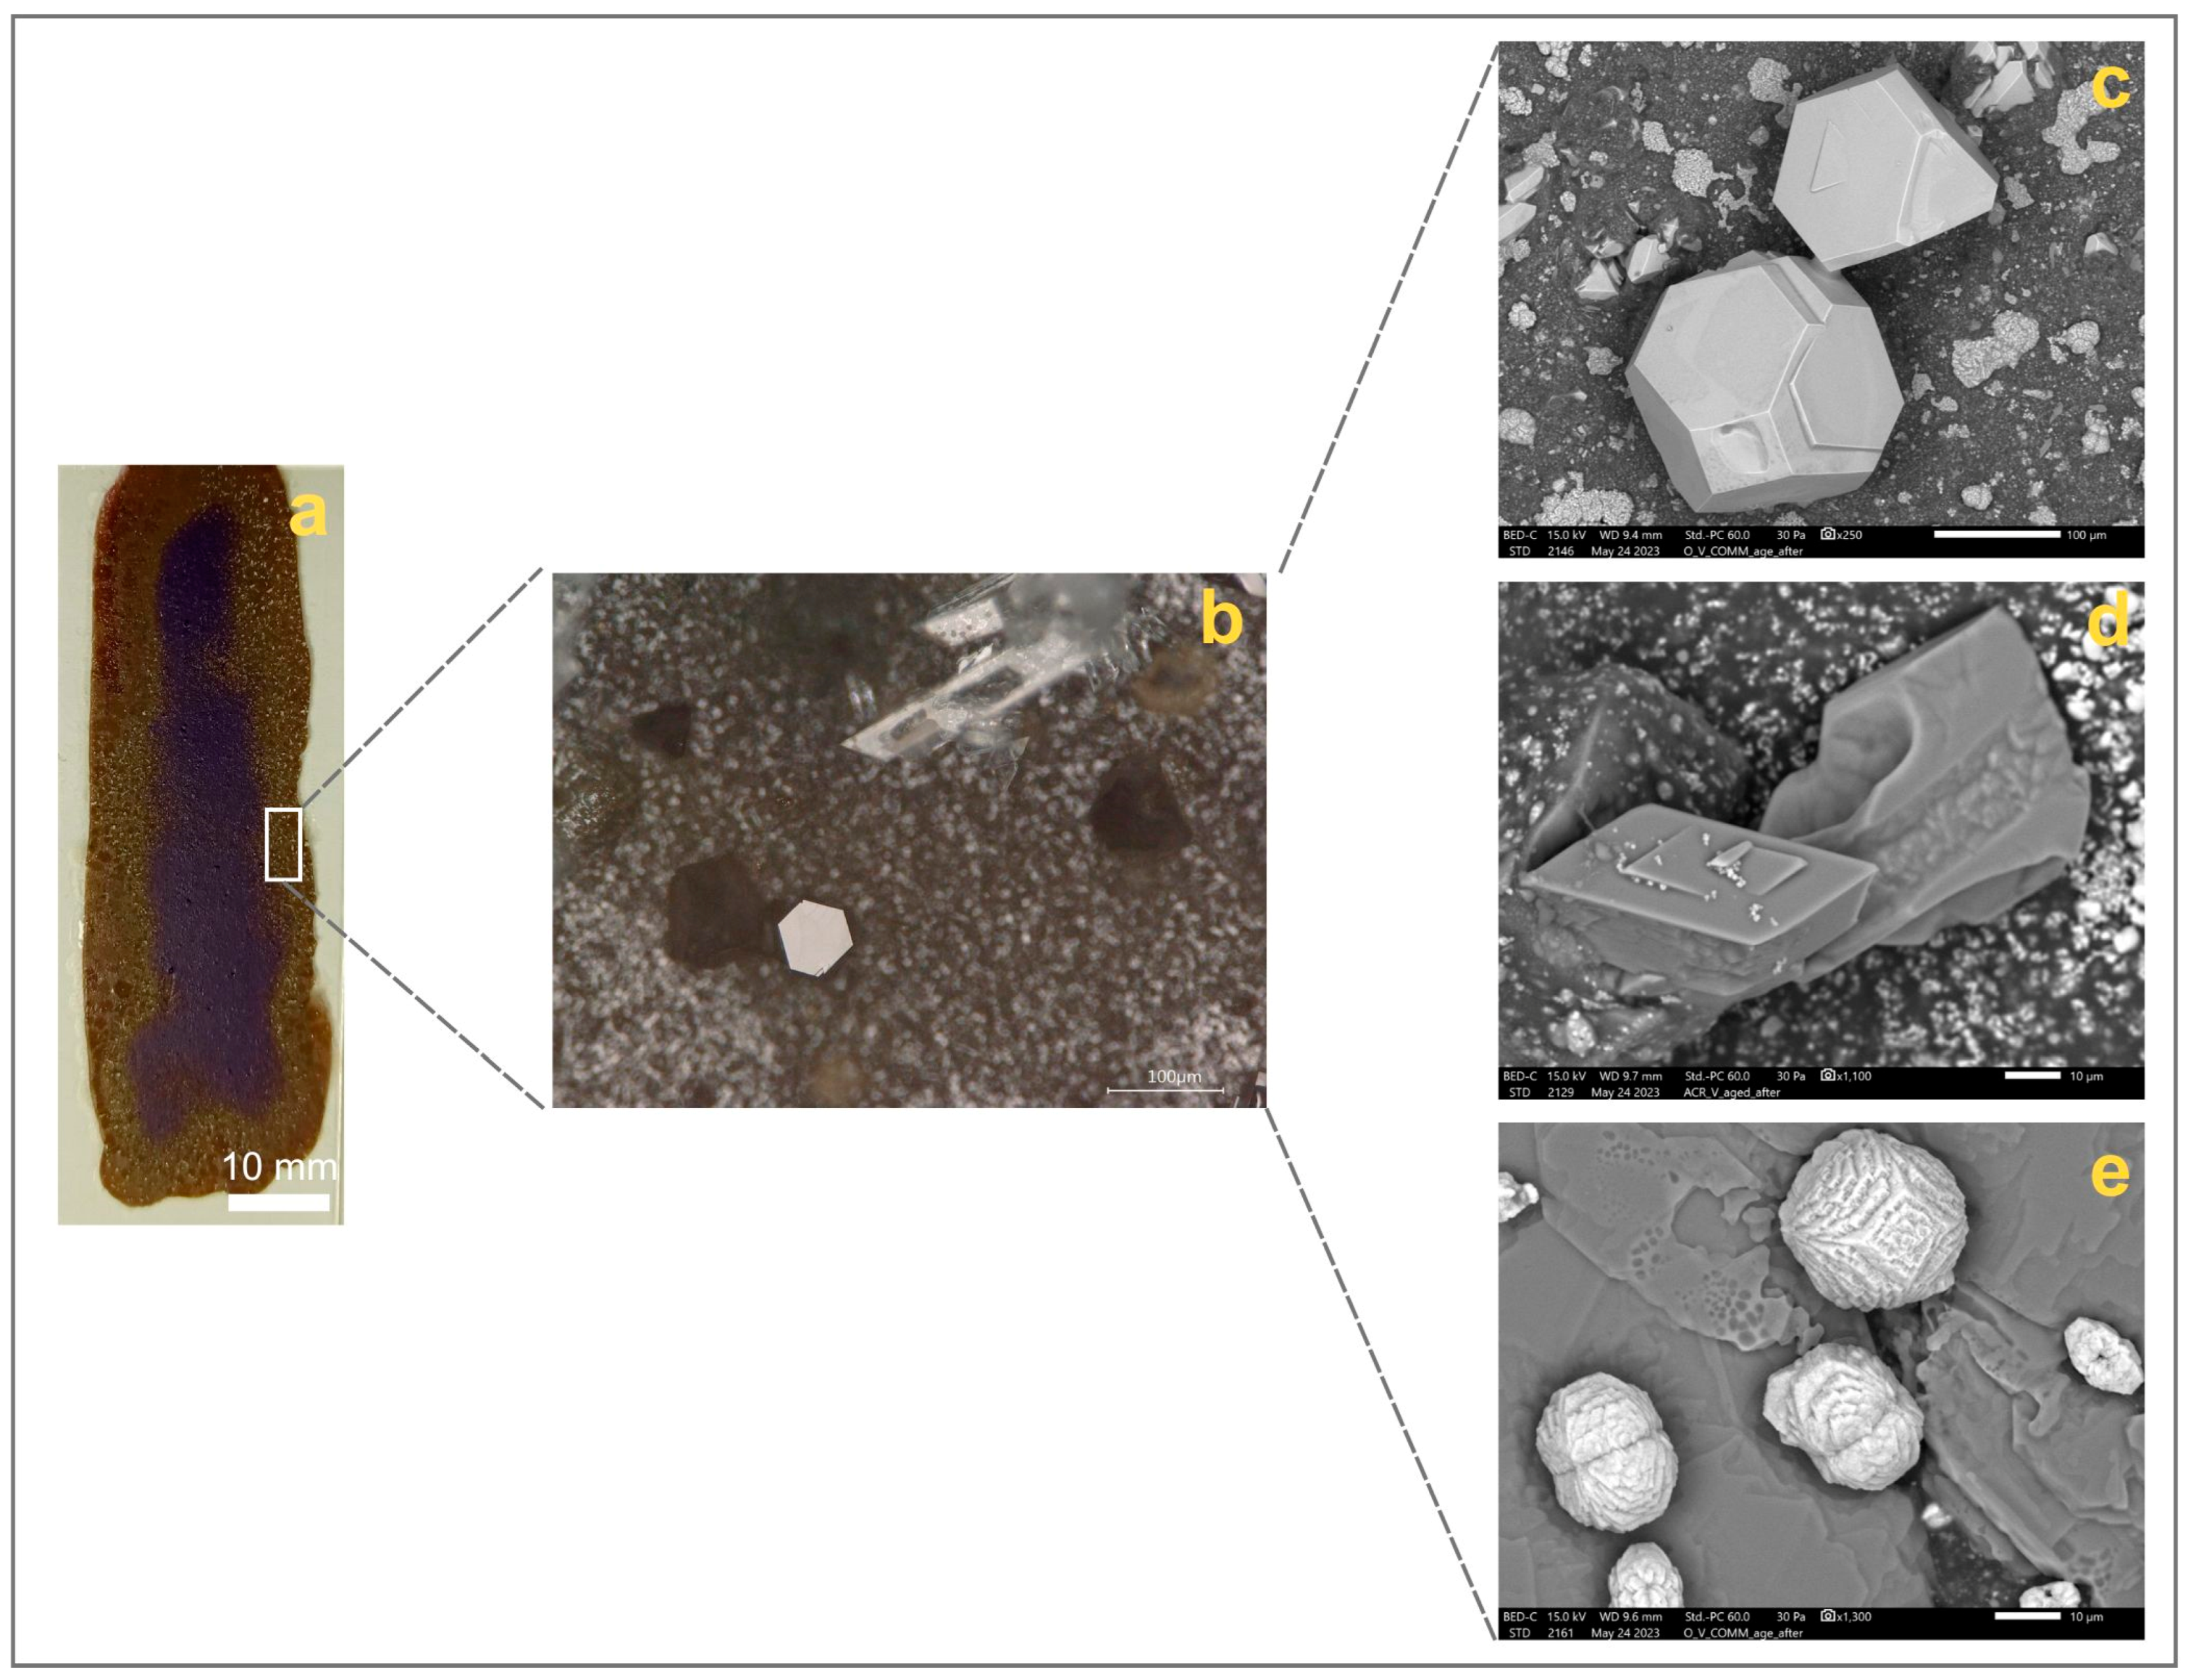
3.3.1. Morphological Observations

As soon as the samples were taken out of the weathering chamber, they all presented liquid droplets on the surface, as shown in Supplementary Table S10. For the Oil_V_COMM, Alk_V, and Sty_V samples, the droplets were uniformly spread over the entire surface, whereas in Oil_V and Acr_V, the droplets were only found on the edges of the paint. The pH value of the droplets was measured with a litmus paper, obtaining a value around pH = 1. Considering the high acidity value and the aging conditions inside the weathering chamber, it can be assumed that sulfuric acid (H2SO4) was formed inside the chamber by a reaction between sulfur dioxide and the humidified water [60]. In addition, surface changes begin to occur as early as three days after the end of accelerated aging. Specifically, a color change from violet to grey was observed above all at the edges. Over time, the color change seems to affect a more noticeable area of the surface. However, it is important to note that in the samples where the droplets were all over the surface, the color change is widespread, whereas in the Oil_V and Acr_V samples, it is limited to a few points along the edges. This may be due to the different drying phases of the binder. However, it is evident that in all paint films, the color variation starts from the edges.
Digital Optical Microscopy was used to obtain a more detailed understanding of the primary visual inspection. The microscopic observations (Supplementary Table S11) show that small crystals appear to grow on the droplets formed during accelerated aging, as soon as the samples are removed from the weathering chamber. Over time, the droplets dry out and the crystals become more defined, appearing to have a rhombohedral shape. A second type of monoclinic crystal also appears to form over time. However, as shown in Supplementary Table S11, these considerations exclude sample Oil_V, as it is difficult to observe from the microscopic photos whether crystals have formed or not due to the long drying phase of the liquid droplets on the surface.

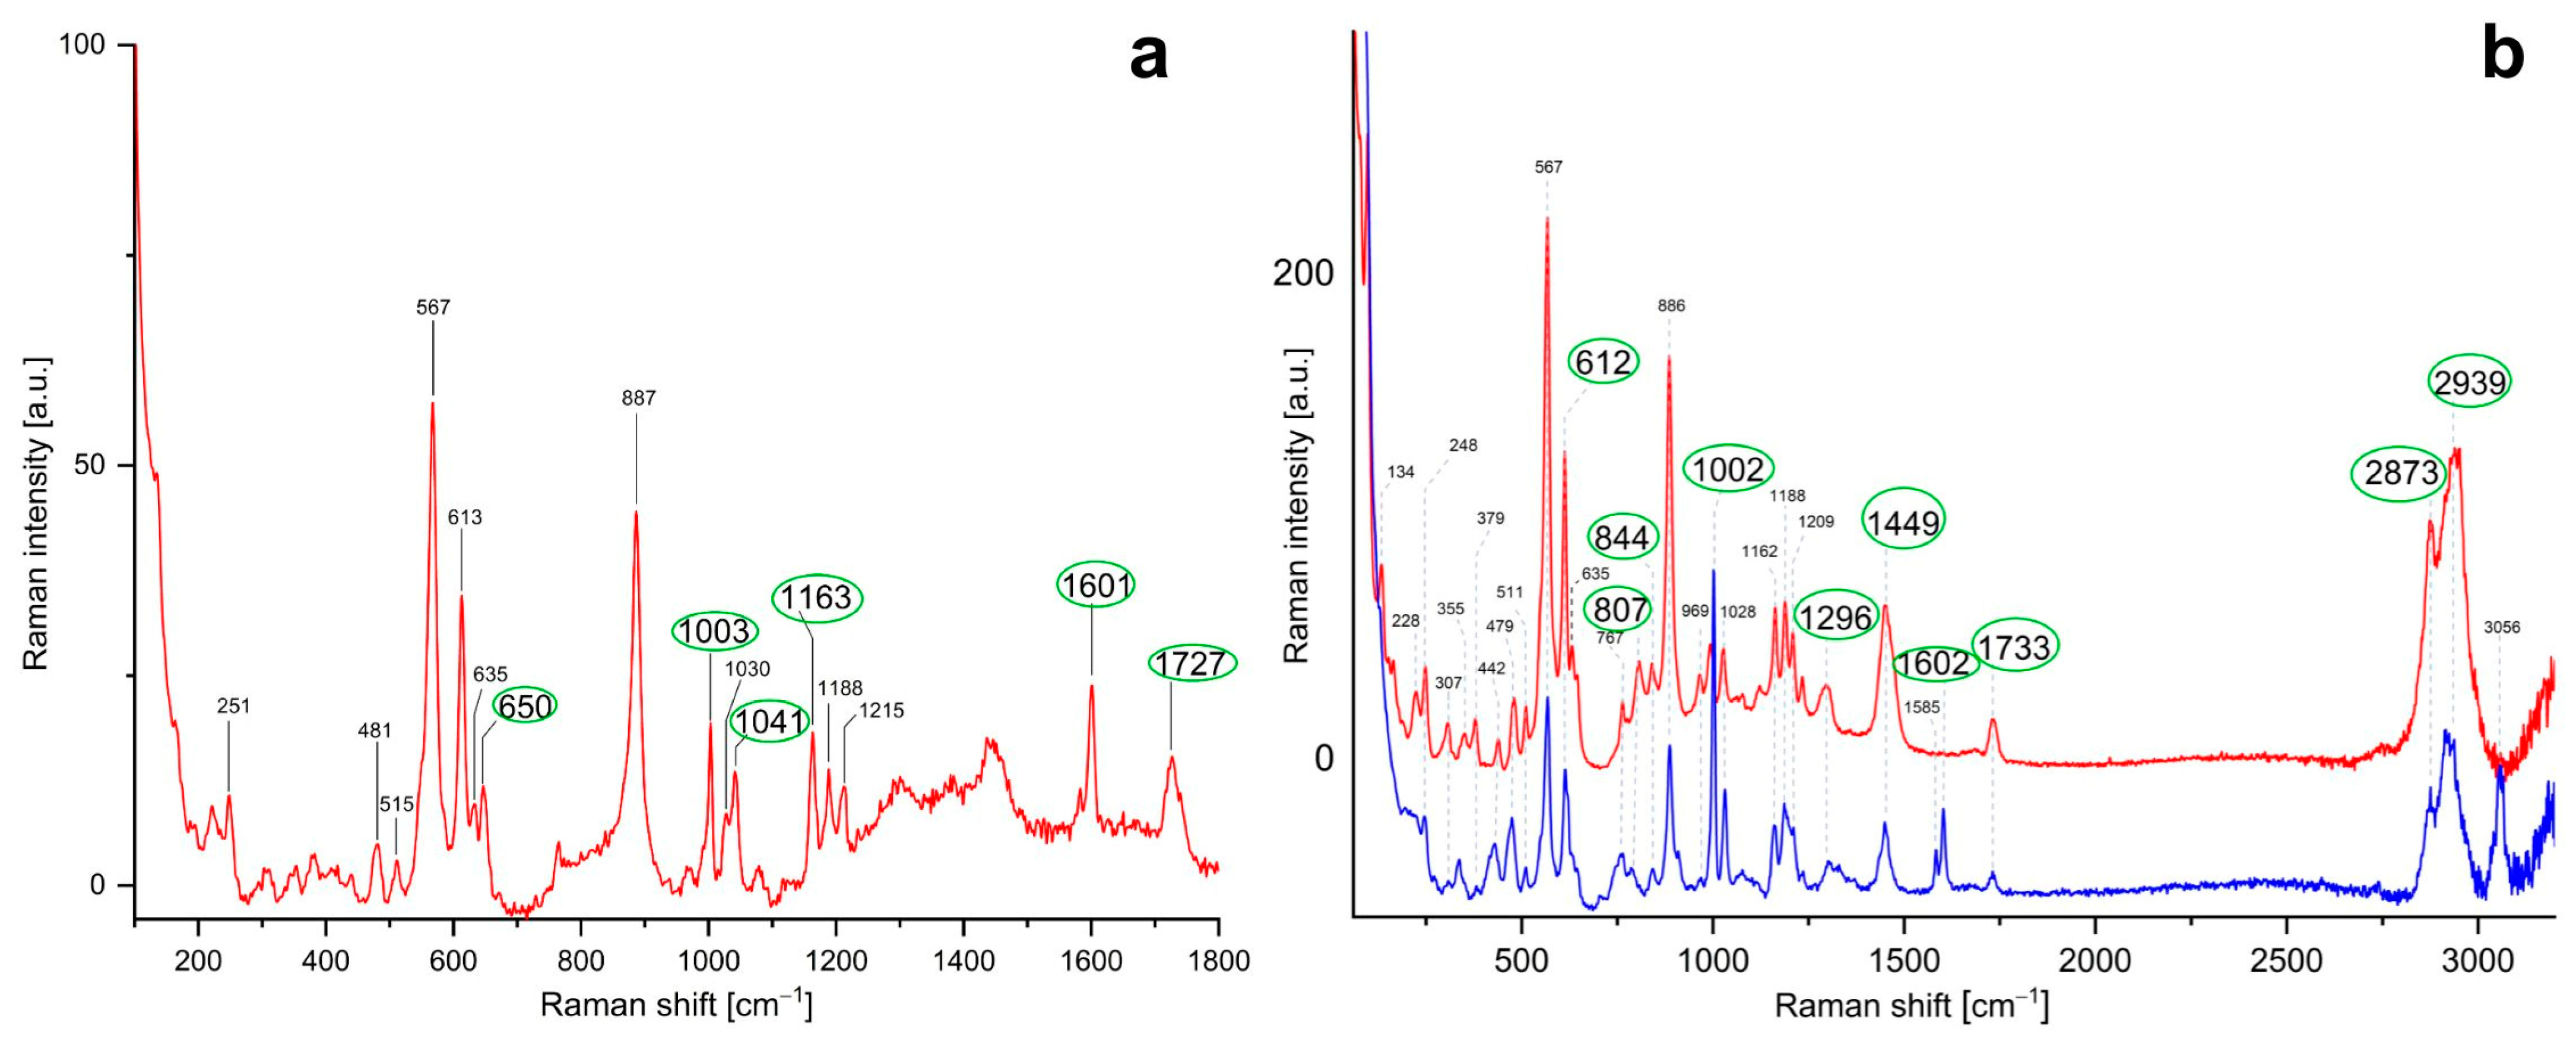
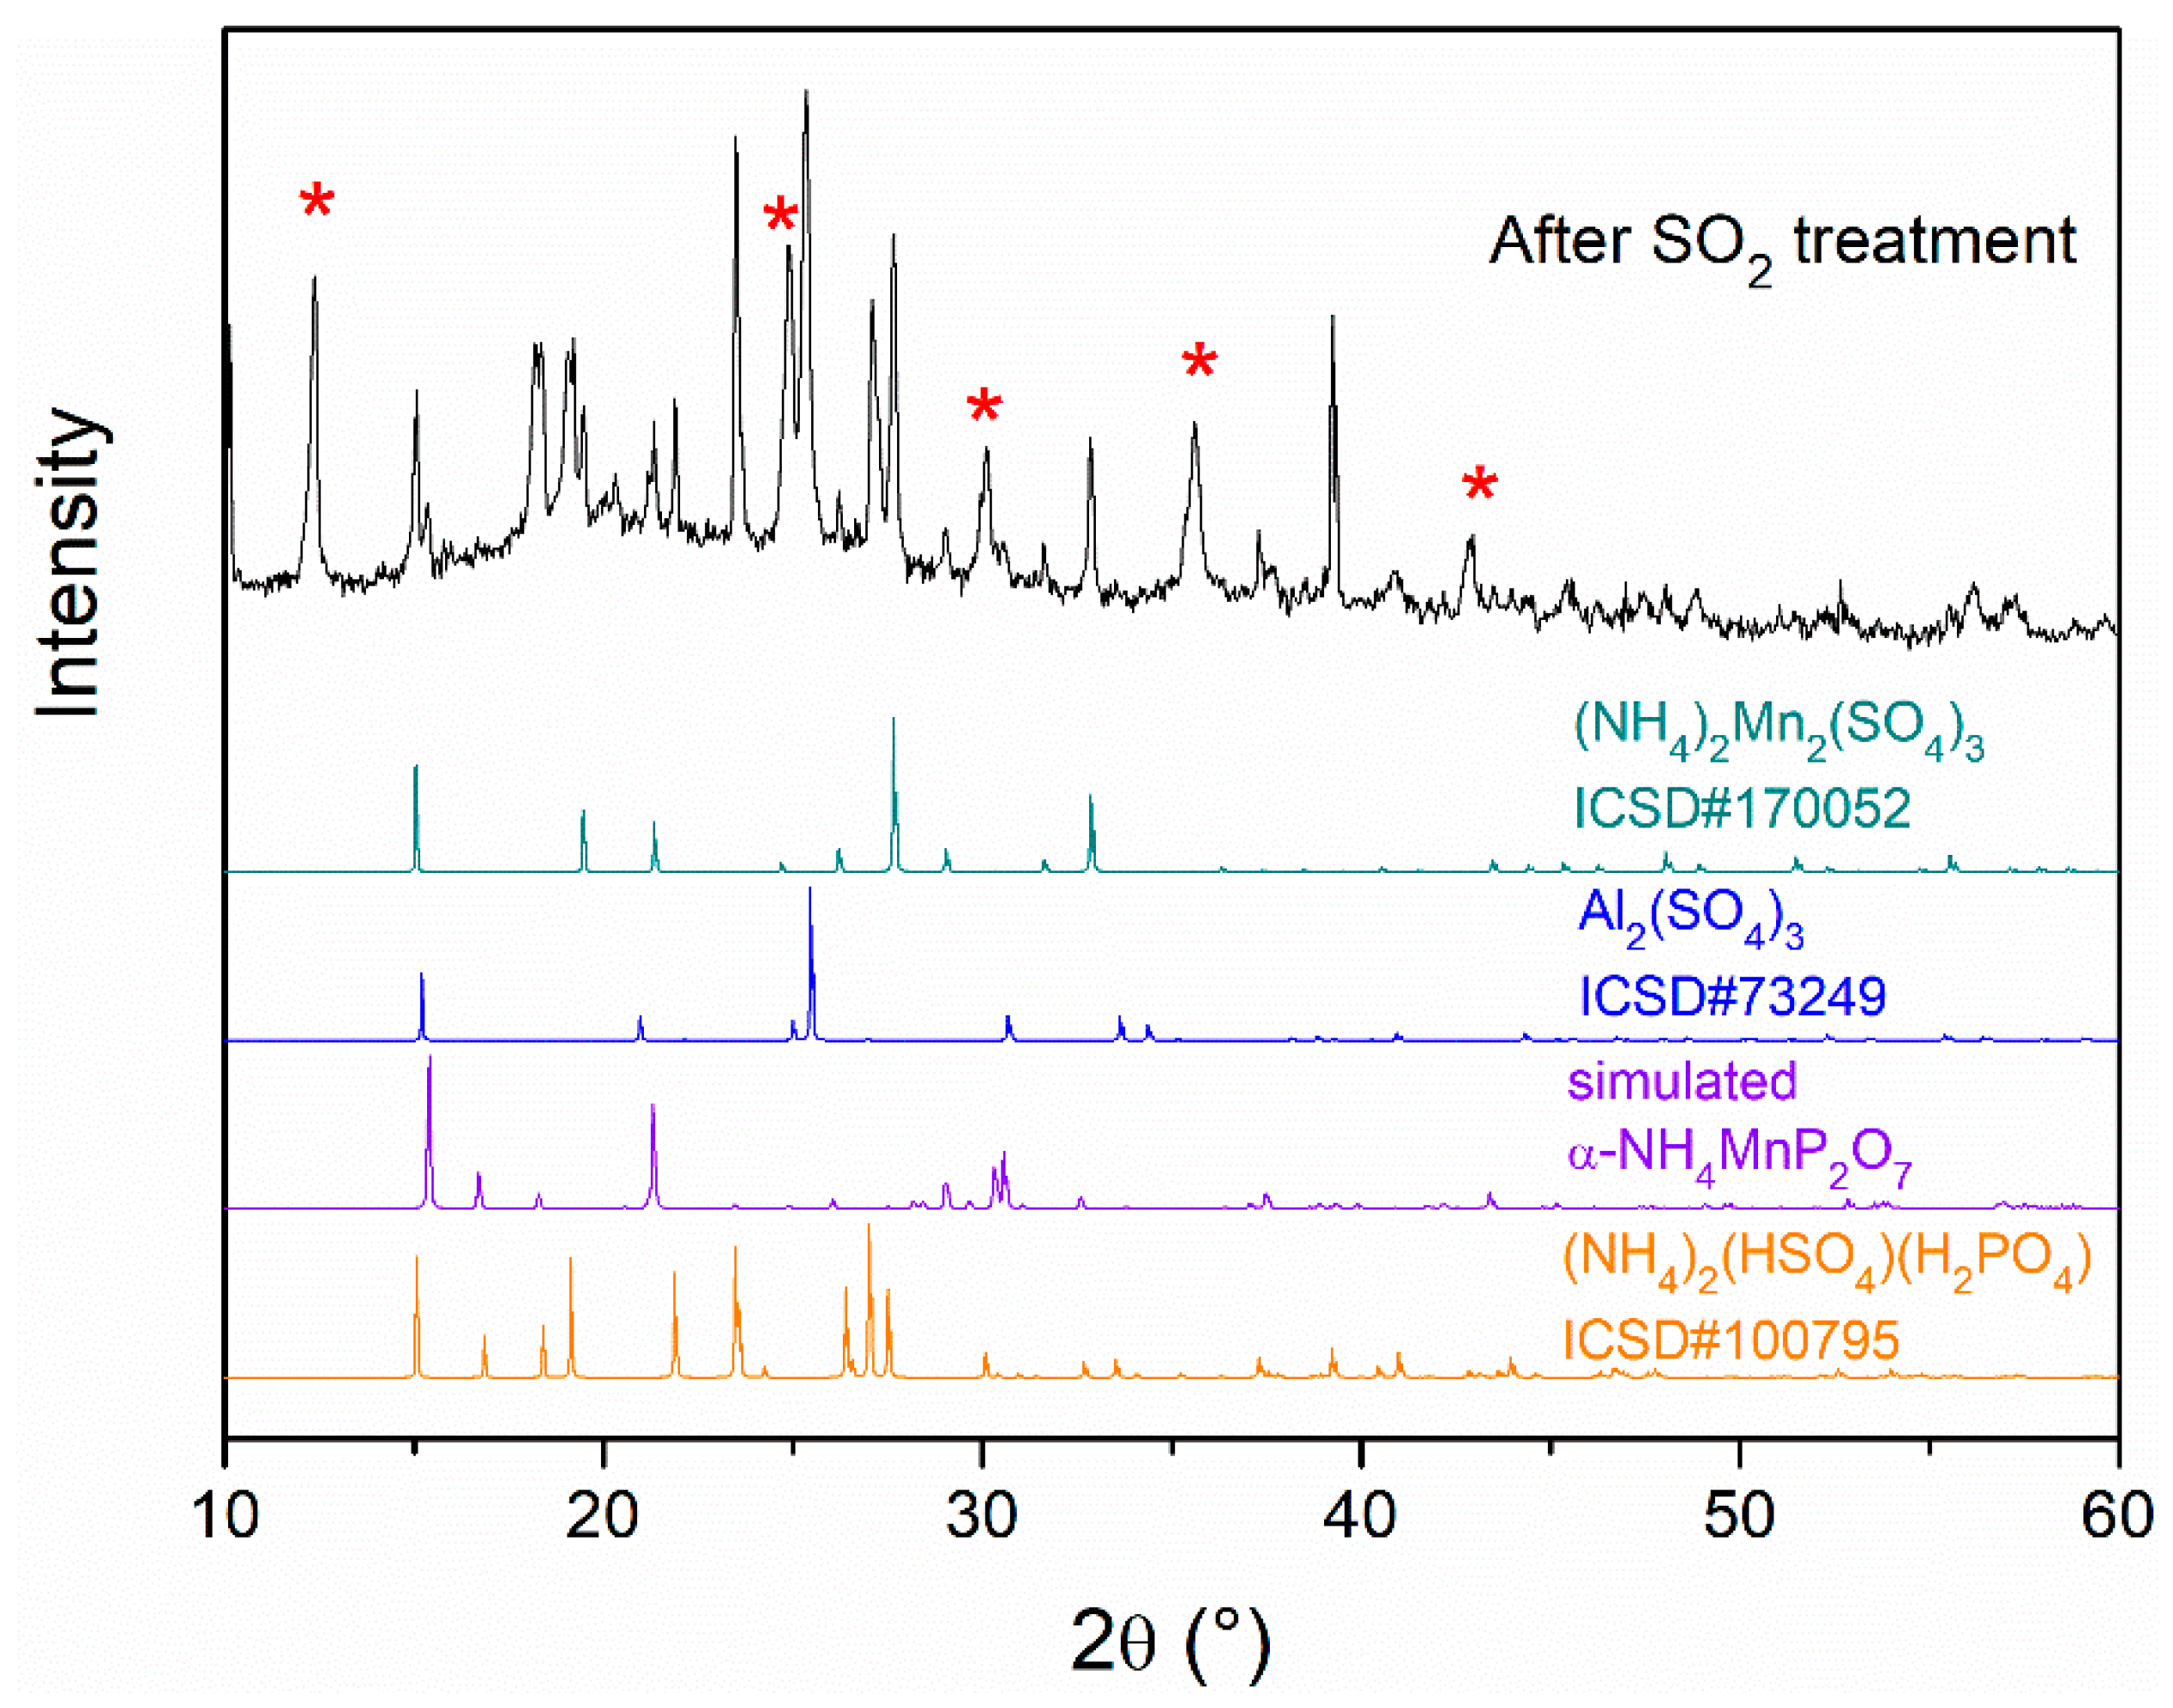
3.3.2. Inorganic Fraction

The morphological observations carried out with Optical Microscopy are confirmed by the SEM-EDX analysis. Indeed, the crystals formed after exposure to SO2 in a humid environment can be observed with greater resolution in the SEM. In particular, three different crystal types can be distinguished (Figure 6). The first crystal (namely CRY_1) appears to have a cubic structure, the second (CRY_2) appears to have a monoclinic structure, and the third (CRY_3) appears less defined and more rounded. These three types of crystals were observed in all samples, except for the Oil_V sample, where only the first type was distinguishable.
Considering the EDX spectra obtained for each crystal type (Supplementary Figure S9), the qualitative elemental composition of the three crystals appears to be the same but in different percentages. The crystals CRY_1 and CRY 2 contain the same main elements: oxygen (O), nitrogen (N), manganese (Mn), phosphorus (P), and sulfur (S). The weight percentages of the latter four elements, however, differ greatly between the two crystals (Table 2). It would therefore appear that the CRY_1 crystal contains mainly manganese, sulfur, and nitrogen, whereas CRY_2 crystals contain mostly phosphorus, sulfur, and nitrogen. The carbon detected in these two crystals is probably linked to the organic matrix on which the crystals were formed, and the aluminum and silicon could be linked to the presence of kaolinite identified in the samples before the accelerated aging. Regarding CRY_3, in addition to oxygen, the main elements found are manganese (22.73% ± 0.7), phosphorus (16.52% ± 0.3), and sulfur (2.01% ± 0.1).
ATR-FTIR spectroscopy was employed to obtain additional chemical information on the crystal composition. The spectra after aging were acquired mainly on the grey area, due to the high presence of crystals. In Figure 7, it can be observed that in all samples, the pigment peaks disappear or decrease, such as the peaks at 989, 590, and 563 cm−1. This phenomenon indicates that changes have occurred in the inorganic fraction. Moreover, new peaks are visible. In Oil_V and Oil_V_COMM samples, a new peak around 1000 cm−1 could be related to the asymmetric stretching of the PO43− anion [61], and the band at 600 cm−1 could be related to the PO3 asymmetric bending [33]. In addition, in the Oil_V sample, a new band at 691 cm−1, probably related to the twisting vibration of water molecule [32], and a band at 616 cm−1, attributable to the vibration of the sulfate group (SO42−), are visible [62,63,64]. In Oil_V_COMM, new bands are visible at 503 and 449 cm−1, possibly due to the stretching of the Mn-O bond of manganese sulfate crystals and the asymmetrical bending of the P-O-P bond, respectively [33,65]. Regarding the alkyd resin sample, a shift of the peak related to the symmetric stretching of the PO3 group (at 979 cm−1) and the formation of two new bands at 602 and 470 cm−1 can be observed, probably due to the asymmetric bending and rocking of the PO3 group [32,33]. There is also a new band at 533 cm−1 that could be due to the stretching of the Mn-O bond [65]. Concerning the acrylic and styrene–acrylic-based samples, a peak around 970 cm−1 can be related to the stretching of the sulfate group [44,65]. It is also visible that a new peak at 665 cm−1 is probably related to the bending of the MnOH or PO3 group [33,66]. Additional bands at 600 and 530 cm−1 can be assigned to the PO3 asymmetric bending and the Mn-O bond stretching, respectively [33,65]. Furthermore, in the Sty_V sample, a new band is visible at 469 cm−1, probably related to the rocking of the PO3 group [32]. As just reported, ATR-FTIR analysis revealed new signals mainly related to the PO3 group, and in some samples (Oil_V, Acr_V, and Sty_V), absorptions related to the sulfate group are also visible. This identification could indicate a reaction between the pigment and the sulfuric acid that was presumably formed inside the weathering chamber.
To better understand the nature of the crystals formed, it is necessary to consider the results of μ-Raman spectroscopy: acquisitions were carried out by trying to focus on the crystals; however, due to instrumental limits, it was hard to distinguish the three crystal types already differentiated with SEM-EDX. The main characterization was obtained for CRY_1. µ-Raman analysis (Figure 8) detects the co-presence of phosphate and sulfate groups. New peaks can be observed in the Oil_V_COMM sample (Figure 8a). They are probably related to the vibrations of the sulfate group: specifically, the peak at 460 cm−1 could be related to SO42− stretching, the one at 603 cm−1 to SO42− group vibration, and the one at 1093 cm−1 to SO42− asymmetric stretching [63,67,68]. There are also new peaks related to phosphate, such as the bands at 624 and 637 cm−1 of the PO3 bending and the band at 1120 cm−1 of the asymmetric stretching of PO3 [33]. Moreover, there is a strong increase in the intensity of the peak related to the asymmetric stretching of PO3 (at 1026 cm−1), already present in the unaged sample. Finally, most of the bands related to the phosphate groups of PV16 and that were also detected before aging are still visible, such as those at 565, 613, 628, and 884 cm−1.
Concerning sample Oil_V, the high-fluorescence drawback makes the interpretation difficult (Supplementary Figure S10a). However, a single new broadband at 1381 cm−1 was detected, related to the vibration of the O-H bond of the carboxylic acids formed after aging due to the oxidation reaction that occurred in the binder [69]. In the alkyd sample (Figure 8b), the appearance of new bands related to the sulfate group is also visible: as for the Oil_V_COMM sample, the absorptions at 460, 607, and 1093 cm−1 can be related to stretching, vibration, and asymmetric stretching of the SO42− group, respectively [63,67,68]. Other bands related to the sulfate group are those at 581 cm−1, due to out-of-plane bending; and at 983 and 1146 cm−1, due to symmetric and asymmetric stretching [62,64,68]. Furthermore, a shift is observed from 886 cm−1 to 892 cm−1 in the asymmetrical stretching band of the PO3 group [33]. According to Chapman et al. [35], the shift of this peak could depend on how the phosphate group is conjugated to the other elements. In addition, as for Oil_V_COMM, the main peaks detected before aging are still visible, and there is a strong increase in the band at 1027 cm−1. Regarding the acrylic sample (Figure 8c), two new bands are visible at 577 and 976 cm−1, and they could be related to the out-of-plane bending and the symmetric stretching of the sulfate group, respectively [62,63,70]. Moreover, a shift from 307 cm−1 to 297 cm−1 of the vibration of the phosphate group can be noticed. As for the previous samples, new peaks are visible in the Sty_V sample (Supplementary Figure S10b), in particular, a peak at 300 cm−1 that could be related to the vibration of the phosphate group and a peak at 982 cm−1 attributable to the symmetrical stretching of the SO42− group [62,64].
To gain more information on the crystals formed through the accelerated weathering, XRPD analysis was additionally carried out. For this purpose, the aged styrene–acrylic-based sample was considered since it was the most representative in terms of degradation products, such as crystals, observed and detected by SEM and µ-Raman. In particular, the analysis was performed on crystals visible to the naked eye and the grey area. As can be seen in Supplementary Figure S11, the crystals were identified as (NH4)2(HSO4)(H2PO4) (ICSD#100795). On the other hand, the investigation of the XRPD pattern of the grey area was quite complex. As evidenced in Figure 9, in addition to a fraction of unmodified α-NH4MnP2O7 phase, the formation of (NH4)2(HSO4)(H2PO4), the presence of Al2(SO4)3 related to the minority phase of the kaolinite, and the formation of the (NH4)2Mn2(SO4)3 compound (ICSD#170052) were detected.
Combining the SEM-EDX, ATR-FTIR, and μ-Raman results with the XRPD results, it can be concluded that crystal CRY_1 corresponds to (NH4)2Mn2(SO4)3 and crystal CRY_2 to (NH4)2(HSO4)(H2PO4), whereas crystal CRY_3 could not be identified from these initial analyses. For this reason, further investigations are needed.
A further step was taken on the Sty_V sample to evaluate the effect of the accelerated weathering on pigment color using FORS. In particular, the Kubelka–Munk function was applied to the reflectance spectra acquired before and after aging. In Supplementary Figure S12a, the origin of the violet color of the α-NH4MnP2O7 pigment can be attributed to the Mn3+ ion (3d4 electron configuration) in the octahedral site dominated by the main absorption band centered on 545 nm due to the spin-allowed 5Eg5T2g transition. It is also well known that the optical properties of Mn3+ ions are influenced by the Jahn–Teller effect, which results in the splitting of the ground state 5E [71,72] and the 5T2 and 1T2 excited states [73]. From the results described previously, it appears that one of the main reactions that took place during the artificial aging was the transformation of α-NH4MnP2O7 to (NH4)2Mn2(SO4)3, suggesting the reduction of Mn3+ (3d4) to Mn2+ (3d5). Considering that in (NH4)2Mn2(SO4)3 the two Mn2+O6 octahedrons are characterized by very similar Mn-O bond lengths, the absorption bands visible after the accelerated aging at 460 nm and 565 nm (Supplementary Figure S12b) can be assigned to the transitions from the 6A1g ground state to the 4T2g and 4T1g excited states, respectively [74].

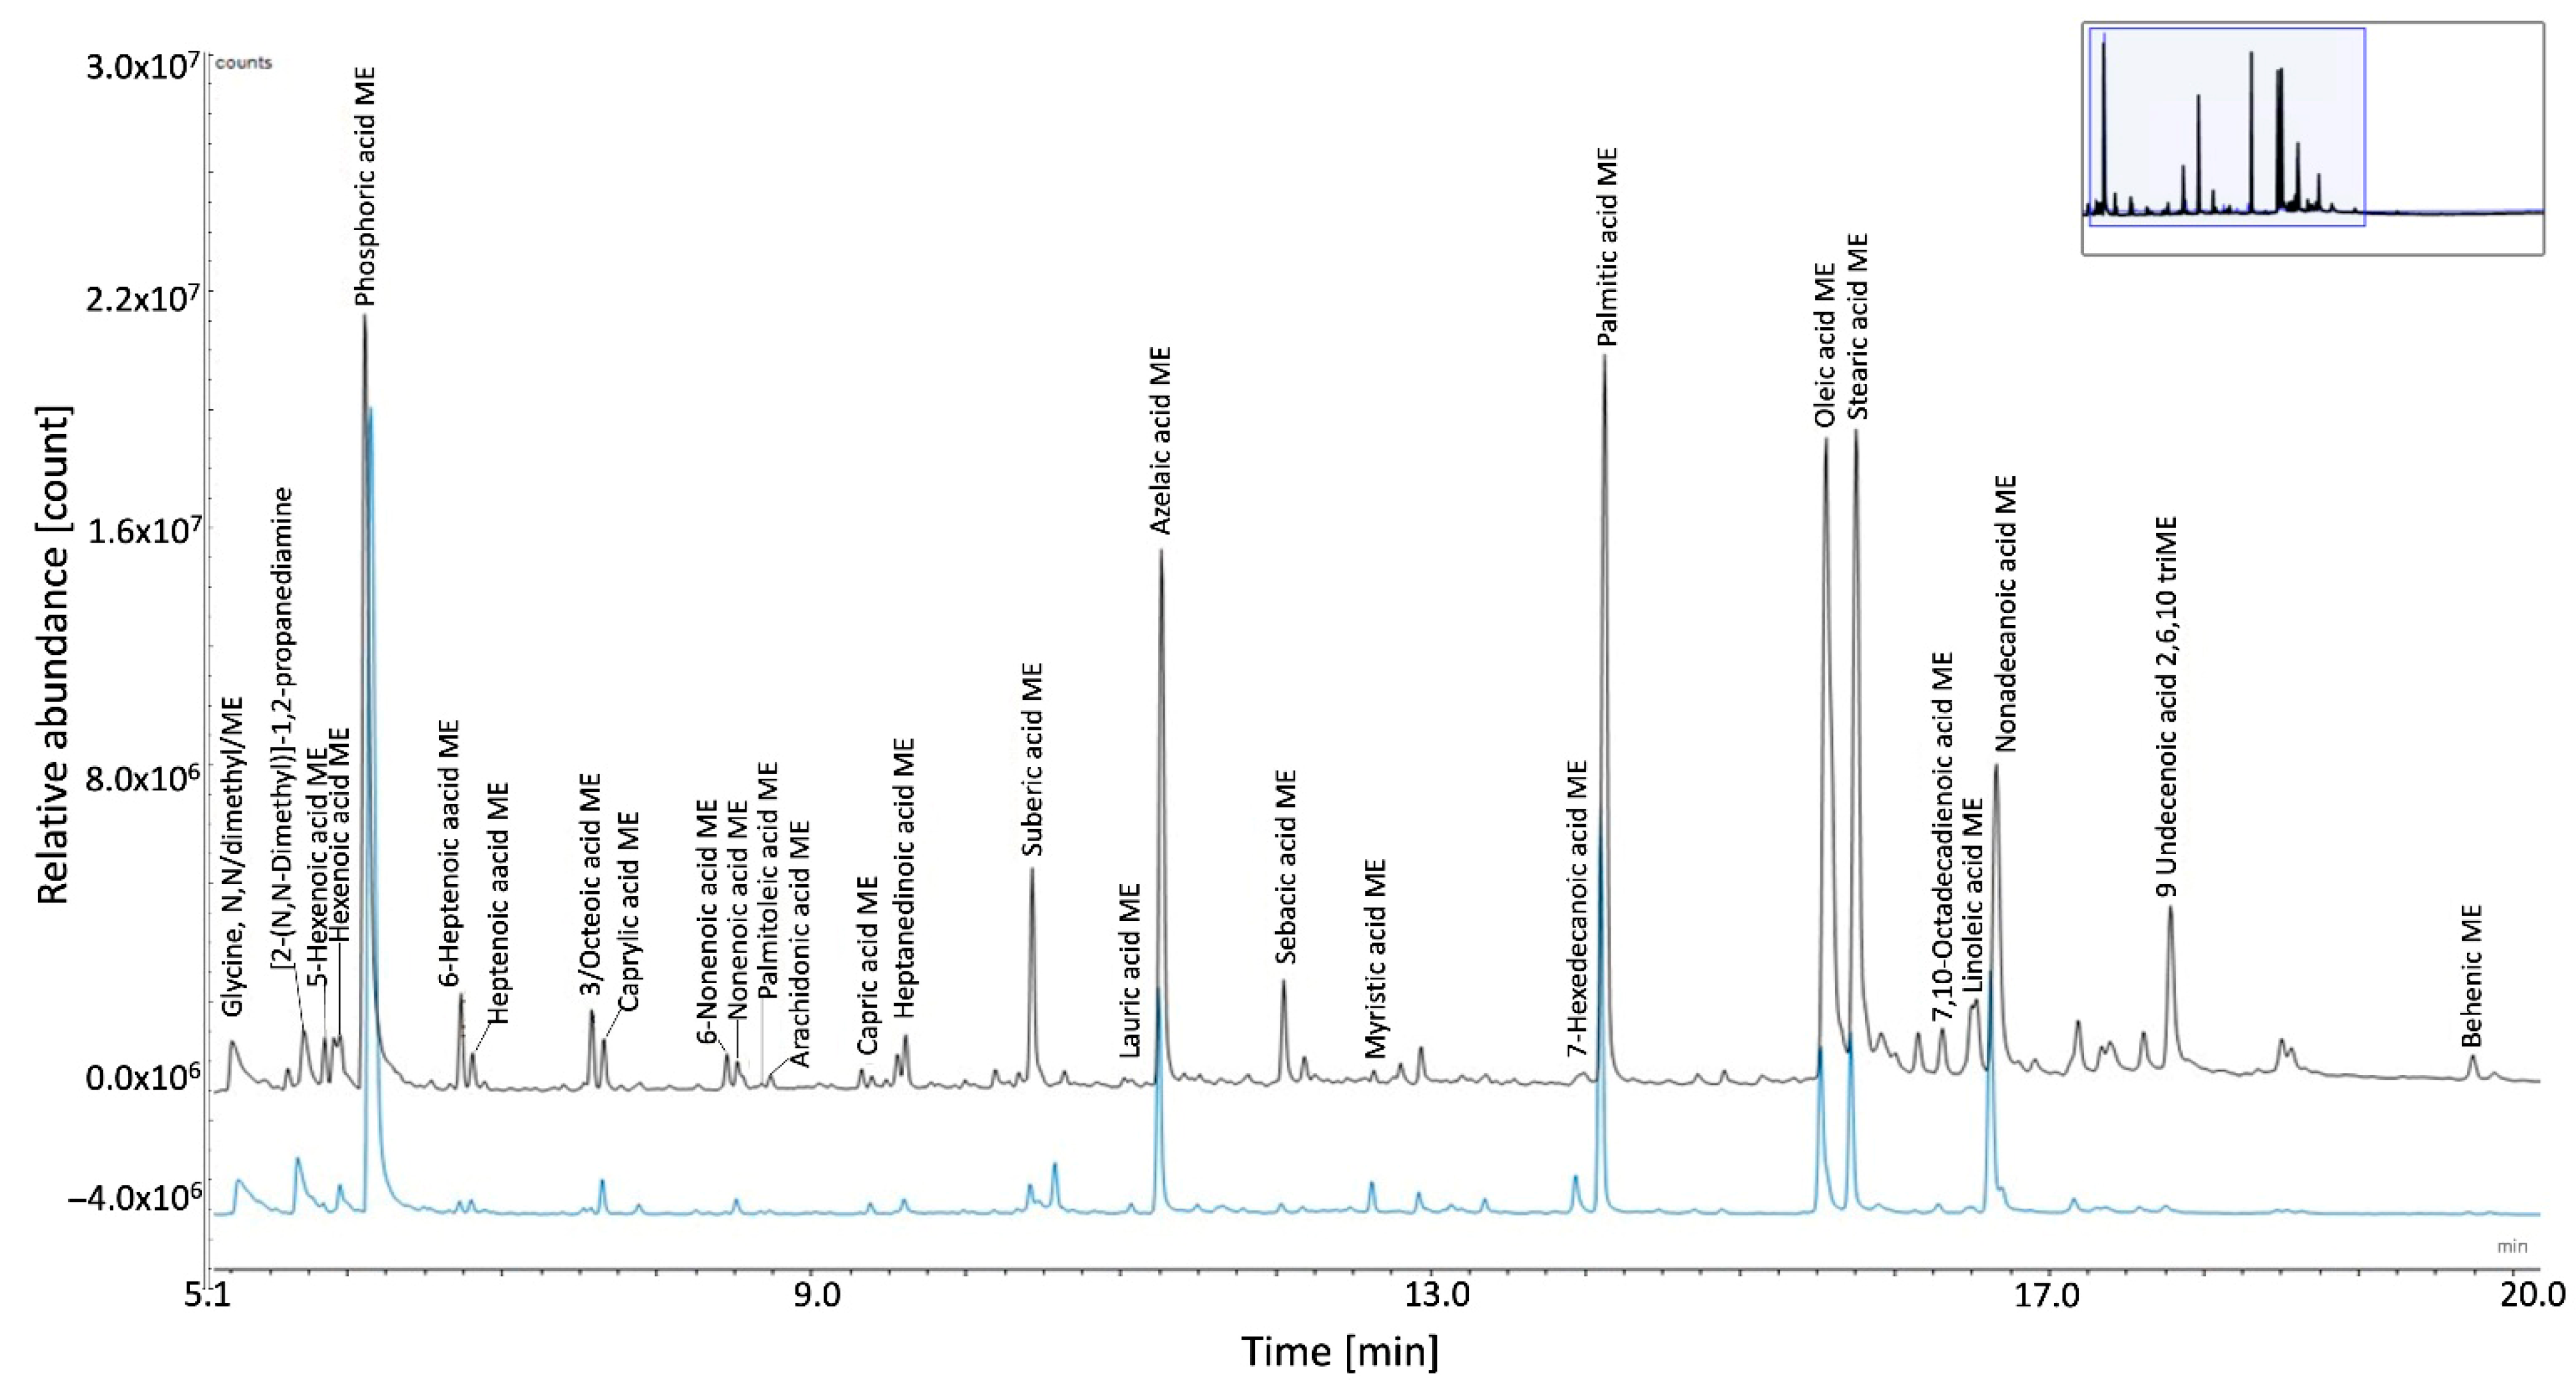
3.3.3. Organic Fraction

This section describes all the chemical changes that occurred in the organic matrix after accelerated aging. When possible, infrared spectra were acquired both on the part of the sample that showed no color change and on the part that turned grey. THM-Py-GC/MS and Py-GC/MS analyses were performed on samples taken along the edges of the paint where the color changed to grey. Both analyses were performed after the samples had dried.

Linseed Oil

The IR spectrum (Figure 7a) obtained in the violet area is very similar to that of the unaged sample, while the spectrum of the grey region shows some variations. In particular, from a semi-quantitative analysis (Supplementary Table S12), an increase in intensity can be observed in the region between 3600 and 2600 cm−1, i.e., the bands associated with C-H stretching, with also the formation of a band around 3250 cm−1. This may be caused by the absorption of water due to the high relative humidity content present during aging and/or the formation of new carboxylic acids and alcohols due to hydrolysis and oxidation reactions [48]. The esters of triglycerides can indeed react with water molecules to form carboxylic acids and alcohols [48,75]. At the same time, sulfur dioxide is a good oxidant that can therefore favor oxidation reactions of the oil, resulting in the formation of aldehydes, ketones, alcohols, and carboxylic acids [49]. Evidence for these hypotheses is the formation of a new band at 1705 cm−1 and a shoulder at 1633 cm−1, probably related to the C=O stretching of carboxylic acids and diketones in enol form, respectively [45,76]. Moreover, the semi-quantitative evaluation highlights a decrease in the intensity of the carbonyl stretching (1737 cm−1) and C-H bending (1377 cm−1) bands due to oxidation reactions (Supplementary Table S12). Furthermore, a band appears at 1432 cm−1, which could be attributed to the formation of metal soaps due to the presence of manganese [77]. Metal soaps are metal carboxylate salts, usually found in oil paintings because of the chemical reaction between metal ions present in the painting layers and free fatty acids from the lipidic binders [77]. In this specific case, the new peak can be related to the bending of the CH2 group of manganese azelate or the symmetrical stretching of the COO- group of manganese palmitate [77]. Finally, a band at 2346 cm−1 is visible, which may be associated with the stretching of the O-H bond of a sulfonic acid group (-SO3H) [69]. SO2 can react with pre-existing hydroperoxide groups bound to allyl carbons to form free radicals that initiate crosslinking reactions with a mechanism similar to that of normal autoxidation [78]. This leads to the insertion of sulfonic groups within the polymer chain. A further indication of possible sulfonation of the oil is given by the results obtained with THM-Py-GC/MS and listed in Table 3.
From the polymerization induced by accelerated aging, an increase in the content of saturated dicarboxylic acids (suberic, azelaic and sebacic acid) and a decrease in unsaturated fatty acids (oleic and linoleic acid) would be expected [48]. In fact, the dicarboxylic acids, and in particular azelaic acid, are formed during the oxidative fragmentation of the unsaturated fatty acid from the vegetable oil as a tertiary oxidation products [48]. On the other hand, a decrease in %D (especially azelaic acid), from 20.90% to 9.59% is observed. Consequently, the A/P and D/P values decrease instead of increasing and the A/Sub value increases instead of decreasing. A similar reduction of azelaic acid had also occurred in a recent study on drying oils [79], and it was hypothesized that the formed dicarboxylic acids may have covalently bonded to the polymeric network resulting in a decrease in their content. Therefore, it could be assumed that sulfonation reactions have occurred due to the presence of SO2 and high RH values, leading to crosslinking reactions [78]. This hypothesis was confirmed by ATR-FTIR spectroscopy where the formation of a band related to the sulfonic group was detected at 2346 cm−1. Another possible reason could be that the formation of phosphate and sulfate groups is hindering the detection of azelaic acid [50]. On the other hand, the O/S ratio decreases, as expected [48].

Commercial Oil

Figure 7b compares the IR spectra obtained before and after the aging of the oil-based commercial paint sample. In this case, it was only possible to acquire the spectrum on the grey part as the entire surface was affected by the color change. As for the Oil_V sample, the semi-quantitative evaluation highlights an increase in the region from 3600 to 2600 cm−1 due to hydrolysis and oxidation reactions [80] (see Supplementary Table S12). A splitting of the band related to the carbonyl group is evident with also the formation of a peak at 1711 cm−1 associated with fatty acids formed after aging [48]. Also for this sample, there is a decrease in the main binder peaks (Supplementary Table S12) and the appearance of a shoulder at 1630 cm−1 ascribable to the C=O stretching of diketones [76]. Finally, as in the previous sample (Oil_V), there is a band at 2346 cm−1, probably related to sulfonic acid [69].
Concerning the results obtained by THM-Py-GC/MS, unlike what was observed in the stand oil sample, there is an increase in saturated dicarboxylic acids, as can be shown in Table 3. The increase in dicarboxylic acids %D (in particular, azelaic acid) brings to the consequent increase in the ratio A/P and D/P and the decrease in the A/Sub ratio if compared to the value obtained before aging. At the same time, the content of oleic acid decreases and, consequently, the O/S value, as expected. All these considerations confirm the formation of dicarboxylic acids as a result of oxidation, as already hypothesized with ATR-FTIR spectroscopy [48].

Alkyd Resin

Also, for these samples, IR spectra could only be acquired on the grey part (Figure 7c). As shown for the previous samples, hydrolytic degradation occurs after accelerating aging and, in this case, it is favored by the presence of the ortho-phthalate esters, which are sensitive to water in an acidic environment [81,82]. As shown from the semi-qualitative evaluation (Supplementary Table S12), this leads to a decrease in the intensity of the phthalate group bands (1261, 742, and 710 cm−1) and an increase in the region between 3600 and 2600 cm−1. The increase in intensity in this region may also be due to the oxidation reactions that occur in the oil fraction in the presence of SO2, leading to the formation of alcohols and other carbonyl species such as fatty acids and ketones [22]. Further evidence for the presence of oxidation products can be noticed in the formation of a shoulder at 1636 cm−1 due to the stretching of diketones in enolic form [76]. The formation of ketones and aldehydes may also be due to the oxidation of pentaerythritol [25]. Furthermore, as in the previous samples, a band appears after aging at 2346 cm−1 probably related to the interaction of sulfur dioxide with the oil, as fatty acids tend to be reactive with SO2 [22]. Further evidence for this interaction with SO2 is provided by the band at 868 cm−1, which could be related to the stretching of the S-O bond of sulfinic acid (-SO-OH) [69].
The results obtained with THM-Py-GC/MS analysis provide more detailed information on the various components in the organic matrix (Table 3). As for sample Oil_V, a decrease in the carboxylic acids and, consequently, in the A/P and D/P ratios is evident. Therefore, the sulfonation reactions took place mainly in the lipid fraction, as for the Oil_V samples. The O/S ratio, an index of oil maturity, decreases, as expected [49], while the P/S value, which should remain stable over time [49], increases. For the other components of the alkyd resin, the % areas were considered. In particular, Table 3 shows a decrease in pentaerythritol due to oxidation reactions [25]. There is also a % increase in phthalic acid, indicating that more free phthalic acids were formed during aging, probably also by hydrolysis of phthalic anhydride [25]. The % increase in benzoic acid may indicate instability of the resin as a result of aging [83].

Acrylic Emulsion

The results obtained on acrylic samples employing ATR-FTIR spectroscopy (Figure 7d) provided important indications of possible changes that may have occurred because of accelerated aging. The spectrum obtained in the violet area is very similar to that of the unaged sample, while the spectrum of the grey region shows some variations. As for the previous binders, the acrylic emulsion sample shows an increase in intensity in the region between 3600 and 2600 cm−1. This trend may indicate that hydrolytic degradation has occurred, leading to a gradual opening of the polymeric network [22,24]. Water absorption is also favored by the presence of the surfactant PEO, which is hygroscopic and therefore tends to migrate to the surface when exposed to high RH values, weakening the physical and mechanical properties of the polymer, forming efflorescence on the surface and stickier areas [23,24]. As a result of the hydrolysis, an increase in the intensity of the PEO (1341 and 1114 cm−1) and of the main binder bands (2956, 2872, 1727, and 1436 cm−1) is observed from the semi-quantitative evaluation (Supplementary Table S12). A confirmation of oxidation reactions is provided by the formation of a shoulder at 1637 cm−1, probably related to the C=O stretching of the ketones formed as oxidation products [76]. Finally, a new band at 2346 cm−1 is visible. This band could be related to the stretching of the O-H bond of the sulfonic acid group (-SO3H) [69]. Sulfuric acid, which is assumed to have formed within the weathering chamber during accelerated aging, is a good sulfonating agent that can easily insert HSO3- groups into the polymer chain [84]. The band at 1138 cm−1, which is probably related to the asymmetric stretching of the sulfonate group [84,85], and the band at 853 cm−1, which could be due to the S-O stretching of sulfinic acid [69], may provide further indications of sulfonation.
The results obtained with Py-GC/MS (Supplementary Table S13) confirm the hypothesis assumed with ATR-FTIR spectroscopy. An intense decrease in the area of the dimeric and trimeric fractions is visible, associated with the oxidation and hydrolysis reactions that lead to a scission of the polymer chain [24]. This hypothesis would also explain the consequent strong increase in the area of n-butyl acrylate (nBA), its pyrolysis products (1-butene, n-butyl acetate, and n-butyl tiglate), and, in general, the peaks of low-molecular-weight compounds (e.g., butyl alcohol).

Styrene–Acrylic Emulsion

Looking at the ATR-FTIR results (Figure 7e), hydrolytic degradation appears to have taken place, and this reaction can be detected by the increase in the intensity of the main binder bands (2931, 2872, and 1728 cm−1) and the region between 3600 and 2600 cm−1 (Supplementary Table S12) [24]. Indeed, the absorption of water and the formation of carboxylic acids following the rupture of the polymeric chains lead to an increase in the intensity of almost all the spectra signals [69]. As for the other samples, bands at 2346, 1150, and 853 cm−1 could be an indication that sulfonation reactions took place [69,84]. In polyester-based polymers, sulfuric acid can promote the formation of a crosslinked material through the insertion of sulfonic groups between the aromatic rings [84,85], and this would explain the presence of these bands. Oxidation reactions seem to have occurred, confirmed by the presence of a shoulder at 1640 cm−1, probably related to the C=O stretching of ketones formed as oxidation products [76]. SO2 is likely to oxidase the side groups of the polymeric chain, leading to the formation of carboxylic acids, aldehydes, and ketones [22,24,86].
In Supplementary Table S14, the results obtained with Py-GC/MS before and after accelerated aging are compared. A decrease in peak area % of the dimeric and trimeric fractions of styrene, nBA, and the combination of styrene and nBA is visible. For example, the area of the styrene–styrene–nBA trimer peak decreases so much that it is below the detection limit. Consequently, there is a strong increase in the area% of the styrene peak, from 40.78% to 87.26%. As already supposed by IR spectroscopy, these changes may have been caused by oxidation and hydrolysis reactions that occur during aging [24]. These reactions could have resulted in the breaking of the polymer network, leading to an increase in the area of the main low-molecular-weight peaks [24].

4. Final Discussion and Conclusions

This study investigated the stability of modern paints containing manganese violet PV16 (NH4MnP2O7) when exposed to weathering agents, specifically high relative humidity and sulfur dioxide. In the field of cultural heritage, PV16 is used mainly in paintings, but little research exists on its conservation. This study further investigates the susceptibility of this pigment to degradation in indoor conditions and mixed with different modern binders (oil, alkyd resin, acrylic emulsion, and styrene–acrylic emulsion).
After the accelerated aging, color changes from violet to grey occurred in all the samples, and in the grey areas, degradation of both organic and inorganic fractions was observed. At the inorganic level, three different types of crystals were formed in all samples, except in the oil one, where only one type of crystal was visible. These crystals have different shapes and elemental compositions. In fact, they were identified as a mixture of phosphates and sulfates and, in particular, (NH4)2Mn2(SO4)3 and (NH4)2(HSO4)(H2PO4). Both the formation of the crystals and color changes seem to be more related to the pigment itself and, in particular, to the hygroscopicity of its phosphate group and the electron configuration of Mn ions. The main chemical reactions that occurred in the organic matrix of all samples are hydrolysis, oxidation, and sulfonation. The effect of hydrolysis is more evident in the acrylics; oxidation is more evident in the commercial and styrene–acrylic samples; and sulfonation is evident in all samples, but less in the commercial oil one. Furthermore, comparing the self-made and the commercial oil-based samples, some differences were noticed. The commercial sample showed the greatest optical change on the surface, and the prevalent degradation reaction seems to be the oxidation of the organic binder, whereas in the self-made oil sample, the color change was only at the edges, and the principal reaction appears to be sulfonation. These differences could be related to the pre-heated treatment of the oil in the self-made sample and the presence of additives in the commercial sample. Considering all the results obtained, the most degraded paints after exposure to SO2 in a humid environment were those based on alkyd resin, styrene–acrylic emulsion, and commercial oil paint, while the more stable paints were the acrylic-based and the self-made oil-based samples.
The results obtained proved promising for future investigations and considerations of the materials under investigation. One example is the understanding of the role and the chemical stability that the two types of oil, i.e., stand-oil and non-pre-polymerized types, have regarding the resistance of the manganese pigment to acid attacks.
Another consideration for future studies is the use of models that reproduce paintings on canvas to study the possible influence of the substrate and the presence of other pigments. Finally, it is important to investigate whether this type of degradation effect can also be found in real works of art, for example, in modern and contemporary paintings, to possibly proceed with studies on its correct conservation. It is important to underline that geographic areas that are more susceptible to this problem are those where SO2 levels are still high, such as Mediterranean and Asian countries, including China, India, and Southern Italy. Therefore, the survey should be carried out starting from these areas.
This study has contributed to the expansion of knowledge relating to modern and contemporary paints containing manganese-based purple pigment, highlighting their susceptibility to exposure to pollutants, especially depending on the different binders with which it is mixed. These results therefore highlight the importance of museum environmental-monitoring measures, underlining the need for constant refinement. Furthermore, they will also be able to provide useful indications for ongoing research in other application fields where this material is used, such as in sensor technology and construction.

Supplementary Materials

The following supporting information can be downloaded at https://www.mdpi.com/article/10.3390/app15094630/s1, Table S1: IR and Raman band assignment of manganese violet pigment; Table S2: IR band assignment of Oil_V and Oil_V_COMM samples before accelerating aging; Table S3: Pyrolysis fragments of unaged Oil_V and Oil_V_COMM samples detected by THM-Py-GC/MS analysis listed and described according to their retention time (RT, min), their compound name, and their mass to charge ratio (m/z) with the respective base peak not written in brackets. ME=methyl mester; Table S4: IR band assignment of Alk_V sample before accelerating aging; Table S5: Pyrolysis fragments of unaged Alk_V sample detected by THM-Py-GC/MS analysis listed and described according to their retention time (RT, min), their compound name, and their mass to charge ratio (m/z) with the respective base peak not written in brackets. ME=methyl ester; Table S6: IR band assignment of Acr_V sample before accelerating aging; Table S7: Pyrolysis fragments of unaged Acr_V sample detected by Py-GC/MS analysis listed and described according to their retention time (RT, min), their compound name, and their mass to charge ratio (m/z) with the respective base peak not written in brackets. ME = methyl ester; Table S8: IR band assignment of Sty_V sample before accelerating aging; Table S9: Pyrolysis fragments of unaged Sty_V sample detected by Py-GC/MS analysis listed and described according to their retention time (RT, min), their compound name, and their mass to charge ratio (m/z) with the respective base peak written not in brackets; Table S10: Photos of paint samples taken at different times: before the aging, immediately after aging, 3, 6, 10, 20 and 45 days after the end of accelerated aging; Table S11: Microscopic images (100×, 200×, 300×, 500×) of paint samples taken at different times: immediately after aging, 10 and 45 days after the end of accelerated aging; Table S12: Integrated area values of samples analysed; Table S13: Normalized % in weight of the most abundant compounds of Acr_V sample detected; Table S14: Normalized % in weight of the most abundant compounds of Sty_V sample detected; Figure S1: IR spectrum of Oil_V (blue) and Oil_V_COMM (red) samples acquired before accelerating aging; Figure S2: Raman spectra of Oil_V (blue) and Oil_V_COMM (red) samples acquired before accelerating aging and obtained with a 785 nm laser. Only peaks related to the organic fraction are signed; Figure S3: IR spectrum of Alk_V sample acquired before accelerating aging; Figure S4: Total ion current (TIC) pyrogram obtained from Alk_V sample before accelerated aging; Figure S5: IR spectrum of Acr_V sample acquired before accelerating aging; Figure S6: Total ion current (TIC) pyrogram obtained from Acr_V sample before accelerated aging; Figure S7: IR spectrum of Sty_V sample acquired before accelerating aging; Figure S8: Total ion current (TIC) pyrogram obtained from Sty_V sample before accelerated aging; Figure S9: EDX spectra obtained on the crystals formed after accelerated aging. (A) CRY_1 spectrum (B) CRY_2 spectrum (C) CRY_3 spectrum; Figure S10: µ-Raman spectra acquired on the paint samples after the accelerated aging and obtained with a 785 nm laser. (a) Oil_V, (b) Sty_V; Figure S11: XRPD pattern of the surface crystals along with the (NH4)2(HSO4)(H2PO4) reference (ICSD#100795); Figure S12: Kubelka-Munk functions of the PV16 pigment (a) and the Sty_V sample (b) after accelerated aging.

Author Contributions

L.P., conceptualization, methodology, data curation, writing—original draft, and editing; G.C., literature research, investigation, validation, and writing—original draft; M.B., investigation and methodology; F.P., investigation and methodology; K.S., investigation and supervision; V.P., supervision and editing; F.C.I., supervision, review, editing, and funding. All authors have read and agreed to the published version of the manuscript.

Funding

This research received no external funding.

Institutional Review Board Statement

Not applicable.

Informed Consent Statement

Not applicable.

Data Availability Statement

Additional information concerning literature, data, and information concerning methodology and weathering parameters is available upon request.

Acknowledgments

We gratefully thank Elisabetta Zendri (Ca’ Foscari University of Venice) for the support and availability of using the laboratory areas for the realization of the model samples. Moreover, we would like to thank Margherita Gnemmi and Teodora Raicu for their support during the Py-GC/MS analysis and the semi-quantitative evaluations, and Federica Cappa for her support during the accelerated aging. Moreover, the authors acknowledge Tiziano Finotto for his support during the XRPD measurements.

Conflicts of Interest

The authors declare no conflicts of interest.

References

  1. Grzywacz, C.M. Monitoring for Gaseous Pollutants in Museum Environments; Getty Publications: Los Angeles, CA, USA, 2006. [Google Scholar]
  2. Motta, O.; Pironti, C.; Ricciardi, M.; Rostagno, C.; Bolzacchini, E.; Ferrero, L.; Cucciniello, R.; Proto, A. Leonardo da Vinci’s “Last Supper”: A case study to evaluate the influence of visitors on the Museum preservation systems. Environ. Sci. Pollut. Res. Int. 2022, 29, 29391–29398. [Google Scholar] [CrossRef]
  3. Franey, J.P.; Graedel, T.E. Corrosive Effects of Mixtures of Pollutants. J. Air Pollut. Control Assoc. 1985, 35, 644–648. [Google Scholar] [CrossRef]
  4. Kreislova, K.; Knotkova, D.; Geiplova, H. Atmospheric corrosion of historical industrial structures. Corros. Conserv. Cult. Herit. Met. Artefacts 2013, 65, 311–343. [Google Scholar] [CrossRef]
  5. European Environment Agency. Air Pollution Fact Sheet 2013; European Environment Agency: Copenhagen, Denmark, 2013.
  6. Pozo-Antonio, J.S.; Rivas, T.; Dionísio, A.; Barral, D.; Cardell, C. Effect of a SO2 Rich Atmosphere on Tempera Paint Mock-Ups. Part 1: Accelerated Aging of Smalt and Lapis Lazuli-Based Paints. Minerals 2020, 10, 427. [Google Scholar] [CrossRef]
  7. Yue, Y.; Cheng, J.; Lee, K.S.; Stocker, R.; He, X.; Yao, M.; Wang, J. Effects of relative humidity on heterogeneous reaction of SO2 with CaCO3 particles and formation of CaSO4·2H2O crystal as secondary aerosol. Atmos. Environ. 2022, 268, 118776. [Google Scholar] [CrossRef]
  8. Chianese, E.; Riccio, A.; Dura, I.; Trifuoggi, M.; Iovino, P.; Capasso, S.; Barone, G. Measurements for indoor air quality assessment at the Capodimonte Museum in Naples (Italy). Int. J. Environ. Res. 2012, 6, 509–518. [Google Scholar]
  9. Faulkner, E.B.; Hollenberg, J.C. Coloring the Cosmetic World: Using Pigments in Decorative Cosmetic Formulations, 2nd ed.; Wiley: Hoboken, NJ, USA, 2021. [Google Scholar]
  10. Rajadurai, R.S.; Lee, J.-H.; Choi, E.; Kang, J.-W. MnNH4P2O7-Based Coating for High Temperature Assessment on the Surfaces of Cement Composites. Coatings 2020, 10, 396. [Google Scholar] [CrossRef]
  11. Finlay, V. The Brilliant History of Color in Art, 1st ed.; J. Paul Getty Museum: Los Angeles, CA, USA, 2014. [Google Scholar]
  12. Kirby, J.; Stonor, K.; Roy, A.; Burnstock, A.; Grout, R.; White, R. Seurat’s Painting Practice: Theory, Development and Technology. In National Gallery Technical Bulletin; The National Gallery: London, UK, 2003; pp. 4–37. Available online: https://www.nationalgallery.org.uk/research/research-resources/technical-bulletin/seurats-painting-practice-theory-development-and-technology (accessed on 31 October 2024).
  13. Haddad, A.; Pastorelli, G.; Ortiz Miranda, A.S.; Ludvigsen, L.; Centeno, S.A.; Duvernois, I.; Hoover, C.; Duffy, M.; Aviram, A.; Zycherman, L. Exploring the private universe of Henri Matisse in The Red Studio. Herit. Sci. 2022, 10, 168. [Google Scholar] [CrossRef]
  14. Calza, C.; Pedreira, A.; Lopes, R.T. Analysis of paintings from the nineteenth century Brazilian painter Rodolfo Amoedo using EDXRF portable system. X-Ray Spectrom. 2009, 38, 327–332. [Google Scholar] [CrossRef]
  15. Roldán, C.; Ferrero, J.; Juanes, D.; Murcia, S.; Ripollés, V. Joaquin Sorolla’s pigment characterisation of the paintings “Vision of Spain” by means of EDXRF portable system. X-Ray Spectrom. 2011, 40, 289–296. [Google Scholar] [CrossRef]
  16. Anselmi, C.; Vagnini, M.; Cartechini, L.; Grazia, C.; Vivani, R.; Romani, A.; Rosi, F.; Sgamellotti, A.; Miliani, C. Molecular and structural characterization of some violet phosphate pigments for their non-invasive identification in modern paintings. Spectrochim. Acta Part A Mol. Biomol. Spectrosc. 2017, 173, 439–444. [Google Scholar] [CrossRef]
  17. Sirois, P.J.; Stewart, C.; Helwig, K.; Moffatt, E.; Legate, K.M. A Technical Study of the Materials and Methods Used by David B. Milne in his Oil Paintings. J. Can. Assoc. Conserv. 2007, 32, 17–33. [Google Scholar]
  18. Rosi, F.; Grazia, C.; Fontana, R.; Gabrieli, F.; Pensabene Buemi, L.; Pampaloni, E.; Romani, A.; Stringari, C.; Miliani, C. Disclosing Jackson Pollock’s palette in Alchemy (1947) by non-invasive spectroscopies. Herit. Sci. 2016, 4, 18. [Google Scholar] [CrossRef]
  19. Defeyt, C.; Mazurek, J.; Zebala, A.; Burchett-Lere, D. Insight into Sam Francis’ painting techniques through the analytical study of twenty-eight artworks made between 1946 and 1992. Appl. Phys. A Mater. Sci. Process. 2016, 122, 991. [Google Scholar] [CrossRef]
  20. Sabatini, F. Ageing and Fading of Organic Pigments in Art: A Multi-Analytical Study Based on Mass Spectrometric Techniques. Ph.D. Thesis, University of Pisa, Pisa, Italy, 2018. [Google Scholar]
  21. La Nasa, J.; Doherty, B.; Rosi, F.; Braccini, C.; Broers, F.T.H.; Degano, I.; Matinero, J.M.; Miliani, C.; Modugno, F.; Sabatini, F.; et al. An integrated analytical study of crayons from the original art materials collection of the MUNCH museum in Oslo. Sci. Rep. 2021, 11, 7152. [Google Scholar] [CrossRef]
  22. Pagnin, L.; Calvini, R.; Wiesinger, R.; Schreiner, M. SO2 and NOx initiated atmospheric degradation of polymeric films: Morphological and chemical changes, influence of relative humidity and inorganic pigments. Microchem. J. 2021, 164, 106087. [Google Scholar] [CrossRef]
  23. Pagnin, L.; Wiesinger, R.; Koyun, A.N.; Schreiner, M. The effect of pollutant gases on surfactant migration in acrylic emulsion films: A comparative study and preliminary evaluation of surface cleaning. Polymers 2021, 13, 1941. [Google Scholar] [CrossRef]
  24. Pagnin, L.; Calvini, R.; Sterflinger, K.; Izzo, F.C. Data Fusion Approach to Simultaneously Evaluate the Degradation Process Caused by Ozone and Humidity on Modern Paint Materials. Polymers 2022, 14, 1787. [Google Scholar] [CrossRef] [PubMed]
  25. Pagnin, L.; Zendri, E.; Izzo, F.C. How Can Ozone and Relative Humidity Affect Artists’ Alkyd Paints? A FT-IR and Py-GC/MS Systematic Study. Polymers 2022, 14, 1831. [Google Scholar] [CrossRef]
  26. Aegerter, M.A.; Mennig, M. (Eds.) Sol-Gel Technologies for Glass Producers and Users; Springer: Boston, MA, USA, 2004. [Google Scholar] [CrossRef]
  27. Camuffo, D.; Brimblecombe, P.; Van Grieken, R.; Busse, H.-J.; Sturaro, G.; Valentino, A.; Bernardi, A.; Blades, N.; Shooter, D.; De Bock, L.; et al. Indoor air quality at the Correr Museum, Venice, Italy. Sci. Total Environ. 1999, 236, 135–152. [Google Scholar] [CrossRef]
  28. Krupińska, B.; Van Grieken, R.; De Wael, K. Air quality monitoring in a museum for preventive conservation: Results of a three-year study in the Plantin-Moretus Museum in Antwerp, Belgium. Microchem. J. 2013, 110, 350–360. [Google Scholar] [CrossRef]
  29. Izzo, F.C.; Ferriani, B.; den Berg, K.J.V.; Van Keulen, H.; Zendri, E. 20th century artists’ oil paints: The case of the Olii by Lucio Fontana. J. Cult. Herit. 2014, 15, 557–563. [Google Scholar] [CrossRef]
  30. Pintus, V.; Baragona, A.J.; Cappa, F.; Haiml, C.; Hierl, C.; Sterflinger, K.; Schreiner, M. Multi-Analytical Investigations of Andy Warhol’s “Orange Car Crash”: Polymeric Materials in Modern Paints. Polymers 2022, 14, 633. [Google Scholar] [CrossRef]
  31. Nguyen, D.K.; Bach, Q.-V.; Lee, J.-H.; Kim, I.-T. Synthesis and Irreversible Thermochromic Sensor Applications of Manganese Violet. Materials 2018, 11, 1693. [Google Scholar] [CrossRef] [PubMed]
  32. Brouzi, K.; Ennaciri, A.; Harcharras, M.; Capitelli, F. Structure and vibrational spectra of a new trihydrate diphosphate, MnNH4NaP2O7·3H2O. J. Raman Spectrosc. 2004, 35, 41–46. [Google Scholar] [CrossRef]
  33. Bih, H.; Saadoune, I.; Bih, L.; Mansori, M.; ToufiK, H.; Fuess, H.; Ehrenberg, H. Synthesis, Rietveld refinements, Infrared and Raman spectroscopy studies of the sodium diphosphate NaCryFe1−yP2O7 (0 ≤ y ≤ 1). J. Mol. Struct. 2016, 1103, 103–109. [Google Scholar] [CrossRef]
  34. Narayanan, P.S. Raman spectrum of ammonium di-hydrogen phosphate. Proc. Indian Acad. Sci. (Math. Sci.) 1948, 28, 469. [Google Scholar] [CrossRef]
  35. Chapman, A.C.; Thirlwell, L.E. Spectra of phosphorus compounds-The infra-red spectra of orthophosphates. Spectrochim. Acta 1964, 20, 937–947. [Google Scholar] [CrossRef]
  36. Derrick, M.R.; Landry, J.M.; Stulik, D.C. Infrared Spectroscopy in Conservation Science; The Getty Conservation Institute: Los Angeles, CA, USA, 1999. [Google Scholar]
  37. Tironi, A.; Trezza, M.; Irassar, E.; Scian, A.N. Thermal Treatment of Kaolin: Effect on the Pozzolanic Activity. Procedia Mater. Sci. 2012, 1, 343–350. [Google Scholar] [CrossRef]
  38. Johnston, C.; Sposito, G.; Birge, R. Raman Spectroscopic Study of Kaolinite in Aqueous Suspension. Clays Clay Miner. 1985, 33, 483–489. [Google Scholar] [CrossRef]
  39. Begum, Y.; Wright, A.J. Relating highly distorted Jahn–Teller MnO6 to colouration in manganese violet pigments. J. Mater. Chem. 2012, 22, 21110–21116. [Google Scholar] [CrossRef]
  40. Nicholas Walsh, V.C. Pigment Compendium: A Dictionary and Optical Microscopy of Historical Pigments; Taylor & Francis Ltd.: Oxfordshire, UK, 2008. [Google Scholar]
  41. Wicks, Z.W., Jr. Alkyd Resins. In Encyclopedia of Polymer Science and Technology; John Wiley & Sons Ltd.: Hoboken, NJ, USA, 2007. [Google Scholar] [CrossRef]
  42. Learner, T. A review of synthetic binding media in twentieth-century paints. Conservator 2000, 24, 96–103. [Google Scholar] [CrossRef]
  43. Nakayama, Y. Polymer blend systems for water-borne paints. Prog. Org. Coat. 1998, 33, 108–116. [Google Scholar] [CrossRef]
  44. Androver Gracia, I. Applicazioni Della Spettrofotometria IR allo Studio dei Beni Culturali; Il Prato: Saonara, Italy, 2001. [Google Scholar]
  45. Silverstein, R.M.; Kiemle, D.J.; Webster, F.X.; Bryce, D.L.; Zanardi, F. Identificazione Spettrometrica di Composti Organici, 3rd ed.; CEA: Rozzano, Italy, 2016. [Google Scholar]
  46. Burgio, L.; Clark, R.J.H. Library of FT-Raman spectra of pigments, minerals, pigment media and varnishes, and supplement to existing library of Raman spectra of pigments with visible excitation. Spectrochim. Acta Part A Mol. Biomol. Spectrosc. 2001, 57, 1491–1521. [Google Scholar] [CrossRef]
  47. Carlesi, S.; Becucci, M.; Ricci, M. Vibrational Spectroscopies and Chemometry for Nondestructive Identification and Differentiation of Painting Binders. J. Chem. 2017, 2017, 3475659. [Google Scholar] [CrossRef]
  48. Izzo, F.C. 20th Century Artists’ Oil Paints: A Chemical-Physical Survey. Ph.D. Thesis, Università Ca’ Foscari Venezia, Venezia, Italy, 2010. Available online: http://dspace.unive.it/handle/10579/1100 (accessed on 31 October 2024).
  49. Colombini, M.P.; Modugno, F. Organic Mass Spectrometry in Art and Archaeology; Wiley: Chichester, UK, 2009. [Google Scholar]
  50. Tammekivi, E.; Vahur, S.; Vilbaste, M.; Leito, I. Quantitative GC-MS Analysis of Artificially Aged Paints with Variable Pigment and Linseed Oil Ratios. Molecules 2021, 26, 2218. [Google Scholar] [CrossRef]
  51. Wiesinger, R.; Pagnin, L.; Anghelone, M.; Moretto, L.M.; Orsega, E.F.; Schreiner, M. Pigment and Binder Concentrations in Modern Paint Samples Determined by IR and Raman Spectroscopy. Angew. Chem. 2018, 57, 7401–7407. [Google Scholar] [CrossRef]
  52. Learner, T.J.S. Analysis of Modern Paints; The Getty Conservation Institute: Los Angeles, CA, USA, 2004. [Google Scholar]
  53. Ormsby, B.; Learner, T.; Schilling, M.; Druzik, J.; Khanjian, H.; Carson, D.; Foster, G.; Sloan, M. The Effects of Surface Cleaning on Acrylic Emulsion Paintings: A Preliminary Investigation. Tate Pap. 2012, 6, 1–4. Available online: https://www.tate.org.uk/research/tate-papers/06/effects-of-surface-cleaning-on-acrylic-emulsion-painting-preliminary-investigation (accessed on 31 October 2024).
  54. Melchiorre Di Crescenzo, M.; Zendri, E.; Miliani, C.; Rosi, F. A preliminary FTIR-based exploration of the surfactant phase-separation process in contemporary mural paintings. E-Preserv. Sci. 2013, 10, 10–18. [Google Scholar]
  55. Sridevi, N.A.; Karuppasamy, K.; Balakumar, S.; Shajan, S. Structural and Ionic Conductivity Studies on Nanochitosan Incorporated Polymer Electrolytes for Rechargeable Magnesium Batteries. Chem. Sci. Trans. 2012, 1, 311–316. [Google Scholar] [CrossRef]
  56. de Oliveira, A.G.G.; Wiercigroch, E.; Gomes, J. de A.; Malek, K. Infrared and Raman spectroscopy of automotive paints for forensic identification of natural weathering. Analalytical Methods 2018, 10, 1203–1212. [Google Scholar] [CrossRef]
  57. Bauer, P.; Buettner, A. Characterization of Odorous and Potentially Harmful Substances in Artists’ Acrylic Paint. Front. Public Health 2018, 6, 350. [Google Scholar] [CrossRef] [PubMed]
  58. Fardi, T.; Pintus, V.; Kampasakali, E.; Pavlidou, E.; Schreiner, M.; Kyriacou, G. Analytical characterization of artist’s paint systems based on emulsion polymers and synthetic organic pigments. J. Anal. Appl. Pyrolysis 2018, 135, 231–241. [Google Scholar] [CrossRef]
  59. Abd El-Wahab, H.; Saleh, T.; Zayed, E.; El-Sayed, A.; Assaker, R. Synthesis and evaluation of new anti-microbial additive based on pyrazole and triazole derivative incorporated physically into polyurethane varnish. Egypt. J. Chem. 2014, 57, 27–43. [Google Scholar]
  60. Flamm, D.L.; Bacon, D.D.; Kinsbron, E.; English, A.T. Chemical Reaction of Sulfur Dioxide at High Humidity and Temperature: Implications for Accelerated Testing. J. Electrochem. Soc. 1981, 128, 679. [Google Scholar] [CrossRef]
  61. Moustafa, Y.M.; El-Egili, K. Infrared spectra of sodium phosphate glasses. J. Non-Cryst. Solids 1998, 240, 144–153. [Google Scholar] [CrossRef]
  62. Frost, R.L.; Scholz, R.; López, A.; Xi, Y.; Lana, C. Vibrational spectroscopy of the sulphate mineral sturmanite from Kuruman manganese deposits, South Africa. Spectrochim. Acta Part A Mol. Biomol. Spectrosc. 2014, 133, 24–30. [Google Scholar] [CrossRef]
  63. Mabrouk, K.B.; Kauffmann, T.H.; Aroui, H.; Fontana, M.D. Raman study of cation effect on sulfate vibration modes in solid state and in aqueous solutions. J. Raman Spectrosc. 2013, 44, 1603–1608. [Google Scholar] [CrossRef]
  64. Sekar, G.; Ramakrishnan, V.; Aruldhas, G. IR and polarized Raman spectra of (NH4)2M(SO4)2 · 6H2O(M =Zn, Mn). J. Solid State Chem. 1988, 74, 424–427. [Google Scholar] [CrossRef]
  65. Jeong, D.I.; Kim, S.; Koo, J.S.; Lee, S.Y.; Kim, M.; Kim, K.Y.; Azad, M.O.K.; Karmakar, M.; Chu, S.; Chae, B.-J.; et al. Manganese Sulfate Nanocomposites Fabricated by Hot-Melt Extrusion for Chemodynamic Therapy of Colorectal Cancer. Pharmaceutics 2023, 15, 1831. [Google Scholar] [CrossRef]
  66. Qiu, G.; Gao, Z.; Yin, H.; Feng, X.; Tan, W.; Liu, F. Synthesis of MnPO4·H2O by refluxing process at atmospheric pressure. Solid State Sci. 2010, 12, 808–813. [Google Scholar] [CrossRef]
  67. Frost, R.L.; López, A.; Scholz, R.; Wang, L. A Raman and infrared spectroscopic study of the sulphate mineral aluminite Al2(SO4)(OH)4·7H2O. Spectrochim Acta A Mol. Biomol. Spectrosc. 2015, 148, 232–236. [Google Scholar] [CrossRef]
  68. Rao, B.L. Raman spectra of some crystalline nitrates and sulphates. Proc. Indian Acad. Sci. (Math. Sci.) 1941, 14, 48–55. [Google Scholar] [CrossRef]
  69. Socrates, G. Infrared and Raman Characteristic Group Frequencies: Tables and Charts, 3rd ed.; J. Wiley and Sons: Chichester, UK, 2001. [Google Scholar]
  70. Wolfram, R.; Gert, I. Raman Spectroscopic Investigation of Speciation in MnSO4(aq). J. Solut. Cgemistry 2014, 43, 465–485. [Google Scholar] [CrossRef]
  71. Kück, S.; Hartung, S.; Hurling, S.; Petermann, K.; Huber, G. Emission of octahedrally coordinated Mn3+ in garnets. Spectrochim. Acta Part A Mol. Biomol. Spectrosc. 1998, 54, 1741–1749. [Google Scholar] [CrossRef]
  72. McClure, D.S. Optical Spectra of Transition-Metal Ions in Corundum. J. Chem. Phys. 1962, 36, 2757–2779. [Google Scholar] [CrossRef]
  73. Kück, S.; Hartung, S.; Hurling, S.; Petermann, K.; Huber, G. Optical transitions in Mn3+ -doped garnets. Phys. Rev. B 1998, 57, 2203–2216. [Google Scholar] [CrossRef]
  74. Zhang, X.-M.; Hao, Z.-M.; Ng, S.W. Langbeinite-type (NH4)2Mn2(SO4)3. Acta Cryst E 2005, 61, i82–i83. [Google Scholar] [CrossRef]
  75. de Viguerie, L.; Payard, P.A.; Portero, E.; Walter, P.; Cotte, M. The drying of linseed oil investigated by Fourier transform infrared spectroscopy: Historical recipes and influence of lead compounds. Prog. Org. Coat. 2016, 93, 46–60. [Google Scholar] [CrossRef]
  76. Duce, C.; Della Porta, V.; Tiné, M.R.; Spepi, A.; Ghezzi, L.; Colombini, M.P.; Bramanti, E. FTIR study of ageing of fast drying oil colour (FDOC) alkyd paint replicas. Spectrochim Acta A Mol Biomol Spectrosc 2014, 130, 214–221. [Google Scholar] [CrossRef]
  77. Izzo, F.C.; Kratter, M.; Nevin, A.; Zendri, E. A Critical Review on the Analysis of Metal Soaps in Oil Paintings. ChemistryOpen 2021, 10, 904–921. [Google Scholar] [CrossRef]
  78. Simendinger, W.H.; Balik, C.M. Chemical reaction kinetics of sulfur dioxide and oxygen with unsaturated drying oils. J. Coat. Technol. 1994, 66, 39–45. [Google Scholar]
  79. Pizzimenti, S.; Bernazzani, L.; Tinè, M.R.; Treil, V.; Duce, C.; Bonaduce, I. Oxidation and Cross-Linking in the Curing of Air-Drying Artists’ Oil Paints. ACS Appl. Polym. Mater. 2021, 3, 1912–1922. [Google Scholar] [CrossRef]
  80. Lazzari, M.; Chiantore, O. Drying and oxidative degradation of linseed oil. Polym. Degrad. Stab. 1999, 65, 303–313. [Google Scholar] [CrossRef]
  81. La Nasa, J.; Degano, I.; Modugno, F.; Colombini, M.P. Effects of acetic acid vapour on the ageing of alkyd paint layers: Multi-analytical approach for the evaluation of the degradation processes. Polym. Degrad. Stab. 2014, 105, 257–264. [Google Scholar] [CrossRef]
  82. Perrin, F.X.; Irigoyen, M.; Aragon, E.; Vernet, J.L. Evaluation of accelerated weathering tests for three paint systems: A comparative study of their aging behaviour. Polym. Degrad. Stab. 2001, 72, 115–124. [Google Scholar] [CrossRef]
  83. Pintus, V.; Wei, S.; Schreiner, M. Accelerated UV ageing studies of acrylic, alkyd, and polyvinyl acetate paints: Influence of inorganic pigments. Microchem. J. 2016, 124, 949–961. [Google Scholar] [CrossRef]
  84. Francisco-Vieira, L.; Benavides, R.; Da Silva, L.; Cuara-Diaz, E.; Morales-Acosta, D. Effect of sulfonating agent in the properties of styrene copolymers for PEMFC membranes. Int. J. Hydrogen Energy 2022, 47, 30303–30314. [Google Scholar] [CrossRef]
  85. Melo, L.; Benavides, R.; Martínez, G.; Da Silva, L.; Paula, M.M.S. Degradation reactions during sulphonation of poly(styrene-co-acrylic acid) used as membranes. Polym. Degrad. Stab. 2014, 109, 343–352. [Google Scholar] [CrossRef]
  86. Papliaka, Z.E.; Andrikopoulos, K.S.; Varella, E.A. Study of the stability of a series of synthetic colorants applied with styrene-acrylic copolymer, widely used in contemporary paintings, concerning the effects of accelerated ageing. J. Cult. Herit. 2010, 11, 381–391. [Google Scholar] [CrossRef]
Figure 2. Microscopic images of the paint samples before aging: (a) oil, (b) commercial oil, (c) alkyd, (d) acrylic, and (e) styrene–acrylic sample.
Applsci 15 04630 g002
Figure 3. SEM images (300×) of the paint samples before aging: (a) oil sample, (b) commercial oil sample, (c) alkyd sample, (d) acrylic sample, and (e) acrylic–styrene sample.
Applsci 15 04630 g003
Figure 4. Total Ion Current (TIC) pyrograms obtained from Oil_V (black) and Oil_V_COMM (light blue) samples before accelerated aging.
Applsci 15 04630 g004
Figure 5. μ-Raman spectra acquired before accelerating aging and obtained with a 785 nm laser. The green circles indicate the peaks corresponding to the binder. (a) Alk_V sample, (b) Acr_V (red), and Sty_V (blue) samples.
Applsci 15 04630 g005
Figure 6. (a) Photo of a paint sample taken after 45 days from the end of the accelerated aging. (b) Micrograph of a painting portion acquired after 45 days from the end of the accelerated aging. (ce) SEM-BSD images of different types of euhedral crystals appeared after accelerated aging. (c) CRY_1, (d) CRY_2, and (e) CRY_3.
Applsci 15 04630 g006
Figure 7. IR spectra of (a) Oil_V, (b) Oil_V_COMM, (c) Alk_V, (d) Acr_V, and (e) Sty_V samples. In black, the spectrum of the unaged sample; in green, the spectrum of the aged sample collected on the violet part; and in red, the spectrum of the aged sample collected on the grey part.
Applsci 15 04630 g007
Figure 8. µ-Raman spectra acquired on the paint samples after the accelerated aging and obtained with a 785 nm laser: (a) Oil_V_COMM, (b) Alk_V, and (c) Acr_V.
Applsci 15 04630 g008
Figure 9. XRPD pattern of aged styrene–acrylic-based sample and the assignments. The red asterisks represent the unassigned diffraction peaks.
Applsci 15 04630 g009
Table 1. Summary of materials employed and samples prepared for the study.
PigmentChemical CompositionColour Index (C.I.) Number
Manganese violetNH4MnP2O7PV16
BindersChemical compositionCommercial name
OilLinseed stand oilLeinöl Stand oil 450 P (Kremer Pigmente, Germany)
Alkyd resinOil-modified polyester-resinAlkyd Medium 4 (Lukas, Germany)
Acrylic emulsionp(nBA/MMA)Plextol® D498 (Kremer Pigmente, Germany)
Styrene–acrylic emulsionStyrene acrylate copolymerAcronal® S790 (BASF, Germany)
Samples
abbreviations
Composition
Oil_VPV16 + stand oil
Oil_V_COMMCommercial oil paint tube
Alk_VPV16 + alkyd resin
Acr_VPV16 + acrylic emulsion
Sty_VPV16 + styrene–acrylic emulsion
Table 2. Average weight percentages, calculated with ZAF matrix correction, of the main elements in the crystals detected with SEM-EDX.
CRY_1CRY_2CRY_3
Mn17.65% ± 0.41.04% ± 0.122.73% ± 0.8
S15.73% ± 0.212.63% ± 0.22.01% ± 0.1
P2.01% ± 0.114.48% ± 0.216.52% ± 0.3
N8.37% ± 0.311.65% ± 0.5-
O49.69 ± 0.441.22 ± 0.545.12 ± 0.7
Table 3. Calculated molar ratio for unaged and aged Oil_V, Oil_V_COMM, and Alk_V samples. For the Alk_V sample, the normalized % in weight of the other principal constituents was reported (pentaerythritol, phthalic acid, and benzoic acid).
Sample P/SA/PA/SubO/SD/P%DPE%PhA%BA%
Oil_VUNAGED0.900.653.081.240.9720.90-
AGED1.050.244.270.990.319.59
Oil_V_COMMUNAGED1.960.559.291.160.6322.75-
AGED2.121.136.440.641.3442.30
Alk_VUNAGED1.480.487.172.430.5814.3312.0116.4412.05
AGED2.340.226.821.920.2510.071.9029.4214.62
Disclaimer/Publisher’s Note: The statements, opinions and data contained in all publications are solely those of the individual author(s) and contributor(s) and not of MDPI and/or the editor(s). MDPI and/or the editor(s) disclaim responsibility for any injury to people or property resulting from any ideas, methods, instructions or products referred to in the content.

