Article

Impact of the Spatiotemporal Relationship Between Blast Source and Protected Area on Wave Arrival Sequence and Vibration Control Methods in Bench Blasting

School of Resources and Safety Engineering, University of Science and Technology Beijing, Beijing 100083, China
*
Author to whom correspondence should be addressed.
Appl. Sci. 2025, 15(9), 4641; https://doi.org/10.3390/app15094641
Submission received: 12 March 2025 / Revised: 19 April 2025 / Accepted: 20 April 2025 / Published: 23 April 2025

Abstract

:
The adjustment of delay time in open-pit bench blasting is a research hotspot in vibration control. Its core lies in utilizing the periodic characteristics of vibration waves to achieve the superposition and cancellation of wave peaks and troughs. However, due to the spatiotemporal variability in the propagation of blast-induced vibration waves, the optimal delay time determined for vibration control requirements at a specific protected area (monitoring point) makes it difficult to achieve the misalignment superposition effect simultaneously at multiple monitoring points. To address the challenge of multi-area vibration control in open-pit bench blasting, this paper proposes an adjustment method based on local delay adjustment. First, a spatiotemporal relationship model between blast holes with monitoring points is established to calculate vibration wave arrival times. This enables rapid hole identification during dense wave arrivals at monitoring points, with waveform separation achieved through initiation delay adjustments. Following the Anderson principle, reconstructed single-hole vibrations are superimposed according to the wave arrival sequence to validate control efficacy. Statistical analysis of concurrent wave arrivals across all-direction monitoring points identifies high-probability vibration hazard locations. Targeted delay adjustments for blast holes within clustering arrival periods at these locations enable comprehensive vibration reduction. Field data confirm that single-point control reduces peak vibration by >10.55% through simultaneously reducing the amount of waves in clustering arrival periods. Multi-point control resolves seven hazard locations across two directions, attaining 88.57% hazard elimination efficiency and 14.05% peak velocity attenuation. This method achieves vibration control through local delay adjustments while maintaining the fragmentation effect of the original scheme, providing a new approach to solving the challenge of vibration control in large-scale blasting areas.

1. Introduction

Bench blasting is widely utilized in open-pit mining due to its high production efficiency and low operational costs [1,2,3]. However, large-scale blasting operations, which employ substantial amounts of explosives to dislodge ore and rock masses, often induce intense blast vibrations. This persistent issue of vibration control has long been a challenging problem for researchers [4,5,6]. Especially after a certain distance, Rayleigh waves become the main component of the vibration wave and are thus focused on control [7]. To mitigate the adverse effects of blast vibrations on mine slopes and surrounding structures, various methods have been implemented in bench blasting vibration control [8,9,10,11]. Among these methods, adjusting the initiation sequence of blast holes has garnered significant attention, as it achieves vibration control without altering other blasting parameters [12,13,14].
To achieve blast vibration control through the adjustment of initiation delays, it is essential to first establish a correlation between the initiation sequence and blast-induced vibrations, enabling the accurate prediction of blast vibrations [15,16]. Subsequently, various delay schemes are formulated, and the predicted vibration velocities under different delay conditions are computed. Finally, through comparative analysis of the predicted vibration velocities, the optimal delay time that meets the vibration control requirements is selected [17,18,19].
However, in large-scale bench blasting, significant variations in blast-induced vibrations are observed at different monitoring points under the same initiation sequence [5,20]. This discrepancy arises from two primary factors: firstly, the attenuation of blast vibration waves varies as they propagate to different monitoring points [21]. Secondly, the propagation times of vibration waves generated by individual blast holes to the same monitoring point differ, resulting in a superposition of waves that does not strictly follow the initiation sequence [22,23]. In other words, due to the large scale of the blasting area and the consequent large spacing between blast holes, the holes cannot be treated as a single point vibration source. Instead, the vibration waves generated by each hole propagate from different locations within the blasting area over varying distances to the same monitoring point, leading to differing propagation times. Particularly when multiple monitoring points are considered, the actual superposition times of the vibration waves from each hole dynamically vary accordingly.
To investigate the distribution of blast-induced vibrations in different directions, Garai et al. [24] monitored vibrations in four directions around the blasting area and plotted contour maps of peak particle velocity (PPV) values using multiple monitoring datasets. They controlled ground vibrations by altering the initiation positions and sequences. However, Chrzan [24] has argued that vibration control based solely on data from four monitoring points lacks sufficient data support, and proposed the idea of uniformly distributing a large number of monitoring points across the blasting area. To date, there has been no reported literature on all-around vibration data collection and research around the blasting area via the deployment of a large number of monitoring points in complex blasting sites. Although researchers have extensively discussed the installation methods of vibration monitors [25,26,27], they have not specified methods for determining the optimal installation locations. Typically, monitoring points are set at locations requiring protection, and the adjusted delay time for vibration control at these points is considered the optimal solution for all-around vibration control around the blasting area [28,29]. For instance, Ongen et al. [30] installed vibration monitors at residential buildings and analyzed vibration data from 39 blasts in a quarry, providing data support for vibration control. Shi et al. [31] placed vibration monitoring points on mine slopes and established a vibration attenuation model based on the relationship between peak vibration velocity and scaled distance, thereby determining the delay time that meets slope stability requirements. Rezaeineshat et al. [32] precisely measured and collected data from 112 blasts to protect nearby residences and other structures in a limestone mine, constructing an artificial neural network (ANN) model to predict PPV and identify the optimal delay time. Li et al. [33] proposed a blast vibration spectrum control scheme suitable for high-bench slope excavation in hydropower projects, achieving vibration prediction and delay optimization based on single-hole vibration data monitored at different height positions.
In summary, the aforementioned methods can achieve effective blast vibration control at specific locations. In essence, controlling multi-hole blast vibrations by adjusting delay times relies on the periodicity of vibration waves, utilizing the principle of superimposing wave peaks and troughs to achieve cancellation [34,35]. However, two critical problems remain unresolved in bench blasting vibration control based on this principle. Firstly, variations in initiation times cause changes in the arrival times of vibration waves from each blast hole to the same monitoring point, and the arrival times of these waves at different monitoring points also vary. These factors significantly impact the superposition and cancellation effects of wave peaks and troughs, thereby affecting vibration reduction. Secondly, the delay times obtained through the misalignment superposition technique for vibration reduction can only achieve vibration control at a single monitoring point. Under this premise, as the initiation times are predetermined, monitoring points at other locations around the blasting area cannot further reduce vibrations using the misalignment superposition technique. Consequently, vibration monitoring at a single point is insufficient to meet the requirements of comprehensive vibration control, potentially leading to misinterpretation of the vibration control situation by technicians and resulting in inadequate corrective measures. On the basis of meeting the vibration control requirements of a single monitoring point, there is an urgent need for a vibration control method that can take into account the positions of multiple monitoring points.
To solve the above problems, this paper is conducted under the premise of a predefined initiation sequence, which can be determined using vibration wave misalignment superposition techniques or other established methods. Building upon this foundation, localized adjustments are made to vibration waves arriving at monitoring points within the same time window. By systematically shifting the initiation times of subsequent blast holes, this approach achieves vibration reduction while effectively preserving the fragmentation performance of the original delay scheme. Specifically, a computational method is established to determine the arrival times of vibration waves from each hole to the monitoring points based on the spatiotemporal relationship between blast holes and monitoring points. This enables the identification of the number of vibration waves arriving at the monitoring points within the same time window and the corresponding hole indices. The vibration waves in the same time window with excessive concurrent arrivals (clustering arrival period) are adjusted by modifying the initiation delays of the relevant holes. Subsequently, the reconstructed single-hole vibration curves are superimposed according to the revised arrival sequence to obtain the predicted vibration curve for multi-hole blasting. Furthermore, to investigate vibration control across different spatial locations, a dense array of monitoring points is deployed around the blasting area, and the arrival times of vibration waves from all blast holes to each monitoring point are exhaustively calculated. The maximum number of concurrent vibration wave arrivals at each monitoring point and their corresponding locations are statistically analyzed. Finally, the initiation times of blast holes corresponding to the clustering arrival periods at high-probability vibration risk locations are adjusted to achieve comprehensive vibration control across all directions.

2. Vibration Control Methods

The vibration curve obtained from multi-hole blasting monitoring is the superposition of single-hole vibration waves generated by each blast hole, based on their respective arrival times at the monitoring point. This section first introduces the computational principles for wave arrival times, followed by an analysis of how variations in the spatial positions of monitoring points and blast holes influence the arrival sequence. Subsequently, a method is established to identify time windows with a high number of concurrent wave arrivals (referred to as clustering arrival periods) and their corresponding holes at a single monitoring point. A strategy is proposed to adjust the delay time for vibration control by reducing the number of concurrent wave arrivals during these clustering periods. A dense array of monitoring points is deployed around the blasting area to identify the maximum number of concurrent wave arrivals during clustering periods at each location, thereby pinpointing high-probability vibration hazard locations. These locations are systematically addressed to eliminate potential hazards. Finally, the reconstructed single-hole vibration curves are superimposed using Anderson’s principle to generate predicted vibration curves, enabling the evaluation of vibration reduction effectiveness.

2.1. Principle for Calculating the Vibration Wave Arrival Time at the Monitoring Point (Wave Arrival Time)

In bench blasting operations, each blast hole is initiated according to a predefined delay scheme, which determines the actual initiation time t1. The vibration waves generated after blasting require a specific time t2 to propagate to the monitoring point. The initiation time t1 is determined by the inter-hole delay ΔtH and the inter-row delay ΔtR, while the propagation time t2 depends on the propagation distance R and the average propagation velocity c. Consequently, the wave arrival time at the monitoring point is calculated using Equation (1). Blast holes are typically charged with columnar explosives, with charge lengths generally within 10 m, whereas the distance from the blast hole to the monitoring point often exceeds 150 m. The duration of the single-hole vibration wave actually includes the blast vibrations produced by the explosive from initiation to the end of the blast. Therefore, a single blast hole can be treated as a point source, and the propagation time of the detonation wave within the explosive column can be neglected.
t = t 1 + t 2 = f Δ t H , Δ t R + g R , c
where t represents the arrival time of the vibration wave; t1 is the detonation time; t2 is the wave propagation time; ΔtH is the inter-hole delay time; ΔtR is the row-to-row delay time; R is the propagation distance; and c is the average propagation velocity.
The inter-hole delay time ΔtH and row-to-row delay time ΔtR are determined based on site-specific conditions such as the type of rock mass and the development of joint and fissure systems. By considering the position H(i) of each hole, the designed detonation sequence t1(i) can be determined. The propagation distance R of the vibration wave is defined as the distance between the blast hole H(i) and the monitoring point M, which corresponds to the magnitude of the displacement vector HM connecting these two points. The propagation velocity c is calculated as the ratio of the propagation distance R to the propagation time tT. In practice, a field test method can be employed, in which a single blast source and two monitoring points are used. By calculating the ratio of the difference in propagation distance ΔR to the difference in propagation time ΔtT, the average propagation velocity c can be obtained. The average propagation velocity c of vibration waves can be obtained in the same method for different geological conditions. Therefore, Equation (1) can be rewritten in the form of Equation (2).
t i = t 1 i + H ( i ) M / Δ R / Δ t T
where t(i) represents the time at which the vibration wave from the i-th hole reaches the monitoring point; t1(i) is the detonation time of the i-th hole; H(i) denotes the positional coordinates of the i-th hole; M is the positional coordinates of the monitoring point; ||H(i)M|| represents the distance between the i-th hole and monitoring point M; ΔR is the difference in propagation distance; and ΔtT is the difference in propagation time.

2.2. Problems That Can Be Solved by Analyzing to Wave Arrival Time Sequence and Their Positive Implications

In open pit mine-blasting operations, vibration levels exceeding safety thresholds may induce vibration hazards. Specifically: (1) slope rock masses may experience progressive displacement accumulation, increasing risks of slippage or localized collapse; (2) surrounding structures may sustain structural impacts including micro-crack initiation and reduced fatigue life of components. These vibration hazards exhibit positive correlation with vibration intensity, necessitating the implementation of scientific monitoring and control measures for effective mitigation.
Based on the above principle, the time series of vibration waves (generated by different blast holes) arriving at the same monitoring point can be calculated under the precise detonation conditions of electronic detonators. By analyzing and comparing this sequence, the blasting delay parameters can be adjusted. Specifically, the half-period interference vibration reduction technique is employed to separate overlapping vibration waves through localized delay adjustments, thereby reducing the number of waves arriving simultaneously at the monitoring point and achieving vibration mitigation. Furthermore, such delay time adjustments address two critical challenges in open pit bench-blasting vibration control.
Problem 1: Vibration hazard caused by simultaneous arrival waves from multiple blast-holes at the same monitoring points.
Due to the spatial distribution of blast holes, the propagation distances and times of vibration waves through the medium vary, which may result in vibration waves from two or more blast holes initiated at different times arriving simultaneously at the same monitoring point. It is noteworthy that single-hole vibration curves arriving simultaneously at a monitoring point may exhibit phase differences, leading to partial cancellation of wave peaks and troughs upon arrival. However, given the complexity of blasting sites, it is impractical to monitor the vibration curves of each hole at every location. Therefore, it is assumed that variations in blast-induced vibrations are caused by differences in charge, distance, site factors, and other parameters. The measured single-hole vibration curve is used as a baseline to reconstruct the single-hole vibration curves at the monitoring point for holes at different locations. Under this premise, when a large number of vibration waves arrive at the monitoring point within the same time window, the superposition of wave peaks is likely to occur, leading to potential vibration hazard.
The monitoring duration is divided into several continuous time intervals of fixed length. The number of arrival waves within each time interval is then counted based on Equation (3). Figure 1 illustrates the vibration waves arriving at the monitoring point within the same time window, where T represents the vibration wave period. Time segments with a high number of concurrent wave arrivals are defined as clustering arrival periods. When the number of wave arrivals within such a period is significant, the probability of increased vibration amplitude becomes higher, and the monitoring point is identified as a high-probability vibration hazard location.
t k = k 1 Δ t A m , k = t ( i ) t k t ( i ) < t k + Δ t n m , k = n ( A m , k ) n m = max n m , k
where Δt represents the length of the time interval; tk is the starting time of the k-th time interval, k ≥ 1; Am,k denotes the set of all arrival wave time data at the m-th monitoring point within the k-th time interval; nm,k is the number of elements in the set Am,k, which corresponds to the number of blast holes; nm is the maximum number of arrival waves at the m-th monitoring point within the same time interval.
The initiation times of the above blast holes and subsequent holes are increased by a fixed duration to separate the vibration waves arriving simultaneously at the monitoring points, thereby significantly reducing the vibration caused by multi-hole blasting and addressing vibration safety concerns. Figure 2 illustrates the principle of separating vibration waves that arrive simultaneously at the monitoring points. Taking two single-hole vibration curves arriving at the monitoring points within the Δt period as an example, the figure depicts two extreme scenarios. Figure 2a shows two vibration curves arriving at the monitoring points at the same time. According to the principle of peak and trough superposition, translating one of the vibration curves backward by 1/2T achieves the optimal vibration reduction effect. Figure 2b shows two vibration waves arriving at the monitoring points at the beginning and end of the same period, respectively. Translating the latter vibration curve backward by 1/2T − Δt achieves the optimal vibration reduction effect. Therefore, for vibration waves arriving within the Δt period, the range of translation on the x-axis is [1/2T − Δt, 1/2T]. To enhance the convenience of the method, this paper stipulates the use of 1/2T as the additional time length required to separate vibration waves arriving simultaneously at the monitoring points.
It is worth noting that by taking advantage of the differences in the charge amount, distance, and site factor among different blast holes, the vibration curves of single blast holes at any position, which are reconstructed by adjusting the measured vibration curves of single blast holes, possess the same periodicity. On this premise, according to the principle of half-period vibration reduction, it can be determined that moving the waveform arrival time by 1/2T can achieve a relatively good vibration reduction effect.
Problem 2: Vibration hazards around the blast area caused by spatiotemporal variabilities between monitoring points and blast holes.
The distances from each blast hole to different monitoring points are not the same, leading to varying arrival time sequences of the waves at each monitoring point. In a given blasting time sequence, most monitoring points are typically in a normal vibration state, while a specific monitoring point may experience hazards. The location of such monitoring points will shift with changes in the blasting time sequence. In practical blasting vibration control, a limited number of monitoring points are insufficient to comprehensively capture vibration conditions in all directions surrounding the blast area, making it impossible to accurately identify the location of potential vibration hazards.
To ensure blasting vibration safety, this paper establishes a fixed-width monitoring point distribution zone around the blasting area, within which monitoring points are densely deployed. Using the aforementioned method, large-scale iterative calculations are performed to determine the clustering arrival periods at each monitoring point and the corresponding blast hole indices within these periods. A “monitoring point location vs. wave arrival count” contour map is generated to identify high-probability vibration hazard locations. For the clustering arrival periods at these hazard locations, the corresponding blast holes are identified, and their initiation times are delayed by a fixed duration. The contour map is then recalculated based on the modified initiation sequence. Ultimately, all high-probability vibration hazard locations are eliminated, achieving all-around vibration control of the blasting area.
Problem 1 and its corresponding solution aim to address the vibration hazards at a single monitoring point. Problem 2 and its solution are designed to solve the vibration control problem at monitoring points located at any position surrounding the blast area. The solutions to these two problems, starting from individual points and extending to the entire area, enable all-direction vibration control surrounding the blast area.

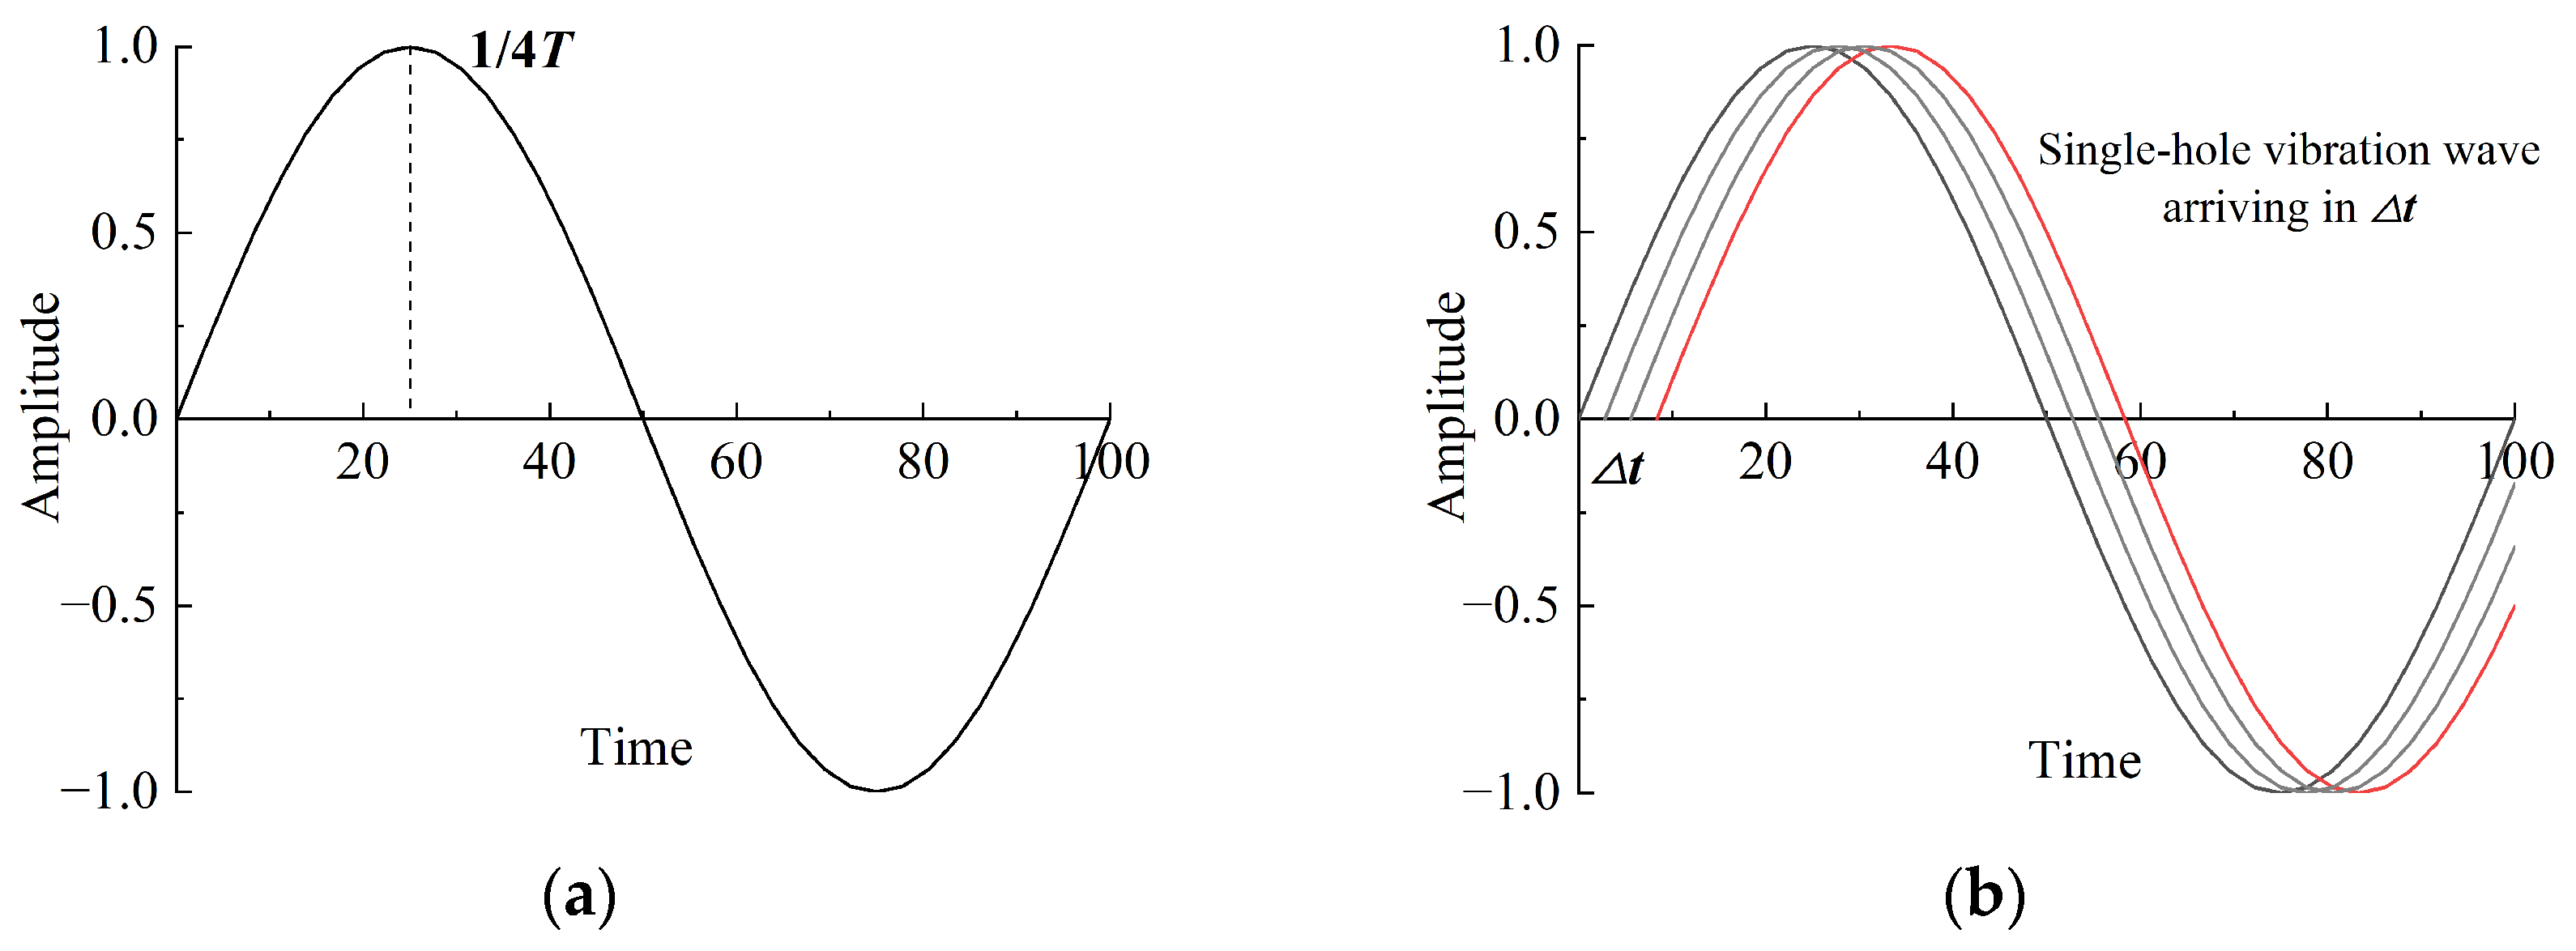
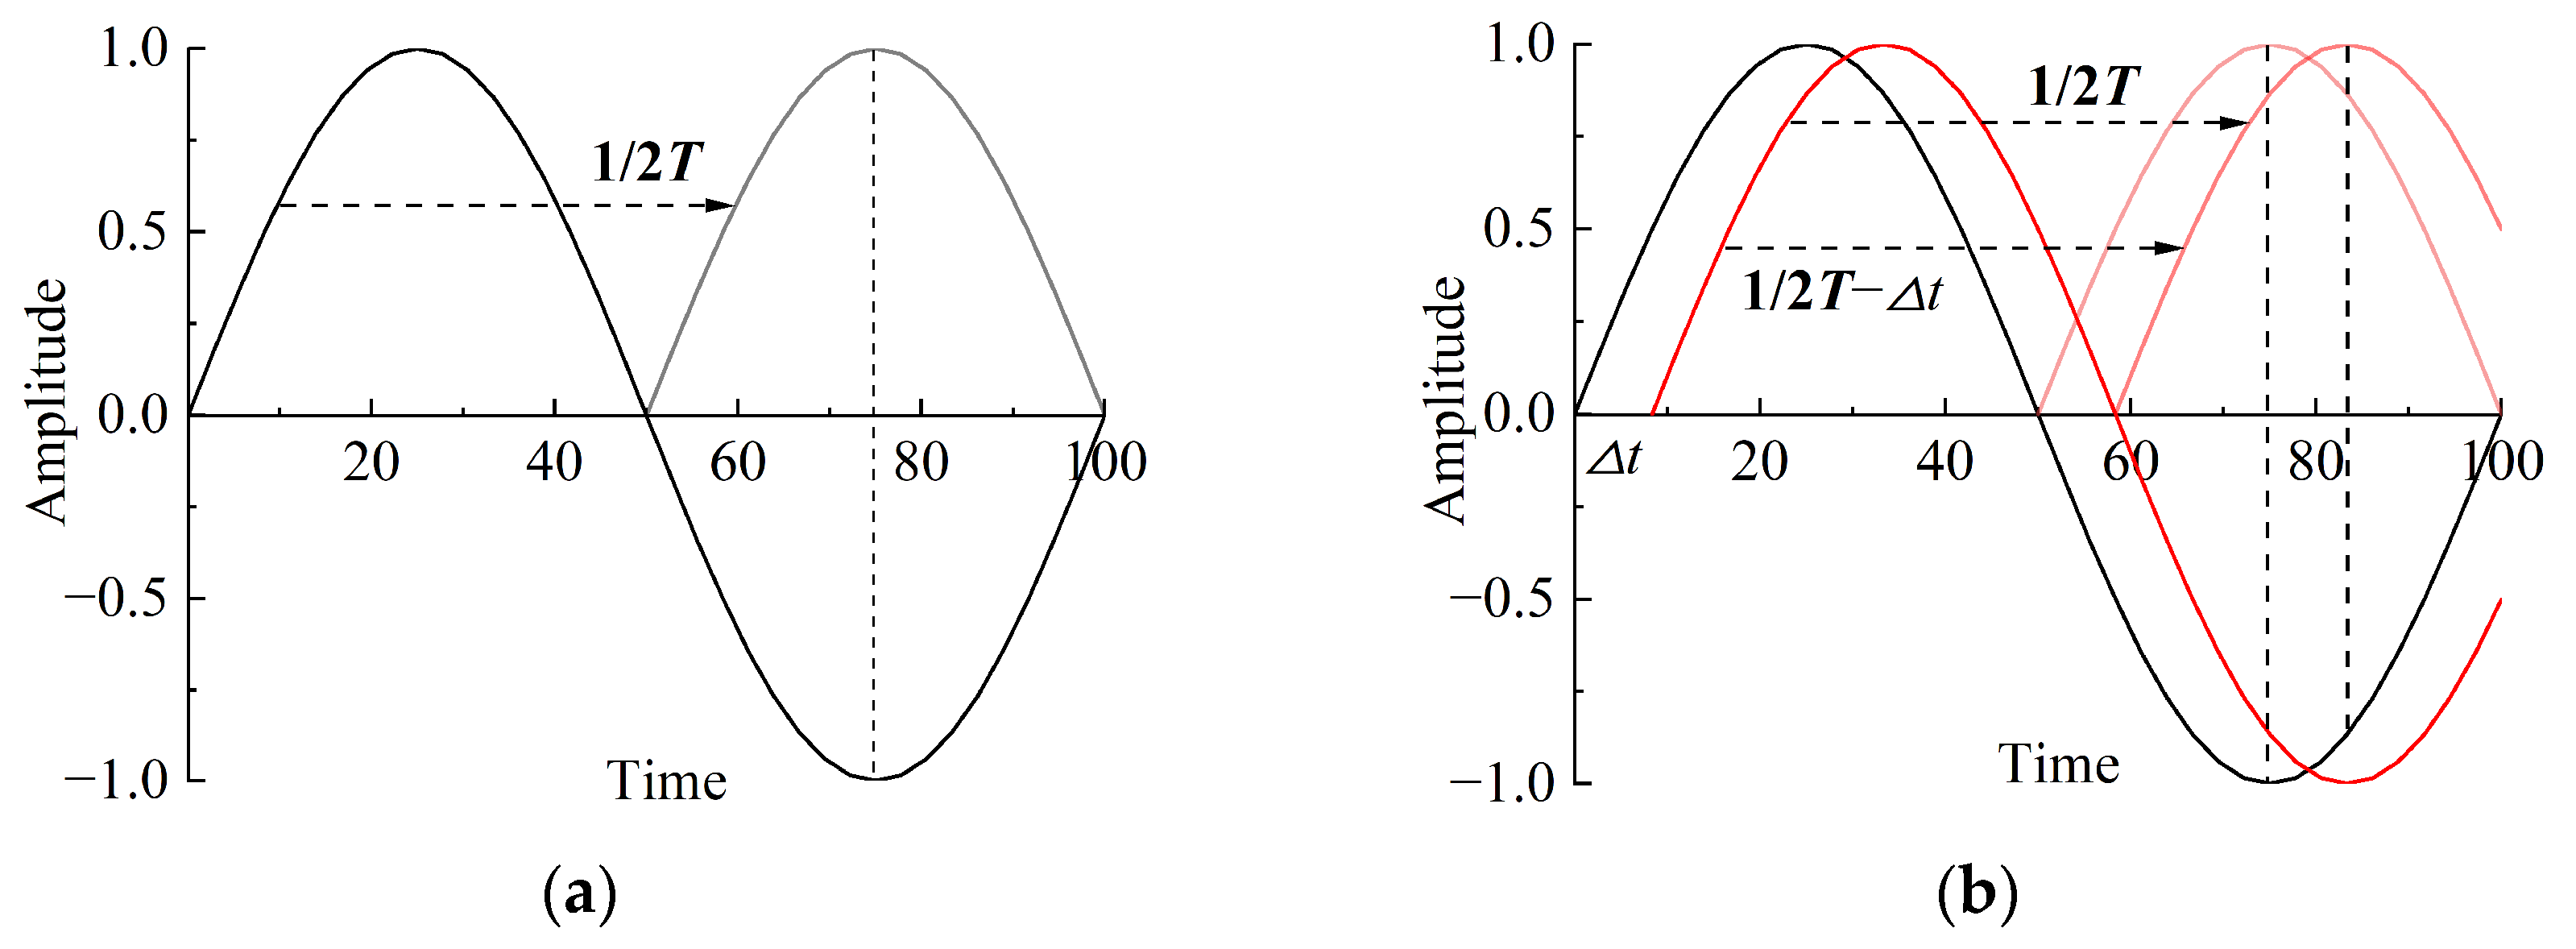
2.3. Single-Shot Vibration Waveform Reconstruction and Multi-Hole Vibration Superposition Method

In multi-hole bench blasting, the vibrations are the superposition of single-hole vibration waves from blast holes at different locations, sequenced according to their arrival times. The spatiotemporal relationship between blast holes and monitoring points not only influences the arrival sequence of vibration waves but also affects the characteristics of the single-hole vibration curves. Based on the aforementioned methodology, the arrival time sequence of vibration waves from each blast hole can be determined. To predict multi-hole blast vibrations, it is also necessary to obtain the vibration curves for holes at various locations. However, in practical blasting engineering, it is challenging to measure the vibration curves of each blast hole on-site. Variations in blast-induced vibrations among holes arise from differences in charge, propagation distance, site factors, and other parameters. Therefore, this section utilizes measured single-hole vibration curves as baseline profiles and reconstructs the single-hole vibration curves at the monitoring point for blast holes at different locations by accounting for variations in these influencing factors. Subsequently, the reconstructed single-hole vibration curves are superimposed according to their arrival times, and the effectiveness of vibration control is evaluated based on the reduction in predicted vibration velocity.
(1)
Determination of the scaling factor for vibration curves at arbitrary blast hole locations.
Differences in blasting vibration from one blast hole to another are due to differences in charge, distance, and site factors. Using the measured vibration data from single holes, a mapping relationship is established between the PPV and factors such as the charge weight, spatial distance, and site conditions, aiming to cover the experimental area as comprehensively as possible, as shown in Equation (4).
V max = λ Q α R β
where Vmax is the peak vibration velocity of a single hole (unit: cm/s); Q denotes the charge weight per hole (unit: kg); R represents the propagation distance between the blast source and monitoring point(unit: m); λ, α, and β are constant parameters for site factors related to lithology and geological conditions, and their values were obtained by regression analysis of field experimental data. In accordance with the blasting vibration attenuation principle, Vmax exhibits an inverse relationship with the distance R, resulting in a negative value for coefficient β.
Due to differences in charge and spatial distance to the monitoring point between any blast hole and the measured hole, the peak vibration velocities of individual holes differ from that of the measured hole. The ratio between these two values is defined as the scaling factor, and the scaling factor for the i-th blast hole is given by Equation (5).
A ( Q 0 , R 0 , Q i , R i ) = V i / V 0 = ( Q i / Q 0 ) α / ( R 0 / R i ) β
where A(Q0, R0, Qi, Ri) represents the proportional coefficient for the i-th blast hole, where i is the hole blasting sequence number; Q0 and R0 are the charge weight and spatial distance from the monitoring point for the test hole, respectively; and Qi and Ri are the charge weight and spatial distance from the monitoring point for the i-th hole, respectively.
(2)
Reconstruction method for the single-shot vibration curve at arbitrary locations.
Based on the measured single-hole vibration curves, the single-hole vibration curves of the holes at any position are reconstructed by using the scaling factor and are extended to be valid in the whole time domain. Equation (6) is the reconstruction function of the single-hole vibration curve of any position of the hole.
f i ( t ) = A ( Q 0 , R 0 , Q i , R i ) f 0 ( t ) = ( Q i / Q 0 ) α / ( R 0 / R i ) β f 0 ( t ) F i ( t ) = δ i ( t ) t < t 1 ( t ) f i ( t ) t 1 ( t ) t t 1 ( t ) + t d u r φ i ( t ) t > t 1 ( t ) + t d u r
where fi(t) represents the reconstruction function of the vibration curve for the blast hole at an arbitrary position and Fi(t) is the extension of fi(t) over the entire time domain; f0(t) is the functional expression of the measured vibration curve for the test hole, obtained by Fourier sequence fitting; tdur is the duration of the single-shot vibration curve; δi(t) represents the noise prior to fi(t); and φi(t) represents the residual wave following fi(t).
(3)
Method for the superposition of vibration waveforms in multi-hole blasting.
Based on the Anderson principle, the reconstructed vibration curves for single holes are superposed according to the arrival time, to obtain the predicted vibration curve for the multi-hole delay blasting. Equation (7) is a superposition formula for multi-hole blasting vibration.
F ( t ) = i = 1 I F i t t i
where I represents the number of holes in the blasting area.
The methods of wave arrival time calculation, vibration wave superposition and the arrangement of monitoring points around the blast area have been written into the MATLAB_R2021b program. After calculating the number of simultaneous wave arrivals at all monitoring points and obtaining the adjusted delay scheme by adjusting the number of simultaneous wave arrivals, the vibration superposition of multi-hole blasting is used to verify the control effect of blasting vibration after delay adjustment. Figure 3 shows the overall idea of the bench blasting vibration control method proposed in the paper.

3. Field Test Analysis and Delay Adjustment Under Vibration Control

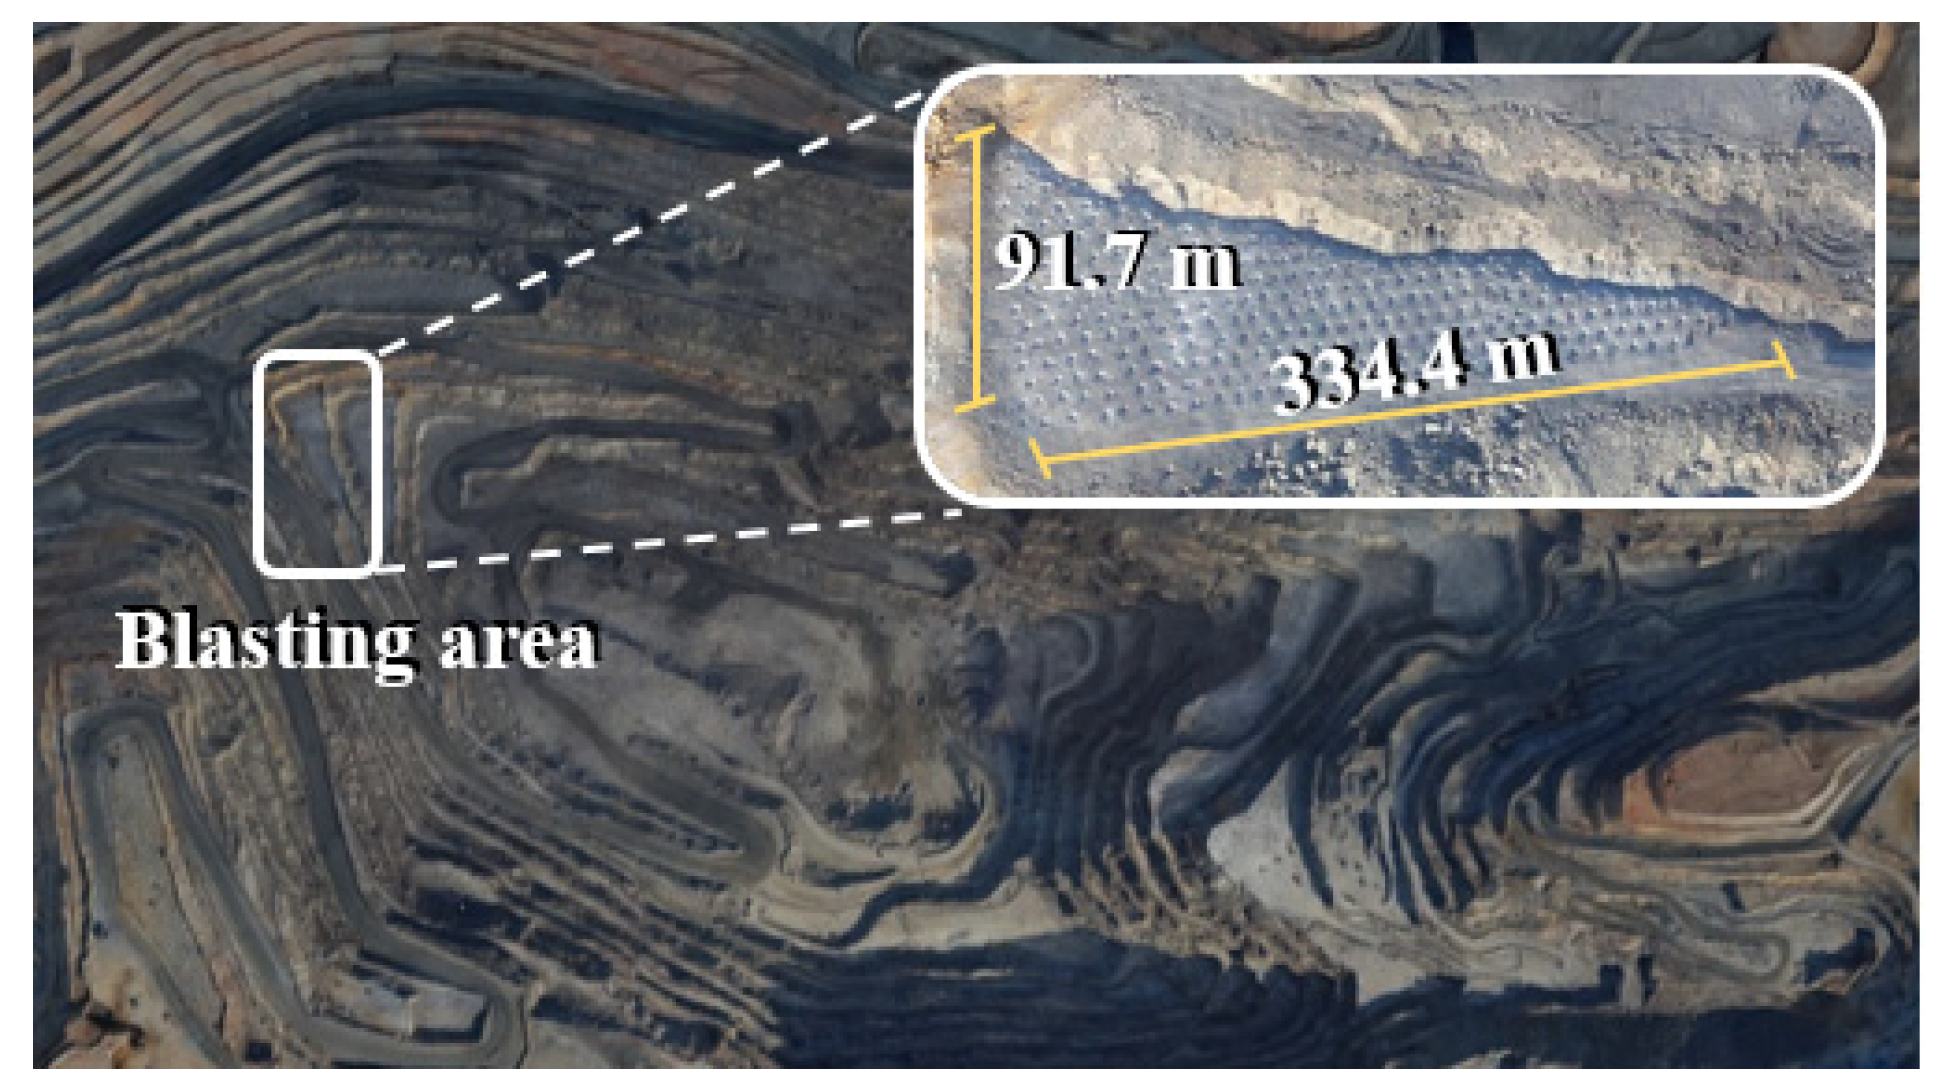
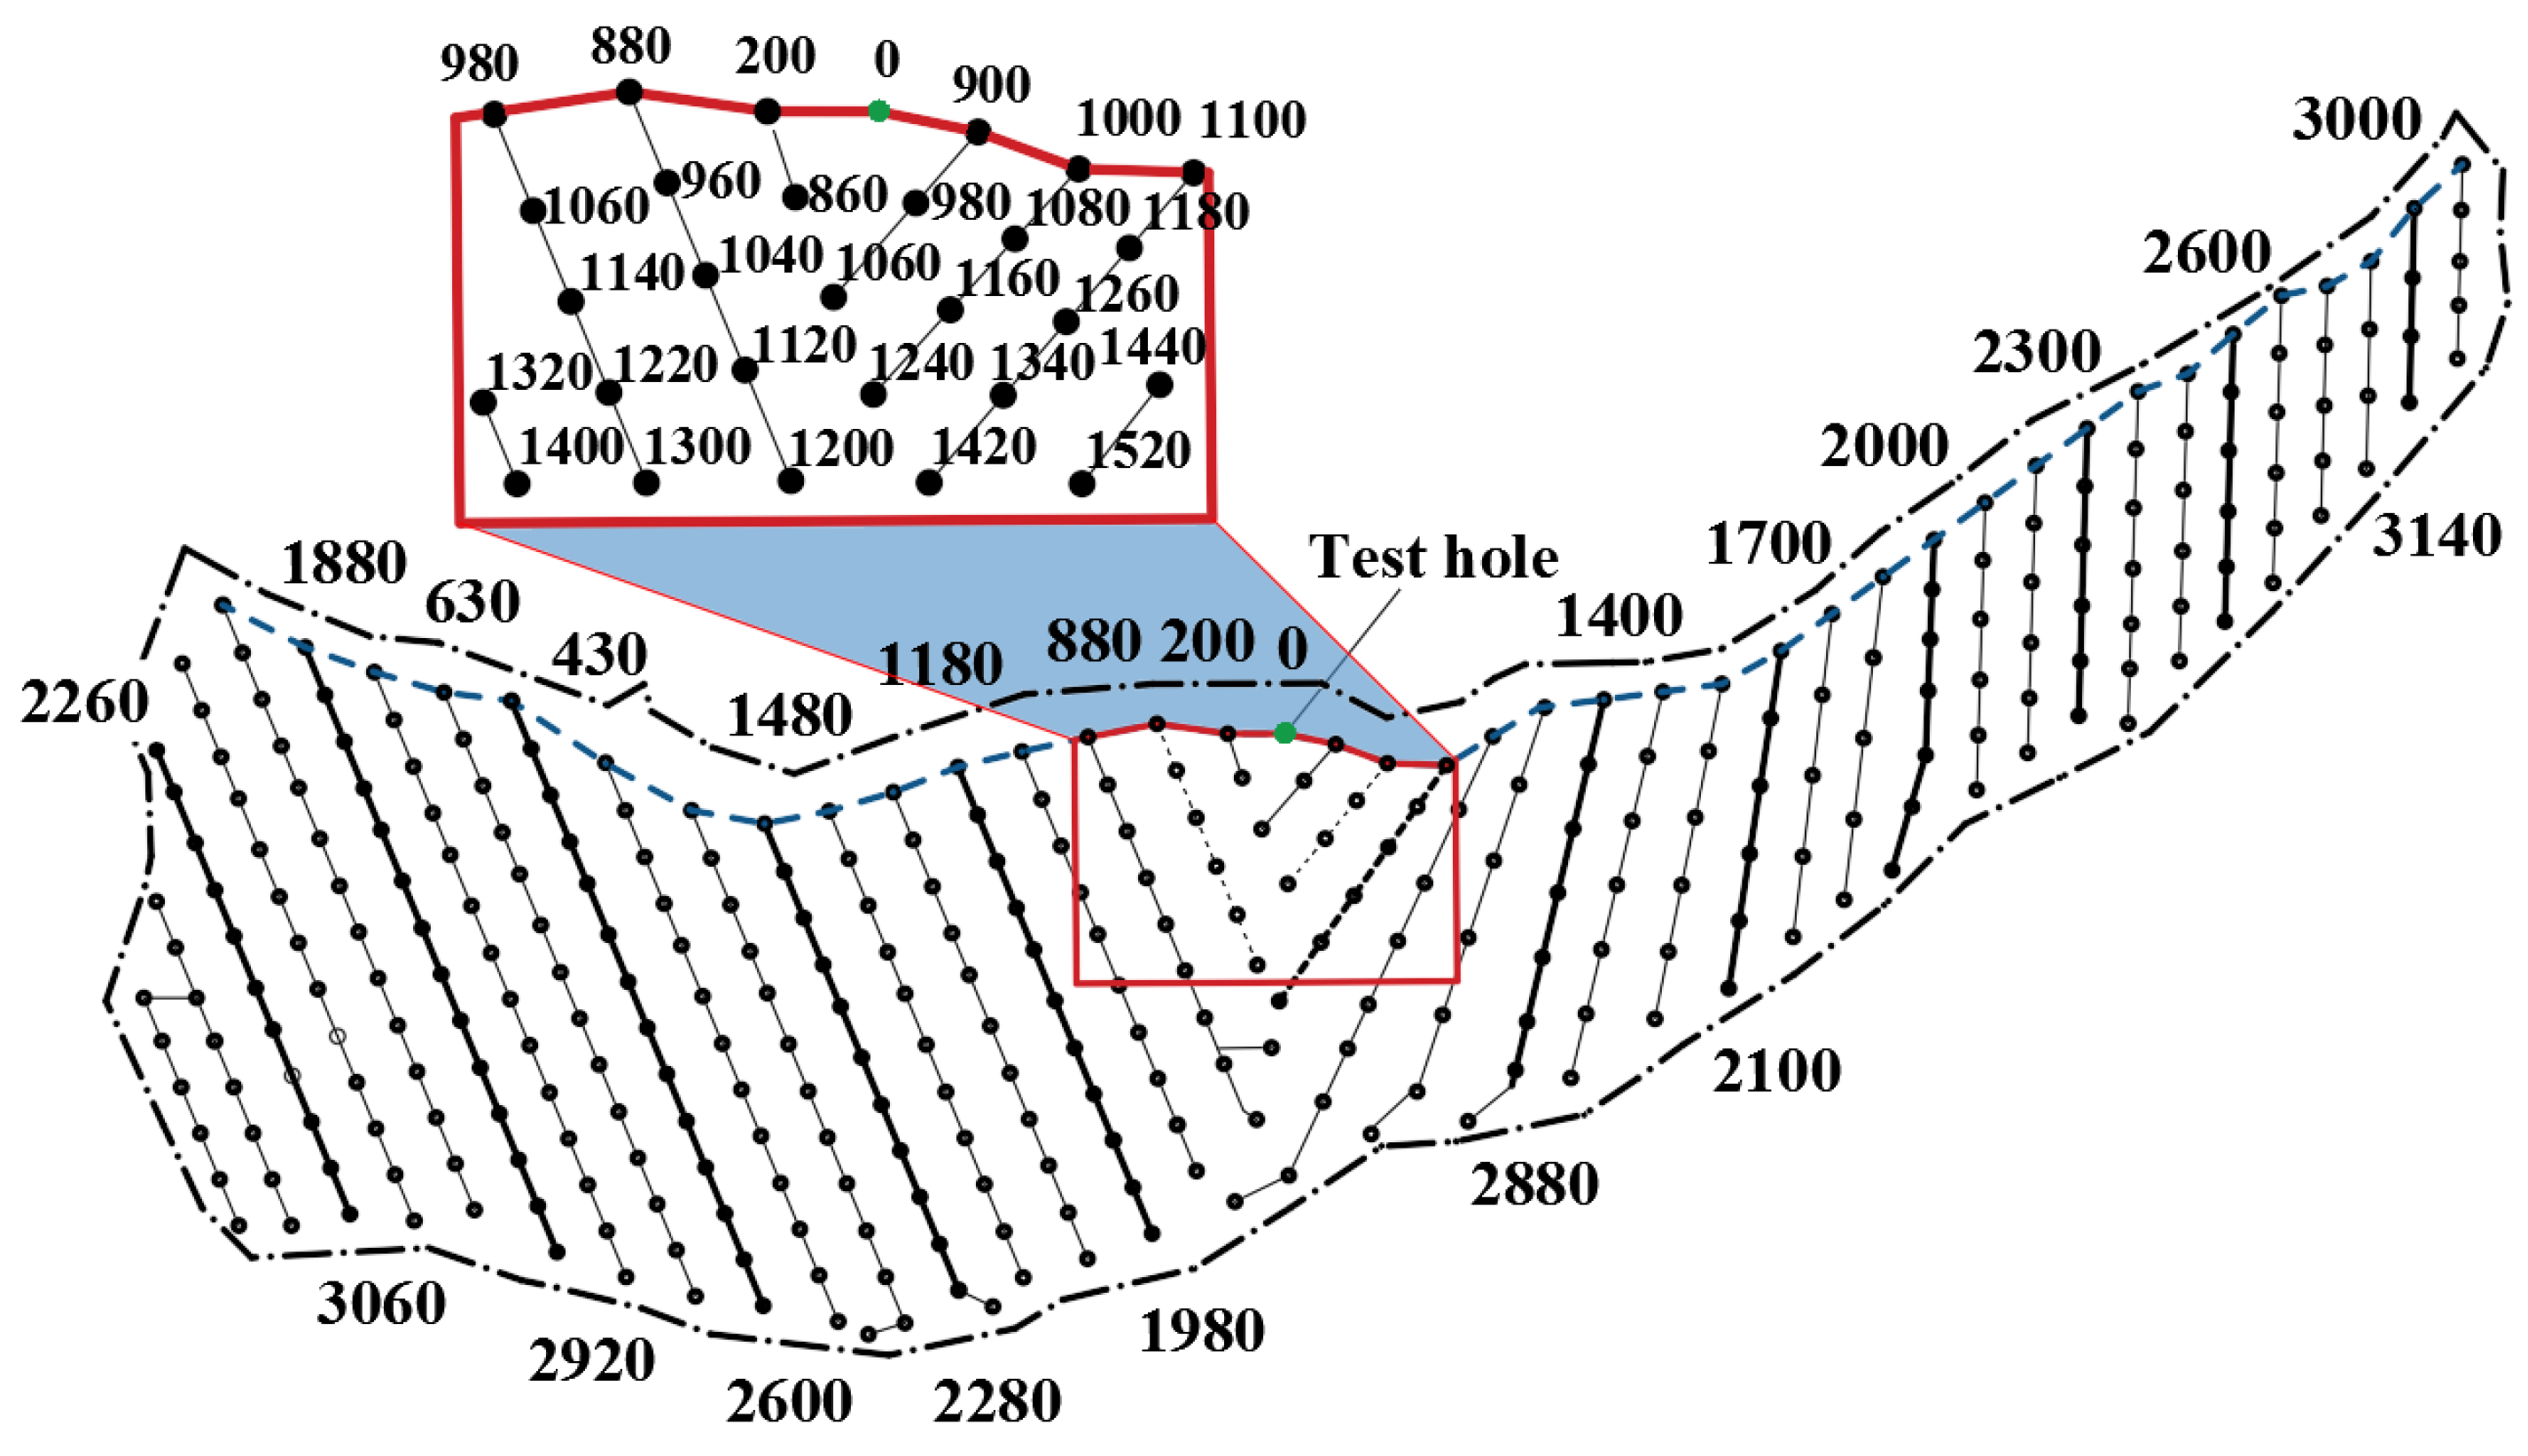
3.1. Engineering Background

The experimental site is located in a large open pit mine in the western region of Inner Mongolia, China. The average height of the bench is 14.5 m, with a slope angle of approximately 78°. The deposit consists of alternating layers of iron ore, rare earth minerals, limestone, and mica, distributed within a long, band-shaped ore body. The ore body extends approximately 334.4 m in the north–south direction and reaches a maximum width of about 91.7 m in the east–west direction. Figure 4 shows the location of the test blast area and drilled holes. Different hole spacing and row spacing were designed based on the ore type. In the rock area, the hole spacing is 11 m × 6 m, while in the ore area it is 8 m × 6 m. The main holes are charged with 700~950 kg/hole, while the peripheral holes are charged with 500~600 kg/hole. The total charge for the 338 holes is 300 t. The holes are connected to the detonation network according to the “V” shape, and electronic detonators are used to initiate explosions hole by hole. The inter-hole delay is set to 100 ms and the inter-row delay to 80 ms. Figure 5 provides a schematic diagram of the detonation network and the location of the test holes. The initiation time interval between the test hole and other holes exceeds 200 ms in order to obtain a complete single-shot vibration curve, which serves as the reference curve for reconstructing the single-shot vibration curve at any arbitrary location.
On the northern slope of the blasting area, two vibration monitoring lines were established, and the precise coordinates of seven monitoring points were obtained using GPS. Figure 6 illustrates the layout of the blast vibration monitoring points. Based on the coordinates of the monitoring points and blast holes, the propagation times of vibration waves from each hole were calculated, enabling the determination of the arrival time sequence of all hole waves at the monitoring points using Equation (2). Taking monitoring point B1 as an example, Figure 7 illustrates the arrival time distribution of vibration waves generated by 338 blast holes. In the figure, the x-axis represents the blast hole number (sequenced by initiation order) and the y-axis indicates the wave arrival time (ms) at the monitoring point. To better visualize the temporal differences in wave arrivals from different holes, the data are divided into four subplots (Figure 7a–d) based on the initiation sequence.
It should be noted that the dominant frequency obtained from Fourier transform analysis of the single-hole vibration waveform at monitoring point B1 was 9.94 Hz, with high-frequency components exhibiting significant attenuation during propagation from the blast source to the monitoring point. Consequently, the influence of medium dispersion characteristics on the propagation velocity of different frequency components was not considered in this study. The average wave propagation velocity, determined experimentally as 4.4 × 10³ m·s−1, was adopted to calculate the arrival times of blast-induced vibrations at the monitoring points.
As shown in Figure 7, the arrival time sequence lasts for approximately 3600 ms. The arrival time sequence curve exhibits a sawtooth pattern rather than a smooth curve. This indicates that, within the same time interval, vibration waves from multiple holes reach the monitoring point simultaneously. The greater the number of vibration waves arriving at the same time, the greater the probability of influencing the superposition of vibration wave peaks and valleys to cancel each other out, making it easier to form the problem of larger vibrations.
This paper primarily investigates the influence of the spatiotemporal relationship between monitoring points and blast sources on wave arrival times, as well as the associated vibration control issues. The reconstruction of single-hole vibration waves and the prediction of multi-hole vibrations serve as validation steps for vibration control effectiveness. Taking monitoring point B1 as an example, Figure 8a shows the measured single-hole vibration curve, with a dominant frequency of 9.94 Hz obtained through Fourier transform, corresponding to a half-period (1/2T) of approximately 50 ms. Using this as the baseline curve and following the methodology outlined in Section 2, the predicted multi-hole vibration curve is generated. A comparison between the predicted and measured vibration curves is presented in Figure 8b, where the initial 830 ms segment corresponds to the single-hole vibration curve of the test blast hole and is not displayed. The high degree of agreement between the two curves demonstrates that the waveform prediction accuracy based on the superposition method meets the requirements for engineering applications.
The core of the vibration control method proposed in this paper is (1) single-hole vibration curve reconstruction based on measured data and (2) wave propagation time calculation based on the spatial relationship. In the reconstruction of the single-hole vibration curve, this method adopts the measured waveform as input data, which effectively avoids the limitations of the theoretical assumptions; in the calculation of the vibration wave propagation time, we accurately determine the actual coordinates of the blast source and the monitoring point based on the technology of GPS positioning, which provides the basic parameters for the calculation of wave propagation time. Under different geological conditions, researchers can realize effective vibration control by adjusting the delay parameters after obtaining the above basic data through experiments.

3.2. Vibration Wave Arrival Time Sequence Analysis for Single Monitoring Point and Delay Adjustment

The monitoring point arrival time sequence was quantitatively analyzed using the method described in Section 2.2. The complete arrival duration was segmented into consecutive 10 ms intervals, dividing the 3600 ms period into 360 discrete time windows ([0,10), [10,20), …, [3590,3600]). Each of the 338 blast hole arrivals was assigned to its corresponding interval, enabling statistical analysis of the number of arrivals in each time interval. Figure 9 presents the arrival wave counts per interval across monitoring points.
Analysis revealed significant wave clustering between 2000–2500 ms, with monitoring point B1 recording up to five simultaneous arrivals during the [2100,2110) interval (Figure 9). This phenomenon directly correlated with the local velocity peak visible in Figure 8b. The source locations of these five waves relative to B1 are shown in Figure 10. The observed spindle-shaped waveform (Figure 8b) emerges from distinct temporal patterns: the initial 0–1300 ms period typically contains ≤ 2 simultaneous arrivals, while the middle-late phase (1300–3100 ms) regularly features ≥ 3 overlapping waves.
The proposed initiation sequence adjustment method achieves vibration reduction through the precise temporal separation of wave arrivals. For monitoring point B1, the implementation protocol involves (1) programmatic identification of critical clustering periods (≥4 simultaneous arrivals), (2) application of a progressive delay strategy with 50 ms (1/2T) increments starting from the second hole in each cluster, and (3) determination of a benchmark delay parameter from the final hole’s adjustment. This active control method is based on the principle of time separation. Not only can it effectively reduce the superposition probability of vibration waves, but can also realize the temporal dispersion of blasting vibration energy and reduce vibration by adjusting the detonation timing.
For example, the four vibration waves arriving simultaneously at monitoring point B1 correspond to blast holes #109, #114, #112, and #115 (this sequence represents the order of arrival times and requires adjustment accordingly). The initial detonation times are designed as 1800 ms, 1840 ms, 1820 ms, and 1840 ms, respectively. The adjusted detonation times are 1800 ms, 1890 ms, 1920 ms, and 1990 ms, with each subsequent hole detonation time increased by 150 ms. This adjustment maintains the relative delay times between subsequent holes while shifting their vibration curves backward by 150 ms. Using the same method, five vibration waves arriving simultaneously at the monitoring point are separated, where the last vibration wave to be adjusted corresponded to hole #163.
Figure 11 illustrates the number of wave arrivals at monitoring point B1 within each time period after the adjustment. It can be observed that the maximum number of simultaneous wave arrivals at the monitoring point is reduced to three. The reconstructed single-hole vibration curves are superimposed according to the adjusted arrival times to obtain the predicted multi-hole vibration curve, which is then compared with the pre-adjustment predicted vibration curve, as shown in Figure 12. The fixed time intervals for the arrival times of blast holes #109 and #163 start at 1800 ms and 2120 ms, respectively. To separate the four and five simultaneous wave arrivals, additional delays of 150 ms and 200 ms were applied. Given the single-hole vibration curve length of 200 ms, the predicted vibration curve within the range of 1800 ms to 2670 ms is extracted. Beyond 2670 ms, the amplitude of the multi-hole vibration curve is unaffected by the adjusted blast holes, and the original vibration curve is shifted backward by 350 ms. Within this time range, the peak positive vibration velocity before adjustment was 2.10 cm·s−1, which decreased to 1.86 cm·s−1 after adjustment, with a reduction rate of 11.43%. The peak negative vibration velocity before adjustment was −2.37 cm·s−1, and it decreased to −2.12 cm·s−1 after adjustment, with a reduction rate of 10.55%. The root mean square (RMS) value of the vibration wave reflects the energy of the signal and is an important indicator for measuring the signal strength. The RMS values before and after adjustment were 0.84 cm·s−1 and 0.69 cm·s−1 respectively, representing a decrease of 17.86% compared with the value before adjustment.
The proposed method effectively restricts the number of simultaneous wave arrivals at the monitoring point to three or fewer, thereby significantly reducing the occurrence of high-probability vibration hazards caused by excessive simultaneous wave arrivals.

3.3. Vibration Wave Arrival Time Sequence Analysis for Multiple Monitoring Points Surrounding the Blast Area and Delay Time Adjustment

The proposed method provides effective vibration control for a single monitoring point. However, its direct application to multiple monitoring points encounters inherent limitations. These limitations arise from the fact that the vibration wave arrives at each monitoring point at different times in the changing spatiotemporal relationship between different blast source monitoring points, which fundamentally alters the wave interference pattern. As a result, a delay scheme adjusted for a specific monitoring point may destroy the peak-to-valley cancellation effect required at other monitoring points.
To address these challenges in an open bench blasting environment, a comprehensive vibration control strategy has been developed. The method begins with a systematic statistical analysis of vibration wave arrival times at all monitoring points. The higher the number of simultaneous wave arrivals at a monitoring point, the higher the probability of vibration exceedance at that time, and the corresponding measurement point location is labeled as a high vibration probability hazard location. The MATLAB program accurately identifies these hidden danger points by detecting time intervals where vibration waves from multiple holes arrive simultaneously, thereby pinpointing the corresponding hole numbers. Through targeted delay-time adjustments, the originally overlapping vibration waves are temporally separated, achieving effective blast vibration mitigation.
The study area remained consistent with the aforementioned blast area. Monitoring points were randomly distributed in the 200–400 m annular region, with 20 m spacing ensuring spatial density control. Precise coordinates were obtained through MATLAB programming, and wave arrival time sequences from all holes to each monitoring point were calculated using Equation (2). Based on Equation (3), the MATLAB program is used to lock the maximum value of the number of simultaneous wave arrivals at different monitoring points and the corresponding number of the gun holes. Accordingly, a cloud diagram of “monitoring point position—number of wave arrivals” is drawn, as shown in Figure 13.
Figure 13 shows concentrated red zones along the HH1 and HH2 directions, indicating a higher number of simultaneously arriving vibration waves (≥5 waves) within specific time windows at these locations. This multi-wave superposition effect significantly increases vibration amplitude, thereby elevating the probability of vibration hazards, with the HH2 direction precisely corresponding to the azimuth of monitoring points A1 and A2. In contrast, three directions (LH1, LH2, and LH3) exhibit low-probability vibration hazard characteristics, with monitoring points B1–B4 all located near the LH2 direction. When using the free face normal direction (LH1) as reference, the spatial distribution shows that HH1 and HH2 are situated in the lower-left and lower-right quadrants of the blast area respectively, while LH2 and LH3 are distributed on the left and right sides, respectively. Figure 14 presents analysis results after adjusting the initiation sequence based on monitoring point B1, demonstrating that adjustment focusing solely on this direction still leaves residual hazards and may lead to underestimation of vibration risks. To achieve comprehensive perimeter vibration control around the blast area, targeted adjustment must be implemented for high-probability hazard directions (such as the zones containing monitoring points A1 and A2).
The monitoring points A1 and A2 exhibited the simultaneous arrival of vibration waves from six identical blast holes (#207, #214, #213, #215, #212, #211) within the 2730–2740 ms time window, as automatically identified by MATLAB. Following the wave separation methodology in Section 3.2, we implemented delay adjustment for these holes. Figure 15 shows the adjusted arrival-time distribution, where the maximum simultaneous waves were effectively controlled below four per window. The vibration profile at each monitoring point is divided into several time windows, and the number of simultaneous wave arrivals in each time window is not uniform, with m representing the maximum value of the number of vibration waves arriving at the same time, and n representing the number of points with such monitoring. The detailed view before adjustment seen in Figure 14 shows seven monitoring points with six simultaneous waves (completely eliminated post-adjustment) and thirty-five points with five waves (reduced to four, 88.57% reduction). The adjustment scheme, initiated at hole #207 (arrival time: 1800 ms) and concluding at #211 (2870 ms), applied progressive 50 ms (1/2T) increments to five consecutive holes (#214–#211), resulting in a cumulative 250 ms delay extension. Considering that the duration of the vibration curve of a single blast hole is 200 ms, the predicted vibration curves in the range of 1800 ms to 3320 ms were extracted for analysis. Figure 15 shows the comparison of the predicted vibration curves before and after the adjustment. Before the adjustment, the peak negative vibration velocity was −1.85 cm·s−1, which decreased to −1.59 cm·s−1 after the adjustment, with a reduction rate of 14.05%. Before the adjustment, the peak positive vibration velocity was 1.18 cm·s−1, which decreased to 1.10 cm·s−1 after the adjustment, with a reduction rate of 6.78%. The RMS values before and after the adjustment were 0.60 cm·s−1 and 0.49 cm·s−1 respectively, representing a decrease of 18.33% compared with the value before the adjustment. In vibration analysis, the logarithmic scale is usually expressed in the form of decibels (dB) and is calculated by the following formula:
L d B = 20 log 10 P P V a f t e r P P V b e f o r e
where PPVafter is the effective value of the vibration after the delay adjustment and PPVbefore is the effective value of the vibration before the delay adjustment.
The decibel value was calculated to be reduced by 1.76 dB after the delay adjustment. In addition, the energy reduction of the vibration wave was calculated to be 33.31% using Equation (9).
η = 1 P P V a f t e r 2 P P V b e f o r e 2 × 100 %
Through the adjustment of the delay times described above, the potential for vibration amplification due to excessive simultaneous wave arrivals at each monitoring point is effectively mitigated. Building on this foundation, the proposed method is further applied to eliminate high-probability vibration hazard locations in the HH2 direction, thereby achieving comprehensive vibration control for multi-hole blasting across all directions.

4. Conclusions

Reducing blast vibration hazard at arbitrary locations around the blasting area is fundamental to achieving comprehensive and precise vibration control. The delay time determined based on vibration control requirements at a specific location often fails to meet the vibration control requirements at other locations. By ensuring the superposition and cancellation effect of vibration wave peaks and troughs, localized adjustments to the delay times are implemented to separate vibration waves during clustering arrival periods, thereby reducing vibrations while maintaining the original blasting effectiveness. The specific conclusions are as follows:
(1)
Based on the spatiotemporal relationship between blast holes and monitoring points, a computational method is established to determine the arrival time sequences of vibration waves from any blast hole to different monitoring points. The vibration induced by multi-hole blasting is the result of superimposing single-hole vibration waves according to their arrival time sequences. As the arrival time sequence varies with the location of the monitoring point, the optimal delay time for a specific location often fails to meet the vibration control requirements at other locations. The vibration control method proposed in this study, which builds upon the original delay design, achieves precise vibration control by separating vibration waves during clustering arrival periods while maintaining the fragmentation effectiveness of the original blasting scheme.
(2)
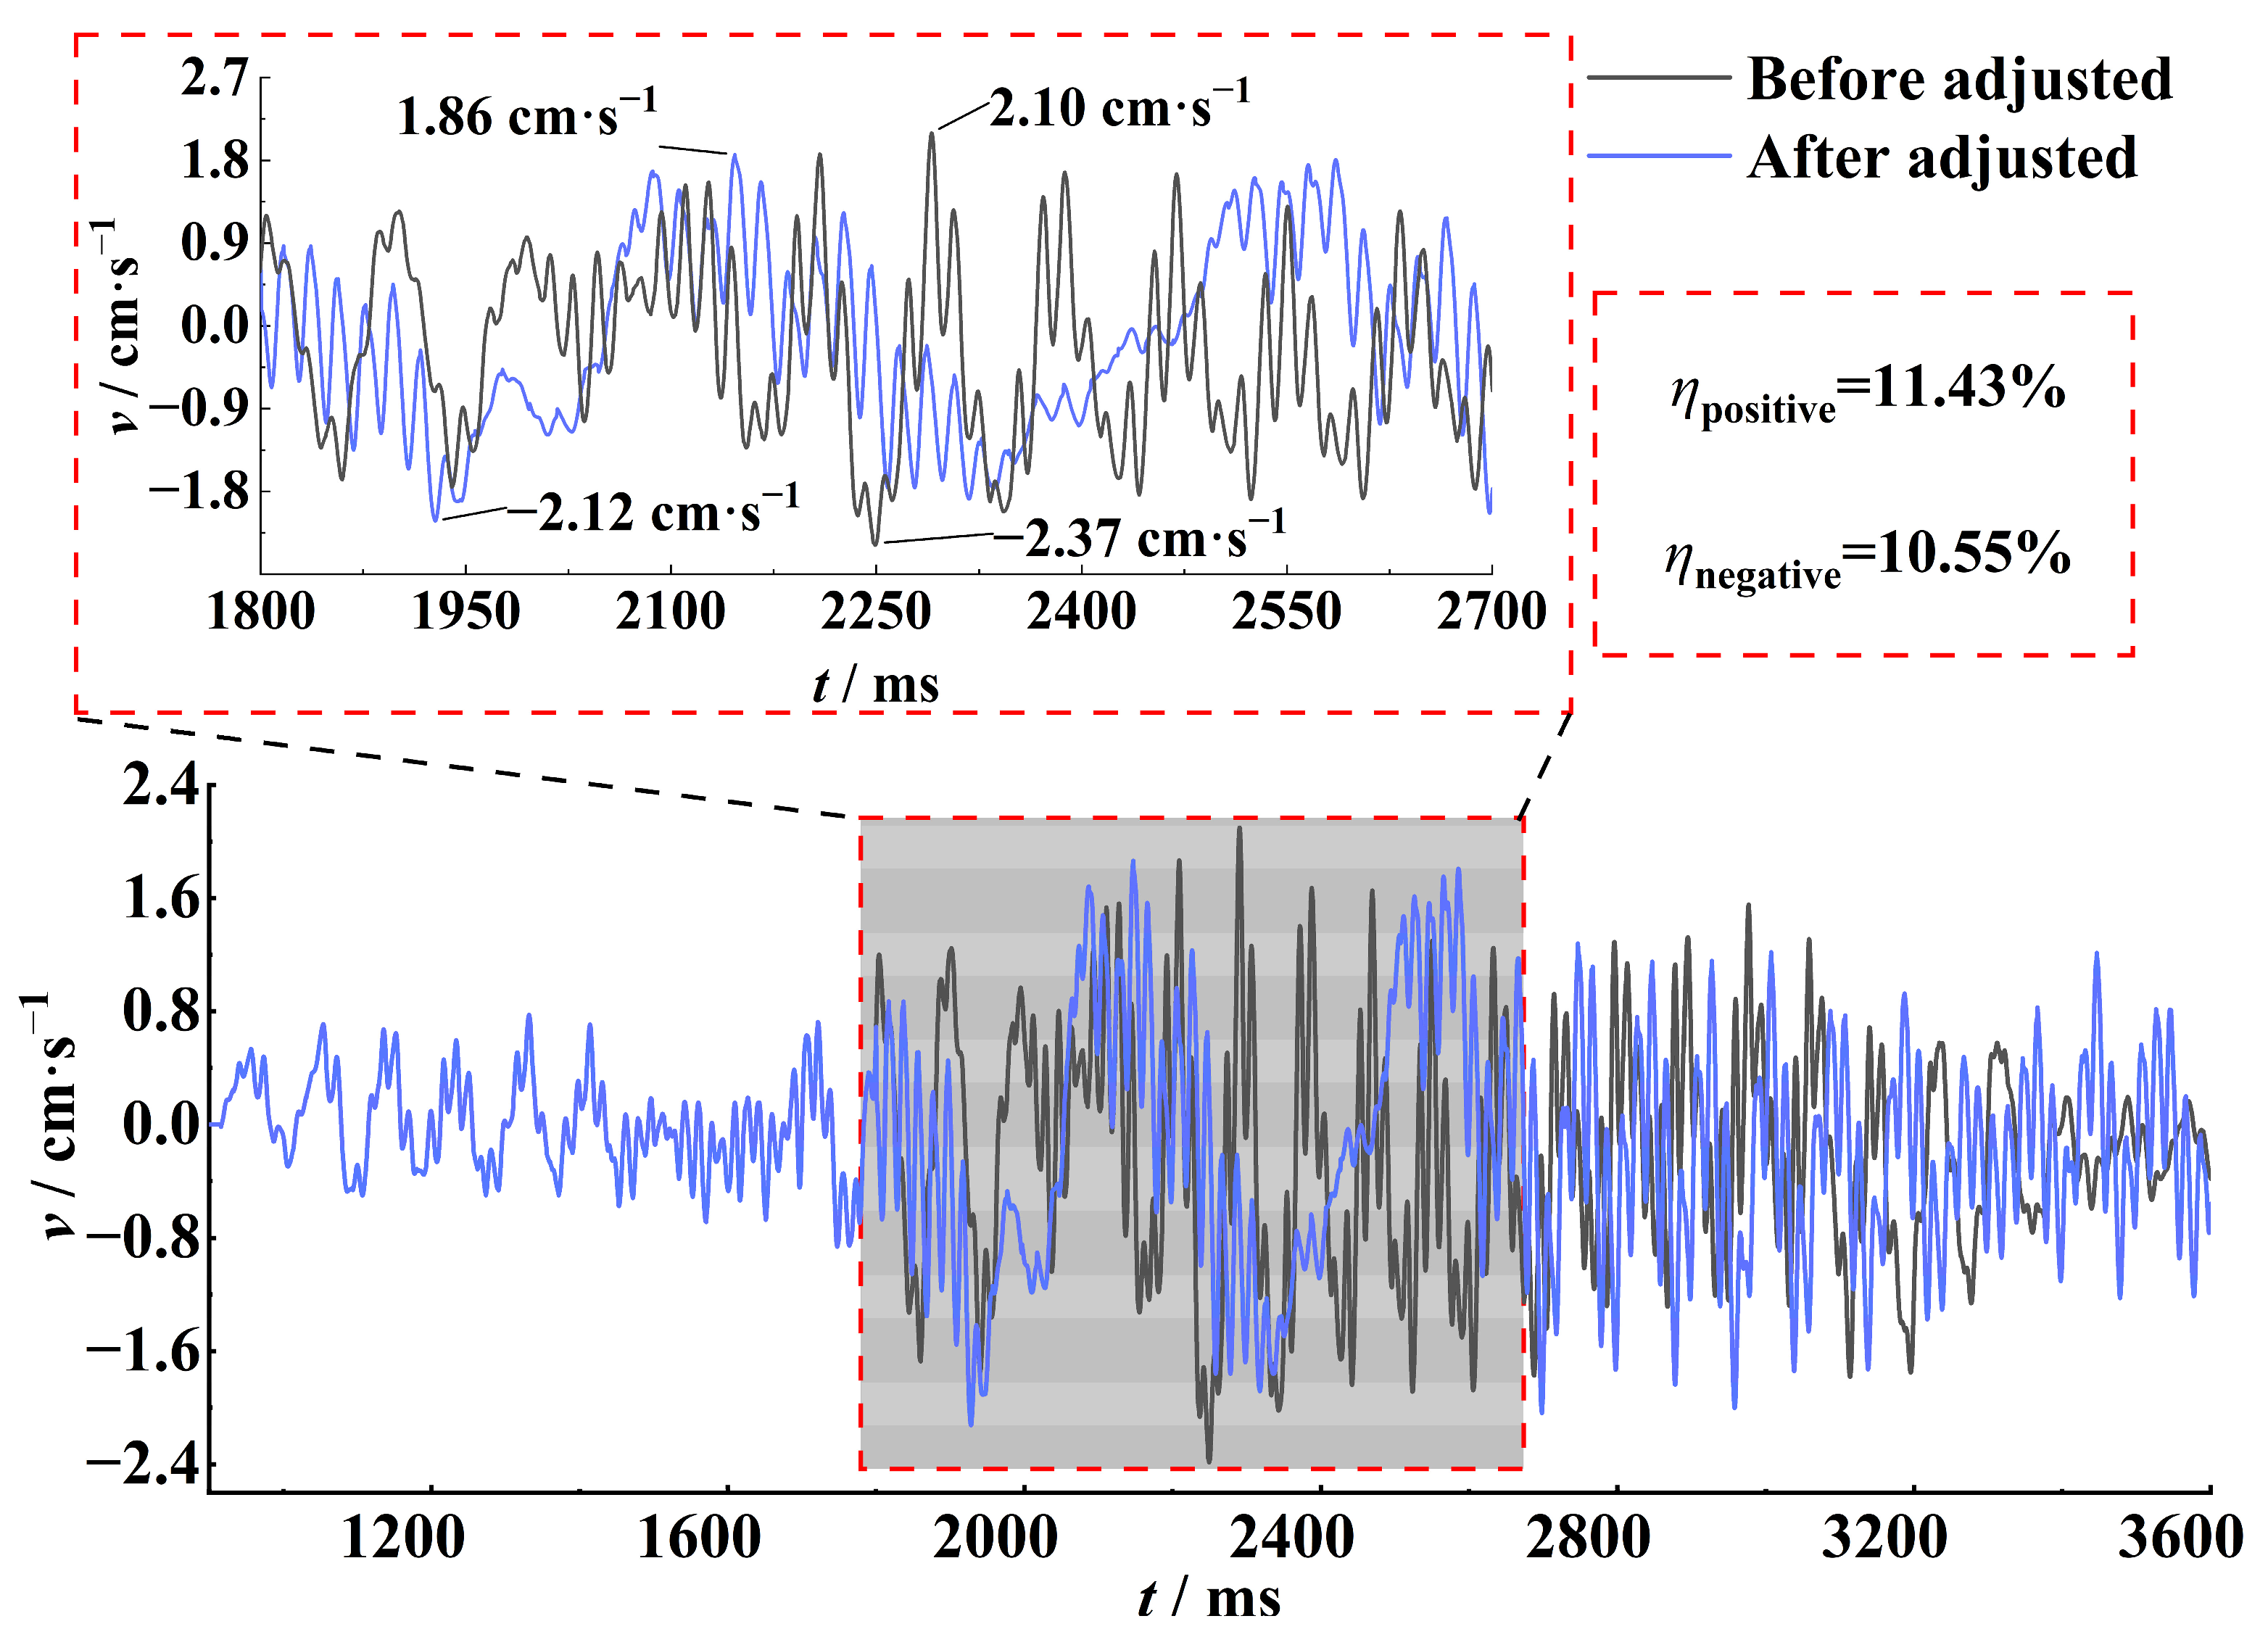
For vibration control at a single monitoring point, the number of wave arrivals within each fixed time interval is statistically analyzed based on the principle of wave arrival time sequence calculation. By identifying time intervals with a high number of simultaneous wave arrivals and their corresponding blast holes, the delay times of these holes are adjusted to effectively reduce the number of arriving vibration waves within these intervals, thereby significantly lowering the high-probability vibration hazard. Taking Monitoring Point B1 as an example in Section 3.2, within the time range of 1800 to 2670 ms, the number of vibration waves arriving at the monitoring point simultaneously after the adjustment decreased from 5 to less than 3. The peak value of the vibration decreased by more than 10.55%, and the RMS value decreased by 17.86%.
(3)
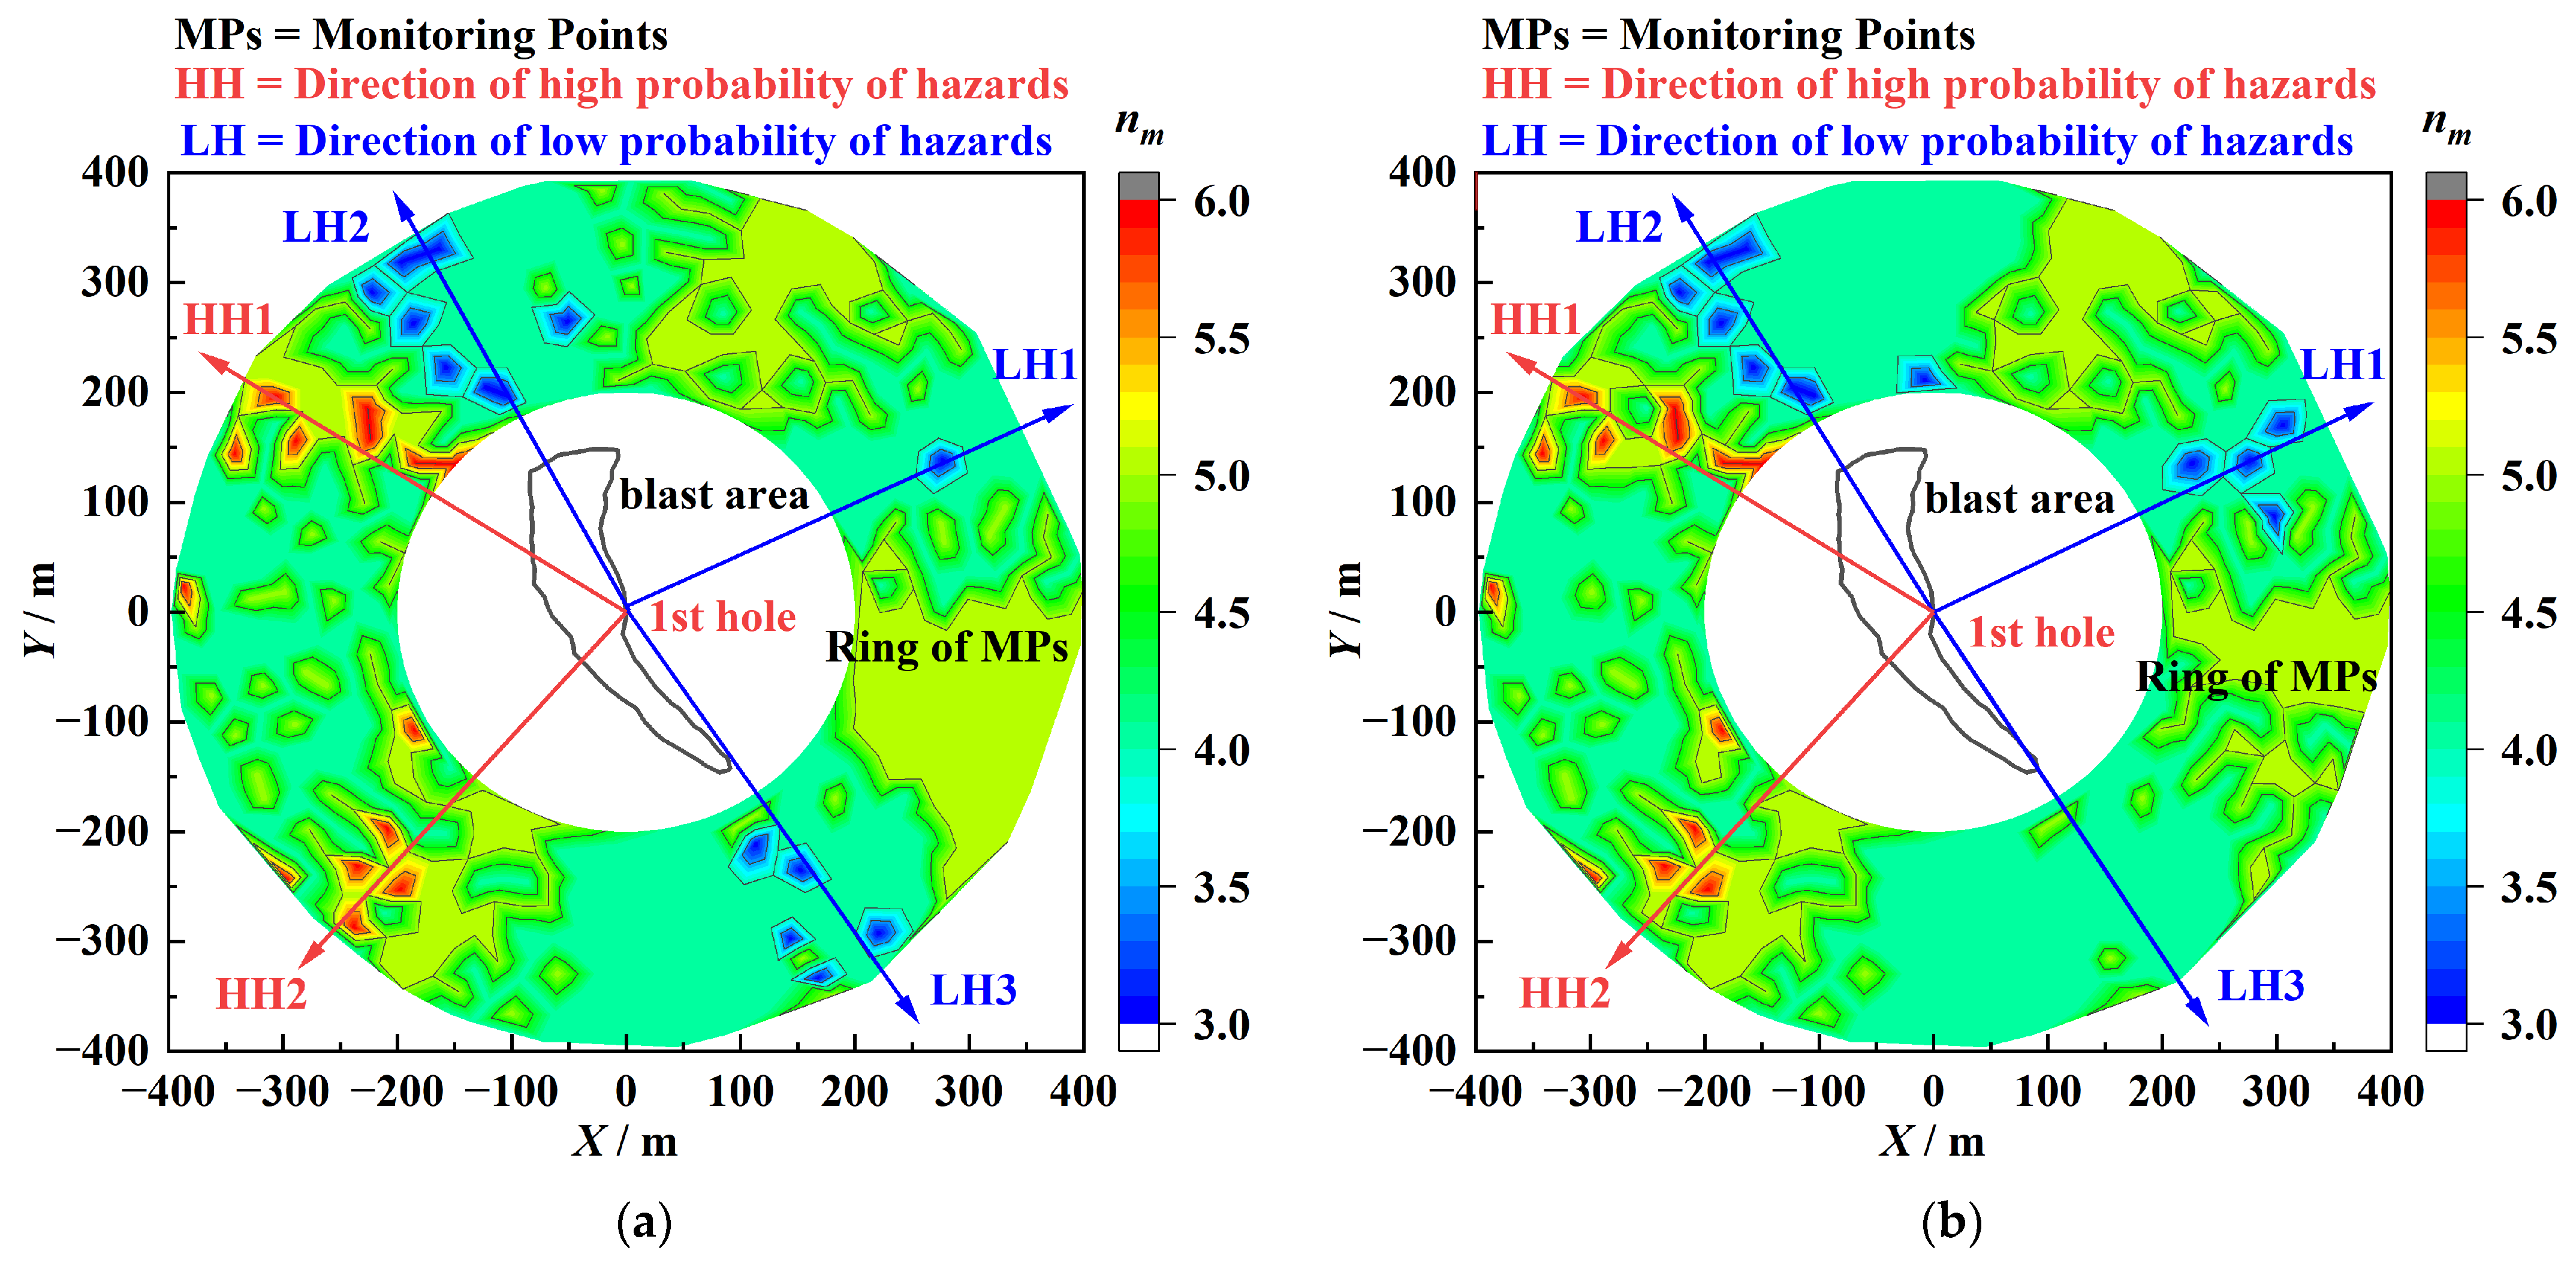
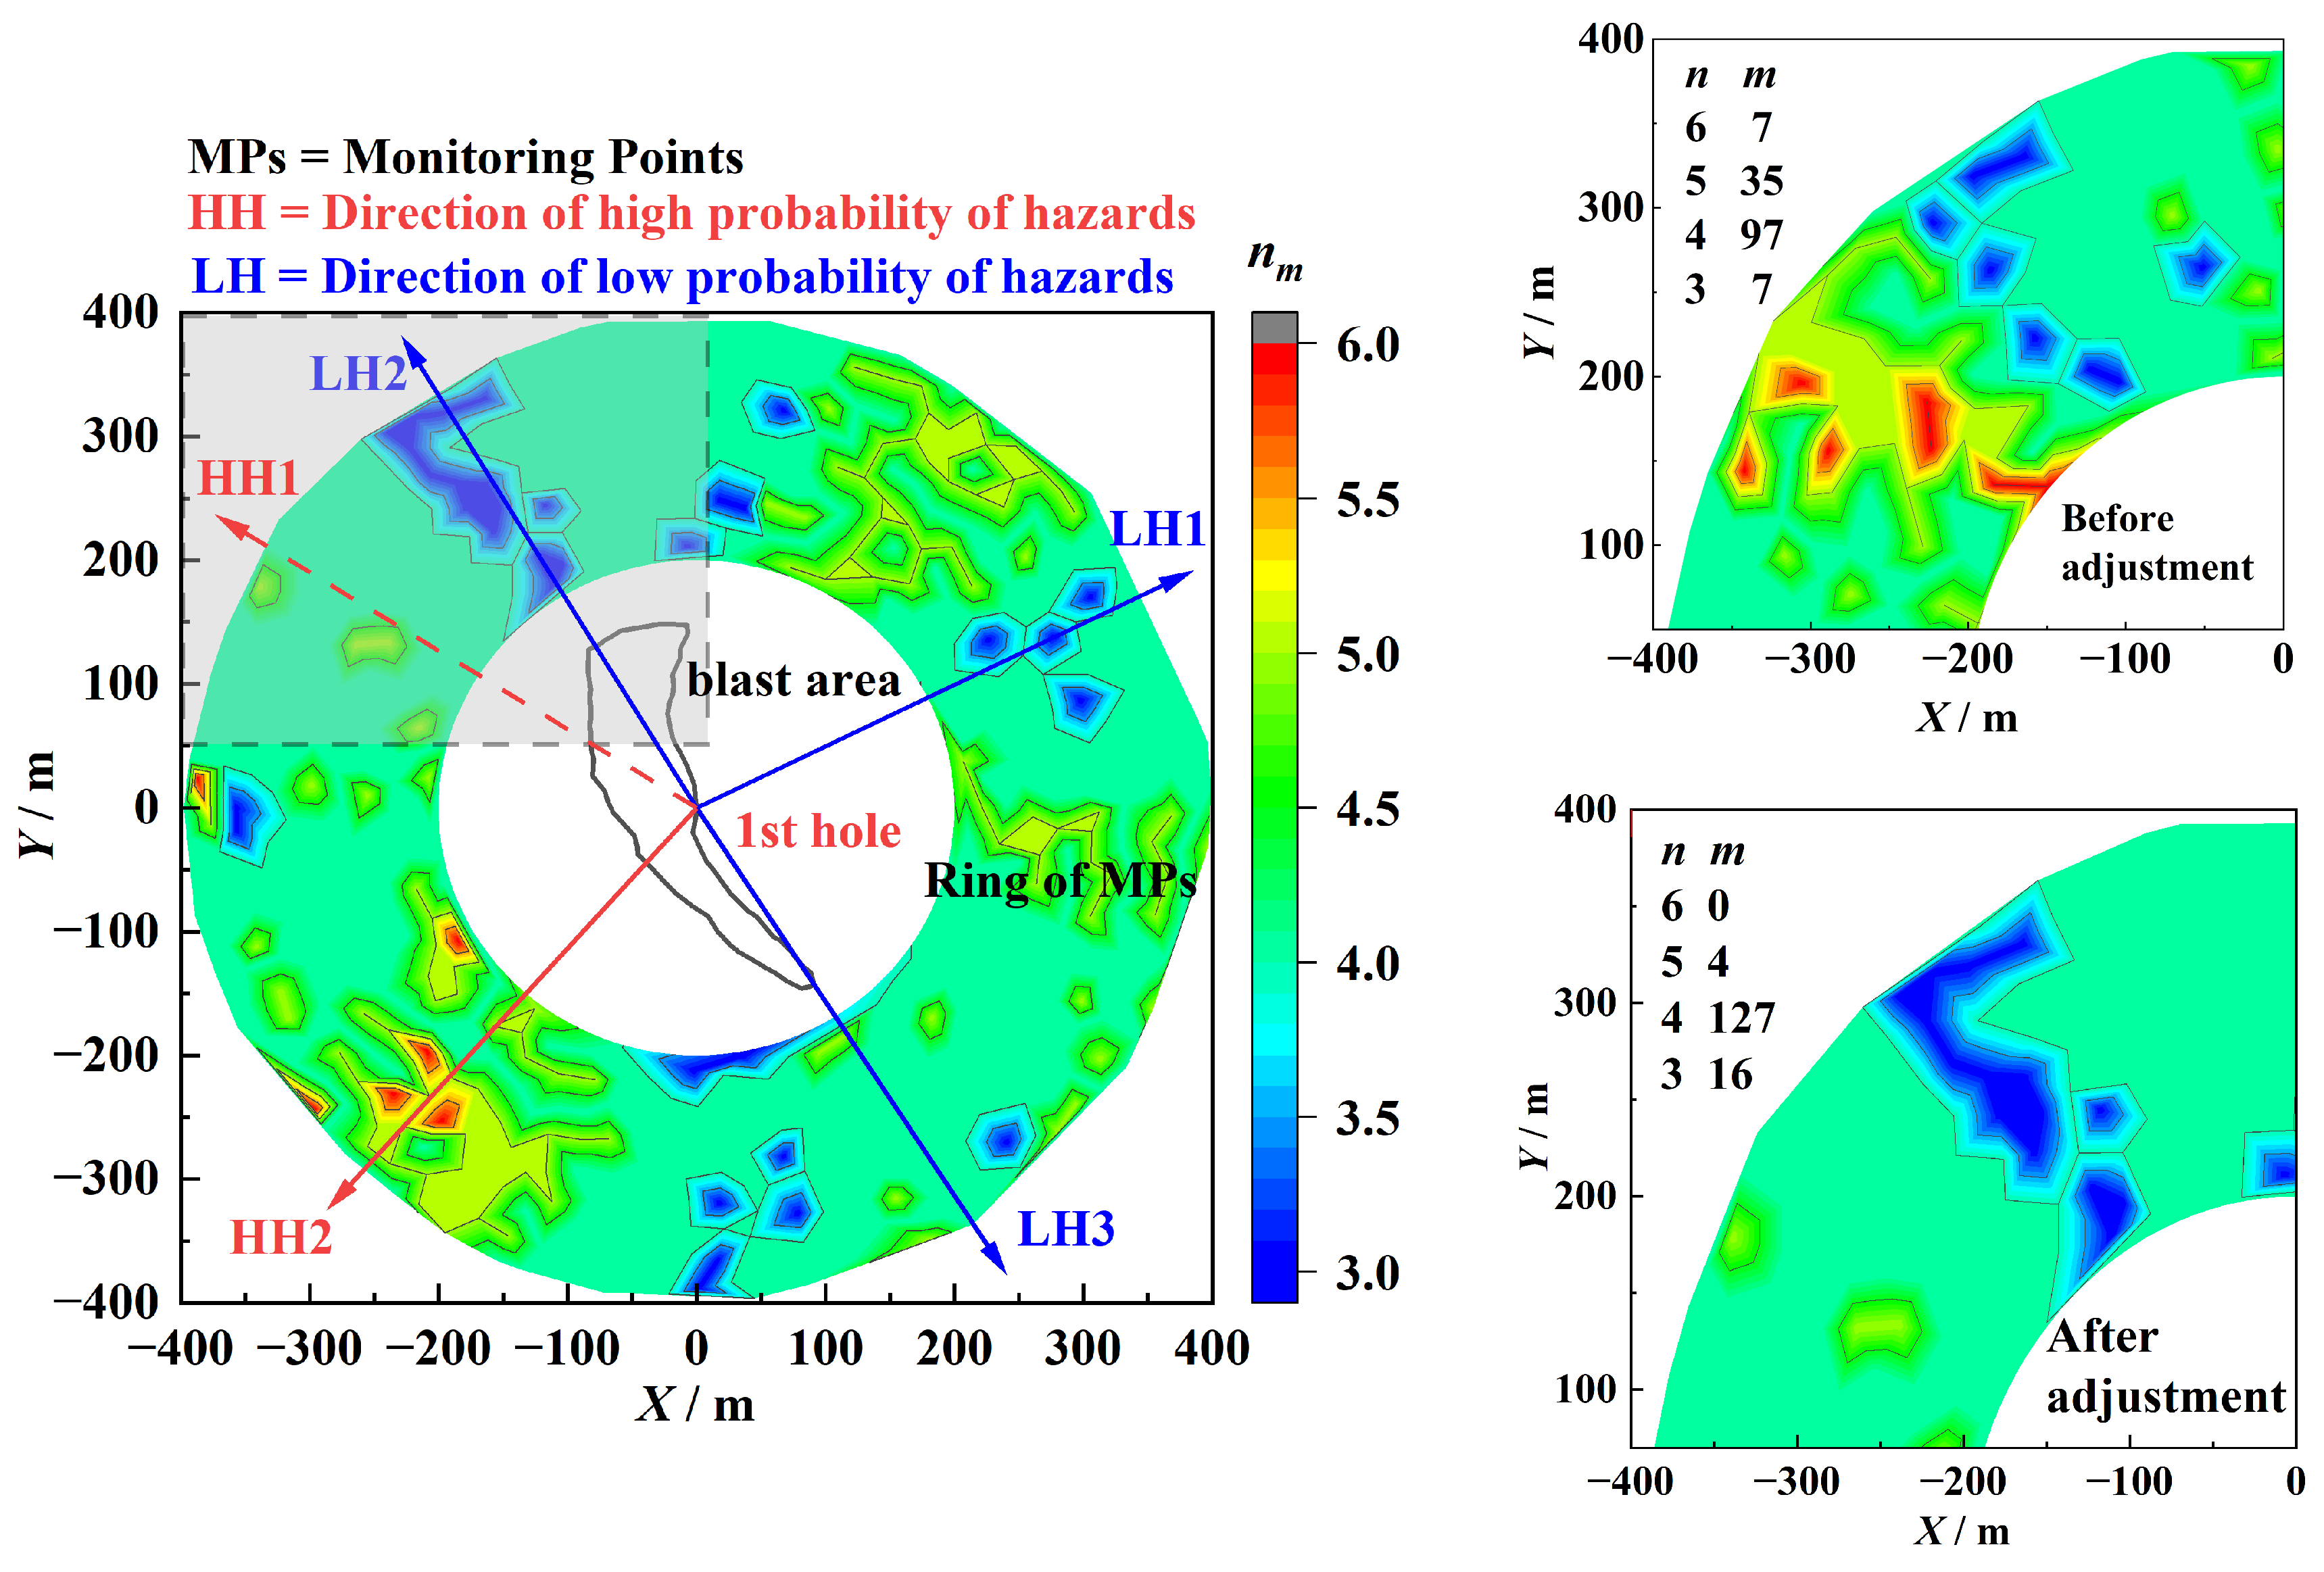
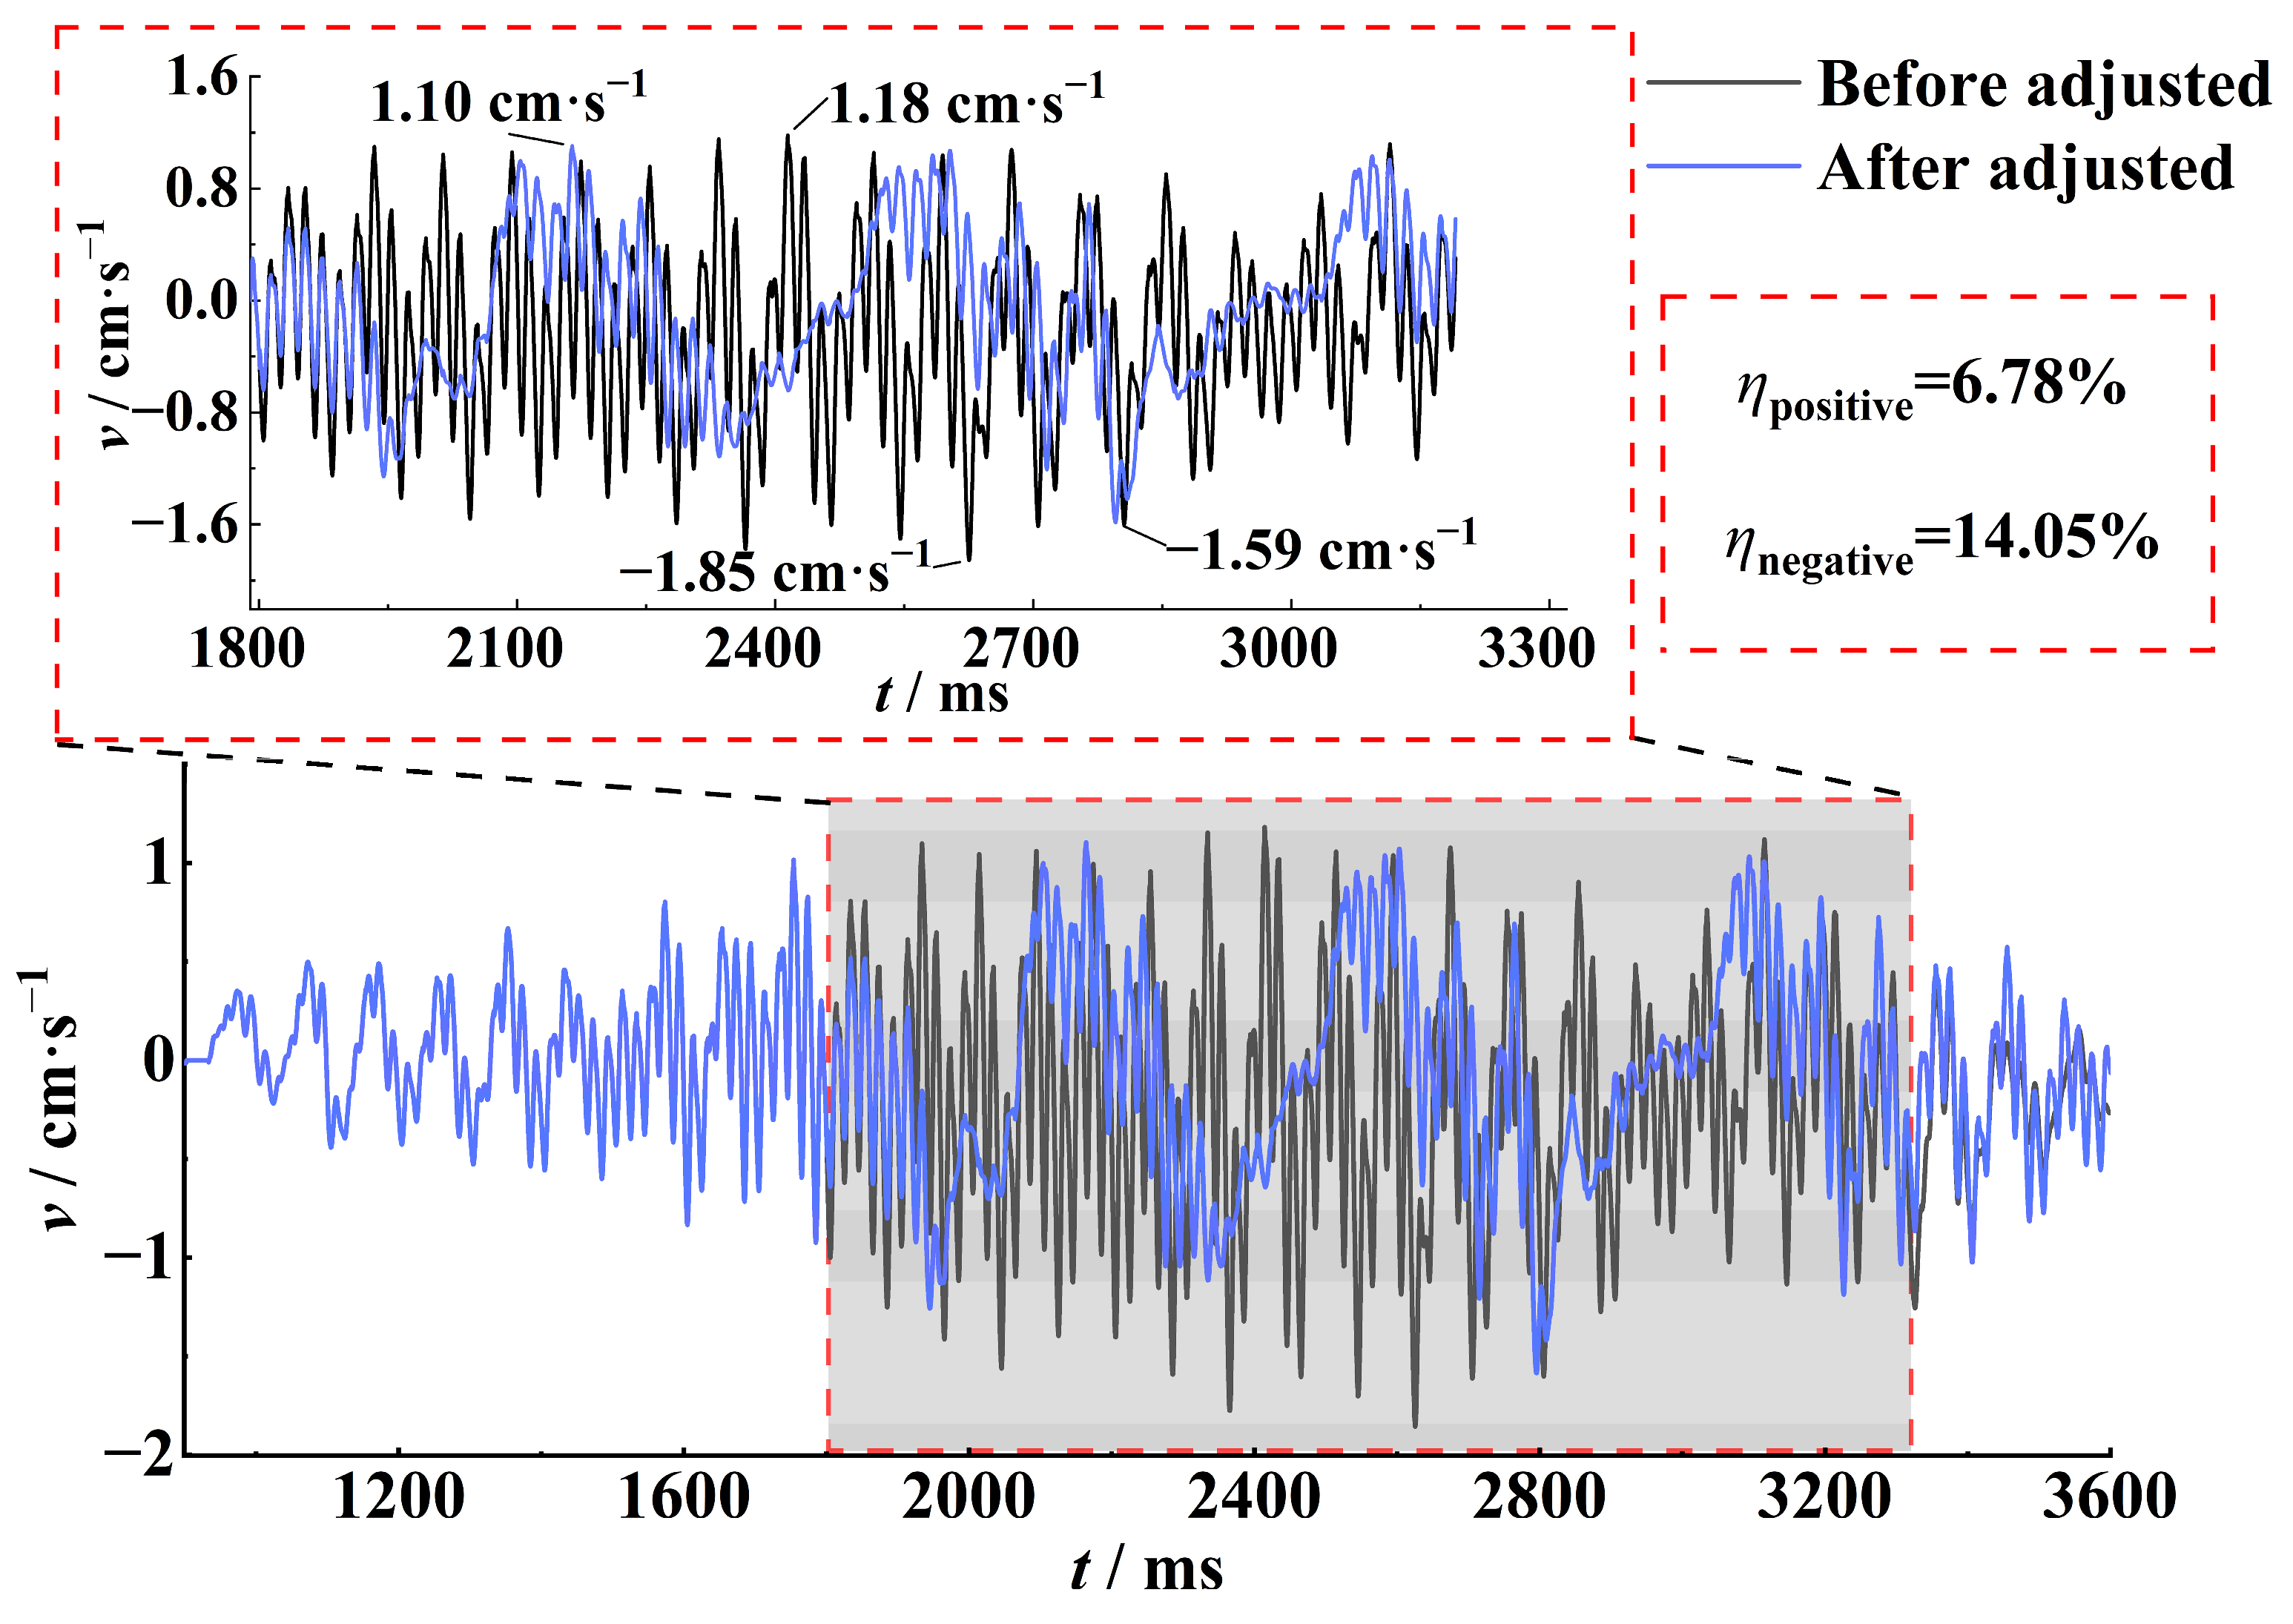
For vibration control across multiple monitoring points, the maximum number of simultaneous wave arrivals at each monitoring point is statistically analyzed based on the principle of wave arrival time sequence calculation. A precise identification method for high-probability vibration hazard locations around the blasting area is proposed, providing critical targets for vibration control. By identifying time intervals with a high number of wave arrivals and their corresponding blast holes at these locations, the number of arriving vibration waves within these intervals is sequentially reduced, successfully eliminating vibration hazards at these points. In Section 3.3, a total of 7 locations with a high probability of vibration hazards in 2 directions were identified around the experimental blasting area. Among these, the maximum number of vibration waves arriving simultaneously reached 6. Taking Monitoring Point A1 as an example, after the adjustment, all the locations with a high probability of vibration hazards were eliminated. The number of locations where the number of simultaneously arriving waves was 5 decreased by 88.57%. Following the delay adjustment, the peak superimposed vibration velocity was reduced by 14.05%, while the root mean square (RMS) velocity within the monitoring window (1800–3320 ms) decreased by 18.33%, corresponding to a 1.76 dB reduction and a 33.31% attenuation in vibrational energy. Effective control of blasting vibration in all directions around the blasting area was realized.
This method has wide applicability and practicality. When applying the vibration control method proposed in this paper, using electronic detonators has remarkable advantages in enhancing the control accuracy, and their initiation delay error can be as low as ±1 ms. After initially determining the delay time by relying on the vibration reduction technology through interference or the blasting synergy effect, by further applying this method and making local and meticulous adjustments to the delay, the coordinated vibration control at multiple monitoring positions can be realized. It is particularly crucial that this process is able to maintain the fragmentation effect of the original blasting plan to a large extent. Moreover, regardless of the geological conditions, as long as the corresponding basic data are obtained through on-site experiments, this method can be efficiently used to carry out vibration control work.

Author Contributions

Conceptualization, S.W. and M.G.; methodology, S.W. and M.G.; software, S.W. and H.W.; validation, S.W. and H.W.; formal analysis, S.W.; investigation, S.W. and H.W.; resources, H.W. and M.G.; data curation, S.W. and X.W.; writing—original draft preparation, S.W.; writing—review and editing, H.W. and M.G.; visualization, M.G.; supervision, X.W.; project administration, X.W.; funding acquisition, H.W. All authors have read and agreed to the published version of the manuscript.

Funding

This study was supported by the Young Elite Scientists Sponsorship Program by BAST (No. BYESS2023043).

Institutional Review Board Statement

Not applicable.

Informed Consent Statement

Not applicable.

Data Availability Statement

The raw data supporting the conclusions of this article will be made available by the authors on request.

Acknowledgments

The authors sincerely thank all the editors and reviewers for their support and help.

Conflicts of Interest

The authors declare no conflicts of interest.

References

  1. Leng, Z.; Fan, Y.; Gao, Q.; Hu, Y. Evaluation and optimization of blasting approaches to reducing oversize boulders and toes in open-pit mine. Int. J. Min. Sci. Technol. 2020, 30, 373–380. [Google Scholar] [CrossRef]
  2. Ozdemir, B.; Kumral, M. A system-wide approach to minimize the operational cost of bench production in open-cast mining operations. Int. J. Coal. Sci. Technol. 2019, 6, 84–94. [Google Scholar] [CrossRef]
  3. Kozan, E.; Liu, S. An operational-level multi-stage mine production timetabling model for optimally synchronising drilling, blasting and excavating operations. Int. J. Min. Reclam. Environ. 2017, 31, 457–474. [Google Scholar] [CrossRef]
  4. Dumakor-Dupey, N.; Arya, S.; Jha, A. Advances in blast-induced impact prediction—A review of machine learning applications. Minerals 2021, 11, 601. [Google Scholar] [CrossRef]
  5. Cardu, M.; Coragliotto, D.; Oreste, P. Analysis of predictor equations for determining the blast-induced vibration in rock blasting. Int. J. Min. Sci. Technol. 2019, 29, 905–915. [Google Scholar] [CrossRef]
  6. Nguyen, H.; Bui, X.; Tran, Q.; Nguyen, H.; Nguyen, D.; Hoa, L.; Le, Q. Prediction of ground vibration intensity in mine blasting using the novel hybrid MARS–PSO–MLP model. Eng. Comput. 2022, 38 (Suppl. 5), 4007–4025. [Google Scholar] [CrossRef]
  7. Yan, W.; Tham, L.; Yuen, K. Reliability of empirical relation on the attenuation of blast-induced vibrations. Int. J. Min. Sci. Technol. 2013, 59, 160–165. [Google Scholar] [CrossRef]
  8. Torres, V.; Silveira, L.; Lopes, P.; de Lima, H. Assessing and controlling of bench blasting-induced vibrations to minimize impacts to a neighboring community. J. Cleaner Prod. 2018, 187, 514–524. [Google Scholar] [CrossRef]
  9. Tian, X.; Song, Z.; Wang, J. Study on the propagation law of tunnel blasting vibration in stratum and blasting vibration reduction technology. Soil Dyn. Earthquake Eng. 2019, 126, 105813. [Google Scholar] [CrossRef]
  10. Yang, J.; Jiyong, C.; Chi, Y. Discussion on blasting vibration monitoring for rock damage control in rock slope excavation. Earthq. Eng. Eng. Vib. 2022, 21, 53–65. [Google Scholar]
  11. Guo, J.; Zhao, P.; Li, P. Prediction and optimization of blasting-induced ground vibration in open-pit mines using intelligent algorithms. Appl. Sci. 2023, 13, 7166. [Google Scholar] [CrossRef]
  12. Azizabadi, H.; Mansouri, H.; Fouché, O. Coupling of two methods, waveform superposition and numerical to model blast vibration effect on slope stability in jointed rock masses. Comput Geotech. 2014, 61, 42–49. [Google Scholar] [CrossRef]
  13. Mansouri, H.; EBRAHIMI, F. Blast vibration modeling using linear superposition method. J. Min. Environ. 2015, 125–140. [Google Scholar]
  14. Singh, C.; Agrawal, H.; Mishra, A. Frequency channeling: A concept to increase the frequency and control the PPV of blast-induced ground vibration waves in multi-hole blast in a surface mine. Bull. Eng. Geol. Environ. 2021, 80, 8009–8019. [Google Scholar] [CrossRef]
  15. Kumar, S.; Mishra, A.; Choudhary, B. Prediction of back break in blasting using random decision trees. Eng. Comput. 2022, 38 (Suppl. 2), 1185–1191. [Google Scholar] [CrossRef]
  16. Agrawal, H.; Mishra, A. An innovative technique of simplified signature hole analysis for prediction of blast-induced ground vibration of multi-hole production blast: An empirical analysis. Nat. Hazards. 2020, 100, 111–132. [Google Scholar] [CrossRef]
  17. Singh, C.; Agrawal, H.; Mishra, A.; Singh, P. Reducing environmental hazards of blasting using electronic detonators in a large opencast coal project-a case study. J. Mines. Met. Fuels. 2019, 67, 345–350. [Google Scholar]
  18. Silva, J.; Li, L.; Gernand, J. Reliability analysis for mine blast performance based on delay type and firing time. Int. J. Min. Sci. Technol. 2018, 28, 195–204. [Google Scholar] [CrossRef]
  19. Jayasinghe, B.; Zhao, Z.; Chee, A.; Zhou, H.; Gui, Y. Attenuation of rock blasting induced ground vibration in rock-soil interface. J. Rock. Mech. Geotech. 2019, 11, 770–778. [Google Scholar] [CrossRef]
  20. Garai, D.; Agrawal, H.; Mishra, A.; Kumar, S. Influence of initiation system on blast-induced ground vibration using random forest algorithm, artificial neural network, and scaled distance analysis. Math. Model. Eng. Probl. 2018, 5, 418–426. [Google Scholar] [CrossRef]
  21. Yu, C.; Yue, H.; Li, H.; Zuo, H.; Deng, S.; Liu, B. Study on the attenuation parameters of blasting vibration velocity in jointed rock masses. B. Eng. Geol. Environ. 2019, 78, 5357–5368. [Google Scholar] [CrossRef]
  22. Yang, N.; Zhang, L. Blasting vibration waveform prediction method based on superposition principle. Explo. Shock. Wave. 2012, 32, 84–90. (In Chinese) [Google Scholar]
  23. Gou, Y.; Shi, X.; Qiu, X.; Huo, X.; Yu, Z. Assessment of induced vibrations derived from the wave superposition in time-delay blasts. Int. J. Rock. Mech. Min. 2021, 144, 104814. [Google Scholar] [CrossRef]
  24. Garai, D.; Agrawal, H.; Mishra, A. Impact of orientation of blast initiation on ground vibrations. J. Rock. Mech. Geotech. 2023, 15, 255–261. [Google Scholar] [CrossRef]
  25. Segarra, P.; López, L.; Sanchidrián, J. Uncertainty in measurements of vibrations from blasting. Rock. Mech. Rock. Eng. 2012, 45, 1119–1126. [Google Scholar] [CrossRef]
  26. Yang, R.; Kay, D.; Kim, G. Case examples of sensor coupling effect on blast vibration measurement and charge weight scaling plot. In Proceedings of the ISEE Proceedings 40th Ann. Conference on Explosives and Blasting Technique, Denver, CO, USA, 9–12 February 2014. [Google Scholar]
  27. Birch, W.; Farnfield, R.; Hosein, S. Blast vibration monitoring & calibration in the 21st century. In Proceedings of the ISEE Proceedings 40th Ann. Conference on Explosives and Blasting Technique, Denver, CO, USA, 9–12 February 2014. [Google Scholar]
  28. Bui, X.; Nguyen, H.; Tran, Q.; Nguyen, D.; Bui, H. Predicting ground vibrations due to mine blasting using a novel artificial neural network-based cuckoo search optimization. Nat. Resour. Res. 2021, 30, 2663–2685. [Google Scholar] [CrossRef]
  29. Rodríguez, R.; de Marina, L.; Bascompta, M.; Lombardía, C. Determination of the ground vibration attenuation law from a single blast: A particular case of trench blasting. J. Rock. Mech. Geotech. Eng. 2021, 13, 1182–1192. [Google Scholar] [CrossRef]
  30. Ongen, T.; Karakus, D.; Konak, G.; Onur, A.H. Assessment of blast-induced vibration using various estimation models. J. Afr. Earth. Sci. 2018, 145, 267–273. [Google Scholar] [CrossRef]
  31. Shi, X.; Chen, S. Delay time optimization in blasting operations for mitigating the vibration-effects on final pit walls’ stability. Soil Dyn. Earthquake Eng. 2011, 31, 1154–1158. [Google Scholar] [CrossRef]
  32. Rezaeineshat, A.; Monjezi, M.; Mehrdanesh, A. Optimization of blasting design in open pit limestone mines with the aim of reducing ground vibration using robust techniques. Geomech. Geophys. Geo-Energ. Geo-Resour. 2020, 6, 40. [Google Scholar] [CrossRef]
  33. Li, P.; Lu, W.; Wu, X.; Chen, M.; Yan, P.; Hu, Y. Spectral prediction and control of blast vibrations during the excavation of high dam abutment slopes with millisecond-delay blasting. Soil Dyn. Earthquake Eng. 2017, 94, 116–124. [Google Scholar] [CrossRef]
  34. Li, S.; Liang, S.; Lu, J. Study on internal vibration law and vibration reduction of xiaoxiku tunnel blasting. Geofluids 2022, 2022, 7650784. [Google Scholar] [CrossRef]
  35. Aldas, G.; Ecevitoglu, B. Waveform analysis in mitigation of blast-induced vibrations. J. Appl. Geophys. 2008, 66, 25–30. [Google Scholar] [CrossRef]
Figure 1. Schematic of vibration waves arriving at the monitoring point during a fixed period. (a) Single-hole wave. (b) Multiple single-hole waves arriving within the same time window.
Applsci 15 04641 g001
Figure 2. Schematic of vibration wave separation during clustering arrival periods. (a) Simultaneous arrival. (b) Δt-interval arrival.
Applsci 15 04641 g002
Figure 3. Omni-directional vibration control method for the blast area.
Applsci 15 04641 g003
Figure 4. Location of the experimental blast area and drilled holes.
Applsci 15 04641 g004
Figure 5. Schematic of the detonation network and test blast hole locations.
Applsci 15 04641 g005
Figure 6. Schematic of blast vibration monitoring points.
Applsci 15 04641 g006
Figure 7. Time of arrival of the vibration waves from each hole at monitoring point B1. (a) Hole-5~84. (b) Hole-85~168. (c) Hole-169~252. (d) Hole-253~338.
Applsci 15 04641 g007
Figure 8. Vibration curves at monitoring point B1. (a) Single-hole measured curve. (b) Multi-hole measured and predicted curves.
Applsci 15 04641 g008
Figure 9. Statistics of wave arrival counts at each monitoring point during different time periods.
Applsci 15 04641 g009
Figure 10. Blast hole locations with simultaneous wave arrivals.
Applsci 15 04641 g010
Figure 11. Wave arrival counts at monitoring point B1 in fixed time intervals after adjustment.
Applsci 15 04641 g011
Figure 12. Comparison of predicted vibration curves before and after adjustment.
Applsci 15 04641 g012
Figure 13. Distribution of maximum simultaneous wave arrival counts at monitoring points in the annular blasting area. (a) Before adjustment. (b) After adjustment.
Applsci 15 04641 g013
Figure 14. Distribution of maximum simultaneous wave arrival counts at monitoring points in the annular blasting area based on initiation sequence adjustment at monitoring point A1 and A2.
Applsci 15 04641 g014
Figure 15. Comparison of predicted vibration curves before and after adjustment.
Applsci 15 04641 g015
Disclaimer/Publisher’s Note: The statements, opinions and data contained in all publications are solely those of the individual author(s) and contributor(s) and not of MDPI and/or the editor(s). MDPI and/or the editor(s) disclaim responsibility for any injury to people or property resulting from any ideas, methods, instructions or products referred to in the content.

