Abstract
In a construction industry characterized by rapid change and increasing complexity, traditional labor-intensive methods of structural safety inspection suffer from numerous limitations, including low productivity, extended project duration, and high costs. Accuracy and speed are particularly vital for safety diagnosis in older structures, fire-damaged buildings, and large-scale facilities, yet conventional methods heavily rely on human expertise, leading to variability and potential unreliability of results. This study quantitatively assessed the productivity improvements and economic benefits of integrating terrestrial laser scanning (TLS) and building information modeling (BIM) into the structural safety assessment process. Both the conventional visual inspection and the TLS-based approach were treated as production systems, and queueing theory was employed to analyze waiting times, service rates, and costs. The analysis of three real-world projects revealed that the TLS-based 3D scanning reverse modeling method reduces total project costs—including survey duration, labor input, as well as service and waiting costs—by about 80–89% compared to the visual inspection method. Additionally, the return on investment (ROI) at the project level varies from approximately 12% to 136%, and when applied to multiple projects at the company level, the overall ROI reaches about 162%, demonstrating the long-term economic benefits of adopting digital technology. These findings suggest that TLS-3D scanning reverse modeling in the construction industry has substantial potential in terms of productivity gains and economic impact.
1. Introduction
Due to the rapidly changing construction industry environment and increasing project complexity, the traditional manpower-oriented production method is exposed to various problems, such as low productivity, long periods of labor, and high costs [1,2]. In particular, structural safety diagnosis performed during the maintenance phase is essential for quick and precise investigation of old facilities, large-scale factory facilities, and fire-damaged buildings, but the accuracy and reliability of the results vary depending on the skill level of personnel and work deviations [3]. As a result, the construction industry is increasingly attempting to overcome the limitations of traditional methods by incorporating digital technologies (e.g., digital twins, terrestrial laser scanning, BIM, etc.) into the construction production process [4].
Globally, the construction industry remains highly dependent on labor, and its productivity lags behind other sectors, such as manufacturing, due to the multi-level collaborative structure at project sites [5]. In particular, the field of structural safety diagnostics requires a lot of manpower, accuracy, and long survey periods to assess the safety of old facilities or investigate damage caused by disasters, such as fires and earthquakes. Recent studies have proposed image-based assessment automation [6], deep learning-based damage identification [7], etc., to address these issues. In this situation, digital technologies, such as terrestrial laser scanning (TLS) and building information modeling (BIM) have been attracting attention as a way to replace and complement existing safety diagnosis methods [8]. TLS enables precise scanning of large-scale or hazardous areas without using humans to obtain three-dimensional point cloud data [9,10], which can be linked to structural analysis and quantity take-off in a BIM environment, enabling much faster and more accurate investigations than before [11]. However, previous studies have focused on the technical or qualitative benefits of these digital technologies, while quantitative analyses of the economic benefits (e.g., construction time savings due to shorter survey periods, labor costs, additional work costs, equipment rental costs, etc.) have been limited [12,13].
As a result, in order for companies or public organizations to decide whether to adopt digital technologies, evidence of economic benefits as well as technical validity is essential [14,15]. This paper aims to quantitatively analyze how much productivity improvement and economic performance can be achieved by introducing terrestrial laser scanning (TLS) and building information modeling (BIM) into the structural safety diagnosis process among these digital transformation trends. To achieve this objective, both the traditional visual and TLS-based inspection methods are treated as production systems, and their detailed work processes are compared using mathematical models. By calculating the return on investment (ROI) at the project and company levels, a basis is established for various stakeholders in the construction industry (e.g., engineering firms, general contractors, owners) to determine the suitability of adopting TLS-based 3D scanning reverse modeling methods. The approach proposed in this study demonstrates the potential for the economic transformation of the labor-intensive structural safety diagnosis process and suggests its applicability to the entire construction cycle, including design, construction, maintenance, and demolition.
2. Materials and Methods
To ensure a comprehensive understanding of both conventional and digital methods for structural safety diagnosis, a systematic literature review was conducted. Several academic databases and search engines—namely Scopus, Web of Science, and Google Scholar—were used to gather relevant publications. These platforms were chosen for their broad coverage of peer-reviewed journals, conference proceedings, and technical reports in the architecture, engineering, and construction (AEC) domain.
2.1. Challenges in Structural Safety Diagnosis
Structural safety diagnosis is a key process for evaluating the structural soundness of buildings and infrastructure facilities to identify potential risk factors in advance and prepare appropriate maintenance measures [16]. Especially in old buildings, disaster-damaged facilities, such as those impacted by fire and earthquakes, and large factory facilities (e.g., pipe racks, conveyor belts, etc.), it is necessary to minimize facility safety and economic losses through rapid diagnosis [3,17]. Most structural safety diagnostics evaluate the condition of a facility through a first visual inspection and a second detailed inspection [18,19,20]. Since the visual inspection process is highly dependent on the competence of the expert, there is high variability in the results depending on the skill and experience level of the inspector [18,21]. In addition, in old facilities or disaster sites with a large survey area, it is difficult to survey all areas [22], and the risk of safety accidents when entering hazardous areas increases, which limits manpower input [3].
Conventional methods require sample-based inspections, visual assessments, and, if necessary, partial dismantling inspections, resulting in long inspection periods and high labor requirements [23]. This increases the cost burden incurred during the maintenance phase and can lead to construction delays and additional costs when repairing fire damage or improving old facilities [24,25]. In the case of old facilities, there are many cases where construction drawings or structural change history information are not properly managed [26]. This lack of data leads to frequent iterations and uncertainties during the inspection process and makes it difficult to reliably diagnose facilities in the long term [3,22].
Compared to labor-based methods, introducing digital-based hardware and software, such as TLS or BIM, and training the workforce requires significant upfront costs [27,28]. Construction companies are hesitant to adopt new equipment or technologies due to high costs and uncertainty of payback [29,30,31], technical limitations [27], and cultural barriers in the construction industry [31,32]. In addition, the manpower-based structural safety inspection process suffers from problems, such as manpower-centered inspection methods [33], long-term increases in manpower and duration [3], the inefficiency of information management [34], and a lack of economic validation [35]. In conclusion, the problems faced in structural safety diagnosis are economic efficiency and information uncertainty. In addition, the human-based visual inspection method is accompanied by labor input and long-term cost increase, so it is essential to verify the economic efficiency of the digital technologies that aim to replace or complement it.
2.2. TLS-Based 3D Scanning Reverse Modeling Process
In the construction industry, digitalization is progressing along several axes, including 4D/5D BIM [36,37], RFID [38], and the use of drones/robots [39]. Two technologies that have gained particular attention in the field of structural safety inspection are TLS and BIM [3,35].
TLS is a technology that uses a laser scanner to acquire three-dimensional point cloud data of the surrounding environment or facility. By rotating the scanner in the field, it emits and receives lasers to accumulate a large number of coordinate values of the corresponding points [40,41,42]. In the process, high-precision, high-resolution data can be obtained quickly, which can significantly reduce the manpower and time required for the safety diagnosis of large-scale facilities that would otherwise be time-consuming if assessed using visual inspection [43]. TLS has been applied in a variety of fields, including displacement monitoring of large structures, such as underground structures and tunnels [44], bridges [8], and older buildings [3], and for as-built modeling [8,10] and quality inspection [45]. In particular, Ham and Lee [3] reported a case of utilizing scanners on an old building, which resulted in a 4-month construction period reduction, 125 man-hours saved, and 50% cost savings compared to traditional construction methods. However, technical and economic barriers exist, including equipment price, field-of-view issues when scanning in the field, and the need for noise removal and data post-processing [46,47]. In addition, the availability of software and experts to manage and analyze large-scale point cloud data is also an essential factor to consider.
BIM is a system that manages the physical and functional information of a facility as a digital model. BIM provides a digital platform to support decision making throughout the entire life cycle of a building, including its design, construction, operation, maintenance, and demolition [48,49,50,51]. When 3D point cloud data scanned with TLS are linked to a BIM platform, it is possible to quantitatively compare displacements or damage conditions and to automatically calculate repair and reinforcement quantities [52,53]. By comparing aging steel structures with BIM models, corrosion areas, deformed spans, etc., can be visually identified, which improves the speed and accuracy compared to traditional 2D drawing-based methods [13,54]. However, the initial investment is high, including the acquisition of BIM experts, software license costs, and the additional workload required to transition from traditional 2D drawings to 3D models [55,56]. In addition, it is also pointed out that BIM data compatibility is poor due to the different work standards across sites and companies [55].
Although the combination of TLS and BIM can be expected to have strong synergies in the structural safety diagnosis process, there is insufficient evidence to demonstrate the economic benefits in terms of investment costs in real projects [13,57]. Tang et al. [58] estimated the labor cost reduction effect of applying TLS in a building quality assessment, but the case study was limited to a single project, which limits the generalizability of the results. Therefore, it is necessary to verify the long-term ROI through multiple project cases, cumulative analysis at the company level, etc.
2.3. Economic Analysis of TLS-Based 3D Scanning Reverse Modeling
The introduction of digital technology in the construction industry is not just a matter of verifying the technical feasibility of new equipment or software but must also be followed by an economic feasibility assessment from the perspective of corporate investment decisions. The following methodologies are typically used.
A cost–benefit analysis (CBA) compares and analyzes the expected benefits and costs of technology adoption in monetary terms [35,59]. Life cycle cost (LCC) is a method of evaluating by calculating all costs incurred during the life cycle of a facility from the planning stage to the disposal stage [60,61]. It is mainly used to analyze the economics of modular construction [62] and energy-saving [63,64], but can also be applied to estimate the long-term costs and benefits of adopting construction technologies [65]. Return on investment (ROI) is a basic indicator used to evaluate investment performance as the ratio of profit from an investment divided by the cost of the investment [66,67,68]. Existing economic evaluation methodologies are macro-evaluation methodologies, and they are limited in analyzing resource efficiency and process changes due to changes in detailed work processes caused by the introduction of digital technology for structural safety diagnosis.
To supplement this, it is necessary to analyze changes in the detailed work processes of structural safety diagnosis before and after the introduction of digital technology and to simulate the process at the stage before performing an economic analysis for the adoption of new technology.
In the construction industry, CYCLONE [69,70], RESQUE [70], and STROBOSCOPE [71] and various simulation techniques have been developed to pursue workflow and resource optimization. Previous studies have focused on the movement or placement of resources, making it easy to treat the entire process from a macro-perspective. On the other hand, the application of queueing theory is effective for analyzing the construction production system from a microscopic perspective and quantitatively understanding resource allocation issues, especially production system optimization [72], resource efficiency [73], and process optimization [74].
The queueing model models the interaction process between the customer (e.g., work, quantity) and the server (e.g., labor, equipment) through a probabilistic or deterministic distribution from the perspective of “arrival-waiting-service” [75]. This allows for the intuitive identification of bottlenecks in the process of various fields [76] and the establishment of resource allocation strategies [77,78]. By quantifying the waiting time and service time that occur at points where the process does not proceed smoothly [78], project managers can accurately identify insufficient resources and decide on additional deployment. It is also advantageous for comparing and analyzing productivity changes before and after the introduction of a technology transition with a relatively constant work rate.
In the construction sector, research using queuing models has been conducted steadily. There are studies where the number of concrete pump trucks was optimized [79], where BIM RFI data were considered as a customer to evaluate the service rate of personnel [80], or where the optimal number of pouring teams was calculated when pouring foundation concrete [81]. These studies prove that the queueing theory is useful for reducing unnecessary waiting time at construction sites and minimizing service costs and construction period delays. In particular, as the speed of work processing in construction projects decreases with the spread of digitalization, the value of using distribution methods, such as the M/D/1 model of queueing, is increasing.
Therefore, this study will compare and analyze the detailed work processes before and after the introduction of digital technology, and based on this, a quantitative simulation will be conducted using a queueing model. Based on the results of this simulation, the economic value of adopting new digital technology in the labor-intensive structural safety diagnosis business will be evaluated.
2.4. Research Methodology
2.4.1. Overall Framework
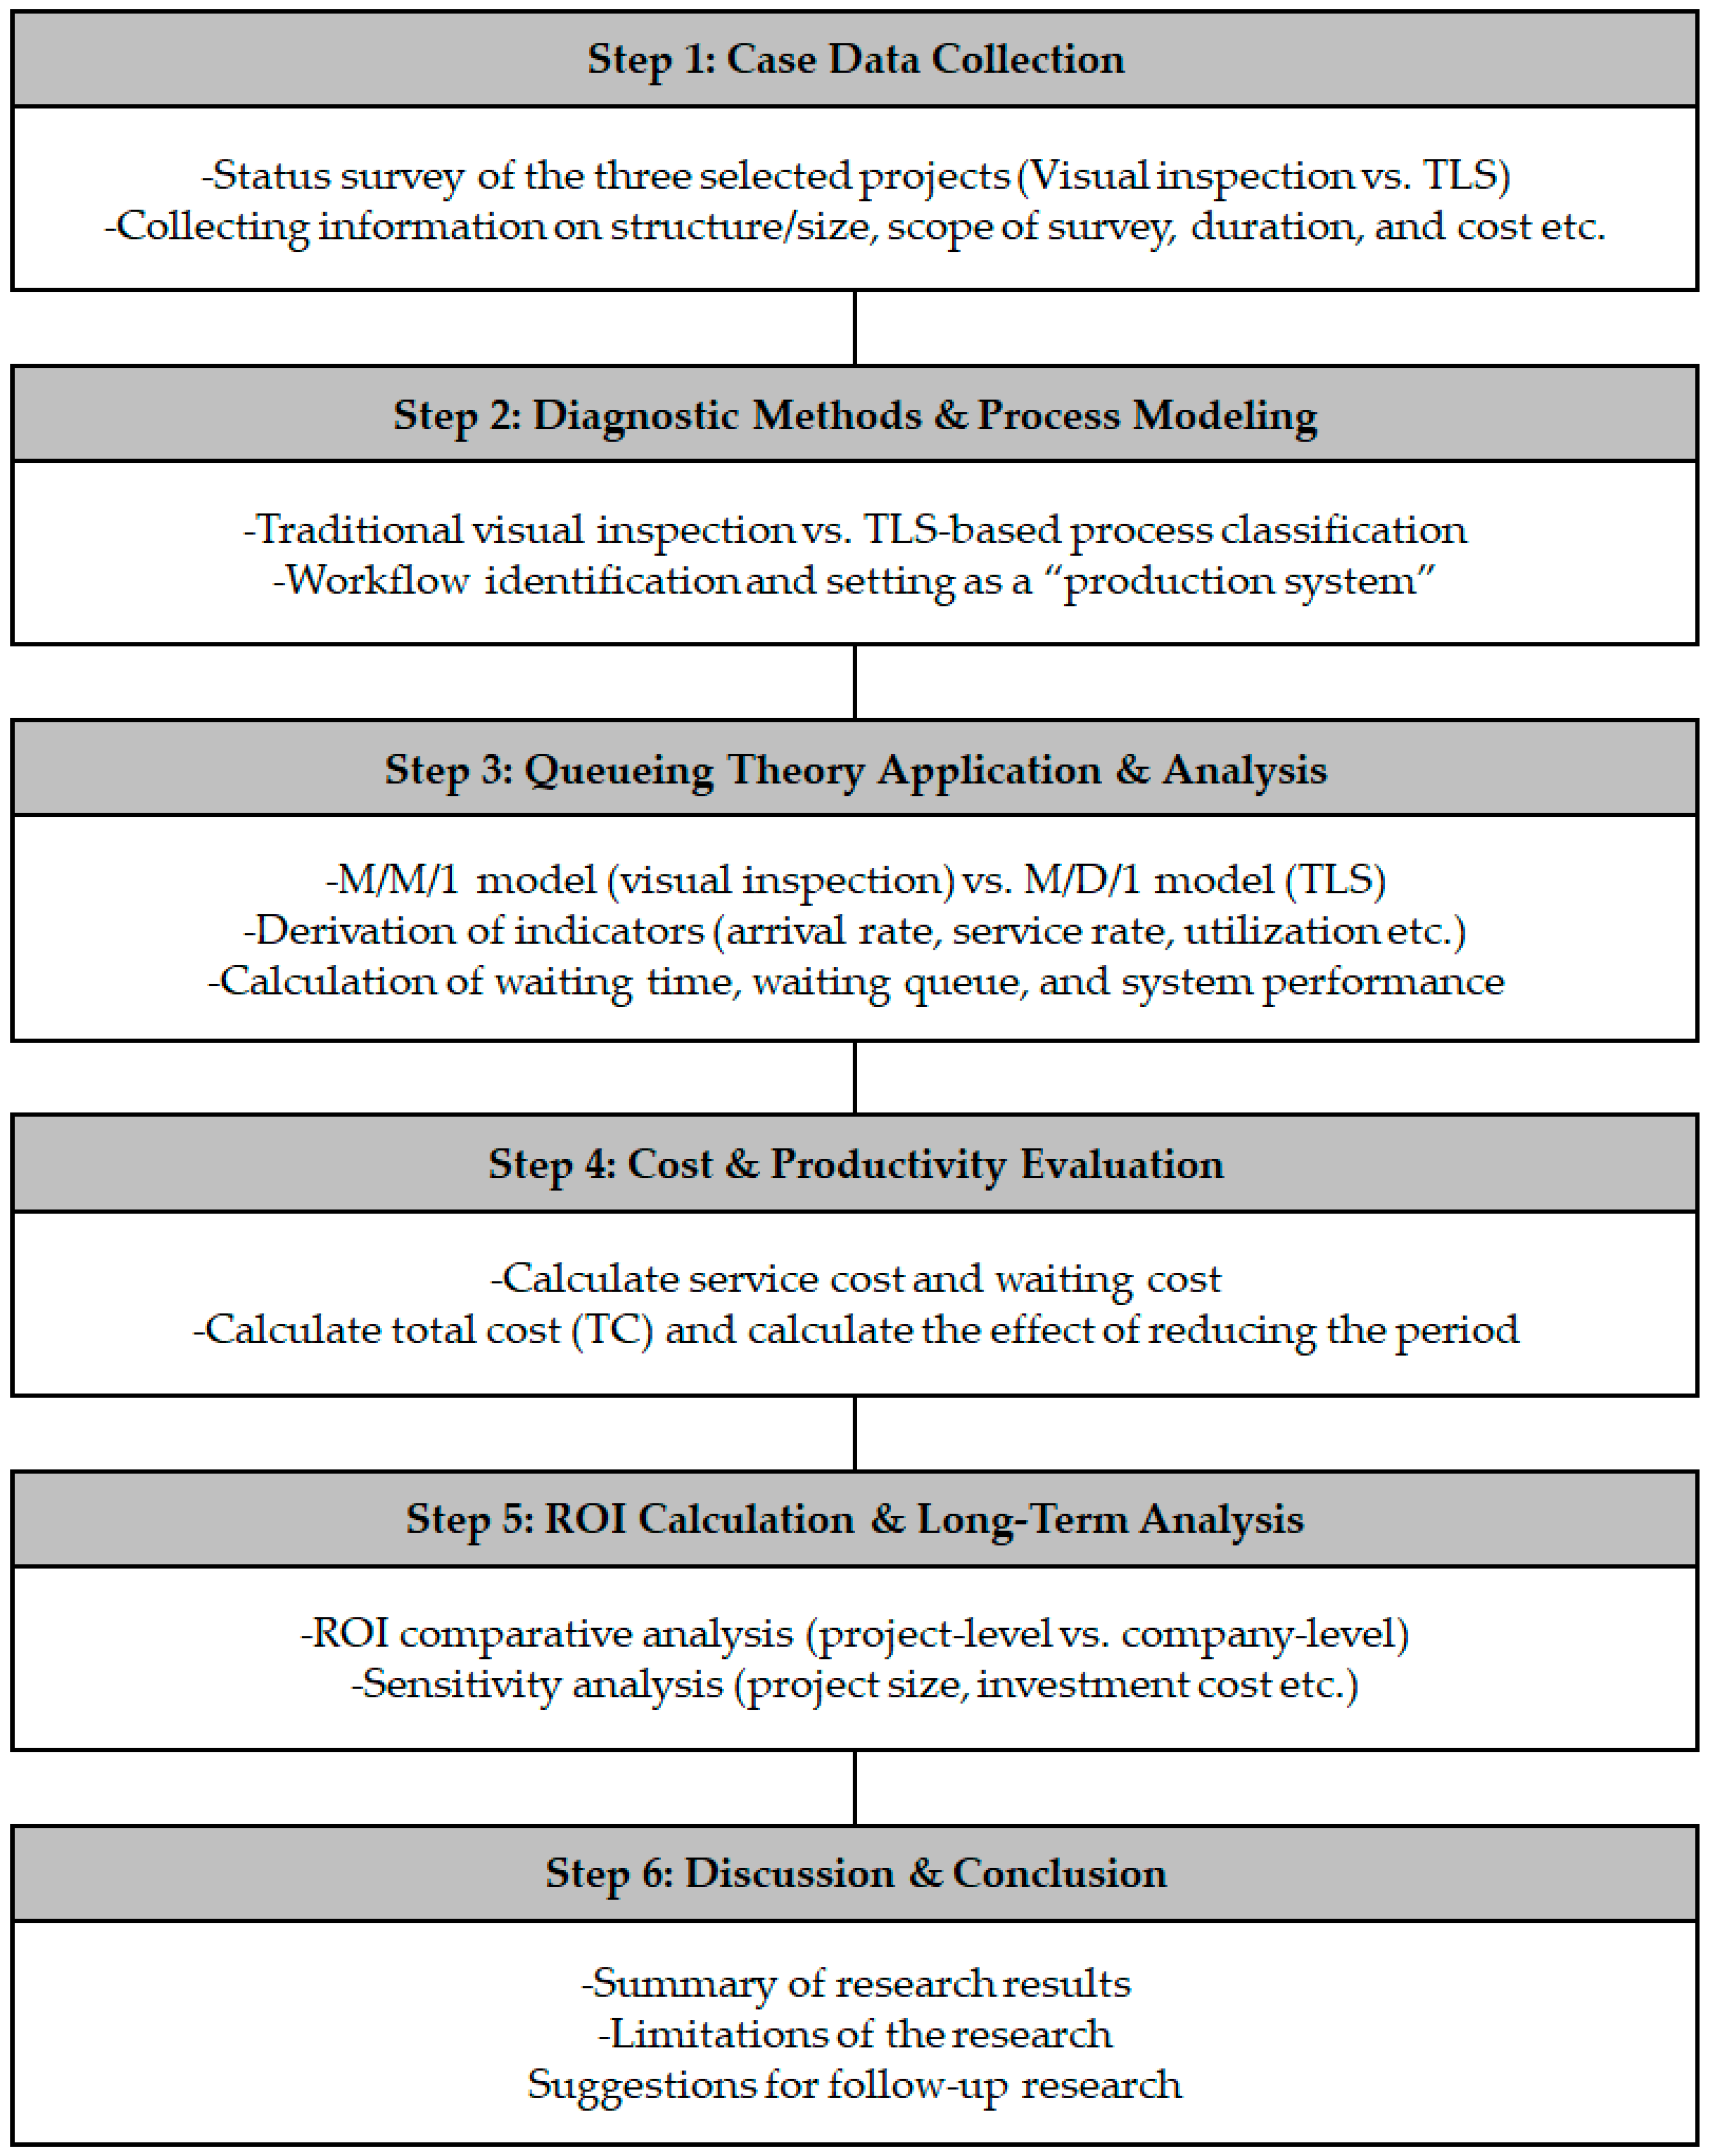
For this study, an overall framework was established, as illustrated in Figure 1.
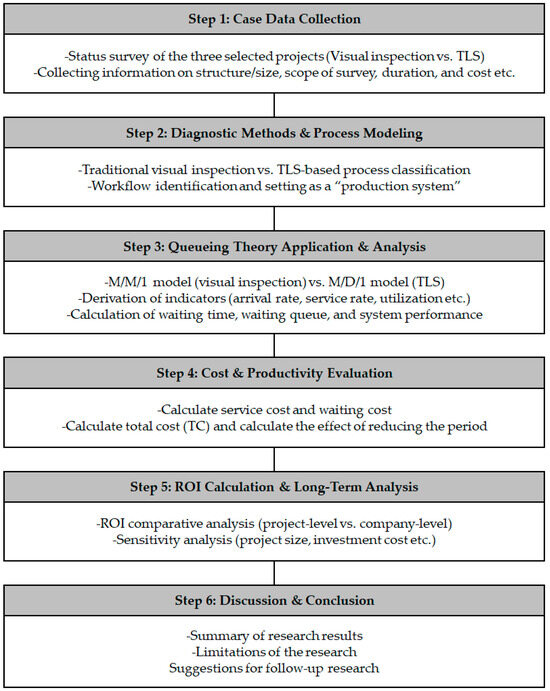
Figure 1.
Overall research methodology flowchart.
The case data collection process is as follows. The data was collected by a company specializing in architectural structures located in Seoul, South Korea. This company is a structural engineering design office that performs various tasks such as structural design and engineering, construction quality control, renovation of aging facilities, safety diagnosis, and repair and reinforcement of fire-damaged buildings by introducing 3D scanning reverse modeling. To compare the labor-intensive traditional visual inspection method with the TLS-based inspection method, the two methods were applied to an actual structural safety diagnosis project. This collected data on the differences between the two methods. Details of the collected case data are shown in Table 1.

Table 1.
Project-specific overview and scope of work.
2.4.2. Queue Method
The waiting-line model is a model that probabilistically represents the state of a waiting system and mathematically analyzes the process by which customers or tasks arrive at and are served in a queue [80,81,82]. Each diagnostic method (manpower-based visual inspection, TLS-based 3D scanning reverse modeling) is defined as a production system, from which key parameters, such as the customer (inspection area, length, etc.) and the server (diagnostic team), are derived. We apply two models to quantify the waiting time, service time, service cost, and waiting cost that occur in the production system using the queuing theory. In the existing human-based diagnostic method, the M/M/1 model, which follows an exponential distribution, is applied in consideration of service deviations due to server uncertainties. In the TLS-based 3D scanning reverse modeling diagnostic method, the M/D/1 model, which follows a deterministic distribution, is applied in consideration of the constant provision of services by the server through the introduction of technology.
In a queueing system, the time between the arrival of a customer is called the inter-arrival time. In a typical queueing system, it is almost impossible to predict when the next customer will arrive. However, if sufficient data are provided to the customers arriving at the queueing system, the average number of customers arriving per unit time can be estimated. This is called the average arrival rate (). Assuming that the server operates without interruption during the service time, the average number of customers that the server can process per unit time is called the average service rate (). Once the customer arrival rate and server service rate values are determined, the server utilization rate (), which is the ratio of the time spent processing customers by the server during the entire business hours, can be obtained. The server utilization rate () can be calculated by dividing the average arrival rate () by the average service rate ().
- M/M/1 Model
The first symbol (M) in the M/M/1 model, which is a model that takes into account the uncertainty of the server, is the probability distribution of the time between customer arrivals, and the second symbol (M) is the probability distribution of service time. The third symbol (1) refers to the number of servers. In the M/M/1 model, there are four indicators for analyzing the basic performance of a production system, namely , , , and . is the average length of customers waiting in the entire queueing system, is the average length of customers in the queueing system, excluding customers being served, is the average waiting time from the arrival of a customer unit to the end of service in the queueing system, and is the average waiting time from the arrival of a customer unit to the end of service, excluding the service time just before service begins. The equations describing these four indicators are shown in the following Equations (1)–(4):
- M/D/1 Model
In the M/D/1 model, which considers the deterministic service provided by the server, the first symbol (M) denotes the probability distribution of interarrival times between customers, while the second symbol (D) denotes the deterministic probability distribution of service times. The third symbol (1) indicates the number of servers.
In the M/D/1 model, there are four performance indicators for analyzing the basic performance of a production system, namely , , , and . The equations for , , and in the M/D/1 model are the same as Equations (2)–(4) in the M/M/1 model, but is represented by the following Equation (5):
- Probabilistic Analysis of Customer Counts and Wait Times
Queueing models allow for probabilistic analysis of the state of queueing systems, including the number of customers and waiting times. When server utilization () is high, the state of the system may deteriorate, leading to waiting costs that reduce economic efficiency. The performance of the server can be evaluated by probabilistically predicting how many customers are present in the queueing system. represents the steady-state probability that there are customers in the system. The equations describing are represented in the following Equations (6) and (7):
Additionally, the probability associated with customer waiting time () can be represented by Equations (8) and (9). Equation (8) expresses the probability that a customer’s waiting time in the queueing system exceeds , whereas Equation (9) indicates the probability that the customer’s waiting time, excluding service time, exceeds , as follows:
- Analyze Economic Performance Considering Cost of Service and On-call Costs
Economic performance analysis using queueing models makes it possible to derive economic outcomes by considering both the server’s service cost and the customers’ waiting costs incurred due to delays. For economic analysis based on queueing theory, daily and total costs () are estimated using basic performance indicators (e.g., average number of customers, average waiting time, etc.) derived from the analytical models. By simultaneously considering service costs () and waiting costs (), comparisons of costs between workforce-based approaches and TLS-based 3D scanning reverse modeling methods, as well as effects on reducing process duration, can be calculated. represents the input cost per server unit per unit time, represents the number of servers, and represents the waiting cost per customer per unit time. The equations used for the analysis are represented in the following Equations (10)–(12):
- Analyze the ROI of adopting digital technologies
Finally, the return on investment (ROI) evaluation is conducted. Investment costs, such as purchasing scanning equipment and software licenses, are defined, and the project revenue generated by adopting the TLS-based 3D scanning reverse modeling approach is calculated. Cumulative ROI at both the individual project level and company level (multiple projects) is analyzed to provide a basis for long-term investment decision-making. The outcomes from three case projects (A, B, and C) are summarized to compare performance before and after the introduction of digital technologies. This allows for a long-term economic evaluation of the company’s investment in equipment and its continuous application across multiple projects. The equations for evaluating ROI at the project level (Equation (13)) and company level (Equation (14)) are shown as follows:
This study mainly focused on direct costs, such as labor (service cost) and waiting cost. However, equipment depreciation, software licensing fees, and personnel training expenses were not explicitly addressed. In actual equipment operation, the scanner’s lifespan may be shorter than expected or the payback period may be longer due to depreciation. Excluding these factors may lead to an overestimation of ROI, since real-world financial burdens can be higher when recurring or long-term costs are considered.
To address these gaps, future research should consider a more comprehensive approach, such as LCC analysis, that includes ongoing maintenance, licensing, and training. A sensitivity analysis of how these unaccounted costs affect overall ROI would also clarify the breakeven point for adopting TLS-based methods.
3. Results
3.1. Overview of Case Projects
In this study, a total of three projects involving the introduction of TLS-based 3D scanning reverse modeling for structural safety diagnosis were selected. Each project has varying service periods and investigation scales, as summarized in Table 2. All three cases were conducted by the same structural safety diagnosis firm (Company A), which enabled a direct comparison of two diagnostic processes—the traditional manpower-based method and the TLS-based 3D scanning reverse modeling method—for the same buildings and structures.
Table 2.
Cost and staffing comparison of as-is vs. to-be.
The labor cost for each engineer was calculated based on the Korean engineering labor cost standard for the construction sector in 2022, the year when the case projects were executed. Engineers were categorized into professional engineers, senior engineers, and junior engineers. Specifically, labor costs for each case project were determined based on the Korean engineering labor cost standard for the construction sector in 2022.
For Project A, the traditional approach required one professional engineer, two senior engineers, and one junior engineer, resulting in a daily labor cost of KRW 1,172,789. In contrast, the TLS-based 3D scanning reverse modeling approach reduced the number of senior engineers by one, lowering the daily labor costs to KRW 890,244. In Project B, the conventional method required one professional engineer, eight senior engineers, and one junior engineer, totaling a daily labor cost of KRW 2,868,059. With the TLS-based 3D scanning reverse modeling approach, the number of senior engineers was reduced to four, resulting in lower daily labor costs of KRW 1,737,879. Lastly, Project C initially employed one professional engineer, eight senior engineers, and one junior engineer, with a daily labor cost of KRW 2,868,059. However, after implementing the TLS-based 3D scanning reverse modeling method, the number of senior engineers decreased to three, significantly reducing daily labor costs to KRW 1,455,334.
The company’s initial investment cost for implementing TLS-based 3D scanning reverse modeling (e.g., equipment purchase and software licenses) was a total of KRW 120 million. This cost was reflected in the economic evaluations across the three selected projects.
3.2. Visual Inspection and TLS-Based 3D Scanning Reverse Modeling Process
Structural safety diagnosis typically involves identifying defects and damage in structures through an initial visual inspection followed by a detailed second-stage investigation, then establishing appropriate repair and reinforcement measures. The conventional manpower-based diagnostic approach largely relies on visual inspections by on-site experts and measuring equipment, where estimations for the entire structure are made based on sampled measurements from specific areas. This approach has limitations, especially in large-scale facilities, fire-damaged sites, or high-altitude work environments, as it often requires significant manpower and extended periods of time.
In contrast, the TLS-based 3D scanning reverse modeling method utilizes 3D scanning technology to quickly measure and document the entire structure, generating BIM models through automated and post-processing workflows from point cloud data. Structural safety analyses are subsequently conducted, and the outcomes are documented as maintenance records. Thus, repetitive visual inspections and sampling tasks by field personnel can be reduced, significantly enhancing investigation reliability and accuracy while also shortening the overall inspection duration.
Project A involved investigating a fire-damaged area in an apartment complex. Under the traditional approach, four personnel were deployed for approximately 40 days to visually inspect damaged sections, conduct precise measurements in selected areas, assess damage levels, and prepare a report. In contrast, using the TLS-based 3D scanning reverse modeling method, 89 scanning points were established for comprehensive 3D scanning. Three personnel completed scanning, analyzed component deformation and damage using the 3D model, and calculated restoration quantities within 14 days.
In Project B, which involved a structural safety assessment of an aging steel-frame structure, the conventional approach employed visual inspections and sample measurements, followed by separate drawing preparation and detailed analysis, requiring a total of 10 personnel over approximately 80 days. With the TLS-based 3D scanning reverse modeling method, however, 192 scanning points were used to capture comprehensive point cloud data. Six personnel performed point cloud integration, modeled steel member dimensions and corrosion conditions, conducted structural analysis, and formulated repair strategies within 55 days.
Finally, Project C was a case examining the displacement and deformation of pipe racks totaling 2743 m. The traditional approach divided the entire section into intervals, manually created drawings, and performed structural analysis, involving 10 personnel over approximately 7 months (154 days). In contrast, the TLS-based 3D scanning reverse modeling method established TLS scanning points across 13 segments, integrated data, and utilized BIM modeling for displacement analysis and reporting. This enabled five personnel to complete the work within 66 days.
Table 3 compares the labor input and process of visual inspection and TLS-based 3D scanning reverse modeling.
Table 3.
Comparison of work inputs and processes between visual inspection and TLS-based 3D scanning reverse modeling methods.
3.3. Queuing Model Results (M/M/1 vs. M/D/1)
In this study, queueing theory was applied, treating the investigation targets as “customers” and deployed personnel as a single “server”. The traditional manpower-based diagnostic approach, characterized by significant variability due to manual labor, was modeled using an M/M/1 queue, following an exponential distribution. In contrast, the TLS-based 3D scanning reverse modeling diagnostic method employed the M/D/1 model due to the nearly constant service times facilitated by scanning equipment.
In Project A, the fire-damaged area was 21,550 m2, and, assuming an 8 h workday over periods of 40 days (visual inspection method) and 14 days (TLS-based 3D scanning reverse modeling method), the arrival rate (λ) was calculated by dividing the total investigation area by the total work hours. Comparing the service rates (μ) based on the actual task duration, the traditional method (M/M/1) achieved a service rate (μ) of 538.75 m2/hour, while the TLS-based 3D scanning reverse modeling method (M/D/1) increased efficiency to 1538.29 m2/hour. As a result, the server utilization (ρ) decreased significantly from 0.91 to 0.32. Additionally, the average number of customers (L) in the system reduced dramatically from approximately 10 m2 to 0.47 m2, and the average waiting time per 1 m2 (W) was substantially shortened from 1.2 min to approximately 0.06 min (3.6 s).
In Project B, the service rate (μ) increased from 65 m2/hour (visual inspection method, M/M/1) to 94.55 m2/hour (TLS-based 3D scanning reverse modeling, M/D/1). Consequently, the server utilization (ρ) decreased from 0.91 to 0.62, the average number of customers in the system (L) dropped from 10 m2 to 1.15 m2, and the average waiting time (W) significantly improved from 10.14 min to 1.14 min.
In Project C, the service rate (μ) more than doubled from 17.81 m2/hour (visual inspection method) to 41.56 m2/hour (TLS-based 3D scanning reverse modeling method). Consequently, the server utilization (ρ) reduced from 0.88 to 0.38, the average number of customers in the system (L) dramatically declined from 7.02 m2 to 0.49 m2, and the average time spent in the system (W) decreased notably from approximately 27 min to around 1.86 min (approximately 111 s).
The detailed analytical results for each project are summarized in Table 4.
Table 4.
Comparison of queue analysis results between visual inspection and TLS-based methods.
Using queueing theory, the probability of a customer remaining in the system for more than one hour, , was estimated. In Project A, this probability was 0.002 with the traditional method but dropped to nearly zero (0.000) with the TLS-based 3D scanning reverse modeling method. For Project B, the probability decreased from 0.478 to 0.012, and for Project C, it also significantly declined from 0.758 to 0.039. Thus, the TLS-based 3D scanning reverse modeling method substantially reduces the likelihood of extended waiting or delays, even when handling larger investigation areas. This indicates that as the scale of the structure increases, scanning-based technologies, such as TLS, become increasingly advantageous. Table 5 shows the probability that the customer waiting time will exceed 1 h.
Table 5.
Timeout probability with visual inspection and TLS-based 3D scanning reverse modeling methods.
3.4. Economic Performance Analysis
3.4.1. Service Cost (SC) and Waiting Cost (WC)
In this study, the service cost (SC) required for structural safety diagnosis projects and the waiting cost (WC) due to process delays or overtime work were defined. According to interviews conducted with the case company (Company A), an additional payment equivalent to 50% of the daily labor cost is required for 3 h of overtime work beyond the standard 8 h workday. Based on this, the calculated SC and WC showed the following differences.
In Project A, the visual inspection method involved a daily labor cost of KRW 1,172,789 (one professional engineer, two senior engineers, and one junior engineer). The waiting cost (WC) was calculated as approximately KRW 195,465. Conversely, using the TLS-based 3D scanning reverse modeling method, the daily labor cost decreased to KRW 890,244 (one professional engineer, one senior engineer, and one junior engineer), significantly lowering the waiting cost to approximately KRW 148,374 per hour.
In Project B, the visual inspection method had a daily labor cost of KRW 2,865,329, with the waiting cost calculated at KRW 477,555 per hour. In contrast, the TLS-based 3D scanning reverse modeling method reduced the daily labor cost to KRW 1,735,149 and significantly decreased the waiting cost to KRW 289,192 per hour.
Similarly, for Project C, the visual inspection method’s daily labor cost was KRW 2,865,329, with a waiting cost of KRW 477,555 per hour. However, the TLS-based 3D scanning reverse modeling method reduced the daily labor cost by nearly half, to KRW 1,452,604, resulting in a substantial reduction in the waiting cost to approximately KRW 242,101 per hour.
Detailed comparisons of service costs () and waiting costs () for each project are provided in Table 6.
Table 6.
Service cost and waiting cost comparison for visual inspection and TLS-based methods.
Consequently, transitioning to the TLS-based 3D scanning reverse modeling approach demonstrates clear advantages in reducing overall project costs. This method not only lowers daily labor costs but also significantly reduces additional expenses associated with overtime work or project delays compared to the visual inspection method.
3.4.2. Total Cost (TC)
By combining the average number of customers in the system () derived from the queueing model, the number of servers, and the daily service cost () and waiting cost (), the daily total cost () was calculated. The results indicate significant reductions in survey duration, labor costs, and waiting costs when adopting the TLS-based 3D scanning reverse modeling approach. Specifically, applying Equation (12) to each project yields the following outcomes.
In Project A, the total daily cost of the existing method is KRW 3,127,437, and a total of KRW 125,097,493 must be spent over 40 days. On the other hand, the total daily cost of the TLS-based 3D scanning reverse modeling method is reduced to KRW 959,485, and a total of KRW 13,432,793 is spent over 14 days of investigation. This represents a significant cost reduction of 89% compared to the existing method.
Project B has a total daily cost of KRW 7,640,877 under the existing method, and a total of KRW 611,270,187 is required to perform it for 80 days. However, the TLS-based 3D scanning reverse modeling method is significantly reduced to KRW 2,217,135 per day, which means that it will only cost KRW 121,942,416 in total when performed for 55 days. This represents an 80% cost reduction compared to the existing method.
In the case of Project C, the total daily cost of the existing method is KRW 6,208,213, and a total of KRW 956,064,776 must be spent over 154 days. In comparison, the TLS-based 3D scanning reverse modeling method is significantly reduced to KRW 1,597,864 per day, which amounts to a total of KRW 105,459,050 over 66 days, representing an 89% cost reduction.
Detailed comparisons of cost-saving effects for each project are summarized in Table 7.
Table 7.
Comparison of total cost savings of visual inspection and TLS-based inspection.
In other words, TLS inspection-based diagnosis methods can be used to ensure high data reliability and complete coverage in large-scale investigations, such as fire damage or aging structure diagnoses, while also greatly reducing the actual manpower and investigation time, thereby reducing the investigation period and total cost.
3.5. ROI Evaluation
3.5.1. Comparing Project-Level and Company-Level ROI
The project-level ROI for the three cases was calculated using the following Equation (15):
where total cost (a) refers to the TLS-based inspection cost from Table 7, service fee (b) is the actual contract fee received for each project, (b − a) is the revenue, and investment is the initial equipment purchase cost (KRW 120 million).
Summarizing the project-level ROI analysis for the three case projects, Project B exhibited significant investment viability, with an ROI of 135.88%, as the revenue generated from adopting the TLS-based 3D scanning reverse modeling approach substantially exceeded the initial investment. In contrast, Project A yielded a ROI of approximately 13.81%, and Project C yielded about 12.12%, indicating that these two projects individually would require relatively longer periods to recover the initial investment. This suggests that ROI can vary significantly depending on project-specific characteristics, such as facility size and the extent of damage. Consequently, making decisions on equipment purchases based solely on a single project’s ROI may lead to an under- or overestimation of investment effectiveness.
The company-level ROI for the three cases was calculated using the following Equation (16):
As a result of implementing all three projects (A, B, and C), the cumulative profit was about KRW 194.17 million, and the overall ROI reached 161.80% compared to the initial investment of KRW 120 million. This demonstrates that by continuously employing TLS-based 3D scanning reverse modeling across multiple projects, companies can not only fully recover their initial investment but also generate additional economic benefits.
Detailed results of the project-level and company-level ROI analyses are provided in Table 8.
Table 8.
ROI analysis at the project level and company level.
Considering the project-level ROI outcomes, it is difficult to conclusively state that introducing digital technologies uniformly guarantees cost-saving effects across all projects, as ROI values can vary greatly depending on individual project conditions and complexity. Although individual projects, such as Project A and Project C, showed relatively lower ROI, larger-scale projects, such as Project B, could yield substantial results sufficient to recover initial investments. However, since construction and maintenance companies typically perform multiple consecutive projects, it is more rational to evaluate cumulative return on investment from a long-term perspective. If a company makes an initial investment in digital equipment and continually utilizes it across multiple projects, judging investment value solely based on the profitability of individual projects may not provide an accurate assessment. Ultimately, from a corporate perspective, investment in digital technology is economically more meaningful when considered in the context of executing multiple consecutive projects.
3.5.2. Sensitivity and Further Considerations
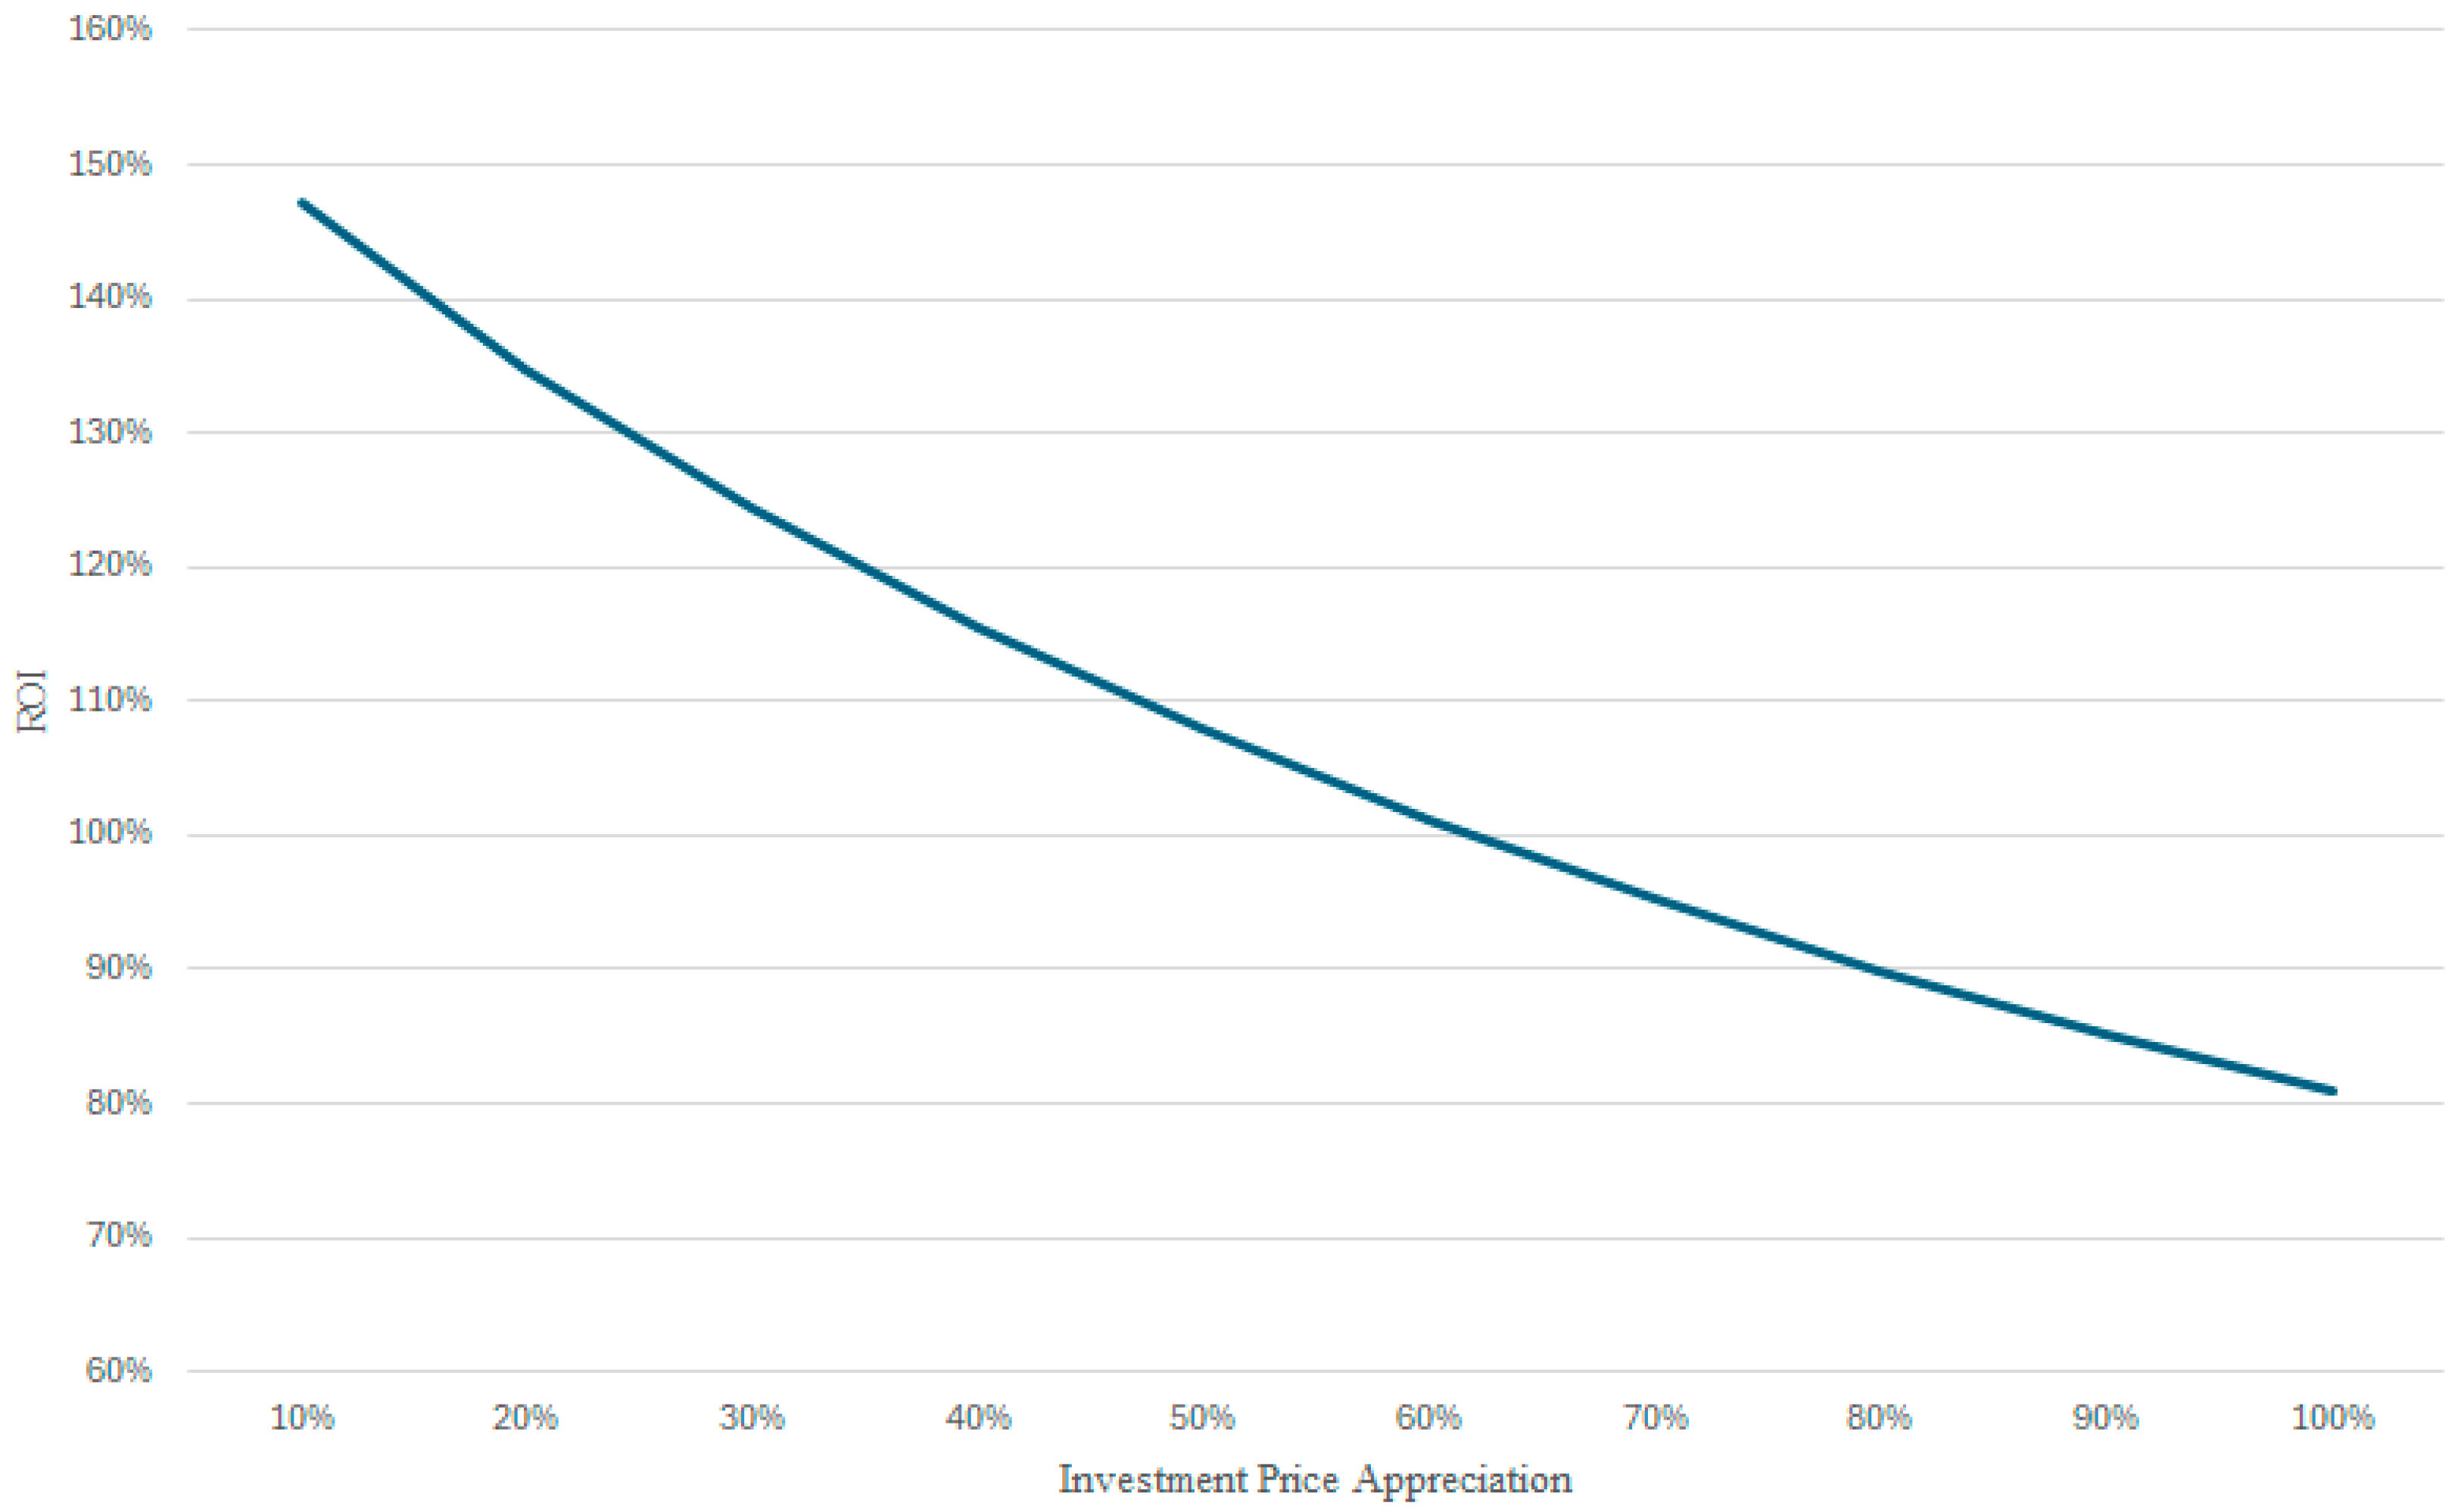
Sensitivity analysis of various factors is essential in investment decision making. First, since the initial investment cost varies according to market conditions or functional specifications, it was confirmed that, even when assuming an increase of up to 60% in equipment prices, the company-level ROI would decrease but was still likely to remain above 100%. Figure 2 shows the company-level ROI according to changes in equipment prices.
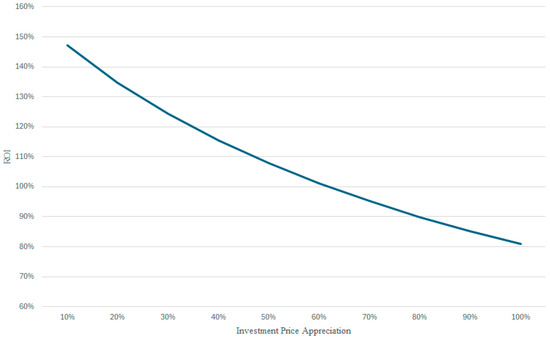
Figure 2.
Changes in ROI with increasing investment price appreciation.
Furthermore, reduced service fees for projects could negatively affect ROI. Conversely, larger project scales lead to greater productivity improvements through adopting digital methods, thereby significantly increasing ROI. However, it is important to note a limitation—if only extremely small-scale diagnostic tasks are available, recovering the initial investment could become challenging. Additionally, as this study is based on only three cases, caution should be exercised in generalizing the results.
Moreover, costs related to training and operational personnel cannot be overlooked in actual business environments. Although this study assumed supplier-provided complimentary training, cultivating internal expert personnel might require additional training expenses. Furthermore, practical factors, such as equipment depreciation and software license renewal costs, must also be considered. These expenses can potentially be distributed and reduced by simultaneously or sequentially performing multiple projects. Lastly, this research focused exclusively on three specific cases (Projects A, B, and C), but actual construction and engineering firms undertake projects of considerably greater diversity in scale and characteristics. Therefore, comprehensive evaluations incorporating various internal datasets and historical performances are recommended to arrive at more accurate and informed investment decisions.
4. Discussion
The integrated adoption of TLS-based 3D scanning reverse modeling for structural safety assessment provides several key implications.
First, employing scanning technology throughout the entire project significantly reduced both waiting and service times compared to visual inspections. This improvement can be attributed to transitioning from a highly variable production system (the visual inspection method) to one characterized by deterministic service times (M/D/1). Such findings highlight the substantial efficiency gains achievable by introducing manufacturing principles, such as automation and standardization, into the construction industry.
Second, at the individual project level, initial investments, such as the purchase of scanning equipment, may seem financially burdensome. However, cumulative benefits increase considerably when performing multiple projects over an extended period. This is clearly demonstrated by the combined ROI of Projects A, B, and C, confirming that the investment is highly beneficial at the company level.
Third, other construction industry processes traditionally hindered by labor-intensive approaches (e.g., design, construction, and maintenance) can similarly benefit from applying queueing theory-based analyses. Future integration of additional digital technologies (e.g., UAVs, IoT, AI-based image processing) and comprehensive evaluation of investment costs versus benefits could provide more objective grounds for strategic decision-making in construction companies.
5. Conclusions
This study quantitatively evaluated the economic and productivity-enhancing effects of incorporating TLS into structural safety assessment processes. Three actual case projects were selected and comparatively analyzed, contrasting traditional manpower-based methods with the TLS-based 3D scanning reverse modeling method. Queueing models (M/M/1 and M/D/1) were applied to determine key performance indicators, including service rates, server utilization, and average waiting times, forming the basis for cost and ROI evaluations.
The results demonstrate that the TLS-based method achieved significantly higher service rates compared to the visual inspection method. In particular, rapid scanning and data integration with BIM substantially reduced inspection durations and the personnel required. Project-level analysis revealed that the largest-scale project (Project B) achieved a high ROI of 135.88%, whereas the relatively smaller-scale Projects A and C recorded lower ROIs of 13.81% and 12.12%, respectively. Nevertheless, the cumulative ROI at the company level from executing all three projects consecutively reached 161.8%, confirming substantial long-term economic advantages from investing in TLS.
Practically, this research highlights that TLS implementation enables shorter inspection periods, reduced costs, and the standardization of operational processes in structural safety diagnosis. Although there is an initial investment cost burden, empirical evidence demonstrates that sufficient returns on investment can be secured through continuous and repetitive project execution over the long term. Academically, this study contributes by quantitatively analyzing the labor-intensive characteristics and performance variability inherent to construction inspection using queueing theory, offering theoretical support for enhancing production system efficiency.
However, this study has limitations, including an analysis restricted to three case projects conducted by a single company, and the exclusion of certain cost components, such as equipment depreciation, software licensing, and personnel training. Consequently, the conclusions regarding long-term ROI may be somewhat optimistic if such factors significantly raise the total expenditure. Additionally, the diversity in construction project types (e.g., tunnels, bridges, skyscrapers) and scales was not addressed. Therefore, future research should involve a broader variety of cases and comprehensively incorporate all cost elements, including depreciation and life-cycle costs, to clarify the broader impact of digital transformation across the construction industry. Further integration and application of various digital technologies, such as AI, IoT, and unmanned aerial vehicles (UAVs), to enhance structural safety assessment efficiency could potentially extend the applicability and economic benefits of digital technologies.
Author Contributions
Conceptualization, K.W. and J.-j.K.; methodology, T.K. and K.W.; software, T.K. and K.W.; validation, T.K., K.W. and N.H.; formal analysis, T.K.; investigation, T.K.; resources, T.K. and N.H.; data curation, T.K. and N.H.; writing—original draft preparation, T.K. and K.W.; writing—review and editing, N.H. and J.-j.K.; visualization, T.K.; supervision, J.-j.K.; project administration, T.K. and N.H.; funding acquisition, T.K. and N.H. All authors have read and agreed to the published version of the manuscript.
Funding
This work was supported by the National Research Foundation of Korea (NRF) grant funded by the Korea government (MSIT) (IRIS RS-2025-00557724).
Institutional Review Board Statement
Not applicable.
Informed Consent Statement
Not applicable.
Data Availability Statement
The raw data supporting the conclusions of this article will be made available by the authors on request.
Conflicts of Interest
The authors declare no conflicts of interest.
References
- Jarkas, A. Factors influencing labour productivity in Bahrain’s construction industry. Int. J. Constr. Manag. 2015, 15, 94–108. [Google Scholar] [CrossRef]
- Jarkas, A.; Balushi, R.; Raveendranath, P. Determinants of construction labour productivity in Oman. Int. J. Constr. Manag. 2015, 15, 332–344. [Google Scholar] [CrossRef]
- Ham, N.; Lee, S. Empirical Study on Structural Safety Diagnosis of Large-Scale Civil Infrastructure Using Laser Scanning and BIM. Sustainability 2018, 10, 4024. [Google Scholar] [CrossRef]
- Chowdhury, T.; Adafin, J.; Wilkinson, S. Review of digital technologies to improve productivity of New Zealand construction industry. J. Inf. Technol. Constr. 2019, 24, 569–587. [Google Scholar] [CrossRef]
- Park, H.-P. A Fundamental Study on International Comparison of Labor Productivity in Construction Industry. In Proceedings of the Korean Institute of Building Construction Conference, Jeju, Republic of Korea, 16–18 May 2018; pp. 310–311. Available online: https://koreascience.kr/article/CFKO201826857077446.pdf (accessed on 25 March 2025).
- Cheng, M.; Khasani, R.; Citra, R. Image-based preliminary emergency assessment of damaged buildings after earthquake: Taiwan case studies. Eng. Appl. Artif. Intell. 2023, 126, 107164. [Google Scholar] [CrossRef]
- Das, M.; Rapolu, N.; Meda, D.; Kalapatapu, P.; Kumar, V. Automated Structural Surface Damage Identification, Classification and Severity Estimation Using Deep Learning Approaches. In Proceedings of the 14th International Workshop on Structural Health Monitoring, Stanford, CA, USA, 12–14 September 2023; pp. 1–9. [Google Scholar] [CrossRef]
- Rashidi, M.; Mohammadi, M.; Kivi, S.; Abdolvand, M.; Truong-Hong, L.; Samali, B. A Decade of Modern Bridge Monitoring Using Terrestrial Laser Scanning: Review and Future Directions. Remote Sens. 2020, 12, 3796. [Google Scholar] [CrossRef]
- Valero, E.; Bosché, F.; Bueno, M. Laser scanning for BIM. J. Inf. Technol. Constr. 2022, 27, 486–495. [Google Scholar] [CrossRef]
- Wu, C.; Yuan, Y.; Tang, Y.; Tian, B. Application of Terrestrial Laser Scanning (TLS) in the Architecture, Engineering and Construction (AEC) Industry. Sensors 2022, 22, 265. [Google Scholar] [CrossRef]
- Keitaanniemi, A.; Virtanen, J.; Rönnholm, P.; Kukko, A.; Rantanen, T.; Vaaja, M. The Combined Use of SLAM Laser Scanning and TLS for the 3D Indoor Mapping. Buildings 2021, 11, 386. [Google Scholar] [CrossRef]
- Stefańska, A.; Markowski, H.; Dixit, S. Three-dimensional laser scanning for structure documentation and construction management: A case study of renovation and rebuilt of metro tunnels. Ain Shams Eng. J. 2024, 15, 102665. [Google Scholar] [CrossRef]
- Chacón, R.; Puig-Polo, C.; Real, E. TLS measurements of initial imperfections of steel frames for structural analysis within BIM-enabled platforms. Autom. Constr. 2021, 125, 103618. [Google Scholar] [CrossRef]
- Jiang, Q.; Zhang, C.; Wei, Q. Digital technology adoption and enterprise investment efficiency. Financ. Res. Lett. 2025, 72, 106623. [Google Scholar] [CrossRef]
- Hwang, W.; Kim, H. Does the adoption of emerging technologies improve technical efficiency? Evidence from Korean manufacturing SMEs. Small Bus. Econ. 2021, 7, 627–643. [Google Scholar] [CrossRef]
- Woliński, S. Multi-faced assessment of structural safety. Arch. Civ. Eng. 2023, 67, 133–154. [Google Scholar] [CrossRef]
- Jeong, H.-J.; Ham, N.-H.; Lee, B.-D.; Park, K.-M.; Kim, J.-J. A Study on the Improvement of Repair and Reinforcement Quantity Take-off in Fire-damaged Area Using 3D Laser Scanning. J. KIBIM 2019, 9, 11–21. [Google Scholar] [CrossRef]
- Pandey, S.; Sinha, A. Visual Inspection Of Structures—Primary Aspect Of Structural Health Assessment. Tuijin Jishu/J. Propuls. Technol. 2023, 44, 4127–4135. [Google Scholar] [CrossRef]
- Anil, A.; Thanuja, R.; Sankar, S.; Gopal, V.; Kumar, E.; Kumar, S. Qualitative Assessment of a Construction Building. Adv. Mater. Res. 2024, 1182, 63–71. [Google Scholar] [CrossRef]
- Agdas, D.; Rice, J.; Martinez, J.; Lasa, I. Comparison of visual inspection and structural-health monitoring as bridge condition assessment methods. J. Bridge Eng. 2016, 30, 04015049. [Google Scholar] [CrossRef]
- Ichitsubo, M.; Horiguchi, I.; Nagamachi, M. A study on the evaluation of structure damages for the visual inspection. In Proceedings of the 2005 International Conference on Active Media Technology (AMT 2005), Kagawa, Japan, 19–21 May 2005; pp. 455–460. [Google Scholar] [CrossRef]
- Smith, D.K.; Tardif, M. Building Information Modeling: A Strategic Implementation Guide for Architects, Engineers, Constructors, and Real Estate Asset Managers; John Wiley & Sons: Hoboken, NJ, USA, 2009. [Google Scholar]
- Bertola, N.; Brühwiler, E. Risk-based methodology to assess bridge condition based on visual inspection. Struct. Infrastruct. Eng. 2021, 19, 575–588. [Google Scholar] [CrossRef]
- Kwon, N.; Song, K.; Ahn, Y.; Park, M.; Jang, Y. Maintenance cost prediction for aging residential buildings based on case-based reasoning and genetic algorithm. J. Build. Eng. 2020, 28, 101006. [Google Scholar] [CrossRef]
- Park, M.; Kwon, N.; Lee, J.; Lee, S.; Ahn, Y. Probabilistic Maintenance Cost Analysis for Aged Multi-Family Housing. Sustainability 2019, 11, 1843. [Google Scholar] [CrossRef]
- Mohamed, A.; Abdallah, M.; Marzouk, M. BIM and semantic web-based maintenance information for existing buildings. Autom. Constr. 2020, 116, 103209. [Google Scholar] [CrossRef]
- Mohamed, H.; Hashim, N.; Yusuwan, N.; Hanafiah, M.; Shamsuddin, S. Assessing cost and benefit attributes of Building Information Modelling (BIM) implementation in Malaysian public agency: PLS-SEM approach. J. Inf. Technol. Constr. 2024, 29, 308–323. [Google Scholar] [CrossRef]
- Datta, S.; Tayeh, B.; Hakeem, I.; Aisheh, Y. Benefits and Barriers of Implementing Building Information Modeling Techniques for Sustainable Practices in the Construction Industry—A Comprehensive Review. Sustainability 2023, 15, 12466. [Google Scholar] [CrossRef]
- Bowden, S.; Dorr, A.; Thorpe, A.; Anumba, C.; Gooding, P. Making the Case for Mobile IT in Construction. In Proceedings of the Computing in Civil Engineering, Cancun, Mexico, 12–15 July 2005; pp. 1–12. [Google Scholar] [CrossRef]
- Zhang, X.; Wu, Z.; Feng, Y.; Xu, P. “Turning green into gold”: A framework for energy performance contracting (EPC) in China’s real estate industry. J. Clean. Prod. 2015, 109, 166–173. [Google Scholar] [CrossRef]
- Yap, J.; Lam, C.; Skitmore, M.; Talebian, N. Barriers to the adoption of new safety technologies in construction: A developing country context. J. Civ. Eng. Manag. 2022, 28, 120–133. [Google Scholar] [CrossRef]
- Afolabi, A.; Nnaji, C.; Okoro, C. Immersive Technology Implementation in the Construction Industry: Modeling Paths of Risk. Buildings 2022, 12, 363. [Google Scholar] [CrossRef]
- Ren, X.; Terwel, K.; Van Gelder, P. Human and organizational factors influencing structural safety: A review. Struct. Saf. 2024, 107, 102407. [Google Scholar] [CrossRef]
- Nong, X.; Luo, X.; Lin, S.; Ruan, Y.; Ye, X. Multimodal Deep Neural Network-Based Sensor Data Anomaly Diagnosis Method for Structural Health Monitoring. Buildings 2023, 13, 1976. [Google Scholar] [CrossRef]
- Kim, T.; Yoon, Y.; Lee, B.; Ham, N.; Kim, J.J. Cost–benefit analysis of scan-vs-BIM-based quality management. Buildings 2022, 12, 2052. [Google Scholar] [CrossRef]
- Zawada, K.; Rybak-Niedziółka, K.; Donderewicz, M.; Starzyk, A. Digitization of AEC Industries Based on BIM and 4.0 Technologies. Buildings 2024, 14, 1350. [Google Scholar] [CrossRef]
- De Souza, A.; Debs, L. Identifying Emerging Technologies and Skills Required for Construction 4.0. Buildings 2023, 13, 2535. [Google Scholar] [CrossRef]
- Wang, M.; Wang, C.; Sepasgozar, S.; Zlatanova, S. A Systematic Review of Digital Technology Adoption in Off-Site Construction: Current Status and Future Direction towards Industry 4.0. Buildings 2020, 10, 204. [Google Scholar] [CrossRef]
- Elghaish, F.; Matarneh, S.; Talebi, S.; Kagioglou, M.; Hosseini, M.; Abrishami, S. Toward digitalization in the construction industry with immersive and drones technologies: A critical literature review. Smart Sustain. Built Environ. 2020, 10, 345–363. [Google Scholar] [CrossRef]
- Shao, J.; Zhang, W.; Mellado, N.; Grussenmeyer, P.; Li, R.; Chen, Y.; Wan, P.; Zhang, X.; Cai, S. Automated markerless registration of point clouds from TLS and structured light scanner for heritage documentation. J. Cult. Herit. 2019, 39, 202–213. [Google Scholar] [CrossRef]
- Aryan, A.; Bosché, F.; Tang, P. Planning for terrestrial laser scanning in construction: A review. Autom. Constr. 2021, 129, 103551. [Google Scholar] [CrossRef]
- Morsy, S.; Shaker, A. Evaluation of LiDAR-Derived Features Relevance and Training Data Minimization for 3D Point Cloud Classification. Remote Sens. 2022, 14, 5934. [Google Scholar] [CrossRef]
- Rougeron, G.; Le Garrec, J.; Andriot, C. Optimal positioning of terrestrial LiDAR scanner stations in complex 3D environments with a multiobjective optimization method based on GPU simulations. ISPRS J. Photogramm. Remote Sens. 2022, 193, 60–76. [Google Scholar] [CrossRef]
- Teng, J.; Shi, Y.; Wang, H.; Wu, J. Review on the Research and Applications of TLS in Ground Surface and Constructions Deformation Monitoring. Sensors 2022, 22, 9179. [Google Scholar] [CrossRef]
- Artese, S.; Zinno, R. TLS for Dynamic Measurement of the Elastic Line of Bridges. Appl. Sci. 2020, 10, 1182. [Google Scholar] [CrossRef]
- Grasso, S.; Bellinvia, S.; Salerno, N.; Rizzo, S. A Simple and Economical System for Automatic Near-Field Scanning for Power Electronics Converters. Energies 2023, 16, 7868. [Google Scholar] [CrossRef]
- Chen, J.; Zhang, Y.; Zhu, J.; Tang, X.; Wang, L. Freehand scanning photoacoustic microscopy with simultaneous localization and mapping. Photoacoustics 2022, 28, 100411. [Google Scholar] [CrossRef] [PubMed]
- Matusova, D.; Bartosova, V. Utilization the Process BIM—Building Information Modeling in Facility Management. In Proceedings of the Advances and Trends in Engineering Sciences and Technologies II, Bangalore, India, 5–7 January 2017; pp. 429–436. [Google Scholar] [CrossRef]
- Valinejadshoubi, M.; Moselhi, O.; Bagchi, A. Integrating BIM into sensor-based facilities management operations. J. Facil. Manag. 2022, 20, 385–400. [Google Scholar] [CrossRef]
- Teicholz, P. BIM for Facility Managers; John Wiley & Sons: Hoboken, NJ, USA, 2013. [Google Scholar] [CrossRef]
- García, O.; Diaz-Severiano, J.; Gómez-Jáuregui, V.; Del Val, C.; Iglesias, J.; Royano, A.; González, C. Modelling As-Built MEP Facilities in a BIM Environment. In Proceedings of the International Conference on The Digital Transformation in the Graphic Engineering, Logroño, Spain, 20–21 June 2019; pp. 491–498. [Google Scholar] [CrossRef]
- Zeibak-Shini, R.; Sacks, R.; Filin, S.; Khaled, L. Towards generation of as-damaged BIM models using laser-scanning and as-built BIM: First estimate of as-damaged locations of reinforced concrete frame members in masonry infill structures. Adv. Eng. Inform. 2016, 30, 312–326. [Google Scholar] [CrossRef]
- Zeibak-Shini, R.; Khaled, L.; Sacks, R. Mapping the Structural Frame of a Damaged Reinforced Concrete Building using As-Damaged Scans and As-Built BIM. In Proceedings of the 32nd CIB W78 Conference, Eindhoven, The Netherlands, 27–29 October 2015. [Google Scholar]
- Wałach, D.; Kaczmarczyk, G. Application of TLS Remote Sensing Data in the Analysis of the Load-Carrying Capacity of Structural Steel Elements. Remote Sens. 2021, 13, 2759. [Google Scholar] [CrossRef]
- Chmeit, R.; Lyu, J.; Pitt, M. Implementation Challenges of Building Information Modelling (BIM) in Small to Medium-Sized Enterprises (SMEs) Participating in Public Projects in Qatar. Comput. Decis. Mak. Int. J. 2024, 1, 252–279. [Google Scholar] [CrossRef]
- Silva, T.; Vieira, D.; De Carvalho, M. Exploring the Challenges in Building Information Modeling (BIM) During the Design Phase: Evidence From Cross-Country Studies. IEEE Trans. Eng. Manag. 2024, 71, 14846–14860. [Google Scholar] [CrossRef]
- Pham, C.; Cao, C.; Van Le, C.; Nguyen, L.; Le, T.; Van Nguyen, T.; La, H. BIM and TLS Point Cloud Integration for Information Management of Underground Coal Mines: A Case Study in Nui Beo Underground Coal Mining in Vietnam. KSCE J. Civ. Eng. 2024, 28, 5829–5840. [Google Scholar] [CrossRef]
- Tang, X.; Wang, M.; Wang, Q.; Guo, J.; Zhang, J. Benefits of Terrestrial Laser Scanning for Construction QA/QC: A Time and Cost Analysis. J. Manag. Eng. 2022, 38, 05022001. [Google Scholar] [CrossRef]
- Hong, J.; Shen, G.Q.; Li, Z.; Zhang, B.; Zhang, W. Barriers to promoting prefabricated construction in China: A cost–benefit analysis. J. Clean. Prod. 2018, 172, 649–660. [Google Scholar] [CrossRef]
- Nezhadpour Esmaeeli, A.; Heravi, G. A decision support framework for economic evaluation of flexible strategies in pavement construction projects. Int. J. Pavement Eng. 2019, 20, 1342–1358. [Google Scholar] [CrossRef]
- Tarefder, R.A.; Ahmad, M. Cost-effectiveness analysis of chip seal with and without millings. Int. J. Pavement Eng. 2018, 19, 893–900. [Google Scholar] [CrossRef]
- Kamali, M.; Hewage, K. Life cycle performance of modular buildings: A critical review. Renew. Sustain. Energy Rev. 2016, 62, 1171–1183. [Google Scholar] [CrossRef]
- Dara, C.; Hachem-Vermette, C. Evaluation of low-impact modular housing using energy optimization and life cycle analysis. Energy Ecol. Environ. 2019, 4, 286–299. [Google Scholar] [CrossRef]
- Vassiliades, C.; Barone, G.; Buonomano, A.; Forzano, C.; Giuzio, G.; Palombo, A. Assessment of an innovative plug and play PV/T system integrated in a prefabricated house unit: Active and passive behaviour and life cycle cost analysis. Renew. Energy 2022, 187, 103–119. [Google Scholar] [CrossRef]
- Vitkova, A.; Vitásek, S. A Case Study on Sustainable Technologies in Residential Buildings from a Life Cycle Cost Analysis (LCC) Perspective. Sustainability 2024, 16, 10892. [Google Scholar] [CrossRef]
- Mariana, Z.; Daniela, M.; Luiza, I. Return on Investment—Indicator for Measuring the Profitability of Invested Capital. Valahian J. Econ. Stud. 2016, 7, 79–86. [Google Scholar] [CrossRef]
- Walasek, D.; Barszcz, A. Analysis of the adoption rate of building information modeling [BIM] and its return on investment [ROI]. Procedia Eng. 2017, 172, 1227–1234. [Google Scholar] [CrossRef]
- Ham, N.H. A Case Study on the Economic Impacts of Design Errors in BIM-based High-Rise Construction Project. Ph.D. Thesis, Hanyang University, Seoul, Republic of Korea, 2018. [Google Scholar]
- Sawhney, A.; Abourizk, S.; Halpin, D. Construction project simulation using CYCLONE. Can. J. Civ. Eng. 1998, 25, 16–25. [Google Scholar] [CrossRef]
- Lestari, D.; Alfianto, D.; Rosidi, Y. CYCLONE Modeling Analysis Operation Slab Work Project Conggeang Bridge—Cisumdawu Toll Road Section 5A. J. Transnatl. Univ. Stud. 2024, 3, 100. [Google Scholar] [CrossRef]
- Martínez, J.; Ioannou, P. General-purpose systems for effective construction simulation. J. Constr. Eng. Manag. 1999, 125, 265–276. [Google Scholar] [CrossRef]
- Rece, L.; Vlase, S.; Ciuiu, D.; Neculoiu, G.; Mocanu, Ș.; Modrea, A. Queueing Theory-Based Mathematical Models Applied to Enterprise Organization and Industrial Production Optimization. Mathematics 2022, 10, 2520. [Google Scholar] [CrossRef]
- Saini, B.; Singh, D.; Sharma, K. Application of Queueing Theory to Analyze the Performance Metrics of Manufacturing Systems. Asian Res. J. Math. 2024, 20, 84–95. [Google Scholar] [CrossRef]
- Saini, B.; Singh, D.; Sharma, D. Exploring the Role of Queueing Theory in Manufacturing: An Analytical Study. Int. Res. J. Adv. Eng. Manag. 2024, 2, 255–266. [Google Scholar] [CrossRef]
- Bebittovimalan, A.; Thiagarajan, M. An Infinite Capacity Single Server Markovian Queueing System with Discouraged Arrivals Retention of Reneged Customers and Controllable Arrival Rates with Feedback. Indian J. Sci. Technol. 2024, 17, 3100–3108. [Google Scholar] [CrossRef]
- Gal, A.; Senderovich, A.; Weidlich, M. Challenge Paper. J. Data Inf. Qual. 2018, 9, 1–5. [Google Scholar] [CrossRef]
- Amjath, M.; Kerbache, L.; Smith, J.; Elomri, A. Optimisation of Buffer Allocations in Manufacturing Systems: A Study on Intra and Outbound Logistics Systems Using Finite Queueing Networks. Appl. Sci. 2023, 13, 9525. [Google Scholar] [CrossRef]
- Staffolani, A.; Darvariu, V.; Bellavista, P.; Musolesi, M. RLQ: Workload Allocation with Reinforcement Learning in Distributed Queues. IEEE Trans. Parallel Distrib. Syst. 2023, 34, 856–868. [Google Scholar] [CrossRef]
- Teknomo, K. Queuing rule of thumb based on M/M/s queuing theory with applications in construction management. Civ. Eng. Dimens. 2012, 14, 139–146. [Google Scholar]
- Ham, N.; Moon, S.; Kim, J.H.; Kim, J.J. Optimal BIM staffing in construction projects using a queueing model. Autom. Constr. 2020, 113, 103123. [Google Scholar] [CrossRef]
- Wee, K.; Ham, N.; Kim, J.J. Microscopical Resource Allocation for Large-Scale Apartment Foundation Work Using Queuing Systems. Buildings 2022, 12, 89. [Google Scholar] [CrossRef]
- Kim, J.W.; Ham, N.; Kim, J.J. Quantitative analysis of waiting length and waiting time for frame construction work activities using a queue model; focusing on Korean apartment construction. Sustainability 2021, 13, 3778. [Google Scholar] [CrossRef]
Disclaimer/Publisher’s Note: The statements, opinions and data contained in all publications are solely those of the individual author(s) and contributor(s) and not of MDPI and/or the editor(s). MDPI and/or the editor(s) disclaim responsibility for any injury to people or property resulting from any ideas, methods, instructions or products referred to in the content. |
© 2025 by the authors. Licensee MDPI, Basel, Switzerland. This article is an open access article distributed under the terms and conditions of the Creative Commons Attribution (CC BY) license (https://creativecommons.org/licenses/by/4.0/).