

Using Age- and Size-Corrected Measures of Technical Skill to Better Assess the Performances of Youth Soccer Players

 ,
,  ,
,  and
and
Abstract
1. Introduction
2. Methods
2.1. Subjects
2.2. Study Design
2.3. Passing and Control Tests
2.4. Passing Tests
2.5. Statistical Analyses
3. Results
4. Discussion
Supplementary Materials
Author Contributions
Funding
Institutional Review Board Statement
Informed Consent Statement
Data Availability Statement
Acknowledgments
Conflicts of Interest
References
- Christensen, M.K. “An Eye for Talent”: Talent Identification and the “Practical Sense” of Top-Level Soccer Coaches. Sociol. Sport J. 2009, 26, 365–382. [Google Scholar] [CrossRef]
- Den Hartigh, R.J.R.; Niessen, A.S.M.; Frencken, W.G.P.; Meijer, R.R. Selection Procedures in Sports: Improving Predictions of Athletes’ Future Performance. Eur. J. Sport Sci. 2018, 18, 1191–1198. [Google Scholar] [CrossRef] [PubMed]
- Meylan, C.; Cronin, J.; Oliver, J.; Hughes, M. Talent Identification in Soccer: The Role of Maturity Status on Physical, Physiological and Technical Characteristics. Int. J. Sports Sci. Coach. 2010, 5, 571–592. [Google Scholar] [CrossRef]
- Williams, A.M. Talent Identification and Development in Soccer: An Update and Contemporary Perspectives. J. Sports Sci. 2020, 38, 1197–1198. [Google Scholar] [CrossRef]
- Lüdin, D.; Donath, L.; Romann, M. Disagreement between Talent Scouts: Implications for Improved Talent Assessment in Youth Football. J. Sports Sci. 2023, 41, 758–765. [Google Scholar] [CrossRef] [PubMed]
- Mann, D.L.; van Ginneken, P.J.M.A. Age-Ordered Shirt Numbering Reduces the Selection Bias Associated with the Relative Age Effect. J. Sports Sci. 2017, 35, 784–790. [Google Scholar] [CrossRef]
- Figueiredo, A.J.; Gonçalves, C.E.; Coelho e Silva, M.J.; Malina, R.M. Characteristics of Youth Soccer Players Who Drop out, Persist or Move Up. J. Sports Sci. 2009, 27, 883–891. [Google Scholar] [CrossRef]
- Bradley, B.; Johnson, D.; Hill, M.; McGee, D.; Kana-ah, A.; Sharpin, C.; Sharp, P.; Kelly, A.; Cumming, S.P.; Malina, R.M. Bio-Banding in Academy Football: Player’s Perceptions of a Maturity Matched Tournament. Ann. Hum. Biol. 2019, 46, 400–408. [Google Scholar] [CrossRef]
- Cumming, S.P.; Brown, D.J.; Mitchell, S.; Bunce, J.; Hunt, D.; Hedges, C.; Crane, G.; Gross, A.; Scott, S.; Franklin, E.; et al. Premier League Academy Soccer Players’ Experiences of Competing in a Tournament Bio-Banded for Biological Maturation. J. Sports Sci. 2018, 36, 757–765. [Google Scholar] [CrossRef]
- Lüdin, D.; Donath, L.; Cobley, S.; Romann, M. Effect of Bio-banding on Physiological and Technical-tactical Key Performance Indicators in Youth Elite Soccer. Eur. J. Sport Sci. 2022, 22, 1659–1667. [Google Scholar] [CrossRef]
- Malina, R.M.; Cumming, S.P.; Rogol, A.D.; Coelho-e-Silva, M.J.; Figueiredo, A.J.; Konarski, J.M.; Kozieł, S.M. Bio-Banding in Youth Sports: Background, Concept, and Application. Sports Med. 2019, 49, 1671–1685. [Google Scholar] [CrossRef] [PubMed]
- Romann, M.; Lüdin, D.; Born, D.-P. Bio-Banding in Junior Soccer Players: A Pilot Study. BMC Res. Notes 2020, 13, 240. [Google Scholar] [CrossRef]
- Towlson, C.; MacMaster, C.; Gonçalves, B.; Sampaio, J.; Toner, J.; MacFarlane, N.; Barrett, S.; Hamilton, A.; Jack, R.; Hunter, F.; et al. The Effect of Bio-Banding on Physical and Psychological Indicators of Talent Identification in Academy Soccer Players. Sci. Med. Footb. 2021, 5, 280–292. [Google Scholar] [CrossRef]
- Hunter, A.H.; Smith, N.M.A.; Camata, T.V.; Crowther, M.S.; Mather, A.; Souza, N.M.; Ramos-Silva, L.F.; Pazetto, N.F.; Moura, F.A.; Wilson, R.S. Age- and Size-Corrected Kicking Speed and Accuracy in Elite Junior Soccer Players. Sci. Med. Footb. 2021, 6, 29–39. [Google Scholar] [CrossRef]
- Wilson, R.S.; David, G.K.; Murphy, S.C.; Angilletta, M.J.; Niehaus, A.C.; Hunter, A.H.; Smith, M.D. Skill Not Athleticism Predicts Individual Variation in Match Performance of Soccer Players. Proc. R. Soc. B Biol. Sci. 2017, 284, 20170953. [Google Scholar] [CrossRef] [PubMed]
- Wilson, R.S.; Smith, N.M.A.; Ramos, S.d.P.; Giuliano Caetano, F.; Aparecido Rinaldo, M.; Santiago, P.R.P.; Cunha, S.A.; Moura, F.A. Dribbling Speed along Curved Paths Predicts Attacking Performance in Match-Realistic One vs. One Soccer Games. J. Sports Sci. 2019, 37, 1072–1079. [Google Scholar] [CrossRef]
- Wilson, R.S.; Sandes de Souza, A.P.; Santiago, P.; Ignacio, D.L.; Smith, N.M.A. Individual Performance in Passing Tests Predicts Age-independent Success in Small-sided Soccer Possession Games. Transl. Sports Med. 2020, 3, 353–363. [Google Scholar] [CrossRef]
- Konefał, M.; Chmura, P.; Zacharko, M.; Chmura, J.; Rokita, A.; Andrzejewski, M. Match Outcome vs Match Status and Frequency of Selected Technical Activities of Soccer Players during UEFA Euro 2016. Int. J. Perform. Anal. Sport 2018, 18, 568–581. [Google Scholar] [CrossRef]
- Yue, Z.; Broich, H.; Mester, J. Statistical Analysis for the Soccer Matches of the First Bundesliga. Int. J. Sports Sci. Coach. 2014, 9, 553–560. [Google Scholar] [CrossRef]
- Rein, R.; Raabe, D.; Memmert, D. Which Pass Is Better? Novel Approaches to Assess Passing Effectiveness in Elite Soccer. Hum. Mov. Sci. 2017, 55, 172–181. [Google Scholar] [CrossRef]
- Pappalardo, L.; Cintia, P. Quantifying the Relation between Performance and Success in Soccer. Adv. Complex Syst. 2018, 21, 1750014. [Google Scholar] [CrossRef]
- Alboukadel, K. Rstatix: Pipe-Friendly Framework for Basic Statistical Tests, R Package Version 0.7.2; R Foundation for Statistical Computing: Vienna, Austria, 2023.
- Harrell, F.E., Jr. Hmisc: Harrell Miscellaneous, R Package Version 4.6-0; R Foundation for Statistical Computing: Vienna, Austria, 2021.
- R Core Team, R. A Language and Environment for Statistical Computing, R Foundation for Statistical Computing: Vienna, Austria, 2020.
- Ali, A.; Williams, C.; Hulse, M.; Strudwick, A.; Reddin, J.; Howarth, L.; Eldred, J.; Hirst, M.; McGregor, S. Reliability and Validity of Two Tests of Soccer Skill. J. Sports Sci. 2007, 25, 1461–1470. [Google Scholar] [CrossRef] [PubMed]
- Rowat, O.; Fenner, J.; Unnithan, V. Technical and Physical Determinants of Soccer Match-Play Performance in Elite Youth Soccer Players. J. Sports Med. Phys. Fit. 2017, 57, 369–379. [Google Scholar] [CrossRef]
- Forsman, H.; Blomqvist, M.; Davids, K.; Liukkonen, J.; Konttinen, N. Identifying Technical, Physiological, Tactical and Psychological Characteristics That Contribute to Career Progression in Soccer. Int. J. Sports Sci. Coach. 2016, 11, 505–513. [Google Scholar] [CrossRef]
- Liao, C.-M.; Masters, R.S.W. Analogy Learning: A Means to Implicit Motor Learning. J. Sports Sci. 2001, 19, 307–319. [Google Scholar] [CrossRef]


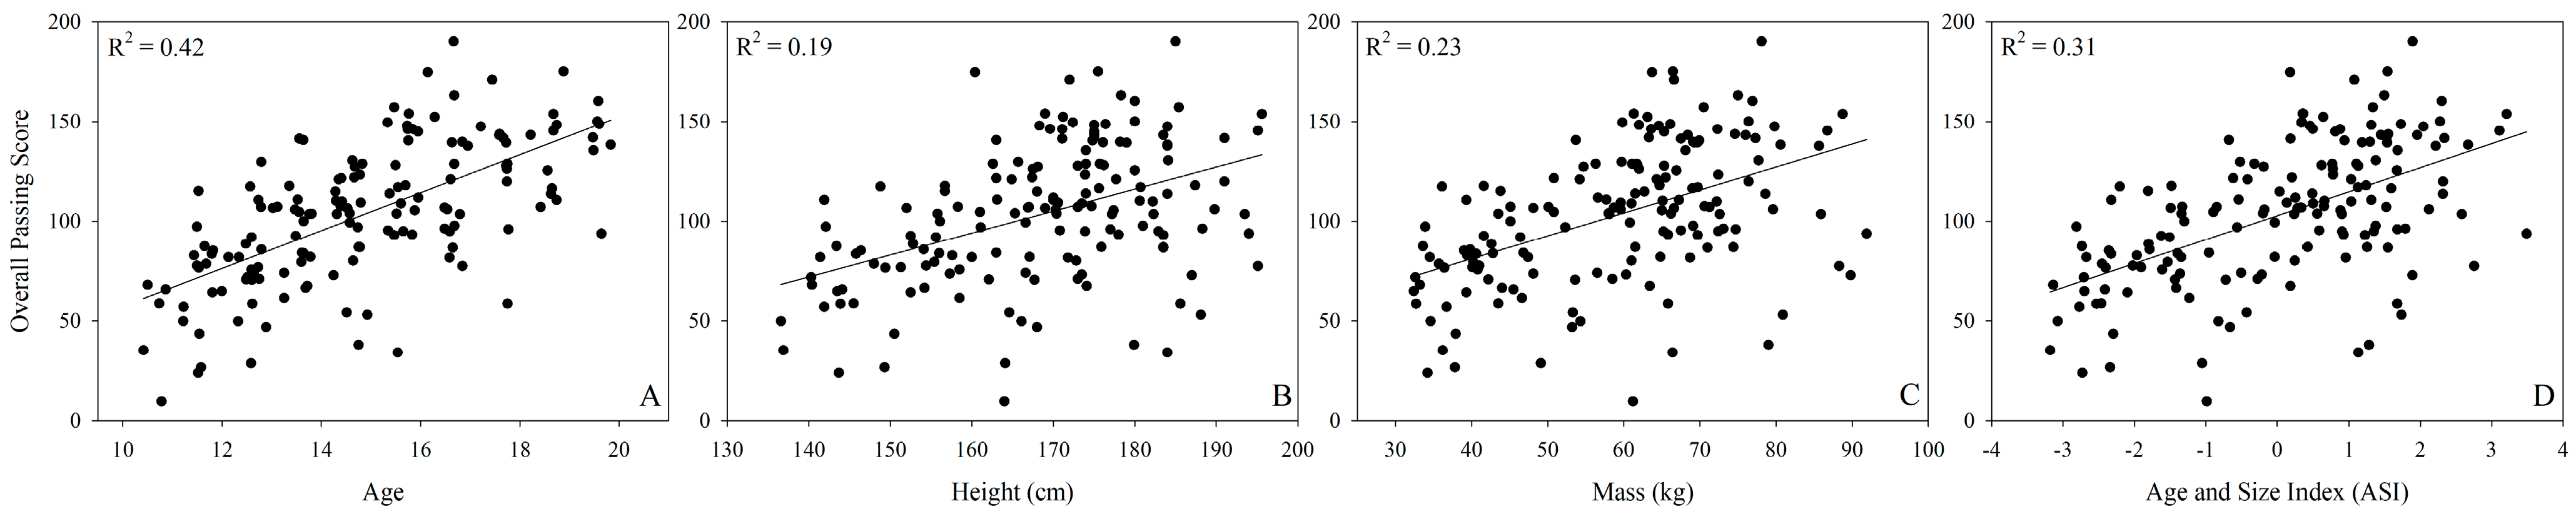
| Intercept | β | R2 | |
|---|---|---|---|
| Age (years) | −37.867 * | 9.515 * | 0.42 |
| Height (cm) | −82.415 * | 1.103 * | 0.19 |
| Mass (kg) | 35.093 * | 1.152 * | 0.23 |
| ASI | 102.83 * | 12.038 * | 0.31 |
| n | Mean ± SD (Passes/Test) | |
|---|---|---|
| Test 1 | 161 | 22.84 ± 4.60 |
| Test 2 | 164 | 12.45 ± 2.38 |
| Test 3 | 159 | 19.58 ± 4.08 |
| Test 4 | 164 | 11.07 ± 2.70 |
| Test 5 | 165 | 27.36 ± 5.38 |
| Test 6 | 164 | 12.39 ± 3.18 |
| Team | Test 1 | Test 2 | Test 3 | Test 4 | Test 5 | Test 6 |
|---|---|---|---|---|---|---|
| U12 | 15.8 ± 4.6 (n = 22) | 10.9 ± 2.3 (n = 24) | 15.7 ± 4.9 (n = 21) | 9.26 ± 2.0 (n = 24) | 22.6 ± 5.0 (n = 24) | 15.7 ± 4.9 (n = 21) |
| U13 | 21.7 ± 2.6 a (n = 22) | 11.0 ± 2.0 (n = 22) | 20.6 ± 3.0 a (n = 22) | 9.05 ± 2.4 (n = 22) | 23.4 ± 5.4 (n = 21) | 20.6 ± 3.0 (n = 22) |
| U14 | 22.4 ± 3.1 a (n = 22) | 11.6 ± 2.3 (n = 22) | 19.3 ± 3.2 (n = 21) | 10.7 ± 2.2 (n = 22) | 27.7 ± 3.8 ab (n = 24) | 19.3 ± 3.2 (n = 21) |
| U15 | 24.3 ± 2.2 a (n = 24) | 12.7 ± 2.3 (n = 24) | 18.7 ± 3.5 (n = 24) | 11. 5 ± 2.3 ab (n = 24) | 28.4 ± 2.3 ab (n = 24) | 18.7 ± 3.5 (n = 24) |
| U16 | 25.0 ± 3.8 ab (n = 19) | 12.9 ± 2.1 (n = 19) | 20.2 ± 5.5 a (n = 19) | 11.3 ± 3.2 b (n = 19) | 30.9 ± 5.1 ab (n = 20) | 20.2 ± 5.5 (n = 19) |
| U17 | 23.4 ± 3.7 a (n = 20) | 13.2 ± 2.3 ab (n = 20) | 20.5 ± 2.8 a (n = 20) | 12.2 ± 2.5 ab (n = 20) | 30.6 ± 4.3 ab (n = 20) | 20.5 ± 2.8 abcde (n = 20) |
| U20 | 26.1 ± 3.4 abcf (N = 32) | 14.2 ± 1.5 abc (N = 33) | 21.3 ± 3.0 a (n = 32) | 12. 9 ± 2.0 ab (n = 33) | 28.3 ± 4.5 ab (n = 32) | 21.3 ± 3.0 abcde (n = 32) |
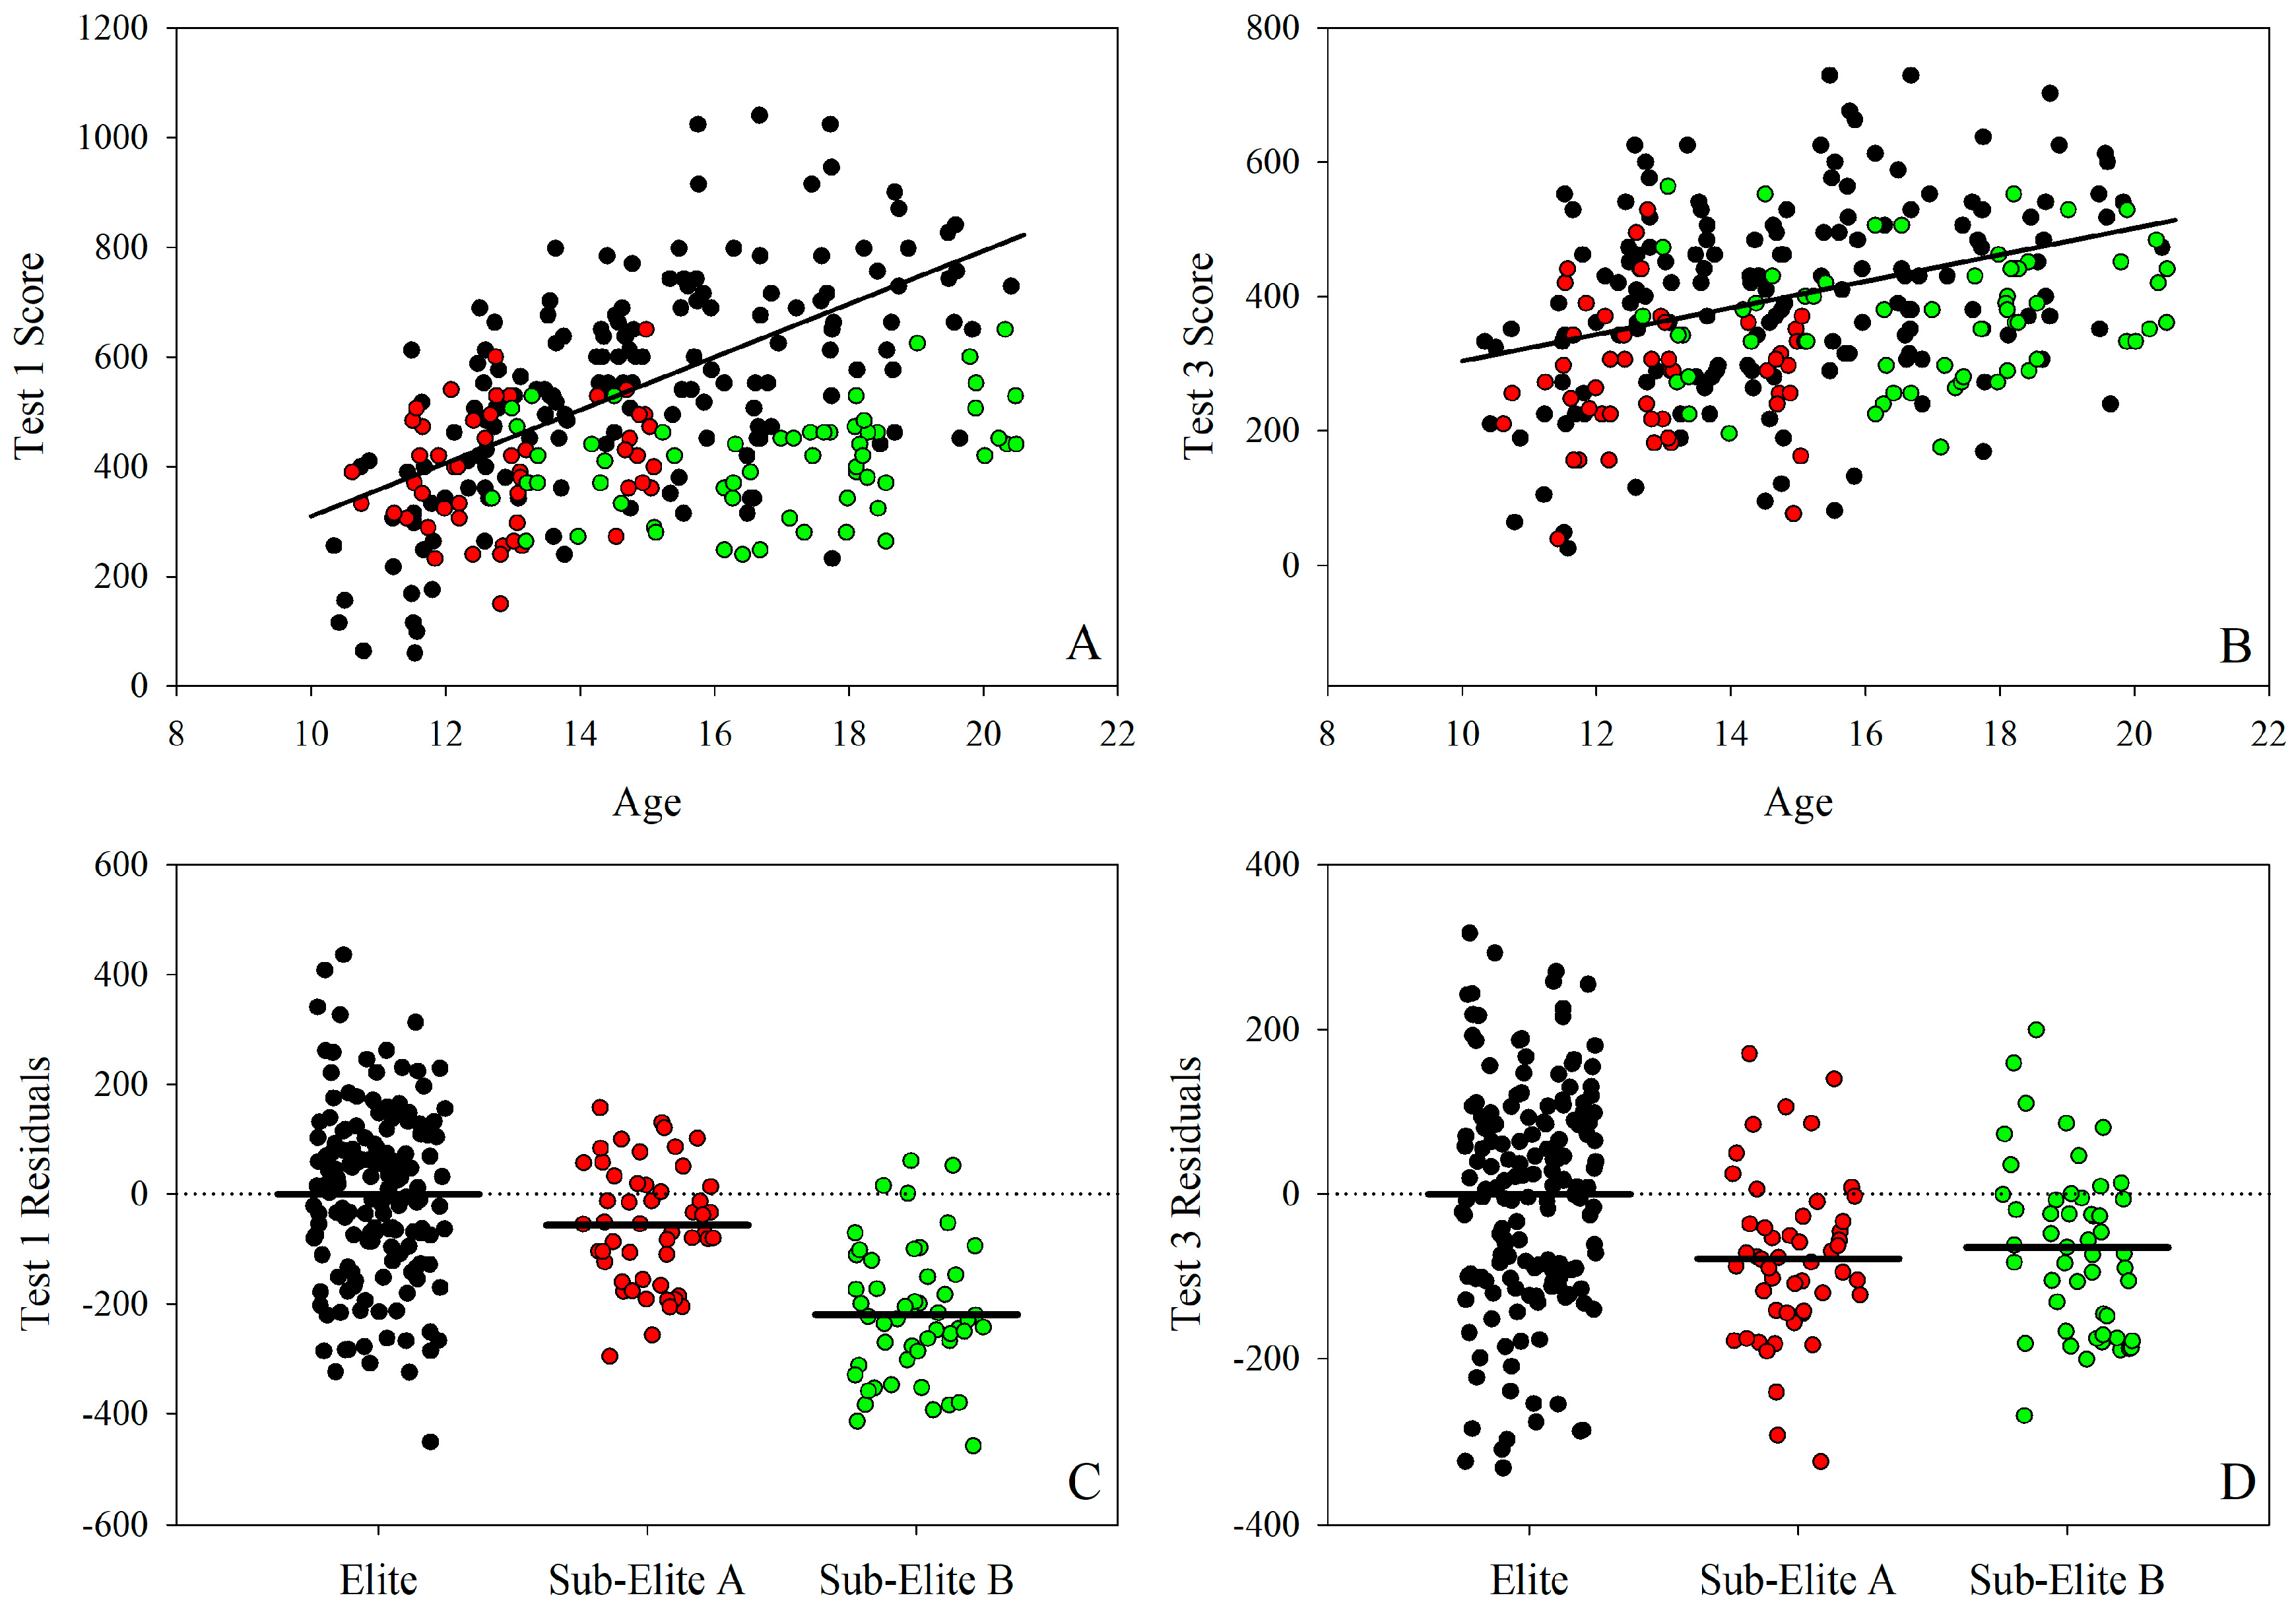
| Intercept | β | R2 | |
|---|---|---|---|
| Test 1 | −174.17 * | 48.39 ** | 0.35 |
| Test 3 | 106.14 | 19.79 ** | 0.10 |
Disclaimer/Publisher’s Note: The statements, opinions and data contained in all publications are solely those of the individual author(s) and contributor(s) and not of MDPI and/or the editor(s). MDPI and/or the editor(s) disclaim responsibility for any injury to people or property resulting from any ideas, methods, instructions or products referred to in the content. |
© 2025 by the authors. Licensee MDPI, Basel, Switzerland. This article is an open access article distributed under the terms and conditions of the Creative Commons Attribution (CC BY) license (https://creativecommons.org/licenses/by/4.0/).
Share and Cite
Camata, T.V.; Hunter, A.H.; Smith, N.M.A.; Crowther, M.S.; Santiago, P.R.P.; Wilson, R.S. Using Age- and Size-Corrected Measures of Technical Skill to Better Assess the Performances of Youth Soccer Players. Appl. Sci. 2025, 15, 4658. https://doi.org/10.3390/app15094658
Camata TV, Hunter AH, Smith NMA, Crowther MS, Santiago PRP, Wilson RS. Using Age- and Size-Corrected Measures of Technical Skill to Better Assess the Performances of Youth Soccer Players. Applied Sciences. 2025; 15(9):4658. https://doi.org/10.3390/app15094658
Chicago/Turabian StyleCamata, Thiago V., Andrew H. Hunter, Nicholas M. A. Smith, Mathew S. Crowther, Paulo R. P. Santiago, and Robbie S. Wilson. 2025. "Using Age- and Size-Corrected Measures of Technical Skill to Better Assess the Performances of Youth Soccer Players" Applied Sciences 15, no. 9: 4658. https://doi.org/10.3390/app15094658
APA StyleCamata, T. V., Hunter, A. H., Smith, N. M. A., Crowther, M. S., Santiago, P. R. P., & Wilson, R. S. (2025). Using Age- and Size-Corrected Measures of Technical Skill to Better Assess the Performances of Youth Soccer Players. Applied Sciences, 15(9), 4658. https://doi.org/10.3390/app15094658