Abstract
Acoustic data inherently contain a variety of information, including indicators of abnormal symptoms. In this study, we propose a method for detecting abnormal symptoms by converting acoustic data into spectrogram representations and applying a deep learning model. Spectrograms effectively capture the temporal and frequency characteristics of acoustic signals. In this work, we extract key features such as spectrograms, Mel-spectrograms, and MFCCs from raw acoustic data and use them as input for training a convolutional neural network. The proposed model is based on a custom ResNet architecture that incorporates Bottleneck Residual Blocks to improve training stability and computational efficiency. The experimental results show that the model trained with Mel-spectrogram data achieved the highest classification accuracy at 97.13%. The models trained with spectrogram and MFCC data achieved 95.22% and 93.78% accuracy, respectively. The superior performance of the Mel-spectrogram model is attributed to its ability to emphasize critical acoustic features through Mel-filter banks, which enhances learning performance. These findings demonstrate the effectiveness of spectrogram-based deep learning models in identifying latent patterns within acoustic data and detecting abnormal symptoms. Future research will focus on applying this approach to a wider range of acoustic domains and environments. The results of this study are expected to contribute to the development of disease surveillance systems by integrating acoustic data analysis with artificial intelligence techniques.
1. Introduction
Acoustic signals contain various types of information. For instance, human speech conveys linguistic content, while operational sounds or mechanical noise can provide insights into the condition of devices or systems. Therefore, proper analysis of acoustic signals may allow for inference about individual states or environmental conditions, enabling timely and appropriate responses [1]. For example, changes in resonance or non-semantic vocal patterns have been studied to detect neurological disorders such as stroke, Parkinson’s disease, and Alzheimer’s disease [2]. In addition, sounds such as coughing and breathing have been utilized in health monitoring applications [3].
Given these characteristics, animal vocalizations also serve as valuable sources of information. Recent studies have explored the detection of vocal patterns associated with specific conditions such as illness or stress in livestock, with the goal of improving productivity and enabling early disease monitoring [4,5].
In this study, we investigate the detection of abnormal symptoms in poultry vocalizations, focusing on chickens, the most commonly farmed poultry in Korea. Chickens suffering from respiratory diseases often exhibit abnormal vocal signs such as coughing, sneezing, snoring, and wheezing [6]. These symptoms can vary depending on environmental factors within livestock facilities. Traditionally, farmers have identified abnormal vocalizations manually in the field, a process that is labor-intensive, time-consuming, and limited in accuracy when identifying the cause or type of a symptom.
Earlier research in acoustic event detection primarily employed traditional machine learning algorithms. These methods typically relied on handcrafted feature extraction from acoustic signals, using parameters such as formant frequency, pitch, power spectral density (PSD), and root mean square (RMS), followed by classification using models such as support vector machines (SVMs), hidden Markov models (HMM), or dynamic time warping (DTW) [5,6,7,8,9]. While effective in some cases, these conventional approaches are constrained by the complexity and labor involved in manually extracting a large number of features. Moreover, they struggle with non-linear and unstructured data, which limits their scalability and generalization.
To overcome these challenges, recent studies have incorporated artificial intelligence techniques to automate feature extraction from acoustic data. For example, convolutional neural networks (CNNs) have been used to classify respiratory abnormalities [10] and animal sounds [11], leveraging various acoustic feature vectors as inputs.
In this study, we propose a method for detecting abnormal symptoms in acoustic signals using CNNs trained on spectrogram-based feature representations. Spectrograms offer a compact and informative visualization of the time–frequency structure of acoustic data and are computed using the short-time Fourier transform (STFT). These representations can be used directly as input for training deep learning models or visualized as images.
Our proposed framework involves collecting raw acoustic data, extracting relevant features, and detecting abnormal symptoms using deep learning. Feature vectors such as spectrograms, Mel-spectrograms, and MFCCs are generated from the STFT and Mel-filter banks and used to train a CNN-based model. The deep learning model is built on a custom ResNet architecture with shortcut connections to improve training efficiency and stability in deeper networks. The representative ResNet architecture, ResNet50, offers high classification accuracy; however, its computational requirements limit its applicability in real farm environments, where lightweight and low-power devices are preferred. The proposed model achieves a performance comparable to ResNet50 while reducing model size from 270MB to approximately 1.19MB, making it suitable for deployment on edge or embedded systems. Experimental validation was conducted using this model to evaluate its classification performance across different feature types [12].
2. Related Research
2.1. Previous Studies on Acoustic Abnormality Detection
Earlier studies in acoustic abnormality detection primarily relied on conventional signal processing and statistical techniques. For example, Van et al. [8] analyzed the frequency characteristics of cough sounds by computing power spectral density (PSD) and used the extracted vectors as input for a classification algorithm. Their method involved calculating the Euclidean distance between PSD vectors and reference data, followed by fuzzy clustering to classify sounds as either coughs or non-coughs. While these traditional approaches performed well on small datasets, they exhibited limitations in scalability and robustness when applied to larger and more complex acoustic data.
To address these issues, several studies have adopted machine learning techniques such as support vector machines (SVMs). Lee et al. [5], for instance, analyzed poultry vocalizations to detect stress conditions, distinguishing between physical stress (e.g., temperature changes) and psychological stress (e.g., fear). Their work utilized features such as RMS, pitch, jitter, shimmer, PSD, and formants, and achieved a detection accuracy of 96.2% and a classification accuracy of 96.7%. These findings demonstrated the potential of using non-invasive acoustic monitoring to assess animal welfare. However, the reliance on manually selected features in SVM-based methods imposes limitations on performance and generalization, particularly when compared to deep learning models capable of automatic feature learning [13].
2.2. Deep-Learning-Based Acoustic Abnormality Detection
Deep learning techniques have demonstrated significant success in various pattern recognition domains, including object detection and speech recognition. Şaşmaz et al. [11] developed a CNN-based model for classifying animal sounds, utilizing Mel-frequency cepstral coefficients (MFCC) as input features. Their model successfully classified ten categories of animal sounds, validating the utility of deep learning in acoustic classification tasks.
In the domain of respiratory abnormality detection, traditional machine learning models often fall short in terms of classification accuracy. To address this gap, Kim et al. [10] proposed an ensemble approach using CNN models trained on multiple acoustic feature representations, including MFCCs, scalograms, and waveforms. Each model was specialized for a specific feature type, and the models’ outputs were aggregated to enhance detection performance. This study highlights the advantage of leveraging deep learning models with diverse input formats to improve the detection of abnormal symptoms in acoustic signals.
2.3. Acoustic Feature Vectors for Symptom Detection
In this study, we define acoustic symptoms as sound patterns that reflect specific physiological or environmental conditions. For example, respiratory illnesses may alter vocalization characteristics, producing distinguishable acoustic symptoms such as wheezing or coughing. To detect these symptoms using machine learning techniques, feature vectors must be extracted from the raw acoustic data.
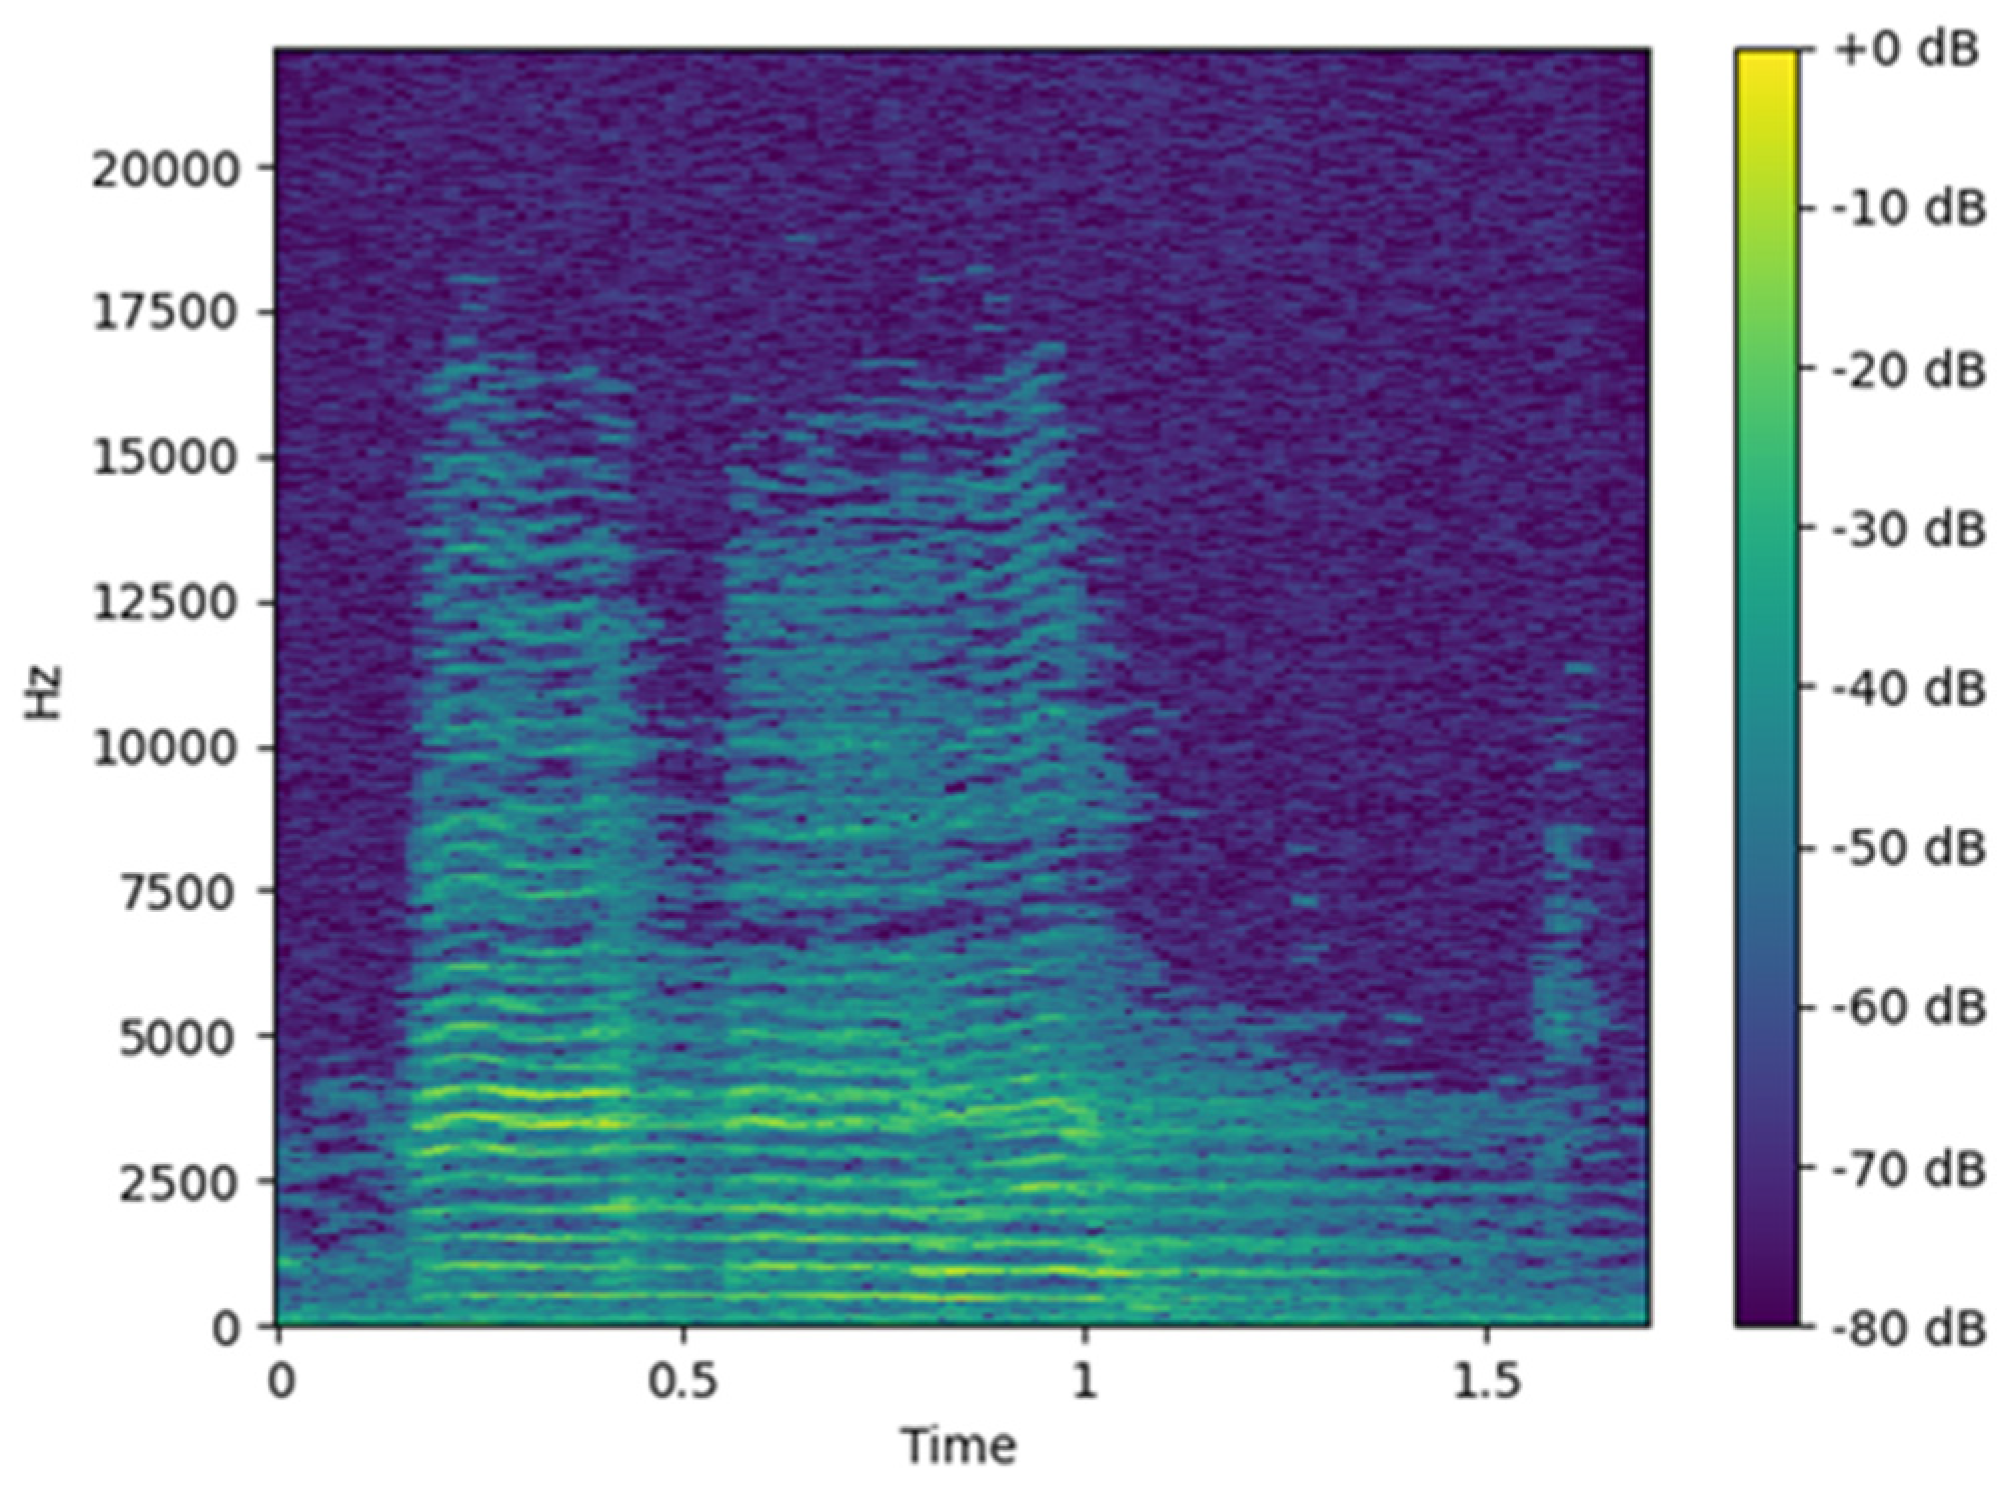
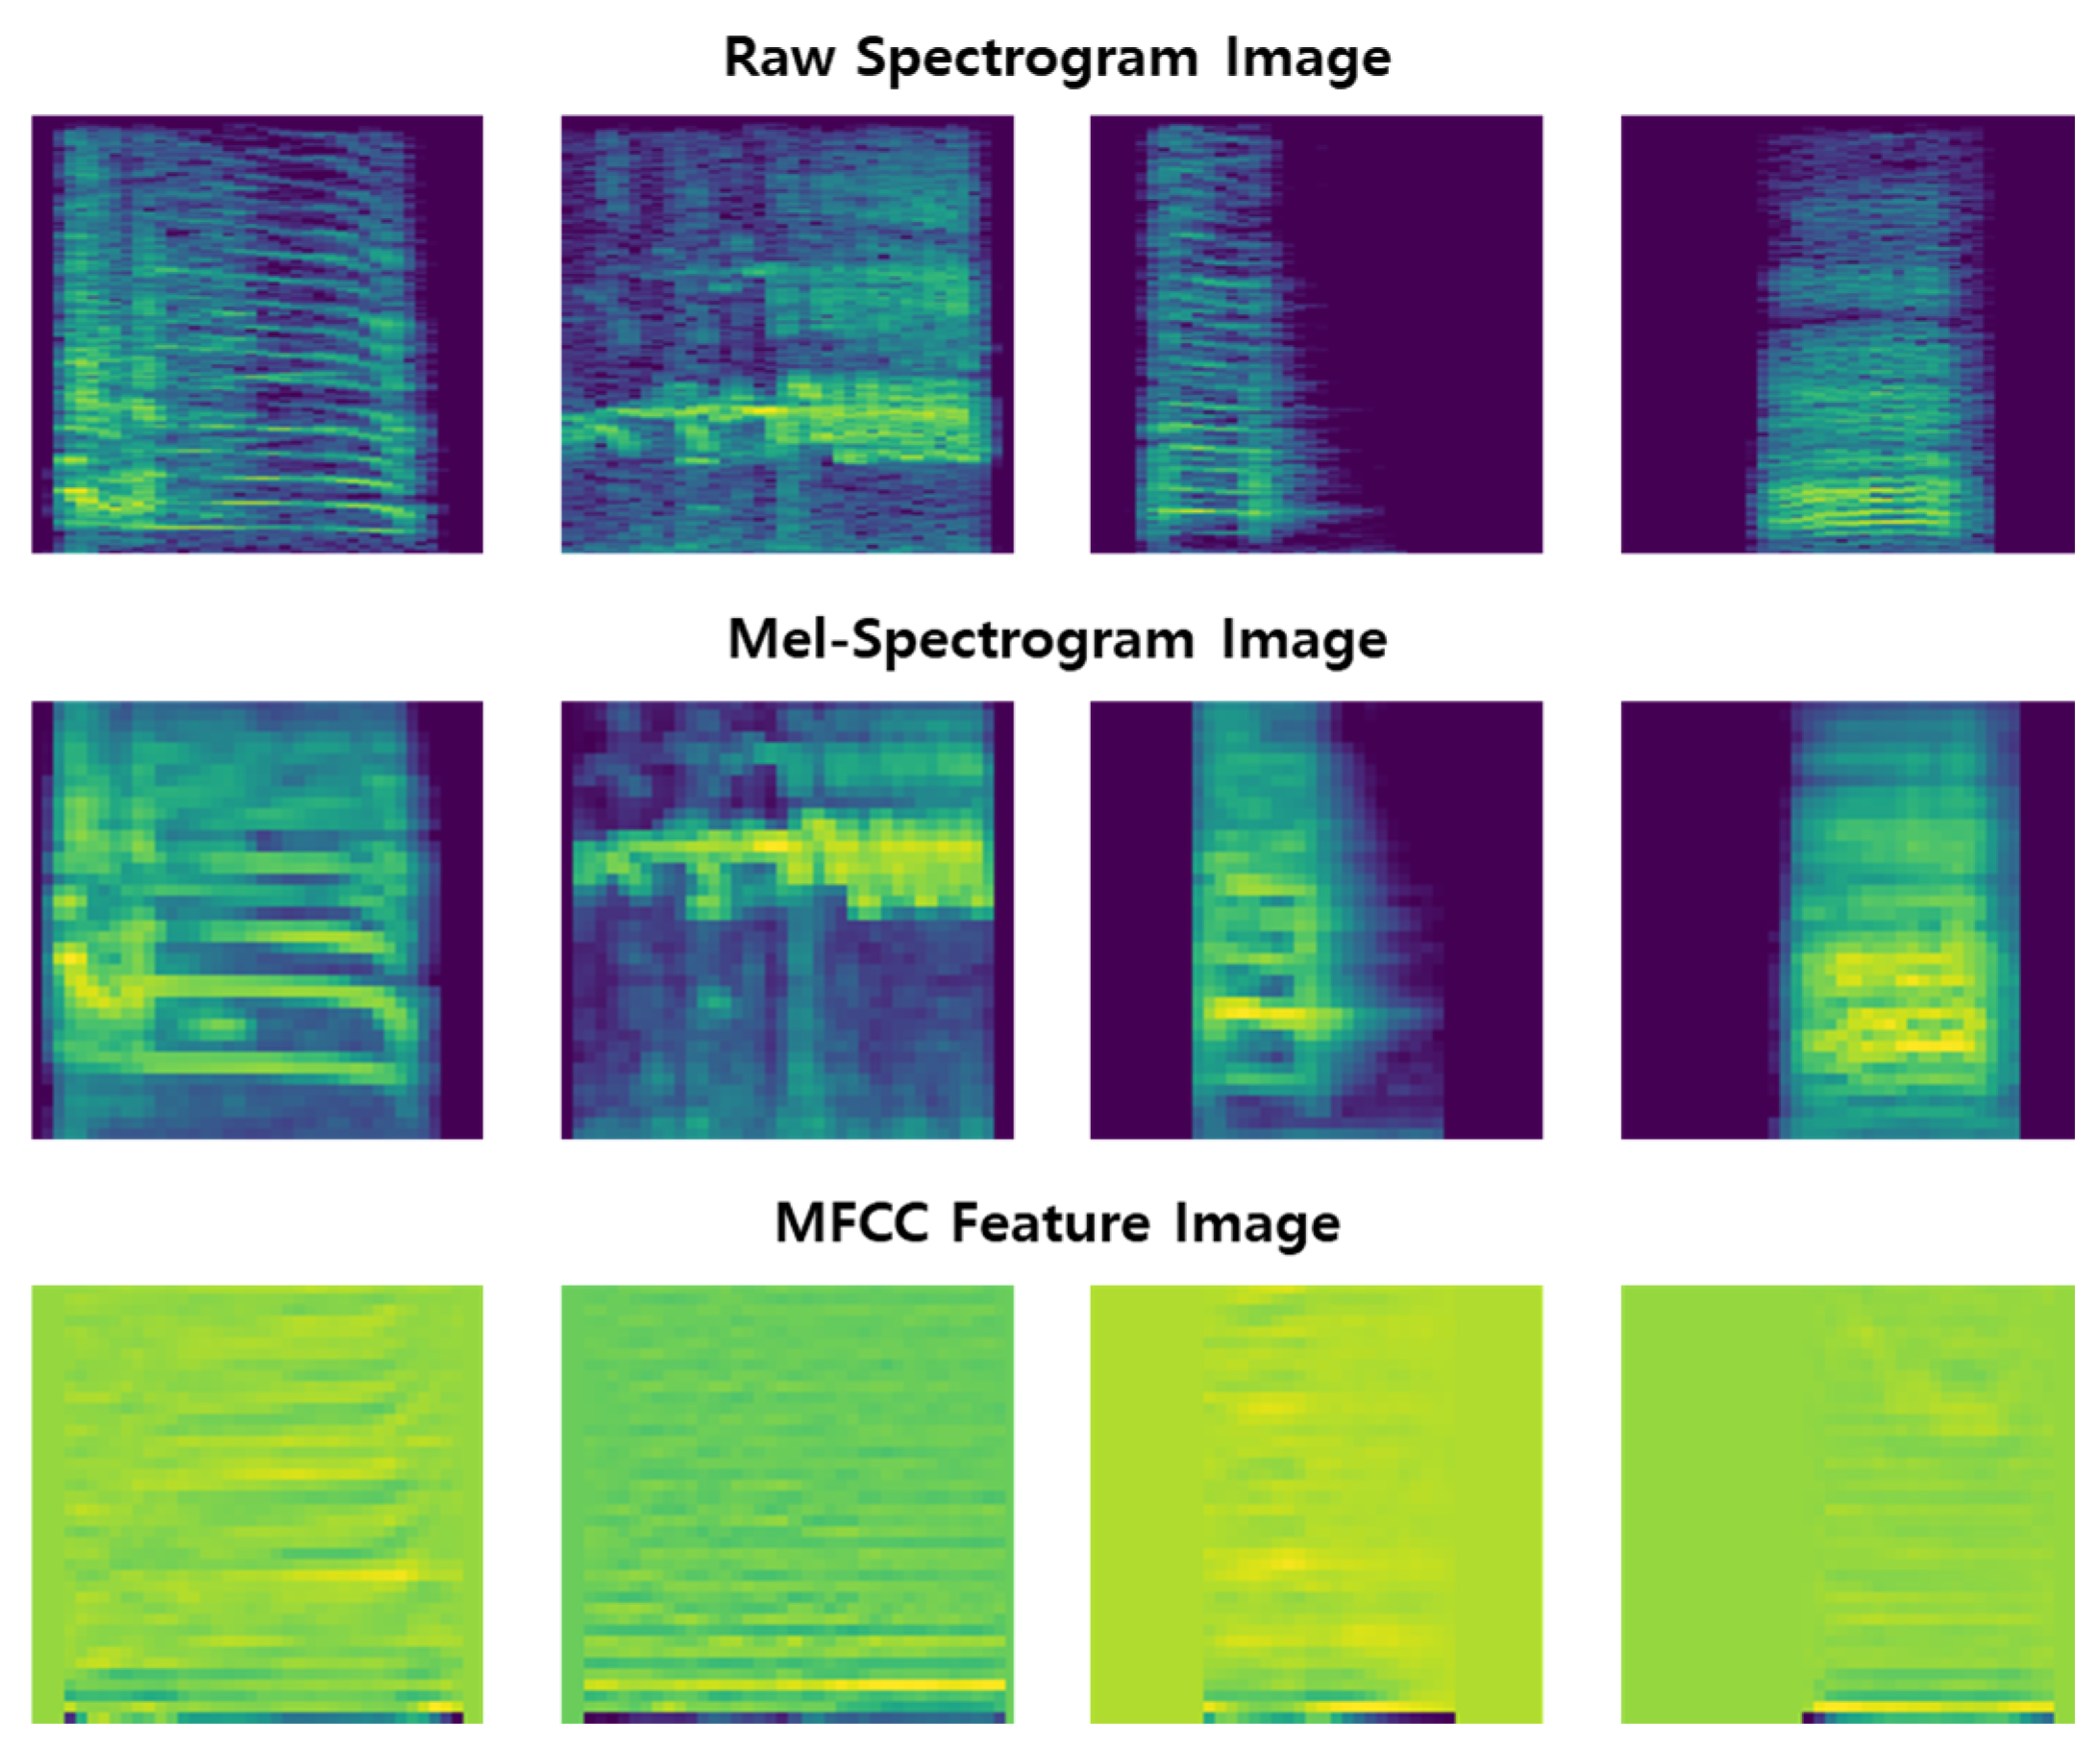
Commonly used acoustic features include time-domain features such as pitch, intensity, jitter, and RMS and frequency-domain features such as formant frequencies and MFCCs [5,6,7]. Spectrograms are capable of capturing both temporal and frequency information and are therefore widely used as input representations for AI-based classification tasks [14]. A spectrogram is generated by applying the short-time Fourier transform (STFT) to audio data, creating a two-dimensional time–frequency representation that can be used directly in neural network training or visualized as an image for image-based learning models. Figure 1 shows an example image of a generated spectrogram [15,16].

Figure 1.
Acoustic spectrogram image.
The Mel-spectrogram is a variant of the spectrogram that reflects human auditory perception. Since human sensitivity to sound decreases as frequency increases, the Mel-scale adjusts the frequency axis using a Mel-filter bank, as shown in Figure 2. Applying this filter bank to an STFT-based spectrogram yields Mel-spectrum frames for each frequency band. These frames are stacked to form a Mel-spectrogram as shown in Figure 3, which retains the essential acoustic characteristics while reducing data dimensionality.
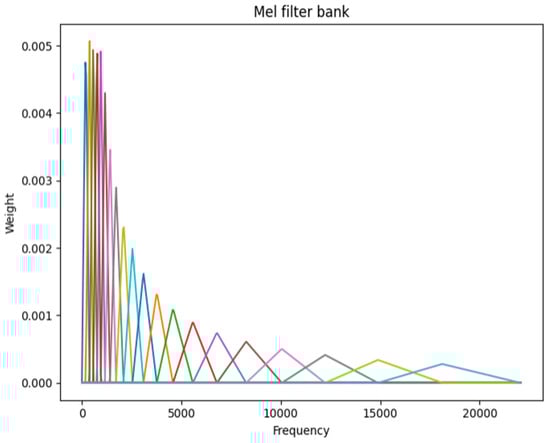
Figure 2.
Mel-filter bank (number of Mel bands: 20). Each colored line indicates a filter designed according to the mel scale.
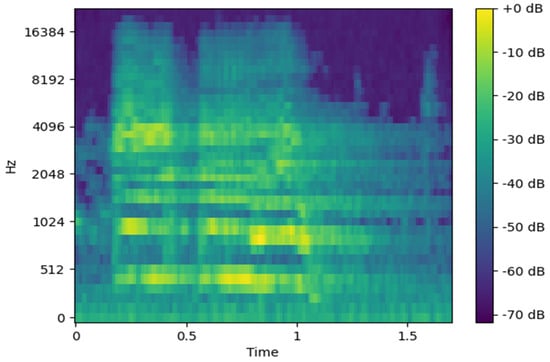
Figure 3.
Mel-spectrogram image.
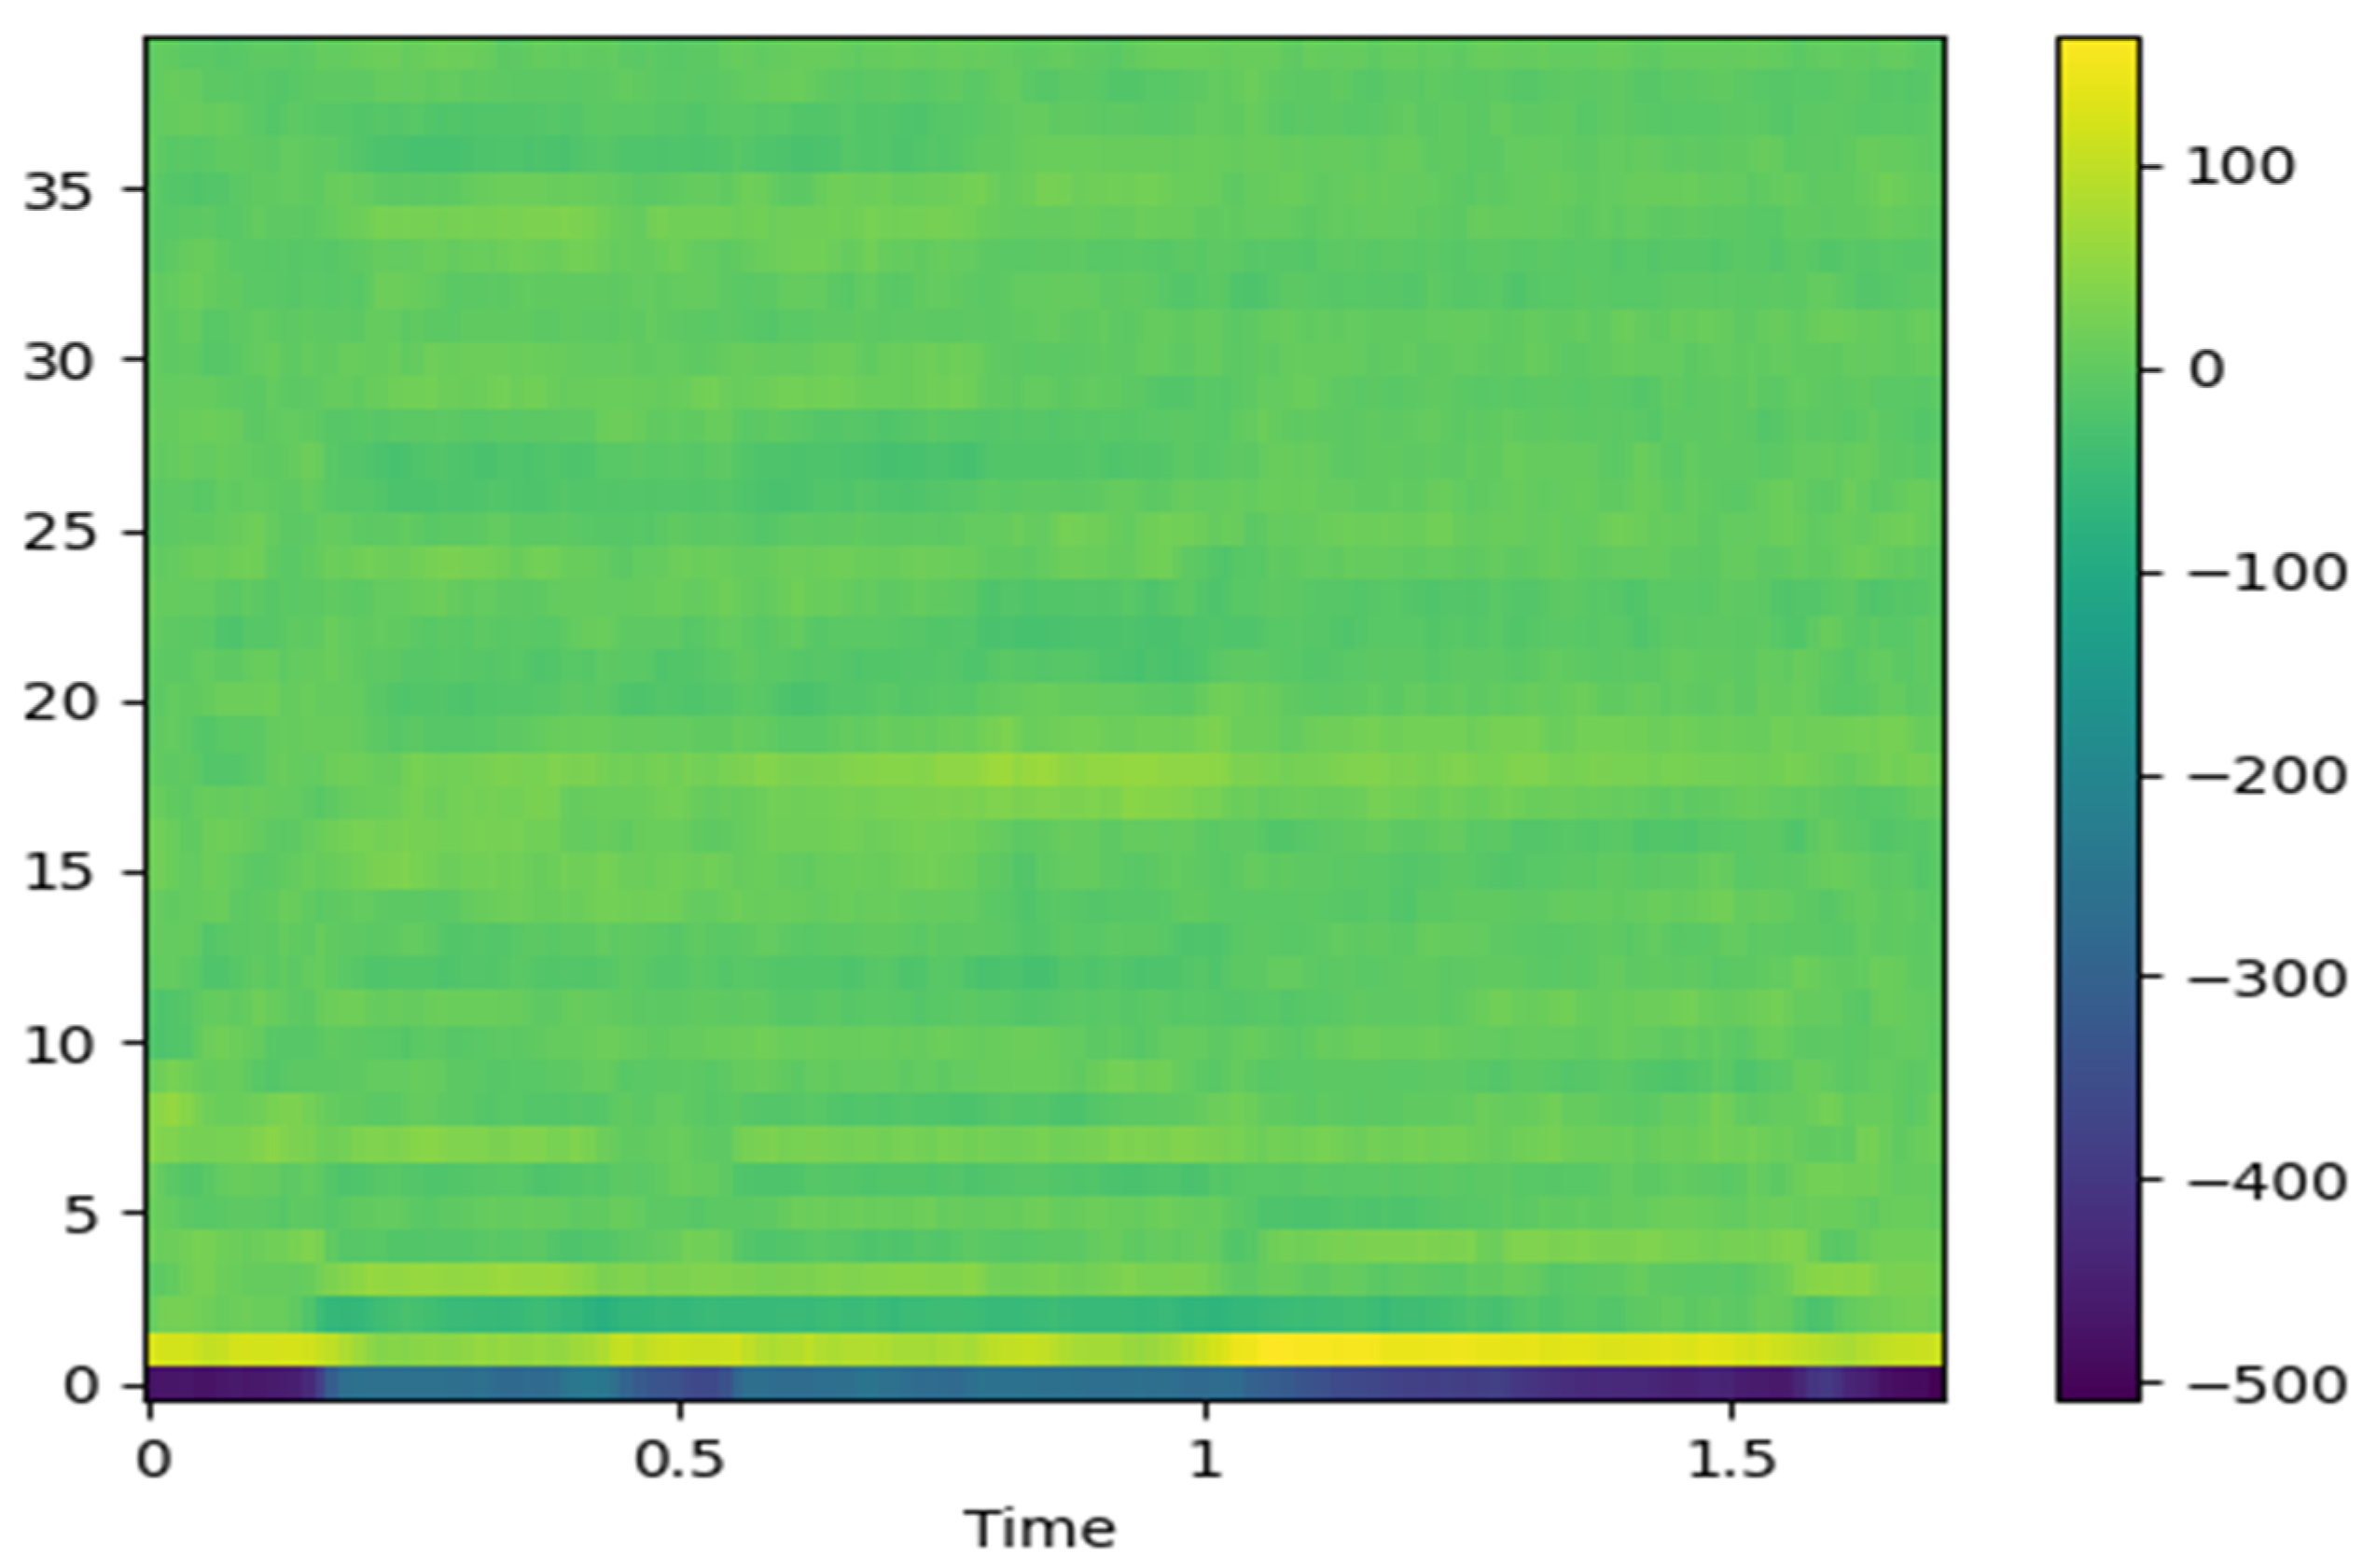
Mel-frequency cepstral coefficients (MFCCs) are derived from a Mel-spectrogram by applying a discrete cosine transform (DCT). This transformation removes frequency correlations and compresses the data by concentrating most of the information into lower-order coefficients [17,18]. The resulting MFCCs, as shown in Figure 4, provide a compact yet informative representation of the original acoustic signal.
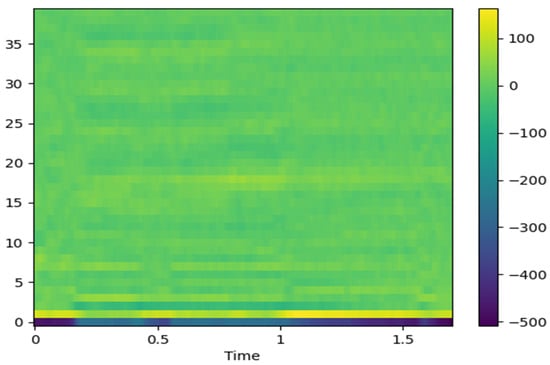
Figure 4.
MFCC feature image.
3. Proposed Method
In this study, we propose a method for detecting abnormal symptoms using convolutional neural networks (CNNs) and spectrogram-based features derived from acoustic data. Spectrograms are two-dimensional representations that capture the temporal and frequency characteristics of acoustic signals. CNNs are well suited for learning local patterns in such two-dimensional data, making them an appropriate choice for analyzing spectrograms.
The proposed model is designed to learn patterns associated with abnormal symptoms using acoustic data collected from livestock vocalizations and other animal sounds. Feature vectors, including spectrograms, Mel-spectrograms, and MFCCs (see Figure 1, Figure 3 and Figure 4), were extracted from the raw data and used as input for model training.
3.1. Acoustic Signal Processing and Feature Vector Extraction
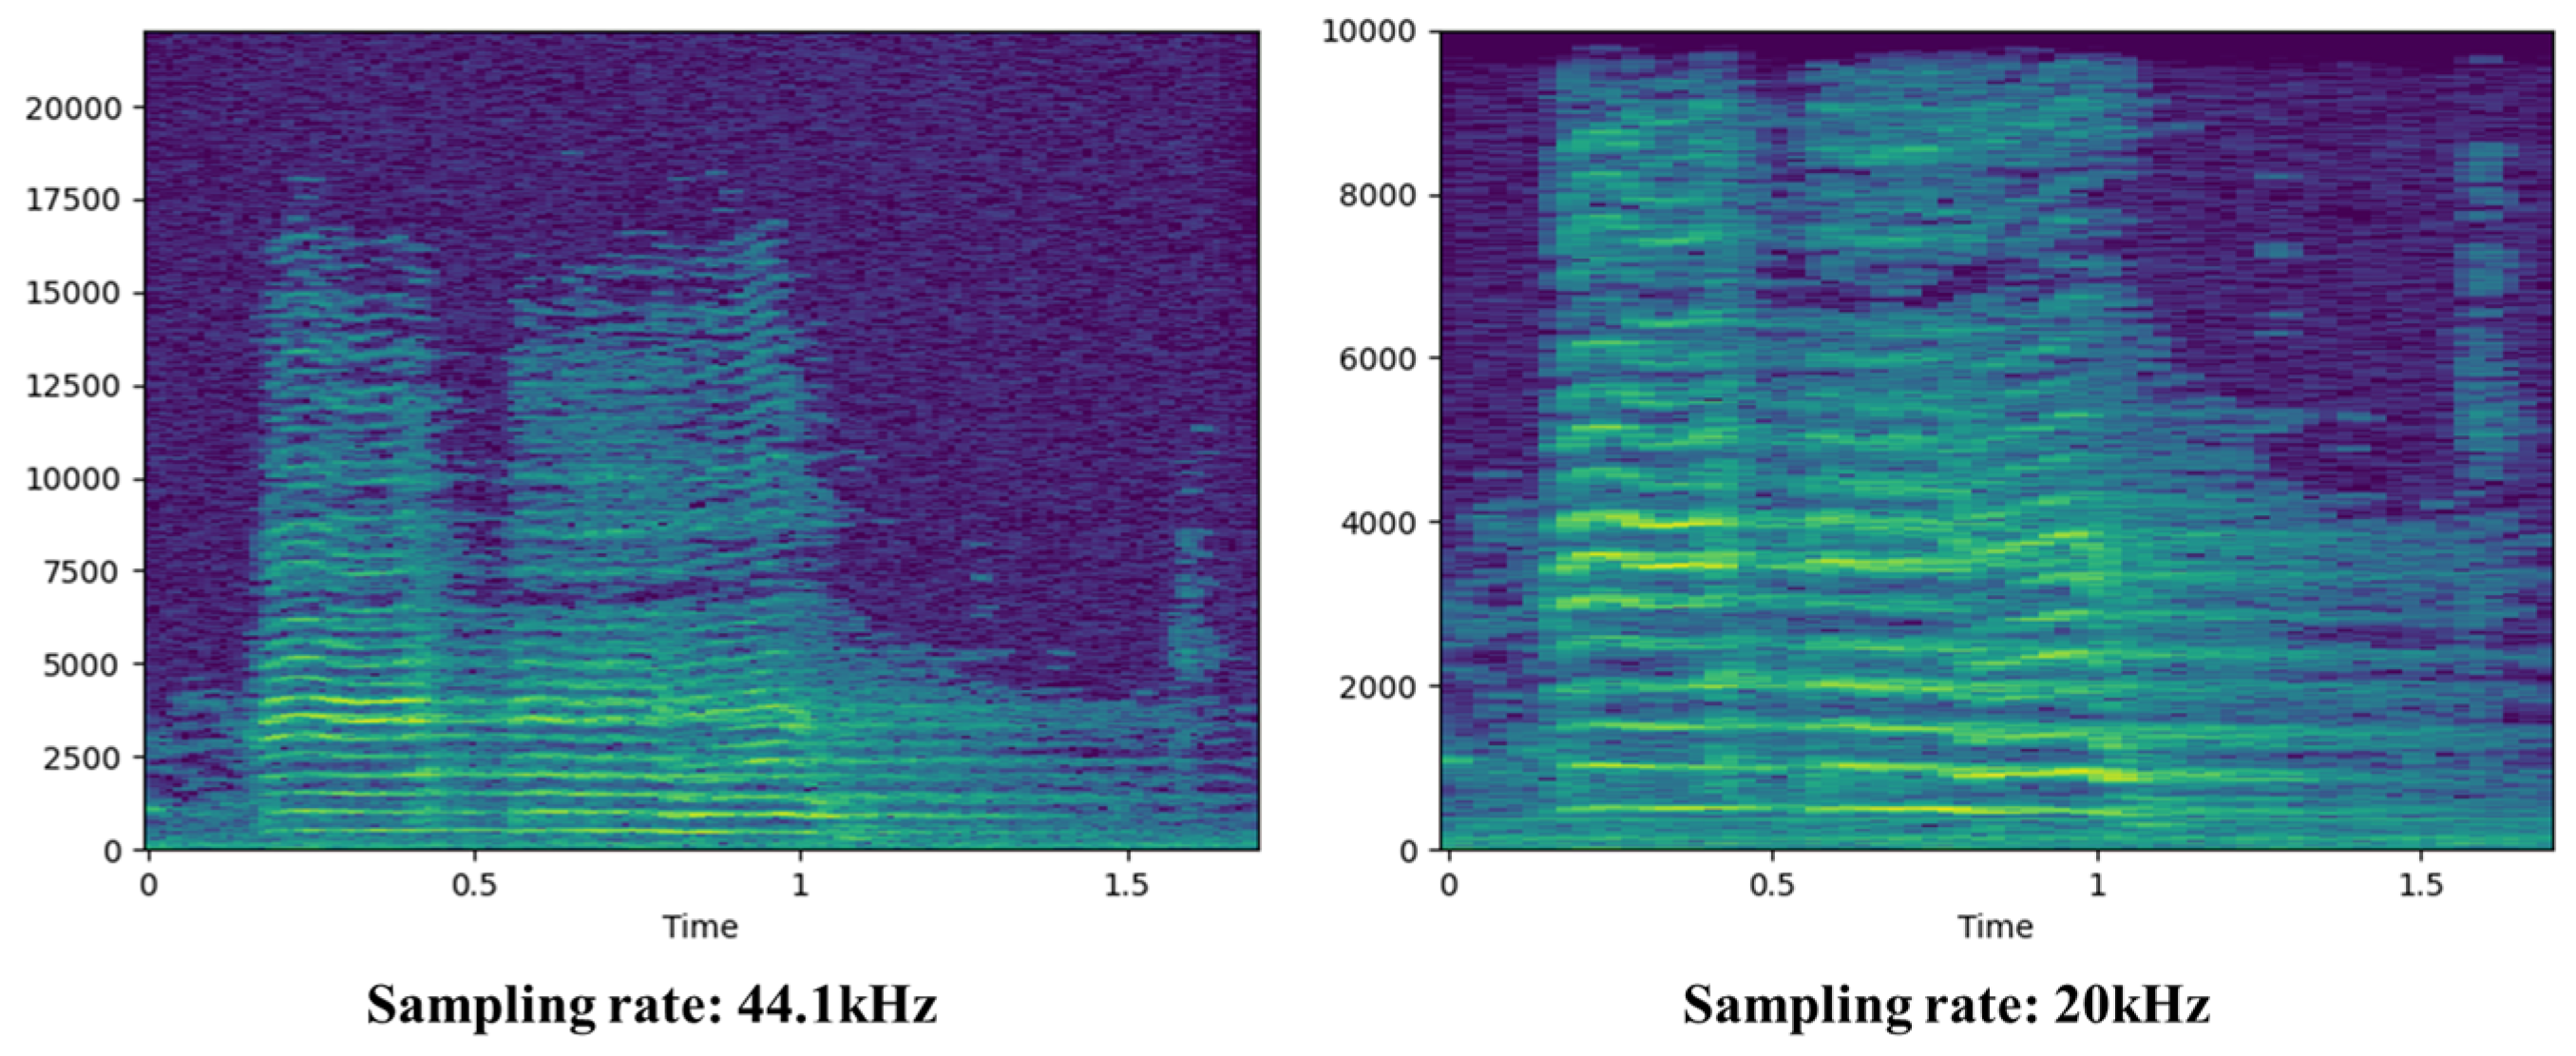
To prepare the acoustic signals for model training, a preprocessing step was first applied. The raw audio data were resampled to 20 kHz, as most characteristic information of the signals lies below 10 kHz as shown in Figure 5.

Figure 5.
Acoustic data sampling rate normalization.
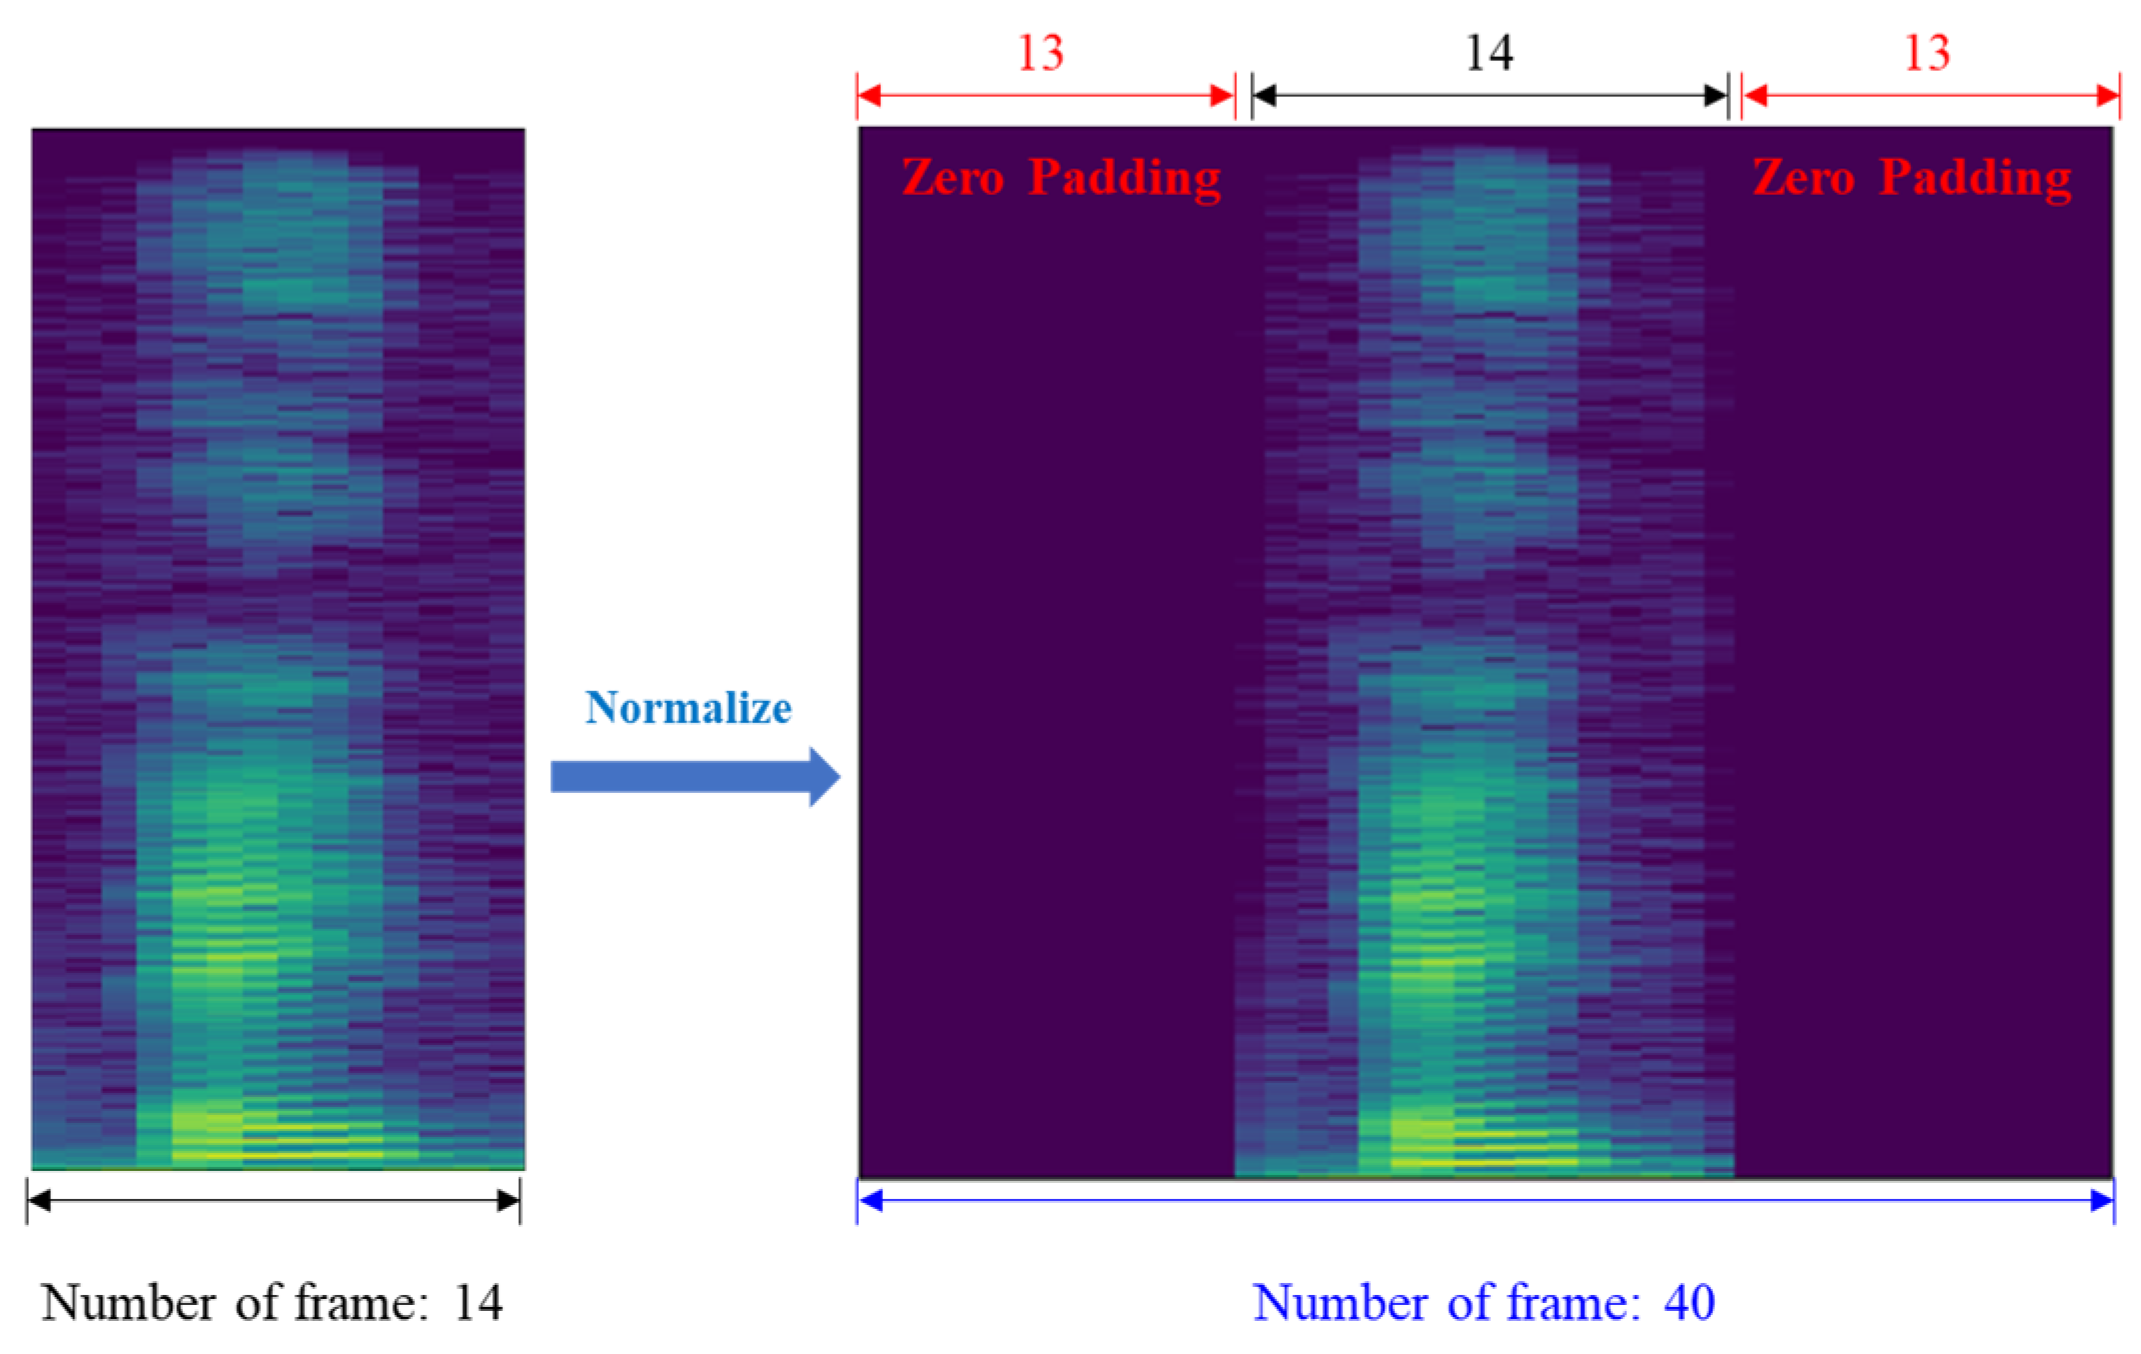
This sampling rate ensures that the frequency components of interest are retained, in accordance with Nyquist’s theorem. Next, the spectrograms were extracted using the short-time Fourier transform (STFT). A window length of 2048 samples (approximately 100 ms) with a 512-sample (about 25 ms) overlap was used. Given that each audio file contains up to 20,000 samples, the STFT generates a maximum of 40 time frames. The resulting spectrogram is a two-dimensional matrix representing the magnitude (in decibels) of each frequency band over time. To generate Mel-spectrograms and MFCCs, the spectrogram was processed using a Mel-filter bank with 40 bands. This step produces 40 Mel-spectrum values per time frame. MFCCs were computed by applying a discrete cosine transform (DCT) to the Mel-spectrogram, resulting in 40 coefficients.
As the dataset includes audio segments of varying lengths, the number of time frames for each sample is inconsistent. To address this, zero-padding was applied to the beginning and end of each acoustic sample, as shown in Figure 6, so that all inputs had a uniform length of 40 frames.
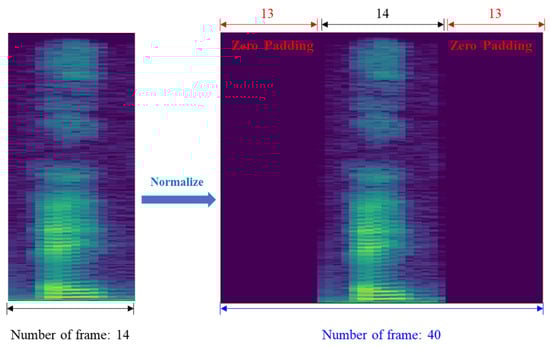
Figure 6.
Zero-padding for acoustic data length normalization.
This ensures that the model receives inputs of consistent shape, improving training efficiency and performance. All feature vectors were saved as 160 × 160-pixel PNG image files for use in the CNN training pipeline (see Figure 7).
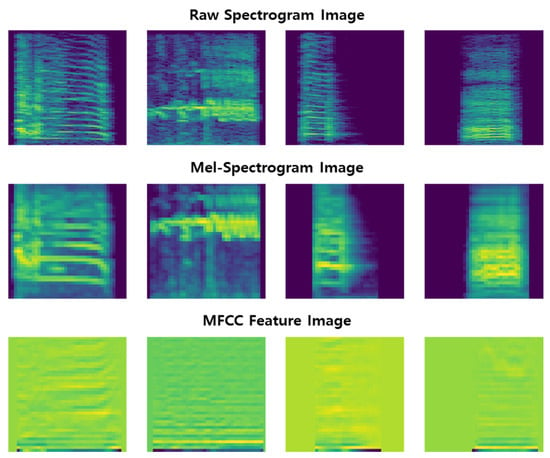
Figure 7.
This figure presents examples of feature vector extraction and visualization for data samples labeled as abnormal, chick, and normal (the third and fourth), displayed from left to right.
3.2. Design of the Acoustic Abnormal Symptom Detection Model
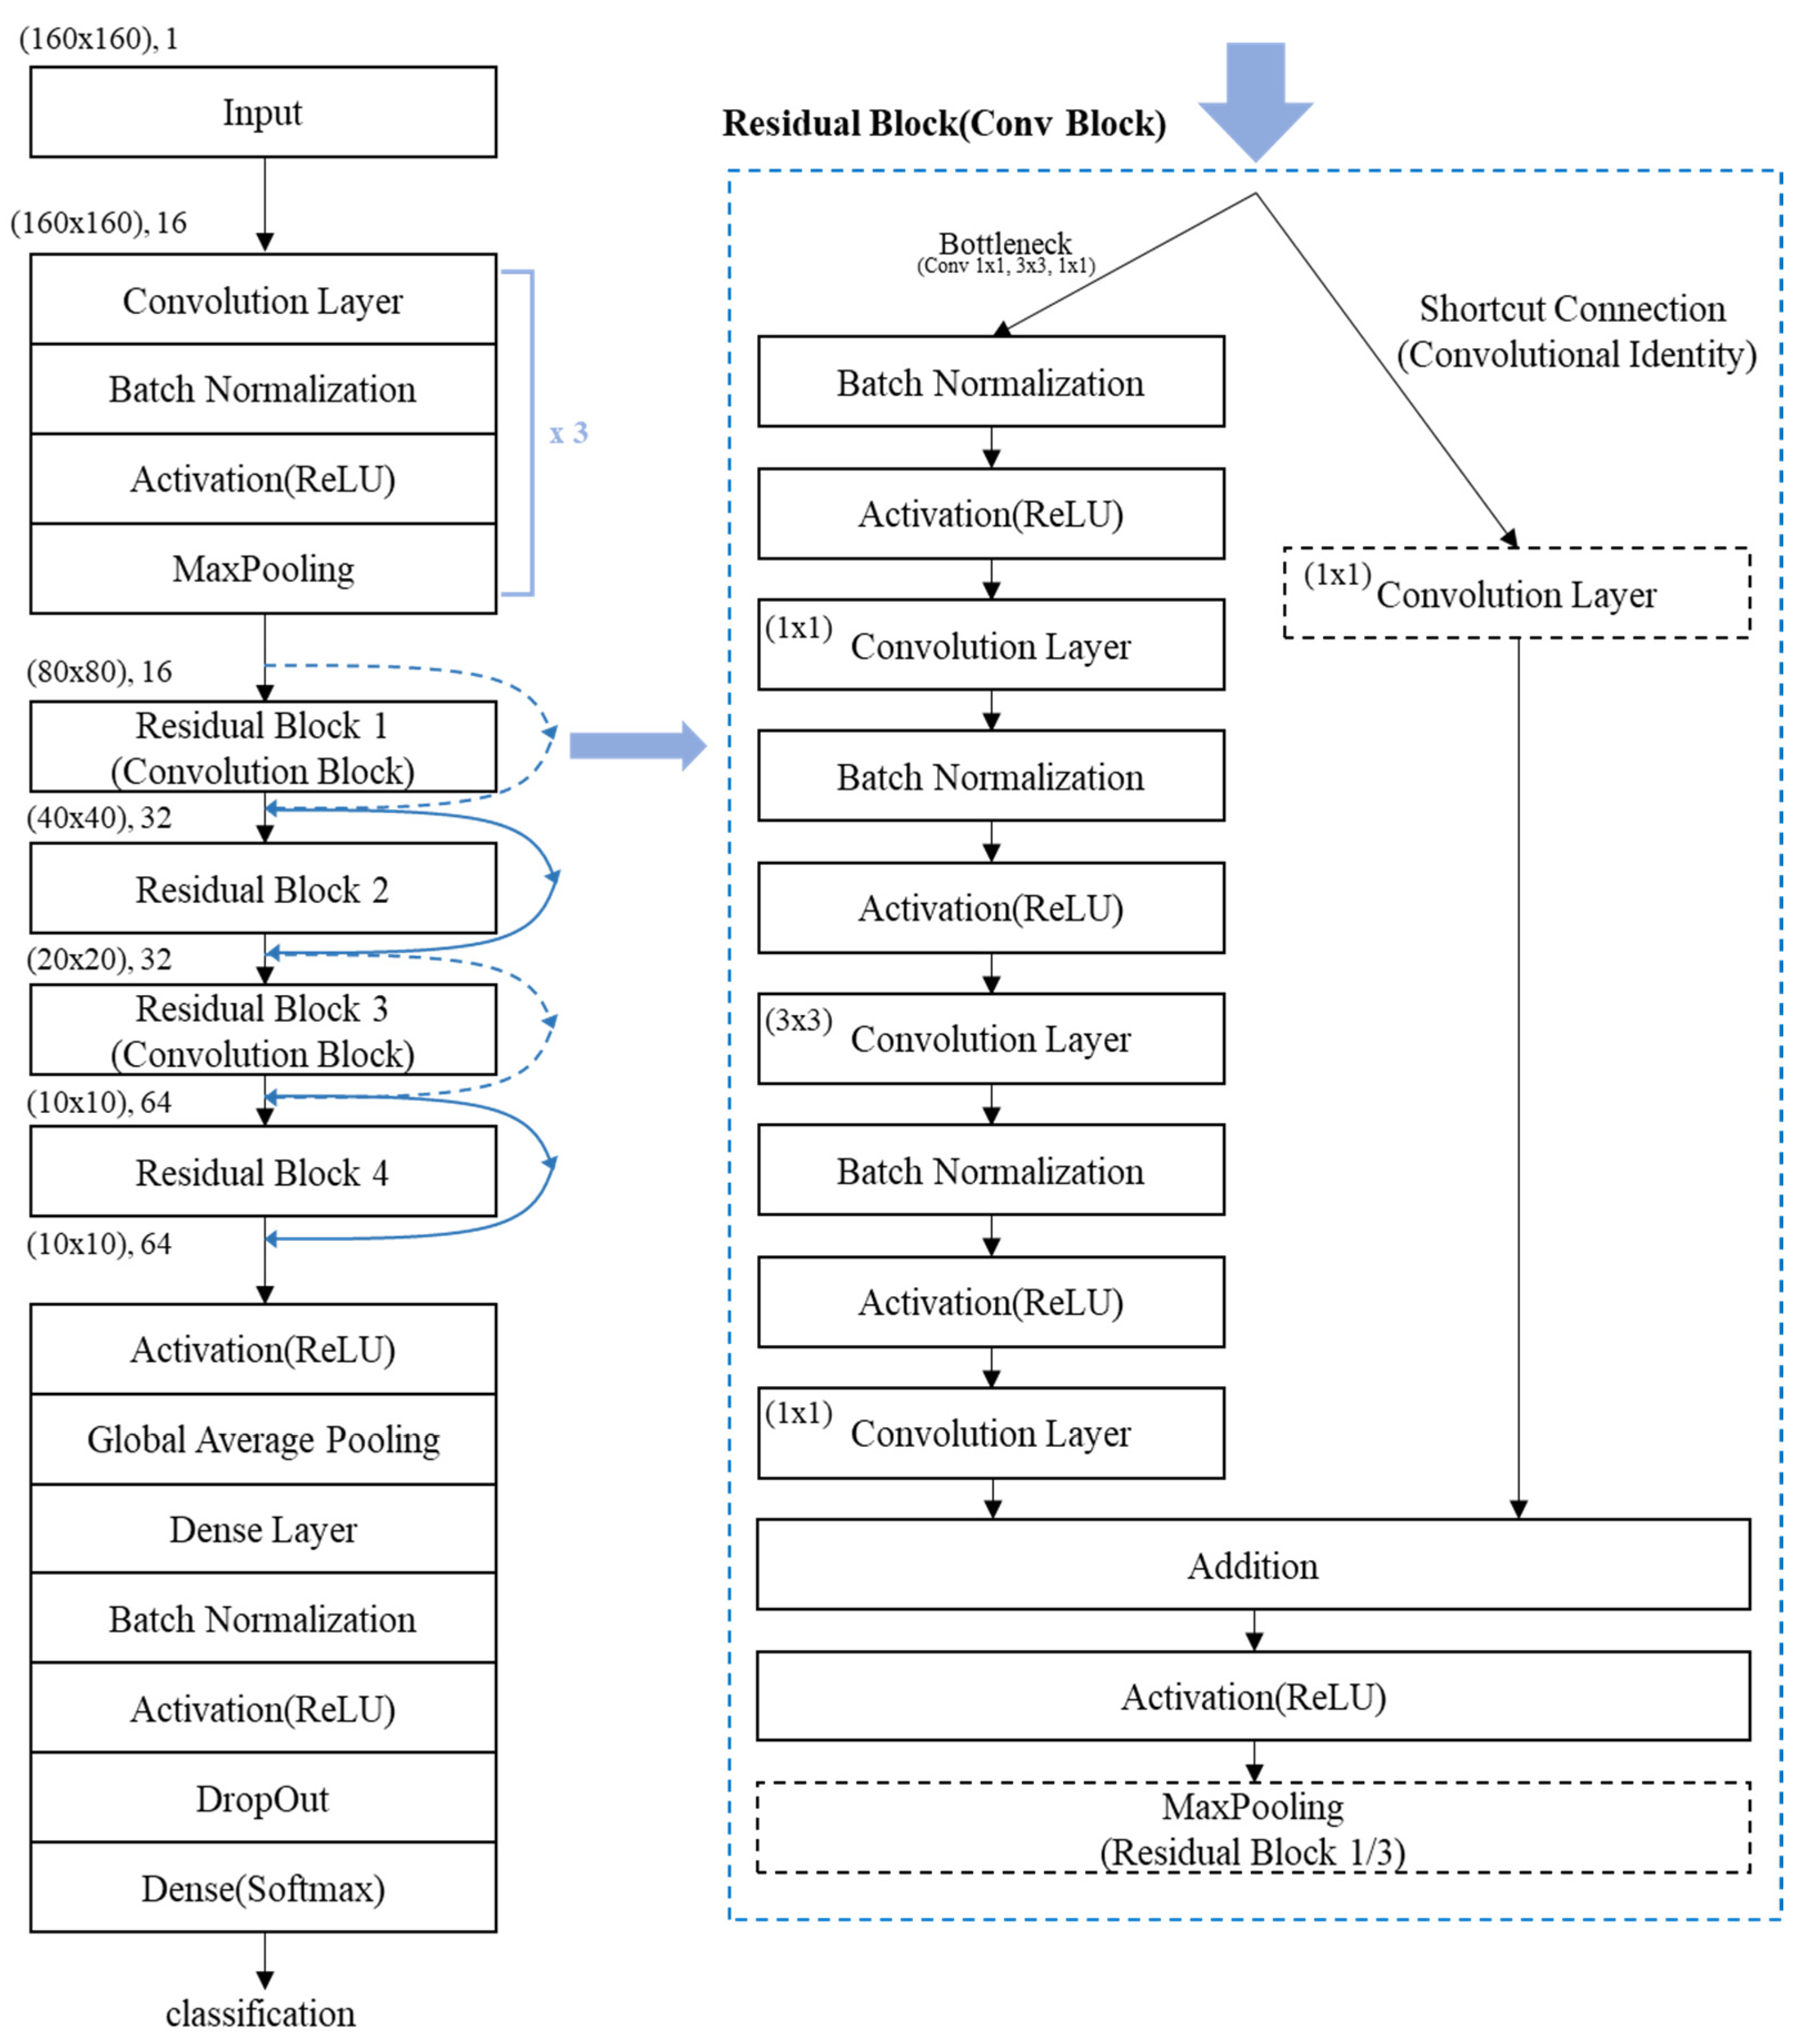
The proposed model visualizes and utilizes spectrograms, Mel-spectrograms, and MFCCs extracted from acoustic data as input for CNN-based training. The model architecture is based on a customized ResNet structure incorporating residual connections and Bottleneck blocks, as illustrated in Figure 8 and Figure 9. The Bottleneck structure is composed of sequential 1 × 1, 3 × 3, and 1 × 1 convolutional layers. It reduces the number of parameters and removes irrelevant noise while preserving essential features [19]. This structure enables efficient parameter usage even in deeper layers of the network and contributes to a lighter model design with a lower computational cost. Residual connections are implemented using convolutional blocks, which include 1 × 1 convolution layers in the shortcut paths. These connections standardize feature map dimensions and maintain compatibility between layers [14]. Pooling operations are applied selectively within the first and third Residual Blocks to prevent excessive downsampling and ensure that spatial resolution is preserved.
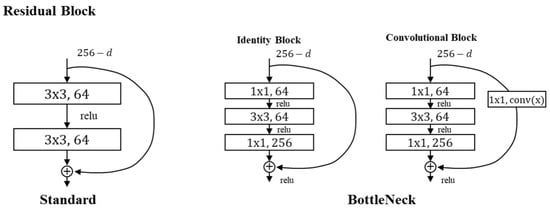
Figure 8.
Standard and Bottleneck structures of the Residual Blocks.
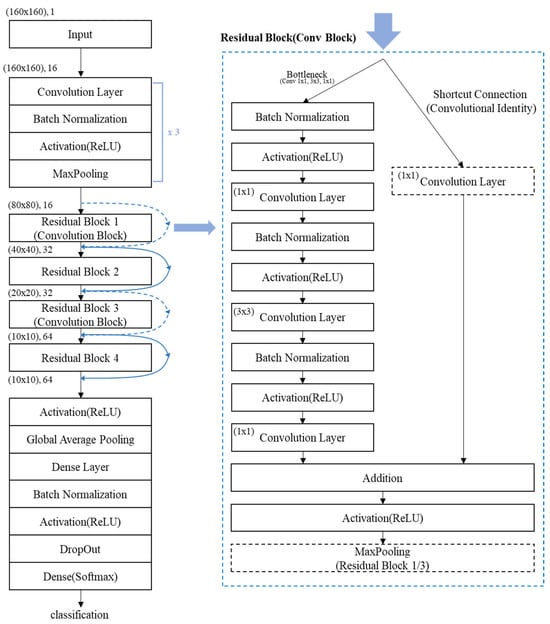
Figure 9.
Architecture of the acoustic abnormal symptom detection model.
Figure 9 illustrates the architecture of the custom ResNet-based model developed in this study for detecting abnormal symptoms in acoustic signals. The model accepts spectrogram, Mel-spectrogram, and MFCC feature representations as input and extracts their salient patterns through a series of convolutional operations, activation functions, and max-pooling layers. The process begins with convolutional layers that generate feature maps by applying learnable filters to the input data. These feature maps are then standardized using batch normalization, which ensures that values are distributed within a normalized range (typically between 0 and 1). Batch normalization helps equalize the contribution of each feature, stabilizes the learning process, and accelerates convergence by mitigating shifts in the input distribution of each layer during training. Following normalization, the data pass through an activation function (ReLU), which introduces non-linearity to the model. This non-linear transformation is essential for enabling the network to learn complex and abstract patterns. The resulting activated feature maps are subsequently downsampled through max-pooling operations. Pooling reduces the spatial dimensions of the data, enhances computational efficiency, and retains the most dominant features for further processing. The pooled feature maps are then propagated through multiple Residual Blocks. These blocks progressively reduce dimensionality while simultaneously refining the extracted features. The residual connections within each block enable the network to bypass specific layers by directly adding the input to the output of subsequent layers. This architectural design addresses the vanishing and exploding gradient problems commonly encountered in deep networks, ensuring more stable and efficient training as depth increases. Furthermore, the inclusion of both batch normalization and dropout techniques within the model contributes to improved generalization performance. While batch normalization maintains consistent input distributions across layers, dropout randomly deactivates a portion of neurons during training, preventing overfitting by reducing co-adaptation of features. These techniques work in synergy to support a deeper and more robust network architecture capable of accurately detecting abnormal acoustic symptoms from diverse input formats [20].
The Residual Blocks in the proposed model are implemented using a Bottleneck structure, which first reduces the dimensionality of the input feature maps and then restores it. This approach effectively filters out irrelevant noise while preserving critical features, thereby enhancing computational efficiency without compromising model performance. In particular, the first and third Residual Blocks are configured as Convolution Blocks, where a 1 × 1 convolutional layer is applied in the shortcut connection. This design ensures that the dimensions of the input and output feature maps are aligned, allowing for seamless addition in the residual connection when feature map sizes differ due to downsampling or increased channel depth. Pooling operations within the Residual Blocks are selectively applied only in the first and third blocks. This design choice prevents excessive spatial reduction, which could result in a loss of important structural information and lead to blurred feature representations. By limiting pooling to specific blocks, the model retains fine-grained details essential for accurate classification. Following the sequence of Residual Blocks, the refined feature maps are passed to a dense (fully connected) layer, followed by a Softmax activation function. This final classification layer outputs the probability distribution across target classes, enabling the model to predict the category of each input sample with high accuracy.
4. Experiments and Results
4.1. Experimental Setup
In this study, livestock vocalization data were used for experimentation. The dataset consisted of audio recordings collected directly from operational livestock farming sites, along with publicly available open datasets that are free from copyright restrictions. Specifically, poultry vocalizations, including those from broilers and laying hens, were gathered from two commercial farms: a laying hen farm located in Wonju, Gangwon-do, and a broiler farm situated in Asan, Chungcheongnam-do, as shown in Figure 10. To supplement the dataset with vocalizations associated with clinically abnormal symptoms, additional recordings were conducted at the experimental poultry farm of the College of Veterinary Medicine at Seoul National University, Pyeongchang Campus.
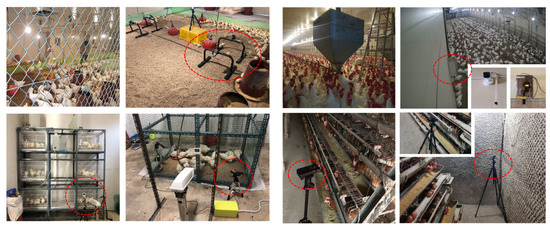
Figure 10.
Experimental Environment for Poultry Data Collection.
The recording environments may have included varying levels of background noise due to typical farm activity and the presence of multiple animals. To ensure data quality, vocalizations were carefully selected based on clarity, with an emphasis on minimizing background interference and avoiding occlusion from overlapping sounds produced by other birds.
The classification of abnormal data was carried out in consultation with a faculty expert in poultry clinical veterinary medicine from the College of Veterinary Medicine at Seoul National University. According to the expert, poultry infected with respiratory diseases commonly exhibit distinguishable vocal symptoms such as sneezing or wheezing, which are often accompanied by phlegmy or labored breathing sounds. Based on this professional assessment, vocal samples suspected to be abnormal were initially identified and then subjected to a review process to ensure clinical relevance. As a result, only those vocalizations that exhibited clear indications of potential respiratory infection or disease were verified and incorporated into the abnormal symptom dataset.
In addition to chicken vocalizations, the dataset also included non-poultry acoustic samples corresponding to Class 3 and Class 4, such as dog barking and cat meowing sounds. Although these sounds are not directly associated with poultry vocal behavior, they were incorporated as supplementary input for training and evaluating the deep learning model. The inclusion of unrelated animal sounds enables the assessment of the model’s ability to accurately identify abnormal poultry vocalizations while effectively distinguishing them from non-target acoustic events. This serves as an important step in validating the model’s robustness and applicability in real-world farm environments, where various background sounds frequently coexist. Moreover, training with a diverse range of acoustic inputs helps mitigate the risk of overfitting to specific datasets. It also contributes to enhancing the model’s generalization performance across different types of acoustic scenarios [21].
The data for Class 3 and Class 4 were obtained from two publicly available datasets: ESC-50 [22] and ARCA23K [23]. ESC-50 is a curated dataset consisting of 50 categories of environmental audio recordings, including vocalizations from domestic animals such as dogs, hens, pigs, and cows. ARCA23K (Automatically Retrieved and Curated Audio) is a large-scale dataset containing animal and nature sounds collected from various web sources, intended for use in machine learning research. In addition, Class 0 (normal poultry vocalization) data were also supplemented with samples from the ESC-50 dataset. This strategy helps prevent bias toward specific recording locations or environmental noise conditions and reduces the risk of overfitting to a single dataset.
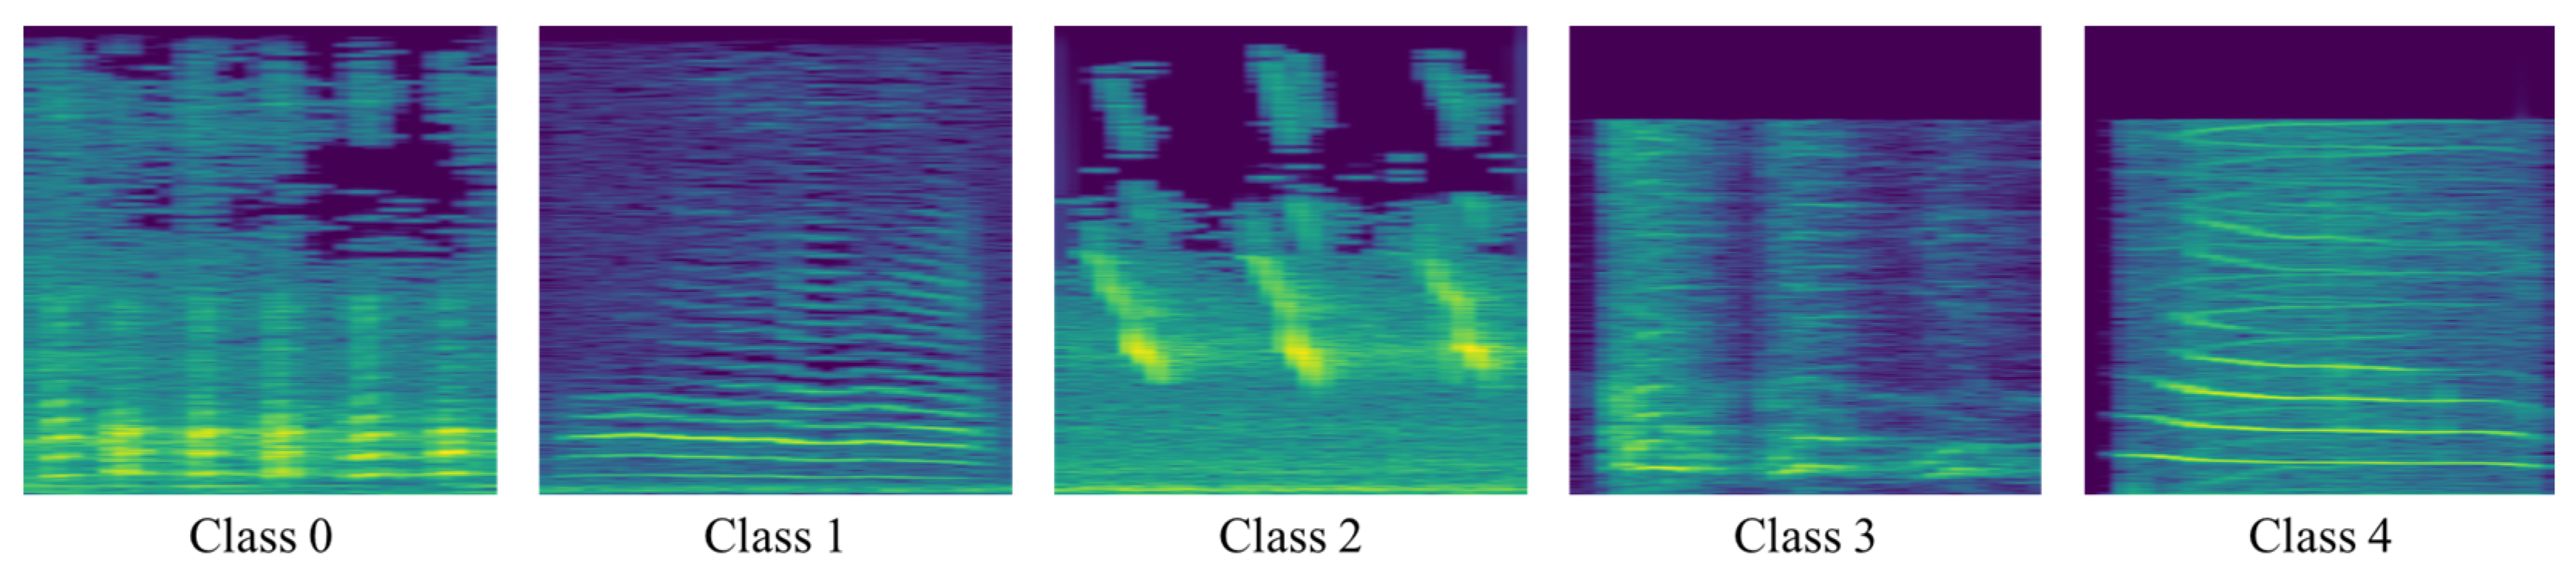
The full dataset was categorized into five distinct classes, each representing a specific type of acoustic data. Table 1 presents the number of samples used for training and testing in each class, while Table 2 summarizes the characteristics associated with each class label. Figure 11 shows example spectrogram images for each class, illustrating the differences in acoustic patterns across the dataset.

Table 1.
Experimental dataset composition.
Table 2.
Experimental dataset label information.
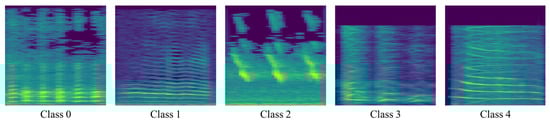
Figure 11.
Example spectrogram images by data classification.
4.2. Acoustic Abnormal Symptom Detection Experiment Result
In this study, spectrogram, Mel-spectrogram, and MFCC data obtained through preprocessing were converted into 160 × 160-pixel image files in PNG format. These images were used as input for training and validation. The data were applied to the model architecture described in Figure 9, and three separate models were trained, each using a different type of input. Model performance was evaluated using a test dataset that was not included in training, and the results are summarized in Table 3.
Table 3.
Model performance by data type.
As shown in Table 3, the models trained on different feature types exhibited clear differences in classification performance. The spectrogram-based model achieved an accuracy of 95.22%, while the MFCC-based model showed a detection accuracy of 93.78%. The Mel-spectrogram-based model outperformed the others, achieving an accuracy of 97.13%. Model performance was evaluated using accuracy, precision, recall, and F1-score. To further assess the effectiveness of the proposed model, it was compared with an SVM, a plain CNN, and the ResNet50 model trained on Mel-spectrogram data. As shown in Table 4, the proposed model achieved an accuracy of 97.37% and an F1-score of 96.87%, exceeding the performance of both the SVM and the plain CNN model without residual connections.
Table 4.
Performance comparison between proposed model and baseline models (Mel-spectrogram).
5. Conclusions
This study proposed a deep-learning-based method for detecting abnormal symptoms using spectrogram representations derived from livestock vocalizations. By converting acoustic signals into time–frequency representations such as spectrograms, Mel-spectrograms, and MFCCs and applying a convolutional neural network architecture, the model was able to learn relevant acoustic patterns associated with abnormal vocal symptoms.
Among the feature types evaluated, the model trained on Mel-spectrograms achieved the highest classification accuracy at 97.13%. This result demonstrates the importance of input representation in acoustic classification tasks, as Mel-spectrograms emphasize perceptually relevant frequency components through the use of Mel-filter banks. In contrast, models using spectrogram and MFCC inputs showed slightly lower performance, suggesting that some information may be lost or underutilized depending on the feature extraction process.
The proposed model was also found to be significantly more lightweight than standard deep networks such as ResNet50, while maintaining comparable accuracy. This balance between performance and model size supports the feasibility of deploying the model in resource-constrained environments, including on-device or edge-based systems used in real-time monitoring applications.
In addition, the dataset used in this study was carefully constructed through a combination of field recordings from actual poultry farms and expert-validated annotations. The inclusion of unrelated animal sounds and environmental noise allowed for robust evaluation under conditions that simulate real farm environments. These design choices contributed to improving the model’s generalization performance and practical applicability.
Future research will aim to expand this approach to other livestock species by collecting and analyzing a wider range of vocalization data. Efforts will also focus on implementing real-time processing and lightweight deployment on edge devices to support continuous monitoring in farm environments. In particular, applying compact models to IoT-based farm systems is expected to enable non-invasive and continuous health monitoring across various livestock management settings.
We hope that this study contributes to ongoing research in acoustic-based health monitoring and inspires further development of intelligent livestock management systems.
Author Contributions
Conceptualization, S.-Y.K. and H.-W.K.; data curation, S.-Y.K. and H.-M.L.; formal analysis, S.-Y.K. and C.-Y.L.; funding acquisition, H.-W.K.; methodology, S.-Y.K. and H.-W.K.; investigation, S.-Y.K., C.-Y.L. and H.-M.L.; resources, H.-W.K.; software, S.-Y.K.; project administration, H.-W.K.; validation, S.-Y.K., H.-M.L. and H.-W.K. writing—original draft preparation, S.-Y.K. writing—review and editing, S.-Y.K., H.-M.L., C.-Y.L. and H.-W.K. All authors have read and agreed to the published version of the manuscript.
Funding
This work was supported by the Institute of Information & Communications Technology Planning & Evaluation (IITP) grant funded by the Korean government (MSIT) (No. 2022-0-01000, Development of 5G Edge Computing SW for Flexible Healthcare to Support Mobile Customized Medical Services).
Institutional Review Board Statement
Not applicable.
Informed Consent Statement
Not applicable.
Data Availability Statement
The data presented in this study are available on reasonable request from the corresponding author.
Conflicts of Interest
The authors declare no conflicts of interest.
References
- Mallegni, N.; Molinari, G.; Ricci, C.; Lazzeri, A.; La Rosa, D.; Crivello, A.; Milazzo, M. Sensing Devices for Detecting and Processing Acoustic Signals in Healthcare. Biosensors 2022, 12, 835. [Google Scholar] [CrossRef] [PubMed]
- Boschi, V.; Catricalà, E.; Consonni, M.; Chesi, C.; Moro, A.; Cappa, S.F. Connected Speech in Neurodegenerative Language Disorders: A Review. Front. Psychol. 2017, 8, 269. [Google Scholar] [CrossRef] [PubMed]
- Baur, S.; Nabulsi, Z.; Weng, W.-H.; Garrison, J.; Blankemeier, L.; Fishman, S.; Chen, C.; Kakarmath, S.; Maimbolwa, M.; Sanjase, N.; et al. HeAR--Health Acoustic Representations. arXiv 2024. [Google Scholar] [CrossRef]
- Exadaktylos, V.; Silva, M.; Ferrari, S.; Guarino, M.; Taylor, C.J.; Aerts, J.M.; Berckmans, D. Time-series analysis for online recognition and localization of sick pig (Sus scrofa) cough sounds. J. Acoust. Soc. Am. 2008, 124, 3803–3809. [Google Scholar] [CrossRef] [PubMed]
- Lee, J.; Noh, B.; Jang, S.; Park, D.; Chung, Y.; Chang, H.H. Stress detection and classification of laying hens by sound analysis. Asian-Australas. J. Anim. Sci. 2015, 28, 592–598. [Google Scholar] [CrossRef] [PubMed]
- Liu, L.; Li, B.; Zhao, R.; Yao, W.; Shen, M.; Yang, J. A Novel Method for Broiler Abnormal Sound Detection Using WMFCC and HMM. J. Sens. 2020, 2020, 2985478. [Google Scholar] [CrossRef]
- Craciun, A.; Paulus, J.; Sevkin, G.; Bäckström, T. Modeling Formant Dynamics in Speech Spectral Envelopes. In Proceedings of the 2017 25th European Signal Processing Conference (EUSIPCO), Kos, Greece, 28 August–2 September 2017; pp. 1669–1673. [Google Scholar] [CrossRef]
- Van Hirtum, A.; Berckmans, D. Objective recognition of cough sound as biomarker for aerial pollutants. Indoor Air 2004, 14, 10–15. [Google Scholar] [CrossRef] [PubMed]
- Mian Qaisar, S. Isolated Speech Recognition and Its Transformation in Visual Signs. J. Electr. Eng. Technol. 2019, 14, 955–964. [Google Scholar] [CrossRef]
- Kim, H.S.; Park, H.S. Ensemble Learning Model for Classification of Respiratory Anomalies. J. Electr. Eng. Technol. 2023, 18, 3201–3208. [Google Scholar] [CrossRef]
- Şaşmaz, E.; Tek, F.B. Animal Sound Classification Using a Convolutional Neural Network. In Proceedings of the 2018 3rd International Conference on Computer Science and Engineering (UBMK), Sarajevo, Bosnia and Herzegovina, 20–23 September 2018; pp. 625–629. [Google Scholar] [CrossRef]
- He, K.; Zhang, X.; Ren, S.; Sun, J. Deep Residual Learning for Image Recognition. In Proceedings of the 2016 IEEE Conference on Computer Vision and Pattern Recognition (CVPR), Las Vegas, NV, USA, 27–30 June 2016; pp. 770–778. [Google Scholar] [CrossRef]
- Mun, S.; Shin, M.; Shon, S.; Kim, W.; Han, D.K.; Ko, H. DNN transfer learning based non-linear feature extraction for acoustic event classification. IEICE Trans. Inf. Syst. 2017, 100, 2249–2252. [Google Scholar] [CrossRef]
- Constantinescu, C.; Brad, R. An Overview on Sound Features in Time and Frequency Domain. Int. J. Adv. Stat. ITC Econ. Life Sci. 2023, 13, 45–58. [Google Scholar] [CrossRef]
- Chanane, H.; Bahoura, M. Convolutional Neural Network-based Model for Lung Sounds Classification. In Proceedings of the 2021 IEEE International Midwest Symposium on Circuits and Systems (MWSCAS), Lansing, MI, USA, 9–11 August 2021; pp. 555–558. [Google Scholar] [CrossRef]
- Jiang, Q.; Chang, F.; Liu, C. A Spectrogram Based Local Fluctuation Feature for Fault Diagnosis with Application to Rotating Machines. J. Electr. Eng. Technol. 2021, 16, 2167–2181. [Google Scholar] [CrossRef]
- Abdul, Z.K.; Al-Talabani, A.K. Mel Frequency Cepstral Coefficient and its Applications: A Review. IEEE Access 2022, 10, 122136–122158. [Google Scholar] [CrossRef]
- Bharali, S.S.; Kalita, S.K. A comparative study of different features for isolated spoken word recognition using HMM with reference to Assamese language. Int. J. Speech Technol. 2015, 18, 673–684. [Google Scholar] [CrossRef]
- Lim, H.; Kim, Y.; Kim, Y.; Kim, H. CNN-based bottleneck feature for noise robust query-by-example spoken term detection. In Proceedings of the 2017 Asia-Pacific Signal and Information Processing Association Annual Summit and Conference (APSIPA ASC), Kuala Lumpur, Malaysia, 12–15 December 2017; pp. 1278–1281. [Google Scholar] [CrossRef]
- Chen, L.; Wei, W.; Liu, D.; Xia, D. Adaptive Beamforming Algorithm Based on Residual Neural Networks. Circuits Syst. Signal Process. 2025, 44, 556–574. [Google Scholar] [CrossRef]
- Yu, Y.; Khadivi, S.; Xu, J. Can data diversity enhance learning generalization? In Proceedings of the 29th International Conference on Computational Linguistics, COLING 2022, Gyeongju, Republic of Korea, 12–17 October 2022; pp. 4933–4945. Available online: https://aclanthology.org/2022.coling-1.437 (accessed on 3 April 2025).
- Piczak, K.J. 2015. In ESC: Dataset for Environmental Sound Classification. In Proceedings of the 23rd ACM International Conference on Multimedia (MM’15), Brisbane, Australia, 26–30 October 2015; pp. 1015–1018. [Google Scholar] [CrossRef]
- Iqbal, T.; Cao, Y.; Bailey, A.; Plumbley, M.D.; Wang, W. ARCA23K: An audio dataset for investigating open-set label noise. arXiv 2021, arXiv:2109.09227. [Google Scholar] [CrossRef]


Disclaimer/Publisher’s Note: The statements, opinions and data contained in all publications are solely those of the individual author(s) and contributor(s) and not of MDPI and/or the editor(s). MDPI and/or the editor(s) disclaim responsibility for any injury to people or property resulting from any ideas, methods, instructions or products referred to in the content. |
© 2025 by the authors. Licensee MDPI, Basel, Switzerland. This article is an open access article distributed under the terms and conditions of the Creative Commons Attribution (CC BY) license (https://creativecommons.org/licenses/by/4.0/).