Article

Changes in Polyphenolic Profile and Antioxidant Properties of Selected Raw and Processed Vegetables Under Different Cooking Methods

by
Grzegorz Kosewski
1,*,
Justyna Chanaj-Kaczmarek
2,
Krzysztof Dziedzic
3,
Karol Jakubowski
1,
Natalia Lisiak
4,
Juliusz Przysławski
1 and
Sławomira Drzymała-Czyż
1
1
Chair and Department of Bromatology, Poznan University of Medical Sciences, Collegium Pharmaceuticum, 3 Rokietnicka St., 60-806 Poznań, Poland
2
Department and Division of Practical Cosmetology and Skin Diseases Prophylaxis, Poznan University of Medical Sciences, Collegium Pharmaceuticum, 3 Rokietnicka St., 60-806 Poznań, Poland
3
Department of Food Technology of Plant Origin, Poznan University of Life Sciences, Wojska Polskiego 31, 60-624 Poznan, Poland
4
Department of Clinical Chemistry and Molecular Diagnostics, Poznan University of Medical Sciences, Collegium Pharmaceuticum, 3 Rokietnicka St., 60-806 Poznan, Poland
*
Author to whom correspondence should be addressed.
Appl. Sci. 2025, 15(9), 4677; https://doi.org/10.3390/app15094677
Submission received: 31 March 2025 / Revised: 18 April 2025 / Accepted: 23 April 2025 / Published: 23 April 2025
(This article belongs to the Special Issue Nutrients and Functional Substances in Plant-Based Foods)

Abstract

:
The polyphenol profile and antioxidant potential in five raw vegetables (beetroot, red cabbage, red pepper, green pepper, kale) were determined after steaming and sous-vide (SV) at different temperatures (80 °C, 85 °C and 90 °C). The total polyphenol content was determined by spectrophotometry using the Folin–Ciocalteu reagent, the antioxidant properties using the DPPH radical, and the polyphenol profile by HPLC–UV–VIS. The sous-vide method at 85 °C resulted in the greatest, smallest losses or the greatest increase in total polyphenol content, whereas the sous-vide method at 80 °C and 85 °C had the same effect on the antioxidant potential and polyphenols profile.

1. Introduction

Vegetables are a rich source of bioactive compounds such as vitamins, minerals, and polyphenols. The World Health Organisation (WHO) recommends a daily intake of at least 500 g of vegetables and fruit to improve general health and reduce the risk of non-communicable diseases such as diabetes, cardiovascular disease and cancer [1,2]. Polyphenols, particularly flavonoids (mainly flavonols, catechins and anthocyanins) and phenolic acids (mainly gallic and chlorogenic acids), are important plant secondary metabolites in the human diet with a wide range of biological properties, including anti-inflammatory, anticancer, and antimicrobial effects [3]. However, one of the best-documented activities of polyphenols is their antioxidant capacity attributed to their ability to donate electrons or hydrogen atoms to neutralise reactive oxygen species (ROS) and reactive nitrogen species (RNS) to reduce oxidative damage to lipids, protein and DNA [4].
Recent research has also focused on the role of polyphenols in modulating the gut microbiota. Polyphenols can influence the composition of human intestinal microorganisms, promoting the growth of beneficial bacteria while inhibiting pathogenic strains. This interaction between polyphenols and the gut microbiota may contribute to their health benefits, including improved metabolic health and reduced inflammation [5]. Gut microbiota may also improve the bioavailability of polyphenols by converting them into bioavailable metabolites [4,6]. Vegetables are eaten raw and subjected to various processes, most often heat-treated, which affects their final nutritional value. Food processing methods are critical in determining the bioactivity and bioavailability of dietary polyphenols, as well as their interactions with the intestinal microbiota [7].
Traditional heat treatments, including classical cooking, stewing, baking and steaming, cause changes in the chemical composition, mainly the content of secondary metabolites and organoleptic properties of vegetables, causing loss of nutrients and contributing to oxidative processes. The modern sous-vide (French: under vacuum) method involves cooking raw materials in a vacuum-sealed, thermostable, plastic bag in a water bath or convection steam oven at a strictly controlled temperature not exceeding 100 °C, the most popular temp. from 80 °C to 95 °C for a longer time than classical methods [8,9,10,11,12,13,14]. Vacuum sealing of the raw material prevents the transfer of valuable nutrients to the broth through osmosis [15,16] and limits the oxidation of phenolic compounds and vitamins. Slow heat treatment also prevents the loss of moisture and volatile compounds, preserving the vegetable’s delicate, juicy structure, intense flavour, aroma and colour [16,17,18,19]. This process also limits the loss of vitamins and other nutrients [20], and the lack of oxygen prevents lipid oxidation [21]. Raw vegetables do not always have the highest antioxidant potential or polyphenol content compared to processed vegetables because elevated temperature and other factors can affect the bioavailability of active ingredients [22].
The sous-vide method increases the bioavailability of vitamins, minerals and phytochemicals compared to conventional cooking methods, which may positively affect the development of various diseases, including lifestyle diseases [23,24]. Therefore, this study determined the changes in the polyphenol total content, their profile and antioxidant properties in selected vegetables with proven high antioxidant potential subjected to steaming and sous-vide cooking at three different temperatures.

2. Materials and Methods

2.1. Preparation of Vegetable Samples

Five vegetables, beetroot (Beta vulgaris L.), red cabbage (Brassica oleracea L. var. capitata f. rubra), red pepper (Capsicium L. f. rubra), green pepper (Capsicium L. f. viride) and kale (Brassica oleracea L. var. sabbellica) were purchased from a European grocery store chain in Poland in 2023. The vegetables were thoroughly washed under running water, and the top layer (beetroot) or seeds (red and green pepper) were removed. The cleaned and peeled vegetables were cut into small pieces, approximately 3 cm × 3 cm, depending on the structure and thickness of the vegetable, before being subjected to two technological processes (Table 1). The thermal processing parameters were determined experimentally, and all treatments were conducted until a uniform level of softness was achieved in all samples. Sous-vide method (SV) cooking was performed in knurled bags (INTER ARMA, Rudawa, Poland) with a certificate for food products and vacuum sealed using a heat sealer with a vacuum pump (Silvercrest Kitchen Tools SV 125 C7) at 80 °C, 85 °C and 90 °C until soft. The softness was determined every 1 min (5–60 min) (Series W115, Laboplay, Bytom, Poland). Steaming was in a temperature-controlled steamer (Tefal Steam Cuisine model S04). The vegetables were laid flat to ensure that the steam reached every part of the vegetable. The process was repeated every 1 min until the material was soft. The samples were frozen and lyophilised (Christ Alpha 2–4 LD Plus) at 1 mbar pressure, at −20 °C for two days using a freeze-dryer. A control sample of raw, unprocessed vegetables was also included. The powders were then vacuum-packed and stored at −20 °C until further analysis.

2.2. Vegetable Extracts Preparation

The phenolic compounds were extracted according to the method of Ávila et al. [25]. Briefly, 10 mL of 80% acidified methanol (0.1% hydrochloric acid) was added to 1 g of each freeze-dried and raw vegetable sample and incubated for 3 min at 30 °C ± 5 °C in an ultrasonic bath (Intersonic I4, Olsztyn, Poland) before centrifugation at 3000 rpm for 10 min at 25 °C (Jouan B4i, Jouan SA, St Herblain, France). The supernatant was removed, and the solid phase was subjected to a similar second extraction. Finally, the supernatants were pooled and filtered for further analysis.

2.3. Determination of Phenolic Compounds

2.3.1. Total Phenolic Content (TPC) Analysis

TPC was determined according to the Folin–Ciocalteu method described by Studzińska-Sroka et al. [26]. Briefly, to 25.0 µL of extracts (diluted with ultrapure water to concentrations of 20–100 mg/mL), 200.0 µL of distilled water, 15.0 µL of Folin–Ciocalteu reagent and 60.0 µL of 20% calcium carbonate solution were added. The mixtures were incubated for 30 min in the dark at room temperature. Absorbance was measured in triplicate at λ = 760 nm using an EnSpire Multimode Plate Reader (PerkinElmer, Waltham, MA, USA). TPC was expressed as mg gallic acid equivalent (GAE) per 100 g freeze-dried vegetables ± standard deviation (SD) using a standard curve of gallic acid (y = 0.2895x − 0.0052, R = 0.999) in the concentration range 0.02–0.16 mg/mL.

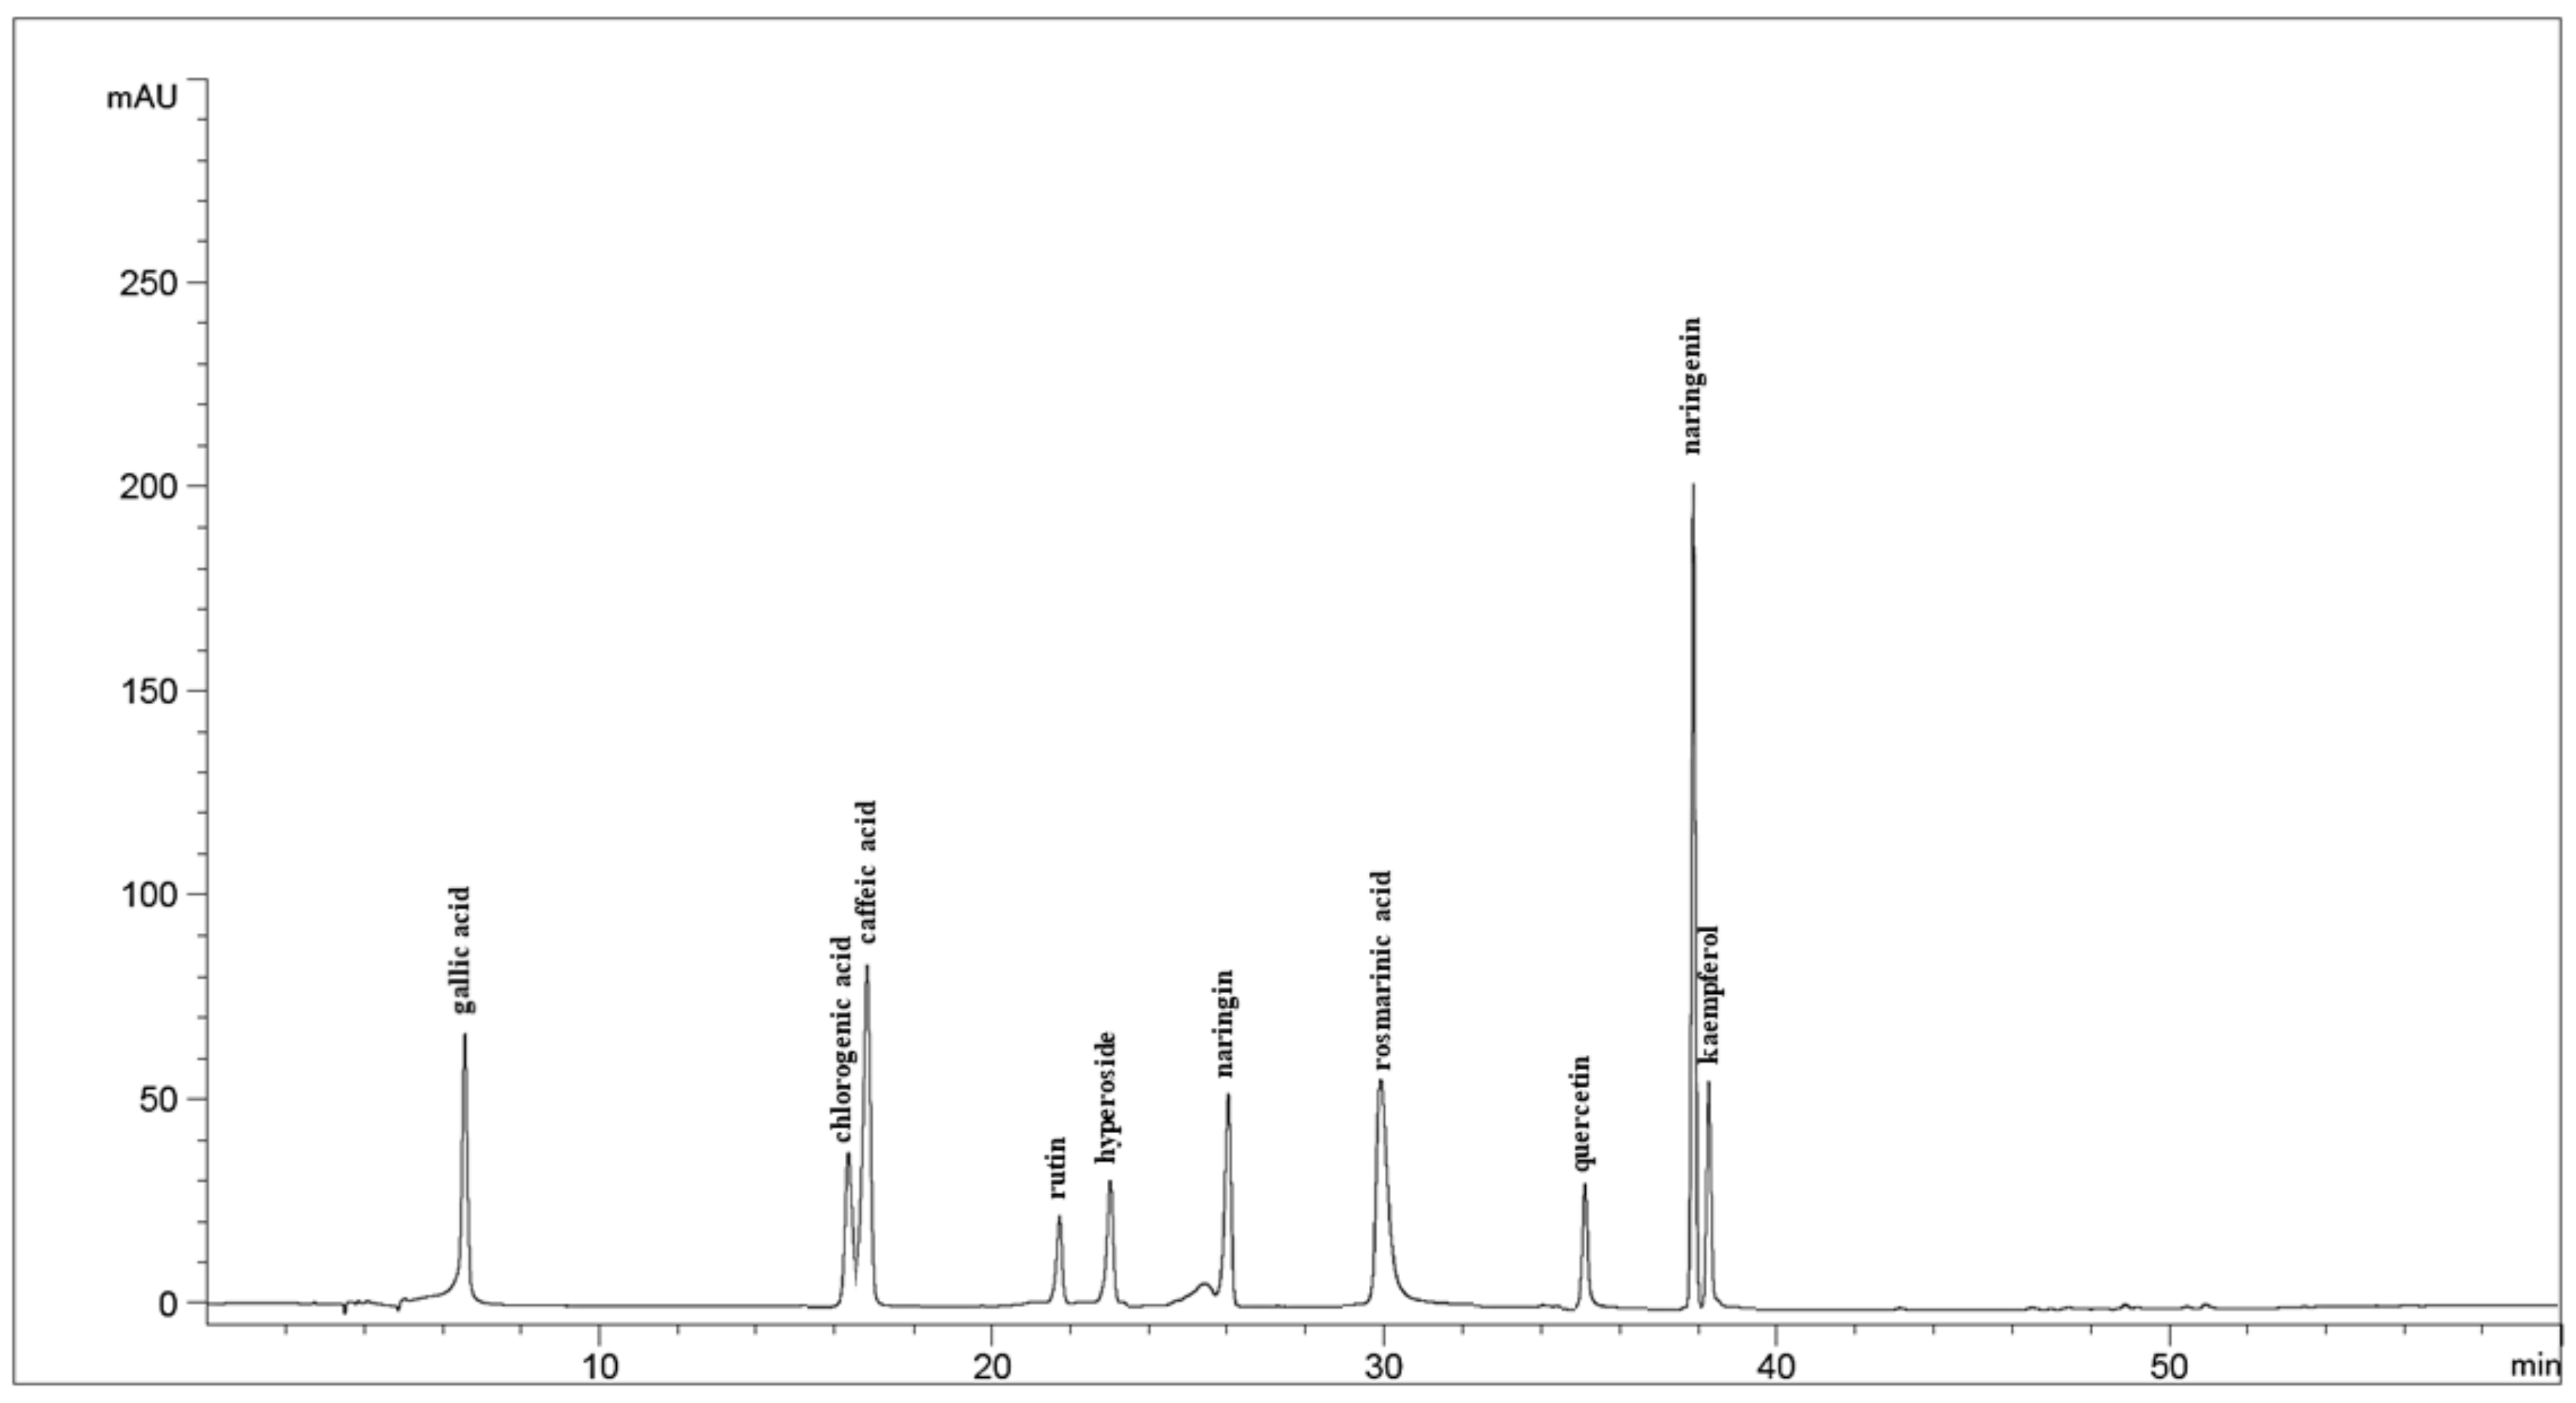
2.3.2. Phenolic Profile Analysis by HPLC–UV–VIS

The concentrations of ten phenolic compounds including phenolic acids (caffeic, chlorogenic, gallic and rosmarinic acids) and flavonoids (quercetin, naringenin, kaempferol, rutin, hyperoside and naringin), were determined by the method described by Yang et al. [27] by HPLC (1220 Infinity II, Agilent Technologies, Santa Clara, CA, USA). Detection was performed using a UV–VIS detector (1220 Infinity II, Agilent Technologies, Santa Clara, CA, USA) at a wavelength of 280 nm on a C18 column (250 × 4.6 mm) (Phenomenex, Torrance, CA, USA) at a temperature of 30 °C. The mobile phase consisted of ultra-distilled water with 0.1% glacial acetic acid (A) and acetonitrile with 0.1% glacial acetic acid (B). The gradient flow was as follows: 0 min, 8% B in A; 2 min, 10% B in A; 27 min, 30% B in A; 50 min, 90% B in A; 51–56 min, 100% B in A; and 51–60 min, 8% B in A. The flow rate was set at 0.8 mL/min, and the injection volume was 20 μL.
The phenolic content of the plant sample was calculated from the calibration curve of standard solutions in methanol prepared at the different concentrations: gallic acid and caffeic acid (10–80 μg/mL), chlorogenic acid and rosmarinic acid (10–160 μg/mL), quercetin, naringenin, kaempferol, rutin, hyperoside and naringin (2.5–40 μg/mL) and expressed as mg/100 g freeze-dried vegetable sample ± SD. Identification of the phenolic compounds in the sample was performed by comparison of retention times with standard reference solutions and by the standard addition method. Analyses were conducted in triplicate.
The HPLC–UV–VIS method was validated according to the International Conference on Harmonization Guideline Q2 (ICH) for linearity, precision, the limit of detection, and the quantification (LOD and LOQ, respectively) [28].

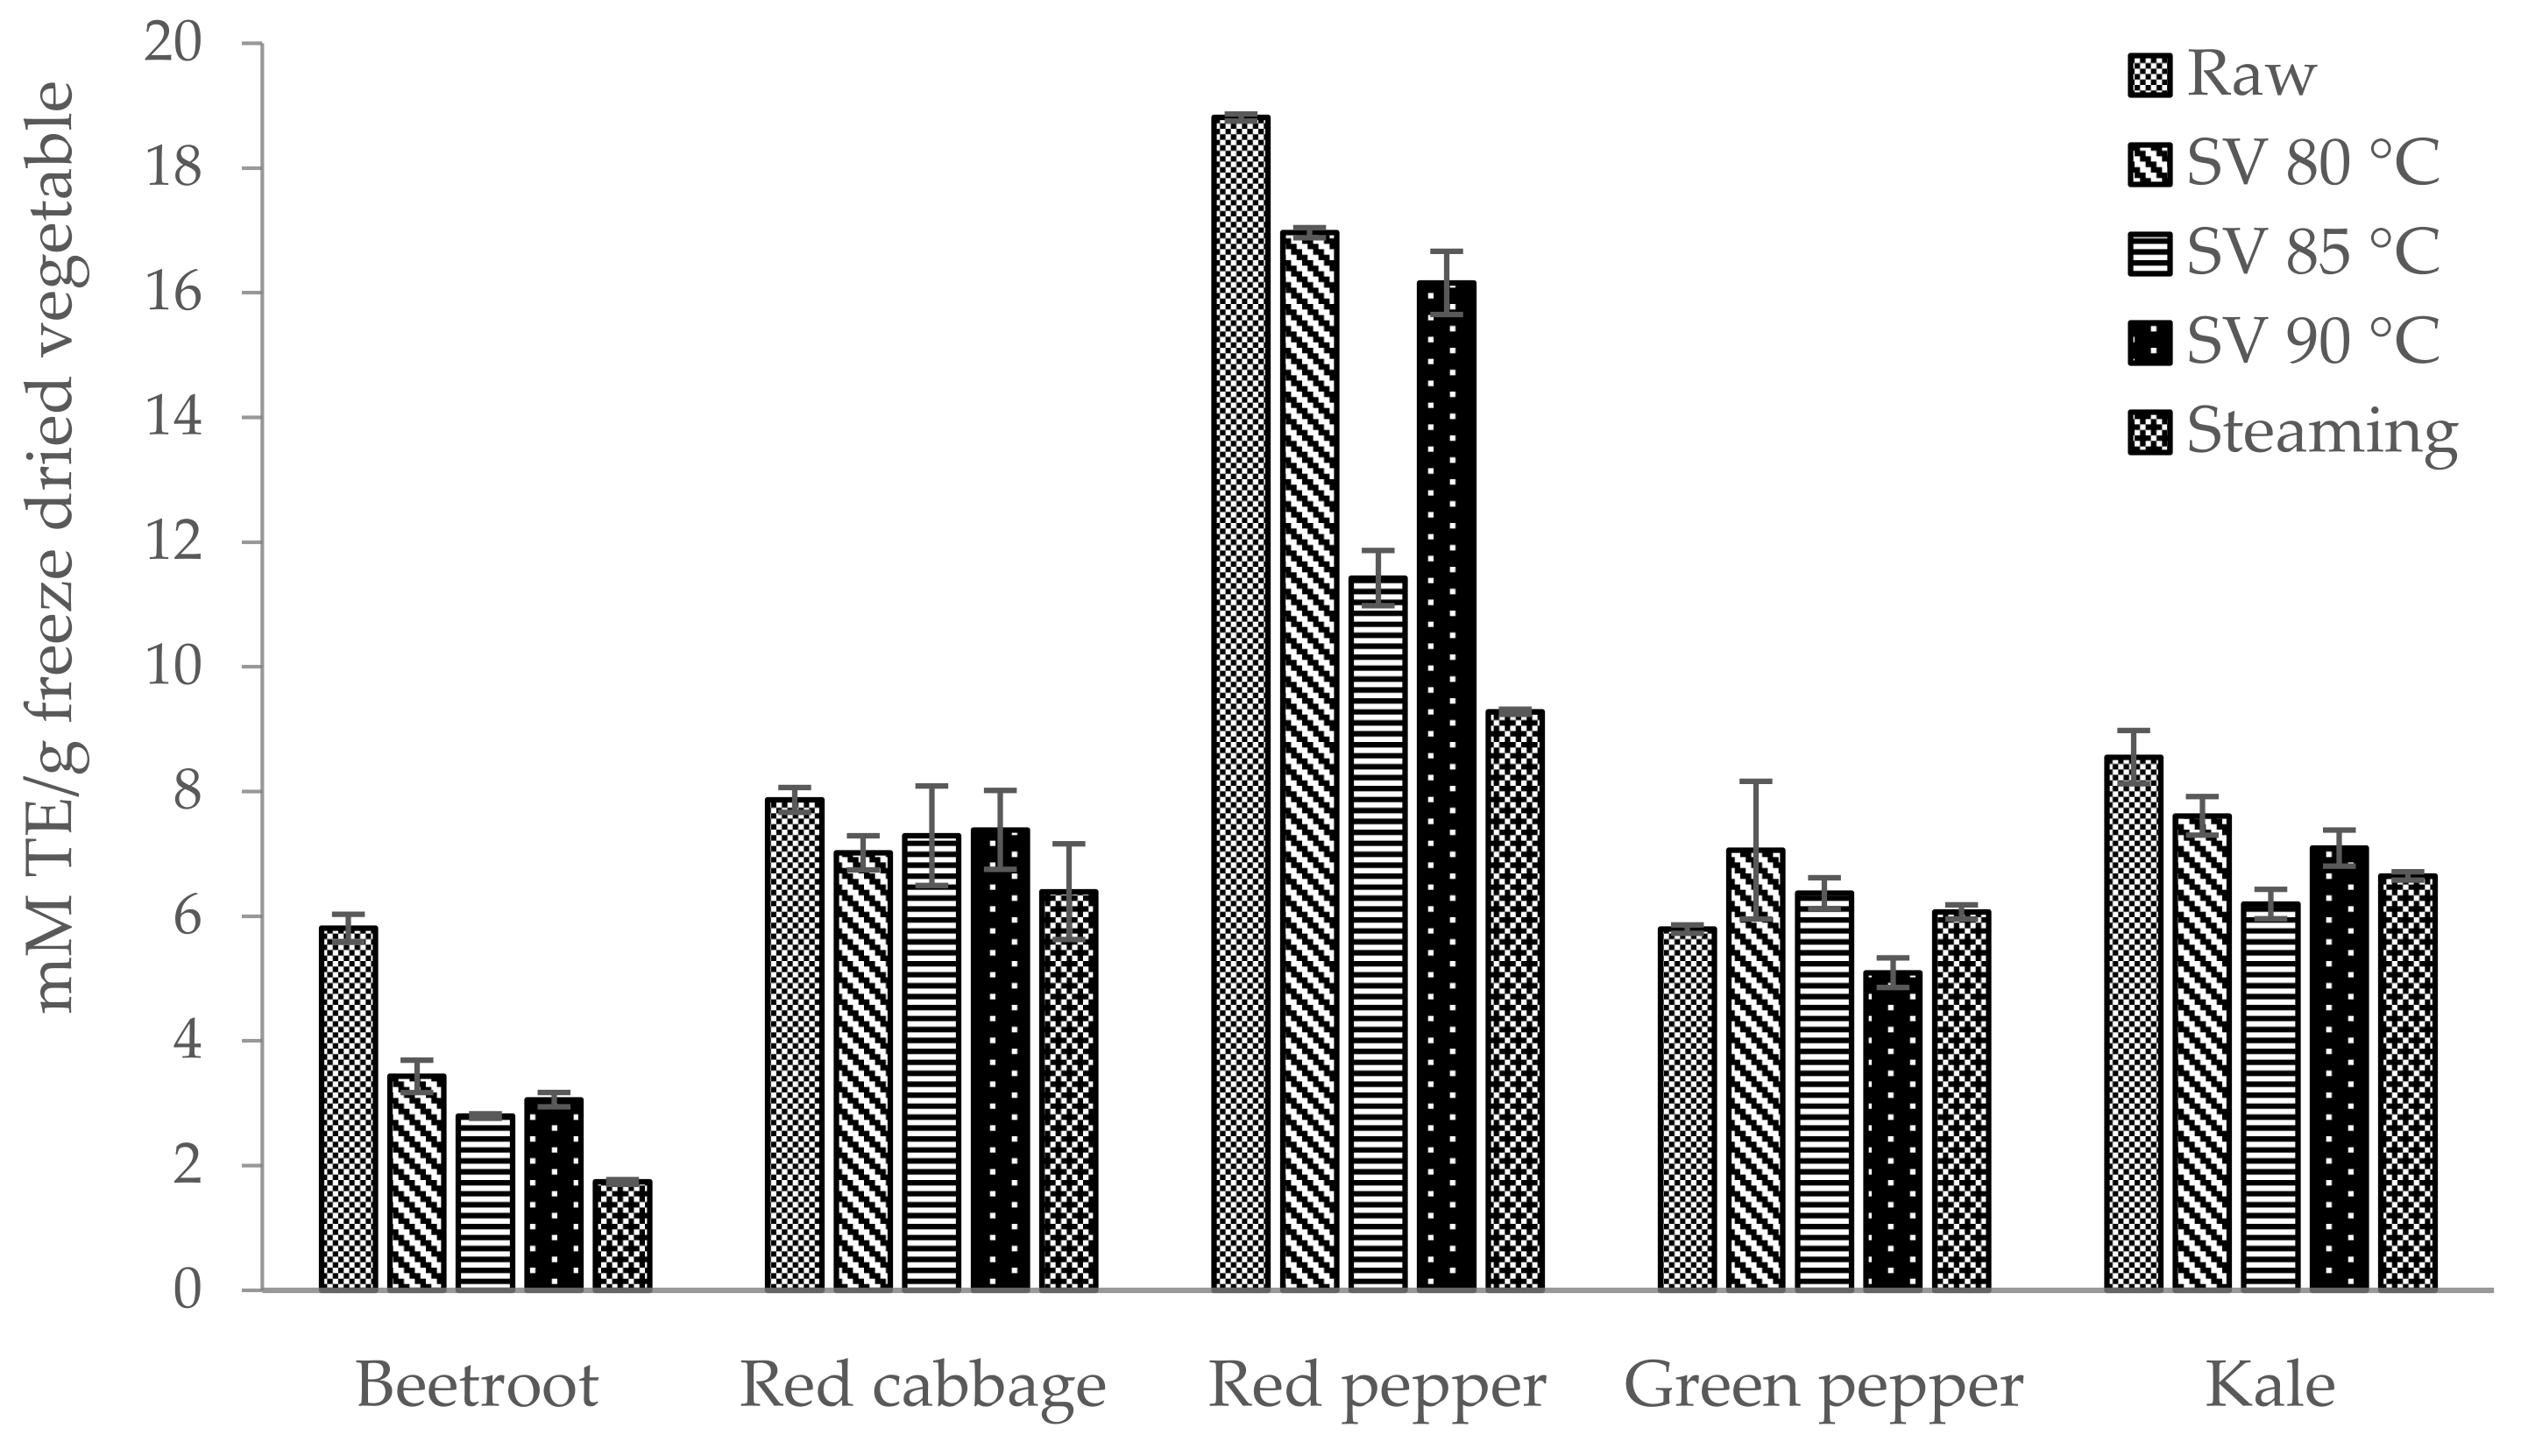
2.4. Determination of Antioxidant Capacity

Antioxidant capacity was determined using the DPPH assay as described by Norma et al. [29]. Briefly, the 0.1 mM methanol solution of DPPH radical (2.0 mL) with extracts (0.04 mL) was incubated in the dark for 30 min before the absorbance was measured at 517nm (Analityk Jena Spekol 1500, Jena, Germany) against the blank sample (methanol) in triplicate. The ability of the plant extracts to scavenge a free radical was expressed as the Trolox equivalent antioxidant capacity (TEAC). The TEAC values were calculated from the Trolox (TE) calibration curve (y = 1.3441x + 7.6319, R = 0.995) prepared using the methanol solution of Trolox at concentrations ranging from 0.02 µM to 0.08 µM, with 5 replicates for each concentration. TEAC values were expressed as micromoles of Trolox equivalents per gram of freeze-dried vegetable sample (mM TE/g).

2.5. Chemicals and Reagents

Reference substances such as caffeic acid, gallic acid, kaempferol, naringin, naringenin, rosmarinic acid, rutin and quercetin were obtained from Sigma-Aldrich Co., (St Louis, MO, USA), chlorogenic acid from Dr. Ehrenstorfer GmbH (Augsburg, Germany) and hyperoside from the HWI (Rülzheim, Germany). Methanol, Folin–Ciocalteu phenol reagents, trolox (6-Hydroxy-2,5,7,8-tetramethylchromane-2-carboxylic acid), DPPH (2,2,-di-phenyl-2pictyl-hydrazyl) were supplied by Merck (Darmstadt, Germany). HPLC grade acetonitrile, hydrochloric acid, glacial acetic acid and sodium carbonate were provided by Avantor Performance Materials Poland S.A. (Gliwice, Poland). Ultra-high-quality pure water was prepared by using a MicroPure™ Water Purification System (Thermo Fisher Scientific, Waltham, MA, USA).

2.6. Statistical Analysis

The data were analysed using Statistica v. 13 (StatSoft, Inc., 2015, Tulsa, OK, USA). Differences between mean values were assessed using analysis of variance (ANOVA) followed by Duncan’s post-hoc test (p < 0.05). All results are expressed as the mean ± standard deviation (SD). Spearman correlations were performed between the total polyphenol content and antioxidant potential results due to the normal distribution.

3. Results and Discussion

3.1. Total Phenolic and Profile of Phenolic Compounds

3.1.1. Total Phenolic Content

One of the most popular methods of determining polyphenols is the spectrophotometric method using the Folin–Ciocalteu reagent to determine the total polyphenol content. The raw vegetables were subjected to technological processes, including steaming and sous-vide cooking at three different temperatures. The highest total polyphenol content (TPC) was in red pepper, while the lowest was observed in green pepper [Table 2]. The effect of technological processes on the total polyphenol content varied and depended mainly on the cooking conditions [9,30,31]. Vegetables such as beetroot and red pepper were characterised by a lower total polyphenol content after all culinary treatments, compared to their raw form. The smallest decrease in the total polyphenol content was observed after the sous-vide process at 85 °C, whereas vegetables such as red cabbage and green pepper had a higher total polyphenol content after all technological processes compared to their raw form (p ≤ 0.05). The highest TPC was observed in red cabbage, green pepper and kale after the sous-vide process at 85 °C. The most advantageous technological processes after which the TPC content in the tested vegetables was the highest or the decrease in this content was the smallest in relation to their raw form, and the remaining cooking technique was the sous-vide method at a temperature of 85 °C. The higher TPC in the vegetables tested after technological processes may be because the bioactive substances, including polyphenols, are not washed out by water through osmosis. Increased temperature also contributes to the loosening of the cell wall structure, facilitating the extraction of bioactive substances [10,16]. Slightly higher temperature may contribute to a greater availability of polyphenolic substances, e.g., steamed green pepper—718 mg GAE/100 g of freeze-dried vegetables vs. raw form—91.9 mg GAE/100 g of freeze-dried vegetables, which is an almost 7-fold increase in TPC.

3.1.2. Phenolic Acids Profile

The polyphenols were identified by the economical, simple and reliable HPLC [32]. The method was validated as shown in Table 3 and Table S1, with an example chromatogram shown in Figure 1. Among ten polyphenols, the content of four polyphenolic acids was determined [Table 4]. The most abundant polyphenolic acid was gallic acid (beetroot, red cabbage, red pepper) and chlorogenic acid (green pepper, kale). The content of these acids after the technological processes was statistically significantly higher, especially after the SV 80 °C and SV 85 °C processes, compared to the raw vegetables. The other polyphenolic acids identified were caffeic acid and rosmarinic acid, the content of which depended on the process used. For most vegetables (beetroot, red cabbage, red pepper), the content of these acids increased after technological processes, especially in red pepper. Green peppers and kale are characterised by very diverse changes in the content of these two polyphenolic acids under the influence of thermal processing. The increased temperature or sealing off the product in a tight bag used in sous-vide contributed to the loss of these two polyphenolic acids. For example, raw green pepper contained 43.9 mg/100 g of rosmarinic acid, increasing two-fold (91.3 mg/100 g) after the SV 80 °C but decreasing to 8.06 mg/100 g after the SV 85 °C process. This suggests the influence of elevated temperature on the decomposition of bioactive substances. On the other side, the beetroot turned out to be a vegetable in which the presence of rosmarinic acid could not be determined.
In contrast, red pepper was characterised by a higher rosmarinic acid content after technological processes vs. raw vegetable, which may mean that phytochemicals were preserved in an unoxidised form [9]. For example, the content of chlorogenic acid was the highest after steaming vs. other technological processes, indicating that high temperature did not always contribute to the decomposition of polyphenols, but to the loosening of the cell structure and their easier extraction. Regarding the total polyphenolic acid content [Table 4], the most beneficial technological process for vegetables such as beetroot and kale was sous-vide at 85 °C, red cabbage and green pepper were sous-vide at 80 °C, but red pepper was steamed. The differential effects of thermal processes on the polyphenolic acid content were confirmed by other authors. Rinaldi et al. [33] examined different varieties of pumpkin, proving that it is the result of several, even opposite, mechanisms. Partial hydrolysis of ester bonds connecting phenolic acids with cell wall polysaccharides and softening of the matrix promote the release of these compounds. However, when phenolic compounds are released, they can be oxidised by polyphenoloxidase and react with cell wall polysaccharides. The interaction of polyphenols with polysaccharides modifies the extractability of these compounds, even though they may partially retain their antioxidant capacity [33].

3.1.3. Flavonoid Glycosides and Aglycones Profile

Six flavonoids were also identified, including three glycosides (rutin, hyperoside, naringin) and three aglycones (quercetin, naringenin, kaempferol) [Table 5]. The content of flavonoids was lower than that of polyphenolic acids, while their content in most vegetables was higher after technological processes than in their raw form (p ≤ 0.05). In some vegetables, certain flavonoids could not be determined, e.g., hyperoside (beetroot and green pepper), naringenin (beetroot, red cabbage and green pepper), kaempferol (beetroot and red cabbage), rutin (kale) and quercetin (red pepper). Interestingly, some vegetables in their raw form did not contain some flavonoids, but their presence was detected after cooking (hyperoside, naringin, quercetin, naringenin and kaempferol). An increase in the content of these flavonoids in beetroot, red cabbage, red pepper and kale was observed after cooking, probably due to the loosening of the cell walls and better extraction of bioactive substances. The flavonoids present in the vegetables tested were found to be very labile to higher temperatures, e.g., aglycones such as quercetin in red cabbage. Analysing total glycosides, the most beneficial technological process in terms of their content in vegetables was more diverse in comparison to polyphenolic acids. Red cabbage and green pepper had a statistically significantly higher content of glycosides after the sous-vide 80 °C, for red pepper SV 85 °C, and for beetroot SV 90 °C, whereas the highest values of aglycones for beetroot, green pepper and kale were found after the SV 85 °C process, and for red pepper after steaming. The only example of a vegetable that contained the most aglycones in the raw form was red cabbage. In the case of flavonoids, similarly to polyphenolic acids, other authors also found that some flavonoids’ content increases under the influence of all the technological processes studied [33].

3.2. Biological Activity

The biological activity of vegetables subjected to different technological processes was determined using DPPH free radical scavenging, and the results were expressed in mM Trolox/g of freeze-dried vegetables [Figure 2, Table S2]. The highest statistically significant antioxidant capacity was characteristic for vegetables in raw form, e.g., beetroot, red cabbage, red pepper and kale, respectively: 5.81, 7.87, 18.8, and 8.55 mM Trolox/g of freeze-dried vegetables. The vegetables mentioned above were characterised by a slight decrease in these properties after thermal processes. The antioxidant capacity of some vegetables in their raw form was not statistically significantly lower than in their forms subjected to SV processes at all temperatures (red cabbage) or higher in the SV 85 °C, SV 90 °C and steaming processes (green pepper). The lowest decrease or the highest increase in the antioxidant potential value was found in vegetables such as beetroot, red pepper, green pepper and kale after the sous-vide at process 80 °C, respectively, 3.43, 17.0, 7.06, 7.61 mM Trolox/g freeze-dried vegetables vs. 5.81, 18.8, 5.79, 8.55 mM Trolox/g freeze-dried vegetables their raw form (p ≤ 0.05). In contrast, the SV 90 °C process turned out to be the most beneficial despite the statistically insignificant decrease in the antioxidant potential value of red cabbage (7.39 mM Trolox/g freeze-dried vegetable) versus its raw form (7.87 mM Trolox/g freeze-dried vegetable). Other studies on the antioxidant potential determined by the DPPH radical scavenging method indicate that sous-vide thermal processing is more beneficial in preserving these capabilities compared to other technological processes. The antioxidant potential is influenced not only by the vacuum sealing of the product, but also by the use of an appropriate temperature and duration of the process [34,35].

3.3. Correlation Between the Total Polyphenol Content (TPC) and Antioxidant Activity

The correlation between total phenol content (TPC) and Trolox equivalent antioxidant capacity (TEAC) of the freeze-dried vegetables is presented in Figure 3. There is a strong correlation for beetroot (r = 0.7555), which means that the increase in total polyphenols increases their antioxidant potential, a moderate correlation for red pepper (r = 0.6881) and green pepper (r = 0.68830). On the other hand, there is no correlation for red cabbage and kale, which suggests that other non-polyphenol bioactive factors and compounds affect their antioxidant potential [31]. The compound mainly responsible for antioxidant properties in red cabbage is 4-(methylsulfinyl)butyl ITC (4MSOB-ITC, sulforaphane), which was not determined in this study [36]. In the case of kale, the lack of correlation may result from the fact that the main compounds responsible for antioxidant capacity are vitamin C and A (lutein and β-carotene) [37,38,39].

4. Conclusions

In summary, the sous-vide process at 80 °C and 85 °C proved to be the most beneficial among the technological processes studied. Among the vegetables studied, the smallest losses or the largest increase in the sum of polyphenols and individual polyphenols were found after the sous-vide process at 80 °C and 85 °C. In terms of changes in antioxidant potential, the most beneficial technological process for vegetables, e.g., beetroots, red peppers, green peppers and kale, for which the smallest losses of antioxidant potential were determined, was the sous-vide process at 80 °C, while for red cabbage this potential was at a similar level for all heat treatment methods. Analysis of the sous-vide method and an attempt to adjust the most favourable process conditions indicate that it should be performed at 80 °C or 85 °C. However, it is advisable to individually consider the best method and conditions for its implementation for a given vegetable. Antioxidant properties depend not only on the vegetable, but also on the technological process, mainly on the temperature used and the content of individual polyphenolic acids and flavonoids. The lack of correlation between the total polyphenol content and the antioxidant potential of vegetables such as red cabbage and kale may be due to the fact that their properties depend mainly on other bioactive components, the content of which should be determined in further studies.

Supplementary Materials

The following supporting information can be downloaded at: https://www.mdpi.com/article/10.3390/app15094677/s1, Table S1: Precision of the HPLC method, Table S2: TEAC (mM TE/g freeze-dried vegetable ± SD) in the tested vegetables before and after different technological processes.

Author Contributions

Conceptualisation, G.K., J.C.-K., J.P. and S.D.-C.; methodology, G.K., J.C.-K. and J.P.; software, G.K. and J.C.-K.; validation, G.K. and J.C.-K.; formal analysis G.K. and J.C.-K.; investigation, G.K., J.C.-K. and N.L.; resources, G.K., J.C.-K., K.J. and K.D.; data curation, G.K. and J.C.-K.; writing—original draft preparation, G.K. and J.C.-K.; writing—review and editing, G.K., J.C.-K., J.P. and S.D.-C.; visualisation, G.K. and J.C.-K.; supervision, J.P. and S.D.-C.; project administration, G.K; funding acquisition, G.K., J.P. and S.D.-C. All authors have read and agreed to the published version of the manuscript.

Funding

This research received no external funding.

Institutional Review Board Statement

Not applicable.

Informed Consent Statement

Not applicable.

Data Availability Statement

The raw data supporting the conclusions of this article will be made available by the authors on request.

Conflicts of Interest

The authors declare no conflicts of interest.

Abbreviations

The following abbreviations are used in this manuscript:
DNADeoxyribonucleic acid
DPPH2,2-Diphenyl-1-picrylhydrazyl
GAEGallic acid equivalent
HPLC–UV–VISHigh performance liquid chromatography ultraviolet detector
ICHInternational Conference of Harmonisation
LODLimit of detection
LOQLimit of quantification
n.d.No detected
RNSReactive nitrogen species
ROSReactive oxygen species
SDStandard deviation
SVSous-vide
TETrolox equivalent
TEACTrolox equivalent antioxidant capacity
TPCTotal phenolic content
WHOWorld Health Organisation

References

  1. ABC Żywienia. Available online: https://ncez.pzh.gov.pl/abc-zywienia/ (accessed on 17 January 2025).
  2. Mohammad Salamatullah, A.; Hayat, K.; Mabood Husain, F.; Asif Ahmed, M.; Arzoo, S.; Musaad Althbiti, M.; Alzahrani, A.; Al-Zaied, B.A.M.; Kahlil Alyahya, H.; Albader, N.; et al. Effects of Different Solvents Extractions on Total Polyphenol Content, HPLC Analysis, Antioxidant Capacity, and Antimicrobial Properties of Peppers (Red, Yellow, and Green (Capsicum annum L.). Evid. Based Complement. Alternat. Med. 2022, 19, 7372101. [Google Scholar] [CrossRef] [PubMed]
  3. Wang, X.; Qi, Y.; Zheng, H. Dietary Polyphenol, Gut Microbiota, and Health Benefits. Antioxidants 2022, 11, 1212. [Google Scholar] [CrossRef] [PubMed]
  4. Parcheta, M.; Świsłocka, R.; Orzechowska, S.; Akimowicz, M.; Choińska, R.; Lewandowski, W. Recent Developments in Effective Antioxidants: The Structure and Antioxidant Properties. Materials 2021, 14, 1984. [Google Scholar] [CrossRef] [PubMed]
  5. Mostafavi Abdolmaleky, H.; Zhou, J.-R. Gut Microbiota Dysbiosis, Oxidative Stress, Inflammation, and Epigenetic Alterations in Metabolic Diseases. Antioxidants 2024, 13, 985. [Google Scholar] [CrossRef]
  6. Mithul Aravind, S.; Wichienchot, S.; Tsao, R.; Ramakrishnan, S.; Chakkaravarthi, S. Role of Dietary Polyphenols on Gut Microbiota, Their Metabolites and Health Benefits. Food Res. Int. 2021, 142, 110189. [Google Scholar] [CrossRef]
  7. Sejbuk, M.; Mirończuk-Chodakowska, I.; Karav, S.; Witkowska, A.M. Dietary Polyphenols, Food Processing and Gut Microbiome: Recent Findings on Bioavailability, Bioactivity, and Gut Microbiome Interplay. Antioxidants 2024, 13, 1220. [Google Scholar] [CrossRef]
  8. Baldwin, D.E. Sous vide cooking: A Review. Int. J. Gastron. Food Sci. 2012, 1, 15–30. [Google Scholar]
  9. Kathuria, D.; Dhiman, A.K.; Attri, S. Sous vide, a culinary technique for improving quality of food products: A Review. Trends Food Sci. Technol. 2022, 119, 57–68. [Google Scholar] [CrossRef]
  10. Michalak-Majewska, M.; Stanikowski, P.; Gustaw, W.; Sławińska, A.; Radzki, W.; Skrzypczak, K.; Jabłońska-Ryś, E. Technologia sous-vide—Innowacyjny sposób Obróbki Cieplnej żywności. Żywn. Nauka Technol. Jakość/Food Sci. Technol. Qual. 2018, 116, 34–44. [Google Scholar] [CrossRef]
  11. Creed, P.G. The sensory and nutritional quality of ‘sous vide’ foods. Food Control 1995, 6, 45–52. [Google Scholar] [CrossRef]
  12. Yıkmış, S.; Aksu, H.; Çöl, B.G.; Demirçakmak, İ.L. Evaluation of sous-vide technology in gastronomy. Int. J. Agric. Life Sci. 2018, 4, 226–231. [Google Scholar]
  13. Amoroso, L.; Rizzo, V.; Muratore, G. Nutritional values of potato slices added with rosemary essential oil cooked in sous vide bags. Int. J. Gastron. Food Sci. 2019, 15, 1–5. [Google Scholar] [CrossRef]
  14. Yılmaz, S.N.; İlyasoğlu, H. Comparision of the effect of Sous vide with traditional cooking methods on color properties and anti-oxidant capacity of zucchini and Green Bean. Food Health 2023, 9, 37–42. [Google Scholar] [CrossRef]
  15. Zavadlav, S.; Blažić, M.; Van de Velde, F.; Vignatti, C.; Fenoglio, C.; Piagentini, A.M.; Pirovani, M.E.; Perotti, C.M.; Bursać Kovačević, D.; Putnik, P. Sous-vide as a technique for preparing healthy and high-quality vegetable and seafood products. Foods 2020, 9, 1537. [Google Scholar] [CrossRef]
  16. Iborra-Bernad, C.; García-Segovia, P.; Martínez-Monzó, J. Physico-chemical and structural characteristics of vegetables cooked under sous-vide, Cook-vide, and conventional boiling. J. Food Sci. 2015, 80, E1725–E1734. [Google Scholar] [CrossRef]
  17. Muñoz, S.; Achaerandio, I.; Yang, Y.; Pujolà, M. Sous vide processing as an alternative to common cooking treatments: Impact on the starch profile, color, and shear force of potato (Solanum tuberosum L.). Food Bioprocess Technol. 2017, 10, 759–769. [Google Scholar] [CrossRef]
  18. Clausen, M.P.; Christensen, M.; Djurhuus, T.H.; Duelund, L.; Mouritsen, O.G. The quest for umami: Can Sous vide contribute? Int. J. Gastron. Food Sci. 2018, 13, 129–133. [Google Scholar] [CrossRef]
  19. Bayomy, H.M. Effects of culinary treatments on the physicochemical properties of Ulva lactuca collected from Tabuk coast of Red Sea in Saudi Arabia. Saudi J. Biol. Sci. 2022, 29, 2355–2362. [Google Scholar] [CrossRef]
  20. dos Reis, L.C.; de Oliveira, V.R.; Hagen, M.E.; Jablonski, A.; Flôres, S.H.; de Oliveira Rios, A. Effect of cooking on the concentration of bioactive compounds in broccoli (Brassica oleracea var. avenger) and cauliflower (Brassica oleracea var. Alphina F1) grown in an organic system. Food Chem. 2015, 172, 770–777. [Google Scholar] [CrossRef]
  21. Martínez, S.; Armesto, J.; Gómez-Limia, L.; Carballo, J. Impact of processing and storage on the nutritional and sensory properties and bioactive components of Brassica spp. A Review. Food Chem. 2020, 313, 126065. [Google Scholar] [CrossRef]
  22. Narwojsz, A.; Borowska, E.J.; Polak-Śliwińska, M.; Danowska-Oziewicz, M. Effect of Different Methods of Thermal Treatment on Starch and Bioactive Compounds of Potato. Plant Foods Hum. Nutr. 2020, 75, 98–304. [Google Scholar] [CrossRef] [PubMed]
  23. Roascio-Albistur, A.; Gámbaro, A. Consumer perception of a non-traditional market on sous-vide dishes. Int. J. Gastron. Food Sci. 2018, 11, 20–24. [Google Scholar] [CrossRef]
  24. Lafarga, T.; Viñas, I.; Bobo, G.; Simó, J.; Aguiló-Aguayo, I. Effect of steaming and Sous vide processing on the total phenolic content, vitamin C and antioxidant potential of the genus Brassica. Innov. Food Sci. Emerg. Technol. 2018, 47, 412–420. [Google Scholar] [CrossRef]
  25. Ávila, S.; Zalamanski, S.; Tanikawa, L.M.; Kruger, C.C.H.; Ferreira, S.M.R. Influence of Cooking Methods on In Vitro Bioaccessibility of Phenolics, Flavonoids, and Antioxidant Activity of Red Cabbage. Plant Foods Hum. Nutr. 2023, 78, 124–131. [Google Scholar] [CrossRef]
  26. Studzińska-Sroka, E.; Majchrzak-Celińska, A.; Bańdurska, M.; Rosiak, N.; Szwajgier, D.; Baranowska-Wójcik, E.; Szymański, M.; Gruszka, W.; Cielecka-Piontek, J. Is Caperatic Acid the Only Compound Responsible for Activity of Lichen Platismatia glauca within the Nervous System? Antioxidants 2022, 11, 2069. [Google Scholar] [CrossRef]
  27. Yang, X.-J.; Dang, B.; Fan, M.-T. Free and Bound Phenolic Compound Content and Antioxidant Activity of Different Cultivated Blue Highland Barley Varieties from the Qinghai-Tibet Plateau. Molecules 2018, 23, 879. [Google Scholar] [CrossRef]
  28. ICH. Validation of analytical procedures Q2 (R2). In Proceedings of the International Conference of Harmonisation, Geneva, Switzerland, 14 November 2018. [Google Scholar]
  29. Norma, P.M.; Virginia, N.-M.; Ral, R.-H.; Jos, C.E.; Cristbal, N.A. A Microassay for Quantification of 2,2-Diphenyl-1-Picrylhydracyl (DPPH) Free Radical Scavenging. Afr. J. Biochem. Res. 2014, 8, 14–18. [Google Scholar] [CrossRef]
  30. Florkiewicz, A.; Socha, R.; Filipiak-Florkiewicz, A.; Topolska, K. Sous-vide technique as an alternative to traditional cooking methods in the context of antioxidant properties of Brassica vegetables. J. Sci. Food Agric. 2019, 99, 173–182. [Google Scholar] [CrossRef]
  31. Misu, G.A.; Canja, C.M.; Lupu, M.; Matei, F. Advances and Drawbacks of Sous-Vide Technique—A Critical Review. Foods 2024, 13, 2217. [Google Scholar] [CrossRef]
  32. Farrés-Cebrián, M.; Seró, R.; Saurina, J.; Núñez, O. HPLC-UV Polyphenolic Profiles in the Classification of Olive Oils and Other Vegetable Oils via Principal Component Analysis. Separations 2016, 3, 33. [Google Scholar] [CrossRef]
  33. Rinaldi, M.; Santi, S.; Paciulli, M.; Ganino, T.; Pellegrini, N.; Visconti, A.; Vitaglione, P.; Barbanti, D.; Chiavaro, E. Comparison of physical, microstructural and antioxidative properties of pumpkin cubes cooked by conventional, vacuum cooking and sous vide methods. J. Sci. Food Agric. 2020, 101, 2534–2541. [Google Scholar] [CrossRef] [PubMed]
  34. Guillén, S.; Mir-Bel, J.; Oria, R.; Salvador, M.L. Influence of cooking conditions on organoleptic and health-related properties of artichokes, green beans, Broccoli and carrots. Food Chem. 2017, 217, 209–216. [Google Scholar] [CrossRef] [PubMed]
  35. Koç, M.; Baysan, U.; Devseren, E.; Okut, D.; Atak, Z.; Karataş, H.; Kaymak-Ertekin, F. Effects of different cooking methods on the chemical and physical properties of carrots and Green Peas. Innov. Food Sci. Emerg. Technol. 2017, 42, 109–119. [Google Scholar] [CrossRef]
  36. Vega-Galvez, A.; Gomez-Perez, L.S.; Zepeda, F.; Vidal, R.L.; Grunenwald, F.; Mejías, N.; Pasten, A.; Araya, M.; Ah-Hen, K.S. Assessment of Bio-Compounds Content, Antioxidant Activity, and Neuroprotective Effect of Red Cabbage (Brassica oleracea var. Capitata rubra) Processed by Convective Drying at Different Temperatures. Antioxidants 2023, 12, 1789. [Google Scholar] [CrossRef]
  37. Satheesh, N.; Workneh Fanta, S. Kale: Review on nutritional composition, bio-active compounds, anti-nutritional factors, health beneficial properties and value-added products. Cogent Food Agric. 2020, 6, 1811048. [Google Scholar] [CrossRef]
  38. Ortega-Hernández, E.; Antunes-Ricardo, M.; Jacobo-Velázquez, D.A. Improving the Health-Benefits of Kales (Brassica oleracea L. var. acephala DC) through the Application of Controlled Abiotic Stresses: A Review. Plants 2021, 10, 2629. [Google Scholar] [CrossRef]
  39. Vučetić, A.; Šovljanski, O.; Pezo, L.; Gligorijević, N.; Kostić, S.; Vulić, J.; Čanadanović-Brunet, J. A Comprehensive Antioxidant and Nutritional Profiling of Brassicaceae Microgreens. Antioxidants 2025, 14, 191. [Google Scholar] [CrossRef]
Figure 1. HPLC chromatogram of the flavonoids and phenolic acids standards at a concentration of 20 μg/mL.
Applsci 15 04677 g001
Figure 2. Trolox equivalents antioxidant capacity of vegetable extracts tested by DPPH method.
Applsci 15 04677 g002
Figure 3. The correlation between total phenol content (TPC) and Trolox equivalent antioxidant capacity (TEAC) values of freeze-dried vegetables.
Applsci 15 04677 g003
Table 1. Time of raw vegetables processing using the steaming and the sous-vide method.
VegetableTime of Technological Processes [min]
Sous-VideSteaming
80.0 °C85.0 °C90.0 °C100 °C
Beetroot 96.0 69.0 45.0 20.0
Red cabbage 61.042.035.010.0
Red pepper53.032.028.014.0
Green pepper43.034.032.08.00
Kale14.017.06.0013.0
Table 2. TPC (mg GAE/100 g freeze-dried vegetable ± SD) in the tested vegetables before and after different technological processes.
Technological ProcessesBeetrootRed CabbageRed PepperGreen PepperKale
Raw526 ± 2.88 a109 ± 0.33 e597 ± 8.52 a91.9 ± 1.84 e555 ± 5.23 c
SV 80 °C361 ± 3.66 d217 ± 1.37 c422 ± 12.3 c596 ± 15.9 c402 ± 5.17 e
SV 85 °C476 ± 13.4 b600 ± 2.11 a439 ± 9.40 b737 ± 1.38 a613 ± 6.33 a
SV 90 °C444 ± 7.98 c576 ± 6.33 b434 ± 2.32 b,c142 ± 0.28 d600 ± 10.8 b
Steaming293 ± 1.60 e187 ± 1.91 d303 ± 5.49 d718 ± 11.5 b461 ± 1.28 d
The values are presented as the mean ± SD (n = 3). Values followed by the same letter are not significantly different at p ≤ 0.05 according to Duncan’s multiple range test. The “a” of the alphabet represents the highest values, and the “b, c, d, e” stands for the statistically significant decreasing values.
Table 3. HPLC method validation parameters at 280 nm.
CompoundRetention Time (min)Regression EquationCorrelation Coefficient (r)Linearity Range (μg/mL)LOD (μg/mL)LOQ (μg/mL)
Gallic acid6.95y = 58.4571x − 297.01951.000010–801.003.04
Chlorogenic acid16.73y = 27.5882x0.999910–1602.688.13
Caffeic acid17.66y = 72.5182x0.999610–802.938.87
Rutin21.72y = 11.6193x1.00002.5–400.441.34
Hyperoside23.05y = 17.9836x0.99992.5–400.802.41
Naringin26.07y = 29.5348x + 11.99371.00002.5–400.320.97
Rosmarinic acid30.01y = 31.2072x1.000010–1602.056.23
Quercetin35.12y = 16.0402x + 4.86041.00002.5–400.461.40
Naringenin37.38y = 86.6723x 0.99992.5–400.651.96
Kaempferol38.51y = 22.7602x + 14.45501.00002.5–400.320.98
LOD—limit of detection (3.3 SD/a), LOQ—limit of quantification (10 SD/a).
Table 4. Profile of phenolic acid compounds (mg/100 g freeze-dried vegetable ± SD) in tested vegetables before and after different technological processes.
VegetablesTechnological ProcessesGallic AcidChlorogenic AcidCaffeic AcidRosmarinic AcidSum of
Phenolic Acids
BeetrootRaw27.0 ± 0.23 d9.51 ± 0.67 c1.58 ± 0.44 dn.d.38.1 ± 0.45 d
SV 80 °C28.3 ± 0.42 c26.5 ± 1.22 b2.96 ± 0.11 cn.d.57.8 ± 0.58 b
SV 85 °C32.3 ± 0.50 b44.1 ± 1.73 a6.29 ± 0.05 an.d.82.7 ± 0.76 a
SV 90 °C34.6 ± 0.08 a6.23 ± 0.24 d4.33 ± 0.38 bn.d.45.2 ± 0.23 c
Steaming28.1 ± 0.27 c5.40 ± 0.41 d1.97 ± 0.14 dn.d.57.8 ± 0.27 b
Red cabbageRaw27.2 ± 1.53 b20.9 ± 0.97 a2.43 ± 0.21 b6.89 ± 0.25 b57.4 ± 0.74 c
SV 80 °C30.0 ± 0.31 a13.2 ± 1.33 b9.95 ± 0.39 a9.26 ± 0.58 a62.4 ± 0.65 a
SV 85 °C27.0 ± 0.16 b5.68 ± 0.63 d2.14 ± 0.19 b4.85 ± 0.22 c39.7 ± 0.30 d
SV 90 °C30.5 ± 0.13 a9.27 ± 1.24 c9.67 ± 0.51 a10.7 ± 0.83 a60.1 ± 0.68 b
Steaming26.4 ± 0.26 b8.06 ± 0.72 c,dn.d.n.d.34.5 ± 0.25 e
Red pepperRaw26.9 ± 0.20 a19.6 ± 1.53 cn.d.3.28 ± 0.01 c49.8 ± 0.58 b
SV 80 °Cn.d17.6 ± 1.23 cn.d.8.26 ± 0.21 a25.9 ± 0.48 e
SV 85 °Cn.d.23.2 ± 0.25 b4.45 ± 0.378.43 ± 0.18 a36.1 ± 0.20 d
SV 90 °C26.5 ± 0.10 a13.4 ± 0.36 dn.d.5.11 ± 0.13 b45.0 ± 0.20 c
Steaming26.8 ± 0.13 a54.6 ± 2.36 an.d.8.61 ± 0.43 a90.0 ± 0.97 a
Green pepperRawn.d.43.5 ± 3.06 c6.23 ± 0.46 b43.9 ± 1.06 b93.6 ± 1.53 c
SV 80 °Cn.d.117 ± 3.87 a5.61 ± 0.08 b91.3 ± 0.88 a213 ± 1.61 a
SV 85 °C35.4 ± 0.6289.7 ± 6.90 b10.3 ± 0.49 a8.06 ± 0.60 d143 ± 2.15 b
SV 90 °Cn.d36.4 ± 2.82 c2.51 ± 0.24 d5.68 ± 0.34 e44.6 ± 1.13 d
Steamingn.d.n.d3.64 ± 0.00 c10.4 ± 0.31 c14.0 ± 0.16 e
KaleRaw30.0 ± 0.12 b82.9 ± 1.77 a10.2 ± 0.85 b3.90 ± 0.27 c127 ± 0.75 b
SV 80 °C28.1 ± 0.22 b39.8 ± 3.08 c5.98 ± 0.43 d30.7 ± 2.79 b105 ± 1.63 c
SV 85 °C78.7 ± 2.26 a69.1 ± 2.94 b7.78 ± 0.64 c40.4 ± 3.48 a196 ± 2.33 a
SV 90 °Cn.d.68.2 ± 3.84 b14.5 ± 0.44 a5.51 ± 0.02 c88.2 ± 1.43 d
Steamingn.d.61.0 ± 3.35 b6.34 ± 0.57 c,d39.6 ± 2.99 a107 ± 2.30 c
n.d.—not detected. The values are presented as the mean ± SD (n = 3). Values followed by the same letter are not significantly different at p ≤ 0.05 according to Duncan’s multiple range test. The “a” of the alphabet represents the highest values, and the “b, c, d, e” stands for the statistically significant decreasing values.
Table 5. Profile of flavonoid compounds (mg/100 g freeze-dried vegetable ± SD) in tested vegetables before and after different technological processes.
VegetablesTechnological ProcessesRutinHyperosideNaringinSum of Flavonoid GlycosidesQuercetinNaringeninKaempferolSum of Flavonoid Aglycones
BeetrootRaw8.97 ± 0.62 en.d.16.8 ± 1.13 d25.8 ± 0.88 en.d.n.d.n.d.n.d.
SV 80 °C51.0 ± 0.32 cn.d.27.4 ± 0.17 c78.4 ± 0.25 c7.13 ± 0.56 bn.d.n.d.7.13 ± 0.56 b
SV 85 °C40.0 ± 1.03 dn.d.64.5 ± 0.20 a104 ± 0.62 b15.4 ± 0.51 an.d.n.d.15.4 ± 0.51 a
SV 90 °C91.4 ± 3.48 an.d.38.4 ± 0.91 b130 ± 2.20 a5.84 ± 0.18 cn.d.n.d.5.84 ± 0.18 c
Steaming61.7 ± 0.12 bn.d.14.1 ± 0.02 e75.8 ± 0.07 dn.d.n.d.n.d.n.d.
Red cabbageRaw16.8 ± 0.57 cn.dn.d.16.8 ± 0.57 d50.7 ± 0.06 an.d.n.d.50.7 ± 0.06 a
SV 80 °C62.5 ± 2.77 a16.2 ± 0.89 bn.d.78.7 ± 1.83 a4.57 ± 0.53 bn.d.n.d.4.57 ± 0.53 b
SV 85 °Cn.d.n.dn.dn.d.n.d.n.d.n.d.n.d.
SV 90 °C21.0 ± 1.17 b8.17 ± 0.52 c2.31 ± 0.53 a31.5 ± 0.74 cn.d.n.d.n.d.n.d.
Steaming24.2 ± 1.78 b18.5 ± 0.50 a1.09 ± 0.15 a43.8 ± 0.81 b4.49 ± 0.54 bn.d.n.d.4.49 ± 0.54 b
Red pepperRaw10.3 ± 0.37 b6.28 ± 0.58 cn.d. 16.6 ± 0.47 dn.d.n.d.n.dn.d.
SV 80 °C8.49 ± 0.79 cn.d.6.25 ± 1.15 c14.7 ± 0.97 en.d.0.84 ± 0.01 bn.d0.84 ± 0.01 c
SV 85 °C12.8 ± 0.89 a27.7 ± 0.38 a10.6 ± 0.41 a51.1 ± 0.56 an.d.n.d.4.41 ± 0.75 a4.41 ± 0.75 b
SV 90 °C9.88 ± 0.56 b,c5.46 ± 0.70 c9.13 ± 0.36 a,b24.5 ± 0.54 cn.d.n.d.n.d.n.d.
Steaming11.1 ± 1.05 b17.2 ± 1.32 b8.12 ± 0.70 b36.4 ± 1.02 bn.d.10.5 ± 0.20 a0.89 ± 0.17 b11.4 ± 0.10 a
Green pepperRaw42.7 ± 1.88 dn.d.6.95 ± 0.71a49.7 ± 1.30 d10.3 ± 0.23 dn.d.3.60 ± 0.66 d13.9 ± 0.45 d
SV 80 °C159 ± 11.5 an.d.n.d.159 ± 11.5 a11.9 ± 1.19 c,dn.d.n.d.11.9 ± 1.19 e
SV 85 °C94.6 ± 7.42 bn.d.n.d.94.6 ± 7.42 b16.6. ± 0.13 an.d.19.4 ± 0.18 a36.0 ± 0.16 a
SV 90 °C50.7 ± 4.06 dn.d.n.d.50.7 ± 4.06 d12.7 ± 1.34 b,cn.d.9.85 ± 1.01 c22.6 ± 1.18 c
Steaming70.7 ± 2.02 cn.d.8.83 ± 0.74 a79.5 ± 1.38 c14.4 ± 1.32 a,bn.d.11.6 ± 0.35 b26.0 ± 0.84 b
KaleRawn.d.n.d.n.d.n.d.n.d.n.d.4.17 ± 0.38 a4.17 ± 0.38 b
SV 80 °Cn.d.n.d.n.d.n.d.n.d.n.d.2.67 ± 0.10 c2.67 ± 0.10 c
SV 85 °Cn.d.n.d.n.d.n.d.20.2 ± 1.74n.d.3.96 ± 0.29 a,b24.2 ± 1.02 a
SV 90 °Cn.d.n.d.n.d.n.d.n.d.n.d.2.07 ± 0.14 d2.07 ± 0.14 c
Steamingn.d.n.d.n.d.n.d.n.d.n.d.3.59 ± 0.07 b3.59 ± 0.07 b
n.d.—not detected. The values are presented as the mean ± SD (n = 3). Values followed by the same letter are not significantly different at p ≤ 0.05 according to Duncan’s multiple range test. The “a” of the alphabet represents the highest values, and the “b, c, d, e” stands for the statistically significant decreasing values.
Disclaimer/Publisher’s Note: The statements, opinions and data contained in all publications are solely those of the individual author(s) and contributor(s) and not of MDPI and/or the editor(s). MDPI and/or the editor(s) disclaim responsibility for any injury to people or property resulting from any ideas, methods, instructions or products referred to in the content.

