Article

Synergistic Evolution and Spatial-Temporal Differences in Green Technological Innovation and Carbon Emission Reduction in the Construction Industry from the Perspective of New Productive Forces

by
Zihao Niu
and
Qingjie Xie
*
School of Environment and Safety Engineering, Jiangsu University, Zhenjiang 212013, China
*
Author to whom correspondence should be addressed.
Appl. Sci. 2025, 15(9), 4720; https://doi.org/10.3390/app15094720
Submission received: 6 March 2025 / Revised: 17 April 2025 / Accepted: 19 April 2025 / Published: 24 April 2025
(This article belongs to the Section Civil Engineering)

Abstract

:
Green technological innovation, as a critical emerging resource element, is instrumental in advancing sustainable and high-quality development of the construction sector. However, despite extensive research, the synergistic mechanism linking regional green technology innovation (RGTI) and carbon reduction in the construction industry (CRCI) remains theoretically underexplored, especially through the lens of new quality productivity (NQP). Based on dynamic panel data from 30 Chinese provinces spanning 2013–2021, this study employed multiple analytical approaches, including econometric models, coupling coordination models, kernel density estimation, and Dagum Gini coefficient decomposition, to systematically examine their interactive relationships and spatiotemporal evolution characteristics. The findings reveal that RGTI directly reduces the carbon emissions intensity of the construction industry and yields a “dual-driving effect” through the mediating role of NQP. Significant coupling coordination effects were identified among RGTI, NQP, and CRCI. Further investigation showed that their synergistic evolution manifests distinct “regional lock-in effects” and “polarization effects”, with eastern regions achieving positive interactions, while central and western regions remain constrained by developmental limitations. Although overall disparities narrowed during the study period, inter-regional differences persisted as the dominant factor. This study extends the research perspective on construction industry carbon reduction, contributing to new quality productivity formation and inter-regional emission reduction coordination.

1. Introduction

With the intensification of global climate change, reducing carbon dioxide emissions to achieve sustainable development goals has become a priority agenda for nations worldwide [1]. As one of the pillar industries in many countries, the construction sector plays a critical role in driving economic growth and infrastructure development while simultaneously facing significant challenges in promoting green and low-carbon transformation [2]. The construction industry is not only a high consumer of resources and energy but also a major contributor to greenhouse gas (GHG) emissions [3]. Statistics indicate that the construction sector accounts for 40% of global energy consumption and nearly one-third of GHG emissions [4]. In response, countries have actively implemented measures to tackle these challenges, and China is no exception. The construction industry in China contributes 51% of the nation’s total CO2 emissions and 46% of its energy consumption [5]. To address these issues, China has proposed its “Dual Carbon” goals, aiming to reduce carbon emissions across various industries, including construction. However, as one of the largest carbon-emitting sectors in China [6], the construction industry faces even more severe environmental challenges.
Green technology innovation, as a new type of resource factor, has increasingly become the focus of various industries due to its ability to promote technological breakthroughs, process optimization, resource savings, and reductions in environmental pollution, facilitating the transition from traditional high-carbon models to green low-carbon models in traditional industries [7]. The construction industry is no exception. Green technology innovation is widely regarded as a key pathway for driving the construction industry’s transition to a green low-carbon model and sustainable development [8,9]. For example, green building technology (GBT), implemented during the project design, construction, and operation phases, is regarded as a critical factor in achieving the cleaner and greener development of the construction industry [10]. By adopting green building materials, exploring innovative architectural designs, developing new materials, and employing intelligent construction technologies, these green innovations can significantly reduce the carbon footprint during the construction phase [11,12], thereby providing important technical support for carbon reduction in the construction industry.
Despite the significant effectiveness of green technology innovation in carbon reduction, its impact is not isolated and does not manifest consistently across all contexts; rather, it is profoundly influenced by regional economic development levels and policy environments. For instance, Zhang et al. [13] found that different types of environmental regulations produce varying impacts on the efficiency of green technology innovation in the construction industry, highlighting the necessity to rationally combine these regulations to achieve optimal results. Additionally, Li et al. [14] further confirmed the positive effect of government environmental governance orientations on corporate low-carbon performance, with this effect showing greater significance in heavily polluting industries, small and medium-sized enterprises, and eastern regions. In this context, the concept of “new quality productivity”, driven by innovation and representing advanced productivity levels, has become a key dimension influencing green technology innovation. NQP is not only a crucial driving force for sustainable economic development but also a core indicator for measuring regional digital transformation and green innovation levels [15,16], playing a vital role in the carbon reduction effects of green technology innovation within the construction industry.
Previous studies have explored the mechanisms through which green technological innovation affects carbon reduction, covering various regional, industrial, and corporate levels [17]. However, these studies often focus on single dimensions, such as digital technologies [18], corporate management [19,20], or environmental policies [21,22]. For the construction industry, which operates within the broader framework of urban economic activities, its carbon reduction effects are influenced not only by technological advancements and organizational factors but also by macro-level drivers such as urban socioeconomic development and environmental regulations [23]. These macro-level factors are particularly significant against the backdrop of “new quality productivity” (NQP) emerging as a critical driver of digital and green transformations across industries. Nevertheless, research on the synergistic effects of green technological innovation of the construction industry remains insufficient. Specifically, green technological innovation not only directly promotes carbon reduction but also achieves synergistic effects through continuous technological iteration and adaptive development. Such synergies are particularly pronounced from the perspective of NQP. Furthermore, existing studies have highlighted significant regional disparities in the effects of green technological innovation on carbon emissions in the construction industry [24]. In the vast context of China, regions exhibit considerable variation in resource endowments, innovation capacity, and productivity levels. This regional heterogeneity exacerbates the spatiotemporal differentiation observed in the adoption of green technologies and the transition to low-carbon construction [23]. Thus, exploring the coupling and coordination relationships between regional green technological innovation and carbon reduction in the construction industry from the perspective of NQP is a critical issue that warrants further investigation. Based on this premise, this study employs dynamic panel data from 30 Chinese provinces spanning 2013–2021. Combining econometric models, coupling coordination models, kernel density estimation, and the Dagum Gini coefficient, the study systematically analyzes the synergistic evolution and differentiated characteristics of NQP, regional green technological innovation, and carbon reduction in the construction industry.
The remainder of the paper is structured as follows: Section 2 provides a literature review; Section 3 explains the research methods and data sources; Section 4 presents the empirical results; Section 5 offers a systematic discussion based on the findings; and Section 6 concludes the study, highlighting its limitations and proposing directions for future research.

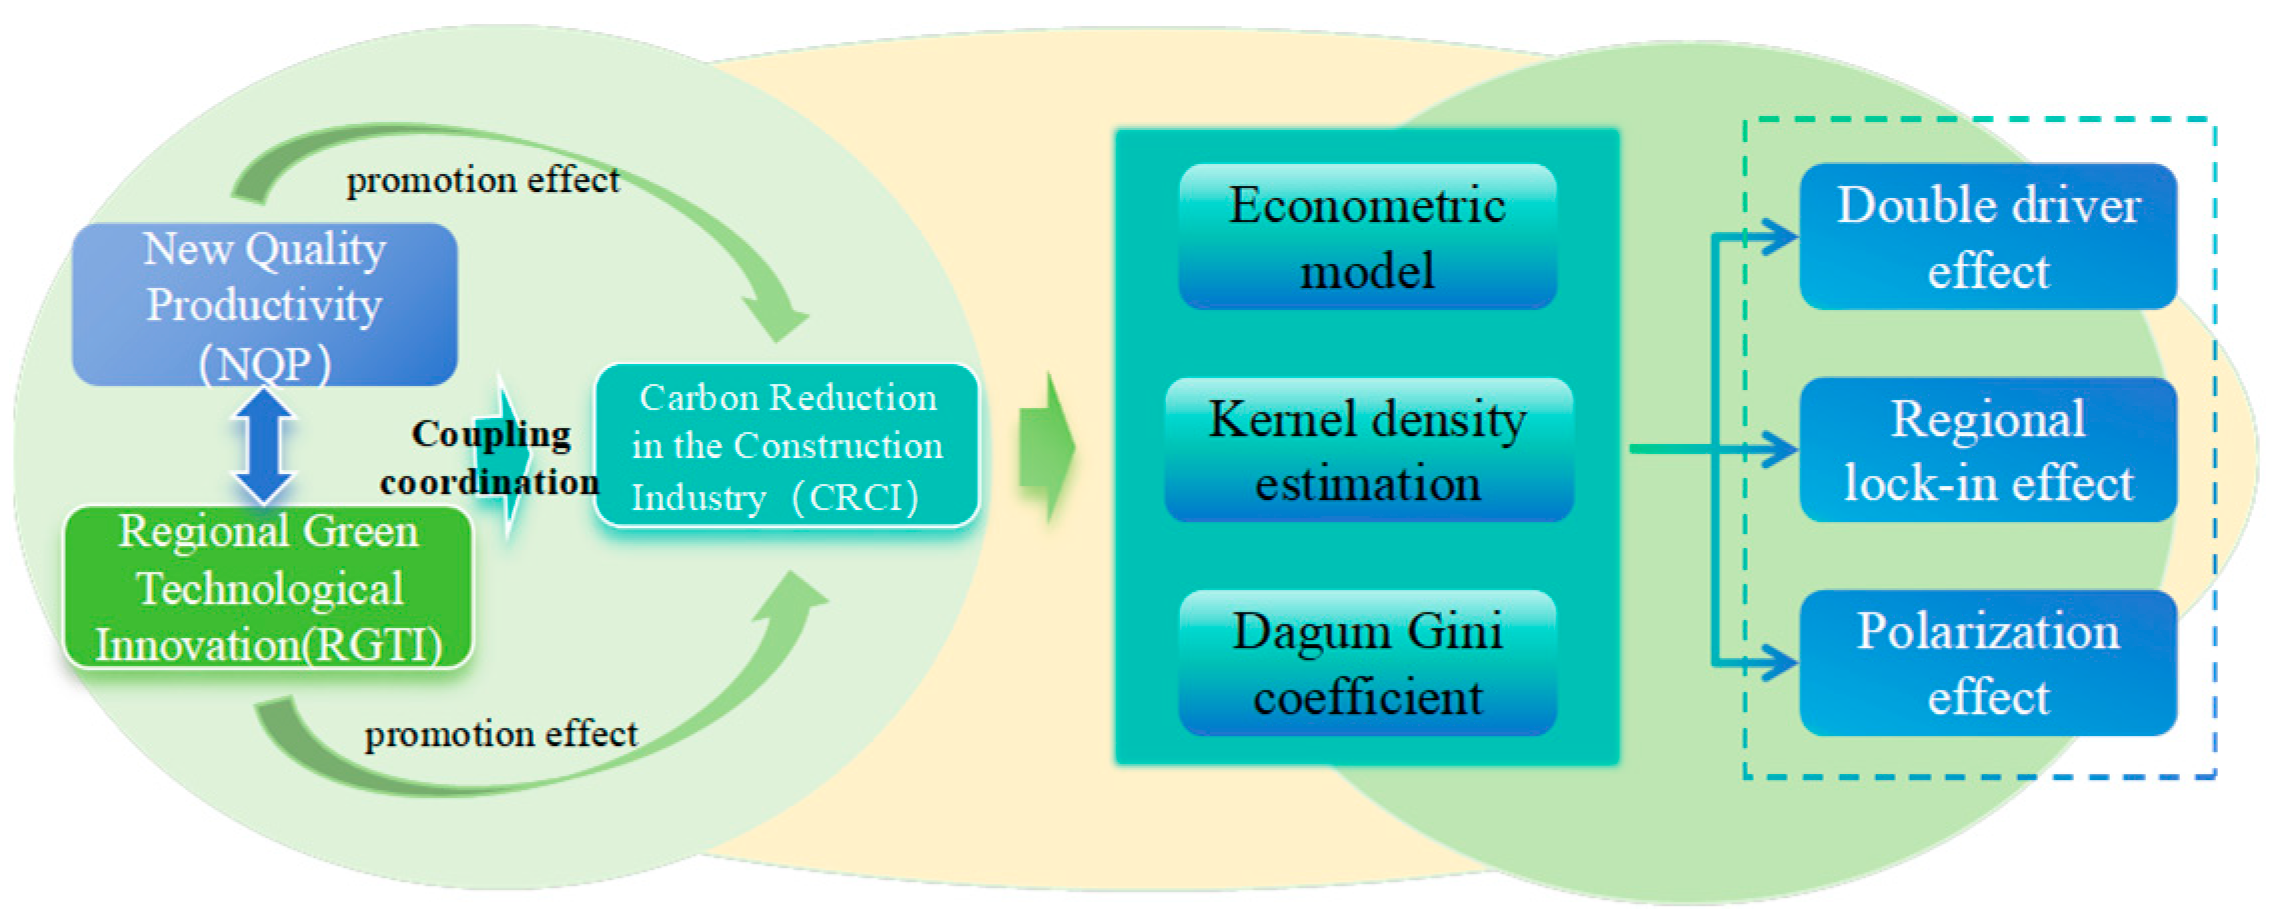
2. Theoretical Analysis and Model Development

Regional green technological innovation (RGTI), known for its ability to reduce energy consumption, minimize pollutant emissions, improve environmental quality, and foster green economic development [25], is widely recognized as an effective pathway to address the high carbon emissions of the construction industry [23]. Existing studies have explored RGTI from various perspectives and methodologies, yielding a wealth of findings [7], which can be categorized into direct effects and indirect impacts. In terms of direct effects, RGTI can reduce energy consumption and carbon emissions intensity by promoting the adoption of low-carbon technologies and driving organizational transformation in enterprises, thereby reshaping traditional high-carbon production models. For instance, Jiao et al. (2020) examined patent data to analyze the direct effects of seven types of green technologies on reducing carbon intensity at the industry level [26]. They found that the vertical spillover effects of green technologies significantly enhanced reductions in carbon intensity. In the power sector, low-carbon technologies such as carbon capture and storage, alternative fuel power generation, and smart grids have substantially reduced carbon emissions [27]. The construction industry is no exception.
Furthermore, RGTI may indirectly contribute to carbon reduction by enhancing resource utilization efficiency. As a typical resource-intensive industry, the carbon emissions of the construction sector primarily stem from high-intensity and low-efficiency resource use. Studies have shown that implementing green and low-carbon technologies in the cement industry can significantly reduce carbon emissions [28]. Additionally, green building practices, building-integrated photovoltaics (BIPV), and carbon-negative technologies are widely regarded as critical pathways to reducing the lifecycle carbon emissions of the construction industry [29]. By promoting green technologies in areas such as optimized building design, intelligent construction management, and resource recycling, the construction sector can effectively reduce its dependence on fossil fuels [30] and establish a more environmentally sustainable resource utilization model.
However, regional disparities in socioeconomic development levels can significantly influence the effectiveness of implementing RGTI. Economically developed regions, benefiting from robust financial resources, technical foundations, and policy support, demonstrate broader applications of green technological innovation outcomes [31]. In contrast, economically underdeveloped areas often face challenges such as limited technological diffusion capabilities, resulting in lower technology adaptability and transformation efficiency. More importantly, disparities in resource endowments and imbalances in industrial structures further exacerbate the technological gap in emissions reduction within the construction sector across regions [32]. Although previous studies have deeply examined the direct role of RGTI in the low-carbon transition of the construction industry, its carbon reduction effects are often constrained and influenced by more complex productivity systems. Particularly in the context of a rapidly growing digital economy, the coupled relationship between the carbon reduction effects of green technological innovation and productivity quality transformation has become increasingly prominent.
In recent years, with the progressive deepening of research on the effects of green technological innovation, the focus has gradually expanded from single-dimension technological innovation to a quality-oriented productivity development paradigm. The concept of new quality productivity (NQP) has provided an innovative theoretical framework for advancing the study of green technological innovation’s role in carbon reduction [33]. As a modern productivity form emphasizing quality-driven, innovation-led, and intensive growth, NQP leverages digital technology empowerment, intelligent upgrades, and structural optimization to signify a fundamental shift from quantitative growth to qualitative improvement in productivity development [34]. Within this theoretical framework, NQP may significantly enhance the diffusion depth and application efficiency of green technologies in the construction sector by improving system-level resource allocation efficiency and reconstructing traditional production models. Moreover, it amplifies the carbon reduction effects of green technologies by optimizing the overall operational quality of industrial systems. Thus, incorporating NQP into the analytical framework of RGTI and carbon reduction in the construction industry (CRCI) not only contributes to constructing a more comprehensive theoretical system but also provides a novel perspective to unveil the integrated mechanism of green technological innovation in developing a low-carbon construction industry.
Building on the above theoretical analysis, this study establishes a multi-dimensional co-evolutionary analytical framework encompassing RGTI, NQP, and CRCI (Figure 1). Specifically, the study first examines the direct impact of RGTI on CRCI and the mediating role of NQP. Furthermore, the coupling coordination model is employed to analyze the co-evolutionary mechanisms among the three dimensions and their spatial-temporal heterogeneity.

3. Method and Data

3.1. Measurement of RGTI, NQP, and CRCI

Accurate quantification of the three key variables—RGTI, NQP, and CRCI—is the foundational step of this study. Based on a systematic review and evaluation of existing measurement methodologies, this study employed the annual number of utility model patents and invention patents granted in each province as the metric for regional green technological innovation (RGTI). Compared to green total factor productivity indicators derived from input–output methods, patent data offer greater timeliness and comparability, providing a more direct reflection of a region’s actual green technological innovation capacity [35].
For the assessment of NQP, a multi-dimensional composite index evaluation system was adopted. This system evaluates regional sustainable development capabilities and technological progress from various dimensions, including economic development level, human resource quality, infrastructure completeness, environmental protection intensity, energy industry structure, and digital economy development. This multi-dimensional framework captures the intrinsic characteristics of NQP, enhancing the comprehensiveness and reliability of the measurements.
In measuring carbon reduction levels in the construction industry (CRCI), a comprehensive evaluation system was designed, encompassing total carbon emissions, carbon emissions intensity, the proportion of total industrial carbon emissions, and per capita carbon emissions. The specific calculation of carbon emissions follows the standard methodology proposed by the IPCC (2006), tailored to the characteristics of the construction industry. Carbon emissions are systematically measured across two dimensions: direct emissions and indirect emissions [36]. The detailed calculation formulas are provided in Equations (1) and (2).
C d c e = i = 1 11 E i × α i × f i ,   C i c e = j = 1 5 M j × β j × ( 1 ε j )
C c e = C d c e + C i c e
In Equation (1), Cdce represents direct carbon emissions, while Cice denotes indirect carbon emissions. Ei represents the consumption of the i-th type of energy, αi is the average low calorific value of the i-th energy type, and fi is the default CO2 emissions factor for the i-th energy type. Mj denotes the consumption of the j-th type of construction material, βj represents the CO2 emissions factor for the j-th construction material, and εj is the recycling coefficient of the j-th construction material. In Equation (2), Cce represents the total carbon emissions of the construction industry.
Taking into account the multidimensionality and complexity of measuring the RGTI, NQP, and CRCI indicator systems, as well as the significant heterogeneity in the dimensional characteristics, measurement units, and numerical attributes of the indicators, the entropy method was employed in this study for the standardization of indicator data to ensure an accurate assessment of the development levels of RGTI, NQP, and CRCI. The entropy method, as an objective weighting approach based on the principle of information entropy, determines weight coefficients by quantifying the information entropy values of each indicator, which effectively avoids any systematic biases that may arise from subjective weighting, thereby ensuring the scientific accuracy of the measurement results [37]. Specifically, this study applies range normalization to the raw data to eliminate dimensional differences, heterogeneity in scale characteristics, and disparities between positive and negative values among indicators. The specific formulas are presented in Equations (3)–(5).
y i j = x i j min ( x i j ) max ( x i j ) min ( x i j ) ,   y i j   is a positive indicator
y i j = max ( x i j ) x i j max ( x i j ) min ( x i j ) ,   y i j   is a positive indicator
p i j = y i j / j = 1 n y i j ,   e i j = k j = 1 n p i j × ln ( p i j ) ,   d j = 1 e j ,   w j = d j / j = 1 n d j
In Equations (3)–(5), Yij represents the normalized value of the j-th indicator for system i; Xij denotes the raw value of the j-th indicator for system i; and xij refers to the information entropy of the j-th indicator for the i-th province. In Equation (3), pij is the normalized value, and m represents the number of provinces. Additionally, ej denotes the information entropy of indicator j, dj represents the redundancy of the information entropy, wj is the weight of indicator j, and n is the total number of indicators.

3.2. Econometric Model

Before investigating the co-evolutionary mechanism between regional green technological innovation (RGTI) and carbon reduction in the construction industry (CRCI), the first task was to verify the potential relationship between RGTI and CRCI. This is particularly important for uncovering the intrinsic mechanism from the perspective of NQP. Accordingly, this study developed a bidirectional fixed-effects model and a mediation effect model to systematically quantify the pathways through which RGTI influences carbon emissions intensity of the construction industry (CEICI). Additionally, a mediation effect test was employed to thoroughly analyze the moderating role of NQP, clarifying the impact of new quality productivity on the process by which green technological innovation facilitates carbon reduction in the construction industry. The specific formulas are presented in Equations (6) and (7).
C E I C I i t = γ 0 + γ 1 R G I T i t + γ 2 C o n t r o l i t + δ i + λ t + ε i t
C E I C I i t = γ 0 + γ 1 R G I T i t + γ 2 N Q P i t + γ 3 C o n t r o l i t + δ i + λ t + ε i t
In Equations (6) and (7), i represents provinces, and t denotes years. The dependent variable, CEICIit, refers to the carbon intensity in the construction sector, calculated as the ratio of construction industry carbon emissions to construction industry value added. The independent variable, RDLit, represents regional green technological innovation levels. Control variables include energy structure (ES), degree of government intervention (DGI), industrial structure (IS), research and development investment (R&D), level of openness to the outside world (LOOW), and regional economic level (LRE). Additionally, δi and λt represent individual and time-fixed effects, respectively, while ε denotes the random disturbance term.
To further explore the intrinsic mechanism of regional green technological innovation on carbon reduction in the construction sector from the perspective of new quality productivity (NQP), a mediation effect model was introduced. This approach aims to uncover the transmission pathway through which regional green technological innovation impacts carbon reduction via NQP as a mediating variable. The specific model formula is presented in Equation (8).
N Q P i t = γ 0 + γ 1 R G I T i t + γ 2 C o n t r o l i t + δ i + λ t + ε i t
In Equation (8), NQPit serves as the dependent variable, while RGITit acts as the independent variable. The meanings of the remaining symbols are identical to those in Equation (7).

3.3. Coupling Coordination Degree Model

Although econometric models reveal the effects of regional green technological innovation (RGTI) on carbon reduction in the construction industry (CRCI) to a certain extent, and mediation models further clarify the moderating role of new quality productivity (NQP), these approaches fail to thoroughly analyze the co-evolutionary mechanisms between RGTI and CRCI, particularly under the dynamic evolution characteristics of NQP. To address this limitation, a coupling coordination model was introduced for systematic analysis. Considering that the interaction between green technological innovation and carbon reduction in the construction industry is significantly influenced by the systemic role of NQP, a three-dimensional co-evolutionary analysis paradigm was constructed from the perspective of NQP.
The coupling coordination model, an effective tool for quantifying the degree of synergistic development among system elements, functions by measuring the interactive relationships among subsystems to evaluate the functional integration and optimization of the overall system [38]. This model has been widely applied in the field of regional economics [39]. The specific calculation method of the RGTI–NQP–CRCI three-dimensional coupling coordination model is detailed in Equations (9)–(11).
C = 3 U 1 U 2 U 3 3 / ( U 1 + U 2 + U 3 )
T = α 1 × U 1 + α 2 × U 2 + α 3 × U 3
D = C × T 3
In the formula, C represents the coupling degree of the ternary system, and T denotes the comprehensive evaluation value of the ternary system. Ui denotes the index of the i-th subsystem, while αi represents the weight coefficient of the i-th subsystem, satisfying α1 + α2 + α3 = 1. Considering that RGIT, NQP, and CRCI are equally significant in evaluating the overall system in this study, the weights are set as α1 = α2 = α3 = 1/3, based on previous research. D represents the coupling coordination degree of the ternary system.
To ensure the scientific validity and interpretability of the evaluation results, this study establishes coupling coordination degree determination criteria based on previous research [40], which are detailed in Table 1. In this context, the coordination type reflects the current overall stage of RGTI, NQP, and CRCI, while the coordination level further refines the coordination type and relates to the range of D values. This allows for a comprehensive assessment of the collaborative development levels of the three systems and their dynamic change trends.

3.4. Analysis of Spatiotemporal Evolutionary Differences

To further elucidate the co-evolutionary dynamics among regional green technological innovation (RGTI), new quality productivity (NQP), and carbon reduction in the construction industry (CRCI), particularly the regional differentiation characteristics at the inter-regional level, this study employed kernel density estimation and the Dagum Gini coefficient to analyze their temporal evolution and regional disparities, respectively [41]. Both methods have been widely applied in studies examining spatial-temporal differences across regions. Given the vast expanse of China and the significant differences in resource endowments, historical development, and economic conditions across regions, this study adopted the National Bureau of Statistics’ regional classification standard, dividing China’s 30 provincial administrative regions into four economic zones: eastern, central, western, and northeastern regions [42]. The formulas for kernel density estimation and the Dagum Gini coefficient are presented in Equations (12) and (13), respectively.
f ( x ) = 1 N h i = 1 n K ( X i x ) / h
In Equation (12), N represents the number of provinces, hhh denotes the bandwidth, and K(x) is the kernel function. Xi refers to independent and uniformly distributed sample data, representing the coupling coordination degrees of RGTI, NQP, and CRCI across different provinces. xxx indicates the average value of the coupling coordination degree.
G = k = 1 l h = 1 l i = 1 n k r = 1 n h S k i S h r / 2 T n 2 ,   G = G i n t r a + G n d + G h y p e r
In Equation (13), G represents the Dagum Gini coefficient, with Gintra denoting intra-group differences, Gnb representing inter-group differences, and Ghyper indicating hyper-variation density. Ski refers to the coupling coordination degree of province iii in region k for RGTI, NQP, and CRCI. Similarly, Shr denotes the coupling coordination degree of province r in region h, while T represents the average coupling coordination degree across all provinces. n indicates the total number of provinces, and l refers to the total number of regions.

3.5. Data Collection

Considering data availability and reliability, this study selected panel data from 30 Chinese provinces (excluding Tibet, Hong Kong, Macau, and Taiwan) spanning the years 2011 to 2021 as the research sample. The data used in this study were primarily obtained from the Chinese Research Data Services Platform (CNRDS), the China Construction Industry Statistical Yearbook, the China Energy Statistical Yearbook, the Digital Finance Research Center at Peking University, and various provincial statistical yearbooks, among other official and authoritative data sources. Furthermore, to ensure data completeness and scientific rigor, linear interpolation was employed to estimate missing values.

4. Results

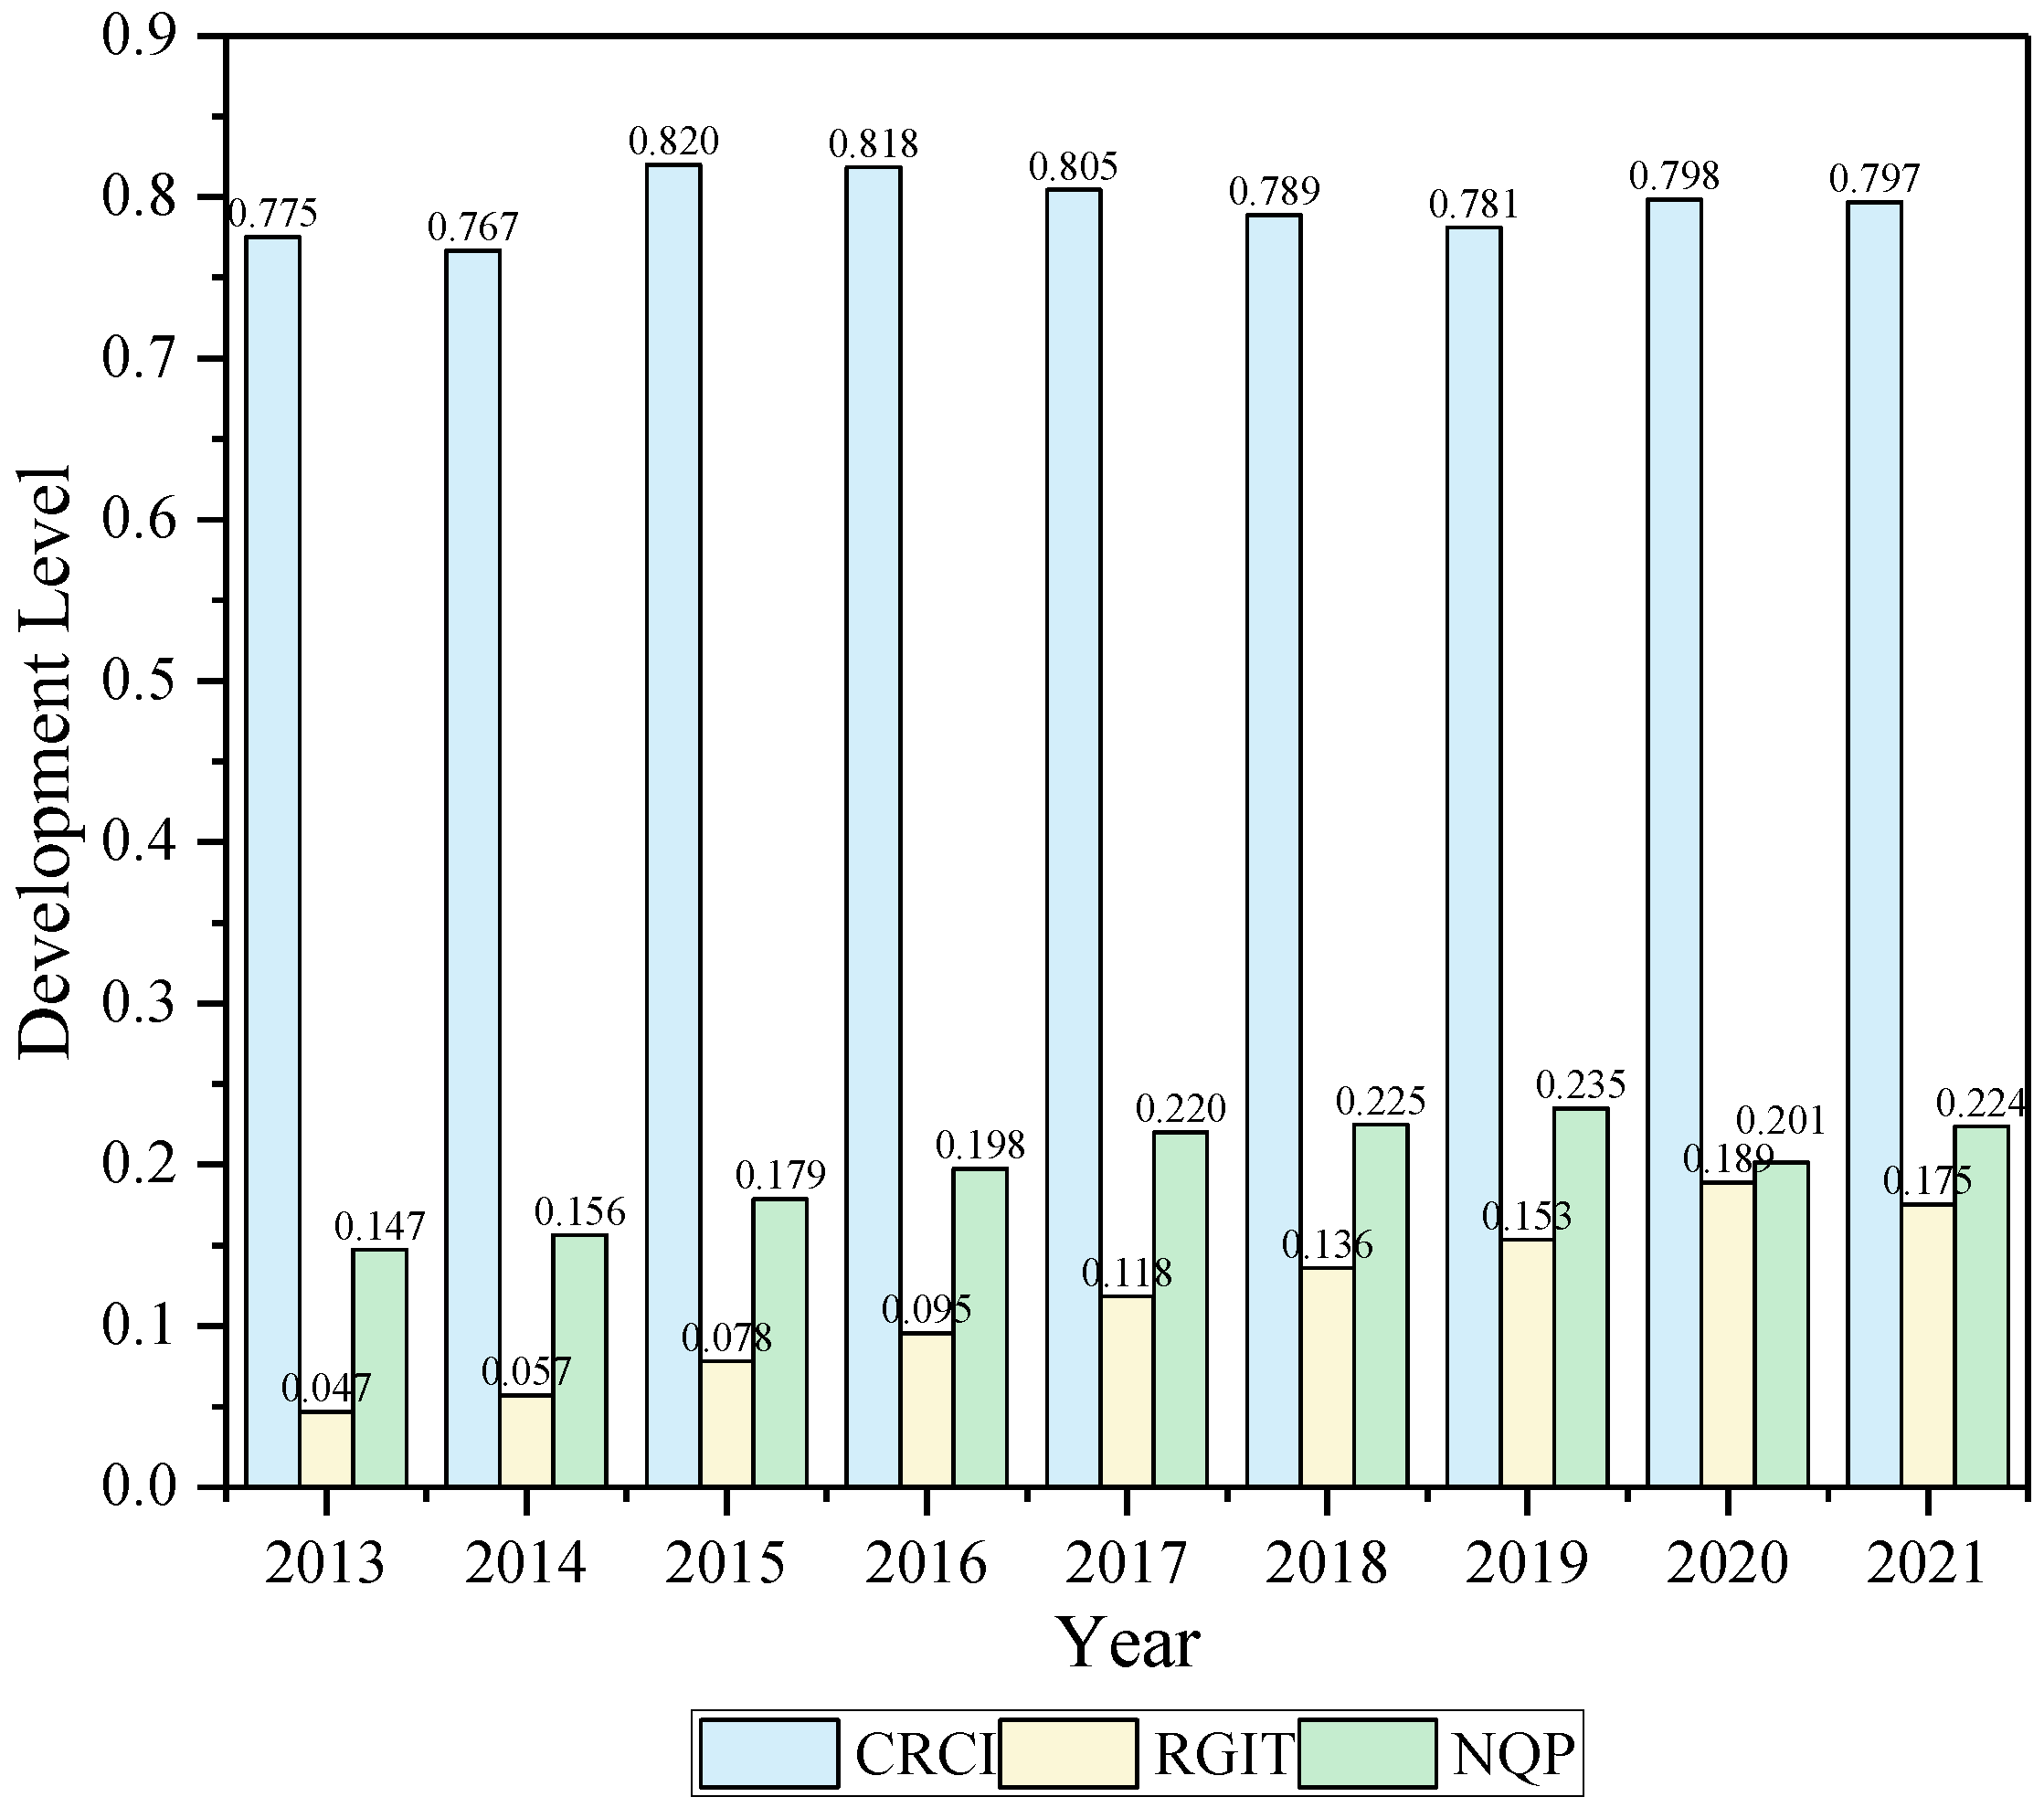
4.1. Measurement Results of RGTI, NQP, and CRCI

This study is based on the measurement indicator system established in Section 3.1, measuring the development levels of CRCI, RGTI, and NQP across 30 provinces from 2013 to 2021. Figure 2 indicates that the regional CRCI was maintained at a high level of 0.750 to 0.820 throughout the study period. This phenomenon is considered to reflect the effectiveness of emission reduction policies in the construction industry and also reveals the complex interaction between the policy framework and technological drivers. During this period, the low-carbon transformation of the construction industry was promoted by the provinces through the implementation of innovative low-carbon technologies and the optimization of resource allocation, indicating that although the construction industry is a significant source of carbon emissions, a gradual improvement in overall carbon emission levels was achieved due to effective reduction measures [43]. In terms of RGTI, the upward trend is considered to be particularly evident, especially since 2015, when a significant acceleration was observed. Specifically, RGTI was observed to increase from 0.078 in 2015 to 0.175 in 2021; this change is considered to reflect the efforts made by provinces under the implementation of technology innovation policies and also to represent substantial progress in green technologies. Funds and resources were actively invested in green technology research and development, providing strong support for the industry and facilitating the achievement of carbon reduction targets.
Similarly, NQP was noted to have steadily increased from 0.147 in 2013 to 0.224 in 2021, reflecting the effective improvement of new productivity among provinces during economic structural transformation and new economic models. This growth is considered to reflect the effectiveness of technological advances and industrial optimization, reinforcing the adaptability and resilience of the economy during the green transformation process. This suggests that new productivity may create conditions for further applications of green technologies, thereby facilitating their carbon reduction effects. This was found to be consistent with prior studies on the carbon reduction effects of new productivity [44]. The carbon reduction effects brought about by green technology innovation were observed to support carbon reduction in the construction industry, while the enhancement of new productivity indirectly was seen to strengthen the emissions reduction effects of green technologies through optimizing industry efficiency, production methods, and resource allocation. Based on the analysis above, the interactive relationship between CRCI, RGTI, and NQP is highlighted as showing a potential synergy in the process of transformation and upgrading. Higher CRCI levels are considered to complement the increases in RGTI and NQP. It is necessary for an econometric model to be constructed further to systematically quantify the impact mechanism of RGTI on CRCI and to explore the mediating effect of NQP, thus providing empirical support for the collaborative evolution of regional green technology innovation and carbon reduction in the construction industry from the perspective of new productivity.

4.2. Econometric Results

The results of the regression model are presented in Table 2. Model (1) shows that RGTI has a negative impact on CEICI at the 1% significance level, with a regression coefficient of −0.478. After including control variables, Model (3) indicates that this negative impact remains significant at the 1% statistical level, with the regression coefficient increasing to −0.813. Upon the inclusion of the NQP variable, RGTI continues to exhibit a negative effect on CEICI at the 1% significance level, with the regression coefficient reaching −0.759. This indicates that regions can significantly reduce the carbon emissions intensity of the construction industry and promote carbon reduction by enhancing the level of green technology innovation, which also verifies previous findings on the carbon reduction effects of green technology innovation, including in the construction industry [24,45]. NQP in Models (2) and (4) exhibits a similar situation, although after incorporating control variables, the negative impact of NQP on CEICI decreases from the 1% level to the 5% level; it continues to show a robust negative effect. This demonstrates that the development of NQP can not only enhance carbon emissions performance [44] but also effectively promote carbon reduction in the construction industry.
Further analysis reveals that, according to Model (5), the levels of government governance (DGI), degree of openness (LO), regional economic development (LRE), and industrial structure (IS) all exhibit significant negative impacts on CEICI. This indicates that regions can enhance the implementation of green technology innovation, improve the application and promotion of low-carbon technologies, and accelerate the green transition by strengthening policy support for carbon reduction, promoting market openness, and optimizing industrial structures [46], thereby further improving overall carbon reduction performance in the construction industry. It is noteworthy that, according to Model (6), RGTI has a positive impact on NQP at the 1% significance level, with a regression coefficient of 0.250. Combining the results of Model (3), it is evident that NQP plays a significant mediating role in the effect of RGTI on CEICI. This suggests that NQP can facilitate RGTI’s further reduction of carbon emissions intensity in the construction industry, which is consistent with previous research findings on the carbon reduction effects of new productivity [44].

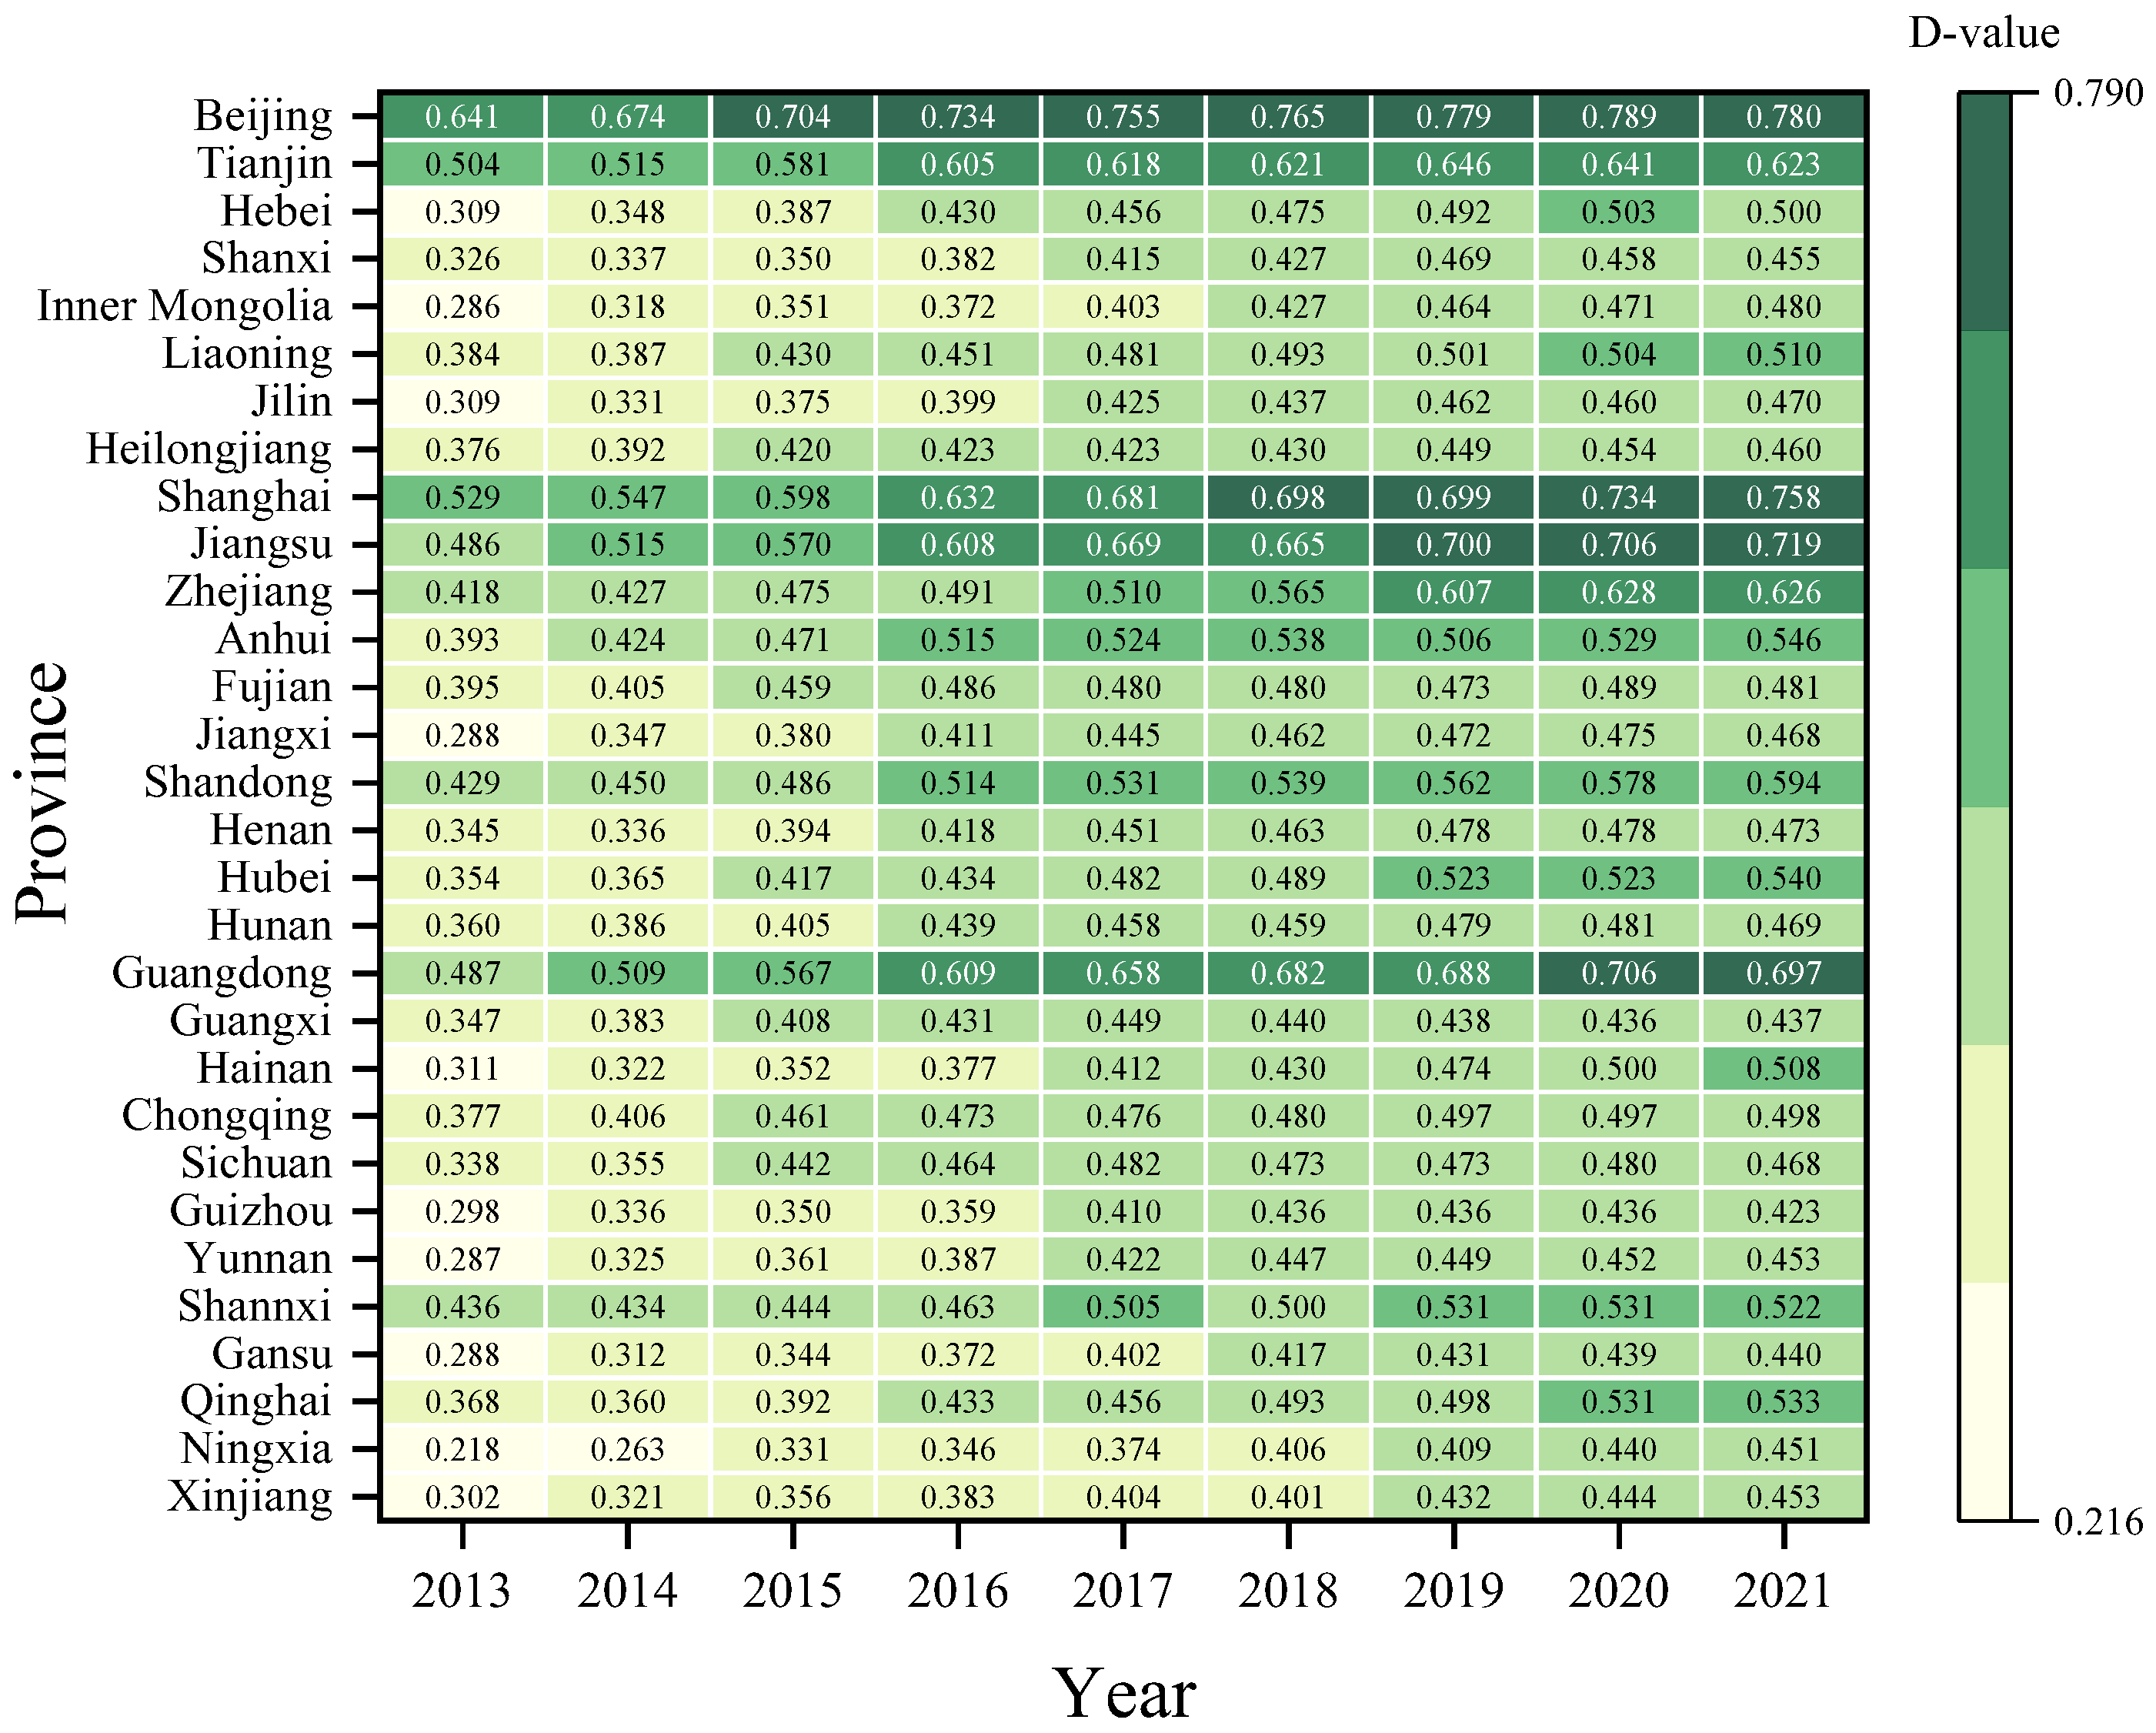
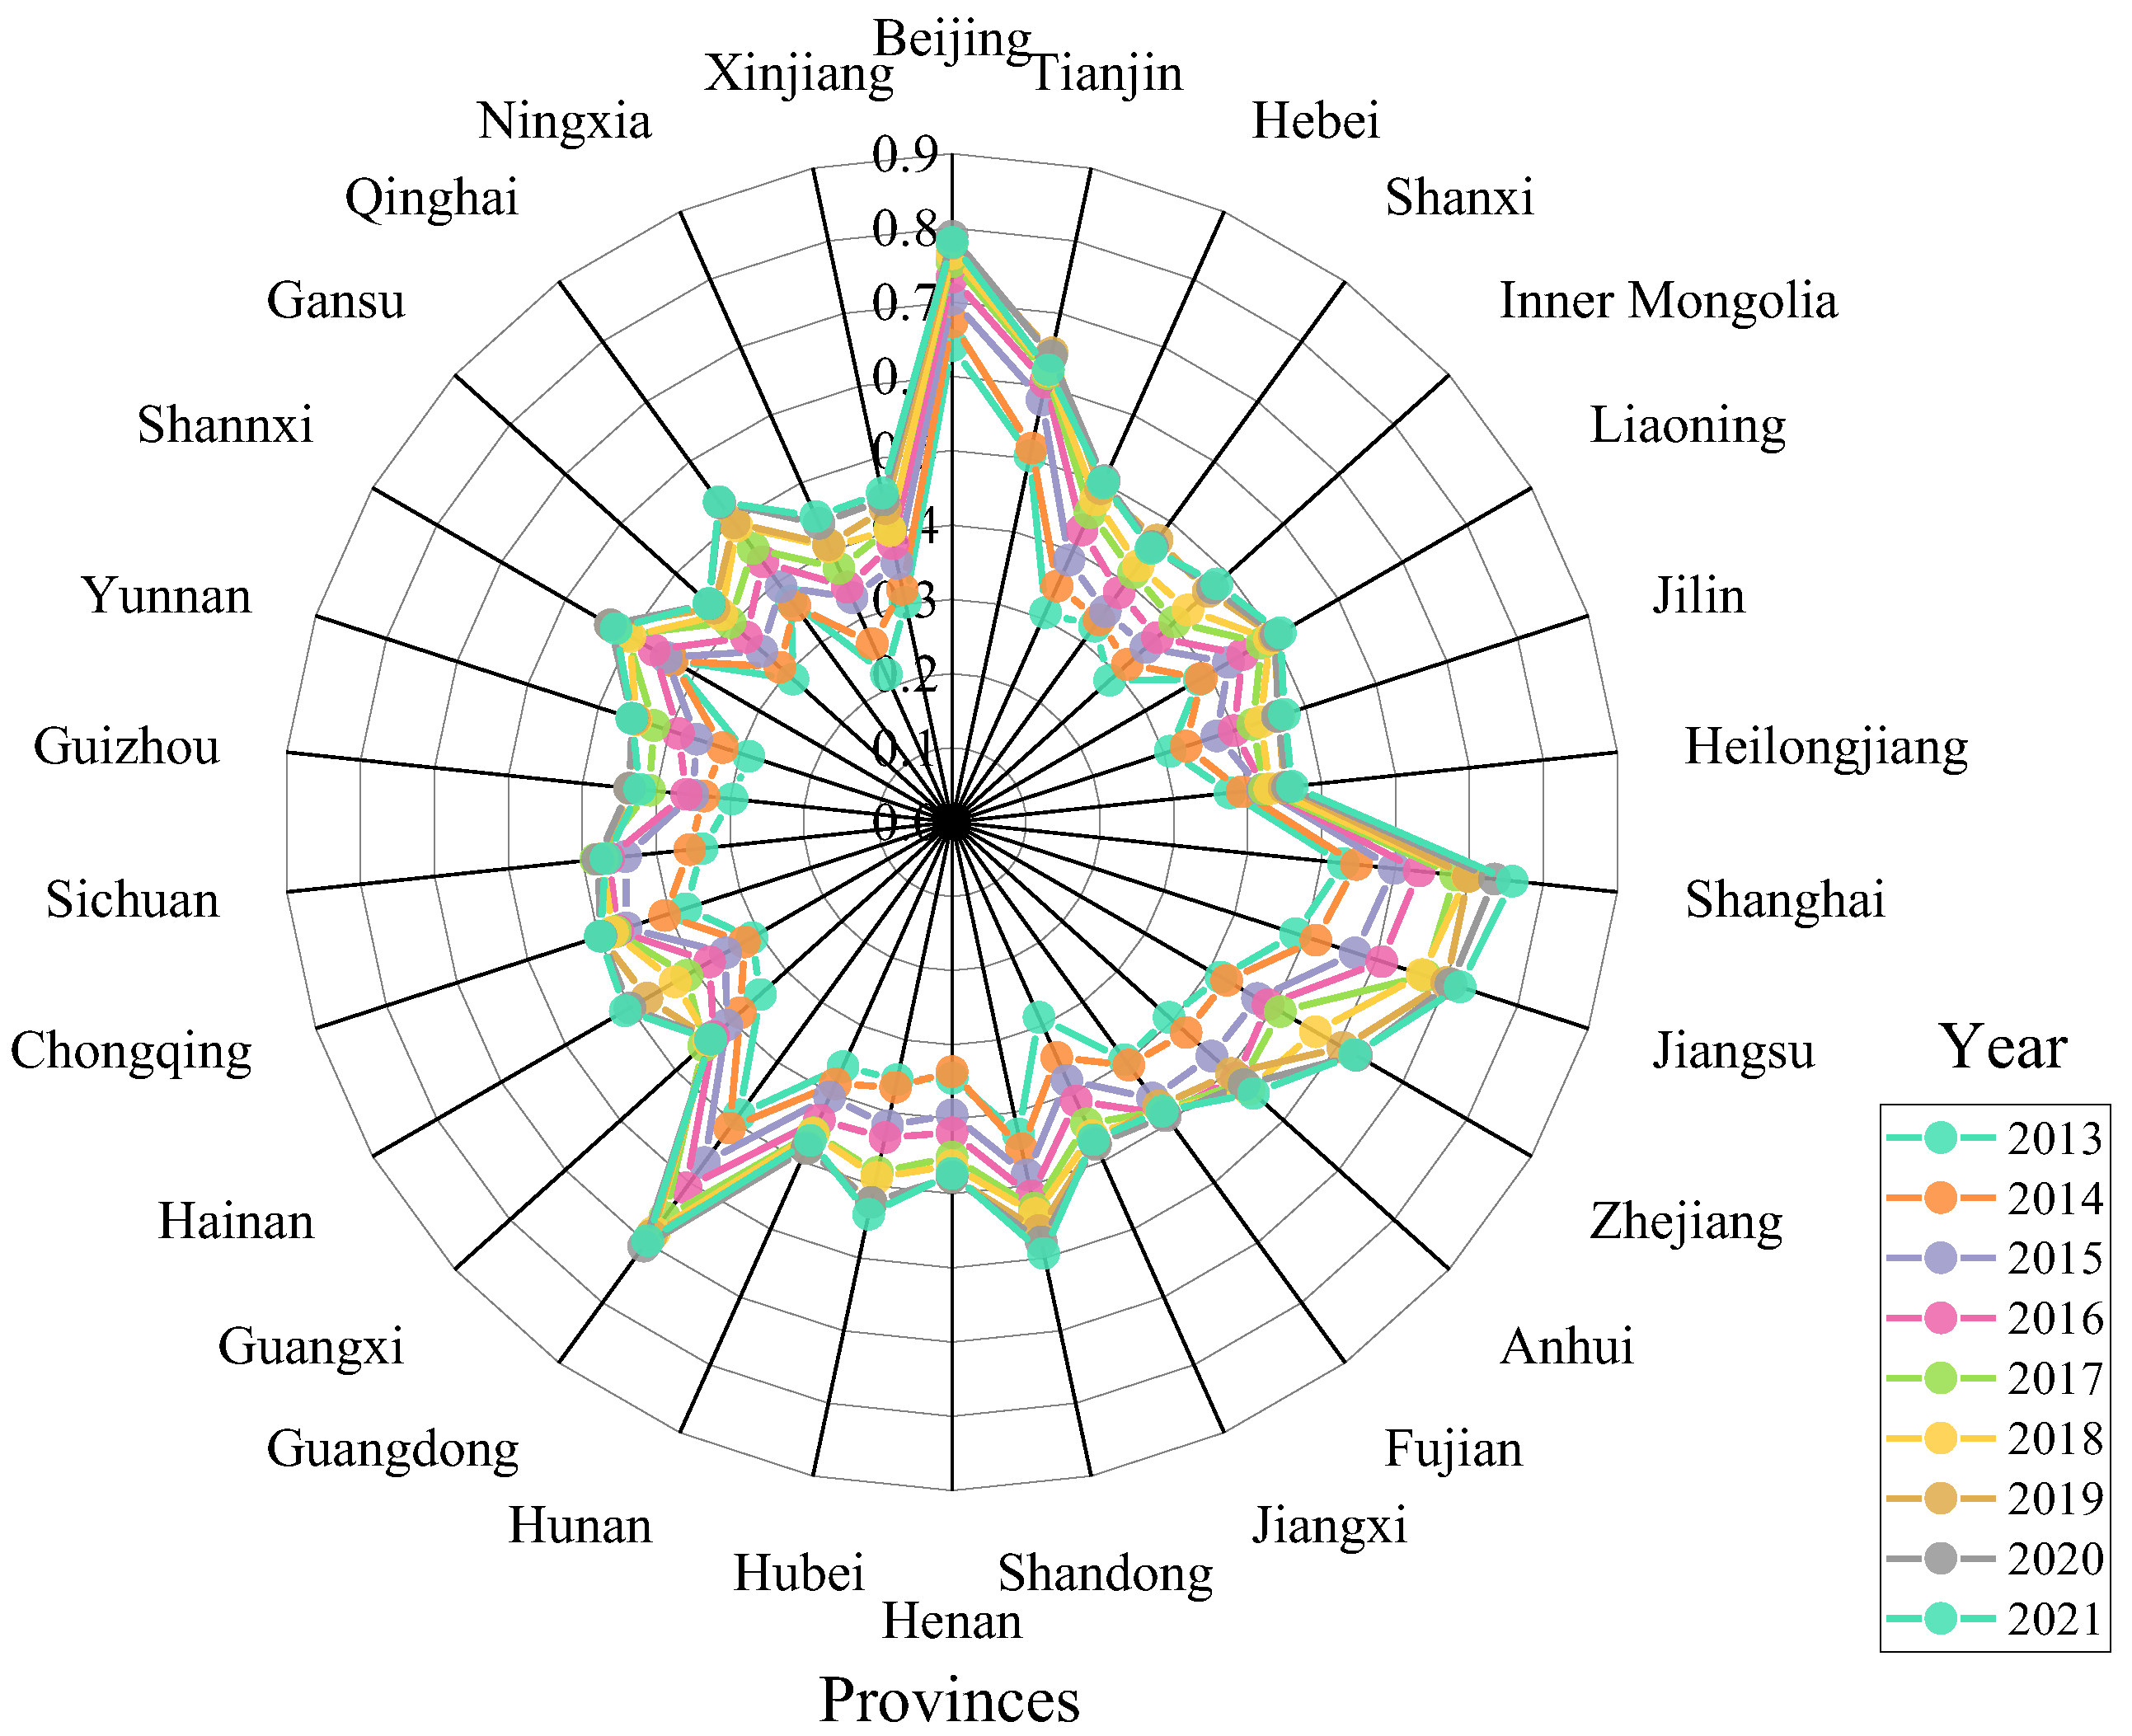
4.3. Co-Evolutionary Results of RGTI, NQP and CRCI

This study measured the coordinated development level among RGTI, NQP, and CRCI based on the method of coupling coordination degree. Figure 3 demonstrates that from 2013 to 2021, the coupling coordination degree (D value) among RGIT, NQP, and CRCI has shown a steady upward trend nationwide, while the fluctuations indicated in Radar Figure 4 reflect the significant regional disparities in coordinated development among the 30 provinces nationwide. Regionally, the eastern region exhibits the most favorable cooperative evolution trend, with its coupling coordination degree consistently maintaining a leading level. Specifically, the D value of Beijing steadily increased from 0.641 in 2013 to 0.780 in 2021, while Shanghai and Jiangsu achieved 0.758 and 0.719, respectively, realizing a transition from primary to intermediate coordination. This high level of coupling coordination reveals that, driven by new productivity, green technology innovation in the eastern region has fully facilitated carbon reduction in the construction industry. This phenomenon may arise from the superior endowment of innovative resources and policy support systems in the eastern region, allowing green technologies to efficiently permeate the low-carbon transformation process of the construction industry. Wang et al. [47] assessed the efficiency of regional green technology innovation using a dynamic network slack measurement method and also found that technological innovation efficiency scores exhibit strong spatial dependence and significant spatial imbalance phenomena. Similarly, Chen et al. [48] found that there is a significant spatial agglomeration phenomenon between the level of green technology innovation in Chinese provinces and carbon intensity; the direct impact of green technology innovation on the carbon intensity of local regions presents a significant “inverted U-shaped” relationship.
In contrast, the central region exhibits a “catch-up” collaborative evolution characteristic, with its coupling coordination degree value, although lower than that of the eastern region, showing a steady upward trend. For example, in 2021, the coupling coordination degrees of Anhui and Henan reached 0.546 and 0.473, respectively, placing them within the range of “barely coordinated” to “near disorder”. This “catch-up” development model aligns closely with the transformation characteristics of the central region. The deeper reason lies in the gradual development of green technology innovation capabilities in these regions as they undertake industrial transfer and technology spillovers from the eastern region. However, constrained by the weak foundation of new productivity and a lack of innovative resources, the practical application of green technologies in the construction industry still requires improvement. In particular, the gap between the central and eastern regions remains evident in terms of technology absorption, transformation, and the industrialization of innovative outcomes.
Finally, the coupling coordination degree in the western and northeastern regions is generally at a low level. Figure 4 shows that the D values in these regions mostly fall between mild disorder and moderate disorder, indicating a slow rate of growth. For example, the D values of Ningxia and Heilongjiang reached 0.451 and 0.460 in 2021, respectively, indicating that they merely reached the level of “near disorder”. This indicates that the lagging nature of this collaborative evolution reflects the structural contradictions in regional development. Firstly, the inertia of traditional industries and path dependence constrain the formation of new productivity. Secondly, the shortage of innovative resources and talent outflow weaken the endogenous driving force of green technology innovation. Furthermore, the technological transformation and process upgrades in the construction industry face high cost pressures, affecting the promotion and application of low-carbon technologies. Especially in the western region, the geographical conditions and market scale limitations hinder the full realization of the economies of scale for green technologies [49], further exacerbating regional imbalances in coordinated development.

4.4. Results of Spatiotemporal Evolution Analysis

Based on the results in Section 4.3, significant temporal and spatial differences are observed in the coordinated development levels of RGTI, NQP, and CRCI. Therefore, this study employed kernel density estimation and the Dagum Gini coefficient to explore the spatiotemporal characteristics of these inter-regional disparities.

4.4.1. Dynamic Evolution Results

The density estimation results (Figure 5) reveal the dynamic evolution characteristics of the three-dimensional coupling coordination degree (D) of RGTI, NQP, and CRCI from 2013 to 2021. From a temporal perspective, the density distribution of D values exhibits a significant rightward shift. In 2013, the distribution peak was concentrated around 0.4, indicating that most regions were at the “on the verge of imbalance” or “barely coordinated” level. By 2021, the peak had notably shifted upward to approximately 0.7, suggesting that the overall coordination level had progressed into the “primary coordination” to “intermediate coordination” range. This systematic rightward shift reflects the increasing investment in green technological innovation and the enhancement of innovation capacity, which have deepened the penetration of low-carbon technologies in the construction industry. Additionally, the formation of new quality productivity has provided effective support for the absorption and transformation of green technologies, further strengthening the impact of technological innovation on carbon reduction.
In terms of distribution morphology, the D-value density curve evolves from a unimodal to a bimodal structure. The unimodal distribution observed in 2013 gradually transitions into a bimodal pattern by 2021, revealing significant structural differentiation in regional coordinated development. Innovative regions such as the Beijing-Tianjin-Hebei (BTH) area and the Yangtze River Delta (YRD) have leveraged robust innovation systems and advanced industrial foundations to achieve rapid improvements in CRCI, driven by the synergy of RGTI and NQP. In contrast, less developed regions with scarce innovation resources and weak industrial bases remain constrained by limited technological absorption capacity and inefficient innovation transformation, resulting in persistently lagging coordinated development levels. This regional divergence is not only reflected in the expanded range of D-value distributions but also highlights systemic differences in regional innovation capacity and resource allocation efficiency.
This study further reveals that the bimodal evolution of the kernel density curve profoundly reflects the “Matthew Effect” in China’s green transition process. High-coordination regions continuously maintain their leading positions through cumulative innovation advantages, while low-coordination regions face multiple constraints in their efforts to catch up technologically, exacerbating regional disparities. This spatial polarization poses new challenges for the formulation of regional coordinated development strategies. Based on these findings, future research will employ the Dagum Gini coefficient method to conduct a more refined analysis of spatial heterogeneity in coupling coordination degrees across China’s four major regions: eastern, central, western, and northeastern.

4.4.2. Spatial Variation Results

Table 3 and Figure 6 present the results based on the decomposition of the Dagum Gini coefficient. This study provides an in-depth analysis of the spatial differences in the coordinated development of regional green technology innovation and carbon reduction in the construction industry from 2013 to 2021. According to Table 3, the overall Gini coefficient (G) for the 30 provinces and municipalities in the country shows a continuous downward trend, decreasing from a maximum of 0.127 in 2013 to 0.091 in 2019, before slightly rebounding to 0.094 in 2021. This indicates that the coordinated development of RGTI, NQP, and CRCI generally exhibits a convergent characteristic. Specifically, although the inter-regional disparity component decreased from 0.078 in 2013 to 0.068 in 2021, the inter-regional disparity remains a major characteristic causing significant regional differences among the four major regions.
This is also validated in Figure 6, which shows through the difference decomposition results for the four major regions that inter-regional disparity has always been the dominant factor of inequality, with its contribution rate rising significantly from 62% in 2013 to 72% in 2021. This indicates that although the gap between developed and underdeveloped regions in terms of green technology application and carbon reduction has narrowed, structural differences remain significant. The coastal eastern region, benefiting from the advantages gained since the reform and opening up, has significant advantages in the allocation of innovative resources, technological investment, and industrial structure transformation, not only consolidating higher education institutions and research agencies but also possessing more complete innovation conditions and capital markets [50]. In contrast, the central and western regions have long faced structural challenges, including a shortage of innovative elements, lower industrial levels, and limited financial support. Meanwhile, the intra-regional disparity component exhibits a continuous decline trend from 0.029 to 0.019, accounting for 20–23% of the total disparity, reflecting a continual strengthening of consistency within each region. Moreover, the hyper-variance density decreased from a maximum of 0.019 to 0.008, indicating that the extreme degree of differentiation in regional development has significantly weakened.
These empirical findings highlight critical characteristics of China’s regional green development. Although overall spatial disparities are converging, the relative importance of inter-regional differences continues to increase, underscoring persistent structural challenges in achieving regional coordination. In particular, the sustained rise in the share of inter-regional differences emphasizes the necessity of in-depth examination of regional heterogeneity. Therefore, future research should focus on the specific characteristics and interaction mechanisms of the eastern, central, western, and northeastern regions.
Table 4 presents the differential characteristics of coordinated development within the four major regions of China from 2013 to 2021. A systematic analysis of the Gini coefficients (G values) within subgroups of each region reveals significant intra-regional disparity characteristics and their evolutionary trends. The results indicate that the internal differences in the eastern region are the most pronounced, with an average G value of 0.104, which, although decreasing gradually from 0.118 in 2013 to 0.093 in 2021, remains significantly higher than in other regions. This persistently high level of disparity reflects significant structural imbalances in the coordinated development of green technology innovation and carbon reduction in the eastern region, which may stem from the heterogeneity in the technological diffusion capabilities and industrial transformation processes among provinces within the region, particularly the existing siphoning effect.
In contrast, the central and western regions exhibit a higher degree of intra-regional homogeneity, with average G values of 0.036 and 0.034, respectively. Notably, in the western region, the G value significantly decreased from 0.051 in 2013 to 0.023 in 2021, showing the most pronounced convergence trend. This sustained convergence of intra-regional disparities may be attributed to a series of collaborative innovation policies implemented in the western region under the national strategy for coordinated regional development. In contrast, the northeastern region exhibits unique evolutionary characteristics, with its G value dropping substantially from 0.095 in 2013 to 0.040 in 2021, yielding an average value of 0.056. This significant downward trend indicates that, despite facing pressures for industrial transformation, the intra-regional consistency in green and low-carbon development is gradually strengthening. The revitalization strategy for the northeast has shown certain effectiveness.
Further analysis reveals that Table 5 shows the differences in the coordinated development of RGTI, NQP, and CRCI among the subgroups of the four major regions of China from 2013 to 2021. Empirical results indicate that the differences between the eastern region and other regions are significantly greater than those among other regional combinations; in particular, the average difference value between the eastern and northeastern regions reached 0.156, exhibiting the most significant regional differentiation characteristics. Specifically, the eastern–northeastern difference decreased gradually from 0.183 in 2013 to 0.149 in 2021. Although this shows a converging trend, it remains at a relatively high level. This persistent high level of disparity reflects the significant advantages of the eastern region in terms of green technology innovation capabilities and industrial transformation efficiency.
In contrast, the northeastern region, as a traditional industrial base, faces significant challenges in the green transformation process and experiences a siphoning effect. The differences between the eastern–central and eastern–western regions also remain at high levels, with average values of 0.131 and 0.141, respectively. Notably, these two sets of differences exhibit distinct evolutionary characteristics over the study period: the eastern–central difference decreased from 0.141 to 0.130, while the eastern–western difference remained relatively stable, decreasing from 0.153 to 0.136. In contrast, the average difference values for the central–western, central–northeastern, and western–northeastern regions are significantly lower than those with the eastern region and exhibit a continuously converging trend. Notably, the difference between the central and western regions decreased from 0.058 in 2013 to 0.035 in 2021, indicating that these regions are trending toward heterogeneity in terms of green development levels. This may be related to the effectiveness of the recently implemented regional coordinated development strategy.

5. Discussion

As the effects of new productivity and green technology innovation on carbon reduction become increasingly evident [44,51], clarifying the interaction mechanism between new productivity, green technology innovation, and carbon reduction in the construction industry has become a key issue that needs to be addressed to promote high-quality development in China’s construction sector. This study used panel data from 30 provinces of China from 2013 to 2021 to reveal and analyze the interactive relationships among the three factors and their spatial-temporal evolution characteristics. The results show that during the study period, the development levels of RGIT, NQP, and CRCI exhibited a continuous upward trend. Moreover, the econometric model reveals a significant negative impact of RGIT on CEICI, and that NQP serves as a crucial mediating factor in this relationship. This indicates that regions can effectively suppress carbon emissions and enhance their carbon emission performance by developing green technology innovation and promoting the green technology innovation capacity of construction enterprises. Although green technology innovation has previously been shown to suppress carbon emissions at both the industry and regional levels [52,53], this study further extends the carbon reduction effects of green technology innovation to the construction industry. Previous research has also validated this viewpoint. For example, Li et al. (2023) found through panel data from 30 provinces in China between 2005 and 2020 that green innovation has a significant positive impact on carbon dioxide reduction in China’s construction industry and that environmental regulation plays a facilitating role in this process [24].
Furthermore, the coupled coordination degree model reveals that the overall level of coordinated development among the three has improved from a state of mild disorder at 0.373 in 2013 to a state of barely coordinated at 0.528. This indicates that as the levels of RGIT, NQP, and CRCI continuously rose during the study period, their coordinated development has also shown a continuous upward trend, reflecting a positive and beneficial interaction among the three. However, significant regional differences in the coordinated development among the three were also observed, particularly in the eastern region, where RGIT, NQP, and CRCI exhibit strong synergistic effects. For example, in economically developed coastal regions such as Beijing, Tianjin, Jiangsu, Zhejiang, and Guangdong, the coupling coordination degree values are all no lower than 0.600, indicating progress to the intermediate coordination stage. Nan et al. [54] also demonstrated this pattern through the spatial distribution of NQP in 271 prefecture-level cities in China. Similarly, Gao et al. [55] found a similar trend in their study of the dynamic evolution of new productivity and carbon total factor productivity in 30 provinces and municipalities in China. This phenomenon mainly arises from the comparative advantages of these regions in terms of economic level, technological accumulation, and resource aggregation. The eastern region, with its high level of new productivity, actively promotes the deep application of intelligent and digital technologies in the construction sector, which not only enhances resource allocation efficiency significantly but also accelerates the penetration of green technologies in the construction industry, thereby achieving significant carbon reduction effects. The underlying logic may be that the continuous improvement of new productivity not only provides a solid foundation for the widespread application of green technologies but also further stimulates the emission reduction potential of these technologies.
However, despite certain progress in RGIT, NQP, and CRCI in recent years, the effectiveness of carbon reduction in the construction industry in the central, western, and northeastern regions remains insufficient. These regions face numerous bottlenecks in the promotion and application of technology, particularly against the backdrop of relatively lagging levels of new productivity, making it difficult for the application effects of green technologies in the construction industry to be fully realized, thus failing to achieve the expected reduction targets. Especially in the central and western regions, insufficient funding and a lack of technological resources make it difficult for green technology innovation to achieve effective breakthroughs in the construction sector. This phenomenon indicates that the effectiveness of green transformation depends not only on the innovation of technologies itself but also requires strong support from the level of new productivity [56,57]. This is consistent with the kernel density estimation results, which indicate that the coupling coordination level in the eastern region is significantly better than in other regions, displaying clear spatial differentiation characteristics. This is further validated by the Dagum Gini coefficient analysis, which shows that the inter-regional differences constitute the primary source of national coupling coordination disparities. This phenomenon of regional developmental imbalance reflects that, under the dual drivers of green technology innovation and new productivity, while significant progress has been made in carbon reduction in the construction industry, the development gap between regions remains pronounced. This necessitates systemic policy interventions to address it. Therefore, the central and western regions, as well as the northeastern region, urgently need to accelerate the cultivation of new productivity from multiple dimensions, including infrastructure improvement and technical talent training, to provide a strong guarantee for carbon reduction driven by green technology innovation.

6. Conclusions

In the context of new productivity driving high-quality development across various industries in China, exploring the interactive mechanisms and synergistic effects between regional green technology innovation and carbon reduction in the construction industry is crucial for promoting the green, low-carbon transformation and sustainable development of the construction sector. This study is based on panel data from 30 provinces and municipalities in China from 2013 to 2021, and empirically analyzed the synergistic evolutionary relationship between regional green technology innovation and carbon reduction in the construction industry from the perspective of new productivity. Our results revealed the interactive relationships among the three, the spatial-temporal distribution dynamics, and their differentiated characteristics. The results show that RGTI not only directly promotes CRCI but also reduces carbon emissions intensity in the construction industry by enhancing NQP, thereby fostering carbon reduction in the construction sector and creating a “dual-driving effect”. Furthermore, the levels of coordinated development among RGTI, NQP, and CRCI are continuously improving, yet significant regional heterogeneities exist, with an overall decreasing trend from the eastern to central and western regions. Specifically, the eastern region leverages policy advantages, economic levels, structural adjustments in industry, and resource siphoning benefits to achieve a benign, coordinated interaction between green technology innovation and carbon reduction. In contrast, the central, western, and northeastern regions are constrained by their development stages and resource limitations, exhibiting regional phenomena of “carbon lock-in” and “polarization”. This imbalance in regional development further highlights the challenges faced in advancing new productivity in China, particularly in the process of promoting a green, low-carbon transition.
Based on this, under the impetus of new productivity, the green, low-carbon transformation of the construction industry requires the establishment of a more refined and inclusive regional collaborative development mechanism. Adaptive green technology innovation pathways can be designed based on the differentiated characteristics of different provinces, such as urbanization rates and industry maturity. For example, in the eastern region, which has a high urbanization rate and relatively mature industrial structure, it is essential to promote public–private partnerships and accelerate the deep application of green technologies throughout the entire lifecycle of construction through innovative local governance models. In contrast, for the central and western regions, emphasis should be placed on improving infrastructure development and the cultivation of green technology talent, gradually alleviating the structural imbalance in regional innovation capabilities through special fund support. At the same time, a cross-regional technology diffusion platform should be established to facilitate the orderly flow of innovation resources from the eastern region to other areas. Additionally, a precise carbon emissions monitoring and dynamic assessment system should be established. Through participation from multiple stakeholders and a regionally tailored innovation ecosystem, this approach can not only stimulate regional innovation vitality but also effectively break through the “carbon lock-in” dilemma, ultimately achieving a holistic breakthrough and high-quality development in the green, low-carbon transformation of the construction industry.
Finally, this study constructed, for the first time, a multi-dimensional interaction framework of new productivity, regional green technology innovation, and carbon reduction in the construction industry based on the concept of coupled synergy. By incorporating new productivity into the study of carbon reduction in the construction industry, we expanded and extended the boundaries of previous research in this field. Simultaneously, by innovatively combining various analytical methods to empirically analyze the interaction mechanisms among the three, the methodology of relevant research is enriched. This provides exemplary experiences and reference points for carbon reduction in the construction industries of many developing countries.
Although this study has made significant progress in theoretical construction and empirical analysis, some limitations remain: First, the analysis at the provincial level may obscure subtle differences within regions, and future research could shift to micro-level urban data to more accurately depict the heterogeneous characteristics within regions. Second, follow-up studies could incorporate spatial econometric models to further explore the cross-regional spillover effects of technological innovation and carbon reduction in different regions, enriching the breadth and depth of the research. These limitations also provide important directions and pathways for future research.

Author Contributions

Methodology, Z.N. and Q.X.; software, Z.N.; validation, Z.N.; formal analysis, Z.N.; resources, Q.X.; writing—original draft preparation, Z.N.; supervision, Q.X. All authors have read and agreed to the published version of the manuscript.

Funding

This research was supported by the Tibet Autonomous Region Key R&D Project (XZ202301ZY0002N).

Institutional Review Board Statement

Not applicable.

Informed Consent Statement

Not applicable.

Data Availability Statement

The data that support the findings of this study are available from the corresponding author upon reasonable request.

Acknowledgments

The authors thank the editor and anonymous reviewers for their numerous constructive comments and encouragement that have improved our paper greatly.

Conflicts of Interest

The authors declare no conflicts of interest.

References

  1. Ahmed Ali, K.; Ahmad, M.I.; Yusup, Y. Issues, impacts, and mitigations of carbon dioxide emissions in the building sector. Sustainability 2020, 12, 7427. [Google Scholar] [CrossRef]
  2. Onat, N.C.; Kucukvar, M. Carbon footprint of construction industry: A global review and supply chain analysis. Renew. Sustain. Energy Rev. 2020, 124, 109783. [Google Scholar] [CrossRef]
  3. Erdogan, S. Dynamic nexus between technological innovation and building sector carbon emissions in the BRICS countries. J. Environ. Manag. 2021, 293, 112780. [Google Scholar] [CrossRef] [PubMed]
  4. Lai, K.E.; Rahiman, N.A.; Othman, N.; Ali, K.N.; Lim, Y.W.; Moayedi, F.; Dzahir, M.A.M. Quantification process of carbon emissions in the construction industry. Energy Build. 2023, 289, 113025. [Google Scholar] [CrossRef]
  5. Li, D.; Huang, G.; Zhang, G.; Wang, J. Driving factors of total carbon emissions from the construction industry in Jiangsu Province, China. J. Clean. Prod. 2020, 276, 123179. [Google Scholar] [CrossRef]
  6. Chen, C.; Bi, L. Study on spatio-temporal changes and driving factors of carbon emissions at the building operation stage—A case study of China. Build. Environ. 2022, 219, 109147. [Google Scholar] [CrossRef]
  7. Liu, C.; Gao, X.; Ma, W.; Chen, X. Research on regional differences and influencing factors of green technology innovation efficiency of China’s high-tech industry. J. Comput. Appl. Math. 2020, 369, 112597. [Google Scholar] [CrossRef]
  8. Peng, B.; Zheng, C.; Wei, G.; Elahi, E. The cultivation mechanism of green technology innovation in manufacturing industry: From the perspective of ecological niche. J. Clean. Prod. 2020, 252, 119711. [Google Scholar] [CrossRef]
  9. Lin, S.; Chen, Z.; He, Z. Rapid transportation and green technology innovation in cities—From the view of the industrial collaborative agglomeration. Appl. Sci. 2021, 11, 8110. [Google Scholar] [CrossRef]
  10. Zhang, R.; Tang, Y.; Zhang, Y.; Wang, Z. Collaborative relationship discovery in green building technology innovation: Evidence from patents in China’s construction industry. J. Clean. Prod. 2023, 391, 136041. [Google Scholar] [CrossRef]
  11. Sizirici, B.; Fseha, Y.; Cho, C.-S.; Yildiz, I.; Byon, Y.-J. A review of carbon footprint reduction in construction industry, from design to operation. Materials 2021, 14, 6094. [Google Scholar] [CrossRef]
  12. Fenner, A.E.; Kibert, C.J.; Woo, J.; Morque, S.; Razkenari, M.; Hakim, H.; Lu, X. The carbon footprint of buildings: A review of methodologies and applications. Renew. Sustain. Energy Rev. 2018, 94, 1142–1152. [Google Scholar] [CrossRef]
  13. Zhang, J.; Ouyang, Y.; Ballesteros-Pérez, P.; Li, H.; Philbin, S.P.; Li, Z.; Skitmore, M. Understanding the impact of environmental regulations on green technology innovation efficiency in the construction industry. Sustain. Cities Soc. 2021, 65, 102647. [Google Scholar] [CrossRef]
  14. Li, C.; Qi, L. Can Government Environmental Attention Improve Corporate Carbon Emission Reduction Performance?—Evidence from China A-Share Listed Companies with High-Energy-Consumption. Sustainability 2024, 16, 4660. [Google Scholar] [CrossRef]
  15. Xu, T.; Yang, G.; Chen, T. The role of green finance and digital inclusive finance in promoting economic sustainable development: A perspective from new quality productivity. J. Environ. Manag. 2024, 370, 122892. [Google Scholar] [CrossRef]
  16. Liu, Y.; He, Z. Synergistic Industrial Agglomeration, New Quality Productive Forces and High-quality Development of the Manufacturing Industry. Int. Rev. Econ. Financ. 2024, 94, 103373. [Google Scholar] [CrossRef]
  17. Miao, C.; Fang, D.; Sun, L.; Luo, Q. Natural resources utilization efficiency under the influence of green technological innovation. Resour. Conserv. Recycl. 2017, 126, 153–161. [Google Scholar] [CrossRef]
  18. Yuan, S.; Pan, X. Inherent mechanism of digital technology application empowered corporate green innovation: Based on resource allocation perspective. J. Environ. Manag. 2023, 345, 118841. [Google Scholar] [CrossRef]
  19. Xue, L.; Zhang, Q.; Zhang, X.; Li, C. Can digital transformation promote green technology innovation? Sustainability 2022, 14, 7497. [Google Scholar] [CrossRef]
  20. Dou, Q.; Gao, X. How does the digital transformation of corporates affect green technology innovation? An empirical study from the perspective of asymmetric effects and structural breakpoints. J. Clean. Prod. 2023, 428, 139245. [Google Scholar] [CrossRef]
  21. Xu, D.; Abbas, S.; Rafique, K.; Ali, N. The race to net-zero emissions: Can green technological innovation and environmental regulation be the potential pathway to net-zero emissions? Technol. Soc. 2023, 75, 102364. [Google Scholar] [CrossRef]
  22. Liu, L.; Wang, Z.; Xu, J.; Zhang, Z. Green baton: How government interventions advance green technological innovation. Environ. Dev. Sustain. 2023, 25, 11121–11152. [Google Scholar] [CrossRef]
  23. Wang, B.; Chen, H.; Ao, Y.; Liao, F. Spatiotemporal differentiation and influencing factors of green technology innovation efficiency in the construction industry: A case study of chengdu–chongqing urban agglomeration. Buildings 2023, 13, 73. [Google Scholar] [CrossRef]
  24. Li, X.; Qin, Q.; Yang, Y. The impact of green innovation on carbon emissions: Evidence from the construction sector in China. Energies 2023, 16, 4529. [Google Scholar] [CrossRef]
  25. Wang, M.; Li, Y.; Li, J.; Wang, Z. Green process innovation, green product innovation and its economic performance improvement paths: A survey and structural model. J. Environ. Manag. 2021, 297, 113282. [Google Scholar] [CrossRef]
  26. Jiao, J.; Chen, C.; Bai, Y. Is green technology vertical spillovers more significant in mitigating carbon intensity? Evidence from Chinese industries. J. Clean. Prod. 2020, 257, 120354. [Google Scholar] [CrossRef]
  27. Chen, W.; Ma, Y.; Bai, C. The Impact of Carbon Emission Quota Allocation Regulations on the Investment of Low-Carbon Technology in Electric Power Industry Under Peak-Valley Price Policy. IEEE Trans. Eng. Manag. 2021, 71, 374–391. [Google Scholar] [CrossRef]
  28. Guo, Y.; Luo, L.; Liu, T.; Hao, L.; Li, Y.; Liu, P.; Zhu, T. A review of low-carbon technologies and projects for the global cement industry. J. Environ. Sci. 2024, 136, 682–697. [Google Scholar] [CrossRef]
  29. Yao, H.; Xu, P.; Wang, Y.; Chen, R. Exploring the low-carbon transition pathway of China’s construction industry under carbon-neutral target: A socio-technical system transition theory perspective. J. Environ. Manag. 2023, 327, 116879. [Google Scholar] [CrossRef]
  30. Darko, A.; Chan, A.P.C.; Gyamfi, S.; Olanipekun, A.O.; He, B.-J.; Yu, Y. Driving forces for green building technologies adoption in the construction industry: Ghanaian perspective. Build. Environ. 2017, 125, 206–215. [Google Scholar] [CrossRef]
  31. Agan, B.; Balcilar, M. On the determinants of green technology diffusion: An empirical analysis of economic, social, political, and environmental factors. Sustainability 2022, 14, 2008. [Google Scholar] [CrossRef]
  32. Hu, S.; Li, S.; Meng, X.; Peng, Y.; Tang, W. Study on regional differences of carbon emission efficiency: Evidence from Chinese construction industry. Energies 2023, 16, 6882. [Google Scholar] [CrossRef]
  33. Zhang, J.; Shan, Y.; Jiang, S.; Xin, B.; Miao, Y.; Zhang, Y. Study on the coordinated development degree of new quality productivity and manufacturing carbon emission efficiency in provincial regions of China. Environ. Dev. Sustain. 2024, 1–35. [Google Scholar] [CrossRef]
  34. Zhou, W.; Xu, L. On new quality productivity: Connotative characteristics and important focus. Reform 2023, 10, 1–13. [Google Scholar]
  35. Hao, X.; Liang, Y.; Yang, C.; Wu, H.; Hao, Y. Can Industrial Digitalization Promote Regional Green Technology Innovation? J. Innov. Knowl. 2024, 9, 100463. [Google Scholar] [CrossRef]
  36. Li, W.; Sun, W.; Li, G.; Cui, P.; Wu, W.; Jin, B. Temporal and spatial heterogeneity of carbon intensity in China’s construction industry. Resour. Conserv. Recycl. 2017, 126, 162–173. [Google Scholar] [CrossRef]
  37. Cui, X.; Zhao, T.; Wang, J. Allocation of carbon emission quotas in China’s provincial power sector based on entropy method and ZSG-DEA. J. Clean. Prod. 2021, 284, 124683. [Google Scholar] [CrossRef]
  38. Song, Q.; Zhou, N.; Liu, T.; Siehr, S.A.; Qi, Y. Investigation of a “coupling model” of coordination between low-carbon development and urbanization in China. Energy Policy 2018, 121, 346–354. [Google Scholar] [CrossRef]
  39. Sun, Y.; Cui, Y. Evaluating the coordinated development of economic, social and environmental benefits of urban public transportation infrastructure: Case study of four Chinese autonomous municipalities. Transp. Policy 2018, 66, 116–126. [Google Scholar] [CrossRef]
  40. Liu, X.; Nie, W. Study on the coupling coordination mechanism of green technology innovation, environmental regulation, and green finance. Environ. Sci. Pollut. Res. 2022, 29, 71796–71809. [Google Scholar] [CrossRef]
  41. Tao, C.-Q.; Yi, M.-Y.; Wang, C.-S. Coupling coordination analysis and Spatiotemporal heterogeneity between data elements and green development in China. Econ. Anal. Policy 2023, 77, 1–15. [Google Scholar] [CrossRef]
  42. Wang, F.; Zhuang, L.; Cheng, S.; Zhang, Y.; Cheng, S. Spatiotemporal variation and convergence analysis of China’s regional energy security. Renew. Sustain. Energy Rev. 2024, 189, 113923. [Google Scholar] [CrossRef]
  43. Sun, Y.; Hao, S.; Long, X. A study on the measurement and influencing factors of carbon emissions in China’s construction sector. Build. Environ. 2023, 229, 109912. [Google Scholar] [CrossRef]
  44. Wang, S.; Chen, F. Can New Quality Productivity Promote the Carbon Emission Performance—Empirical Evidence from China. Sustainability 2025, 17, 567. [Google Scholar] [CrossRef]
  45. Lu, X.; Lu, Z. How does green technology innovation affect urban carbon emissions? Evidence from Chinese cities. Energy Build. 2024, 325, 115025. [Google Scholar] [CrossRef]
  46. Shao, Y.; Chen, Z. Can government subsidies promote the green technology innovation transformation? Evidence from Chinese listed companies. Econ. Anal. Policy 2022, 74, 716–727. [Google Scholar] [CrossRef]
  47. Wang, Q.; Ren, S. Evaluation of green technology innovation efficiency in a regional context: A dynamic network slacks-based measuring approach. Technol. Forecast. Soc. Change 2022, 182, 121836. [Google Scholar] [CrossRef]
  48. Chen, H.; Yi, J.; Chen, A.; Peng, D.; Yang, J. Green technology innovation and CO2 emission in China: Evidence from a spatial-temporal analysis and a nonlinear spatial durbin model. Energy Policy 2023, 172, 113338. [Google Scholar] [CrossRef]
  49. Si, R.; Wang, Y.; Cao, M.; Wen, H. Does green technology innovation promote green economic growth?–Examining regional heterogeneity between resource-based and non-resource-based cities. Int. Rev. Econ. Financ. 2024, 94, 103406. [Google Scholar] [CrossRef]
  50. Grashof, N.; Basilico, S. Divergent paths for green transition: Regional disparities in technology diversification. Reg. Stud. 2025, 59, 2363327. [Google Scholar] [CrossRef]
  51. Cai, A.; Zheng, S.; Cai, L.; Yang, H.; Comite, U. How does green technology innovation affect carbon emissions? A spatial econometric analysis of China’s provincial panel data. Front. Environ. Sci. 2021, 9, 813811. [Google Scholar] [CrossRef]
  52. Guo, L.; Tan, W.; Xu, Y.; Tang, Q. Curbing regional carbon emissions through green technology innovation: An empirical analysis in China. Environ. Dev. Sustain. 2024, 1–24. [Google Scholar] [CrossRef]
  53. Du, K.; Li, P.; Yan, Z. Do green technology innovations contribute to carbon dioxide emission reduction? Empirical evidence from patent data. Technol. Forecast. Soc. Change 2019, 146, 297–303. [Google Scholar] [CrossRef]
  54. Feng, N.; Yan, M.; Yan, M. Spatiotemporal Evolution and Influencing Factors of New-Quality Productivity. Sustainability 2024, 16, 10852. [Google Scholar] [CrossRef]
  55. Gao, X.; Li, S. A Dynamic Evolution and Spatiotemporal Convergence Analysis of the Coordinated Development Between New Quality Productive Forces and China’s Carbon Total Factor Productivity. Sustainability 2025, 17, 3137. [Google Scholar] [CrossRef]
  56. Zhang, X.; He, S.; Shen, J. The Impact of New Quality Productivity on Carbon Emission Intensity: Evidence from China. Front. Earth Sci. 2025, 13, 1546703. [Google Scholar]
  57. Li, J.; Noorliza, K.; Zhang, X. Enhancing environmental, social, and governance performance through new quality productivity and green innovation. Sustainability 2024, 16, 4843. [Google Scholar] [CrossRef]
Figure 1. Research framework.
Applsci 15 04720 g001
Figure 2. Comprehensive development levels of GTI, NQP, and CRCI across 30 provinces.
Applsci 15 04720 g002
Figure 3. Heat map of RGTI, NQP, and CRCI coupling coordination degrees (D values).
Applsci 15 04720 g003
Figure 4. Radar plot of RGTI, NQP, and CRCI coupling harmonization (D values).
Applsci 15 04720 g004
Figure 5. The 3D and 2D kernel density estimation plots for RGTI, NQP, and CRCI coupling coordination.
Applsci 15 04720 g005
Figure 6. Distribution of differential contributions of four major areas based on Dagum Gini coefficient data.
Applsci 15 04720 g006
Table 1. Classification standards and categories for coupling coordination degree.
Coordination TypeD-Value RangeCoordination Level
Coordinated Development[0.9, 1]High-quality coordination
[0.8, 0.9)Good coordination
[0.7, 0.8)Intermediate coordination
Transitional Development[0.6, 0.7)Primary coordination
[0.5, 0.6)Barely coordinated
[0.4, 0.5)On the verge of imbalance
Imbalanced Decline[0.3, 0.4)Slight imbalance
[0.2, 0.3)Moderate imbalance
[0.1, 0.2)Severe imbalance
[0, 0.1)Extreme imbalance
Table 2. Regression results.
Variables(1)(2)(3)(4)(5)(6)
CEICICEICICEICICEICICEICINQP
RGTI−0.478 *** −0.813 *** −0.759 ***0.250 ***
(0.171) (0.212) (0.240)(0.032)
NQP −0.876 *** −0.860 **−0.215
(0.325) (0.400)(0.442)
ES 0.2280.2330.2310.012
(0.157)(0.160)(0.157)(0.024)
DGI −1.287 **−0.771−1.256 **0.147 *
(0.566)(0.561)(0.571)(0.086)
IS 0.127 **0.0370.117 *−0.048 ***
(0.060)(0.059)(0.063)(0.009)
R&D −9.151−12.425 **−9.281−0.607
(5.695)(5.737)(5.711)(0.861)
LO −0.773 **−0.484−0.815 **−0.196 ***
(0.311)(0.312)(0.323)(0.047)
LRE −0.311 **−0.209−0.297 **0.064 ***
(0.146)(0.149)(0.149)(0.022)
Time FEYesYesYesYesYesYes
Id FEYesYesYesYesYesYes
N270270270270270270
Adj R20.7850.7840.8340.7940.8010.950
Note: Standard errors in parentheses; *, **, and *** represent significance at the 10%, 5%, and 1% levels, respectively. Control variables include energy structure (ES), degree of government intervention (DGI), industrial structure (IS), research and development investment (R&D), level of openness (LO), and regional economic level (LRE).
Table 3. Results of the overall Gini coefficient and the contribution of its components.
YearOverall Variance GIntra-Regional VarianceInter-Regional VarianceHypervariance Density
20130.127 0.029 0.078 0.019
20140.113 0.026 0.071 0.016
20150.108 0.024 0.068 0.016
20160.105 0.023 0.069 0.014
20170.099 0.022 0.066 0.011
20180.095 0.020 0.065 0.009
20190.091 0.019 0.066 0.006
20200.093 0.018 0.068 0.007
20210.094 0.019 0.068 0.008
Average0.103 0.022 0.069 0.012
Note: G represents the Dagum Gini coefficient, Gintra denotes the intra-group difference, Gnb signifies the inter-group difference, and Ghyper refers to hyperdensity.
Table 4. Analysis of differences within subgroups by region.
YearEastern RegionCentral Region Western RegionNortheastern Region
20130.118 0.047 0.051 0.095
20140.115 0.037 0.046 0.073
20150.109 0.030 0.050 0.063
20160.104 0.049 0.028 0.061
20170.106 0.040 0.029 0.051
20180.102 0.038 0.031 0.042
20190.095 0.021 0.025 0.042
20200.092 0.028 0.024 0.040
20210.093 0.038 0.023 0.040
Average0.104 0.036 0.034 0.056
Note: Eastern Region represents the eastern region; Central Region refers to the central region; Western Region denotes the western region; and Northeastern Region signifies the northeastern region.
Table 5. Differential contributions between subgroups in each region.
YearE–CE–WE–ENC–WC–ENW–EN
20130.141 0.153 0.183 0.058 0.089 0.083
20140.138 0.142 0.165 0.048 0.068 0.066
20150.136 0.141 0.159 0.045 0.060 0.063
20160.134 0.139 0.157 0.042 0.064 0.054
20170.125 0.139 0.149 0.043 0.054 0.045
20180.124 0.139 0.145 0.043 0.047 0.039
20190.120 0.134 0.146 0.030 0.044 0.038
20200.127 0.142 0.148 0.033 0.042 0.037
20210.130 0.136 0.149 0.035 0.045 0.037
Average0.131 0.141 0.156 0.042 0.057 0.051
Note: E represents the Eastern Region, C represents the Central Region, W represents the Western Region, and EN represents the Northeastern Region. E–C represents the relationship between the Eastern Region and the Central Region; E–W denotes the relationship between the Eastern Region and the Western Region; E–EN signifies the relationship between the Eastern Region and the Northeastern Region; C–W refers to the relationship between the Central Region and the Western Region; C–EN represents the relationship between the Central Region and the Northeastern Region; and W–EN indicates the relationship between the Western Region and the Northeastern Region.
Disclaimer/Publisher’s Note: The statements, opinions and data contained in all publications are solely those of the individual author(s) and contributor(s) and not of MDPI and/or the editor(s). MDPI and/or the editor(s) disclaim responsibility for any injury to people or property resulting from any ideas, methods, instructions or products referred to in the content.

