Article

Study on the Bearing Characteristics of Composite Foundations with Permeable Concrete Piles

School of Civil Engineering and Architecture, Wuhan Institute of Technology, Wuhan 430074, China
*
Author to whom correspondence should be addressed.
Appl. Sci. 2025, 15(9), 4835; https://doi.org/10.3390/app15094835 (registering DOI)
Submission received: 28 March 2025 / Revised: 24 April 2025 / Accepted: 25 April 2025 / Published: 27 April 2025

Abstract

:
Permeable concrete piles, which combine the advantages of rigid piles and drainage consolidation techniques, have been widely applied in soil foundation treatment. In this study, the optimal mix proportion of the permeable concrete pile material was first determined through laboratory experiments; subsequently, based on the experimental results, numerical simulations were employed to investigate the load-bearing characteristics of composite foundations reinforced with permeable concrete piles under applied loads. The experimental results indicate that when the designed porosity is set between 20% and 35%, and the water-to-cement ratio is 0.3, the actual porosity closely approximates the design value, achieving a favorable balance between compressive strength and permeability. Numerical simulation results reveal that as the axial force in the permeable concrete piles attenuates with depth, the side friction of piles exhibits an overall increasing trend. Compared with impermeable piles, the pile–soil stress ratio and the load-sharing ratio of permeable piles gradually decrease under high loads; furthermore, the settlement and pile–soil stress ratio of the composite foundation is significantly influenced by factors such as pile length, pile diameter, cushion modulus, inter-pile soil modulus, and the modulus of the pile material.

1. Introduction

In coastal regions, foundations predominantly comprise soft soils characterized by high water content, high compressibility, poor permeability, and low shear strength. These properties make them susceptible to settlement and deformation during natural disasters [1]. Constructing directly on such foundations can lead to reduced structural bearing capacity and uneven settlement [2]. Composite foundation and drainage consolidation methods are widely used for soft foundation treatment. The composite foundation method involves installing vertical reinforcement elements with high strength to share the upper load, offering the advantage of shorter construction periods [3]. In contrast, the drainage consolidation method establishes drainage channels to accelerate excess pore water pressure dissipation, promoting the consolidation of soft soil foundations. This method is cost-effective but requires a period of extended construction [4].
The bearing mechanism of composite foundations is complex, involving cushion load transfer and pile–soil interaction. The research is mainly carried out through theoretical derivation, numerical simulation, and experimental analysis. Uba [5] proposed and verified the calculation method for settling the cement fly-ash gravel (CFG) pile composite foundation. Wu [6] found that the vertical stress of the pile varies with depth. Fu [7] found that the pile side friction resistance increases with the load. He [8] discussed the cushion mechanism of the CFG pile composite foundation in detail through research. They deduced the optimal space between piles, cushion thickness, pile–soil stress ratio, and actual replacement ratio used to guide the design of CFG pile composite foundations. Zhang [9] obtained the influence law of the thickness of the cushion layer. Its compression modulus on the pile–soil stress ratio and settlement through finite element analysis and the research results provide a theoretical basis for the appropriate selection of the cushion layer thickness and its materials, which is conducive to the optimized design of composite foundations.
Pervious concrete is porous concrete composed of cement, coarse aggregate, or a small amount of fine aggregate, water, and admixtures in specific proportions, providing permeability and air permeability functions. Due to its high porosity and high permeability, permeable concrete is often considered an alternative to traditional hard impermeable pavement, which can control rainwater economically and in an environmentally friendly manner [10]. Currently, pervious concrete is widely used in roads, sidewalks, parking lots, and low-traffic buildings. It is also an environmentally friendly concrete material. The aggregate type, particle size, pore size connection, and pore size of permeable concrete significantly impact the strength and permeability of permeable concrete [11]. The performance of permeable concrete can be improved by optimizing the mix ratio, using additives, and improving the preparation process [12]. For example, permeable concrete made of cyclone aggregate and recycled aggregate has high compressive strength and permeability, respectively [13]. Adding mineral admixtures such as ore powder, fly ash, and silica fume can optimize the interface transition zone of permeable concrete and improve the comprehensive performance of permeable concrete [14]. It is concluded that the main difference between permeable concrete pile composite foundations and traditional piles is soil consolidation around the pile, and its bearing characteristics need to be further studied.
This study aims to analyze the bearing characteristics of pervious concrete piles in composite foundations through laboratory experiments and numerical simulations. Initially, the research examines the variations in compressive strength, permeability coefficient, and porosity of pervious concrete, investigating the effects of different water–cement ratios and designed porosities on its stability and permeability to determine the optimal mix proportion. Subsequently, numerical simulations using Flac3D 6.0 are conducted to explore the bearing characteristics of previous concrete piles in composite foundations. By comparing with traditional impervious piles, the study assesses the advantages and potential of pervious concrete piles in practical engineering applications, providing the scientific basis and technical support for infrastructure development in coastal areas.

2. The Best Mix Ratio Design of Permeable Concrete Piles

2.1. Experiment Method

This section focuses on designing tests for the previous concrete’s compressive strength and permeability. The aim is to investigate how different water-to-cement ratios and porosities affect previous concrete samples’ compressive strength and permeability coefficient.

2.1.1. Experiment Material

In composite foundations, pervious concrete piles are primarily used for drainage consolidation and secondarily for load bearing. Therefore, this experiment selects coarse aggregates with smaller particle sizes and designs higher porosity to achieve good permeability and strength. The aggregates are crushed stones with particle sizes ranging from 4.75 to 9.5 mm, supplied by Wuhan Zhongjian Ready-Mixed Concrete Co., Ltd. in Wuhan, China. The “Standard for Quality and Testing Methods of Sand and Stone for Ordinary Concrete” (JGJ 52-2006) [15] aggregate was tested to obtain its basic physical parameters. The results are presented in Table 1. The cement used is PO42.5 Portland cement with a 28-day compressive strength of 47 MPa and a density of 3145 kg/m3, with a standard water–cement ratio of 26.45%. The water-reducing agent is a polycarboxylate-based admixture, incorporated at 0.9% by mass of cement, which significantly enhances the workability of the concrete. The mixing water is municipal tap water.

2.1.2. Experiment Design
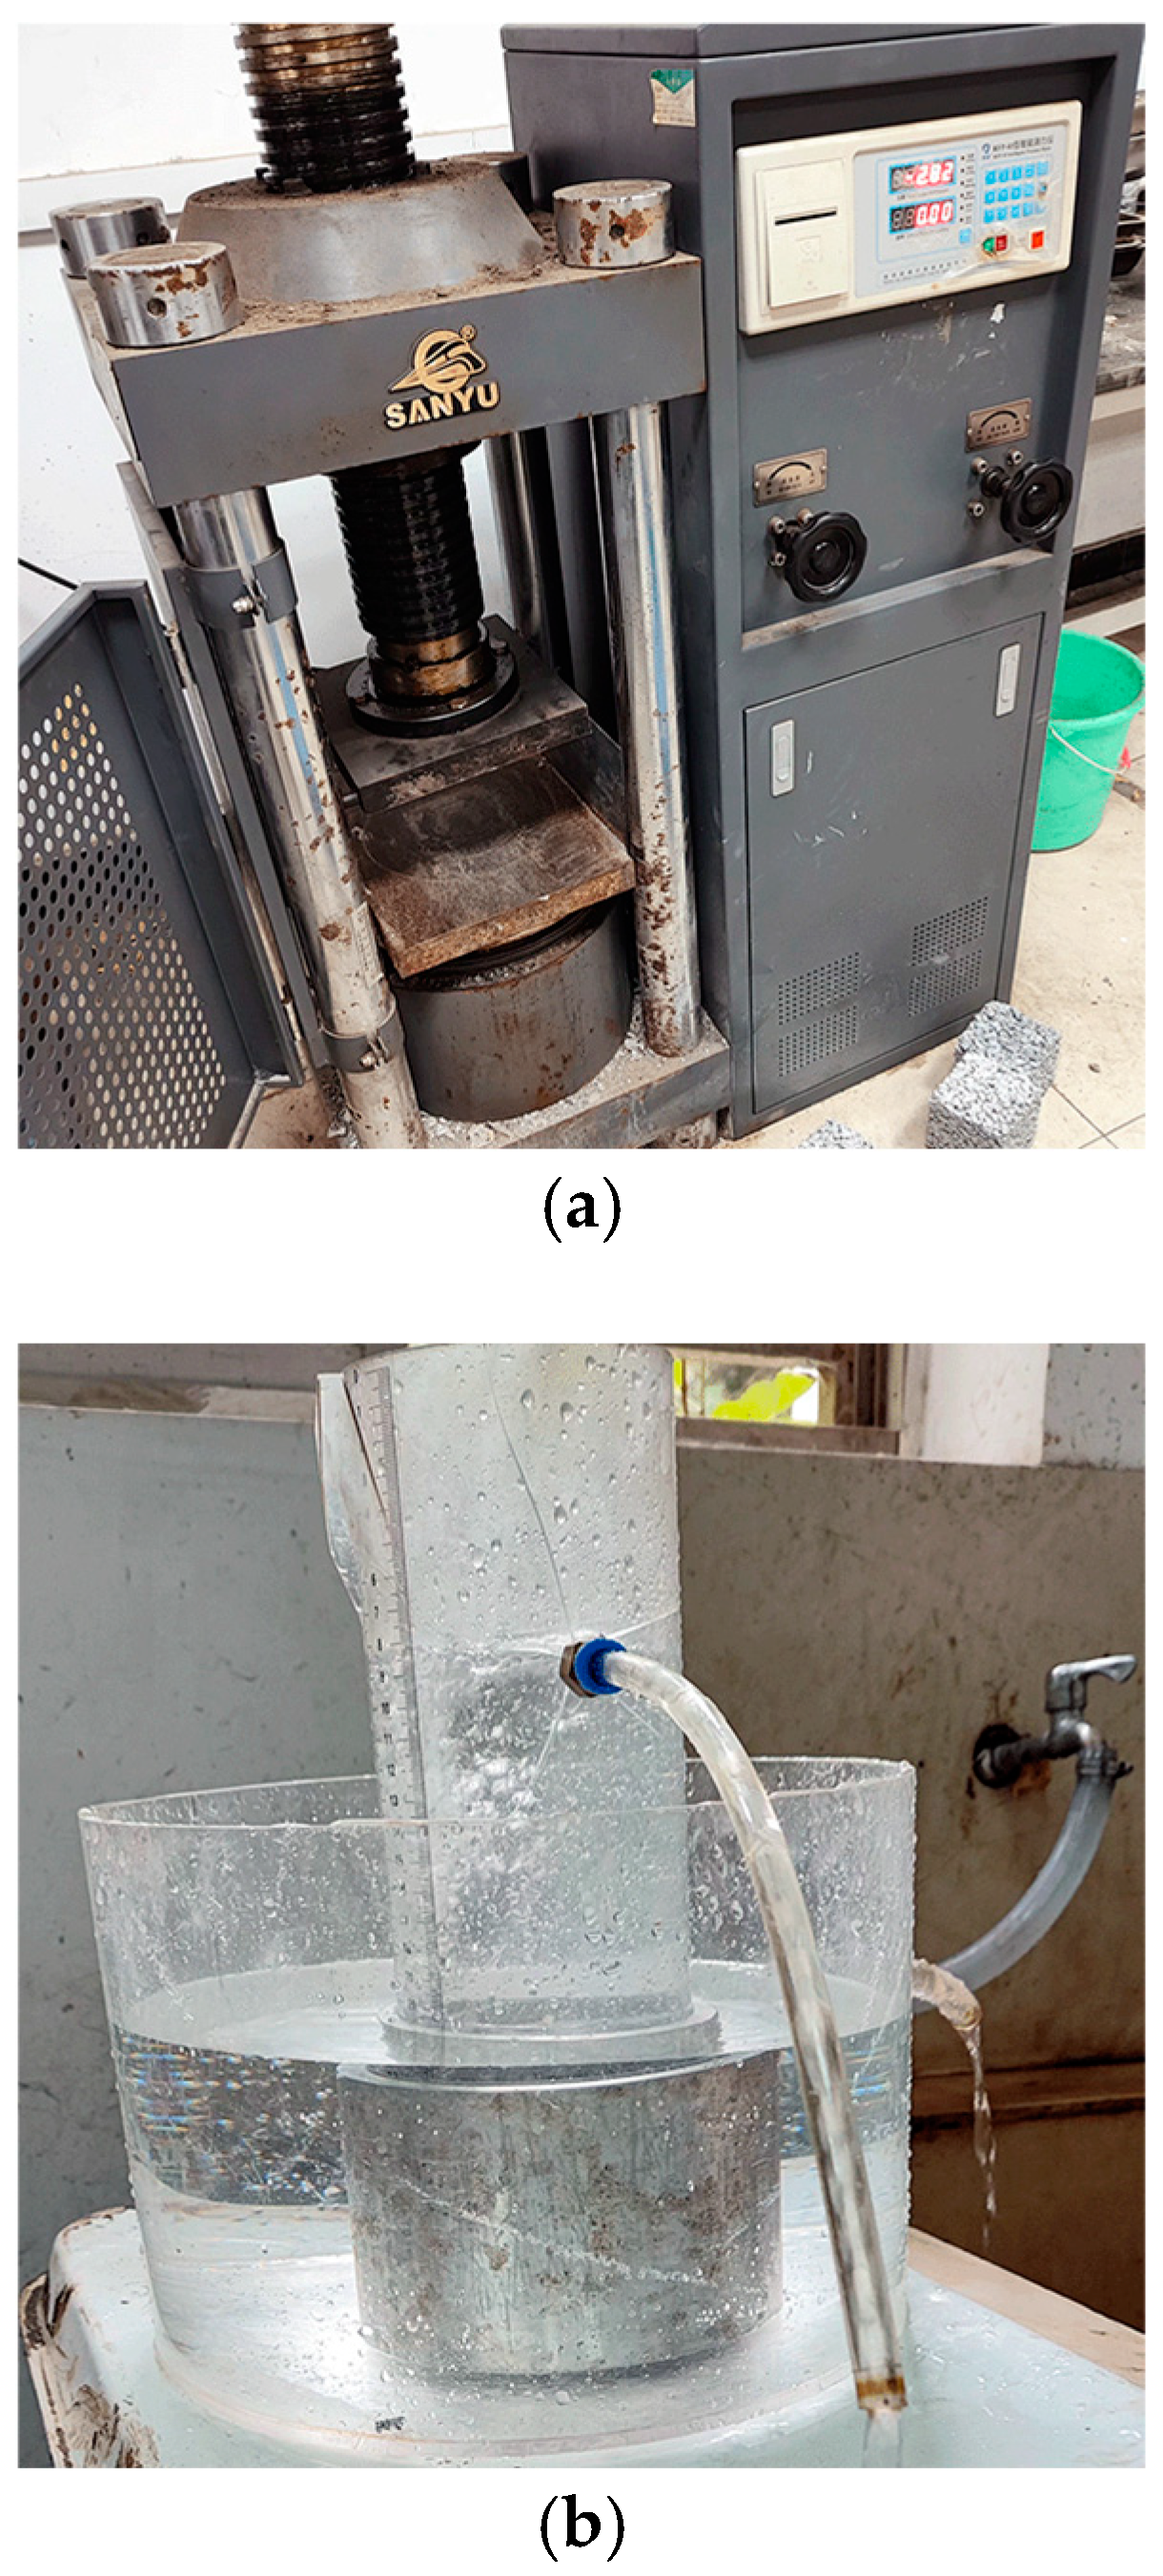
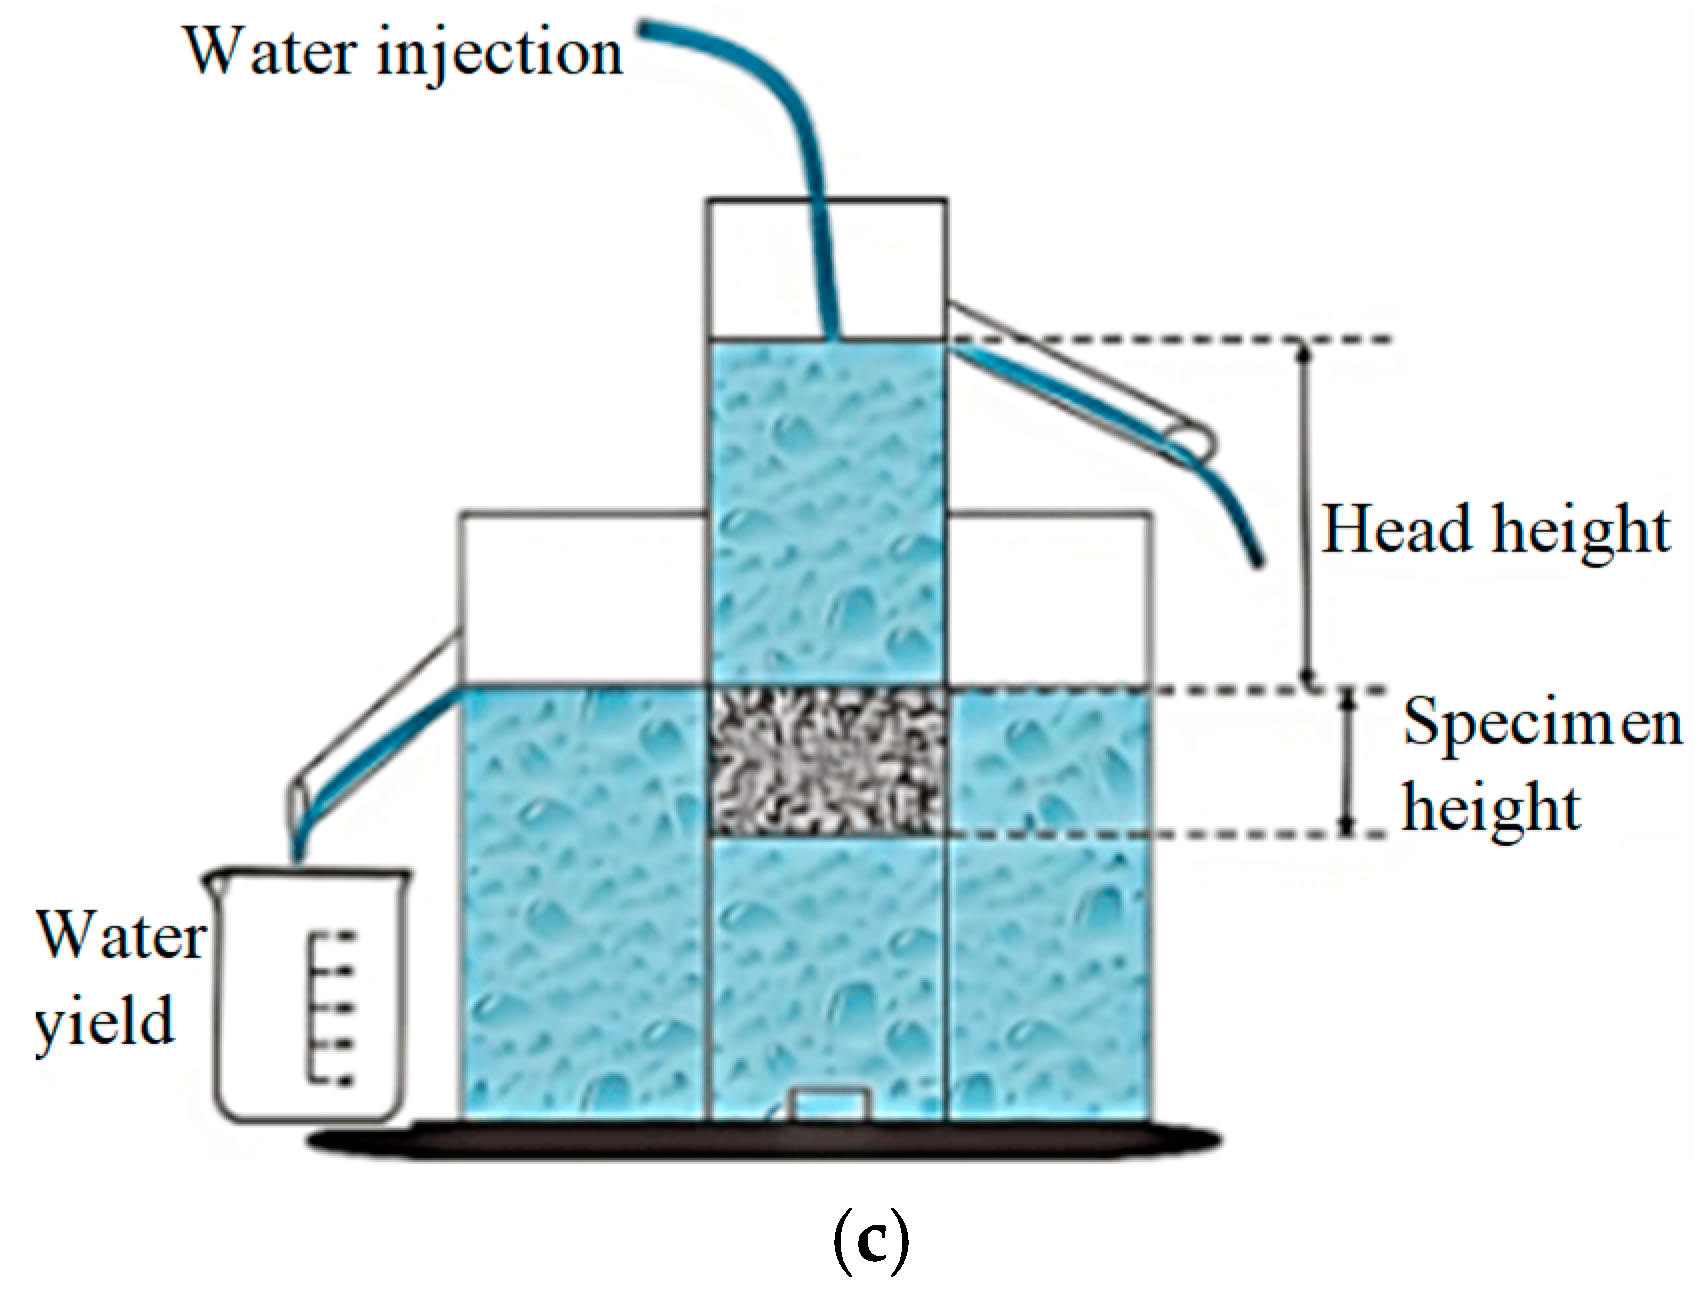
When designing the mix ratio for pervious concrete piles, it is essential to balance mechanical strength and permeability to meet the dual functions of drainage consolidation and load bearing in composite foundations. The key parameters for the pile material mix design are as follows:
(1) Design Porosity: Porosity directly affects the drainage performance of pervious concrete piles. According to the “Technical Code for Pervious Concrete Pavements” (CJJ/T 135-2009) [16], the porosity should be greater than 10%. Therefore, this study sets design porosities of 20%, 25%, 30%, and 35% to balance permeability and strength.
(2) Water-to-Cement Ratio (w/c): The w/c ratio is crucial for the strength and permeability of pervious concrete. The workability of the cement paste directly influences the overall performance of the concrete. Unlike conventional concrete, the workability of pervious concrete is primarily assessed by observing the coverage of the cement paste between aggregates. To prevent paste segregation, this study selects w/c ratios of 0.25, 0.3, and 0.35 for experimentation. This investigation focuses on exploring the changes in the water–cement ratio and does not consider the influence of the cement–aggregate ratio on the strength of permeable concrete. At the same time, the aggregate dosage amount of each set of test blocks during the test was set to a fixed dosage amount.
The mix ratio calculations are based on the formulas provided in the “Technical Code for Pervious Concrete Pavements” (CJJ/T 135-2009) [16] to ensure the optimization of material properties.

2.1.3. Test Method

In this experiment, the compressive strength, porosity, and permeability coefficient of pervious concrete were primarily measured. The specific measurement methods are as follows.
(1) Compressive Strength
According to the “Standards for Testing Methods for Physical Mechanical Properties of Concrete” (GB/T 50081-2019) [17], the test specimen was dried in an oven at 45 °C for 24 h, and then the compressive strength test was performed. The size of the specimen is 100 mm × 100 mm × 100 mm. The final compressive strength is the average of the three samples.
(2) Porosity
Pervious concrete contains both connected and closed pores. Based on Archimedes’ principle [18], specimens were immersed in water for 24 h, and their submerged mass (M1) was recorded. After drying, the dry mass (M2) was recorded [10]. The porosity was calculated using the following formula:
Porosity ( % ) = ( 1 M 2 M 1 ) × 100
(3) Permeability Coefficient
According to the “Technical Code for Pervious Cement Concrete Pavements” (CJJ/T 135-2009) [16], specimens with dimensions of φ100 mm × H50 mm were used (φ is the diameter of the sample; H is the height of the sample). Before testing, the specimens were immersed for 24 h, and their sides were sealed with paraffin wax. After fixing the specimens, water was added, and once the flow stabilized, the volume of water passing through in 5 min was recorded to calculate the permeability coefficient. The experimental setup is shown in Figure 1. Figure 1a is a diagram of the unlimited compressive strength test device through which the sample’s compressive strength can be measured. Figure 1b is a water permeability test device that can measure the permeability coefficient of a concrete sample, and Figure 1c is a schematic diagram of the principle of the permeability test.

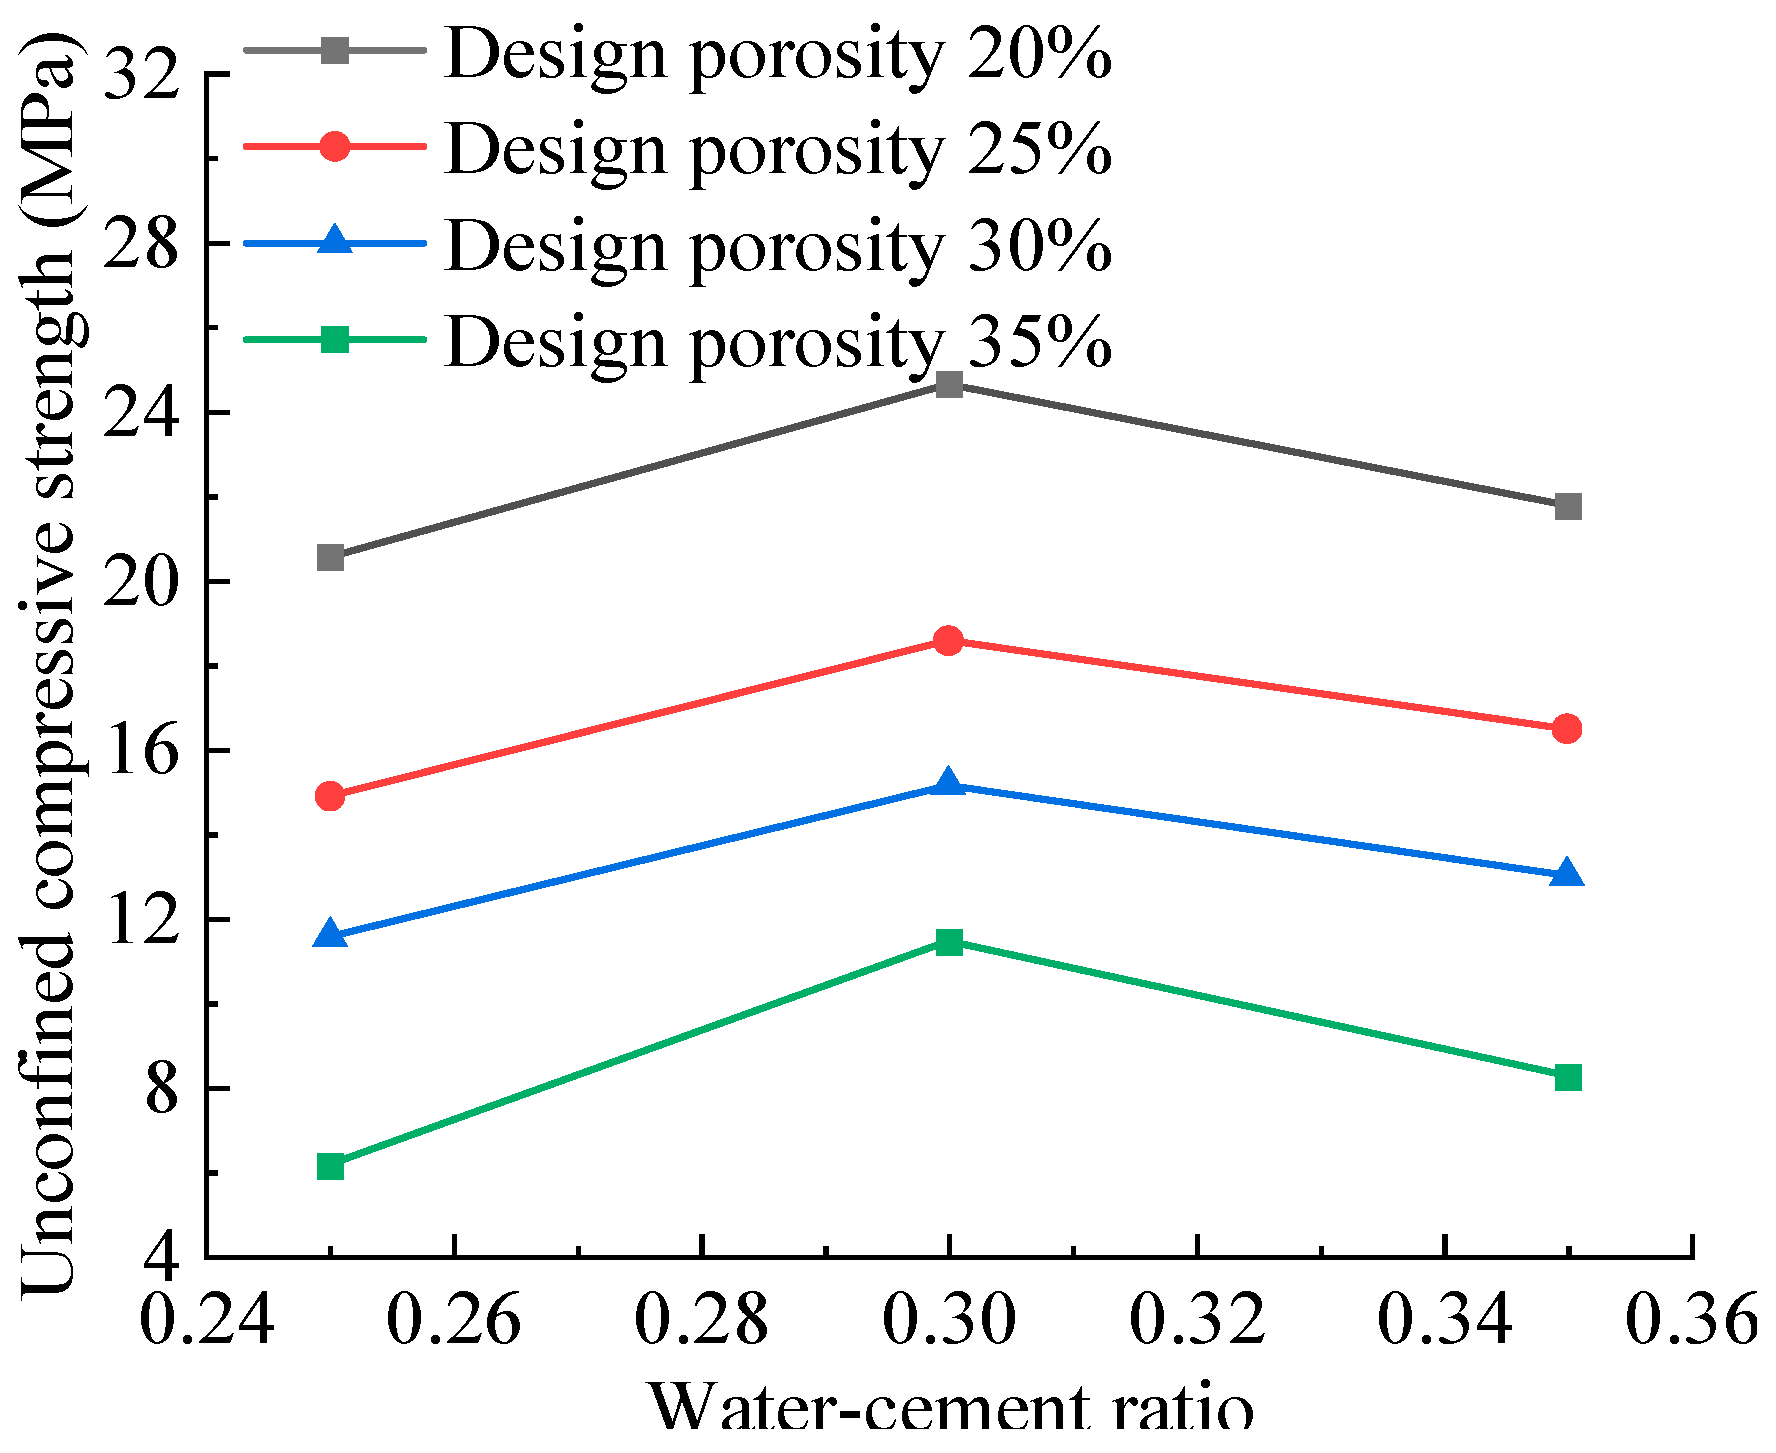
2.2. Experiment Results

Figure 2 shows the relationship between the designed and actual porosities. The results indicate that the actual porosity closely matches the designed porosity under various water-to-cement ratios. Therefore, this study justifies using the designed porosity to investigate the relationship between strength and porosity.
Figure 3 illustrates how compressive strength varies with the water-to-cement ratio under four designed porosities (20%, 25%, 30%, and 35%). The findings reveal that higher designed porosity leads to lower compressive strength. This is attributed to the increased voids within the material, which compromise the structural continuity and load-bearing capacity. As the water-to-cement ratio increases, the compressive strength initially rises and then declines. Moderate increases in the water-to-cement ratio enhance the flowability of the cement paste, facilitating better coverage of the aggregates and thus improving compressive strength. However, excessively high water-to-cement ratios can overly enhance the paste’s flowability, weakening the bond between the paste and aggregates, which may reduce compressive strength. At all designed porosities, a water-to-cement ratio of 0.3 yielded the highest compressive strength, indicating that this is the optimal ratio.
As shown in Figure 4, specimens with higher designed porosity exhibit greater permeability coefficients. This suggests that increased porosity introduces more pathways, facilitating the passage of water and air through the material. Under all designed porosity conditions, the permeability coefficient decreases as the water-to-cement ratio increases. This trend is likely due to the enhanced flowability of the cement paste at higher water-to-cement ratios, which, while improving aggregate coverage, may lead to the closure of micro-pores, thereby reducing permeability.

2.3. Determination of Optimal Mix Proportion

Building upon the previous experimental results, this study employs the effectiveness coefficient method for comprehensive analysis to determine the optimal water–cement ratio that balances compressive strength and permeability in pile materials [19,20]. The efficacy coefficient method is a comprehensive quantitative evaluation method for multi-objective decision-making. Its core idea is to quantify multiple evaluation indexes in the evaluation system to the same degree and determine their efficacy coefficient values. The indices are then weighted and summed to obtain a comprehensive indicator—the total efficacy coefficient. The method has the following characteristics: (1) Based on multi-objective programming principles, the method comprehensively assesses the performance of pile materials to select the optimal mix design. (2) By establishing a unified evaluation scale and scoring the actual measurements, the method considers differences among evaluation indicators while ensuring consistency and accuracy, effectively reducing evaluation errors and enhancing the scientific validity of the results.
This study first calculates the efficacy coefficients of compressive strength and permeability coefficient, and then comprehensively calculates the efficacy coefficients of compressive strength and permeability coefficient of the permeability concrete test block and obtains the total efficacy coefficient. Finally, the combination with the most significant total efficacy coefficient is taken as the optimal combination by analyzing the total efficacy coefficient [21]. The calculation method of the efficacy coefficient of a single influencing factor is shown in Equation (2), and the calculation method of the total efficacy coefficient is shown in Equation (3) [22].
d m n = C m n C max
D a = d a 1 × d a 2 × × d a t 1 × d a t t
where dmn represents the individual effectiveness coefficient for the n indicator in the m experimental group, Cmax denotes the maximum value of the n indicator corresponding to the experimental values, Cmn is the test value corresponding to the n index in the m group test, and Da refers to the total effectiveness coefficient of t evaluation indicators in the a experimental group.
Table 2 shows the calculation results of the efficacy coefficient of permeable concrete samples under different ratios. From the data analyzed in the table, we can see that the PC-7 combination has the best comprehensive performance; therefore, the PC-7 combination with the largest total efficacy coefficient is selected as the optimal mix ratio. The optimal mix design identified using the effectiveness coefficient method is detailed in Table 3.
Numerical simulation was carried out based on the optimal mix ratio obtained in the experiment, and the bearing characteristics of permeable concrete pile composite foundations were further explored. The research of Jun [23] shows that the model test of permeable concrete piles has a high degree of consistency with numerical simulation. For example, the simulation results of related parameters, such as the pile axial force and friction resistance of permeable piles, are the same as the test results, and the model test results are reliable. At the same time, the study also concluded that compared with impermeable piles, permeable piles could significantly accelerate the dissipation of superposed water pressure after the piles. In the load test, the consolidation time can be shortened, the lateral friction resistance can be increased, the peak of superposed water pressure can be reduced, and the characteristic value of bearing capacity can be improved. Therefore, the load-bearing characteristics of the permeable concrete piles were analyzed next.

3. Numerical Simulation of Composite Foundations with Permeable Concrete Piles

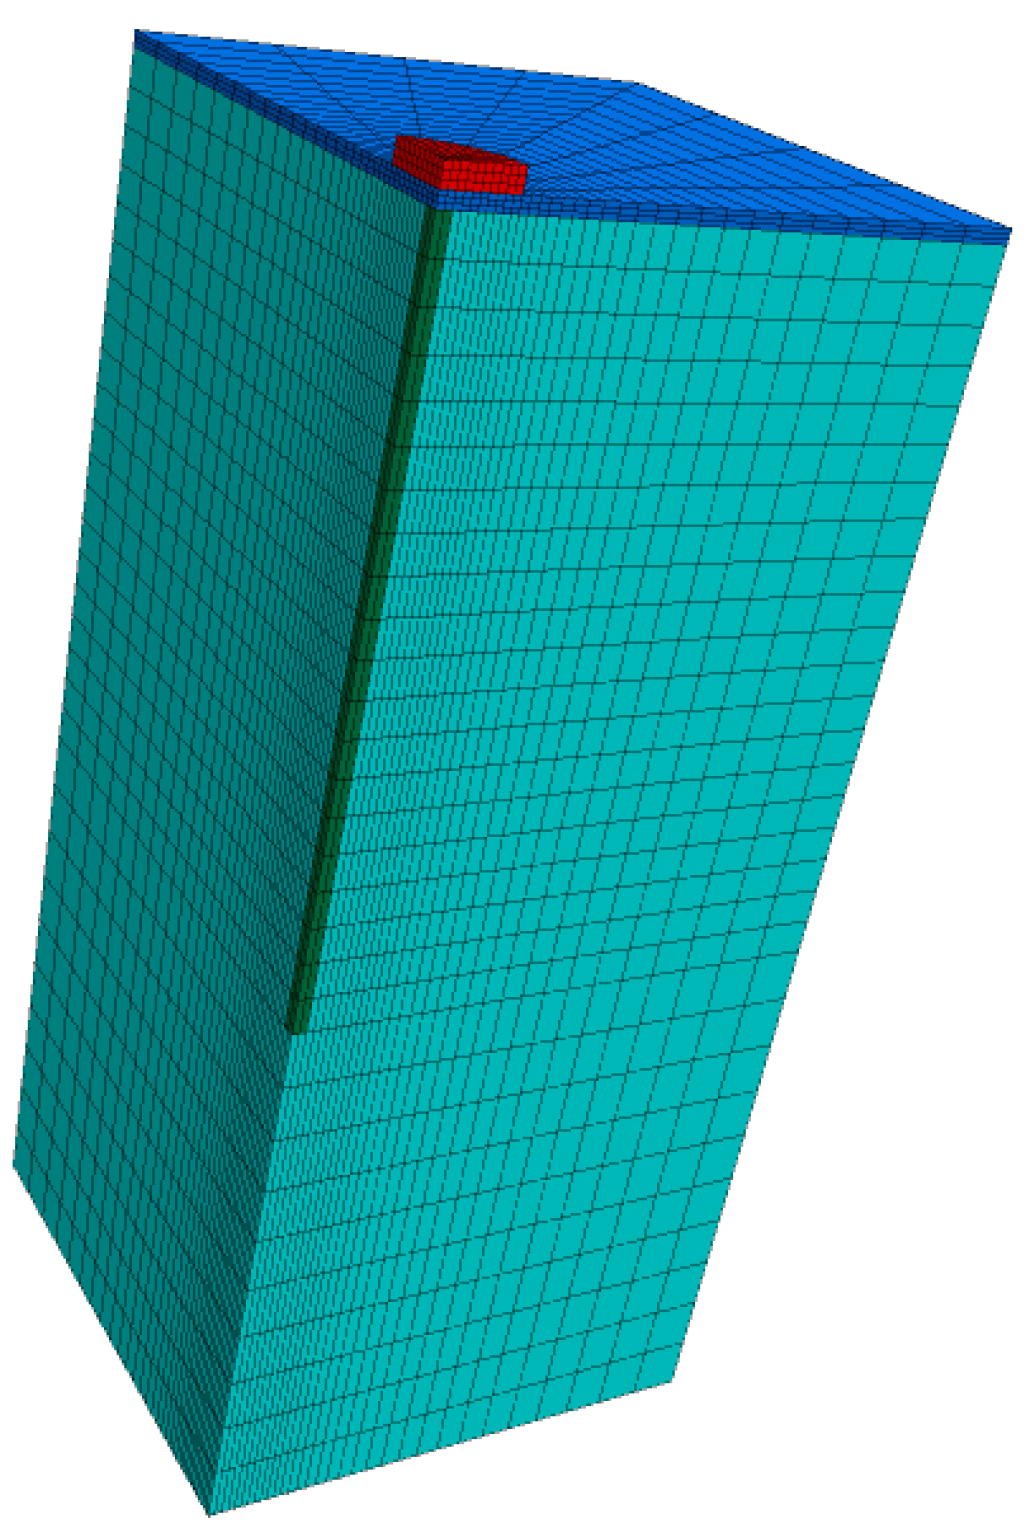
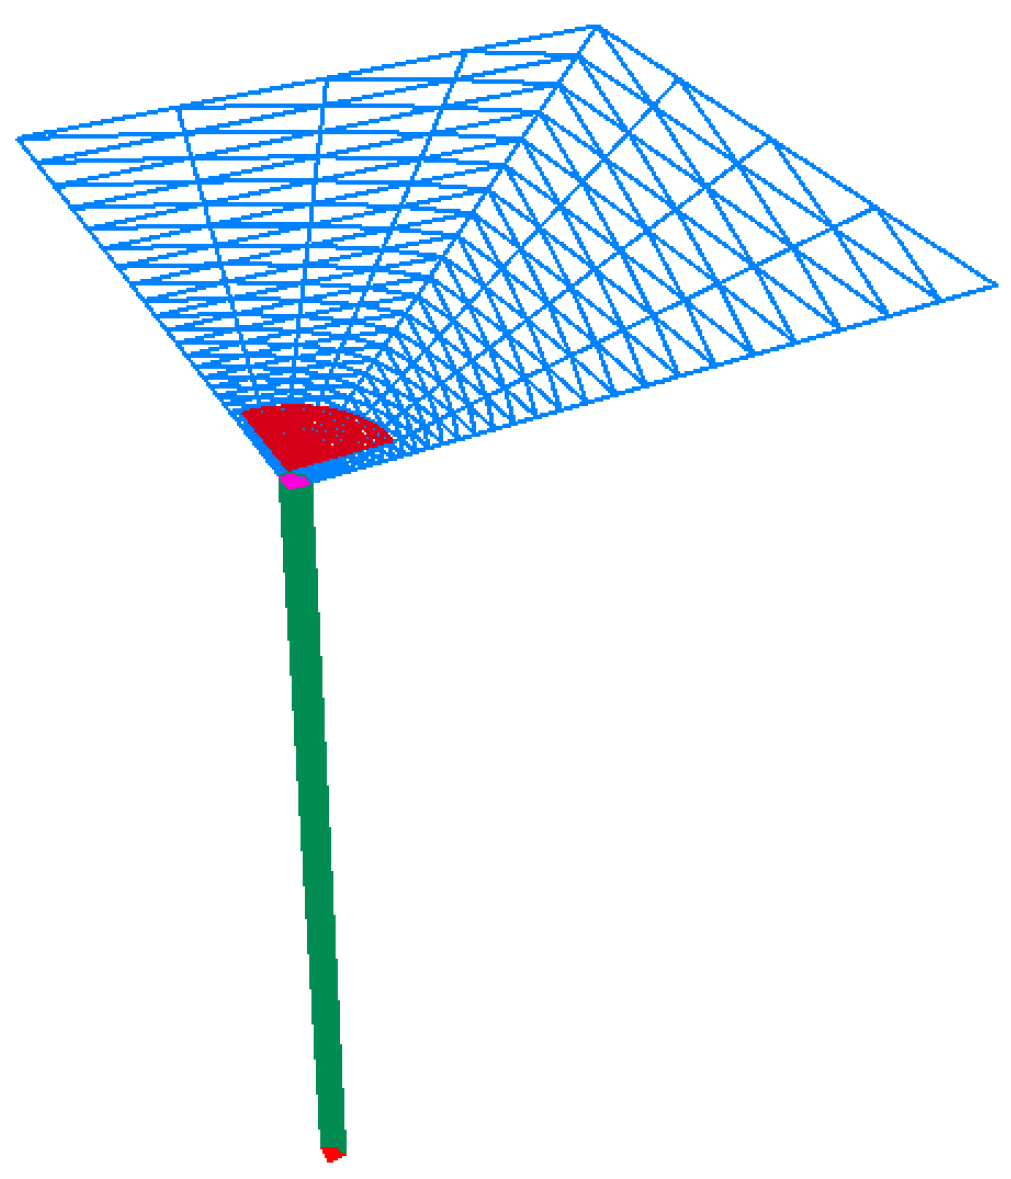
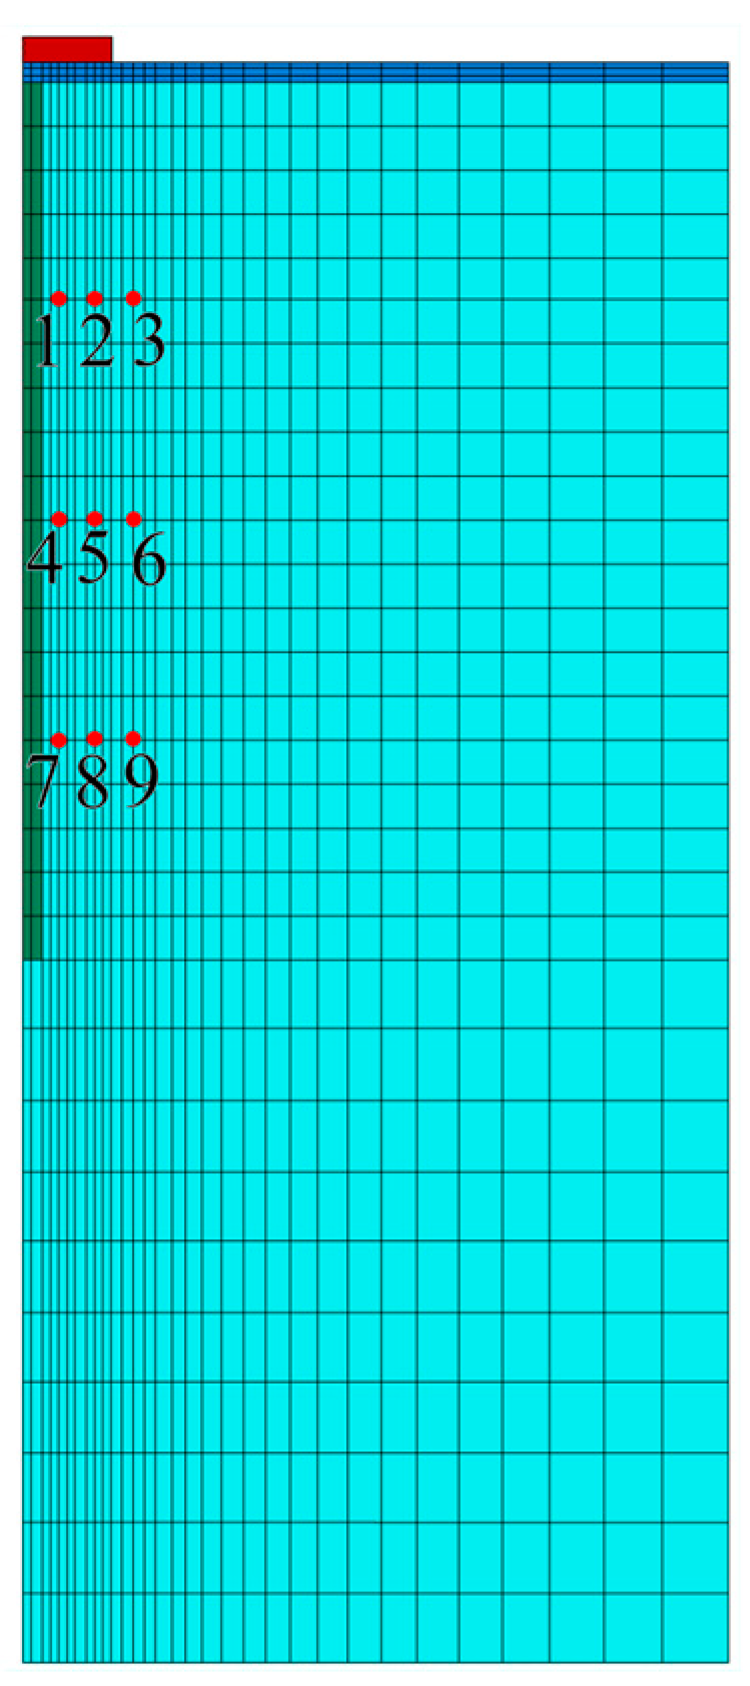
3.1. Model Establishment

To enhance the computational efficiency of numerical simulations and accelerate convergence, this study simplified the treatment of vertical loads in the axisymmetric model by employing a homogeneous soil assumption for calculations. A quarter-scale model was selected as the basic finite difference analysis model to ensure computational accuracy and effectively reduce boundary effects. The model dimensions are 8 m × 8 m × 18 m, with a pile length of 10 m, a pile diameter of 0.4 m, and a cushion thickness of 0.2 m. A cap with a radius of 1 m and a height of 0.3 m is placed above the cushion. The model dimensions were carefully selected to minimize the influence of boundary effects. The model is discretized into a mesh comprising 9512 nodes and 8386 finite element units. The cap is subjected to six levels of uniformly distributed loads, with each level being 50 kPa. Specific details are shown in Figure 5.
In the numerical model, the base is arranged on the cushion layer and is not directly connected to the pile. The cushion acts as an intermediary between the base and the pile and comes into contact with the surrounding soil. To more accurately reflect the behavior of construction projects and machines under soil conditions, connections between all adjacent components are defined to allow movement and separation, making it easier to see how loads are transferred and how components interact, for example, between the pile cap and the buffer layer, the buffer layer and the soil, and between the buffer layer and the pile shaft.

3.2. Parameter Selection

(1) Displacement boundary conditions: The bottom boundary is fully fixed. The sides are subjected to horizontal constraints, and the top is set as a free boundary condition.
(2) Fluid boundary conditions: The bottom surface is defined as an impermeable boundary. The top surface of the foundation soil and the pile body are set as permeable boundaries. The “fluid model assign null” command defines impermeable materials, and the initial pore water pressure in the soil layers is defined using the “initialize pore-pressure” command.
(3) Constitutive model selection: The pile body and cap are modeled using an elastic constitutive model, and the soil and cushion are modeled using the Mohr–Coulomb constitutive model. Since the pile body typically remains in the elastic stage when the surrounding soil fails, the elastic model is chosen to better reflect the pile’s behavior.
(4) Fluid–solid coupling calculation: Soil is defaulted to a porous medium in FLAC3D flow–solid coupling analysis. The fluid flow in a porous medium conforms to Darcy’s law. Also, it conforms to the Biot consolidation theory, which considers the pore structure of soil and the seepage characteristics of porous water based on the concept of porous medium. In FLAC3D fluid–solid coupling, changes in pore water pressure directly affect the soil’s stress state and mechanical response. At the same time, soil deformation will also lead to changes in the pore water pressure, forming a dynamic process of mutual cyclic feedback. FLAC3D stream-solid coupling solution supports a variety of calculation methods, such as the manual calculation method, the master–slave process method, and the direct solution method. In the manual calculation method, the user can independently set the time step of single seepage and single mechanics operation; in the master–slave process method, the running process is divided into two types: the primary process and the child process, and the two states are coordinated and unified; therefore, the calculation efficiency is improved. In the direct solution method, each seepage time step corresponds to a mechanical time step. Although the calculation is complex, it is simpler and can meet specific engineering needs. The model in this study uses an entirely flow–solid coupling method to simulate the composite foundation of permeable concrete piles under load and sets fluid as the primary process. Mechanics is to solve the model from the process.
(5) Calculation parameter selection: The porosity and permeability coefficient of the pile body are selected based on the optimal mix proportion obtained from the material tests described in Section 2.3. The soil parameters are chosen according to the data in the study “Discussion on the Zoning of Chinese Soft Soil and Its Parameter Statistical Characteristics” [24]. The elastic modulus E is set within the range of compression modulus (2.5–3.5) Es. Model parameters include the friction angle φ, cohesion c, elastic modulus E, Poisson’s ratio v, density ρ, permeability coefficient k, and porosity n. Specific values are listed in Table 4. Since the relative displacement between the pile body and the surrounding soil is relatively large, the assumption of displacement continuity does not hold. Therefore, contact interfaces are defined between the cap and cushion, cushion and pile body, cushion and soil, and pile body and soil. The pile–soil contact surface is set as a permeable boundary for the permeable concrete pile composite foundation. The values of the normal stiffness coefficient kn and the tangential stiffness coefficient ks of the contact surface are ten times the maximum stiffness at the junction of the contact surface. The value can be calculated through Equation (4), and the calculation results are shown in Table 5 [25]. Friction angle φ and cohesion c, with values set at 70% of the φ and c values of the adjacent soil layers. See Table 5 for specific values. The contact interface settings are shown in Figure 6.
The study set the initial horizontal stress to 0.4 times the vertical stress. This value was chosen to reflect the typical soil stress conditions, as horizontal stress is usually relatively low due to natural settlement and consolidation processes. Such a low horizontal-to-vertical stress ratio is consistent with soft soils that are usually or slightly overconsolidated. The lateral earth pressure coefficient (K0) can range from 0.3 to 0.6. Based on geotechnical investigation results, K0 was set to 0.4. This setup reasonably approximates the actual site conditions while ensuring numerical stability and realistic deformation responses in the simulation.
K n = K s = 10 max ( K + 4 G / 3 Δ Z min )

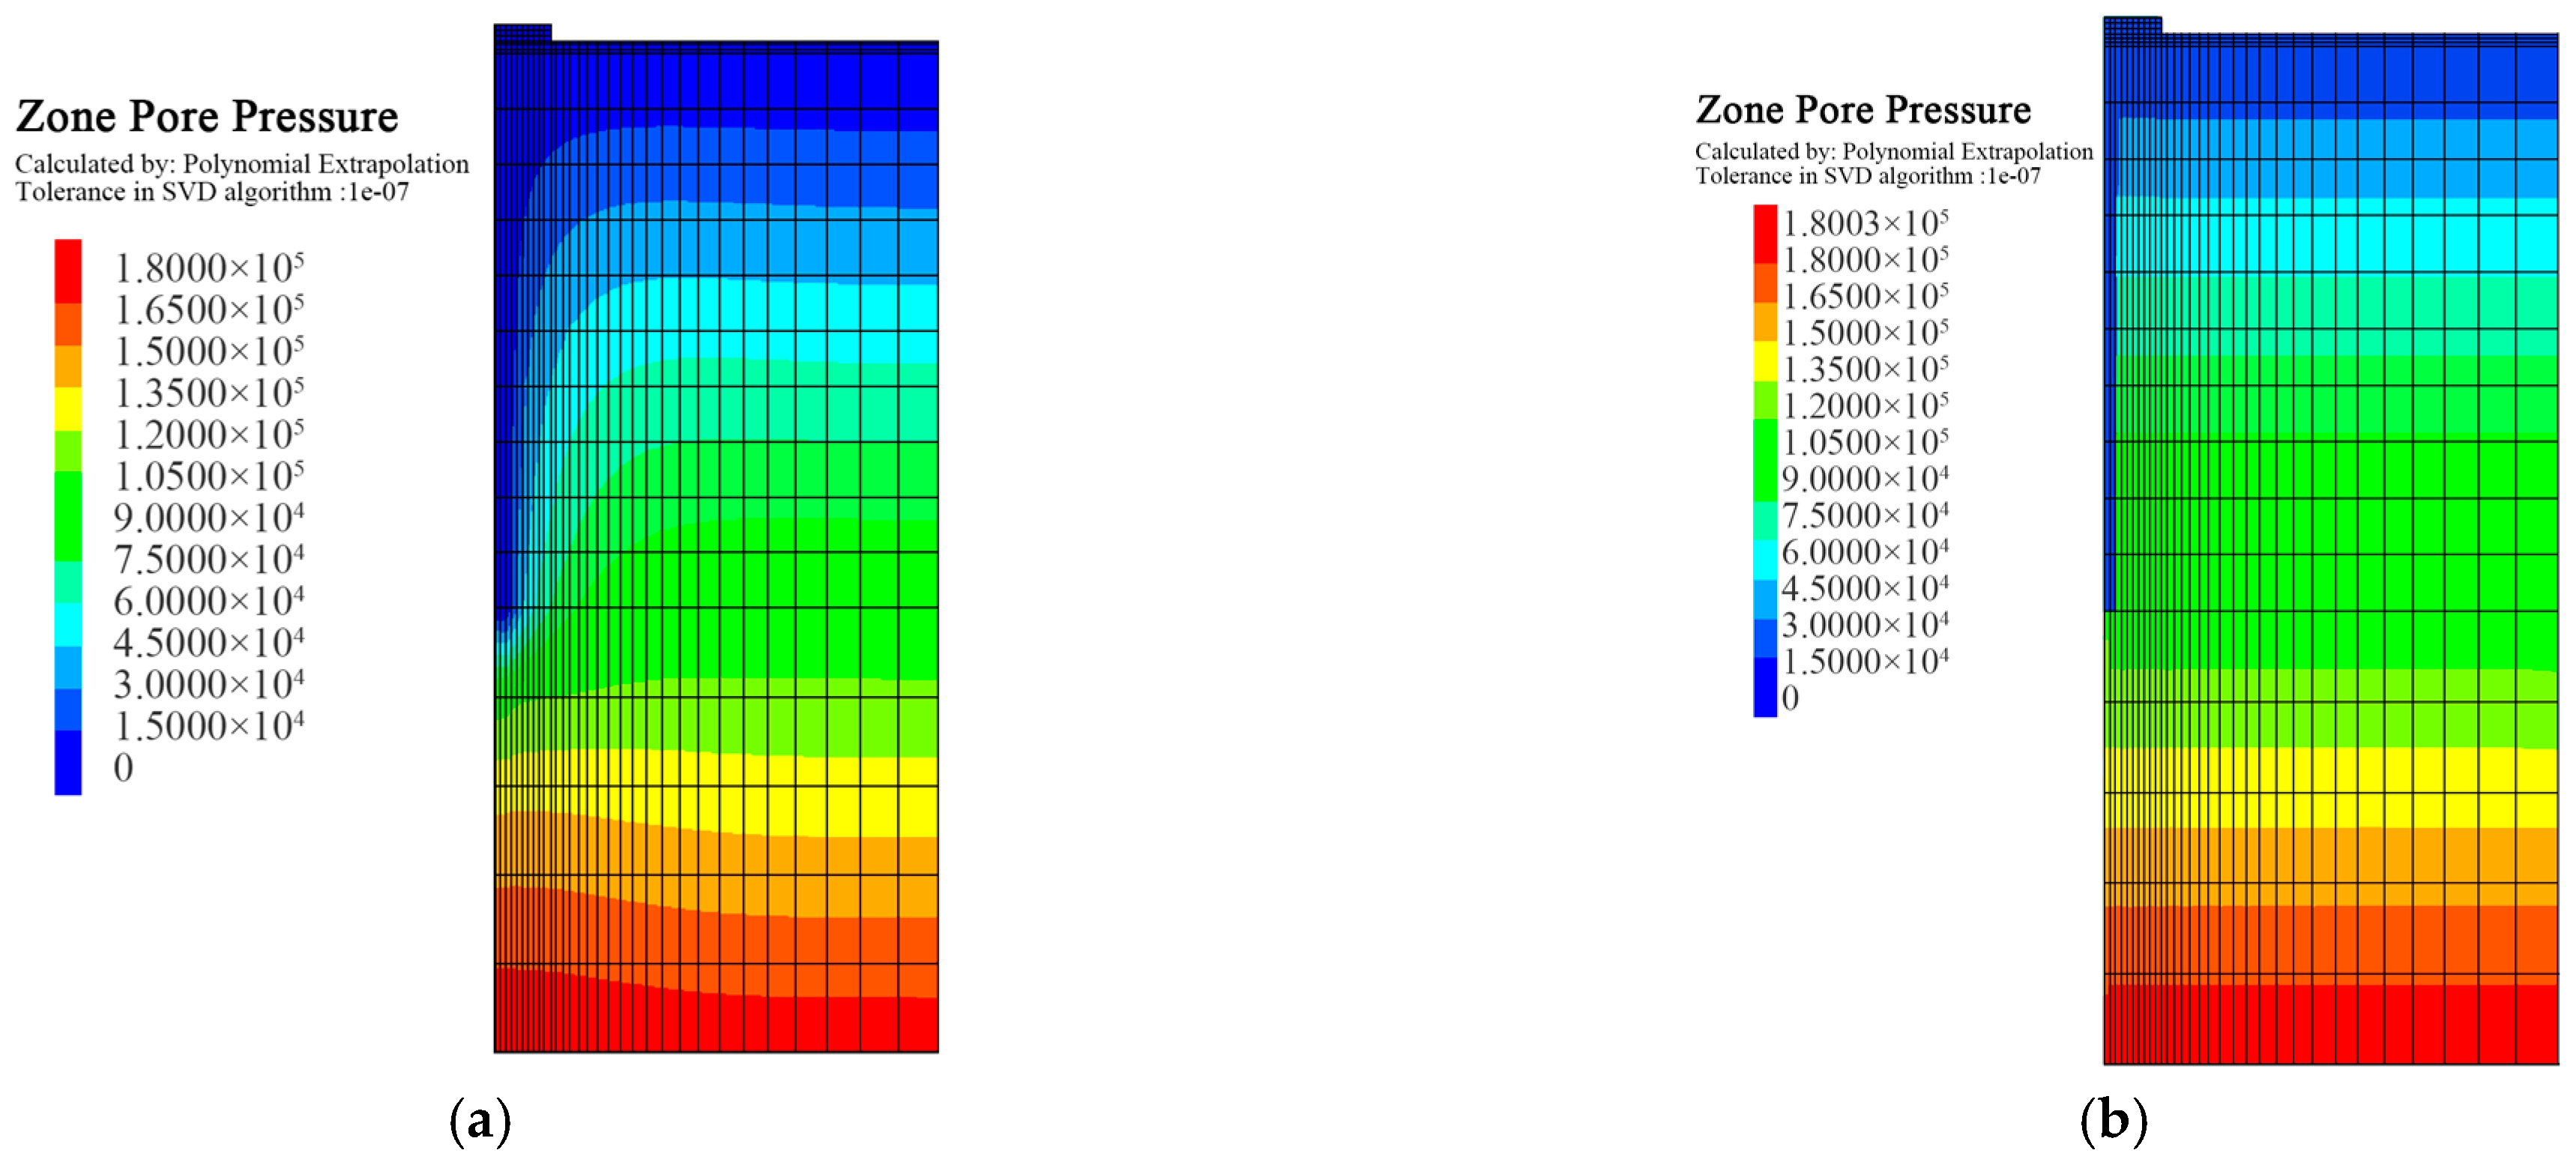
3.3. Pore Pressure Setup

Figure 7 illustrates the layout of the pore pressure monitoring points. Within the same horizontal plane, one monitoring point is placed at 1D, 2D, and 3D distances from the pile center, respectively. Additionally, nine monitoring points are evenly spaced along the pile axis to track changes in pore water pressure.
Figure 8 shows the pore pressure distribution in two different types of composite foundations after final loading. Figure 8a depicts the head difference in radial and vertical directions, while Figure 8b shows the difference only in the vertical direction. The pore water pressure migrates from high-pressure zones to low-pressure zones.
The permeable concrete pile composite foundation supports vertical seepage and allows radial seepage. This effectively increases the drainage pathways, shortens the drainage distance, and accelerates soil consolidation. In contrast, for the impermeable pile composite foundation, excess pore water pressure can only dissipate gradually through the top surface of the foundation. As a result, it takes longer to achieve the dissipation of the pressure effectively. The numerical simulation results in the study are all the results after consolidation.

4. Results and Discussions

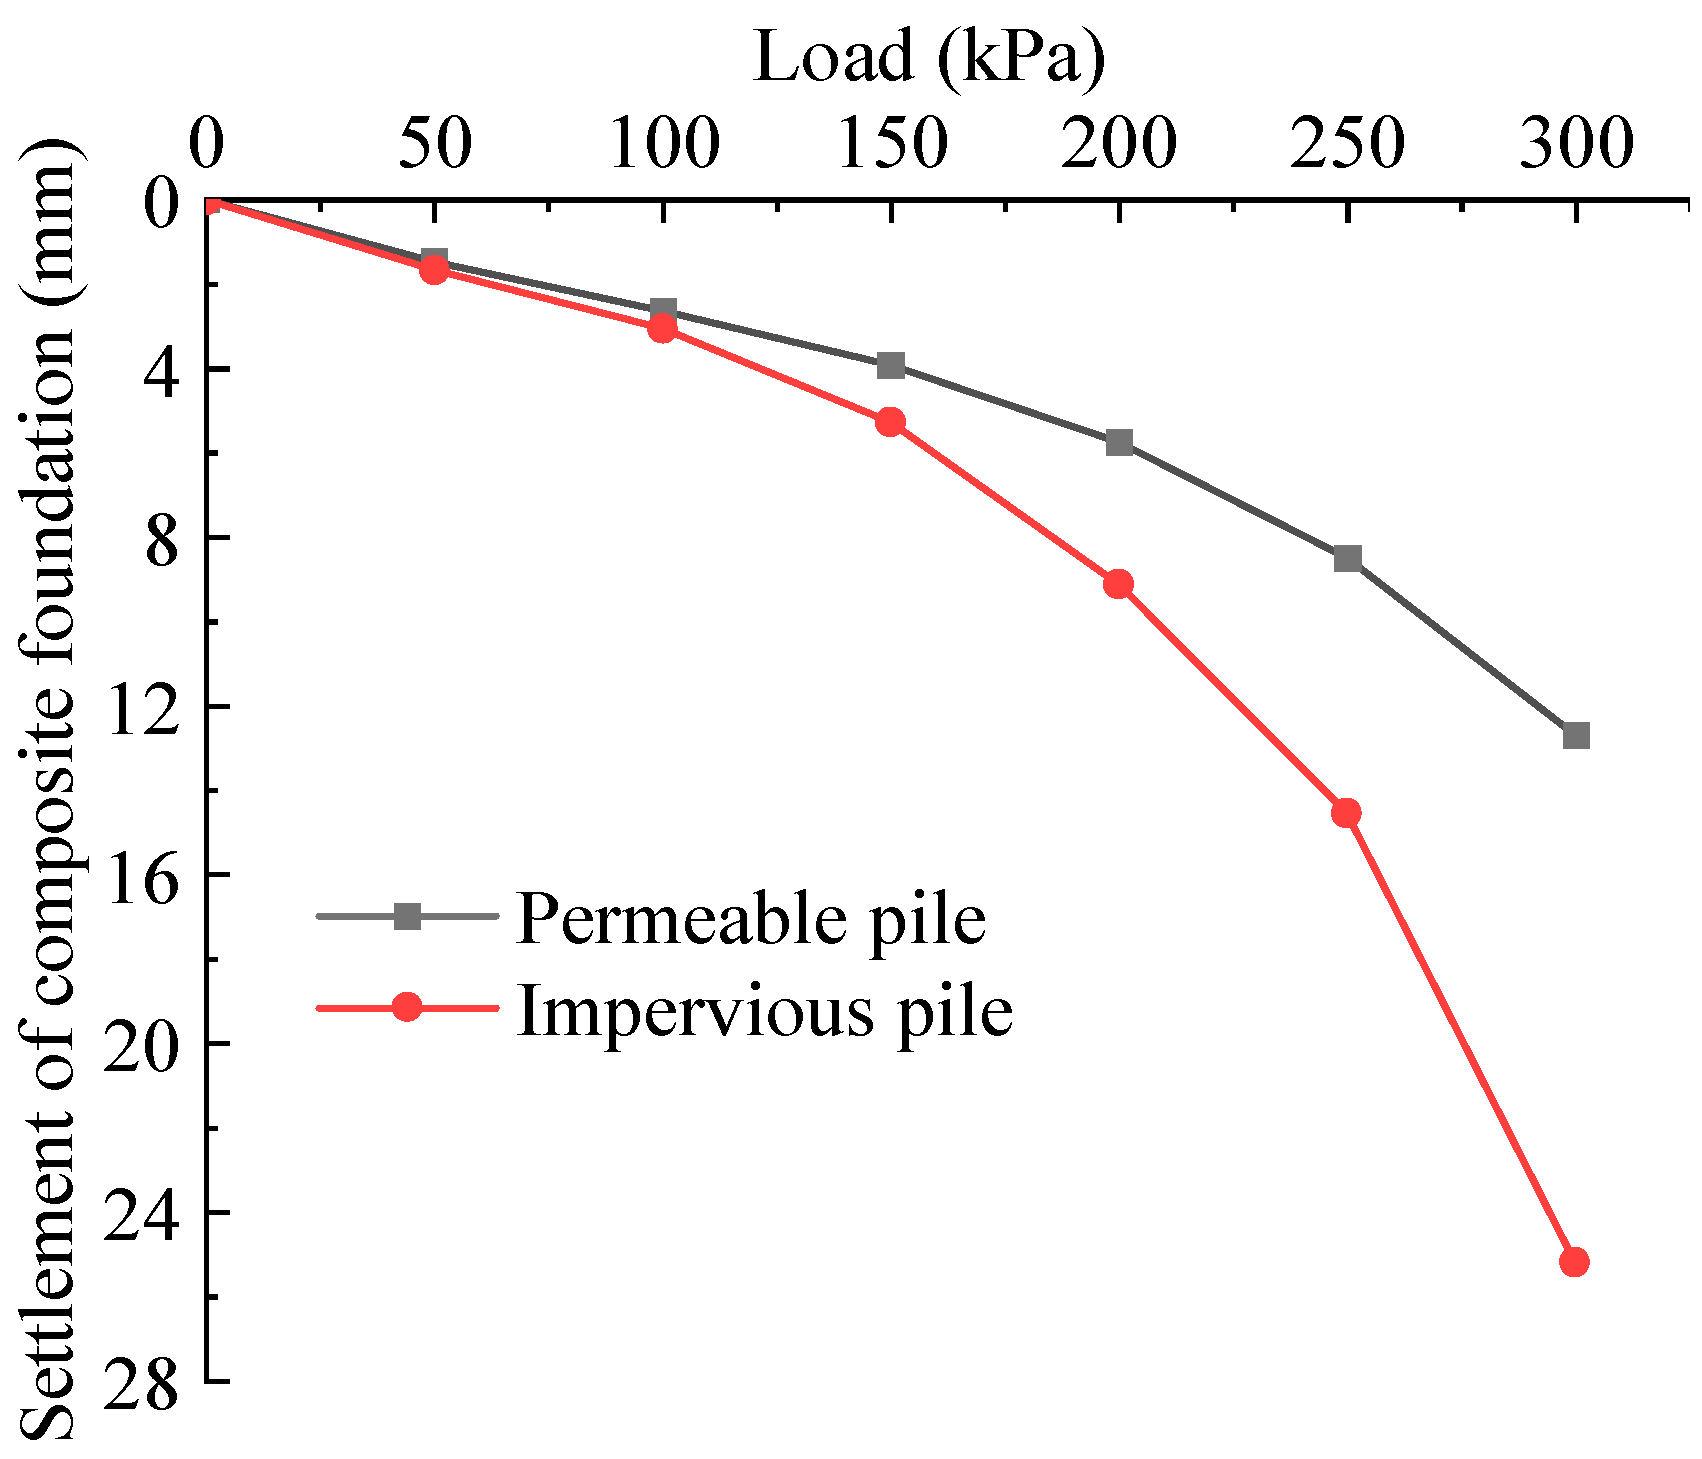
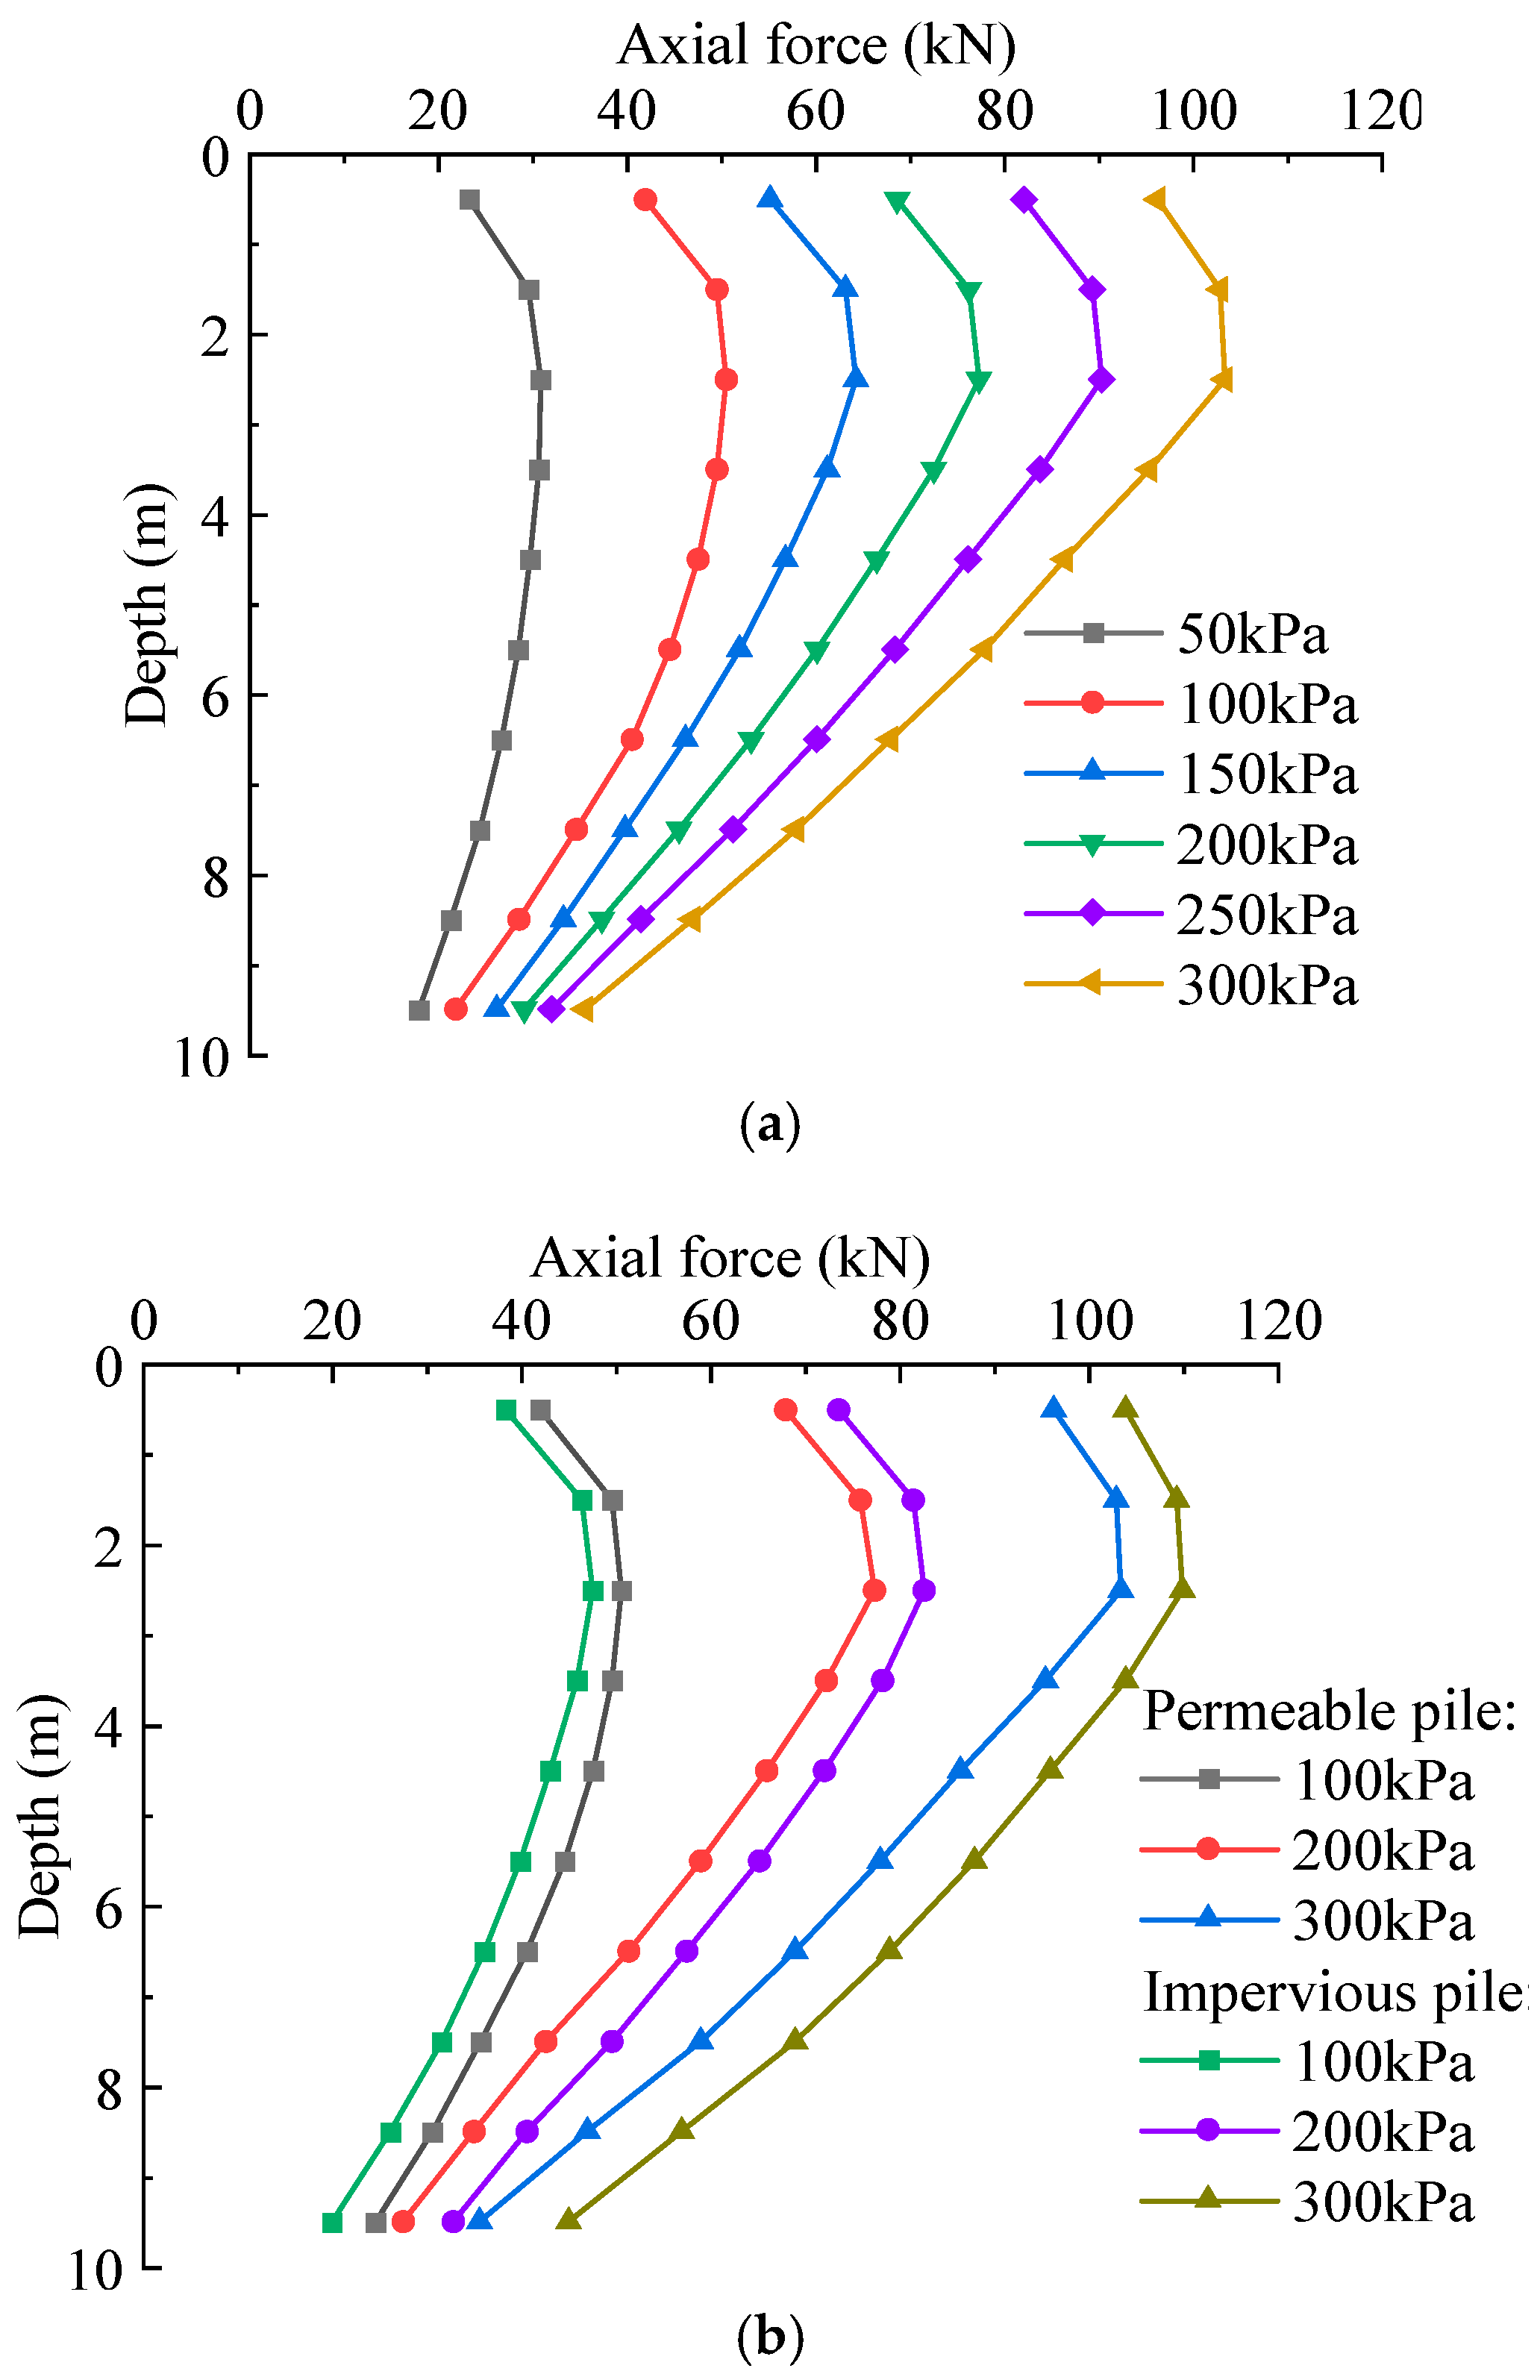
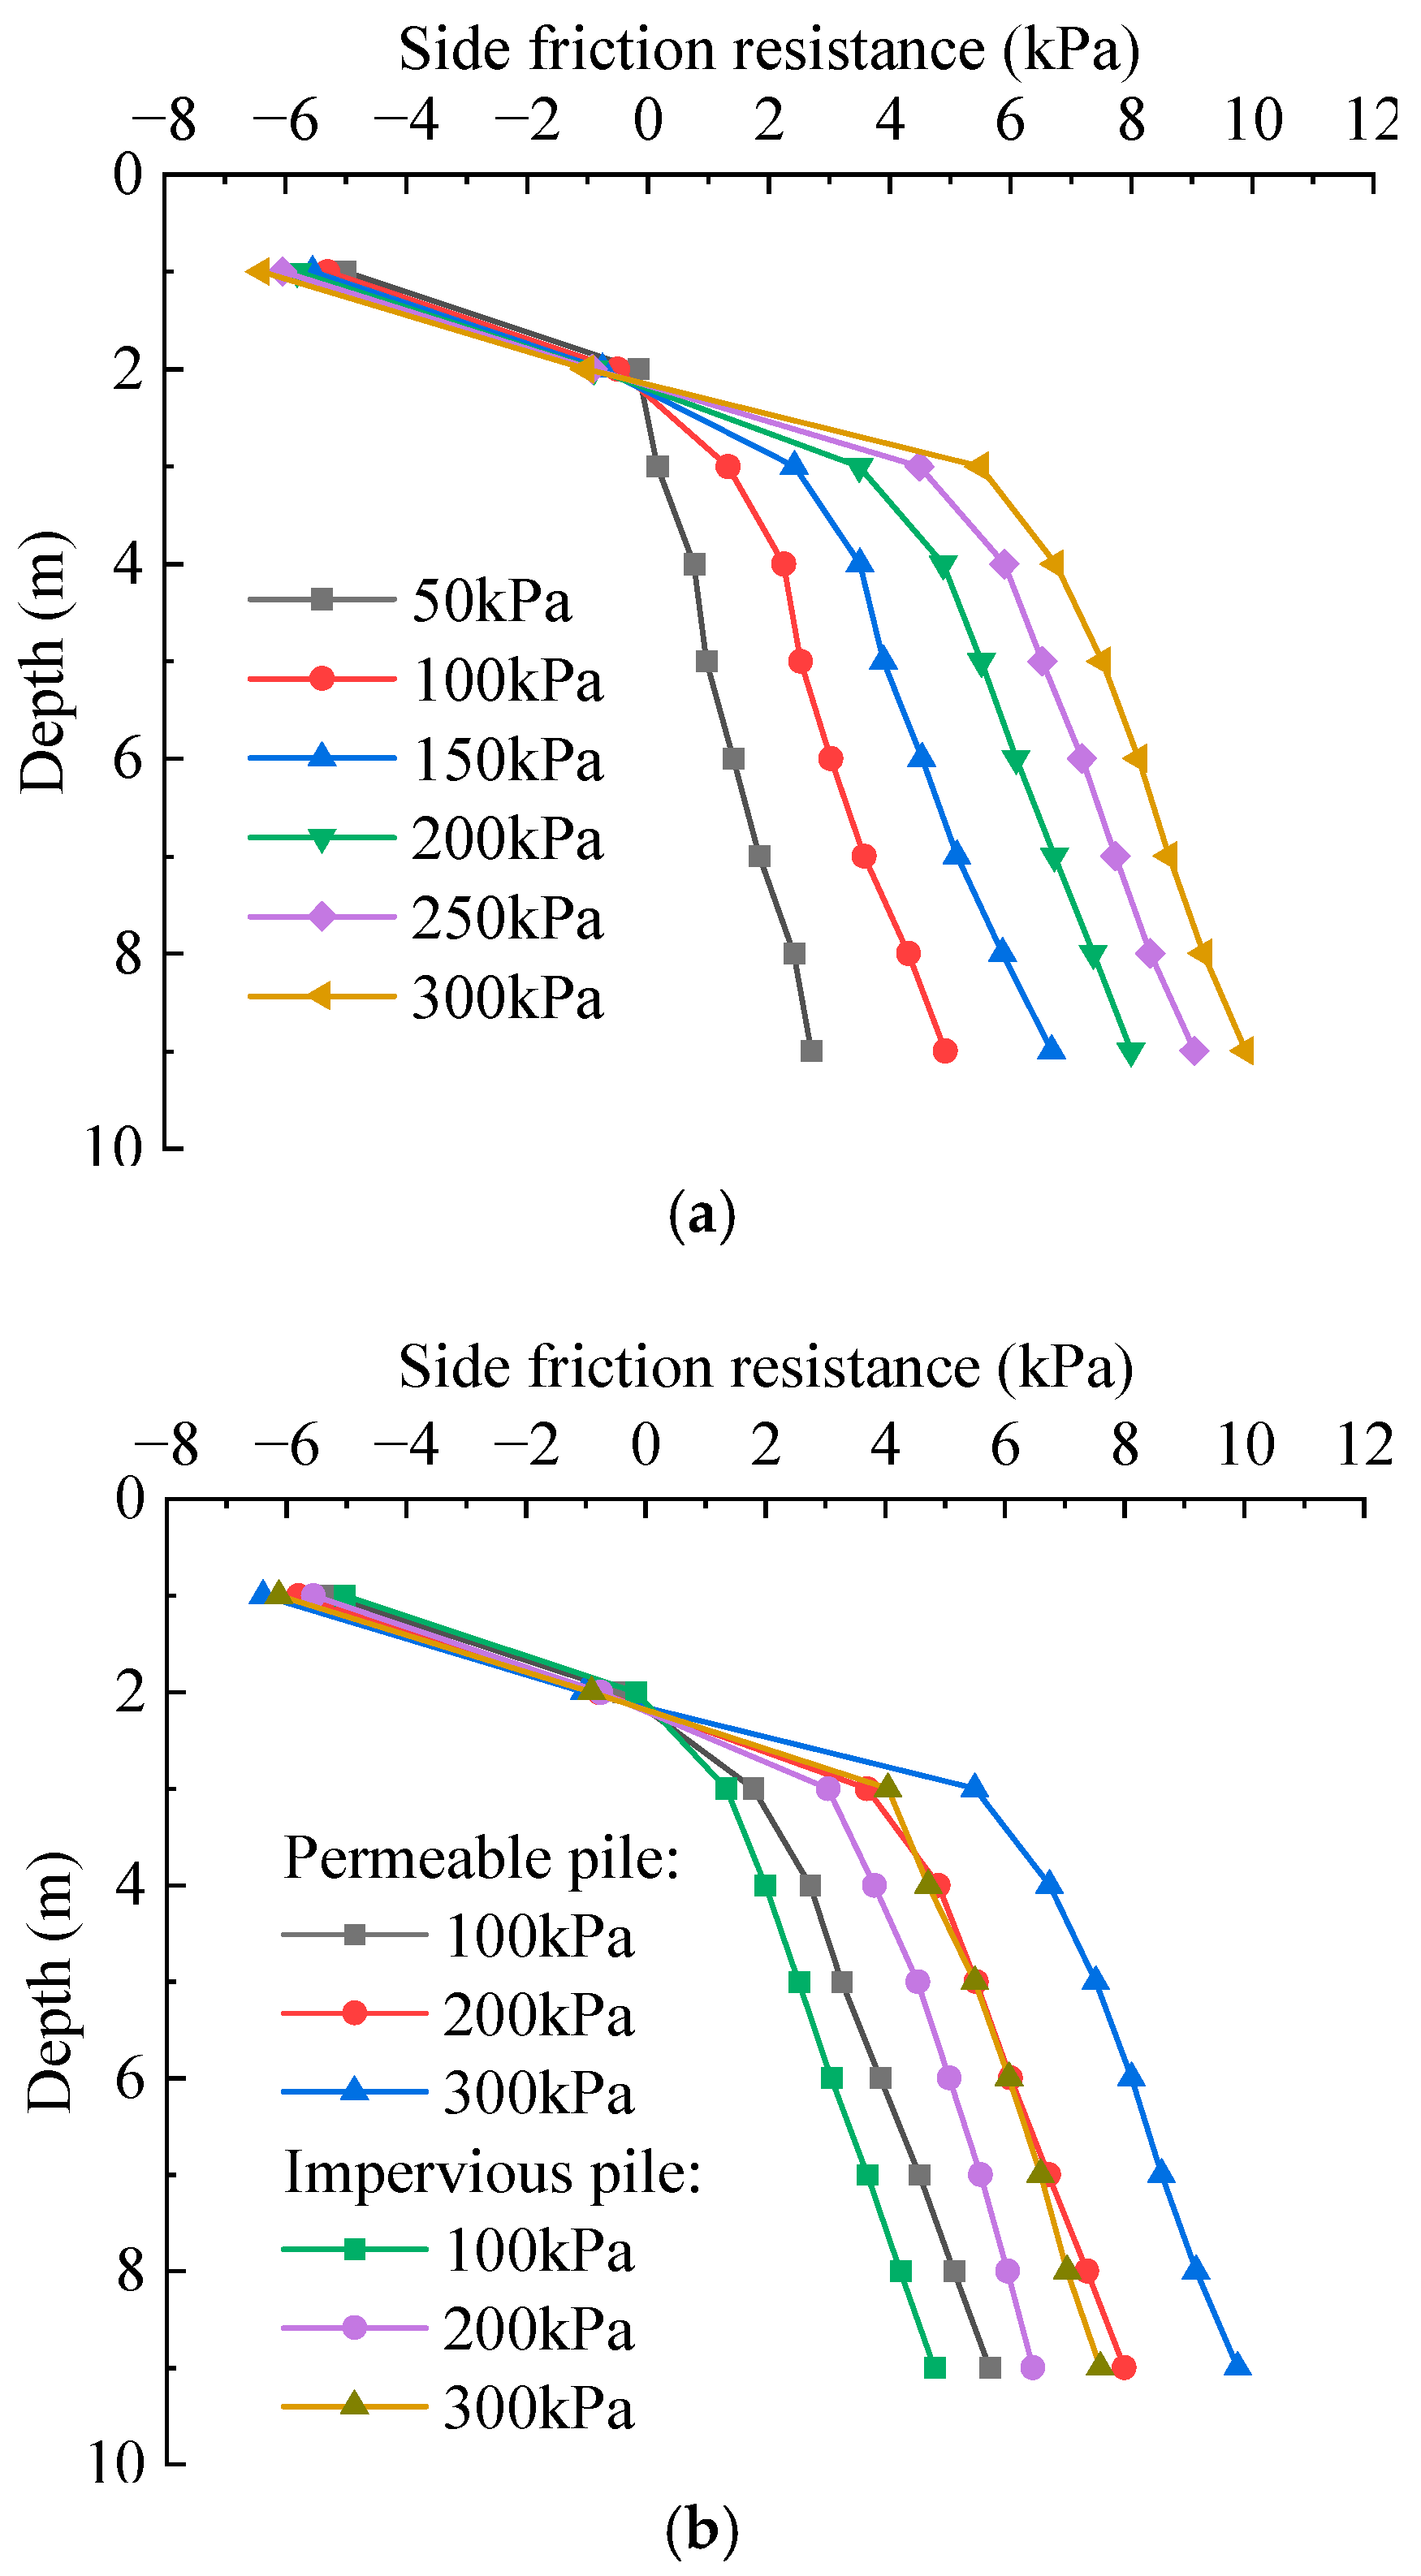
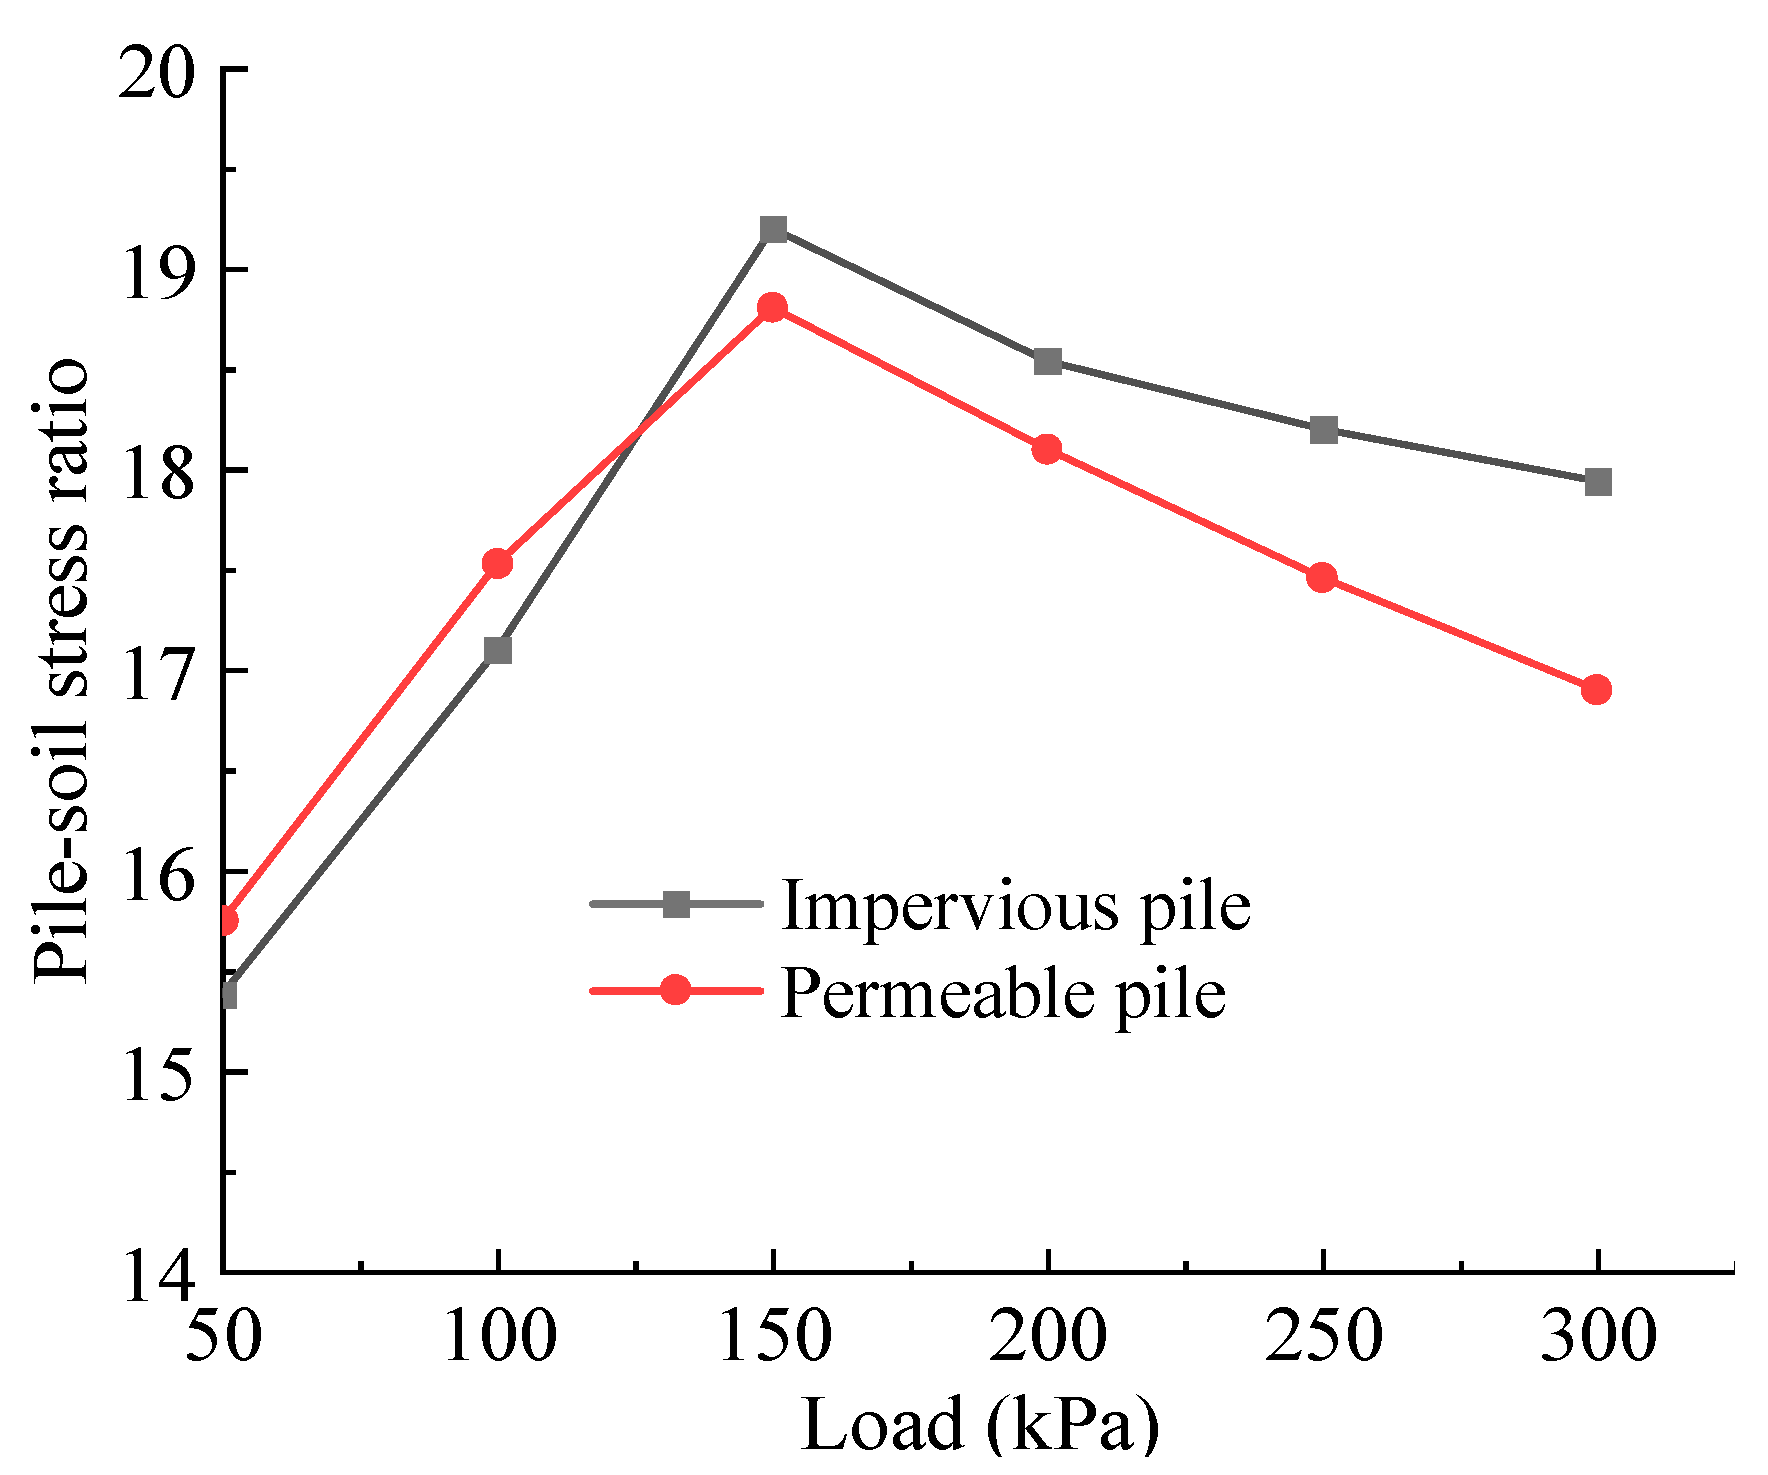
4.1. Comparison of Bearing Characteristics of Permeable and Impermeable Piles

Figure 9 shows the settlement curves of the two types of composite foundations under different loading conditions. In the initial loading stage, the difference in settlement between the permeable concrete pile and the impermeable concrete pile composite foundations is slight. The load–settlement curves show an approximately linear relationship. As the load increases gradually, the difference in settlement between the two foundations becomes larger. The settlement of the permeable concrete pile composite foundation is significantly less than that of the impermeable pile composite foundation. When the load reaches 300 kPa, the settlement of the impermeable concrete pile composite foundation is 24.91 mm, while the settlement of the permeable concrete pile composite foundation is only 12.74 mm. This represents a 50.13% reduction in settlement compared to the impermeable pile. This is because the interconnected pores within the permeable concrete piles form vertical drainage channels. These channels enhance radial and vertical seepage in the foundation, accelerating consolidation and reducing settlement.
Figure 10a illustrates axial force distribution in permeable concrete piles under different loads. As the foundation depth increases, the axial force in the pile initially increases and then decreases. Specifically, the axial force increases at depths less than 2.7 m and gradually decreases at depths greater than 2.7 m. Comparing the axial forces at the same depth, it is observed that as the load increases, the axial force in the upper part of the pile significantly rises. In contrast, the increase in the lower part is relatively small. This is due to the increasing influence of the side friction of piles with depth. For example, at a load of 50 kPa, the top axial force is 23.16 kN, and the bottom axial force is 18.11 kN. When the load reaches 300 kPa, the top axial force increases to 96.37 kN, while the bottom axial force is 35.71 kN. This indicates that as the load increases, the effect of side friction of piles becomes more pronounced, leading to a better attenuation of axial force. This phenomenon reflects the varying influence of the side friction of piles on axial force distribution at different loading stages.
Figure 10b shows the axial force distribution of permeable and impermeable concrete piles under three different loading conditions. The figure indicates that the difference in top axial force between the two types of piles is relatively tiny. However, this difference increases with depth. This suggests that the axial force attenuation in the depth direction is more significant for permeable piles than impermeable piles. This is attributed to the porous structure of permeable piles, which facilitates soil drainage and consolidation, thereby effectively enhancing the pile’s load-bearing capacity. Additionally, as the load increases, the difference in axial force between permeable and impermeable piles becomes larger. This further highlights the structural advantages of permeable piles under different loading conditions.
Figure 11a shows the distribution of side friction of piles of permeable concrete piles under different loads. The figure indicates that when the soil depth is less than 2 m, the side friction of the piles of the pile is negative. This occurs because, within this depth range, the settlement rate of the pile is lower than that of the surrounding soil. As a result, downward frictional resistance is generated between the pile and the soil, creating a negative friction zone. Additionally, the side friction of piles in the negative friction zone shows little difference under various loads. As the depth increases (beyond 2 m), the side friction of piles gradually becomes positive, entering the positive friction zone. In the positive friction zone, the side friction of piles shows significant differences under different loads and increases with increasing load. The interface between the negative and positive friction zones is called the neutral plane of the pile–soil interface. This plane is the critical location where the side friction of piles transitions from negative to positive.
Figure 11b illustrates the distribution of the side friction of piles for permeable and impermeable piles under three different loading conditions. The figure shows that, for both pile types, the side friction of piles is higher at the pile head and pile toe (in opposite directions) and relatively lower in the middle part of the pile. The difference in side friction of piles between permeable and impermeable piles is slight in the negative friction zone. However, in the positive friction zone, there is a significant difference in the side friction of piles between the two piles, with permeable piles exhibiting higher values than impermeable piles. Moreover, as the load increases, the difference in side friction of piles between permeable and impermeable piles becomes larger. When the load increases from 100 kPa to 300 kPa, the difference in the side friction of piles rises from 0.925 to 2.3, an increase of 148.65%. This result indicates that permeable concrete piles can more effectively transfer and distribute lateral loads under higher loads, thereby exhibiting better side friction of the piles.
Figure 12 and Figure 13 show the pile–soil stress ratio and pile load-sharing ratio for the two types of composite foundations under different loading conditions.
As seen in Figure 12 and Figure 13, when the load increases from 50 kPa to 150 kPa, both the pile–soil stress ratio and the pile load-sharing ratio show a clear upward trend. This indicates that the pile takes on a more significant proportion of the load in the initial stage. However, both ratios decline as the load rises from 150 kPa to 300 kPa. This suggests that the bearing capacity of the soil surrounding the pile increases, and the soil begins to take on more of the load.
Specifically, under a load of 150 kPa, the pile–soil stress ratio and pile load-sharing ratio for the permeable concrete pile composite foundation reach their maximum values at 19.03 and 0.441, respectively. In contrast, under a load of 300 kPa, these ratios drop to 17.13 and 0.409, respectively. This change shows that the pile bears a larger share of the load in the initial loading stage. As the soil consolidates and its bearing capacity increases, the foundation soil gradually takes on more of the load, decreasing the ratios.
The ratios for permeable concrete piles are lower under higher loads compared with impermeable piles. This indicates that permeable piles effectively accelerate the consolidation of the soil, thereby enhancing the overall bearing capacity of the foundation.

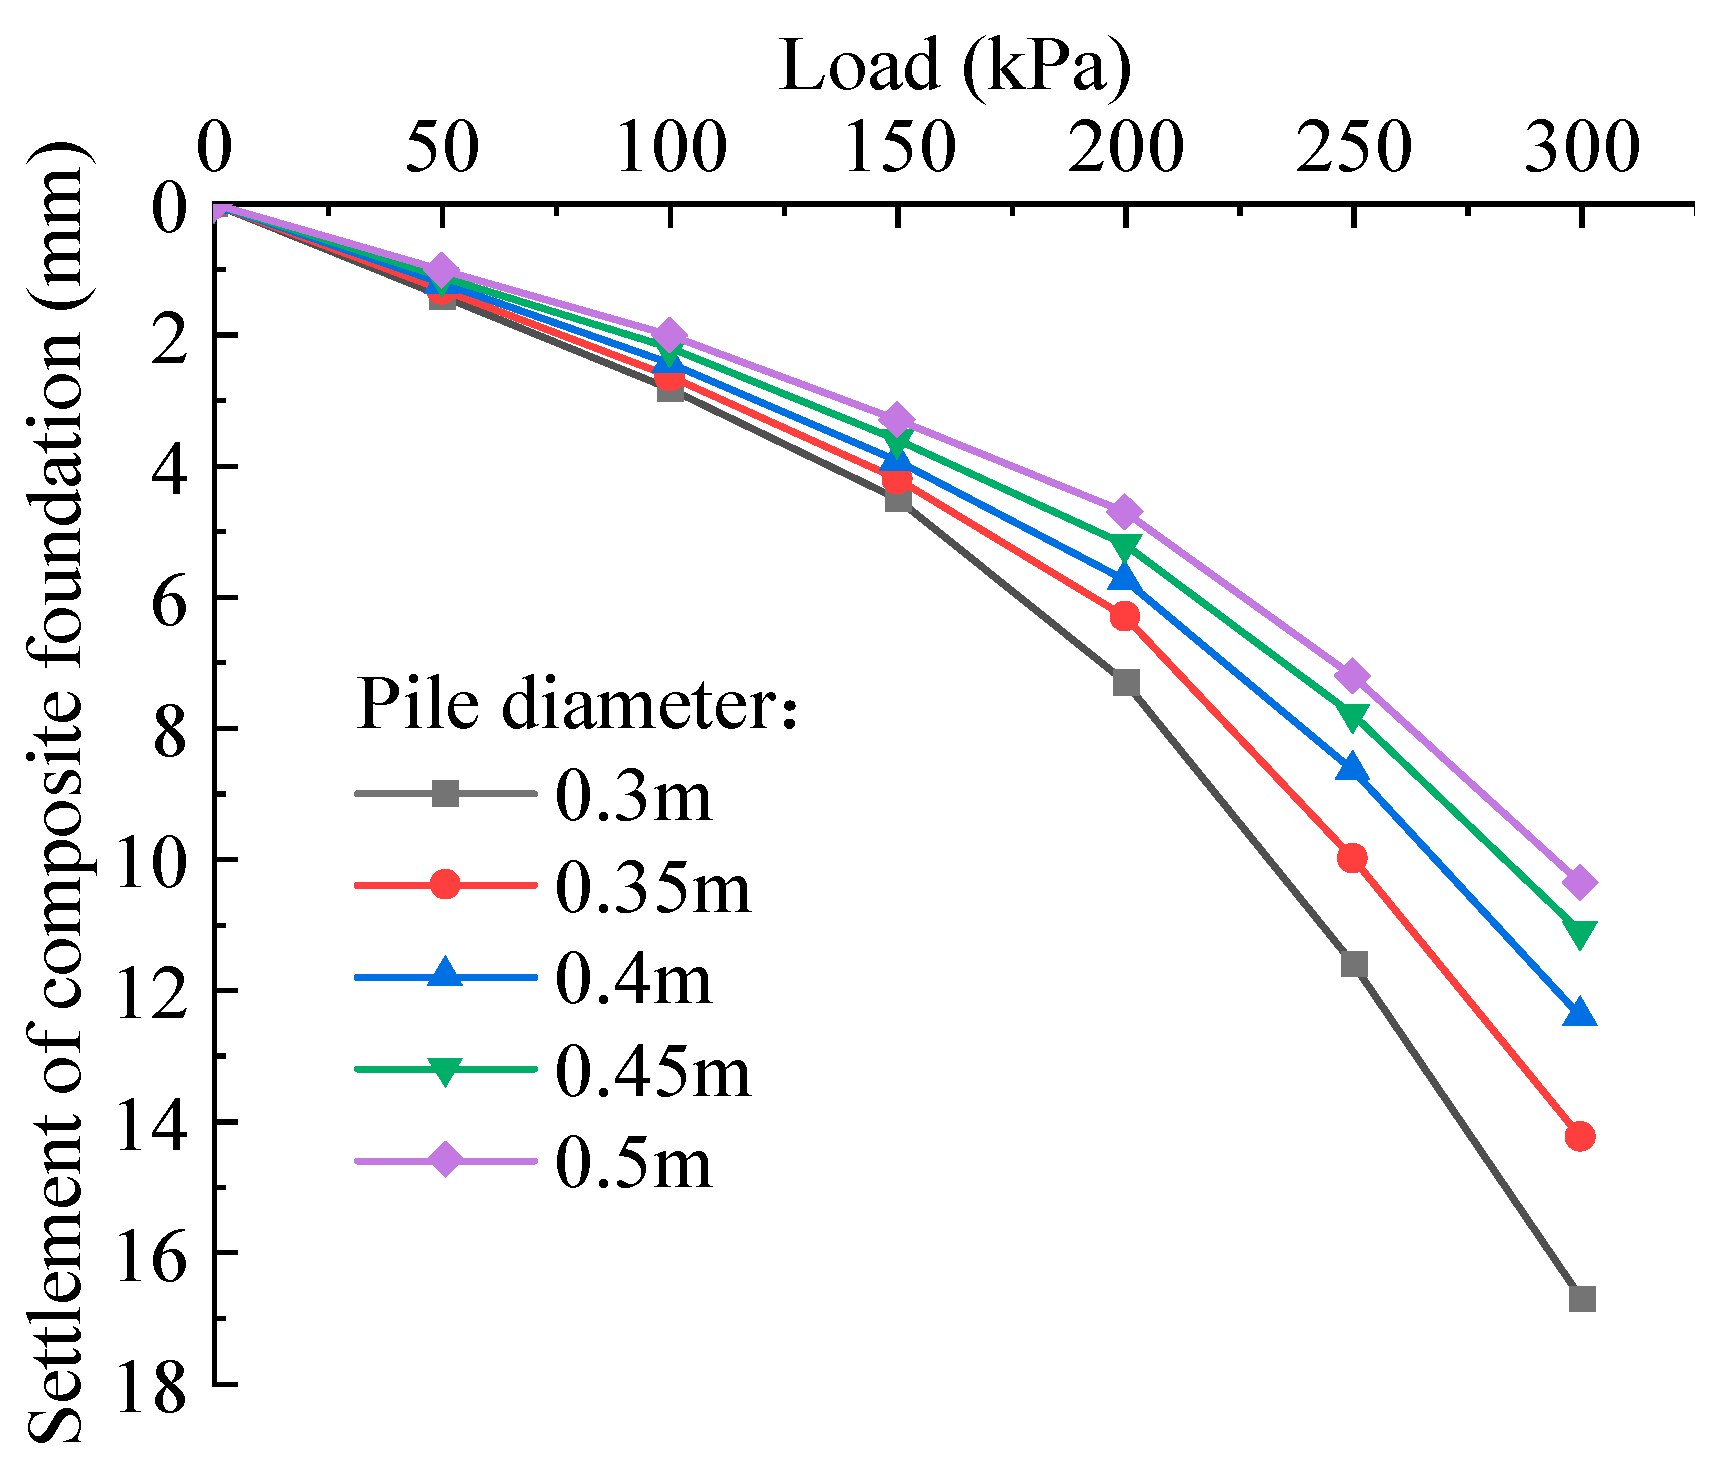
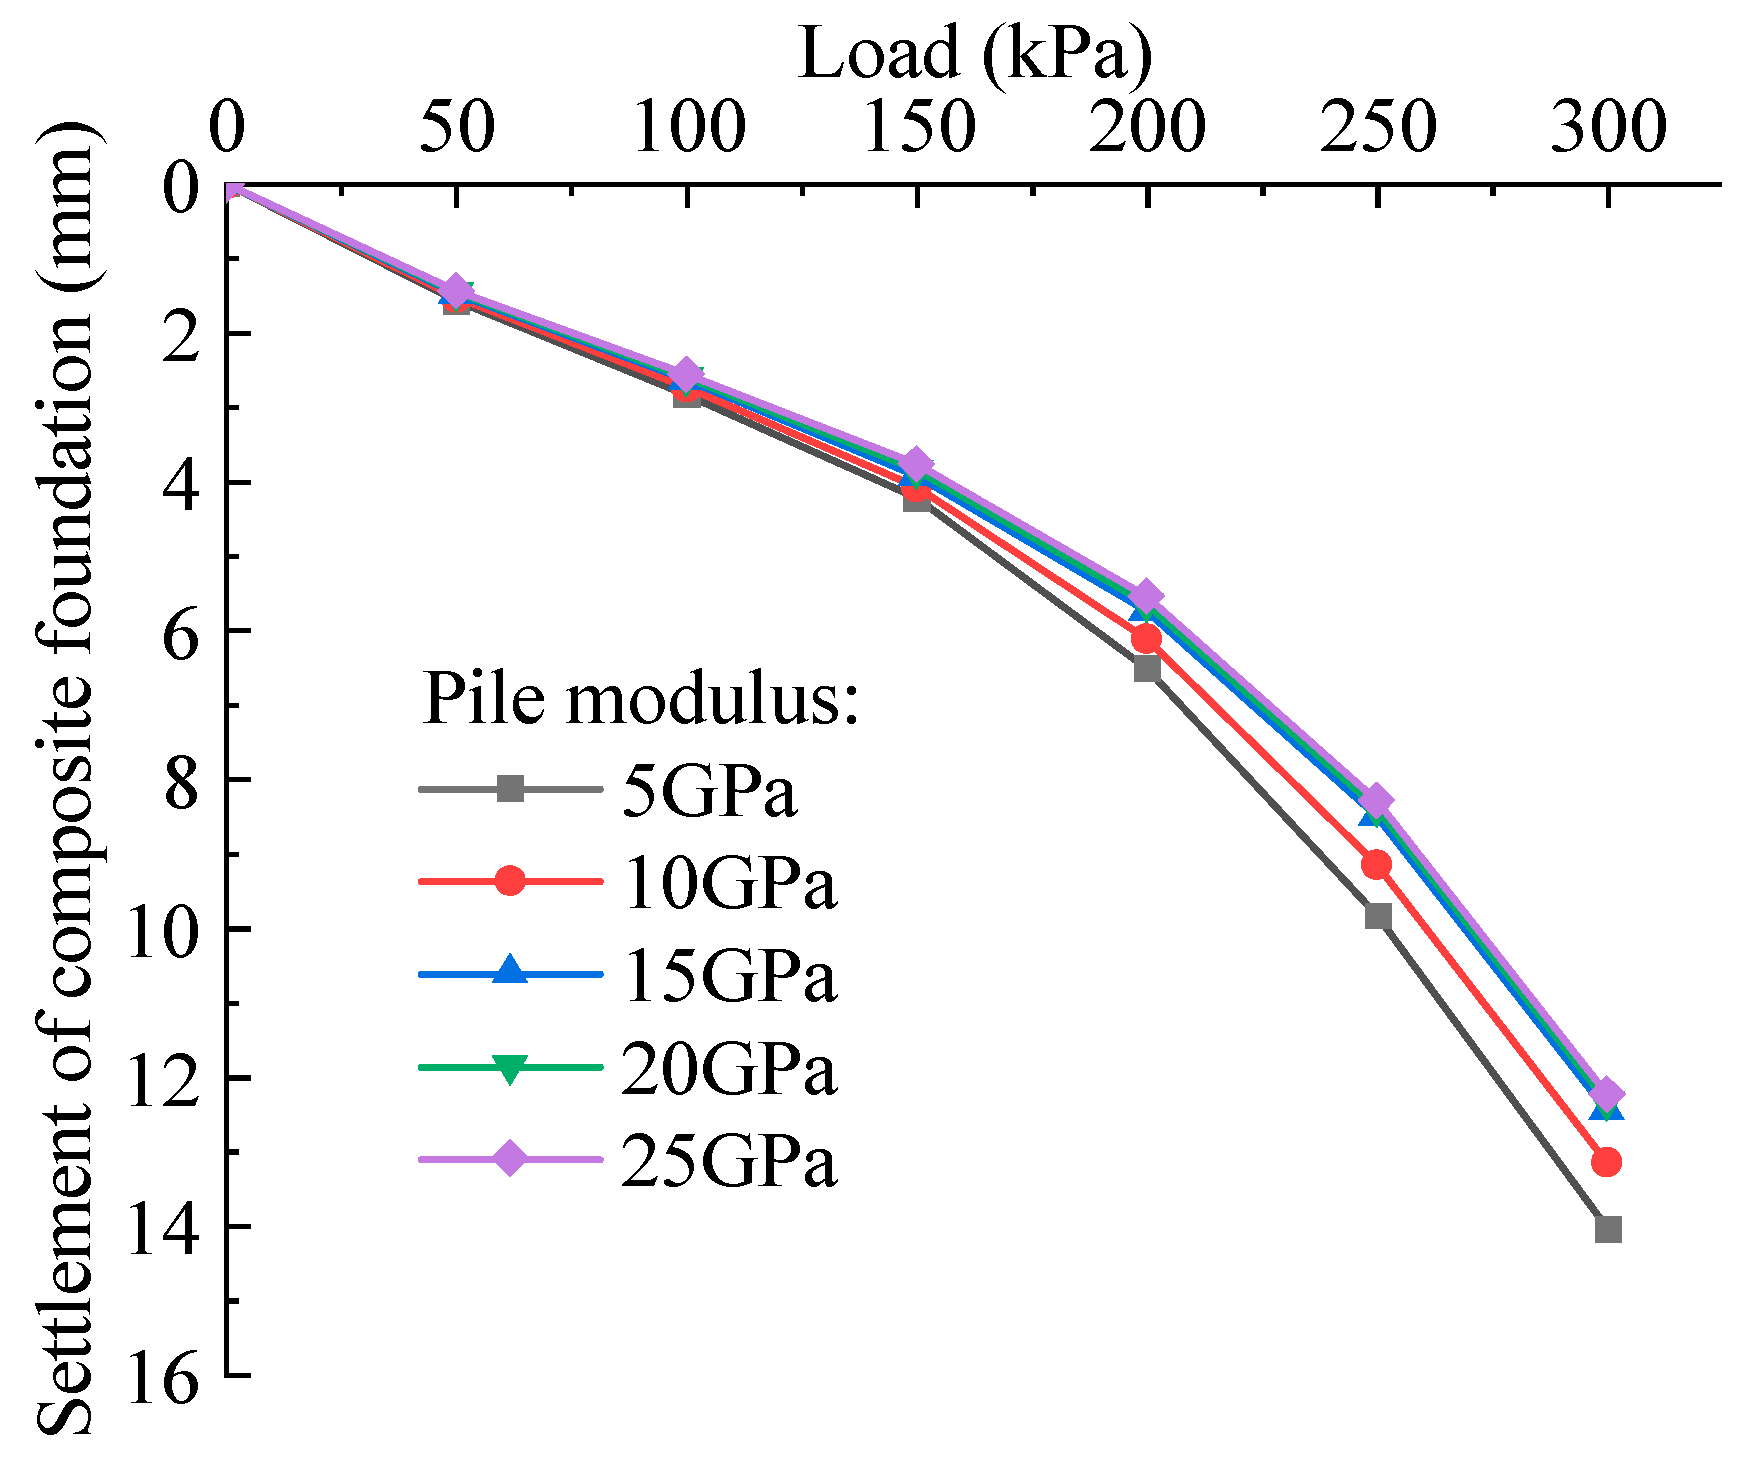
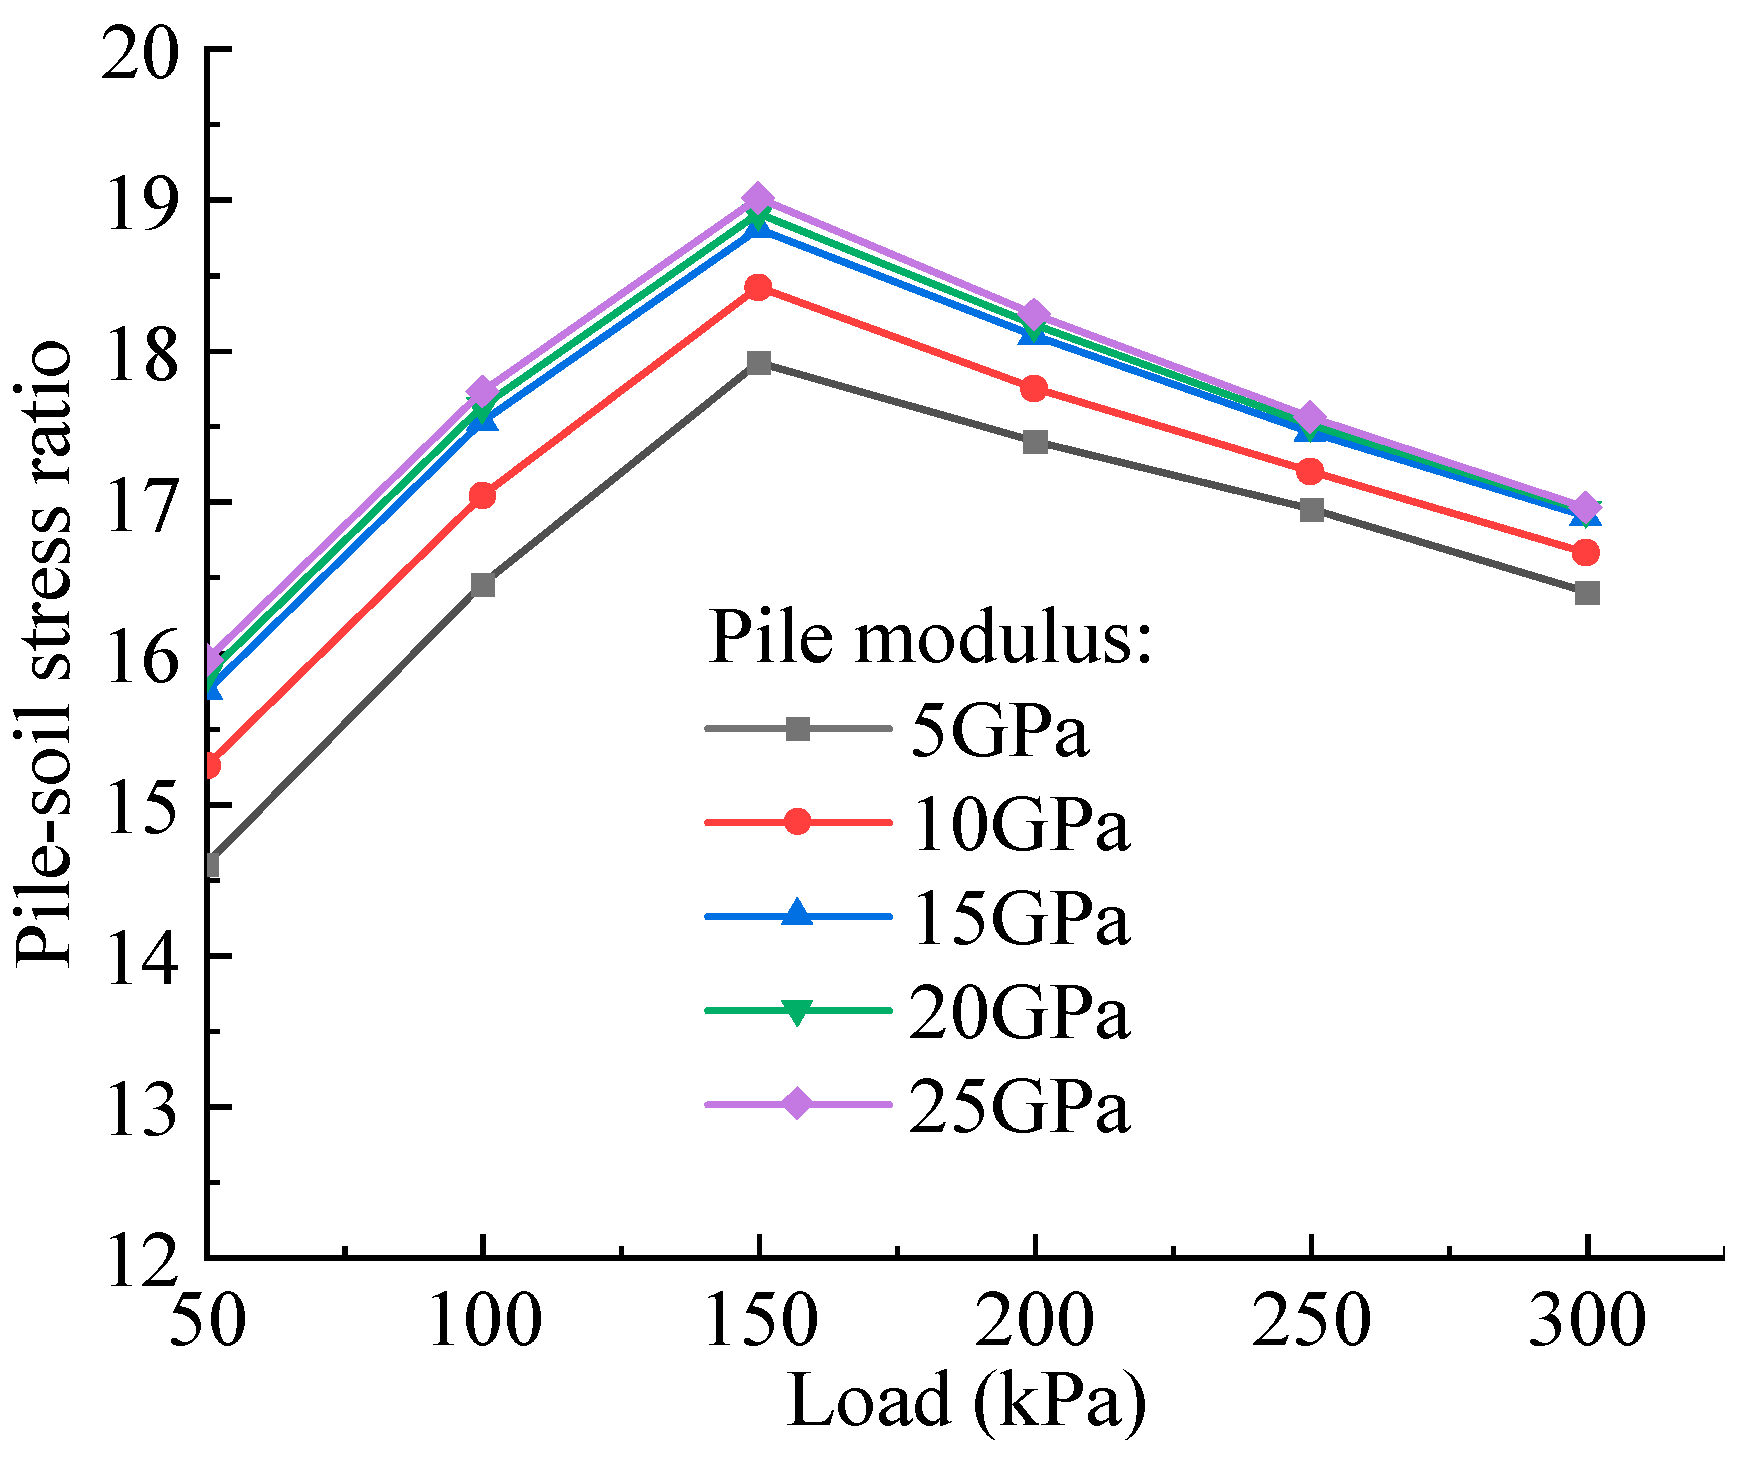
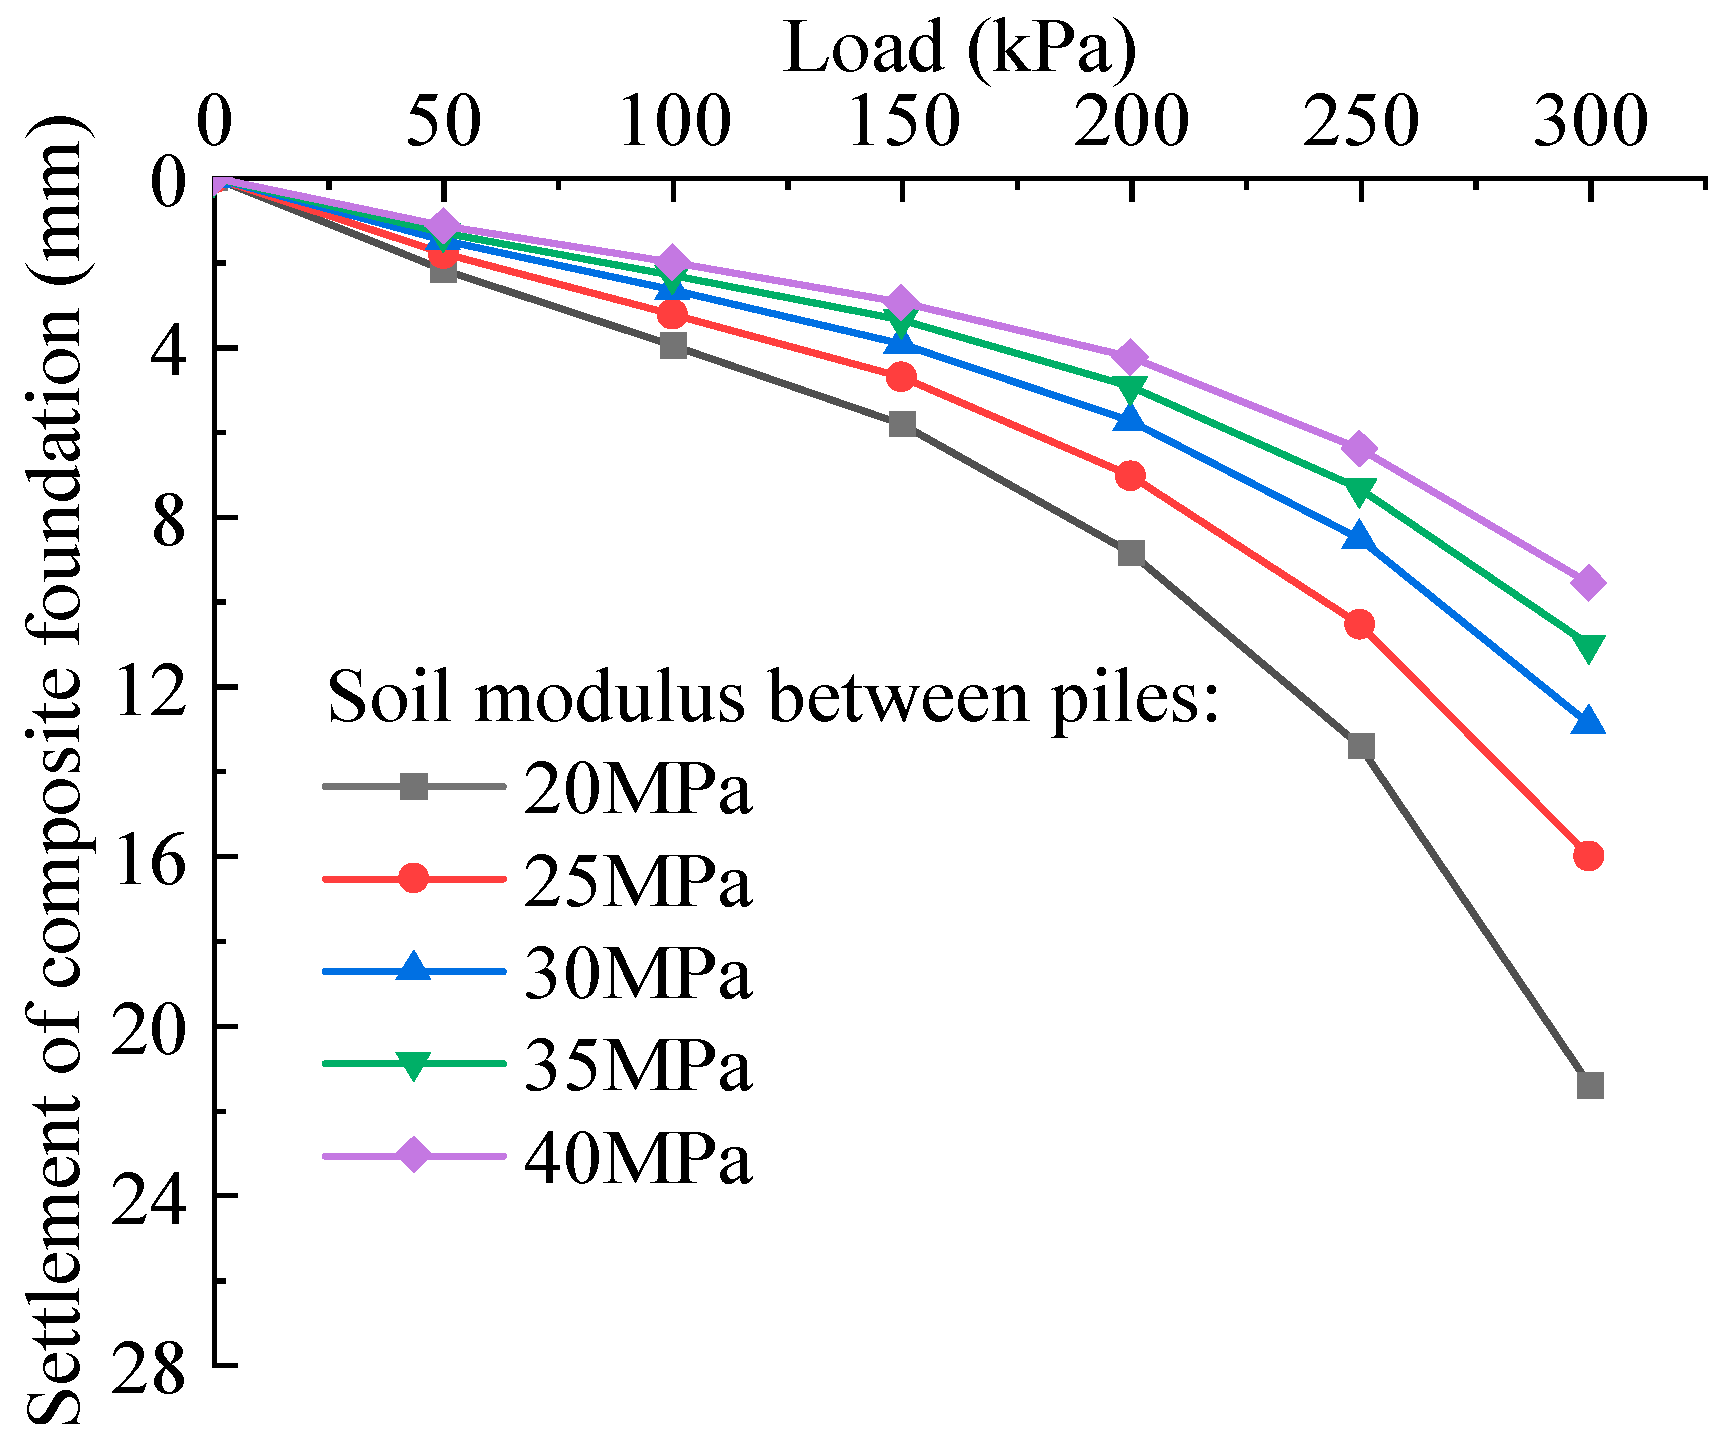
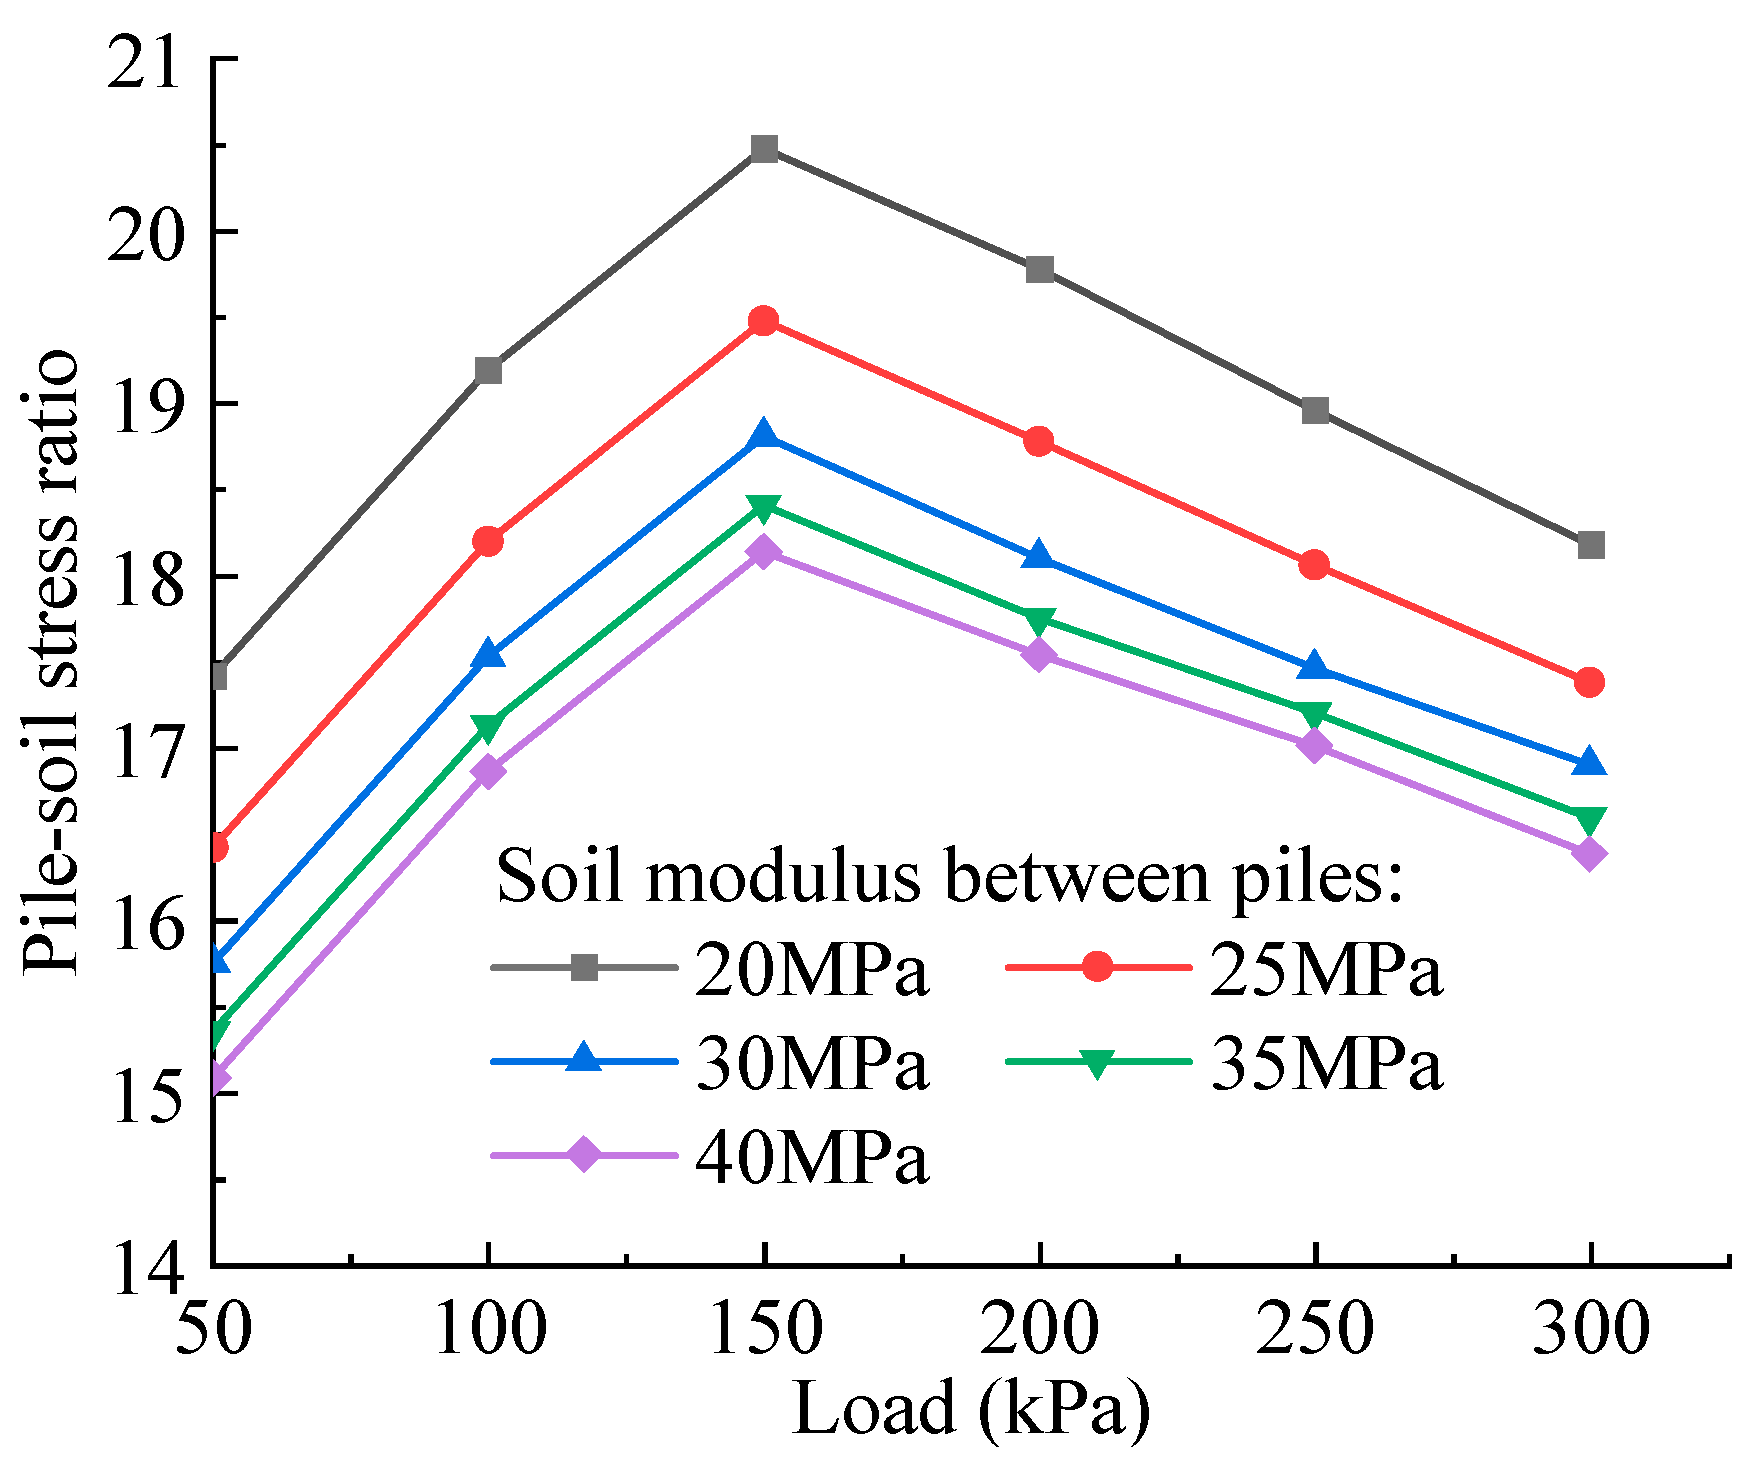
4.2. Influence of the Parameters of Pile

This section investigates the effects of various factors on the settlement and pile–soil stress ratio of composite foundations with permeable concrete piles. These factors include pile length, diameter, cushion thickness, cushion modulus, inter-pile soil modulus, and pile body modulus. Numerical simulations determine the changes in composite foundation settlement and pile–soil stress ratio under different loads for each influencing factor. The patterns of these changes are then analyzed.
Permeable concrete piles, which possess good permeability and a specific load-bearing capacity, typically have lengths ranging from 5 to 20 m. In the analysis, pile lengths were set at 6 m, 8 m, 10 m, 12 m, and 14 m, with other parameters kept constant. The influence of pile length on the settlement of composite foundations with permeable concrete piles and the pile–soil stress ratio was examined. The simulation results are shown in Figure 14 and Figure 15.
Figure 14 shows the influence of load on the settlement of composite foundations with different pile lengths. The figure indicates significant differences in the settlement behavior of composite foundations under different pile lengths. Under the same load conditions, the settlement of the composite foundation decreases gradually with increasing pile length. Further analysis of the settlement at 300 kPa shows that as the pile length increases from 6 m to 14 m, the settlement decreases from 36.98 mm to 7.04 mm, a reduction of 440.16%. This demonstrates that increasing pile length has a significant effect on reducing foundation settlement. However, when the pile length increases from 12 m to 14 m, the decrease in settlement is relatively small. This is due to the existence of an “effective pile length”. Once the pile length reaches this effective length, further increases in pile length have a less noticeable effect on reducing the settlement.
Figure 15 shows the influence of load on the pile–soil stress ratio for different pile lengths. The figure indicates that the pile–soil stress ratio increases with increasing pile length. However, the influence of load on the pile–soil stress ratio is inconsistent across different pile lengths. For piles with lengths of 6 m, 8 m, and 10 m, the pile–soil stress ratio initially increases and then decreases with increasing load. In contrast, the pile–soil stress ratio increases with increasing load for piles with lengths of 12 m and 14 m. This is because shorter piles are more likely to reach their ultimate load-bearing capacity when subjected to higher loads. In comparison, longer piles can continue to bear the load more effectively, thereby providing a more stable load-bearing capacity.
The pile diameters were adjusted to 0.3 m, 0.35 m, 0.4 m, 0.45 m, and 0.5 m, corresponding to replacement rates of 2.25%, 3.06%, 4%, 5.06%, and 6.25%, respectively. Other parameters remained constant. The influence of the pile diameter on the settlement and pile–soil stress ratio of composite foundations with permeable concrete piles was analyzed. The simulation results are shown in Figure 16 and Figure 17.
Figure 16 shows the influence of load on the settlement of composite foundations with different pile diameters. The figure indicates that under the same load, the overall settlement decreases as the pile diameter increases. Further analysis of the settlement at a load of 300 kPa shows that as the pile diameter increases from 0.3 m to 0.5 m, the settlement decreases from 16.7 mm to 10.37 mm, a reduction of 37.90%. This demonstrates that increasing the pile diameter significantly reduces the settlement of the foundation and improves its stability.
Figure 17 shows the influence of load on the pile–soil stress ratio for different pile diameters. The figure indicates that as the load increases, the pile–soil stress ratio initially increases and then decreases for all pile diameters. Specifically, the ratio increases when the load is less than 150 kPa and decreases when the load exceeds 150 kPa. Additionally, the pile–soil stress ratio gradually decreases with increasing pile diameter. This is because a larger pile diameter increases the load-bearing area of the pile, allowing it to share more of the load and reducing stress concentration at the pile head. Moreover, increasing the pile diameter enhances the drainage capacity of permeable concrete piles, accelerating the consolidation of the surrounding soil and improving its bearing capacity. This process further reduces the pile–soil stress ratio.
The pile modulus was adjusted to 5 GPa, 10 GPa, 15 GPa, 20 GPa, and 25 GPa, with other parameters kept constant. The simulation results are shown in Figure 18 and Figure 19.
Figure 18 shows the influence of load on the settlement of composite foundations with different pile moduli. The figure indicates that under the same load conditions, the settlement of the foundation decreases as the pile modulus increases. When the pile modulus reaches 15 GPa, further increases in the pile modulus do not significantly change the settlement. A further analysis of the settlement at a load of 300 kPa shows that as the pile modulus increases from 5 GPa to 15 GPa, the settlement decreases from 13.98 mm to 12.46 mm, a reduction of 10.87%. However, when the pile modulus increases from 15 GPa to 25 GPa, the settlement decreases from 12.46 mm to 12.19 mm, a reduction of only 2.17%. This result indicates that the influence of pile modulus on foundation settlement is relatively limited and that there is a critical modulus value. Beyond this value, further increases in the pile modulus have little effect on settlement.
Figure 19 shows the influence of load on the pile–soil stress ratio for different pile moduli. The figure indicates that the pile–soil stress ratio increases under the same load conditions with an increasing pile modulus. This means that increasing the stiffness of the pile helps it to more effectively share the load, thereby enhancing the stability of the foundation. However, when the pile modulus exceeds 15 GPa, the difference in the pile–soil stress ratio decreases as the pile modulus increases. This suggests that, under high-modulus conditions, the pile’s ability to share the load is close to saturation, and further increases in pile modulus have a limited effect on the pile–soil stress ratio.

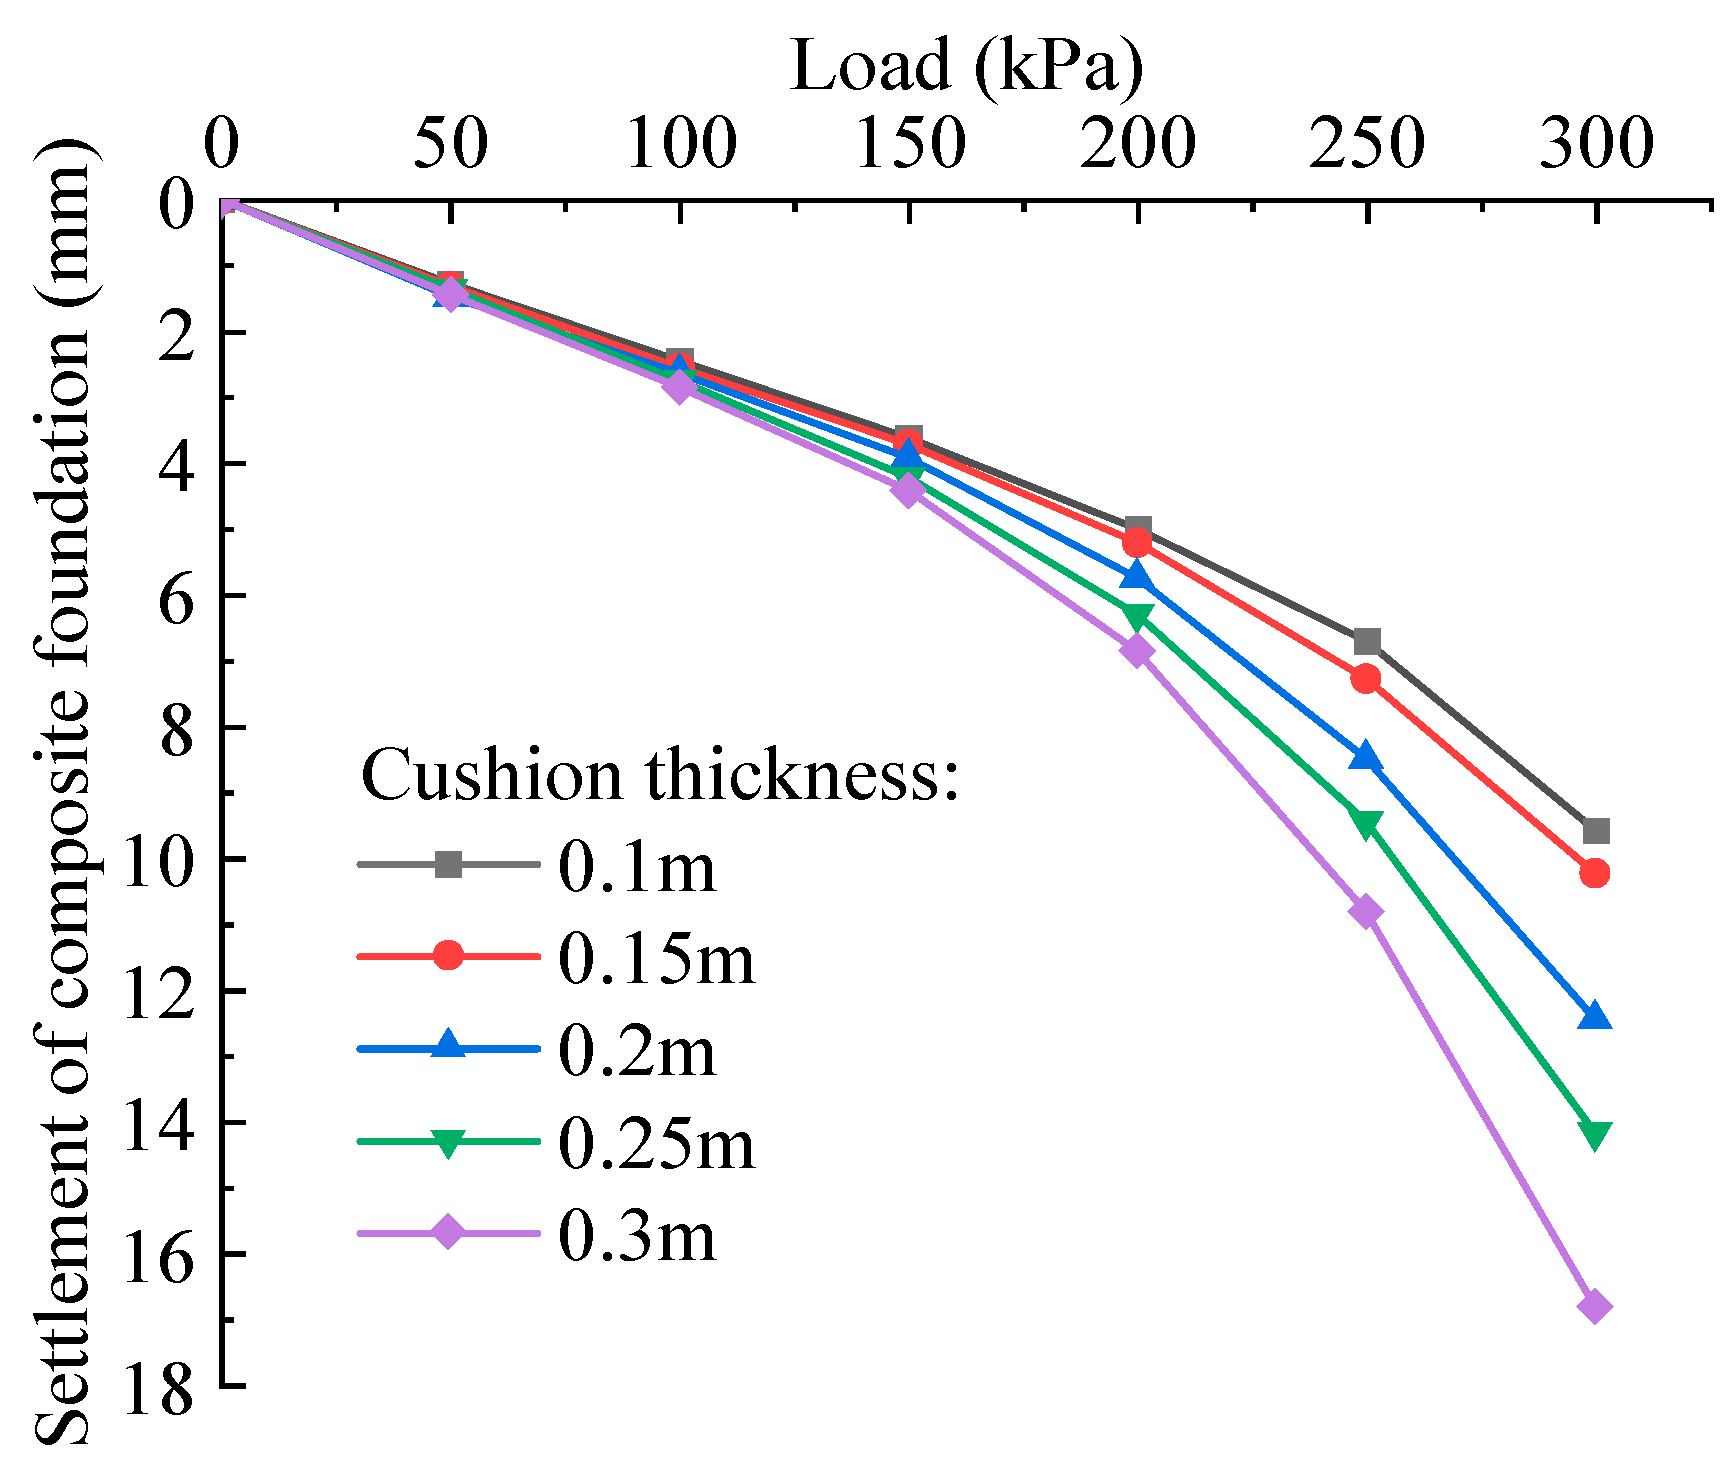
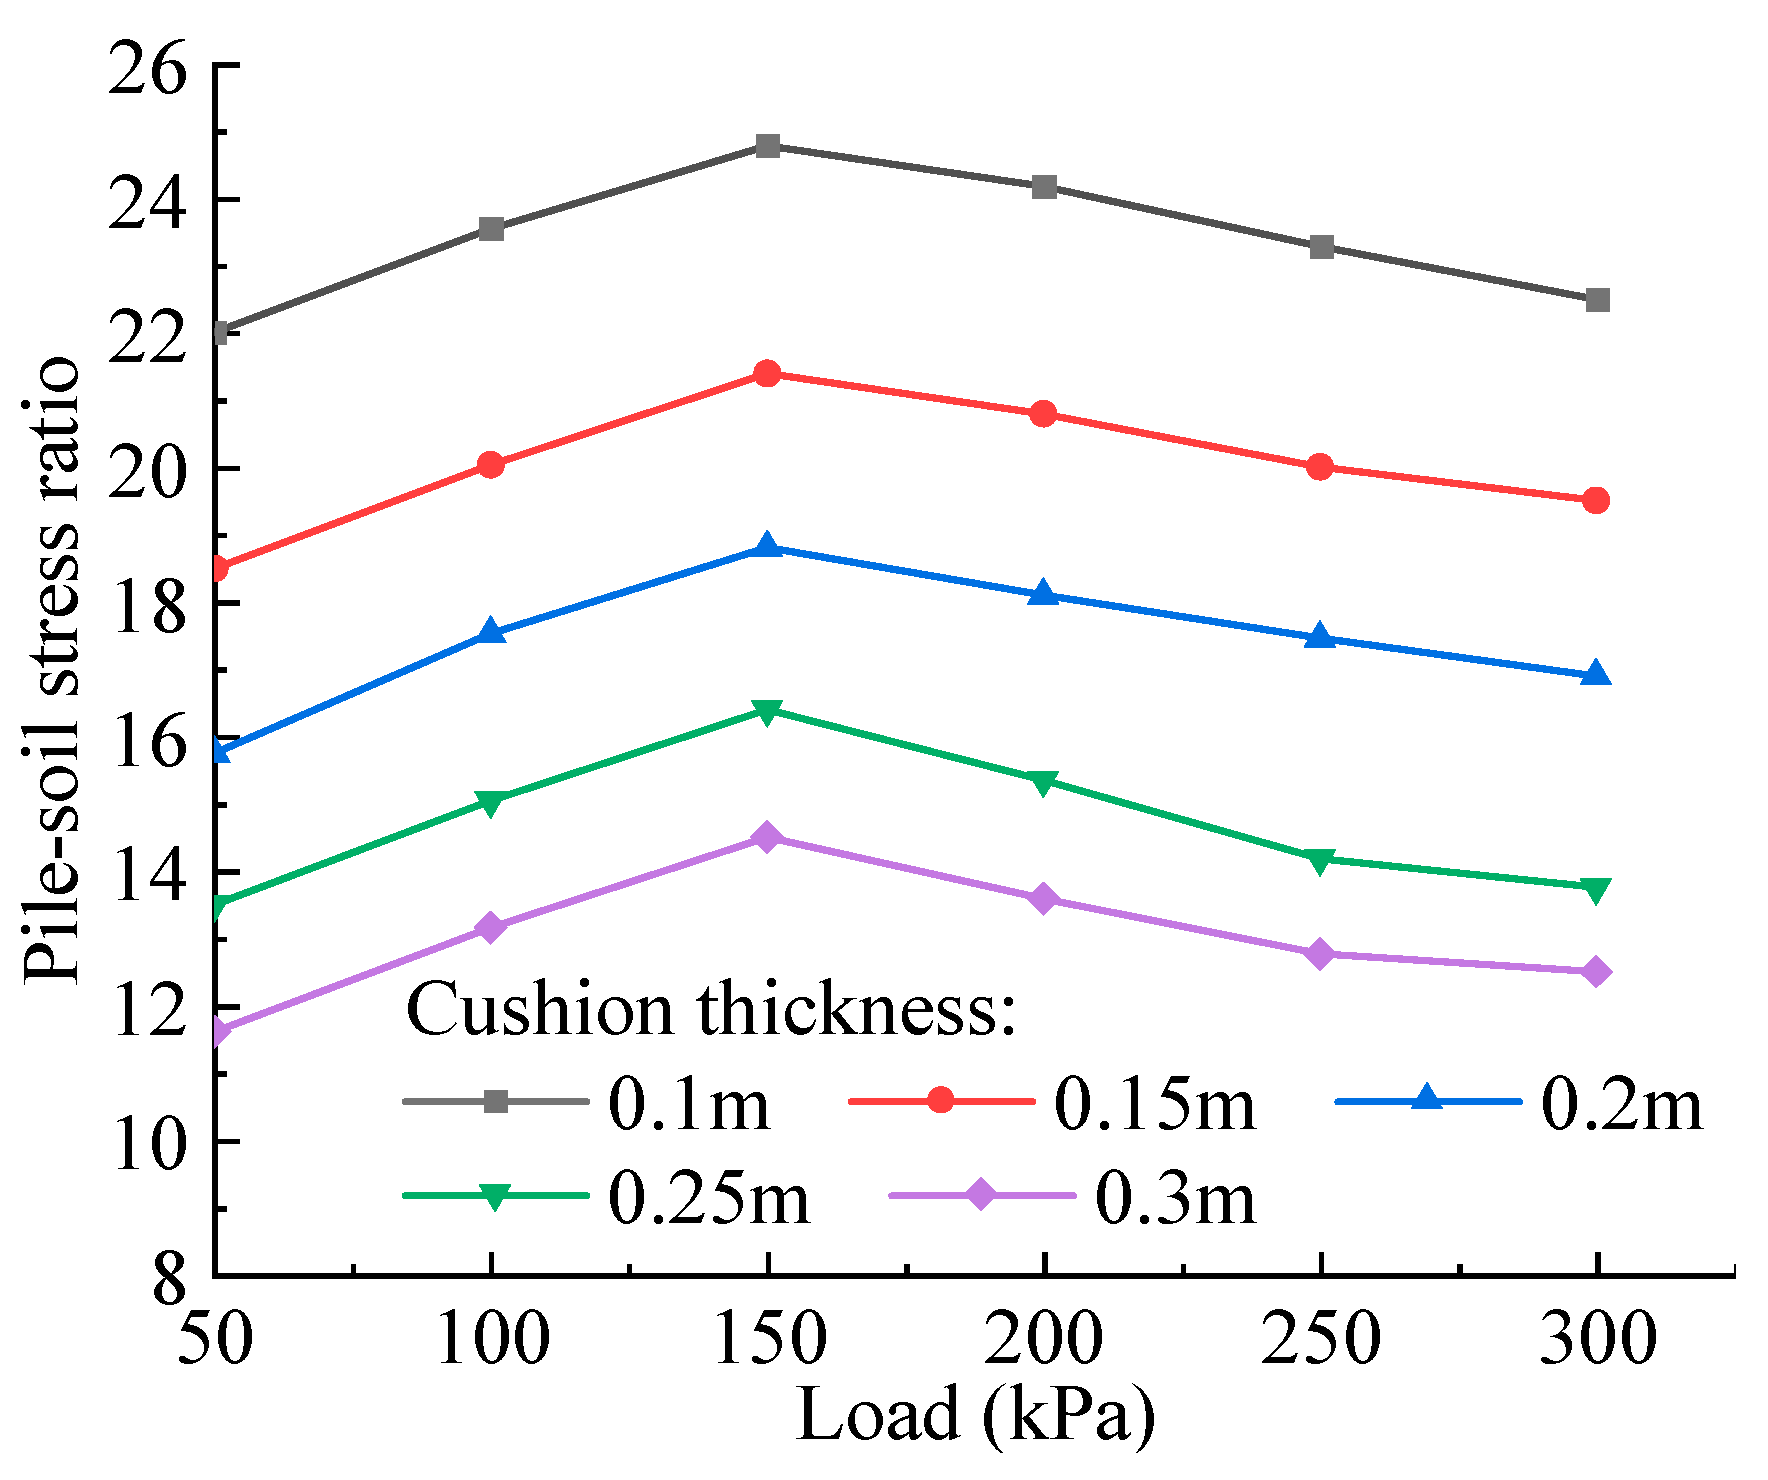
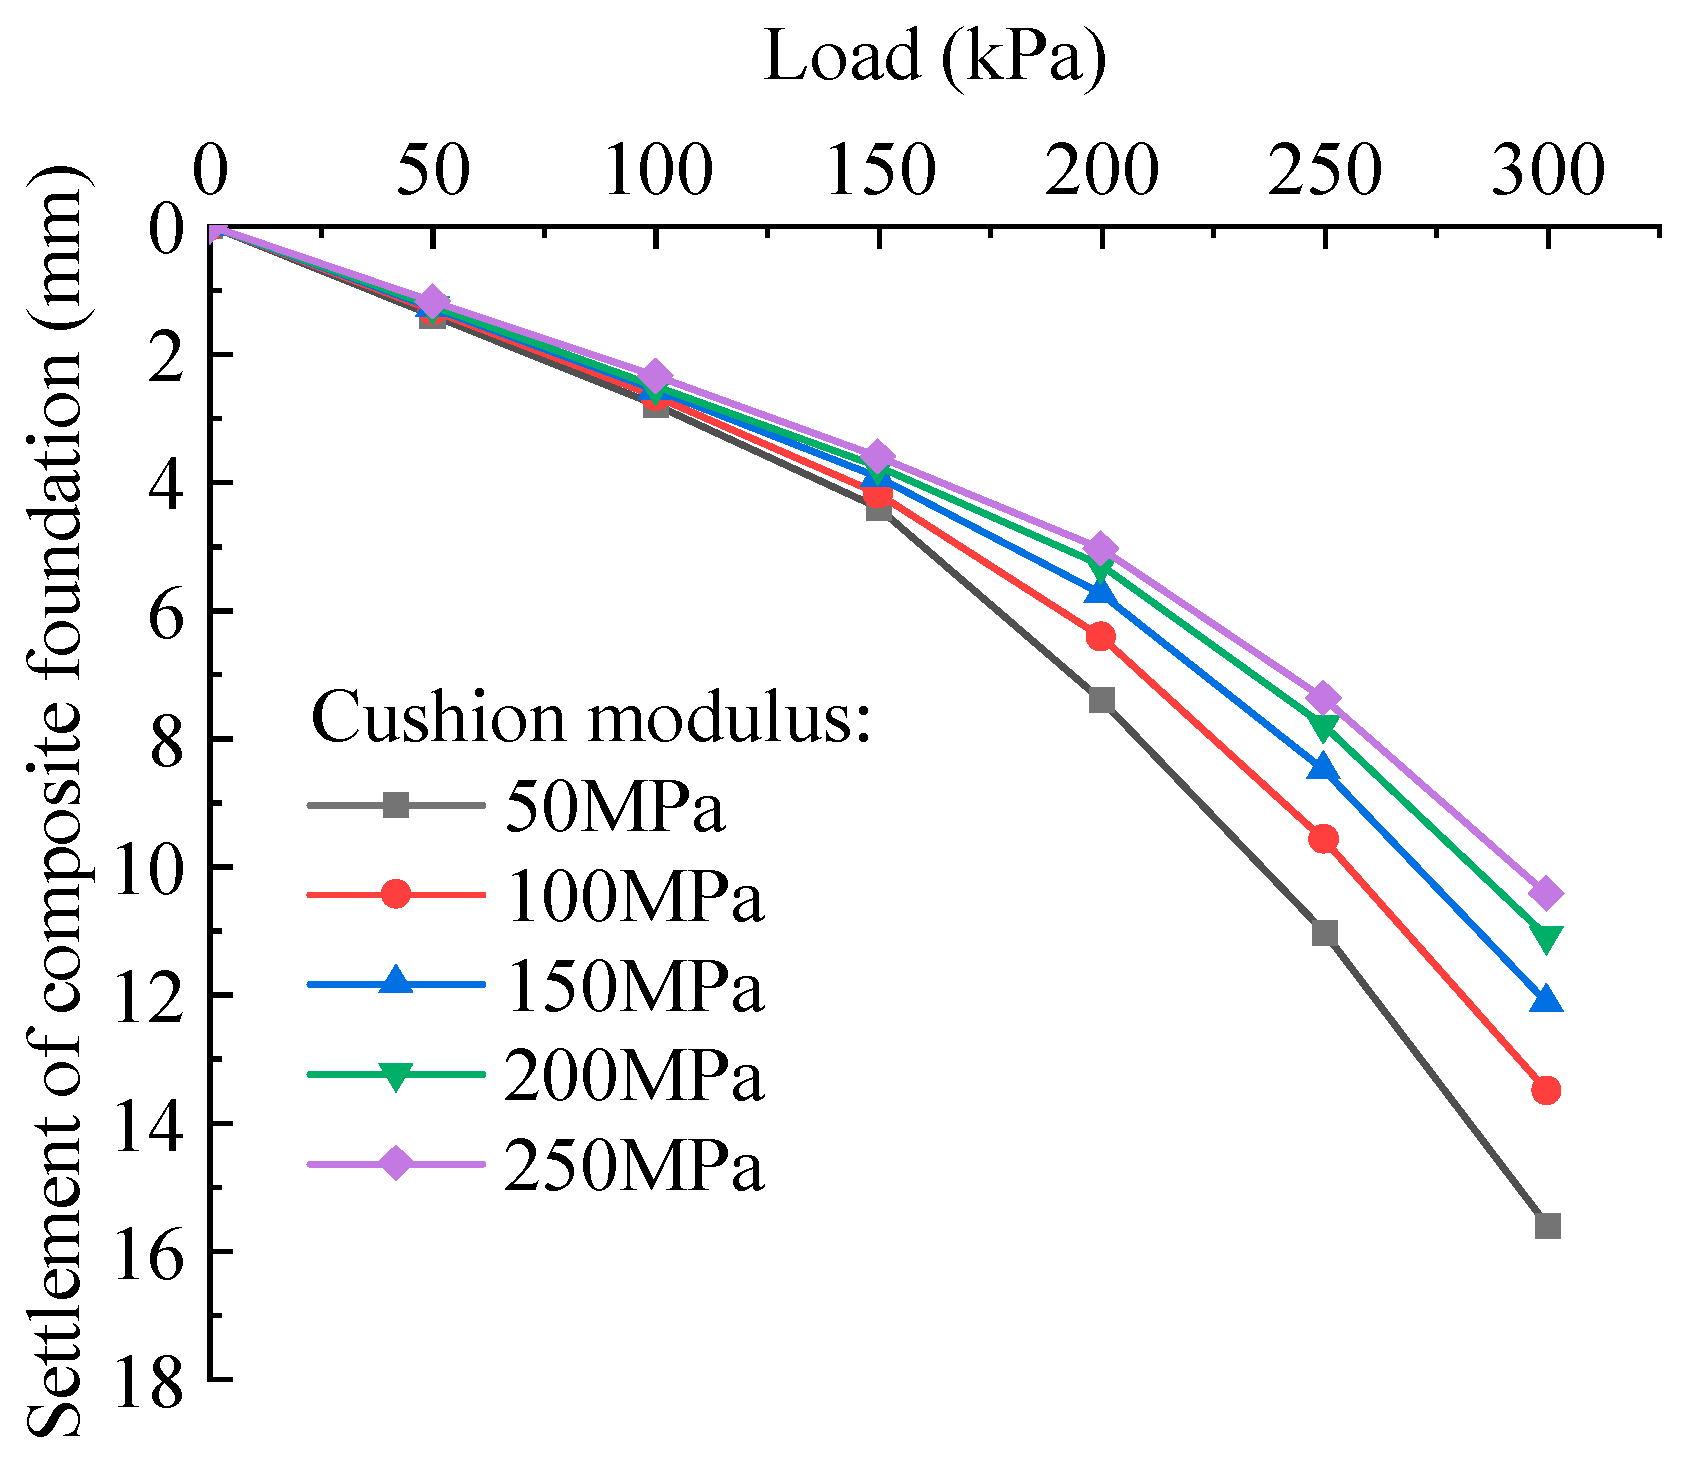
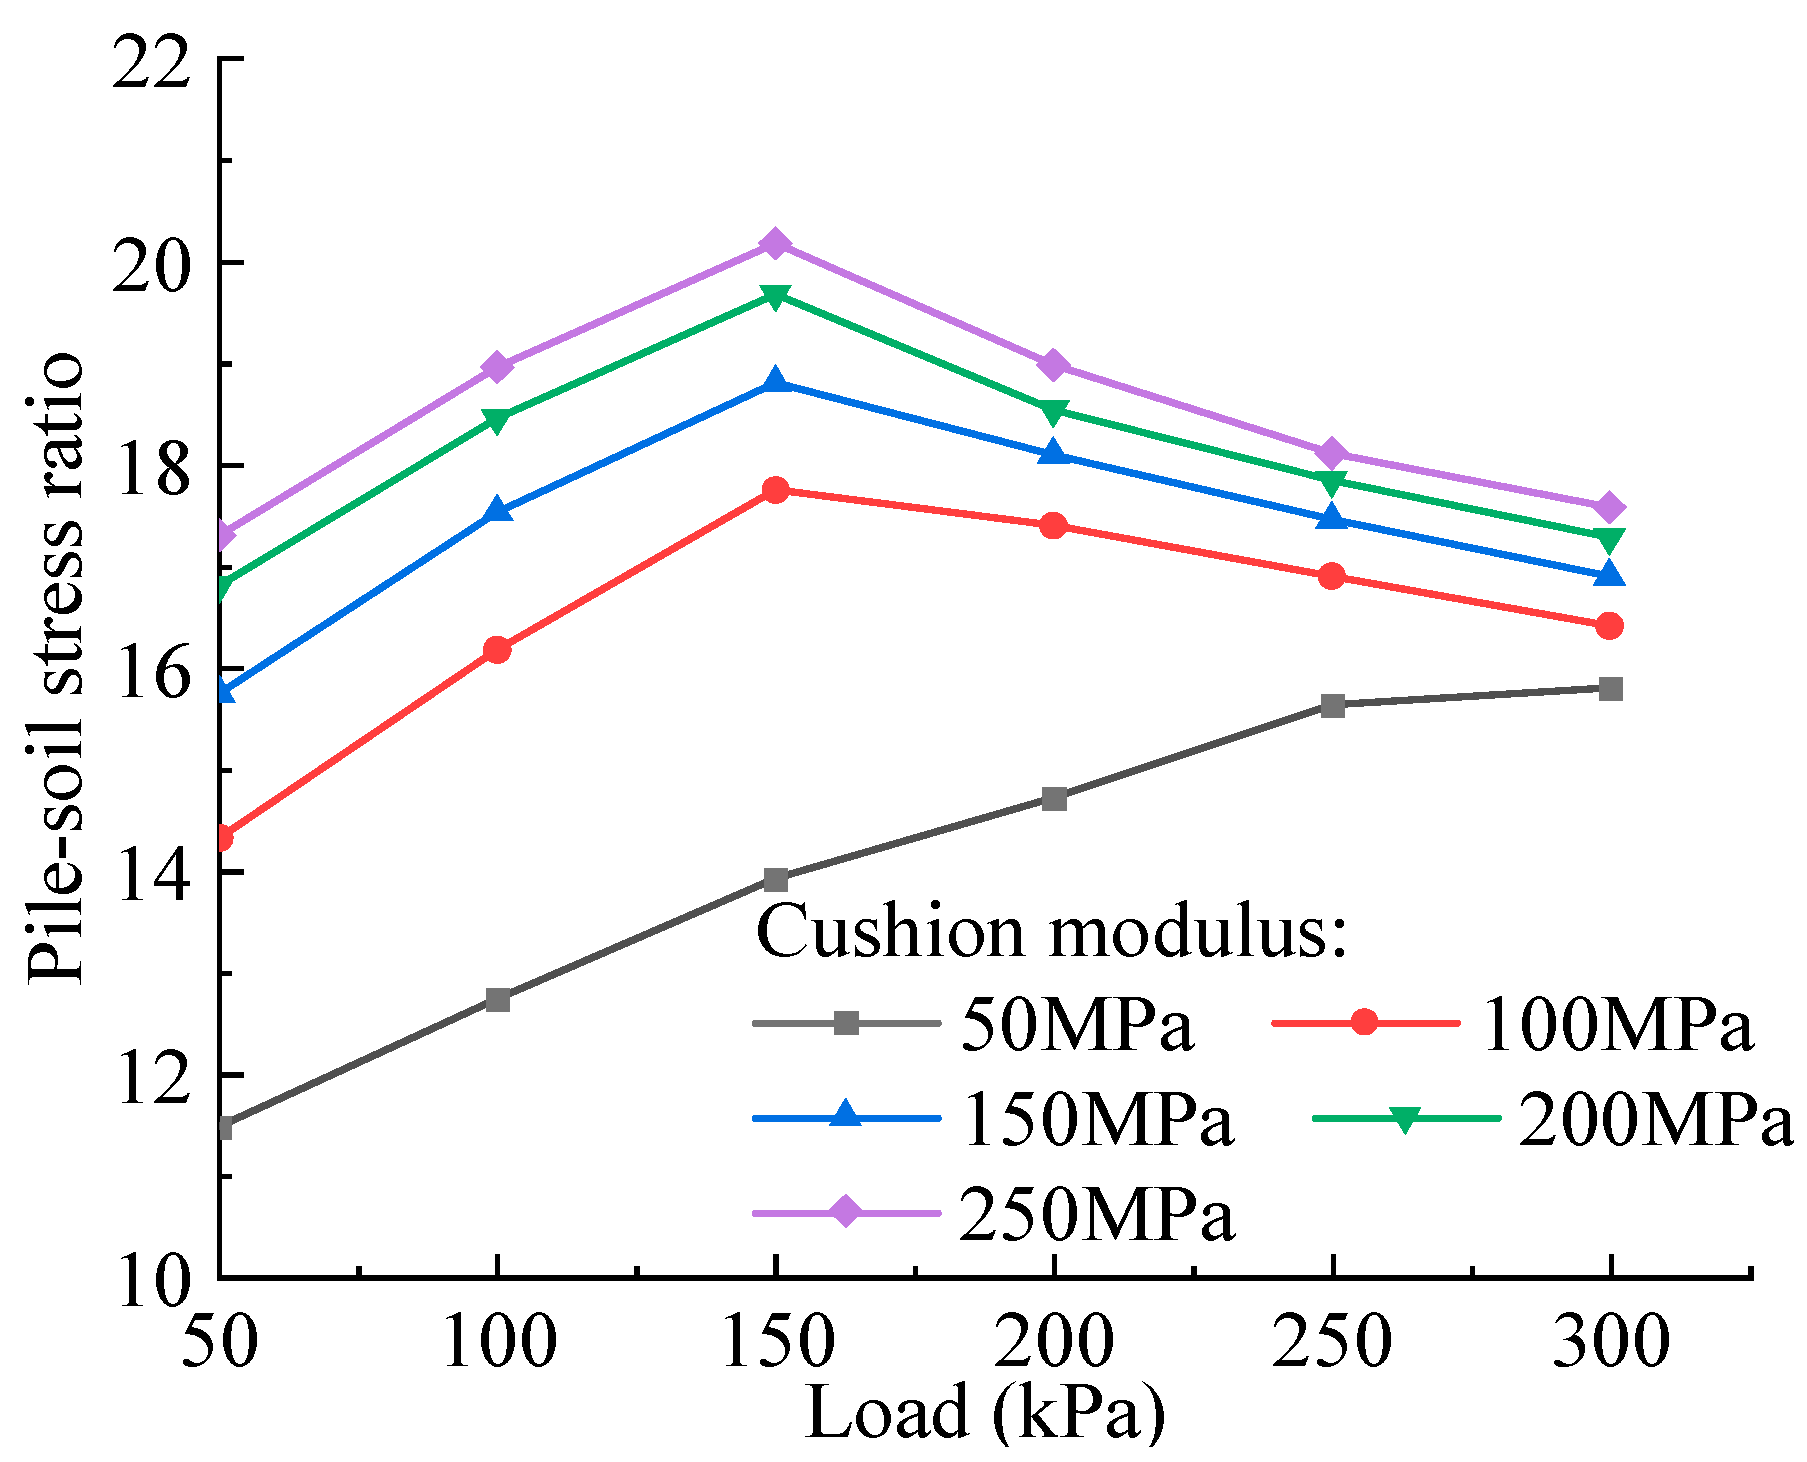
4.3. Influence of the Parameters of Cushion

According to the “Technical Specification for Composite Foundation” (GB/T 50783-2012 [26]), the cushion thickness for rigid pile composite foundations should be set between 150 and 300 mm. In this study, the influence of cushion thickness was analyzed for values of 0.1 m, 0.15 m, 0.2 m, 0.25 m, and 0.3 m, with other parameters kept constant. The simulation results are shown in Figure 20 and Figure 21.
Figure 20 shows the influence of load on the settlement of composite foundations with different cushion thicknesses. The figure indicates that the settlement of composite foundations increases with increasing load for all cushion thicknesses. Additionally, under the same load conditions, the settlement increases with increasing cushion thickness, especially when the load exceeds 150 kPa. Further analysis of the settlement at a load of 300 kPa shows that as the cushion thickness increases from 0.1 m to 0.3 m, the settlement increases from 9.58 mm to 16.83 mm, a rise of 75.68%.
Figure 21 shows the influence of load on the pile–soil stress ratio for different cushion thicknesses. The figure indicates that the pile–soil stress ratio decreases with increasing cushion thickness. More load is transferred to the inter-pile soil as the cushion thickness increases. The increase in cushion thickness helps to regulate the load distribution between the pile and soil, leading to a decrease in the pile–soil stress ratio. Therefore, when designing composite foundations, selecting an appropriate cushion thickness is necessary to minimize foundation settlement while reducing the load borne by the pile.
When designing the cushion layer for composite foundations, well-graded medium-dense sand or gravel is recommended [24]. This study analyzed the influence of cushion modulus for values of 50 MPa, 100 MPa, 150 MPa, 200 MPa, and 250 MPa, with other parameters kept constant. The simulation results are shown in Figure 22 and Figure 23.
Figure 22 shows the influence of load on the settlement of composite foundations with different cushion moduli. The figure indicates that the settlement of composite foundations increases with increasing load for all cushion moduli. However, under the same load, the settlement decreases as the cushion modulus increases. When the load exceeds 150 kPa, the differences in settlement among the various cushion moduli become more significant. Further analysis of the settlement at a load of 300 kPa shows that as the cushion modulus increases from 50 MPa to 250 MPa, the settlement decreases from 15.6 mm to 10.43 mm, a reduction of 33.14%. Therefore, increasing the cushion modulus can reduce the settlement of composite foundations; however, the effect on lowering settlement is limited.
Figure 23 shows the influence of load on the pile–soil stress ratio for different cushion moduli. The figure indicates that when the cushion modulus is 50 MPa, the pile–soil stress ratio increases with increasing load. In contrast, for cushion moduli of 100 MPa, 150 MPa, 200 MPa, and 250 MPa, the pile–soil stress ratio initially increases and then decreases. Further analysis shows that the pile–soil stress ratio rises as the cushion modulus increases. A higher cushion modulus makes the cushion layer more rigid, causing the pile to bear more load and reducing the stress in the inter-pile soil. This leads to an increase in the pile–soil stress ratio. Therefore, when designing composite foundations, both settlement control and pile–soil stress ratio optimization should be considered when selecting a reasonable cushion modulus.
The inter-pile soil modulus was adjusted to 20 MPa, 25 MPa, 30 MPa, 35 MPa, and 40 MPa, with other parameters remaining constant. The simulation results are shown in Figure 24 and Figure 25.
Figure 24 shows the influence of load on the settlement of composite foundations with different inter-pile soil moduli. The figure indicates that the settlement of composite foundations increases with increasing load for all inter-pile soil moduli. Additionally, under the same load, the settlement decreases as the inter-pile soil modulus increases. Further analysis of the settlement at a load of 300 kPa shows that as the inter-pile soil modulus increases from 20 MPa to 40 MPa, the settlement decreases from 21.42 mm to 9.62 mm, a reduction of approximately 55.17%. This demonstrates that as the inter-pile soil modulus increases, the stress concentration in the pile is alleviated, the stiffness of the foundation is enhanced, the compressibility of the soil is effectively reduced, and the bearing capacity is increased, resulting in a decrease in foundation settlement.
Figure 25 shows the influence of load on the pile–soil stress ratio for different inter-pile soil moduli. The figure indicates that the pile–soil stress ratio increases and decreases with increasing load. Under the same load, the pile–soil stress ratio decreases as the inter-pile soil modulus increases. When the load is less than 150 kPa, the differences in the pile–soil stress ratio among different inter-pile soil moduli are minimal, and the pile–soil stress ratio increases linearly with increasing load.

5. Conclusions

(1) When the water-to-cement ratio is 0.3, the porosity is closest to the designed value. This mix proportion effectively controls the porosity.
(2) Higher designed porosity leads to lower material compressive strength. As the water-to-cement ratio increases, the compressive strength first increases and then decreases, with the optimal ratio being 0.3. Regarding permeability, specimens with higher designed porosity have more significant permeability coefficients. As the water-to-cement ratio increases, the permeability coefficient gradually decreases.
(3) Permeable concrete piles accelerate the foundation’s radial and vertical seepage through interconnected pores. This enhances the consolidation process, effectively reducing settlement while increasing the foundation’s overall bearing capacity and the pile side friction of the piles. As a result, they perform better under higher loads. During the loading process of the foundation soil, the pile initially bears more of the load. As the soil consolidates and its bearing capacity increases, the foundation soil gradually takes on more load.
(4) The settlement and pile–soil stress ratio of permeable concrete pile composite foundations are influenced by the cushion modulus, inter-pile soil modulus, and pile modulus. The settlement of the composite foundation increases with increasing pile length, pile diameter, cushion modulus, inter-pile soil modulus, and pile modulus. However, it decreases with increasing cushion thickness, pile length, and pile diameter.

Author Contributions

Conceptualization, H.L. and X.B.; Methodology, X.B.; Formal analysis, S.Y. and H.Z.; Investigation, S.Y.; Resources, H.Z.; Data curation, S.Y.; Writing—original draft, S.Y.; Writing—review and editing, H.L. and H.Z.; Supervision, X.B.; Funding acquisition, H.L. All authors have read and agreed to the published version of the manuscript.

Funding

The authors gratefully acknowledge the financial support from the National Natural Science Foundation of China (52478359, 52308373, 52078396).

Institutional Review Board Statement

Not applicable.

Informed Consent Statement

Not applicable.

Data Availability Statement

The original contributions presented in this study are included in the article. Further inquiries can be directed to the corresponding author.

Conflicts of Interest

The authors declare no conflicts of interest.

References

  1. Monkul, M.M.; Yamamuro, J.A. Influence of silt size and content on liquefaction behavior of sands. Can. Geotech. J. 2011, 48, 931–942. [Google Scholar] [CrossRef]
  2. Zhang, J.Z.; Huang, H.; Bi, H. Land subsidence in the modern Yellow River Delta based on InSAR time series analysis. Nat. Hazards 2015, 75, 2385–2397. [Google Scholar] [CrossRef]
  3. Jiang, X.Y.; Lu, Q.R.; Chen, S.J.; Dai, R.H.; Gao, J.H. Research progress of soft soil foundation treatment technology. IOP Conf. Ser. Earth Environ. Sci. 2020, 455, 012081. [Google Scholar] [CrossRef]
  4. Wu, X.T.; Kang, W.L.; Yuan, Z.; Liang, J.X.; Zhao, W.F. Experimental study of the bearing capacity of a drainage pipe pile under vacuum consolidation. J. Zhejiang Univ. Sci. A 2022, 23, 639–651. [Google Scholar] [CrossRef]
  5. Uba, B.U.; Cheng, G.Y. CFG Pile Composite Foundation: Its Engineering Applications and Research Advances. J. Eng. 2020, 2020, 5343472. [Google Scholar] [CrossRef]
  6. Wu, Y.P.; Zhang, K.N.; Fu, L.M.; Liu, J.; He, J. Performance of cement–soil pile composite foundation with lateral constraint. Arab. J. Sci. Eng. 2019, 44, 4693–4702. [Google Scholar] [CrossRef]
  7. Fu, Q.H.; Li, L.X. Vertical load transfer behavior of composite foundation and its responses to adjacent excavation: Centrifuge model test. Geotech. Test. J. 2021, 44, 191–204. [Google Scholar] [CrossRef]
  8. He, J.B.; Hong, B.N.; Qiu, G.F. Research on cushion action mechanism of CFG pile composite foundation for expressway. Rock Soil Mech. 2004, 15, 243–245. [Google Scholar] [CrossRef]
  9. Zhang, J.W.; Dai, Z.H. Finite element analysis of functions of cushion of cement flyash gravel pile composite foundation. Rock Soil Mech. 2005, 79, 882–888. [Google Scholar] [CrossRef]
  10. Lian, C.; Zhuge, Y. Optimum mix design of enhanced permeable concrete—An experimental investigation. Constr. Build. Mater. 2010, 24, 2664–2671. [Google Scholar] [CrossRef]
  11. Behlul, O.F.; Seyma, S.; Yusa, S. The effects of aggregate and fiber characteristics on the properties of pervious concrete. Constr. Build. Mater. 2022, 356, 129294. [Google Scholar] [CrossRef]
  12. Singh, B.S.; Murugan, M. A review of factors influencing performance of pervious concrete. Seeni Bright. Singh Madasamy Murugan 2021, 73, 1017–1030. [Google Scholar] [CrossRef]
  13. Huang, J.L.; Luo, Z.B.; Khan, M.B.E. Impact of aggregate type and size and mineral admixtures on the properties of pervious concrete: An experimental investigation. Constr. Build. Mater. 2020, 265, 120759. [Google Scholar] [CrossRef]
  14. Zhang, G.F.; Wang, S.X.; Wang, B.; Zhao, Y.J.; Kang, M. Properties of pervious concrete with steel slag as aggregates and different mineral admixtures as binders. Constr. Build. Mater. 2020, 257, 119543. [Google Scholar] [CrossRef]
  15. JGJ 52-2006; Standard for Quality and Testing Methods of Sand and Stone for Ordinary Concrete. China Architecture& Building Press: Beijing, China, 2006.
  16. CJJ/T 135-2009; Technical Code for Pervious Cement Concrete Pavements. Ministry of Housing and Urban-Rural Development of the People’s Republic of China: Beijing, China, 2009.
  17. GB/T 50081-2019; Standard for Test Methods of Physical and Mechanical Properties of Concrete. China Architecture& Building Press: Beijing, China, 2019.
  18. Sriravindrarajah, R.; Wang, N.D.H.; Ervin, L.J.W. Mix Design for Pervious Recycled Aggregate Concrete. Int. J. Concr. Struct. Mater. 2012, 6, 239–246. [Google Scholar] [CrossRef]
  19. Chen, Q.; Wang, C.; Wen, P.; Wang, M.H.; Zhao, J.X. Comprehensive performance evaluation of low-carbon modified asphalt based on efficacy coefficient method. J. Clean. Prod. 2018, 203, 633–644. [Google Scholar] [CrossRef]
  20. Wang, Y.; Jing, H.; Han, L.; Yu, L.Y.; Zhang, Q. Risk analysis on swell–shrink capacity of expansive soils with efficacy coefficient method and entropy coefficient method. Appl. Clay Sci. 2014, 99, 275–281. [Google Scholar] [CrossRef]
  21. Wang, Z.S.; Wang, L.J.; Hao, L.; Su, Z.L. Optimization of coarse aggregate content based on efficacy coefficient method. J. Wuhan Univ. Technol. Mater. Sci. Ed. 2011, 26, 329–334. [Google Scholar] [CrossRef]
  22. Zhang, H.Z.; Yan, Y.H.; Cui, X.Q. Optimization of self-insulating regenerated concrete mix ratio based on total efficacy coefficient method. Sichuan Build. Sci. Res. 2017, 43, 112–115. [Google Scholar] [CrossRef]
  23. Cai, J.; Du, G.; Xia, H.; Sun, C. Model Test and Numerical Simulation Study on Bearing Characteristics of Pervious Concrete Pile Composite Foundation. KSCE J. Civ. Eng. 2021, 25, 3679–3690. [Google Scholar] [CrossRef]
  24. Meng, D.Q. Discussion on China’s Soft Soil Zoning and Its Statistical Characteristics of Parameters. Master’s Thesis, Railway University, Shijiazhuang, China, 2020. [Google Scholar] [CrossRef]
  25. Itasca Consulting Group, Inc. FLAC3D (Fast Largrangian Analysis of Continua in 3 Dimention) User Manuals; Version 5.0; Itasca Consulting Group, Inc.: Minneapolis, MN, USA, 2012; Volume 8. [Google Scholar]
  26. GB/T 50783-2012; Technical Specifications for Composite Foundation. China Architecture & Building Press: Beijing, China, 2012.
Figure 1. Experimental procedure: (a) compression testing machine; (b) principle of permeability test; (c) permeation schematic.
Applsci 15 04835 g001aApplsci 15 04835 g001b
Figure 2. Relationship between actual porosity and designed porosity.
Applsci 15 04835 g002
Figure 3. Influence of water–cement ratio on compressive strength.
Applsci 15 04835 g003
Figure 4. Influence of water-to-cement ratio on permeability coefficient.
Applsci 15 04835 g004
Figure 5. Finite difference modeling and meshing.
Applsci 15 04835 g005
Figure 6. Model contact surface setup.
Applsci 15 04835 g006
Figure 7. Layout of pore pressure monitoring points.
Applsci 15 04835 g007
Figure 8. Pore pressure contour map of pile composite foundation (Pa): (a) head differences in radial and vertical directions; (b) hydraulic head difference in the vertical direction.
Applsci 15 04835 g008
Figure 9. Load–settlement curve of composite foundation.
Applsci 15 04835 g009
Figure 10. Axial force in pervious concrete piles: (a) axial force distribution along the pervious concrete pile; (b) comparison of axial forces in piles.
Applsci 15 04835 g010
Figure 11. Side friction of the piles of the pervious concrete piles: (a) distribution of side friction in pervious concrete piles; (b) comparison of the side friction of the piles.
Applsci 15 04835 g011
Figure 12. Comparison of pile–soil stress ratios.
Applsci 15 04835 g012
Figure 13. Comparison of pile load-sharing ratios.
Applsci 15 04835 g013
Figure 14. Influence of loads on settlement under different pile lengths.
Applsci 15 04835 g014
Figure 15. Influence of loads on pile–soil stress ratio under different pile lengths.
Applsci 15 04835 g015
Figure 16. Influence of loads on settlement under different pile diameters.
Applsci 15 04835 g016
Figure 17. Influence of loads on pile–soil stress ratio under different pile diameters.
Applsci 15 04835 g017
Figure 18. Influence of loads on settlement under different pile moduli.
Applsci 15 04835 g018
Figure 19. Influence of loads on pile–soil stress ratio under different pile moduli.
Applsci 15 04835 g019
Figure 20. Influence of loads on settlement under different cushion thicknesses.
Applsci 15 04835 g020
Figure 21. Influence of loads on pile–soil stress ratio under different cushion thicknesses.
Applsci 15 04835 g021
Figure 22. Influence of loads on settlement under different cushion moduli.
Applsci 15 04835 g022
Figure 23. Influence of loads on pile–soil stress ratio under different cushion moduli.
Applsci 15 04835 g023
Figure 24. Influence of loads on settlement under different soil moduli between piles.
Applsci 15 04835 g024
Figure 25. Influence of loads on pile–soil stress ratio under different soil moduli between piles.
Applsci 15 04835 g025
Table 1. Basic physical parameters of aggregate.
Particle Size
(mm)
Apparent Density
(kg/m3)
Bulk Density
(kg/m3)
Water Absorption Rate
(%)
Crush Value
(%)
4.75–9.50270015200.68.7
Table 2. Calculation results of total efficacy coefficient.
Serial NumberWater–Cement RatioDesign Porosity
(%)
Efficacy Coefficient
(Compressive Strength)
Efficacy Coefficient
(Permeability Coefficient)
Total Coefficient of Efficacy
PC-10.25200.830.460.62
PC-20.25250.600.620.61
PC-30.25300.470.840.63
PC-40.25350.251.000.50
PC-50.3201.000.400.63
PC-60.3250.750.520.63
PC-70.3300.610.720.67
PC-80.3350.460.910.65
PC-90.35200.880.350.55
PC-100.35250.670.480.56
PC-110.35300.530.620.57
PC-120.35350.340.800.52
Table 3. Optimal mix proportion of permeable concrete.
Cement (kg/m3)Coarse Bone Material (kg/m3)Water (kg/m3)Water Reducing Agent (kg/m3)
219.721502.166.422.00
Table 4. Model parameters.
CategoryDensity
(ρ/g∙cm−3)
E (MPa)vc (kPa)φ (°)Permeability Coefficient
(k/cm∙s−1)
Porosity
Cap2.42.0 × 1040.20----
Cushion2.01500.300355.0 × 10−30.50
Soil1.9200.3530171.0 × 10−60.65
Pile2.11.5 × 1040.20--0.6110.30
Table 5. Parameters of the interface.
Interface Namekn (GPa/m)ks (GPa/m)c (kPa)f (°)
Pile cap–cushion 33103310//
Cushion–pile 21502150//
Cushion–soil 580580//
Pile–soil 144014402111.9
Disclaimer/Publisher’s Note: The statements, opinions and data contained in all publications are solely those of the individual author(s) and contributor(s) and not of MDPI and/or the editor(s). MDPI and/or the editor(s) disclaim responsibility for any injury to people or property resulting from any ideas, methods, instructions or products referred to in the content.

