Article

Deep-Space Background Low-Light Image Enhancement Method Based on Multi-Image Fusion

1
Xi’an Institute of Optics and Precision Mechanics, Chinese Academy of Sciences, Xi’an 710119, China
2
University of Chinese Academy of Sciences, Beijing 100049, China
3
Xi’an Key Laboratory of Spacecraft Optical Imaging and Measurement Technology, Xi’an 710119, China
*
Author to whom correspondence should be addressed.
Appl. Sci. 2025, 15(9), 4837; https://doi.org/10.3390/app15094837 (registering DOI)
Submission received: 6 March 2025 / Revised: 23 April 2025 / Accepted: 25 April 2025 / Published: 27 April 2025

Abstract

:
Existing low-light image enhancement methods often struggle to effectively enhance space targets in deep-space contexts due to the effects of extremely low illumination, stellar stray light, and Earth halos. This work proposes a low-light image enhancement method based on multi-image fusion, which integrates features of space targets with the Retinex theory. The method dynamically adjusts contrast by detecting luminance distribution and incorporates an adaptive noise removal mechanism for enhanced image quality. This method effectively balances detail enhancement with noise suppression. This work presents experiments on deep-space background images featuring 10 types of artificial satellites, including AcrimSat, Calipso, Jason, and others. Experimental results demonstrate that the proposed method outperforms traditional methods and mainstream deep learning models in qualitative and quantitative evaluations, particularly in suppressing Earth halo interference. This study establishes an effective framework for improving the visual quality of spacecraft images and provides important technical support for applications such as spacecraft identification, space target detection, and autonomous spacecraft navigation.

1. Introduction

With the rapid advancement of space technology, monitoring space targets has become essential for missions such as space situational awareness [1], autonomous spacecraft navigation, and space debris management [2,3]. However, imaging systems often encounter extremely low-light conditions and complicated background interference [4] when capturing space targets against deep space, leading to weak target signals that can easily be obscured by noise [2,5]. Existing low-light image enhancement methods do not adequately consider the specificity of the space environment, including traditional enhancement methods (e.g., histogram equalization [6,7,8], gamma correction [9,10], Retinex theory-based methods [11,12,13]) and deep learning-based models (e.g., RetinexFormer [14], NeRCo [15]), which are primarily designed for natural light scenarios and have been mainly applied in ground environments, both indoor and outdoor. Therefore, these methods have significant limitations when applied to low-light space scenes characterized by deep-space backgrounds. Enhancing target details in low-light images set against deep-space backgrounds, as well as effectively reducing the noise artifacts introduced by the enhancement, have become pressing challenges.
Satellite images typically include weak light sources from distant stars, as well as scattered light in deep space [4]. However, current enhancement methods [6,10,14,16] primarily focus on natural lighting scenes and often overlook weaker light sources, stray light, Earth halos, and other types of noise present in the space environment. Consequently, these methods serve to enhance the primary target while concurrently amplifying various forms of background interference, including but not limited to background noise, stray light, and atmospheric halos. This degradation adversely affects the visual quality of the image and can interfere with the accurate identification and assessment of targets, such as satellites. Additionally, the Earth itself plays a role in degrading image quality. When targets like artificial satellites are enhanced, the Earth’s portion of the image is also enhanced, leading to color distortion and brightness aberrations, which seriously affect the subsequent visual analysis, target detection, and other tasks.
To cope with the above problems, this study presents a low-light image enhancement method specifically designed for deep-space backgrounds, utilizing multi-image fusion. The method integrates spatial target features with Retinex theory [17], employing the RetinexFormer [14] deep learning model to preprocess the original image. After the preprocessing step, adaptive image enhancement is realized based on the luminance distribution detection mechanism to suppress and eliminate the noise, artifacts, etc., introduced during the preprocessing process. Subsequently, the satellite target region is extracted from the enhanced image, while the Earth region and deep-space background are extracted from the original image for multi-image fusion. This method effectively suppresses the Earth’s halo, avoids the color and brightness distortion of the Earth, increases the visible area of the target satellite, and significantly improves the detail quality of the image. Meanwhile, the edge detection extension module is designed to effectively avoid incomplete extraction of the target region and solve the problem of missing parts of the satellite target. This study establishes an effective framework for improving the visual quality of spacecraft images and provides important technical support for applications such as spacecraft identification and pose estimation [1,4], space target detection [2,4,5], space situational awareness, and accurate and efficient spacecraft docking [1,2,5]. The main contributions of this paper can be summarized as follows.
  • We propose a low-light image enhancement method for deep-space background based on multi-image fusion, which effectively solves the problem of Earth halo interference and color distortion through the steps of calculating segmentation thresholds and binarization processing, calculating halo ranges, extracting and separating halos, contouring analysis, and region optimization, and mask generation;
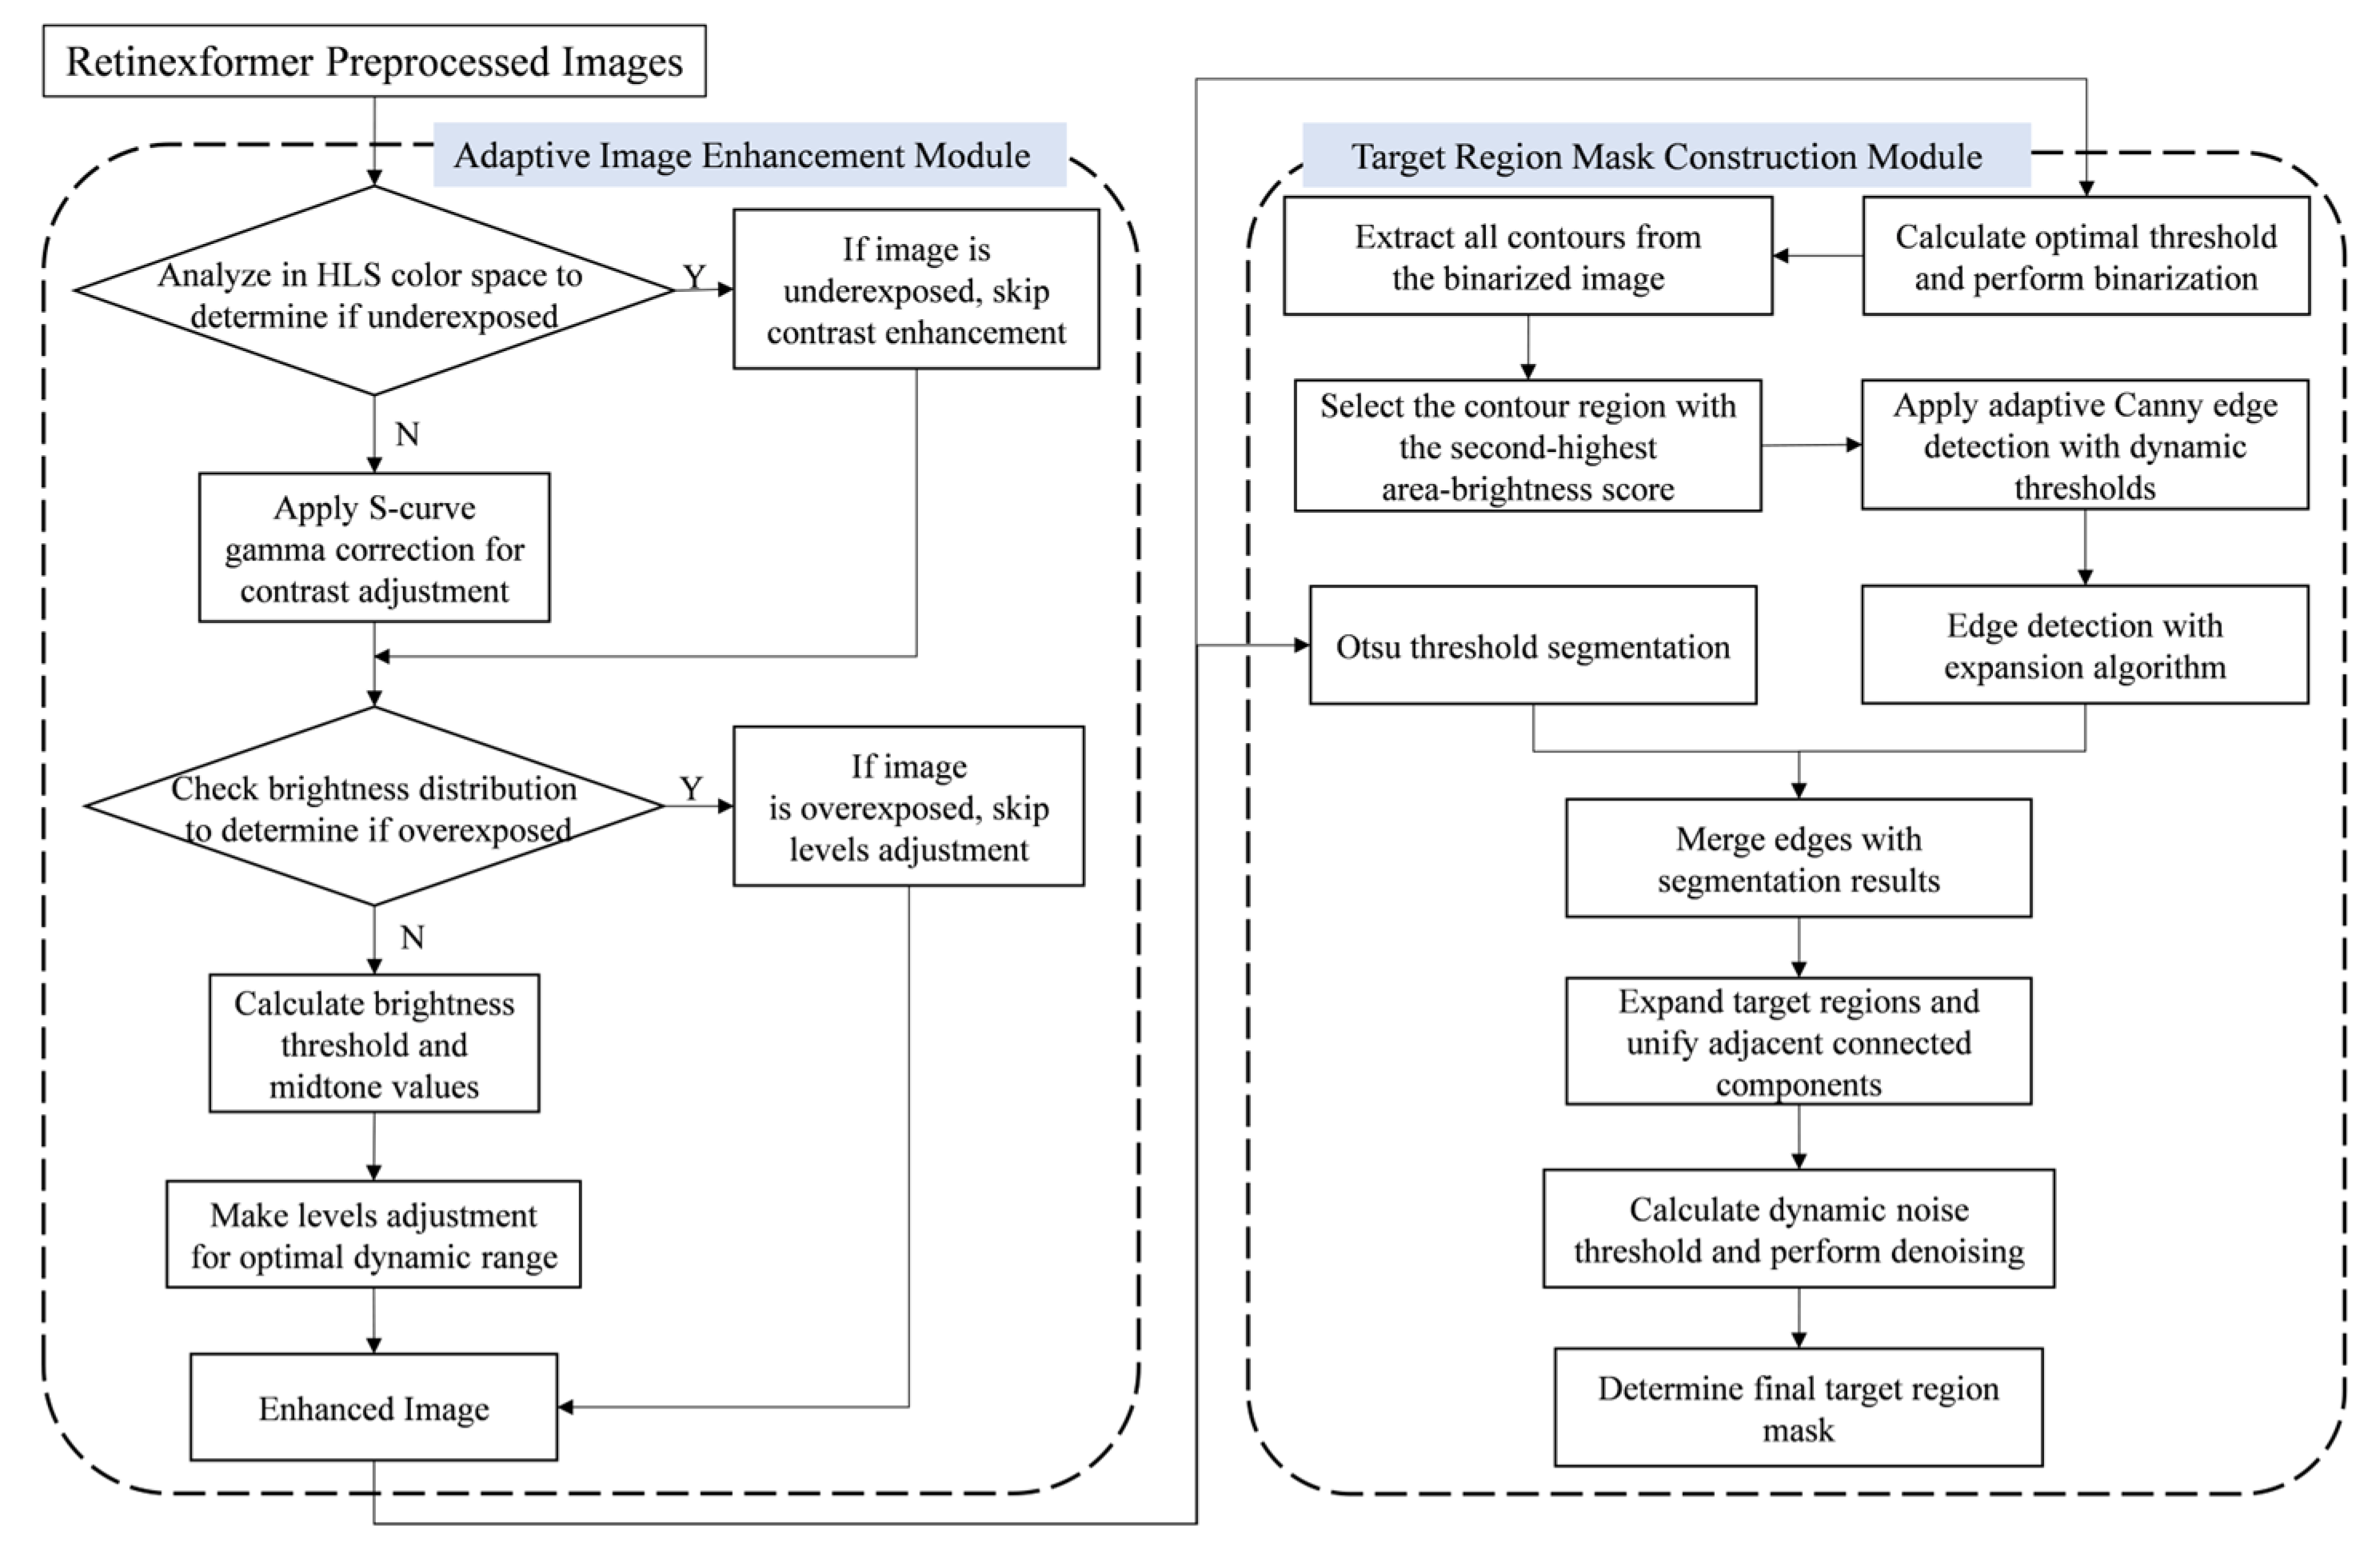
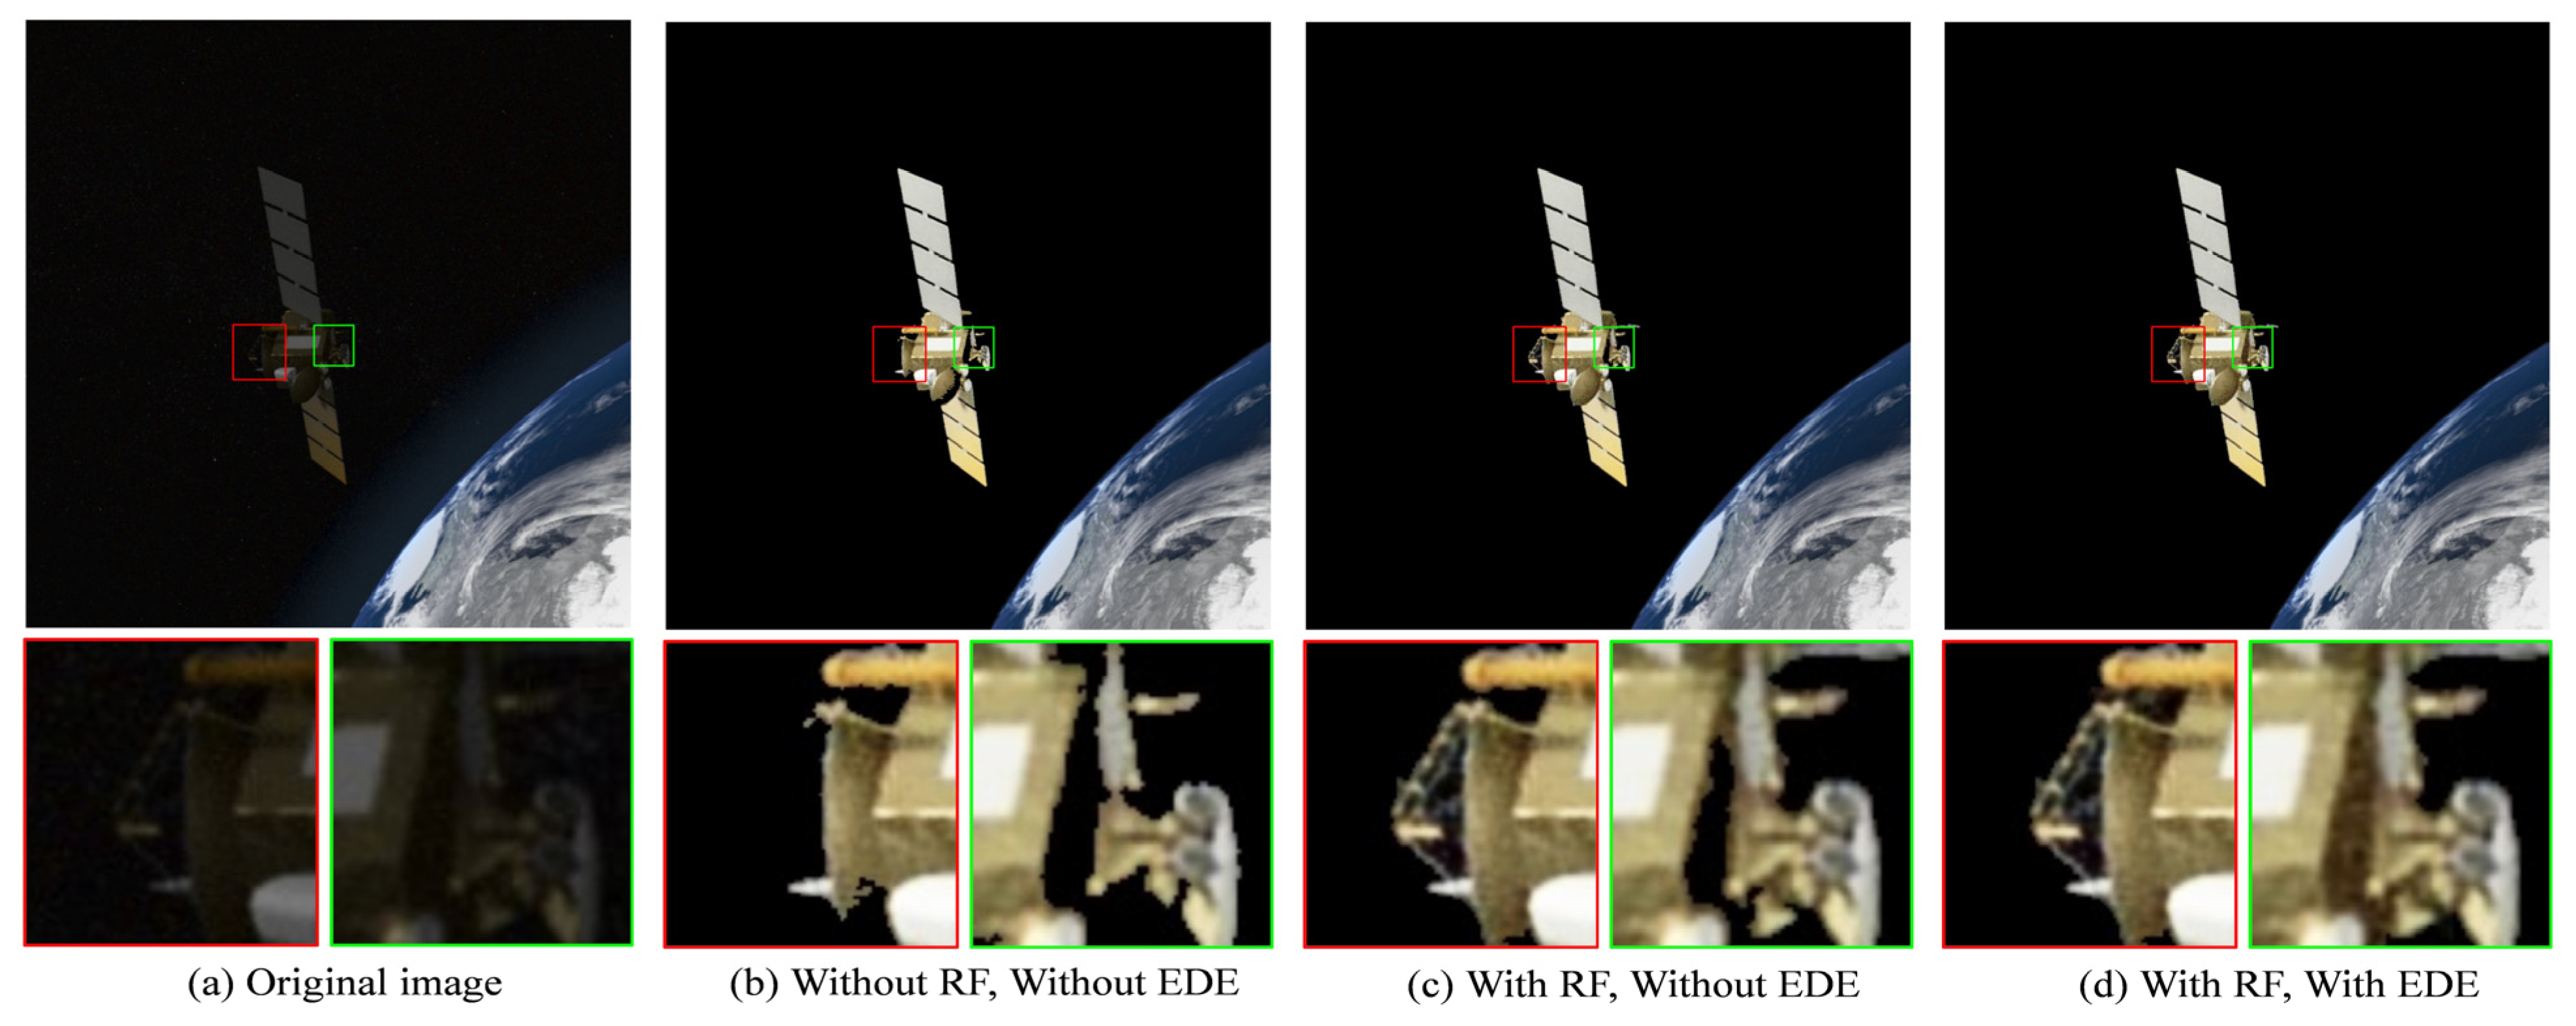
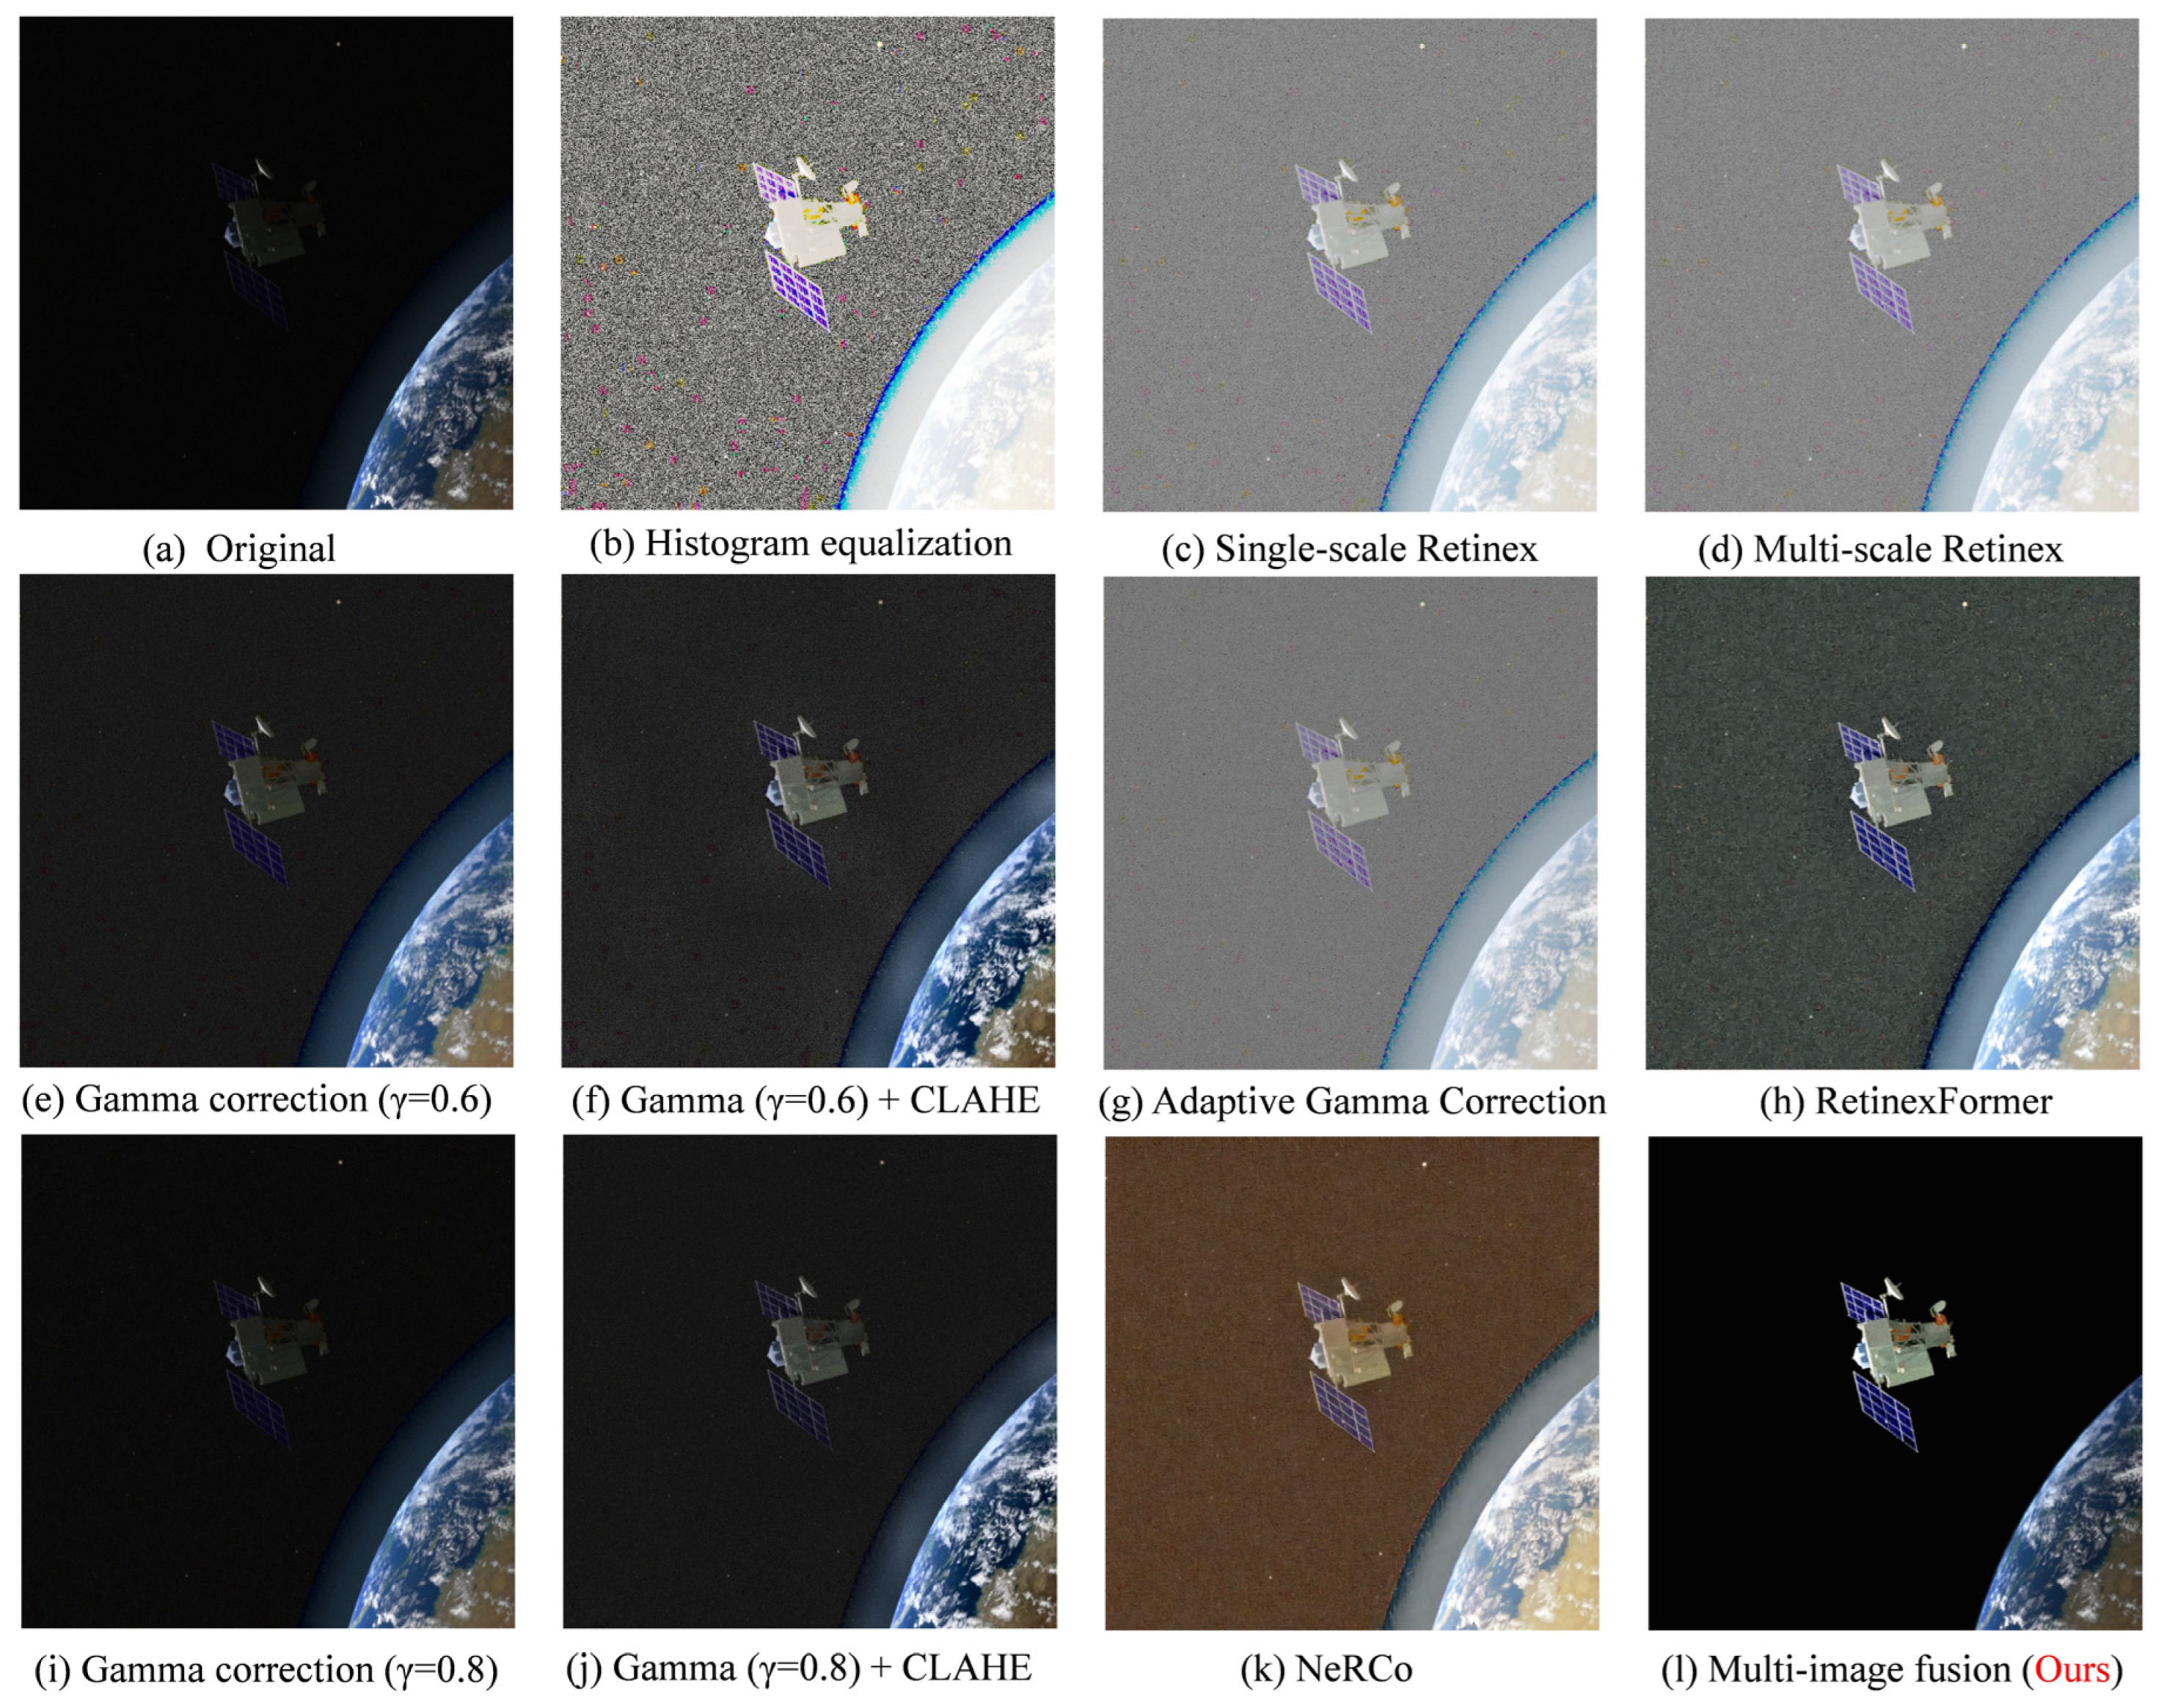
  • We design an adaptive enhancement module based on luminance distribution detection, which effectively suppresses and eliminates the noise and artifacts introduced in the image during the preprocessing of RetinexFormer;
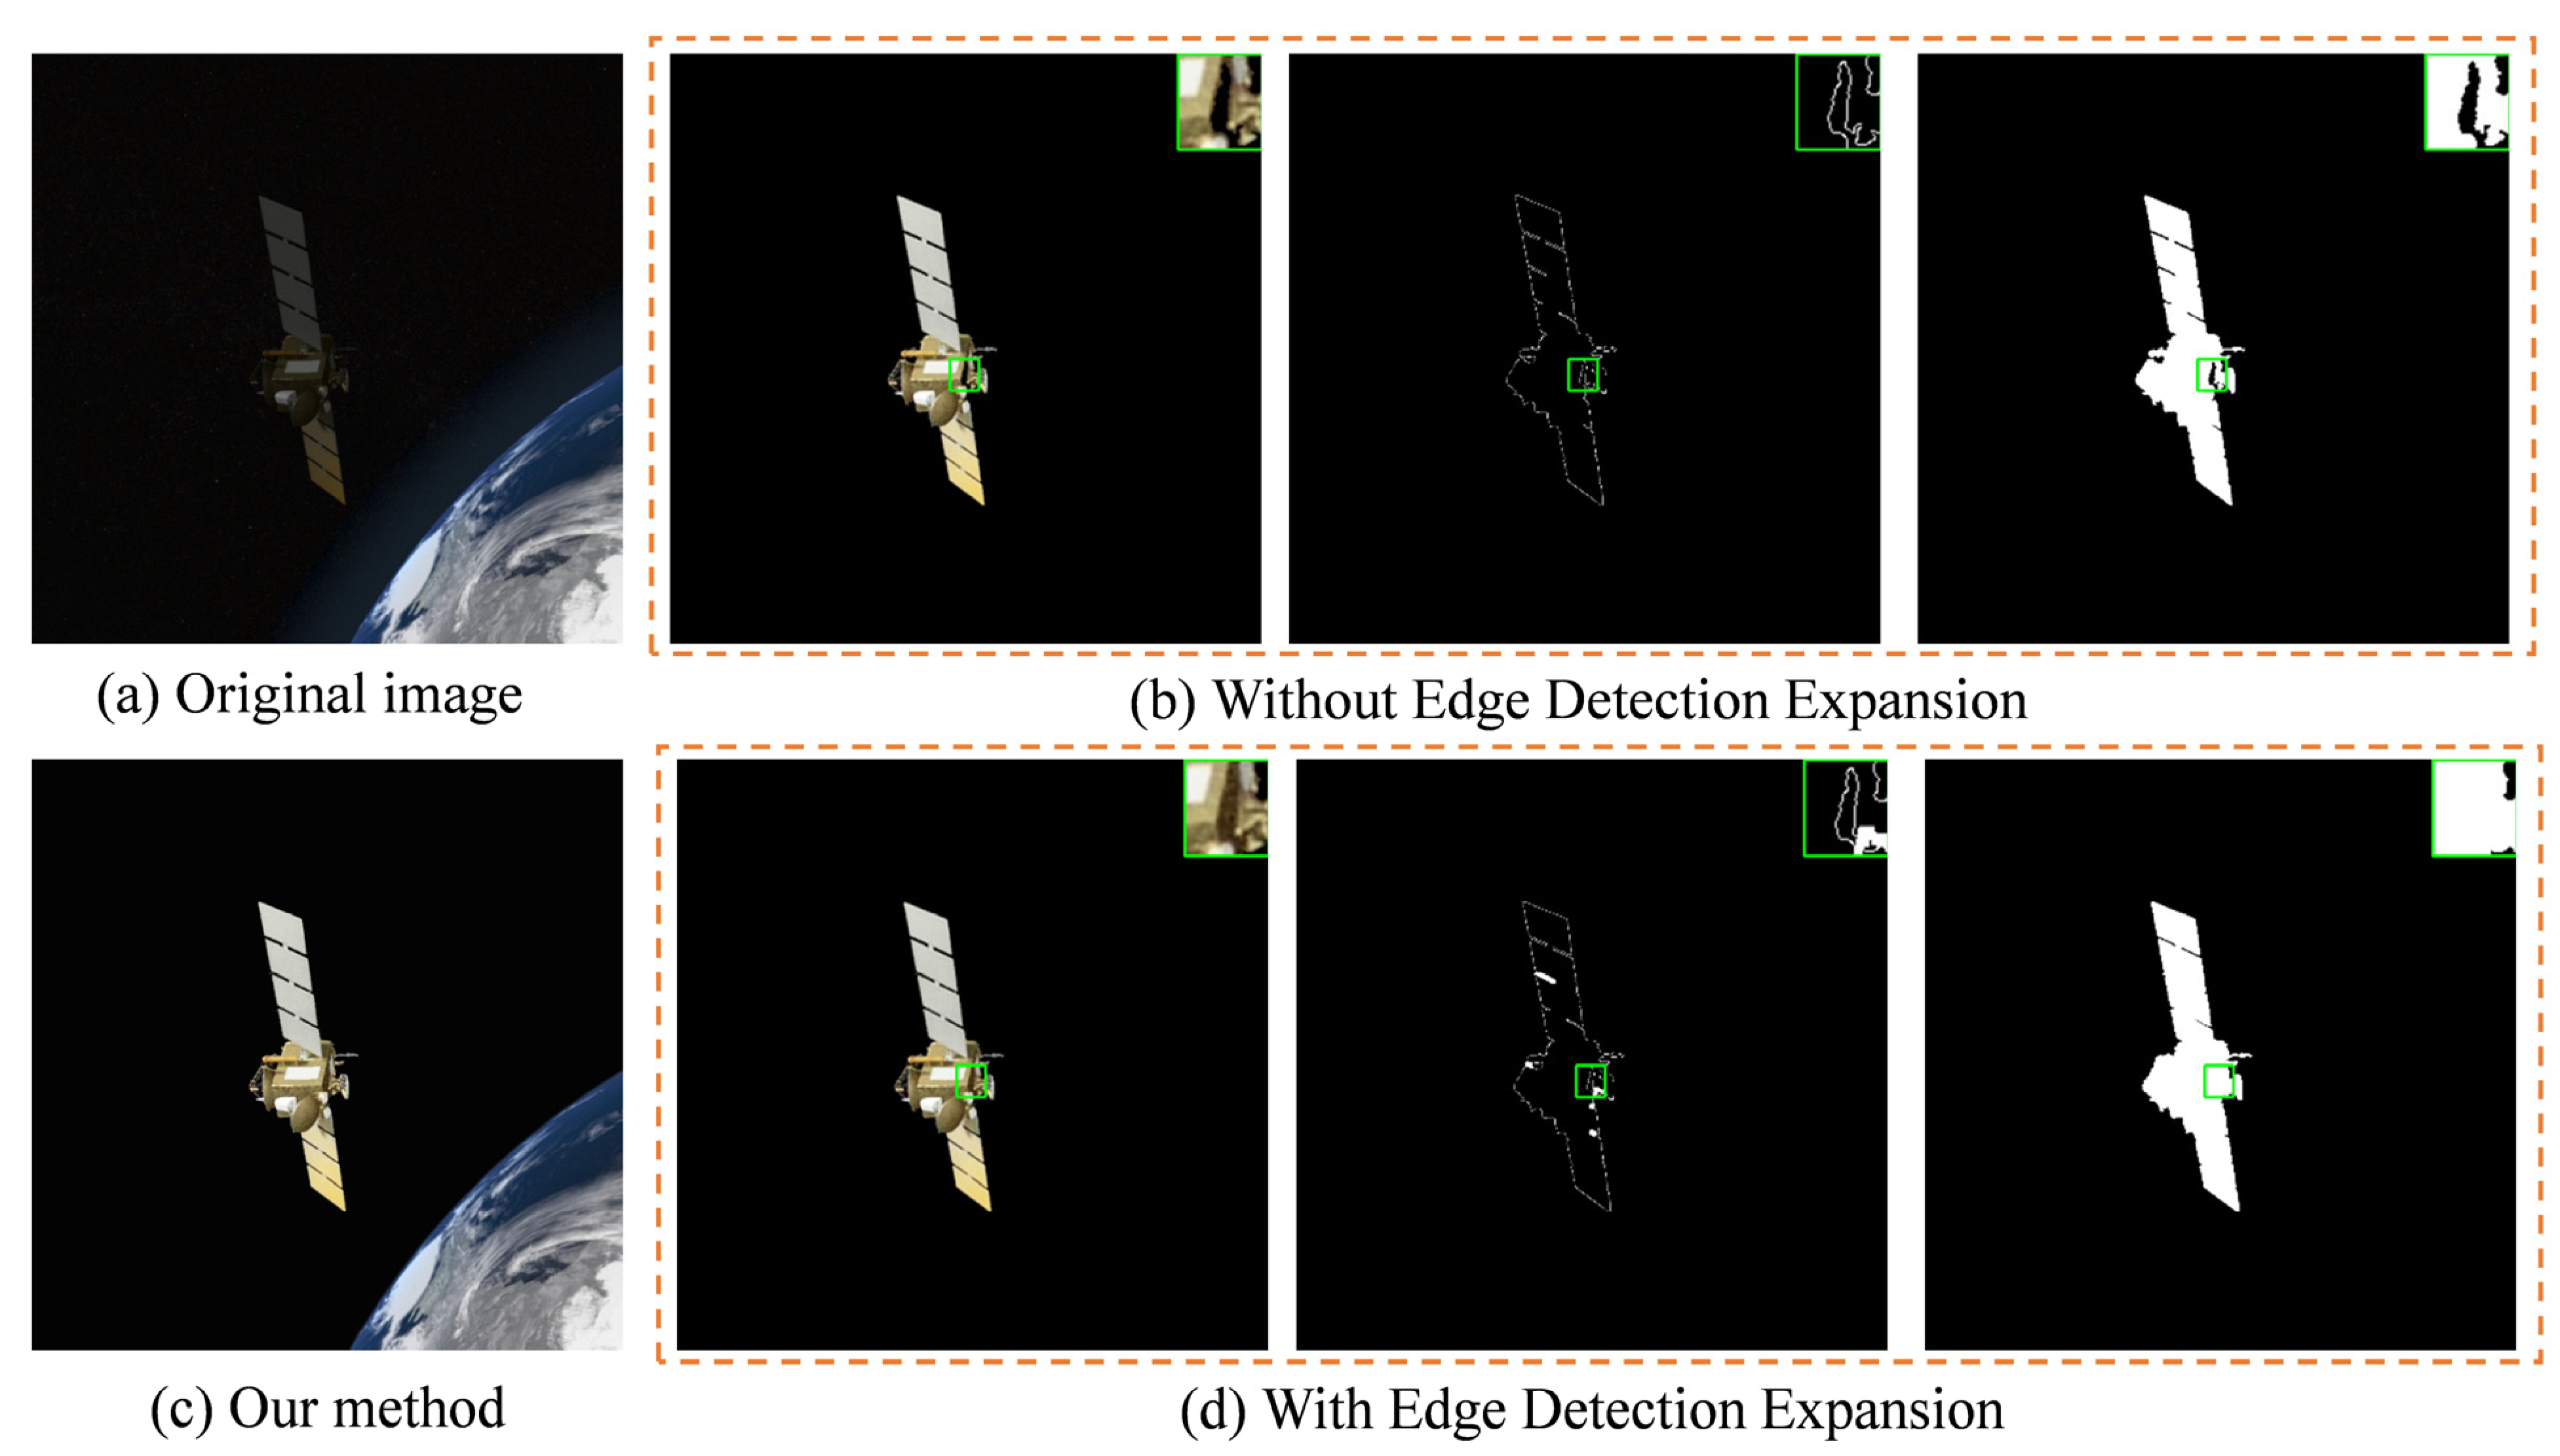
  • We design an edge detection extension module, which extends the edges by expansion and intersection detection, effectively avoiding incomplete extraction of the target region and solving the problem of incomplete satellite target region;
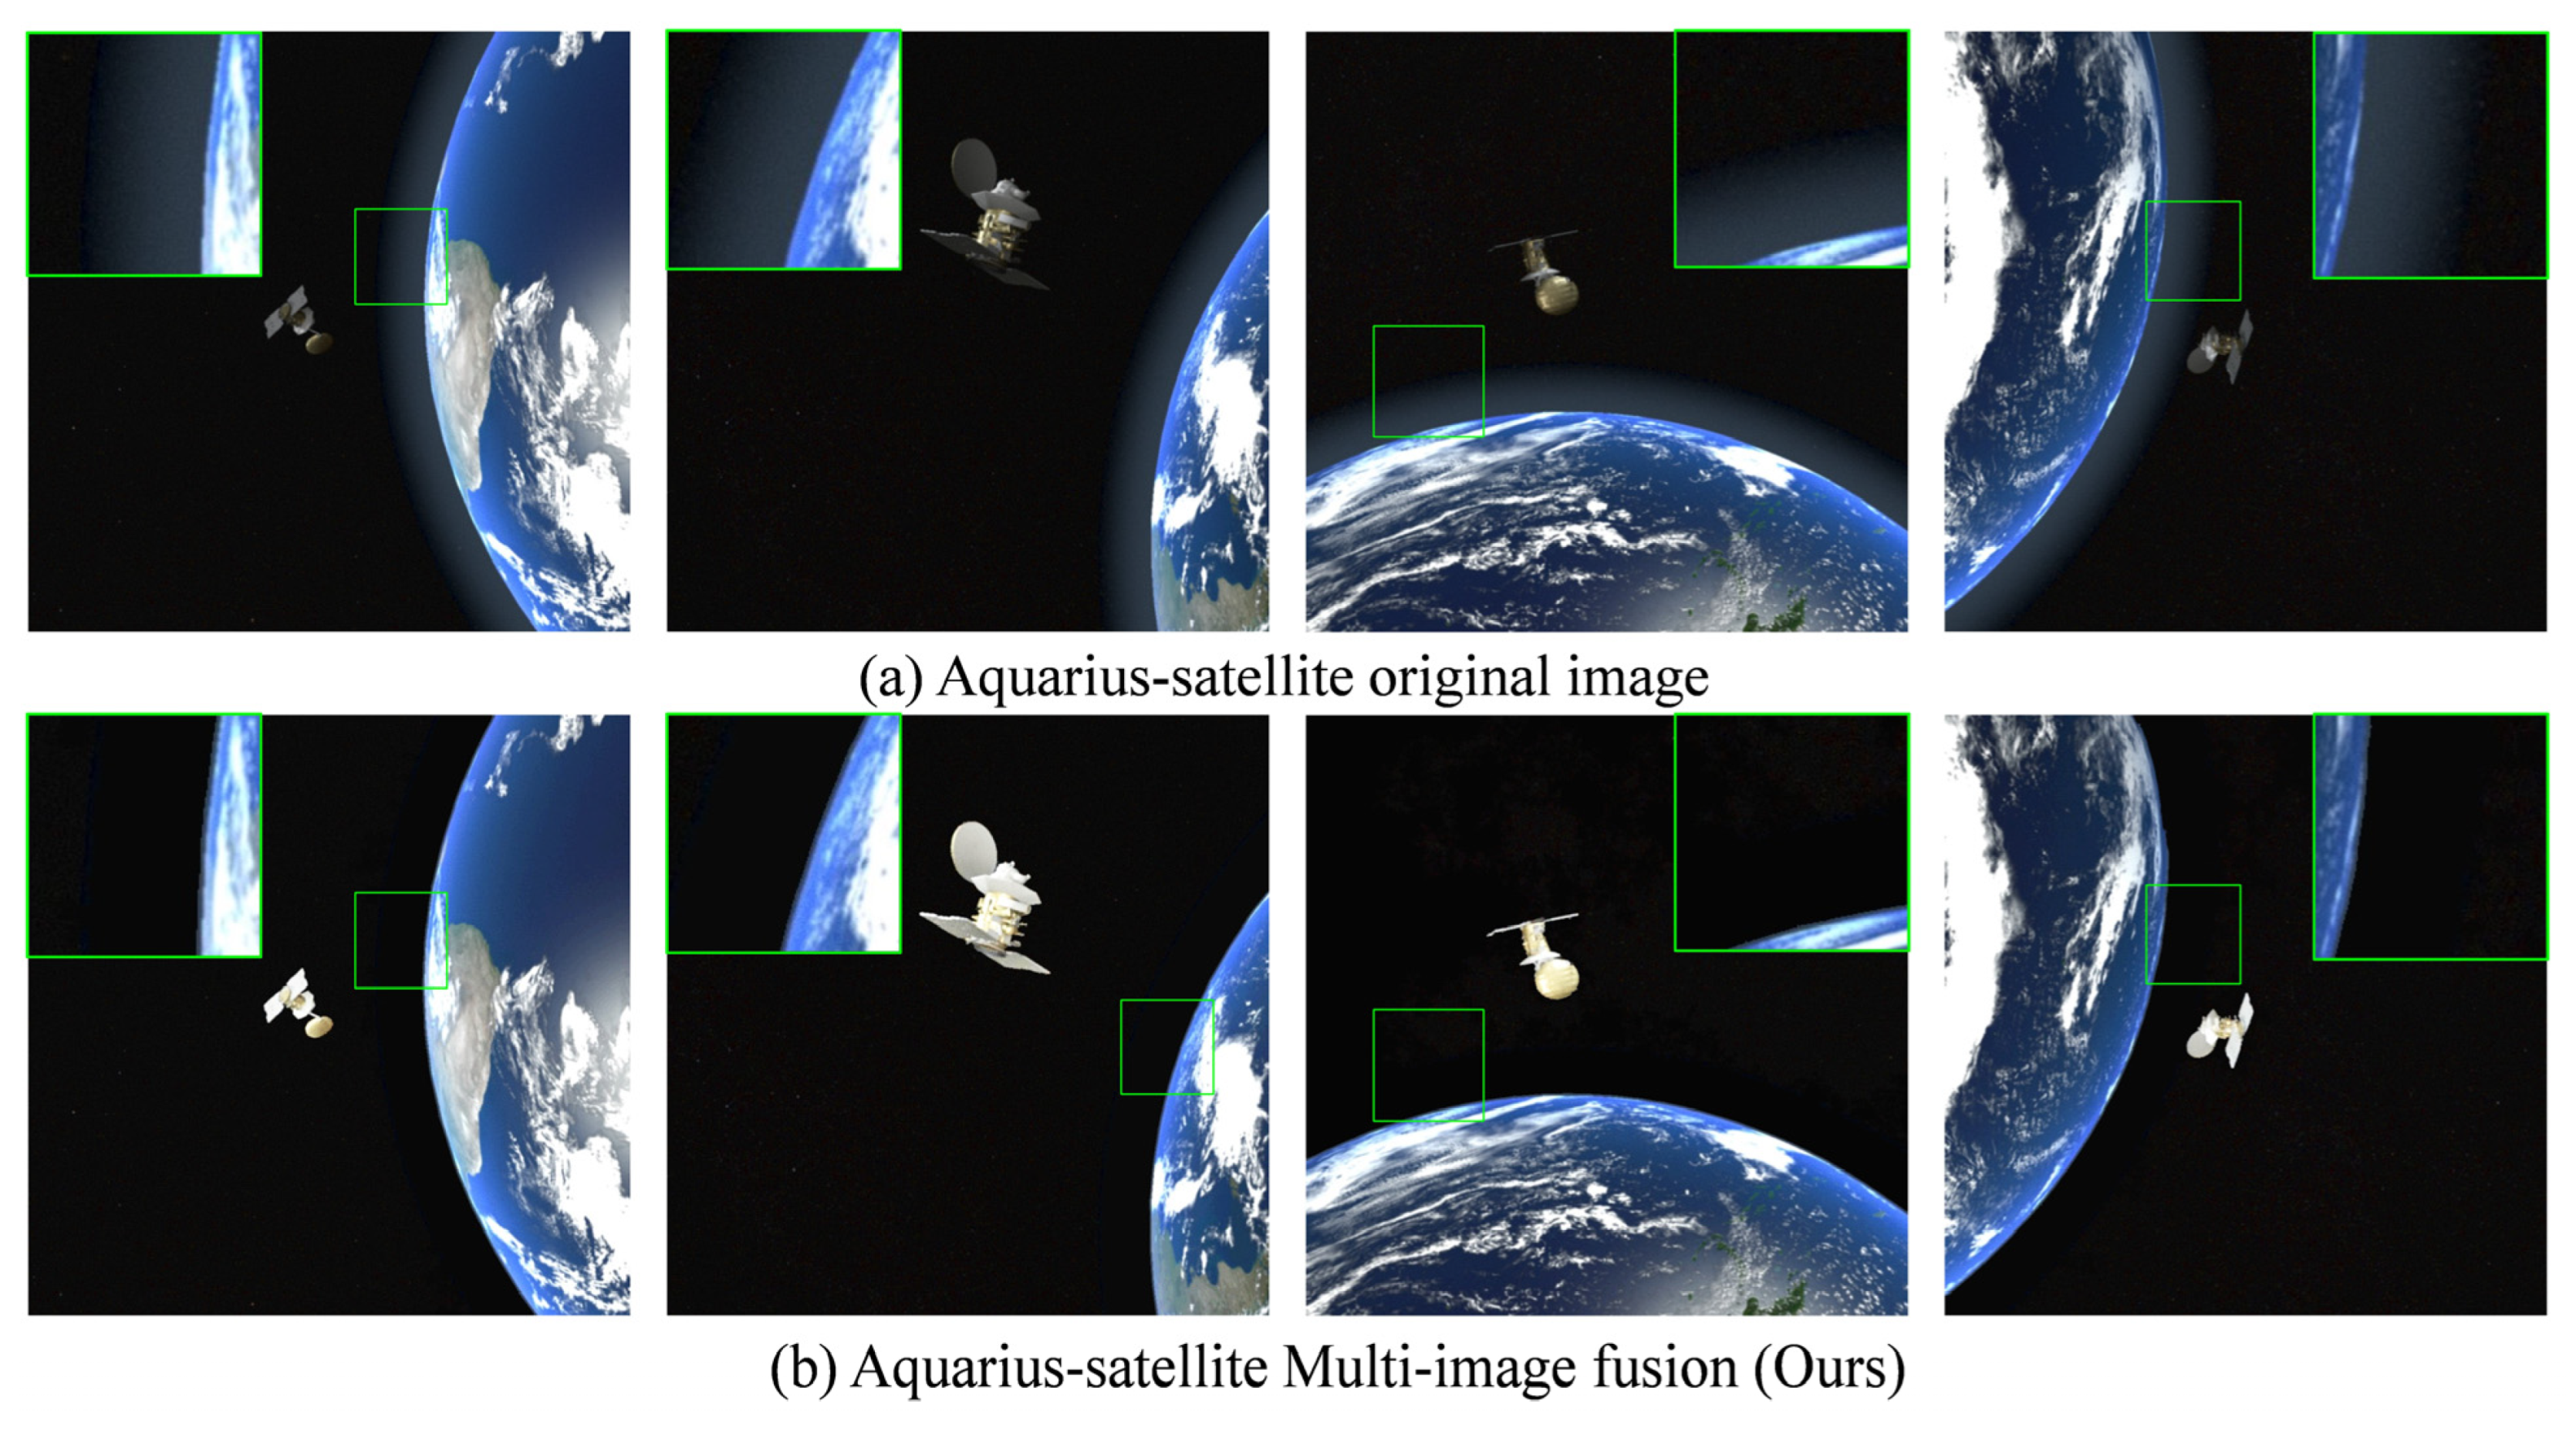
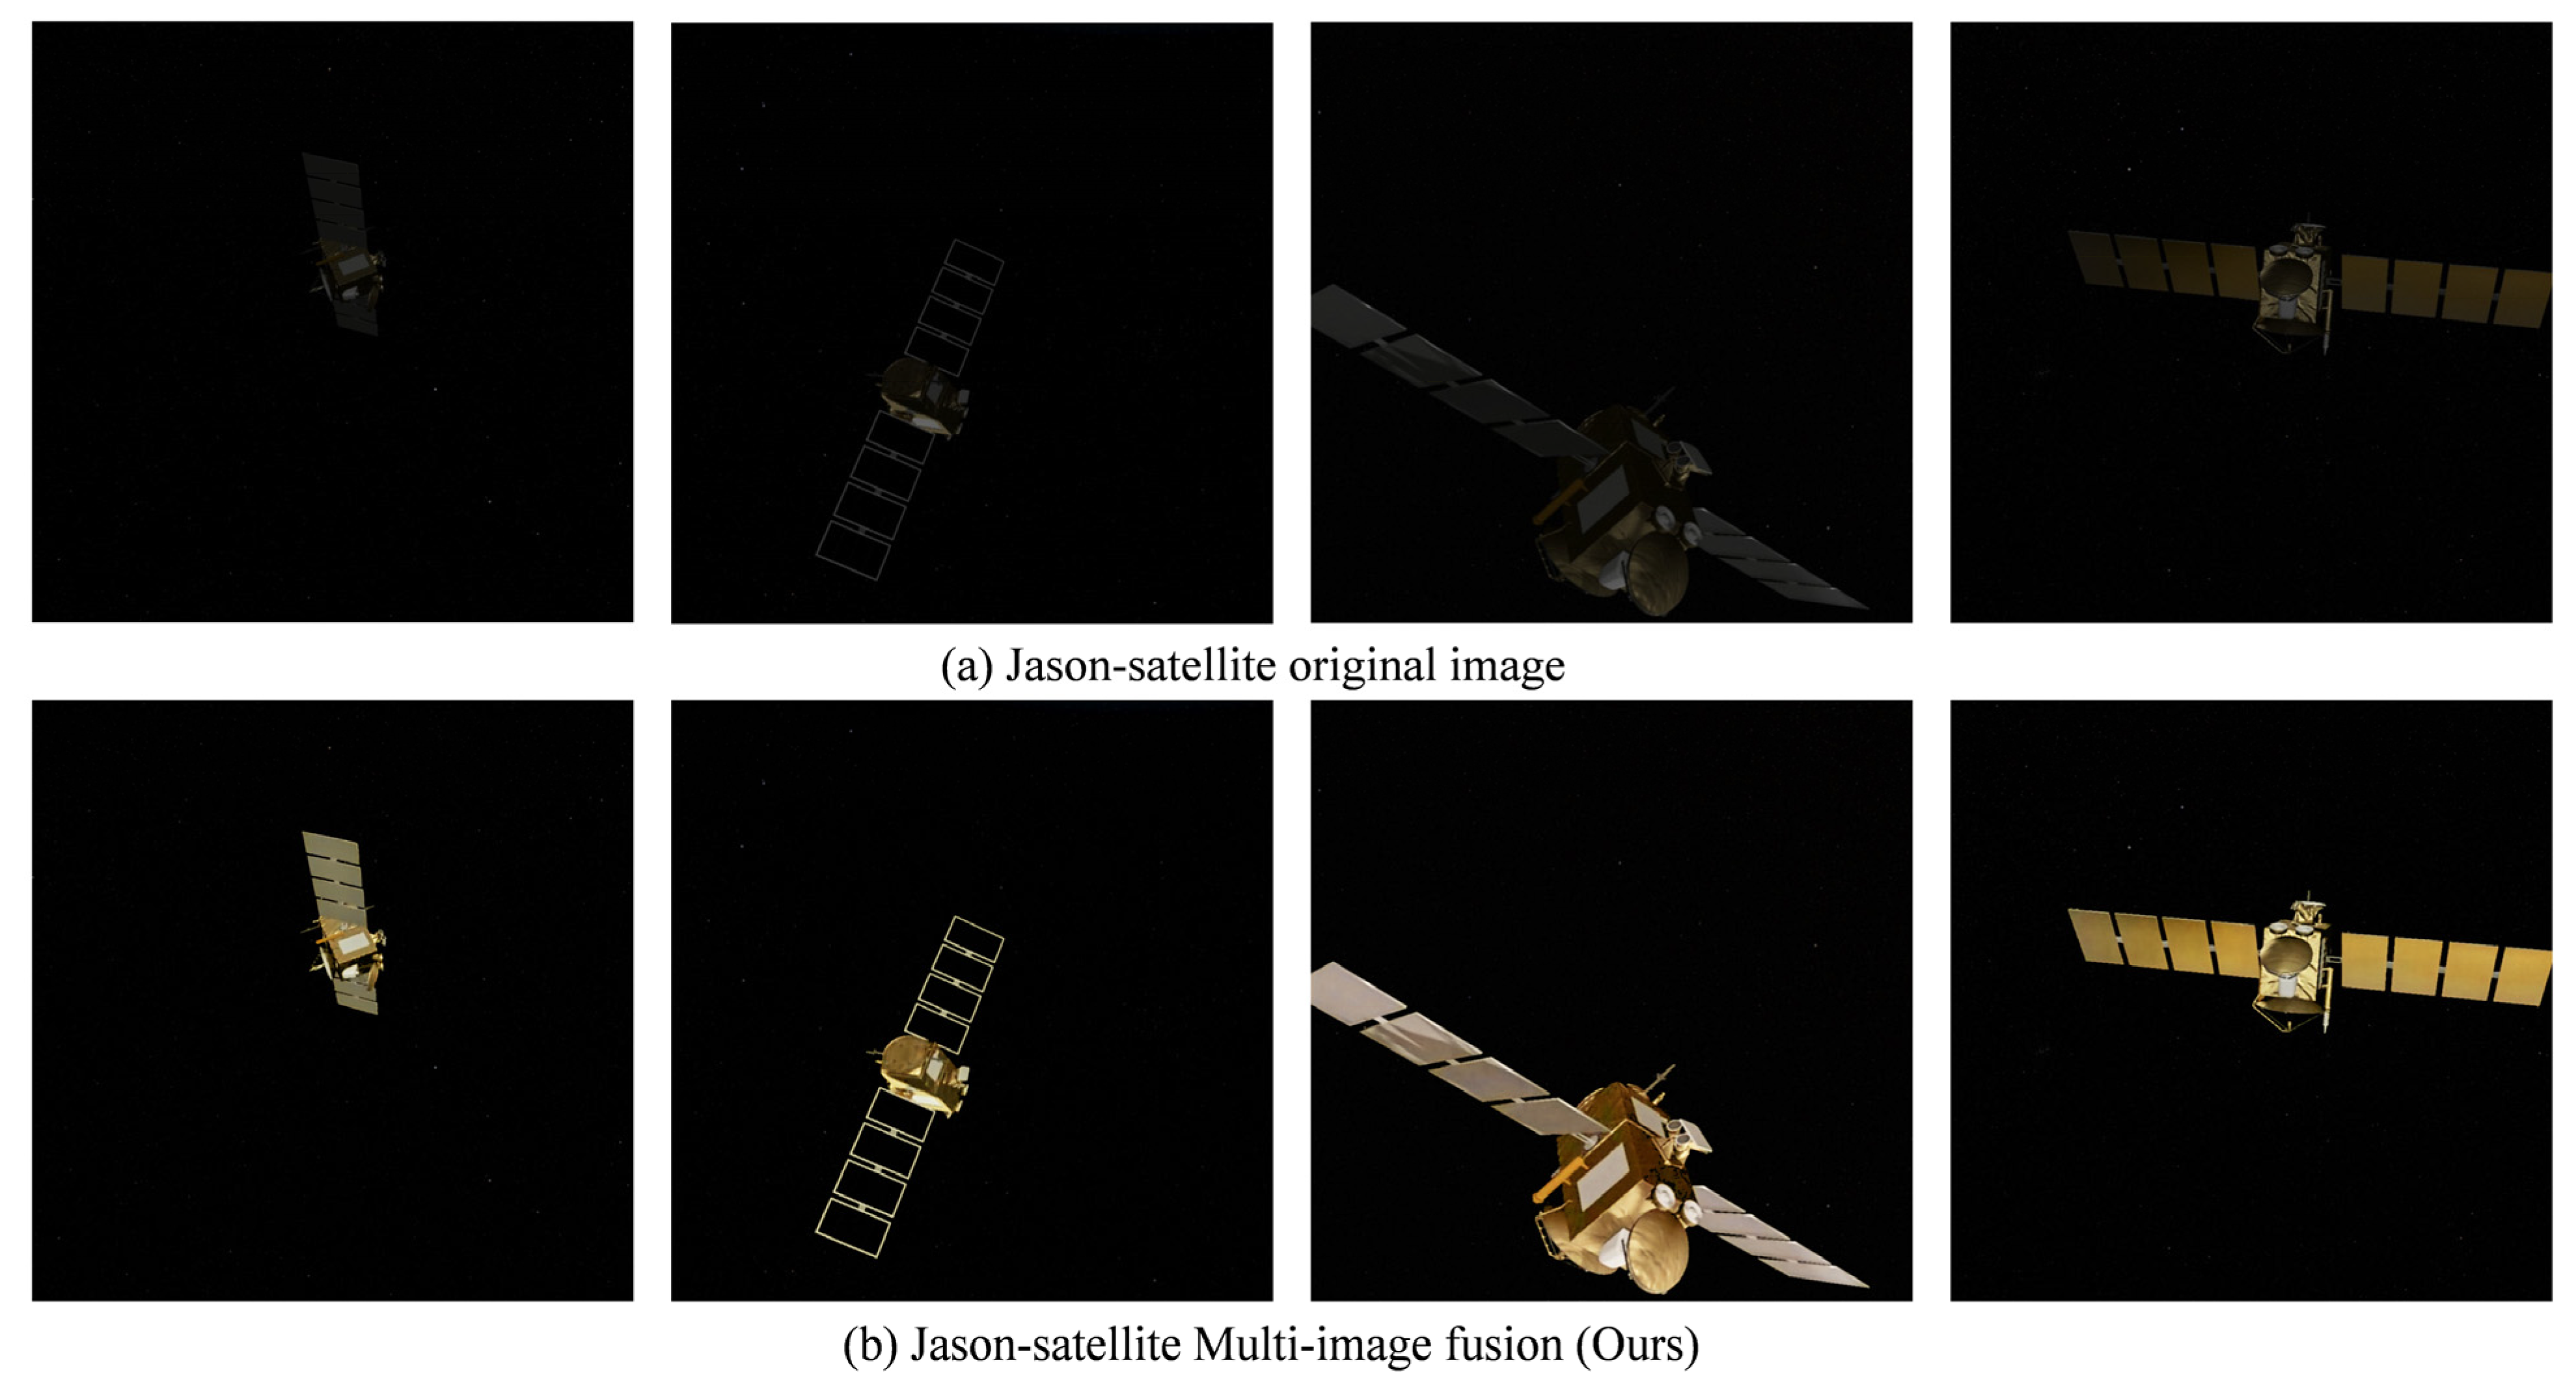
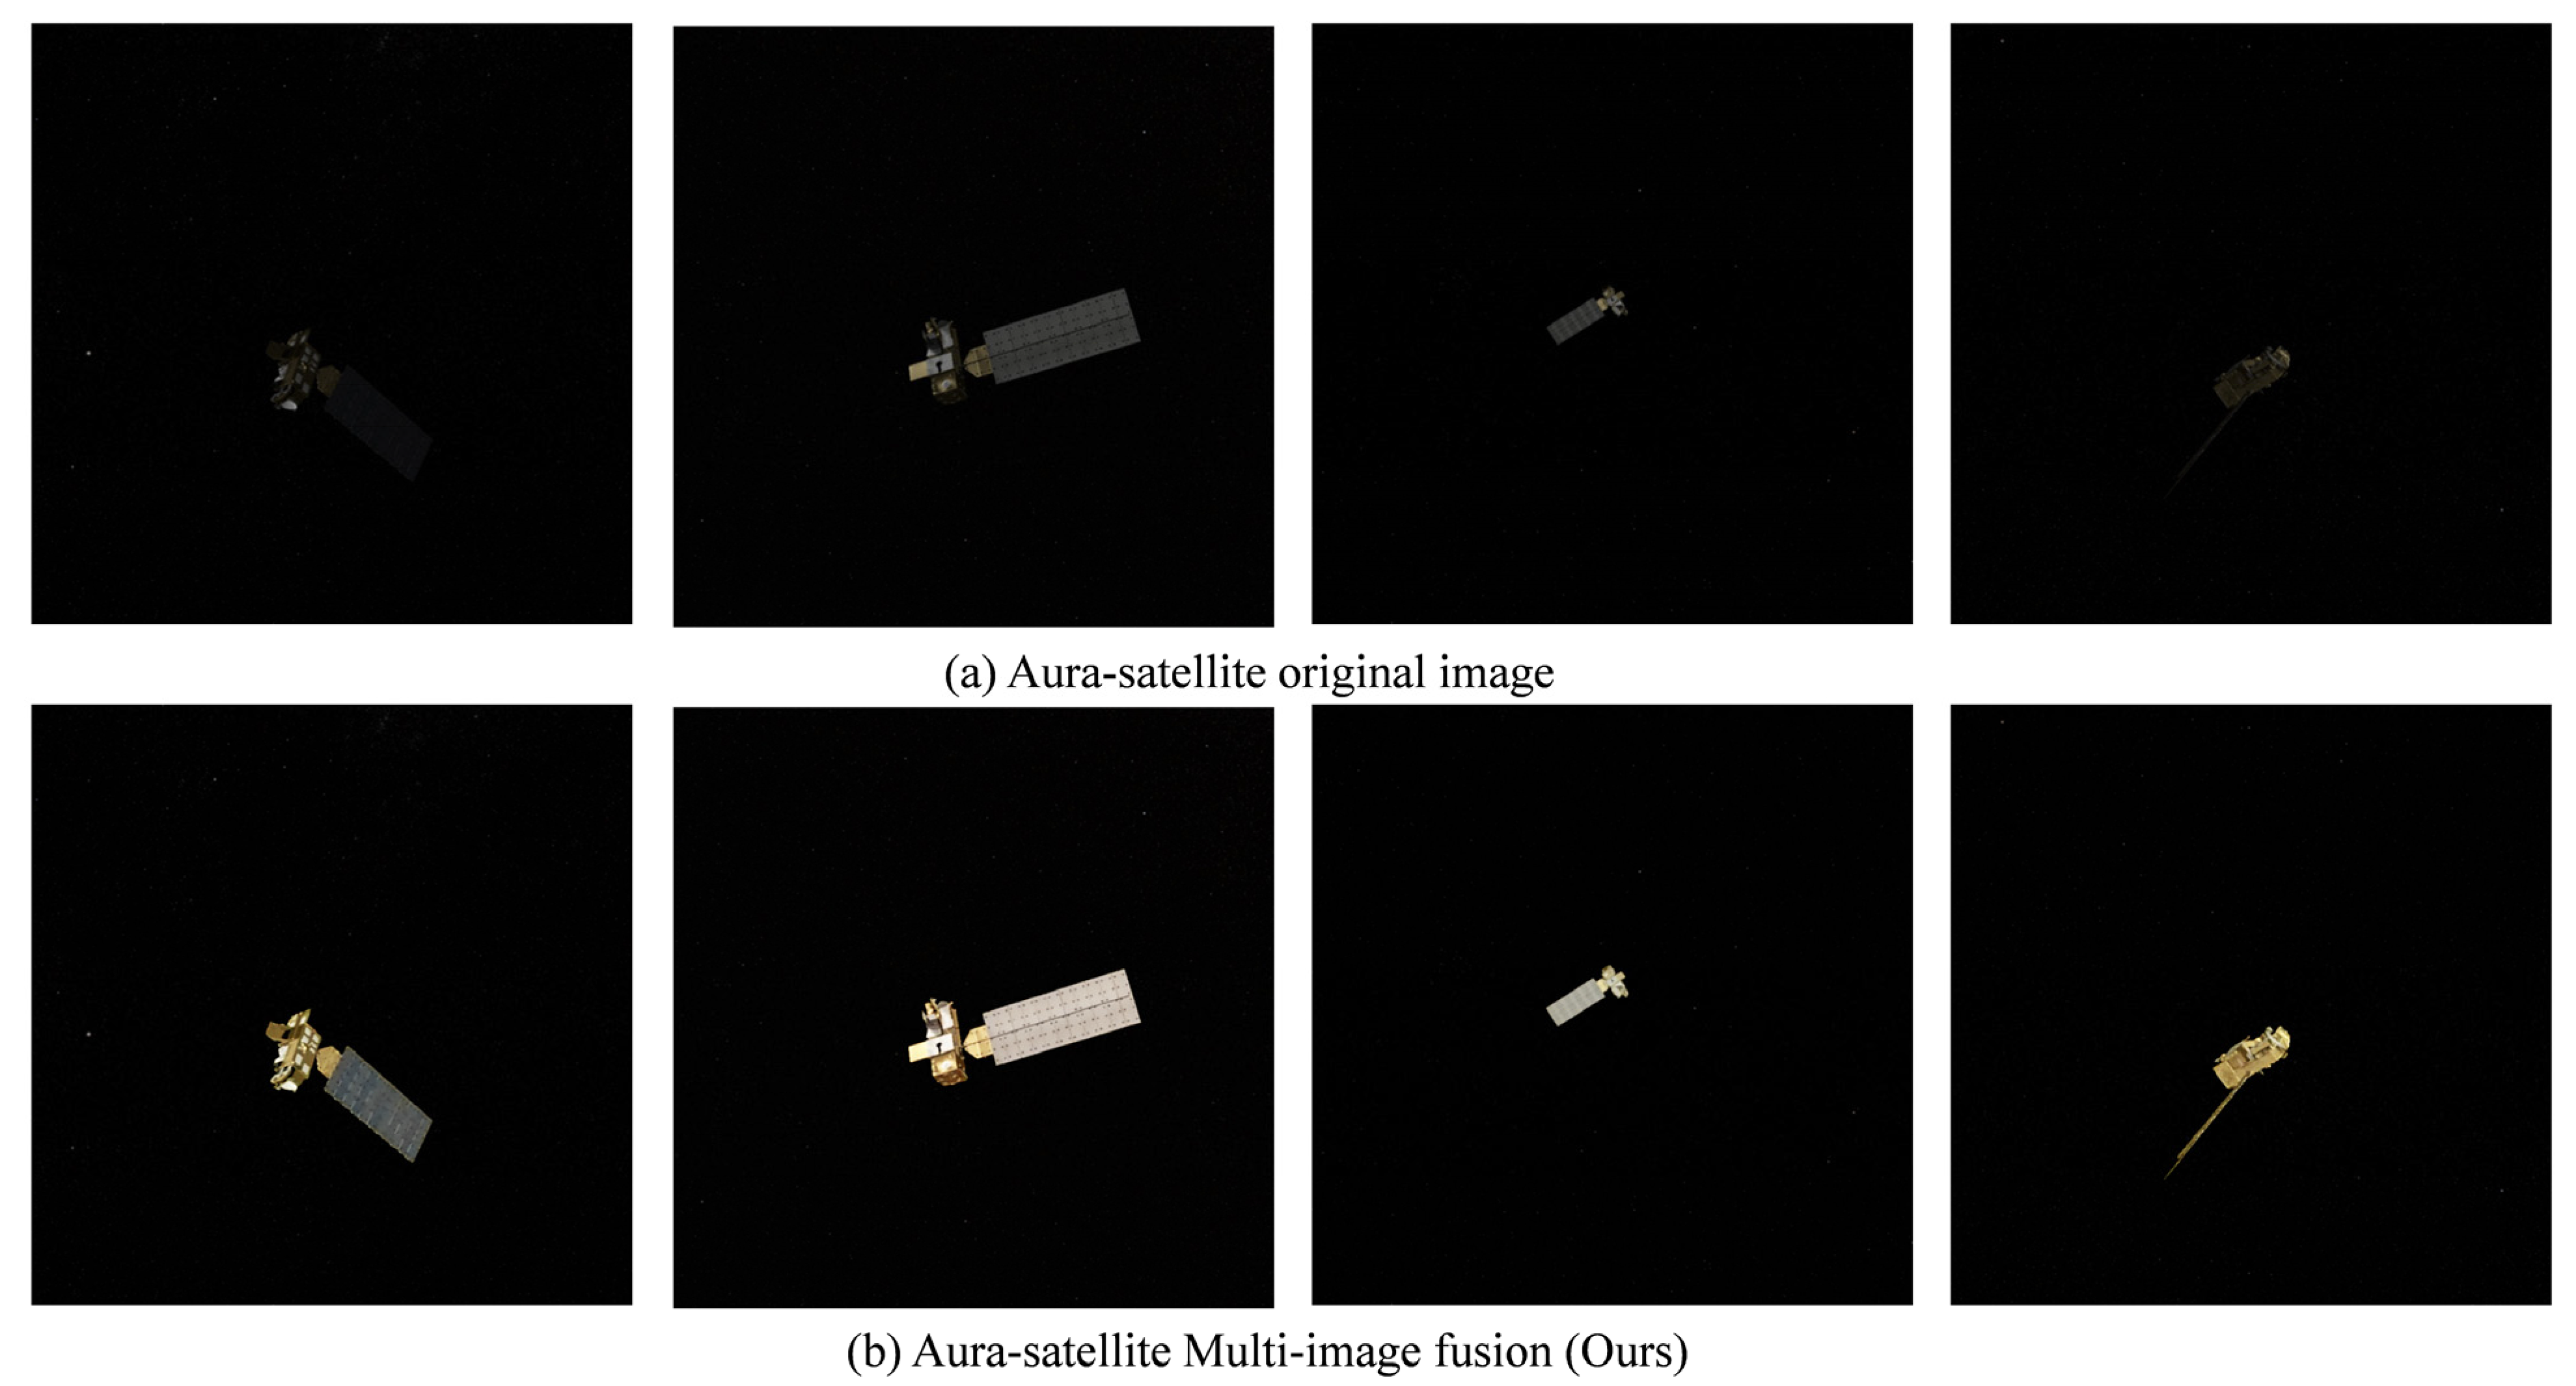
  • By combining the features of different regions, the extraction of the satellite target region, the Earth region, and the deep-space background is realized, which significantly improves the detailed visibility of the satellite target while ensuring high fidelity of the Earth region.
The remaining sections of the paper are organized as follows. Section 2 introduces the existing low-light image enhancement methods. Section 3 describes the proposed method framework and key techniques. Section 4 presents the experimental details and results. Section 5 gives the conclusion and future directions.

2. Related Work

Low-light image enhancement has been widely studied in the field of computer vision, especially for low-light images in natural scenes, and many methods have made significant progress.
Low-light image enhancement methods for natural scenes can be categorized into two main groups: traditional methods and deep learning-based methods. Traditional methods mainly rely on histogram transformation, illumination estimation, and contrast adjustment, including histogram equalization [6], contrast-constrained adaptive histogram equalization (CLAHE) [10], gamma correction [9], and Retinex theory-based enhancement methods [11,12,17,18]. With the advancement of deep learning, numerous models have been used to enhance low-light images [19,20,21]. For instance, Cai et al. [14] proposed to combine Retinex theory with a Transformer to create a one-stage Retinex-based Transformer for low-light image enhancement. These methods can effectively improve image quality in natural scenes, enhance detail and color reproduction, and have better adaptive capabilities.
Histogram equalization, contrast-limited adaptive histogram equalization (CLAHE), gamma correction, and similar methods enhance low-light images by adjusting brightness and contrast. While these methods can improve the visual appearance of images to some extent, they often fail to adequately account for the influence of lighting conditions. As a result, a noticeable gap remains between the enhanced image and one captured under the actual lighting conditions [14].
Enhancement methods based on Retinex theory improve low-light images by modeling the human visual system to produce results that align with human perception [17,18]. However, these methods have two main limitations. First, they often assume that the input images are clean and free of noise artifacts. In practice, low-light images—particularly those with deep-space backgrounds—typically suffer from low signal-to-noise ratios, which can result in amplified noise after processing. Second, these methods rely heavily on manually designed prior assumptions about the image and often require extensive parameter tuning. As a result, they struggle to effectively handle the diverse and complex lighting conditions commonly present in low-light imaging scenarios [14,15].
In recent years, deep learning has made significant progress in the field of low-light image enhancement [16,19,21]. By learning from large-scale datasets, deep learning-based methods have greatly improved the adaptability of enhancement techniques, enabling more effective preservation of image details under diverse lighting conditions. Several advanced models have demonstrated strong performance on benchmark datasets. For example, NeRCo [15] is an implicit neural representation specifically designed for collaborative low-light image enhancement. It addresses the limitations of traditional approaches by integrating neural representation learning with multimodal information. This design not only enhances detail preservation and denoising performance but also significantly improves the model’s generalization ability.
In contrast, RetinexFormer [14] is a Transformer-based low-light enhancement model grounded in Retinex theory. It incorporates a light estimation network with an attention mechanism to guide enhancement. This approach effectively recovers fine details in dark regions, suppresses noise, and improves overall image quality.
While traditional methods and deep learning methods have produced satisfactory results in low-light conditions for natural scenes, they struggle to perform well when addressing deep-space background targets. This difficulty arises from the unique characteristics of the space environment. Specifically, the lighting conditions and background noise in the space environment are significantly more complex than those on the Earth’s surface [4]. The absence of stable light sources, along with the presence of strong noise [2,5] and highly variable illumination, poses substantial challenges. As a result, traditional enhancement methods and existing deep-learning models often struggle to produce satisfactory results when applied to such images.

3. Method

In this section, we present a low-light enhancement method for deep-space backgrounds based on multi-image fusion. Given the unique characteristics of deep-space background images and the variations in target composition, this study classifies deep-space background images into the following two categories: (1) isolated satellite images, which refer to images that contain only a single spacecraft body and have no interference from other celestial bodies; and (2) satellite images containing celestial bodies, which refer to satellite images that contain natural celestial bodies (e.g., Planet Earth). This categorization takes into account the differences in noise characteristics and target properties in various scenes, providing a theoretical foundation for designing the enhancement method. Figure 1 illustrates the architecture and processing flow of this enhancement method for deep-space background satellite images.

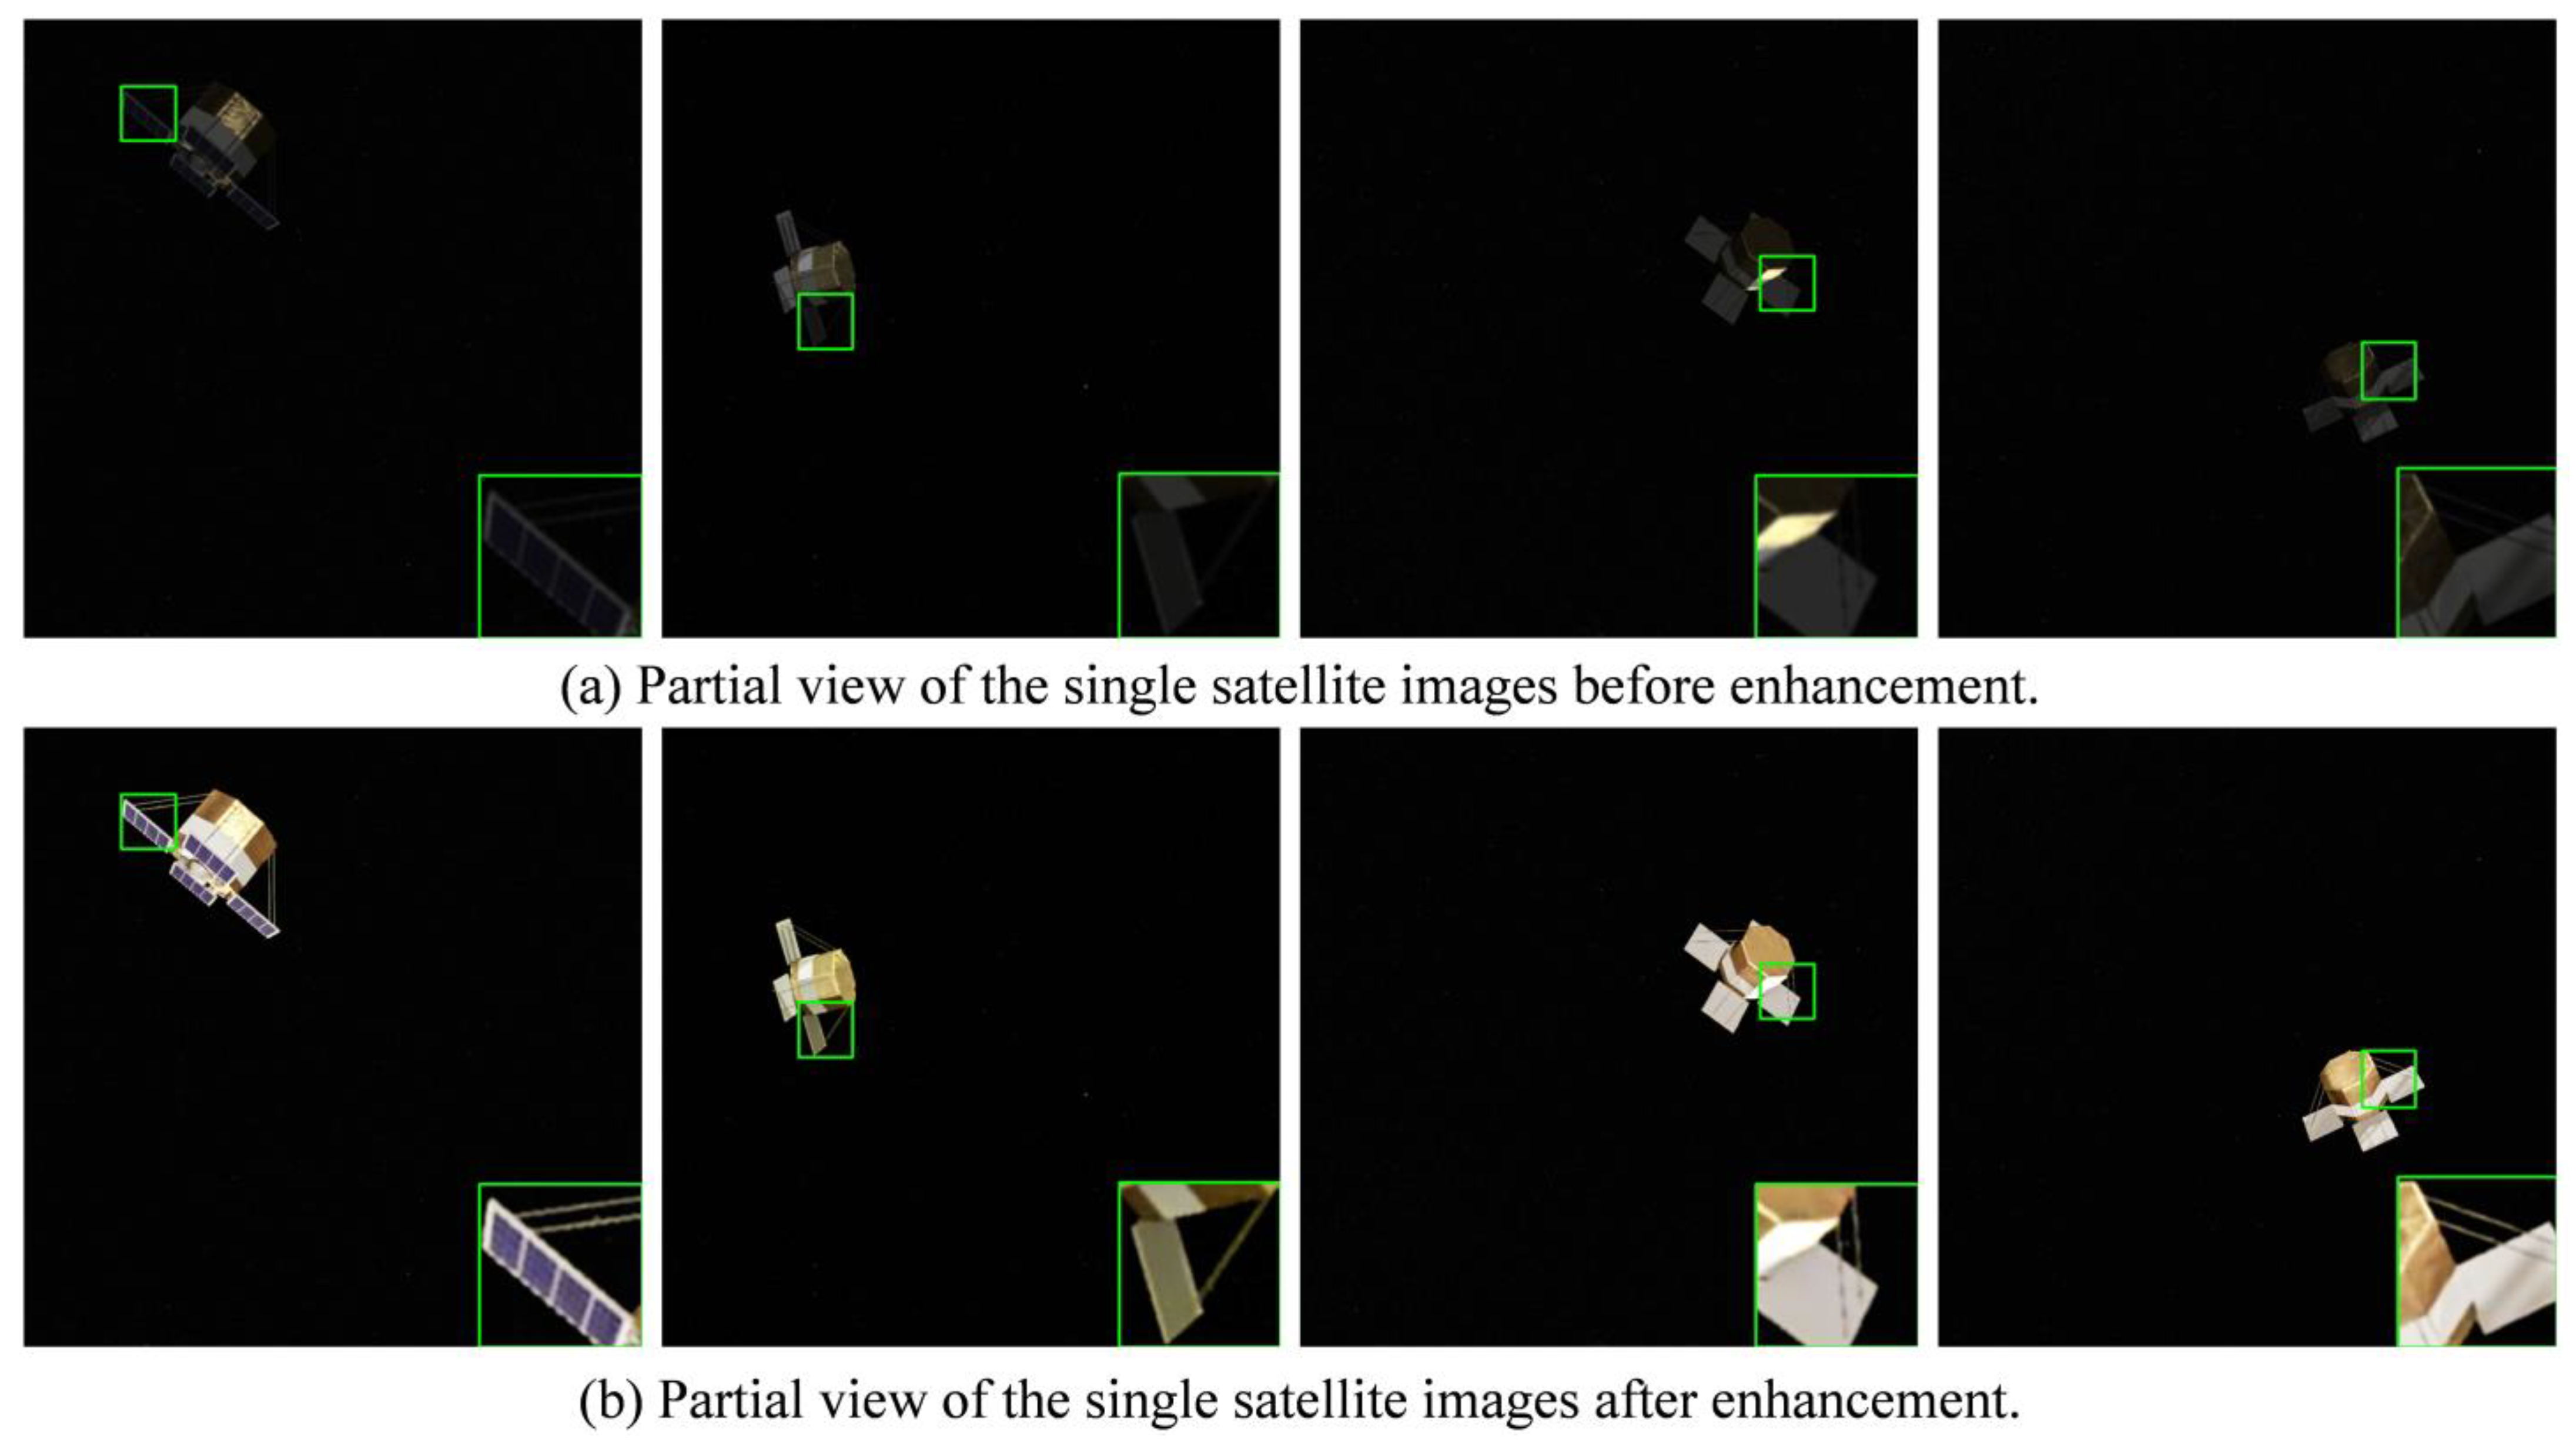
3.1. Enhancement of Single Satellite Images

For enhancing single satellite images, the method extracts the satellite target region from the adaptively enhanced images and fuses it with the deep-space background portion of the original images. This approach enhances the satellite target while preserving detailed context about the dark parts of the deep-space background, thereby significantly improving the overall quality of the satellite image against the deep space. Figure 2 illustrates the workflow for the single satellite image enhancement process.
After preprocessing the original image using RetinexFormer, noise and artifacts introduced during this process are eliminated through techniques like contrast enhancement based on segmented exponential functions. Subsequently, satellite targets are extracted from the enhanced image to generate a target mask, and then reverse masking is performed to obtain a mask of the deep-space background region. Following this, the background-masked areas of the original image (corresponding to the deep-space background) are fused with the satellite target regions from the adaptive enhanced image. This method effectively enhances the detailed features of the satellite, reduces noise, expands the visible area of the target, and significantly improves the overall image quality.
  • Contrast enhancement based on segmented exponential function
To address the common problem of low contrast in satellite imagery, we utilize a contrast enhancement strategy that employs a segmented exponential function. This approach allows us to adjust the contrast of the input image effectively. The input image, denoted as I 0 ,   255   W × H × 3 , is normalized by RGB channels using the following equation:
I ^ c ( x , y ) = I c ( x , y ) 255 , c { B , G , R }
where I c represents the pixels of the input image, and I ^ c signifies the pixels after normalization. Subsequently, each color channel undergoes segmentation for contrast adjustment using the following adjustment formula:
I c ( x , y ) = n · I ^ c ( x , y ) n p i f   I c ( x , y ) < m 1 ( 1 n ) · 1 I ^ c ( x , y ) 1 n p i f   I c ( x , y ) m
where I c denotes the pixel value of the adjusted image, m signifies the segmentation threshold, p represents the exponential parameter, and n is the value post-normalization of the threshold. By enhancing the dark region and suppressing the bright region, the low-brightness portion and the high-brightness portion of the image are adjusted to varying extents, thereby enhancing the image’s contrast and rendering its details more discernible.
2.
Detecting luminance distribution and adjusting dynamic threshold
To further optimize the brightness distribution of the image, the image is converted to the HSL (Hue, Saturation, Lightness) space. The lightness component (L) is then extracted and analyzed using the lightness channel histogram. Subsequently, an adaptive gamma correction model is constructed based on this analysis. The brightness threshold τ is determined by calculating the cumulative distribution function (CDF). This threshold is utilized to assess whether the brightness distribution of the image is suitable. If the image is found to be excessively dark or bright, adjustments are made accordingly.
In addition, a dynamic contrast adjustment algorithm based on image brightness is designed. When the bright part of the image occupies a higher percentage, the contrast adjustment is skipped; otherwise, the image is dynamically adjusted according to the calculated brightness threshold to further enhance the image details. Specifically, Gamma correction [9] by the RGB channel is realized by the following equation:
I c ( x , y )   = 255 × ( I c ( x , y ) a 255 a   ) 1 / γ
where a represents the dynamically adjusted compensation parameter and γ denotes the midtone parameter. The value of r is determined to comply with the equation as follows:
γ = 0.4 τ / 255 < 0.4 τ / 255 0.4 τ / 255 0.7 0.7 τ / 255 > 0.7
where τ denotes the highlight threshold calculated by the cumulative distribution function. When γ < 0.4, the correction curve is too steep, which easily leads to the loss of dark details, and when γ > 0.7, the correction curve is too flat, which affects the contrast enhancement effect. γ 0 . 4 , 0 . 7 can balance the needs of detail retention and contrast enhancement [9].
3.
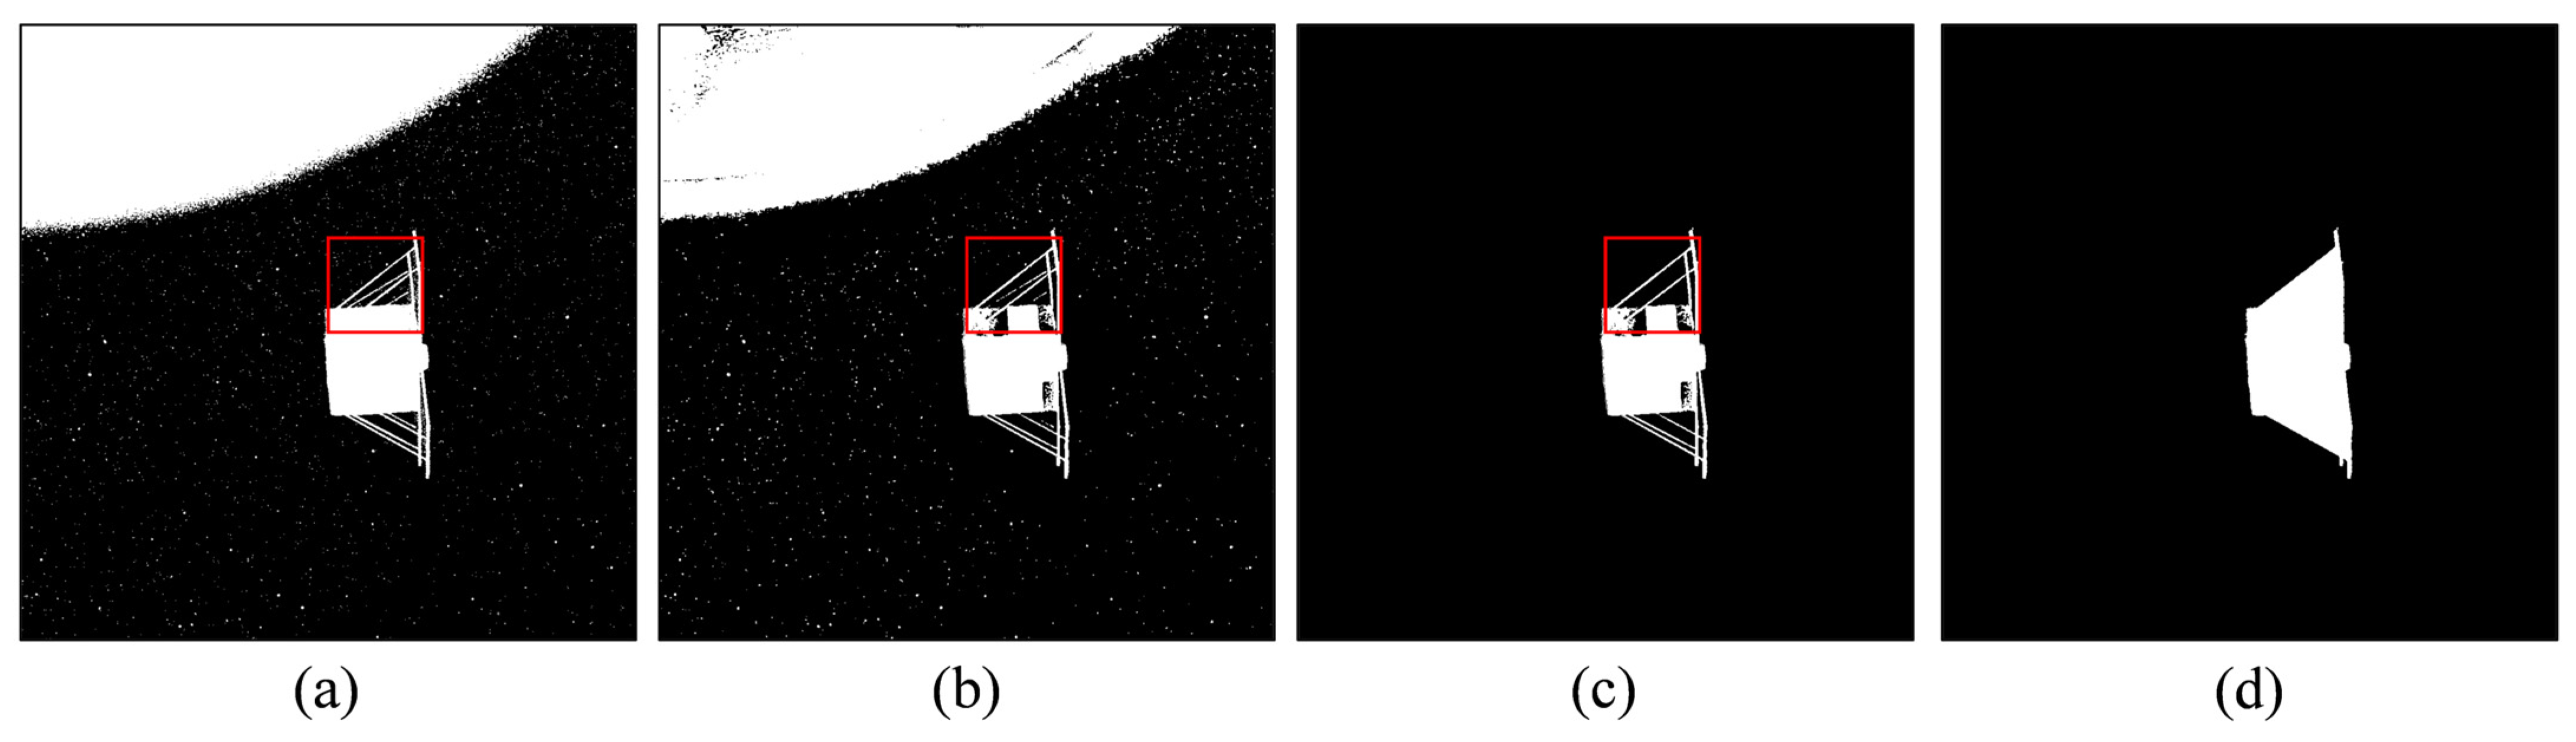
Extraction of satellite target area
Noise in images can significantly impact the accuracy of image analysis. To address this problem, we employ a strategy that combines the OTSU algorithm [22] with Canny edge detection [23] for effective noise removal. Initially, the OTSU algorithm is utilized to binarize the image, creating a binary image. This process also calculates the necessary high and low thresholds for the Canny edge detection. The method helps eliminate most of the small noise present in the image. Finally, we merge the binary image with the results from the edge detection to extract the regions that may contain the target.
When conducting connected component analysis and selecting regions, the target area is determined based on its size, luminance information, and density characteristics. If a candidate region stands out with both the largest area and the highest density uniquely, it is selected directly. However, if the candidate regions with the largest area and highest density differ, the region with the largest area and the highest percentage of luminance exceeding 128 takes priority. In this case, the focus is placed first on selecting the region that has the highest percentage of luminance above 128, followed by the candidate region that possesses the largest area of luminance. Ultimately, based on the results of these analyses, a final target mask is determined, which is used to extract the target region from the original image.
4.
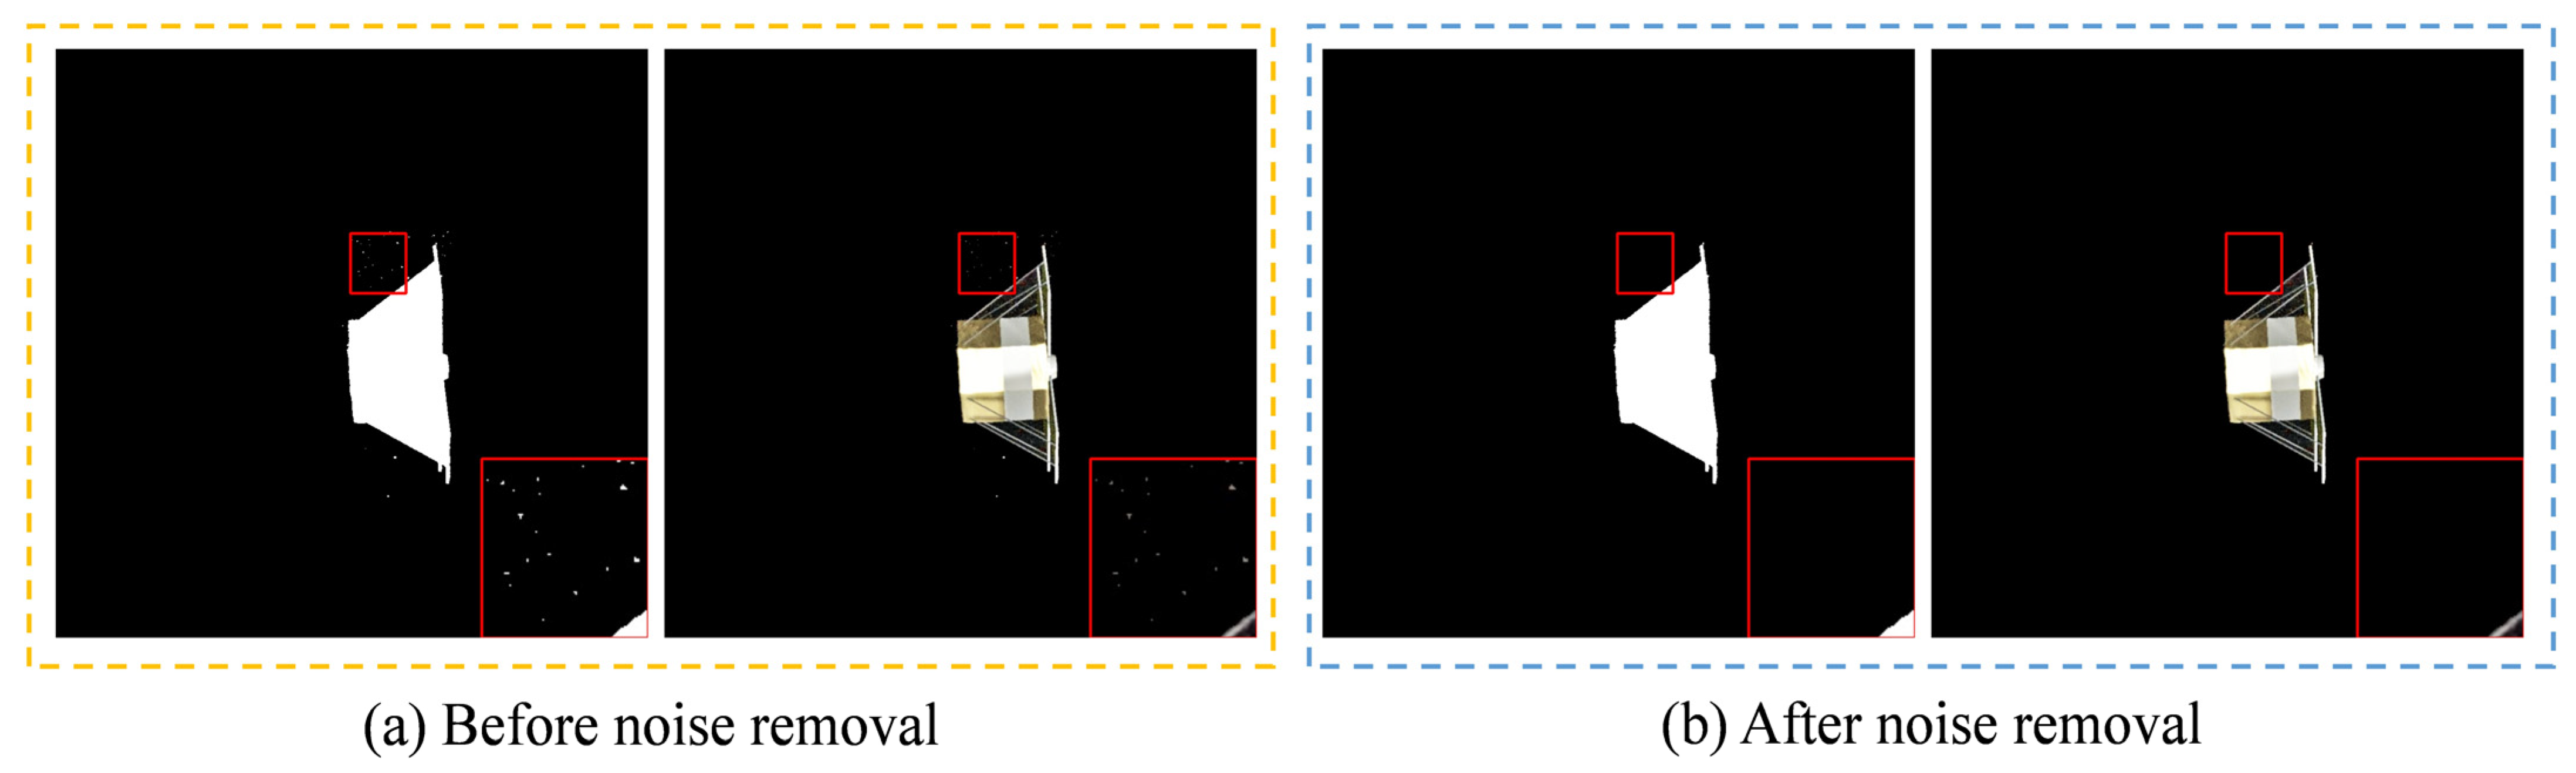
Target areas merging and noise removal
When the target region lacks connectivity, region merging can be achieved by extending the boundaries of the target region. Specifically, the boundary of the target region is extended by 5%, and then the extended region is checked to see if it contains other connected components. If it does, the regions are merged. To avoid excessive noise after region merging, the noise in the merged region needs to be calculated and cleaned up. For the connected components whose area is smaller than the set noise threshold, they are removed to obtain the target region mask after denoising. Finally, set the enhanced processed image as I p r o c , set the original image as I o r i g , and perform the fusion of the two images to obtain the output image as I o u t . The fusion formula for the two images is as follows.
I o u t ( x , y ) = I p r o c ( x , y ) M ( x , y ) = 255 I o r i g ( x , y ) otherwise
where M denotes the final target region mask. This method effectively preserves the detailed information of the deep-space background while enhancing the target. Figure 3 demonstrates the comparison of several single satellite images before and after enhancement.

3.2. Enhancement of Satellite Images Containing Celestial Bodies

Satellite images that contain celestial bodies, where “celestial bodies” mainly refer to the Earth planet. Unlike the images with only a single satellite, these images contain the Earth region, which radiates light outward [4], thereby enhancing the detailed information in the dark areas of the satellite to a certain extent. However, when enhancing such images, the radiation of this light will cause a strong halo effect around the Earth, which in turn affects the visual quality of the image. Especially in low-light environments, the strong halo formed after enhancement often does not conform to the real scene, and may even interfere with the accurate identification and judgment of targets such as satellites. In response to this special situation, this work designs a halo extraction and separation algorithm to effectively suppress the influence of the halo, making the image enhancement effect more realistic and in line with actual observation needs.
The fusion strategy adopted for this type of image is to extract the Earth area and deep-space background part (other backgrounds after eliminating the halo) based on the original image and fuse it with the satellite target that has been enhanced again after RetinexFormer preprocessing.
The processing flow for this type of image is illustrated in Figure 4. Initially, the halo in the original image is extracted and removed based on brightness information, creating a mask for the Earth area to prevent enhancement of that region. After preprocessing the image using RetinexFormer, noise and artifacts introduced during the preprocessing stage are reduced and eliminated through an adaptive image enhancement module that detects brightness distribution. Subsequently, the enhanced satellite target area is extracted, and a mask for this target area is created. Finally, these masks are used to map and generate a fused image.
During processing, determining the Earth area and locating the target range are critical components of the method. The Earth area determination module includes technologies such as expanding the connected component and suppressing the halo effect to accurately locate the Earth area and remove the interference of the halo. The target range positioning module uses methods such as adaptive image enhancement, edge detection expansion, and dynamic calculation of noise thresholds to remove noise and artifacts, thereby ensuring the integrity, clarity, and accuracy of the target area.

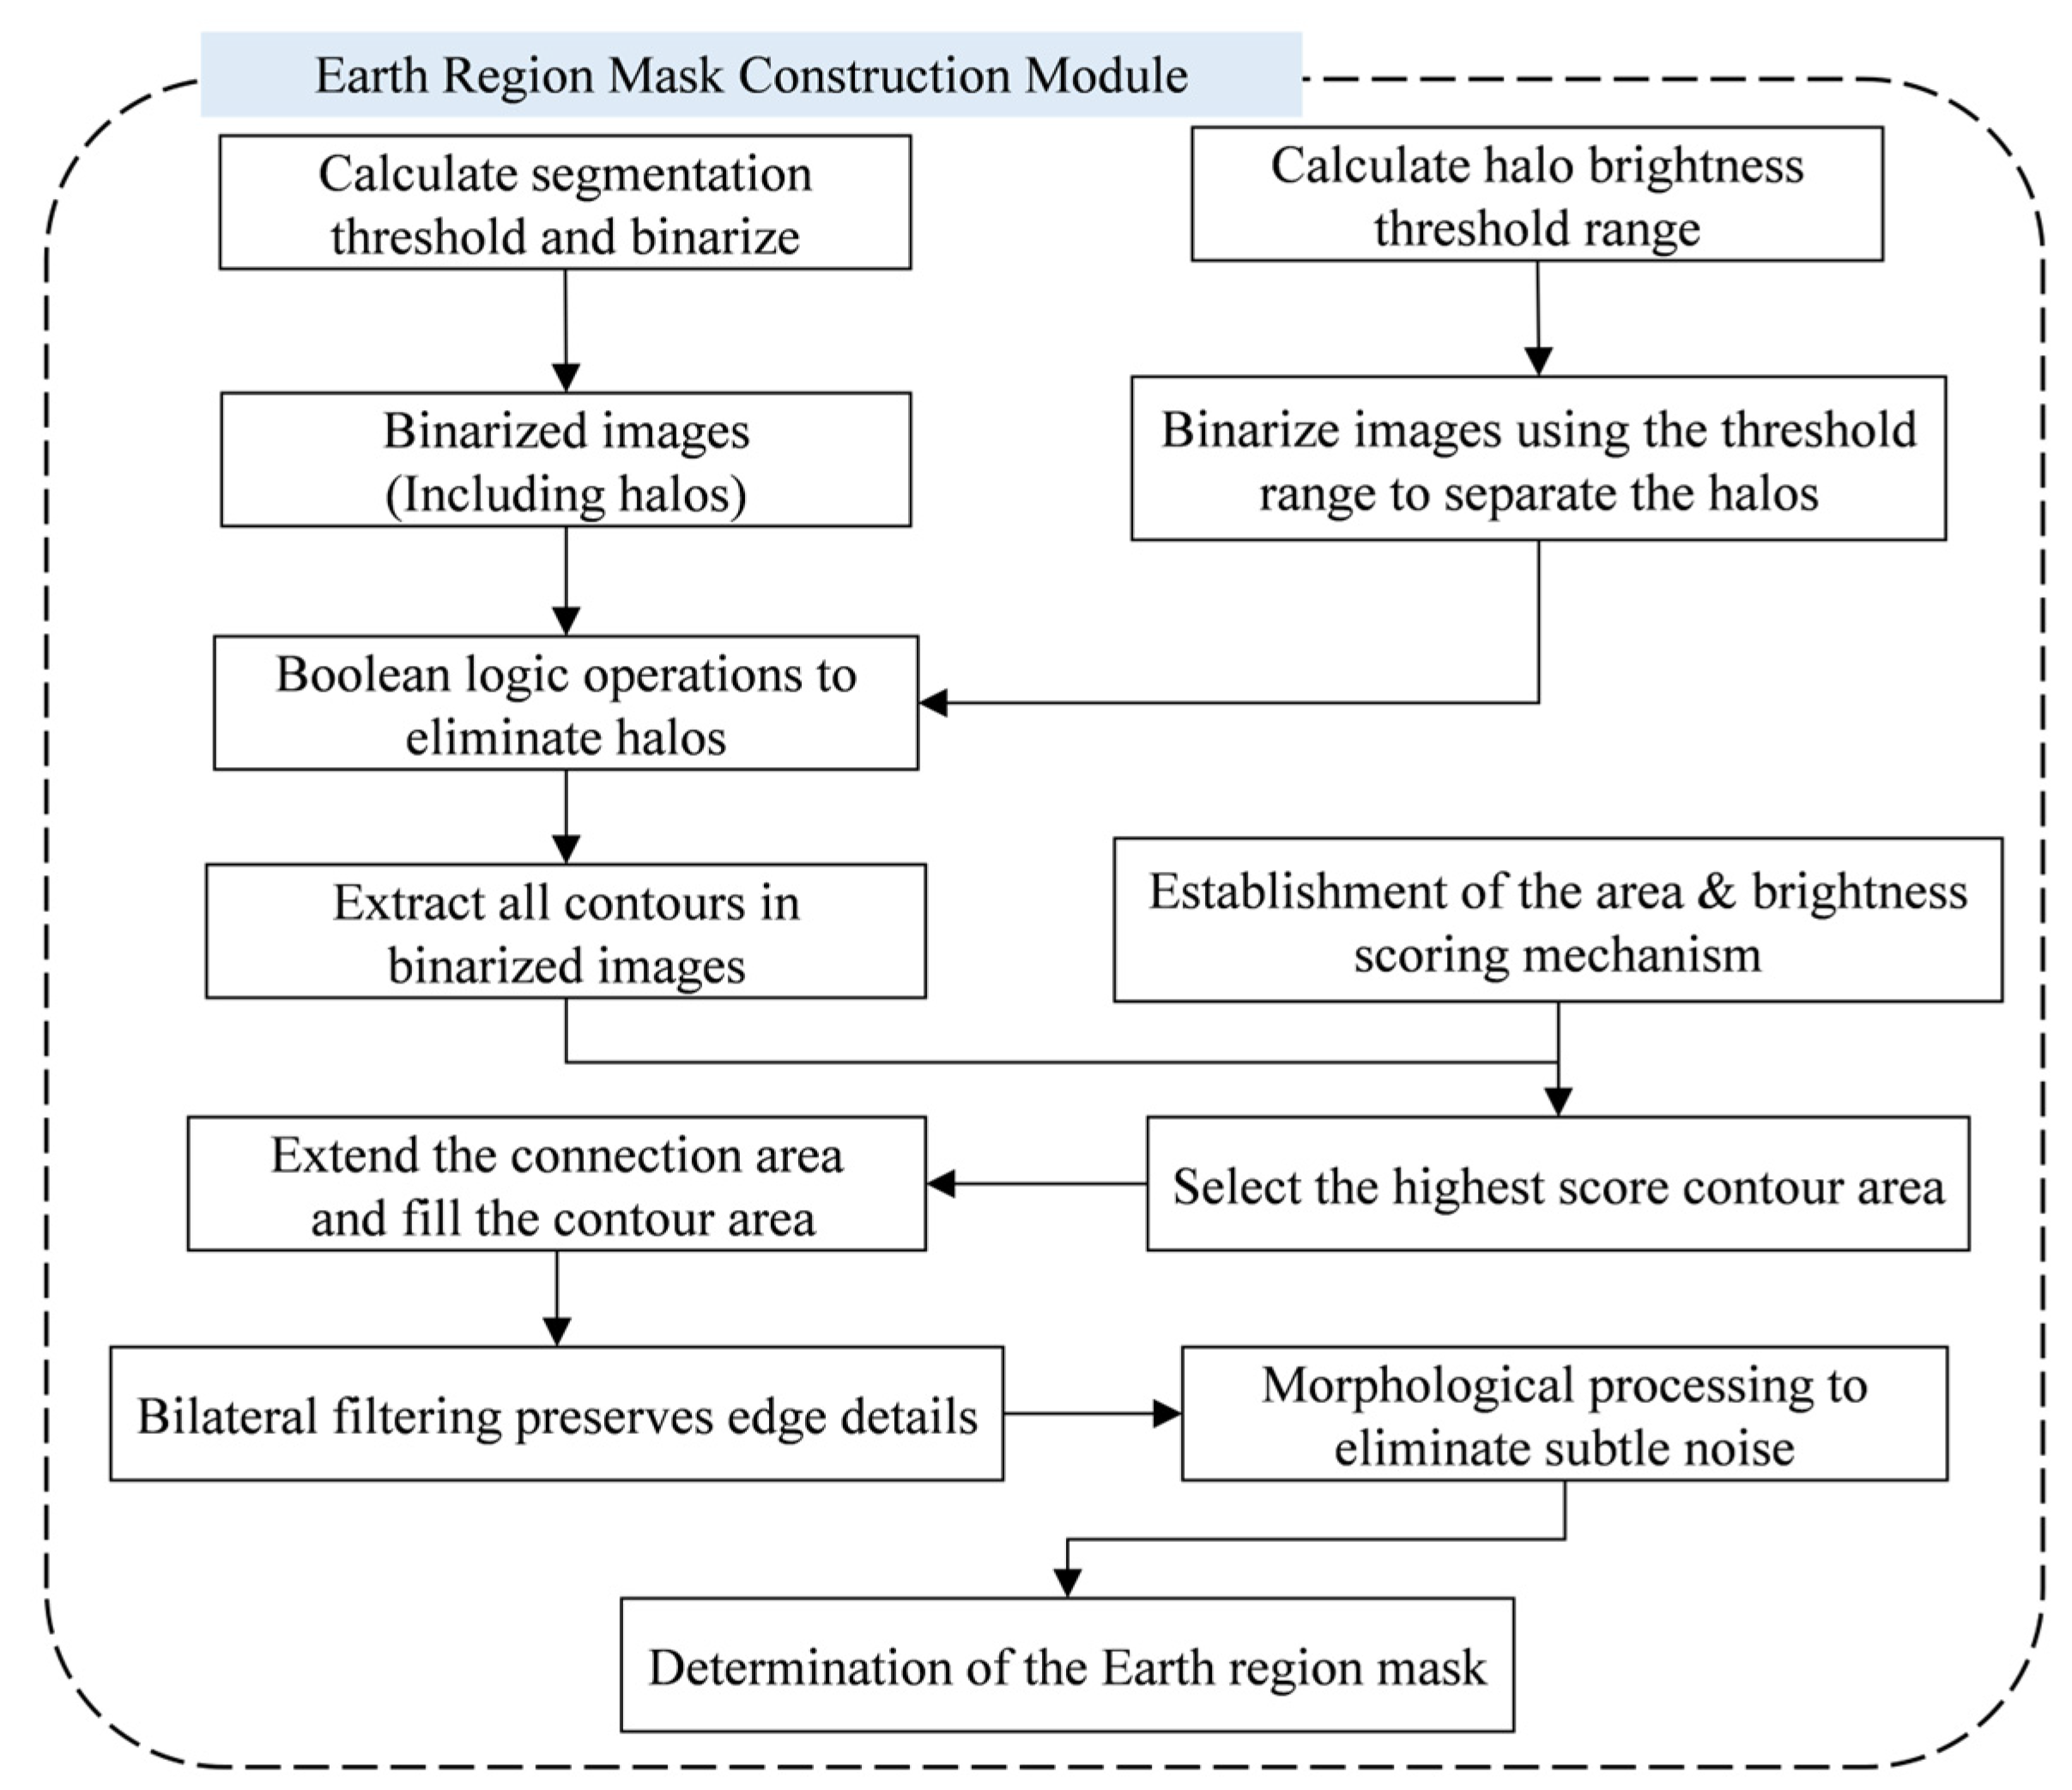
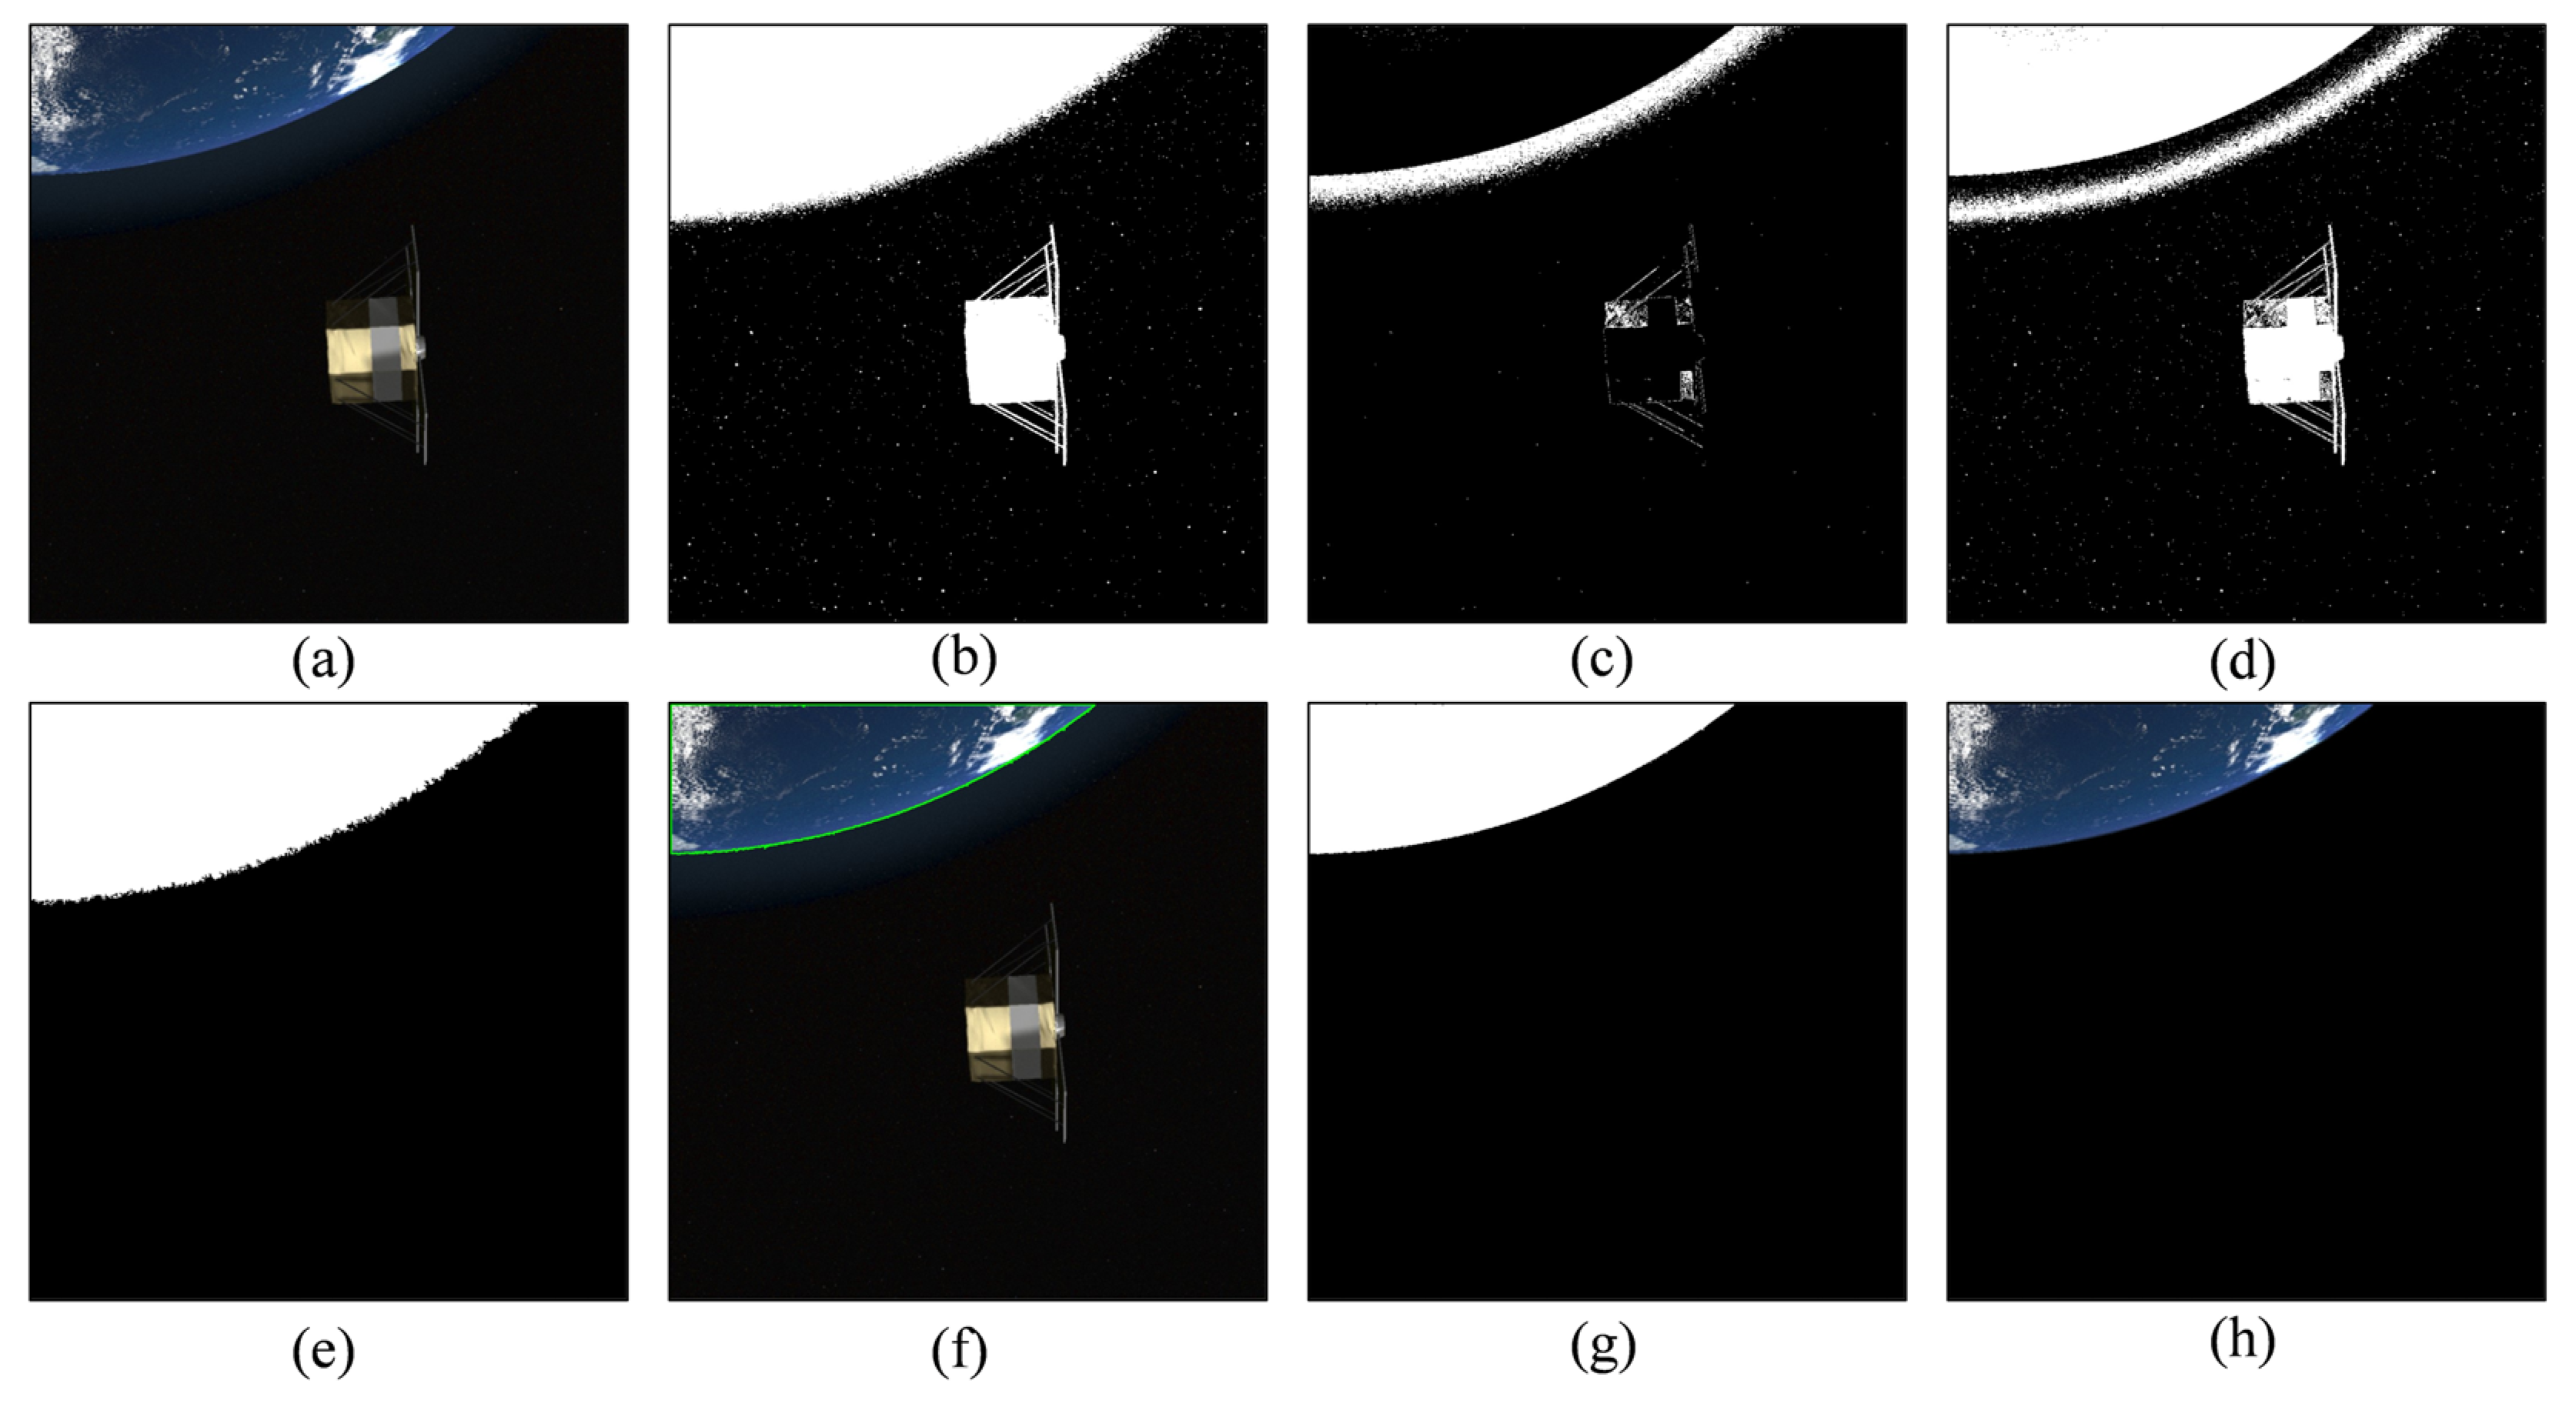
3.2.1. Extract the Earth Region

The Earth region mask construction module is illustrated in Figure 5. This module serves to extract the Earth region while effectively suppressing and eliminating the halo effect. It primarily involves several key steps: calculating the segmentation threshold and conducting binarization, determining the halo range, extracting and separating the halo, performing contour analysis and optimizing the region, as well as executing post-processing to generate the final mask.
  • Calculate segmentation threshold and binarization
To calculate the global segmentation threshold, the most commonly used method is Nobuyuki Otsu’s [22], which determines the optimal segmentation threshold T by maximizing between-class variance. The segmentation threshold T satisfies the following equation.
σ w 2 ( T ) = ω 0 ( T ) σ 0 2 ( T ) + ω 1 ( T ) σ 1 2 ( T )
where ω 0 and ω 1 represent the foreground and background pixel occupancy, respectively, σ 0 and σ 1 denote the corresponding variance. This threshold is used to initially separate the salient regions from the background in the image to generate an initial binary image. Threshold segmentation of the original image I x , y to obtain a binary image B r a w containing halos.
B r a w ( x , y ) = 1 if     I ( x , y ) T 0 otherwise
where T represents the segmentation threshold and B raw denotes the initial binary image. The algorithm is a common method for obtaining the global threshold of the image and applies to most occasions where the global threshold of the image is required. However, because the Earth’s surface has oceans, clouds, land, etc., leading to sometimes when using the OTSU algorithm, the calculated segmentation threshold will make the extracted Earth region incomplete, not in line with the actual situation, affecting the image enhancement effect.
In this paper, we consider that the region occupied by the Earth and the target in the whole image is small, and the rest is the black background region. Combined with this particularity of satellite images, a threshold segmentation algorithm for satellite images containing celestial bodies is designed, i.e., multi-segment threshold segmentation based on average brightness, which is formulated as follows:
t h r e s h o l d   v a l u e = max ( 0.8 × ϖ , 36 ) if   ϖ > 40 min ( ϖ , 36 ) if   30 < ϖ 40 min ( 0.75 × ϖ , 22.5 ) if   10 < ϖ 30 ϖ if   ϖ 10
where ϖ denotes the average brightness of the image, based on the distribution of the average brightness value, to calculate and determine the segmentation threshold. If the average brightness is greater than 40, set the segmentation to 80% of the average brightness, because a higher average brightness means that the image is brighter overall, and setting a smaller threshold can effectively separate the background from the target; if the average brightness is between 30 and 40, use the average brightness itself as the threshold, but not more than 36, which maintains the details while avoiding over-binarization in the case of a relatively high image brightness; if the average brightness is low (between 10 and 30), to prevent loss of dark information, the threshold is set to 75% of the average brightness, up to a maximum of 22.5. This ensures that details are preserved even in darker images; if the average brightness is very low (less than 10, close to black), the threshold is set to the average brightness itself. This prevents noise from being misclassified as a target area.
The comparison effect of the proposed method in this paper with the OTSU [22] algorithm for the binarization of images is shown in Figure 6. The proposed method can display the Earth and satellite target regions more completely, for the extraction of the Earth and satellite target regions, to avoid the loss of some regions.
Since the Earth’s surface has different features such as oceans, land, clouds, etc., if there is a part of the region where the feature brightness is not up to the average brightness, its region will be mistaken for the background and assigned a value of 0 (black) during binarization, resulting in a part of the Earth’s region being missing. Two aspects are designed to prevent this from happening to ensure the integrity of the Earth’s regions. On the one hand, the multi-segment threshold segmentation algorithm based on average luminance is designed to adjust the threshold effectively, minimizing the loss of dark information. On the other hand, known pixel areas and image sizes are computed to recover small black areas. If one of the following conditions is satisfied, it will be recovered:
  • The black area is entirely encircled by the white area, and its area is less than 50% of the white area;
  • The region is located at the edge of the image, i.e., at least one point of its outline is located at the left, right, top, or bottom edge of the image.
2.
Suppressing the halo effect
Based on the physical characteristics of the halo, its luminance distribution satisfies T halo _ low I ( x , y ) T halo _ high . According to the formula for converting RGB to YUV (Y represents luminance), the range of halo brightness of a set of images is obtained, and the thresholds T halo _ low and T halo _ high are determined to eliminate the influence of halo.
  Y = 0.299 × R + 0.587 × G + 0.114 × B U = 0.169 × R 0.331 × G + 0.5 × B + 128 V = 0.5 × R 0.419 × G 0.081 × B + 128
where Y denotes luminance, which represents the light and dark information of an image, U denotes Blue-difference Chroma, which represents the difference between blue and luminance in the color information, and V denotes Red-difference Chroma, which represents the difference between red and luminance in the color information.
To perform halo separation, a double threshold segmentation is applied to generate a halo mask, and a logical XOR operation is used to eliminate the interference of the halo on the target area. The operation formula is as follows:
B split ( x , y ) = B raw ( x , y ) B halo ( x , y )
where B halo ( x , y ) represents the binary image of the extracted part of the halo, B raw ( x , y ) represents the initial binary image, and B split ( x , y ) represents the binary image after separating the halo.
The halo suppression strategy adopted in this paper is based on the dual threshold ( T halo _ low and T halo _ high ) setting to identify and remove halo areas. This method has certain limitations in practical applications, mainly reflected in the sensitivity of threshold selection: when the brightness of the Earth or deep-space background falls into the [ T halo _ low , T halo _ high ] interval, it may be misjudged as a halo area and mistakenly removed. In order to reduce misidentification, we usually adopt a more conservative strategy in design, that is, appropriately increase T halo _ low and reduce T halo _ high , so that the range of [ T halo _ low , T halo _ high ] is slightly smaller than the actual halo brightness interval. This approach improves the accuracy of halo extraction and reduces misidentification, but in some scenarios, such as when the halo brightness is close to the background or the main body of the Earth, some halo areas may not be completely suppressed.
3.
Contour analysis and region optimization
Extract the contours of the connected component, extract all the closed contours { C i } i = 1 N from B split ( x , y ) , and calculate the area A i and the average brightness μ i of each contour. Establish a multi-feature scoring mechanism, and construct a comprehensive evaluation function:
S i = A i × μ i ,
and select the contour C max with the highest score as the Earth candidate area. The extracted regions are expanded and filled, and a morphological dilation operation [24] is performed on the region of contour C max to compensate for segmentation errors:
B expanded ( x , y ) = B C max ( x , y ) K dilate ,
where K dilate represents the circular structural element and B expanded ( x , y ) denotes the binary image of the filling expansion after selecting the contour C max . Figure 7 illustrates an example of the process of extracting the Earth region.
4.
Post-processing and mask generation
Apply a Bilateral Filter to smooth the noise inside the region while preserving the edge information [25]. The filtering equation is as follows.
I filtered ( x , y ) = 1 W p q Ω G σ s ( p q ) G σ r ( | I ( p ) I ( q ) | ) I ( q ) ,
where G σ s and G σ r denote the spatial-domain and luminance-domain Gaussian kernels, respectively, and W p is the normalization factor.
Removing noise from the edges of the Earth by morphological operation, using the closing operation [24], eliminating fine noise, using first a dilation operation to enhance the selected region and then an erosion operation to clean up the fine noise:
B final ( x , y ) = ( B expanded ( x , y ) K dilate ) K erode ,
where K dilate and K erode denote the dilation and erosion structural elements, respectively. B final ( x , y ) represents the binary image obtained after the closing operation [24]. The optimized binary image B final ( x , y ) serves as the definitive mask M earth ( x , y ) for the Earth region, with its logical definition articulated as follows:
M earth ( x , y ) = 1 Internal   ( B final ( x , y ) = 255 , Earth   region ) 0 External   ( otherwise ) ,
where M earth represents the final Earth region mask.
This module effectively solves the problems of halo interference, edge blur, and noise sensitivity through multi-stage refinement processing.

3.2.2. Extract Satellite Target Area

The determination of the final satellite target area involves two components: the adaptive image enhancement module and the target area mask construction module. Figure 8 illustrates the specific steps and processes involved in these two components.
The target area extraction process is analogous to the extraction of Earth areas. The region with the second-highest comprehensive score is selected from the original image to preliminarily determine the target’s location. Subsequently, the original image undergoes preprocessing using the RetinexFormer method. The following process is similar to the target extraction of a single satellite image. The preprocessed image is transferred to the adaptive image enhancement module to obtain the enhanced image B enhanced . The preliminarily identified target area is mapped onto image B enhanced , whereupon edge textures and detailed information in image B enhanced are utilized to refine and expand the target area. Figure 9 illustrates various binary images utilized in the process of determining the target area mask.
The grayscale image B en-gray of image B enhanced undergoes threshold segmentation using the Otsu algorithm [22], followed by edge detection with the Canny operator [23]. Subsequently, the edge detection extension algorithm is applied to detect the original target boundary and expand it outward while maintaining its shape. In cases where the extended edge intersects with other edges, the intersection is retained; if there is no intersection, the original boundary remains intact. This method effectively prevents the loss of the target area. Following this, the results from edge detection and threshold segmentation are combined, allowing for further expansion and refinement of the target area. Any regions identified as mergeable are combined to minimize the risk of target area loss. Finally, the dynamic noise threshold is calculated for denoising, resulting in the final target area mask. Figure 10 presents the comparison of the target area masks and mapped images before and after denoising.
After acquiring the Earth region and satellite target region, the deep-space background area can be extracted through Boolean logic operations. The deep-space background from the original image is mapped onto the enhanced image, ensuring that cosmic background information—such as weak light sources in the deep space—is fully preserved. This process effectively maintains the integrity of the original image’s deep-space background information while improving its visual quality. By applying masks to these areas and fusing the corresponding images, a deep-space background image with more details can be obtained.

4. Experiments

4.1. Dataset Selection

For satellite images, the existing relevant datasets include SPEED [26], SPEED+ [27], SPARK 2021 [4], SPE3R [28], and SPEED-UE-Cube [29], among others. These datasets are primarily utilized for spacecraft pose estimation, 3D Reconstruction, and similar applications. However, low-light enhancement datasets designed specifically for deep-space background targets are very scarce. Table 1 analyzes the available satellite image datasets, detailing the collected scenes, lighting conditions, background noise, bit depth, image resolution, and application types.
Spacecraft Pose Estimation Dataset (SPEED) [26] is the first public benchmark dataset for spacecraft pose estimation and has become the most widely used satellite dataset in recent years. However, SPEED primarily addresses satellite pose estimation issues and does not account for illumination changes or background noise in space scenes. As a result, it is not suitable for low-light enhancement.
In response to these limitations, Tae Ha Park et al. introduced SPEED+ (Next-Generation Spacecraft Pose Estimation Dataset) [27], which considers variations in lighting conditions and enhances the spacecraft pose estimation dataset. SPEED+ includes both synthetic images and hardware-simulated images. The synthetic images are created using OpenGL rendering, similar to the original SPEED, while the hardware-simulated images are generated on SLAB’s Rendezvous and Optical Navigation (TRON) test bench. Lighting conditions for the images are simulated using two light sources: a light box and a sun lamp. Despite these improvements, SPEED+ still does not account for background noise in the space scene.
The SPE3R [28] dataset consists of 3D watertight mesh models of 64 individual satellites from NASA 3D Resources and the European Space Agency’s scientific satellite fleet. Although the dataset contains a rich variety of satellite types, the data are only used to support simultaneous 3D structure representation and pose estimation and still do not consider illumination changes and spatial background noise.
Spacecraft Pose Estimation Dataset of a 3U CubeSat using Unreal Engine (SPEED-UE-Cube) dataset is derived from the SPEED and SPEED+ datasets and is specifically focused on modeling 3U CubeSats [29]. This dataset, which is rendered using Unreal Engine 5, contains airborne images of CubeSat models. However, this dataset is still used to solve the satellite attitude estimation problem and only contains images of 3U CubeSat satellites. Therefore, using this dataset for the validation of methods is not very convincing.
In contrast, the SPARK 2021 dataset is a unique spatial multimodal annotated image dataset. The dataset contains deep-space background images of 10 representative artificial satellites, including AcrimSat, Calipso, CubeSat, and Jason. These data are generated in a realistic space simulation environment with a variety of sensing conditions, including multiple lighting conditions for different orbital scenes, complex cosmic background noise, etc. It is suitable for processing using low-light enhancement methods, so this paper selects deep-space images in the SPARK 2021 dataset for method verification. In addition, we use some low-light images in the SPEED-UE-Cube dataset to verify the method proposed in this paper. The comparison before and after processing is shown in Figure 11.
This experiment processed 3940 satellite images containing the Earth and 51,671 individual satellite images, totaling 55,611 deep-space background images. In terms of experimental design, a multi-dimensional evaluation method was employed to compare and validate against traditional image enhancement techniques and deep learning models. The control group for the experiment consisted of: (1) classic traditional methods, such as histogram equalization and gamma correction; (2) traditional methods based on Retinex theory; and (3) advanced deep learning models, NeRCo and RetinexFormer, which represent cutting-edge approaches in the realm of low-light enhancement.

4.2. Experimental Details

Along with histogram equalization, we considered contrast-limited adaptive histogram equalization, which improves the visual quality of satellite images when combined with gamma correction. Gamma correction, as a nonlinear transformation algorithm, modulates luminance distribution by adjusting the gamma parameter (γ), where the selection of γ values critically determines the image enhancement performance. Given that a fixed γ value may not adequately accommodate varying lighting conditions, two parameters with better effects are selected for comparative experiments (γ = 0.6, γ = 0.8) through experimental verification and theoretical analysis. Additionally, an adaptive gamma correction method [30] is incorporated for visual comparison, ensuring the rigor and scientific validity of the experiment.
In this experiment, we consider both single-scale and multi-scale Retinex algorithms [13], which are grounded in Retinex theory. For the single-scale Retinex algorithm, the Gaussian blur parameter is set to σ = (0.1, 0.1), while the multi-scale Retinex algorithm employs three parameters: σ = (15, 15), σ = (80, 80), and σ = (200, 200). For the deep learning methods, NeRCo and RetinexFormer, the experiments were conducted according to the official requirements. The NeRCo utilizes a pre-trained weight model on the LSRW dataset [31], while RetinexFormer uses the MST_Plus_Plus_NTIRE_4x1800 [14] weight model. The experiments were executed on a Linux system, with models built using version 1.10 of the PyTorch deep learning framework, and performed on an NVIDIA GeForce RTX 4090 graphics card.
These methods have been validated using the test set from the LOL dataset [16] of natural scenes. The methods demonstrate both reliability and effectiveness. Figure 12 illustrates the visual comparative results of image enhancement on the LOL test set utilizing the aforementioned methods.
This paper presents a multi-image fusion enhancement method tailored for low-light images with deep-space backgrounds. The core experimental methods and detailed procedures have been presented in Chapter 3. The key parameters, listed in Table 2, have been validated and optimized using a large dataset of deep-space background images, demonstrating high robustness and practical applicability.

4.3. Ablation Study

To evaluate the effectiveness of the edge detection extension module proposed in this paper for enhancing the integrity of the target area, we conducted an ablation experiment. We analyzed and compared the differences in the enhanced images obtained before and after the integration of the edge detection extension module. The results of the experiment are presented in Figure 13.
In addition, this paper conducts more detailed ablation study on whether to use RetinexFormer preprocessed images for target region extraction. The specific experimental design is as follows: (1) target region extraction using original images without edge detection extension module; (2) target region extraction using RetinexFormer preprocessed images without edge detection extension module; (3) target region extraction using RetinexFormer processed images with edge detection extension module. Some visual comparison is illustrated in Figure 14. Please zoom in to compare more details.
The experimental results demonstrate that the edge detection extension module, coupled with the preprocessing of RetinexFormer, effectively recovers missing portions of the target region and enhances the integrity of the satellite target area.

4.4. Evaluation Metrics

The evaluation system employs a comprehensive method that combines subjective visual assessment with objective quantitative indicators. Subjectively, various methods are visually compared, focusing on the visual effects of deep-space background satellite images and the effectiveness of noise removal, such as halo suppression.
Objectively, several indicators are utilized. Peak Signal-to-Noise Ratio (PSNR) and Structural Similarity Index (SSIM) [32] measure the differences between the enhanced and original images, helping to determine whether excessive distortion or information loss has occurred. PSNR quantifies the noise level introduced during enhancement, whereas SSIM evaluates the preservation of structural information, ensuring that the enhancement process maintains target morphology and edge details. Additionally, the Learned Perceptual Image Patch Similarity (LPIPS) [33] metric serves as a deep learning–based perceptual measure. By comparing high-level features extracted from convolutional neural networks, LPIPS can capture perceptual differences more closely aligned with human visual perception than traditional pixel-level methods. Collectively, these metrics provide a comprehensive evaluation of the enhancement process, effectively quantifying the introduction of noise and artifacts while assessing the preservation of fine details.
This multi-level evaluation framework can fully verify the comprehensive performance of the method in improving the quality of low-light satellite images.

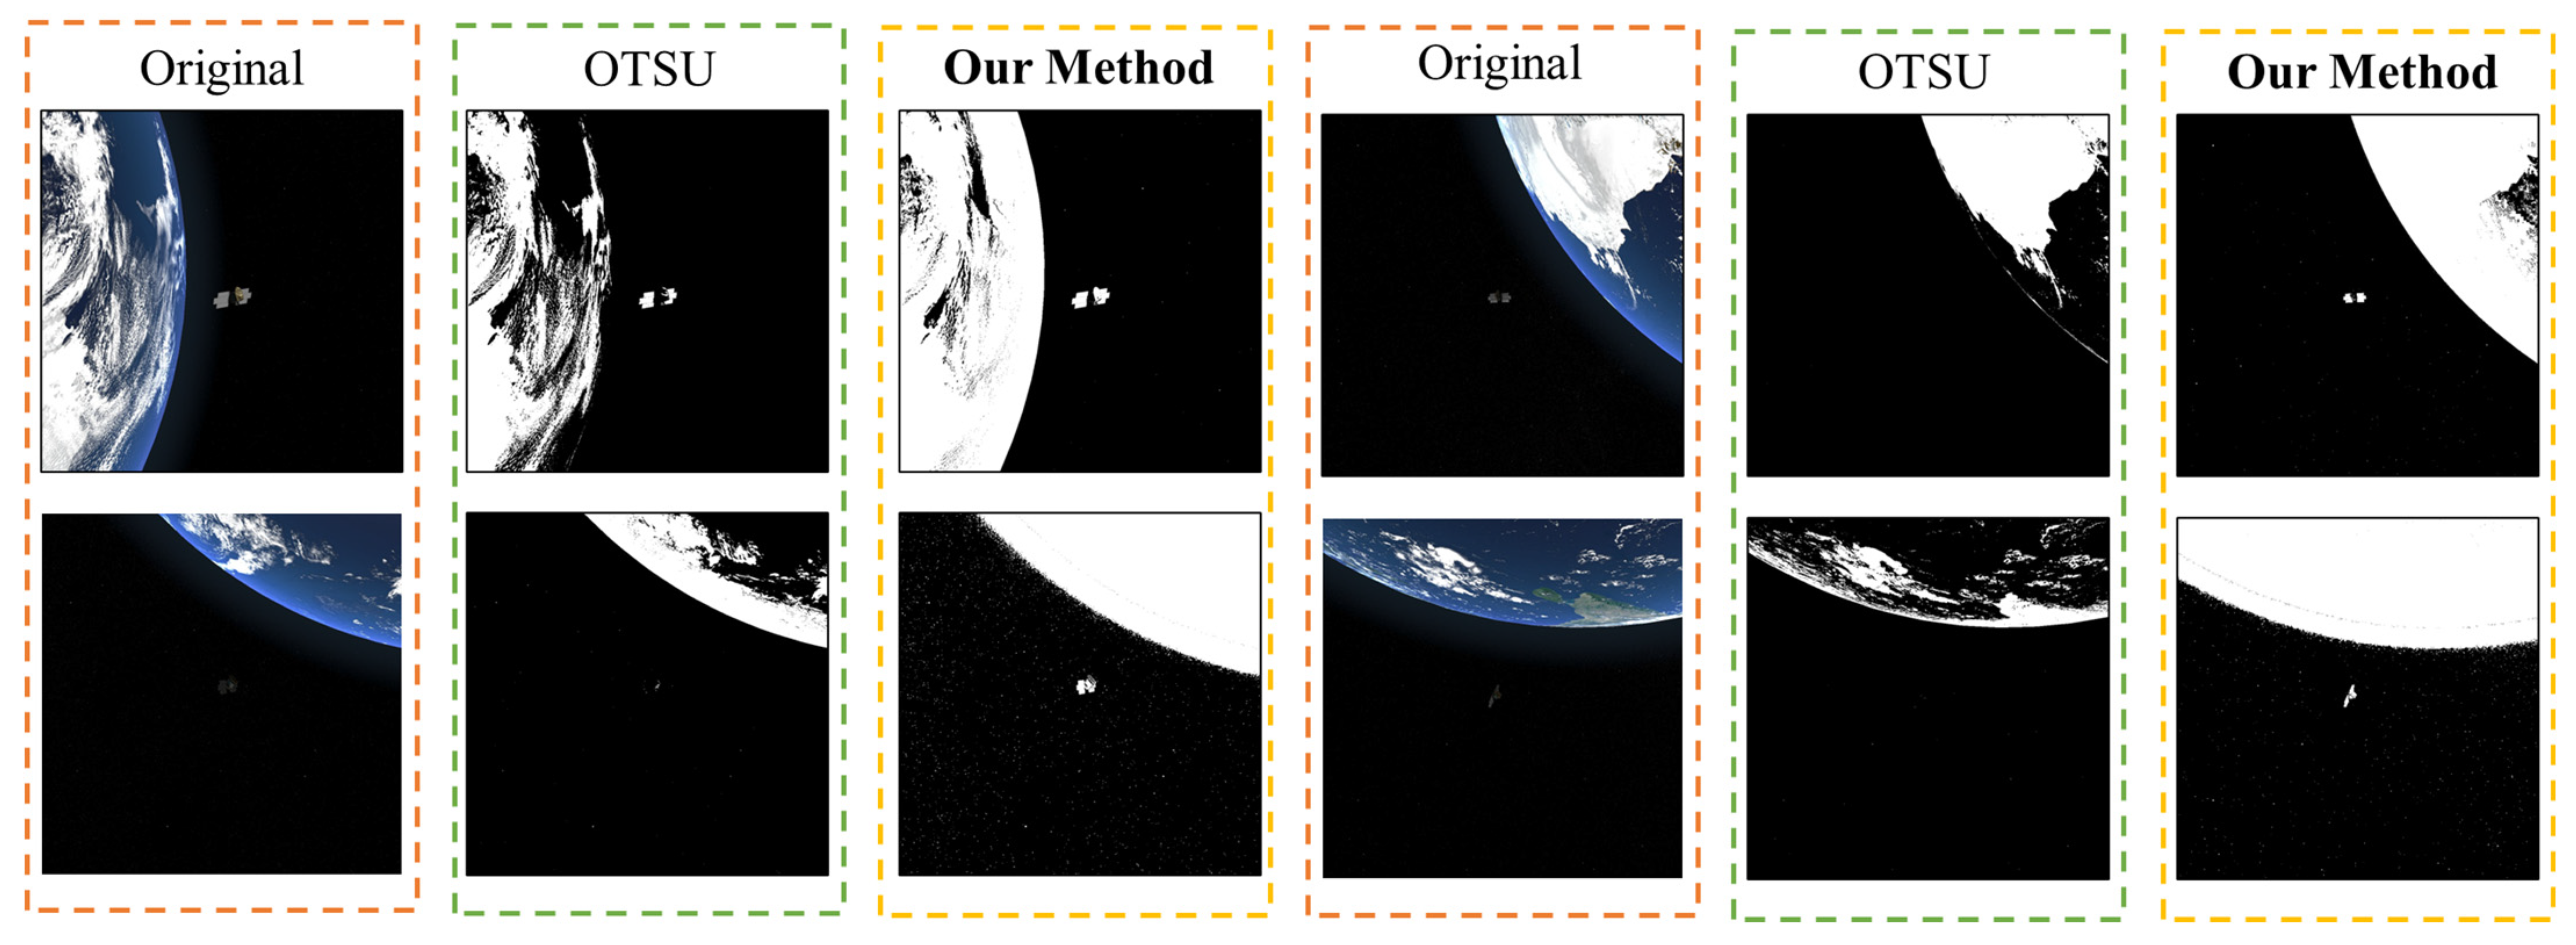
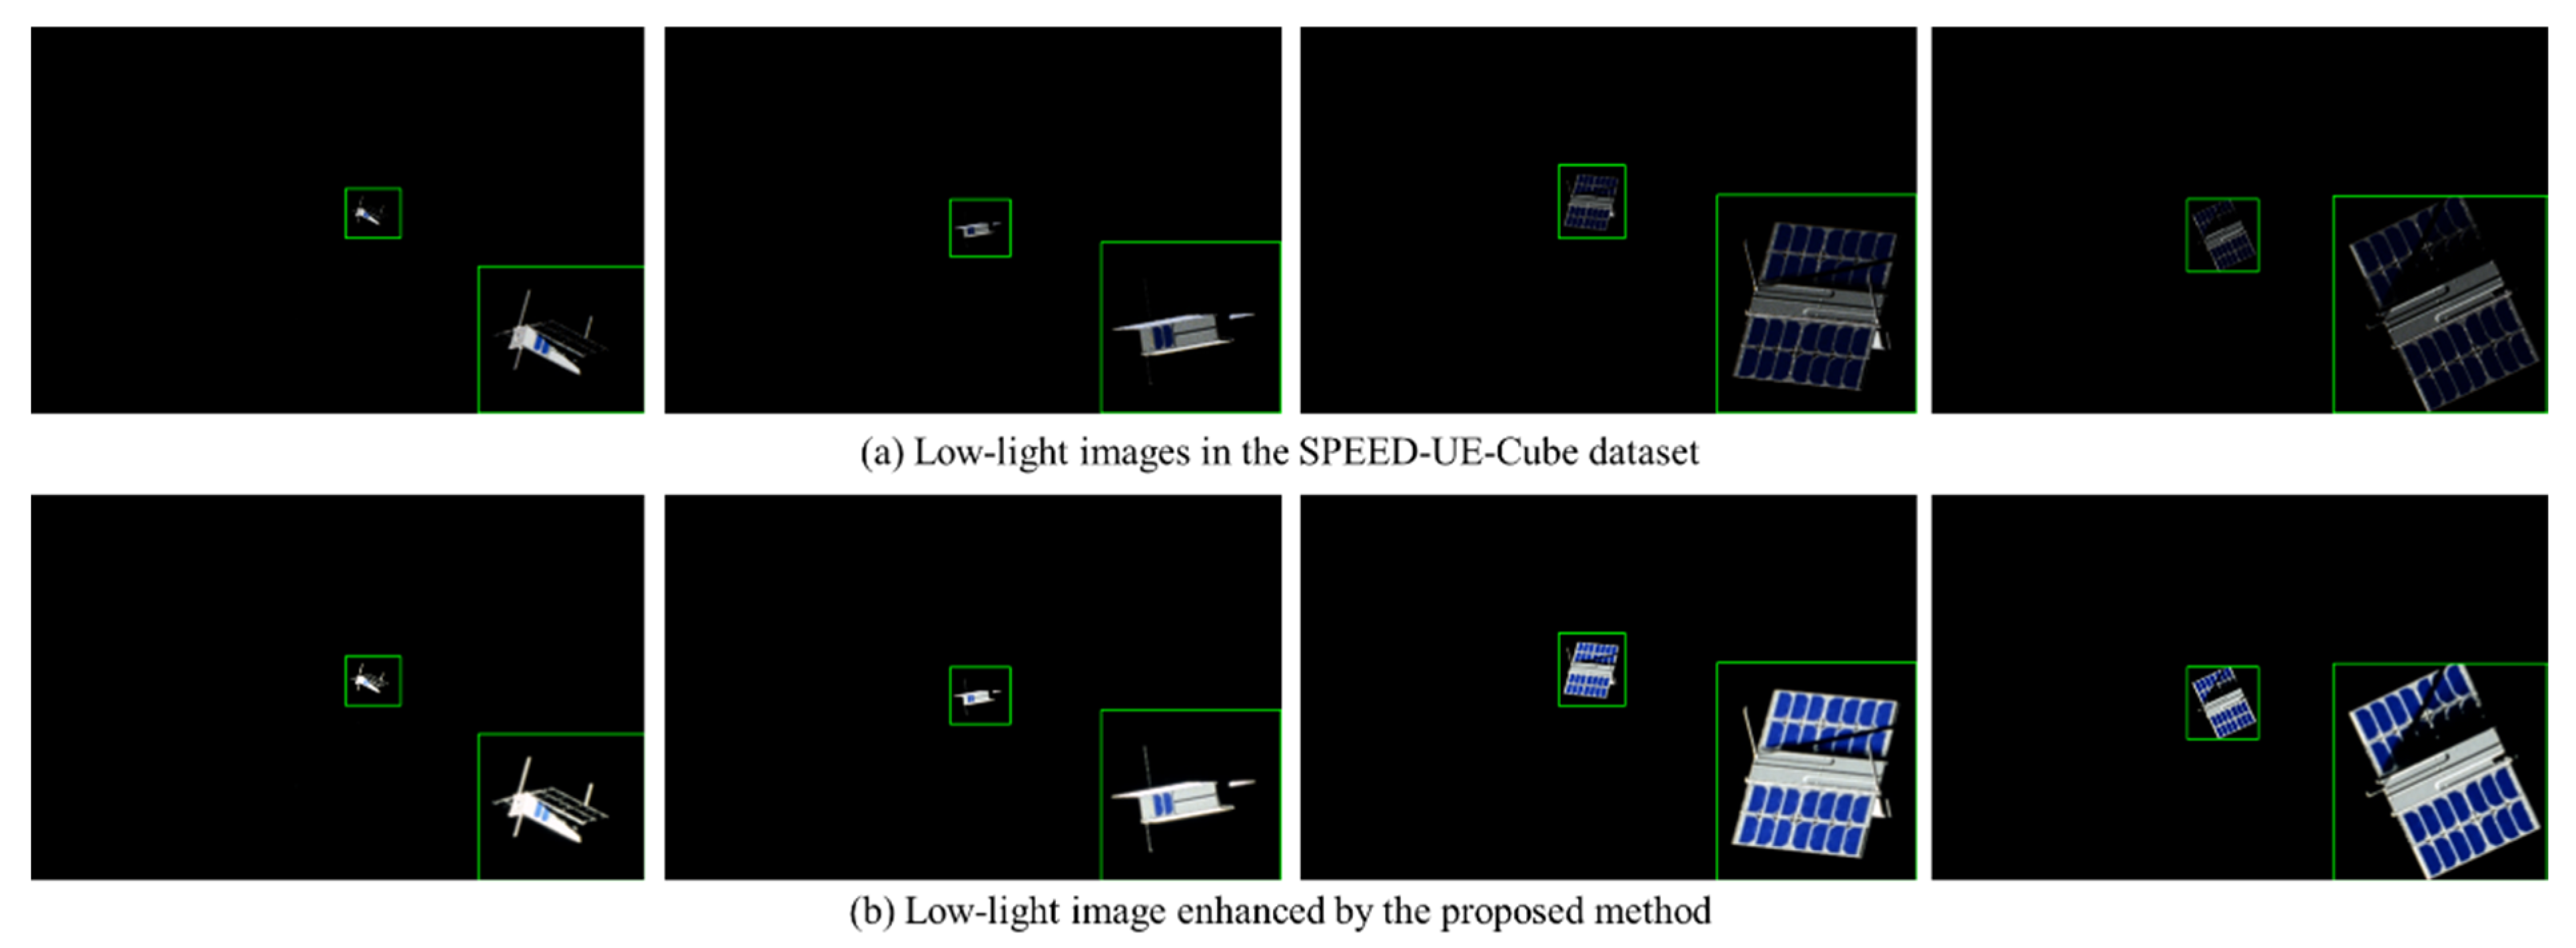
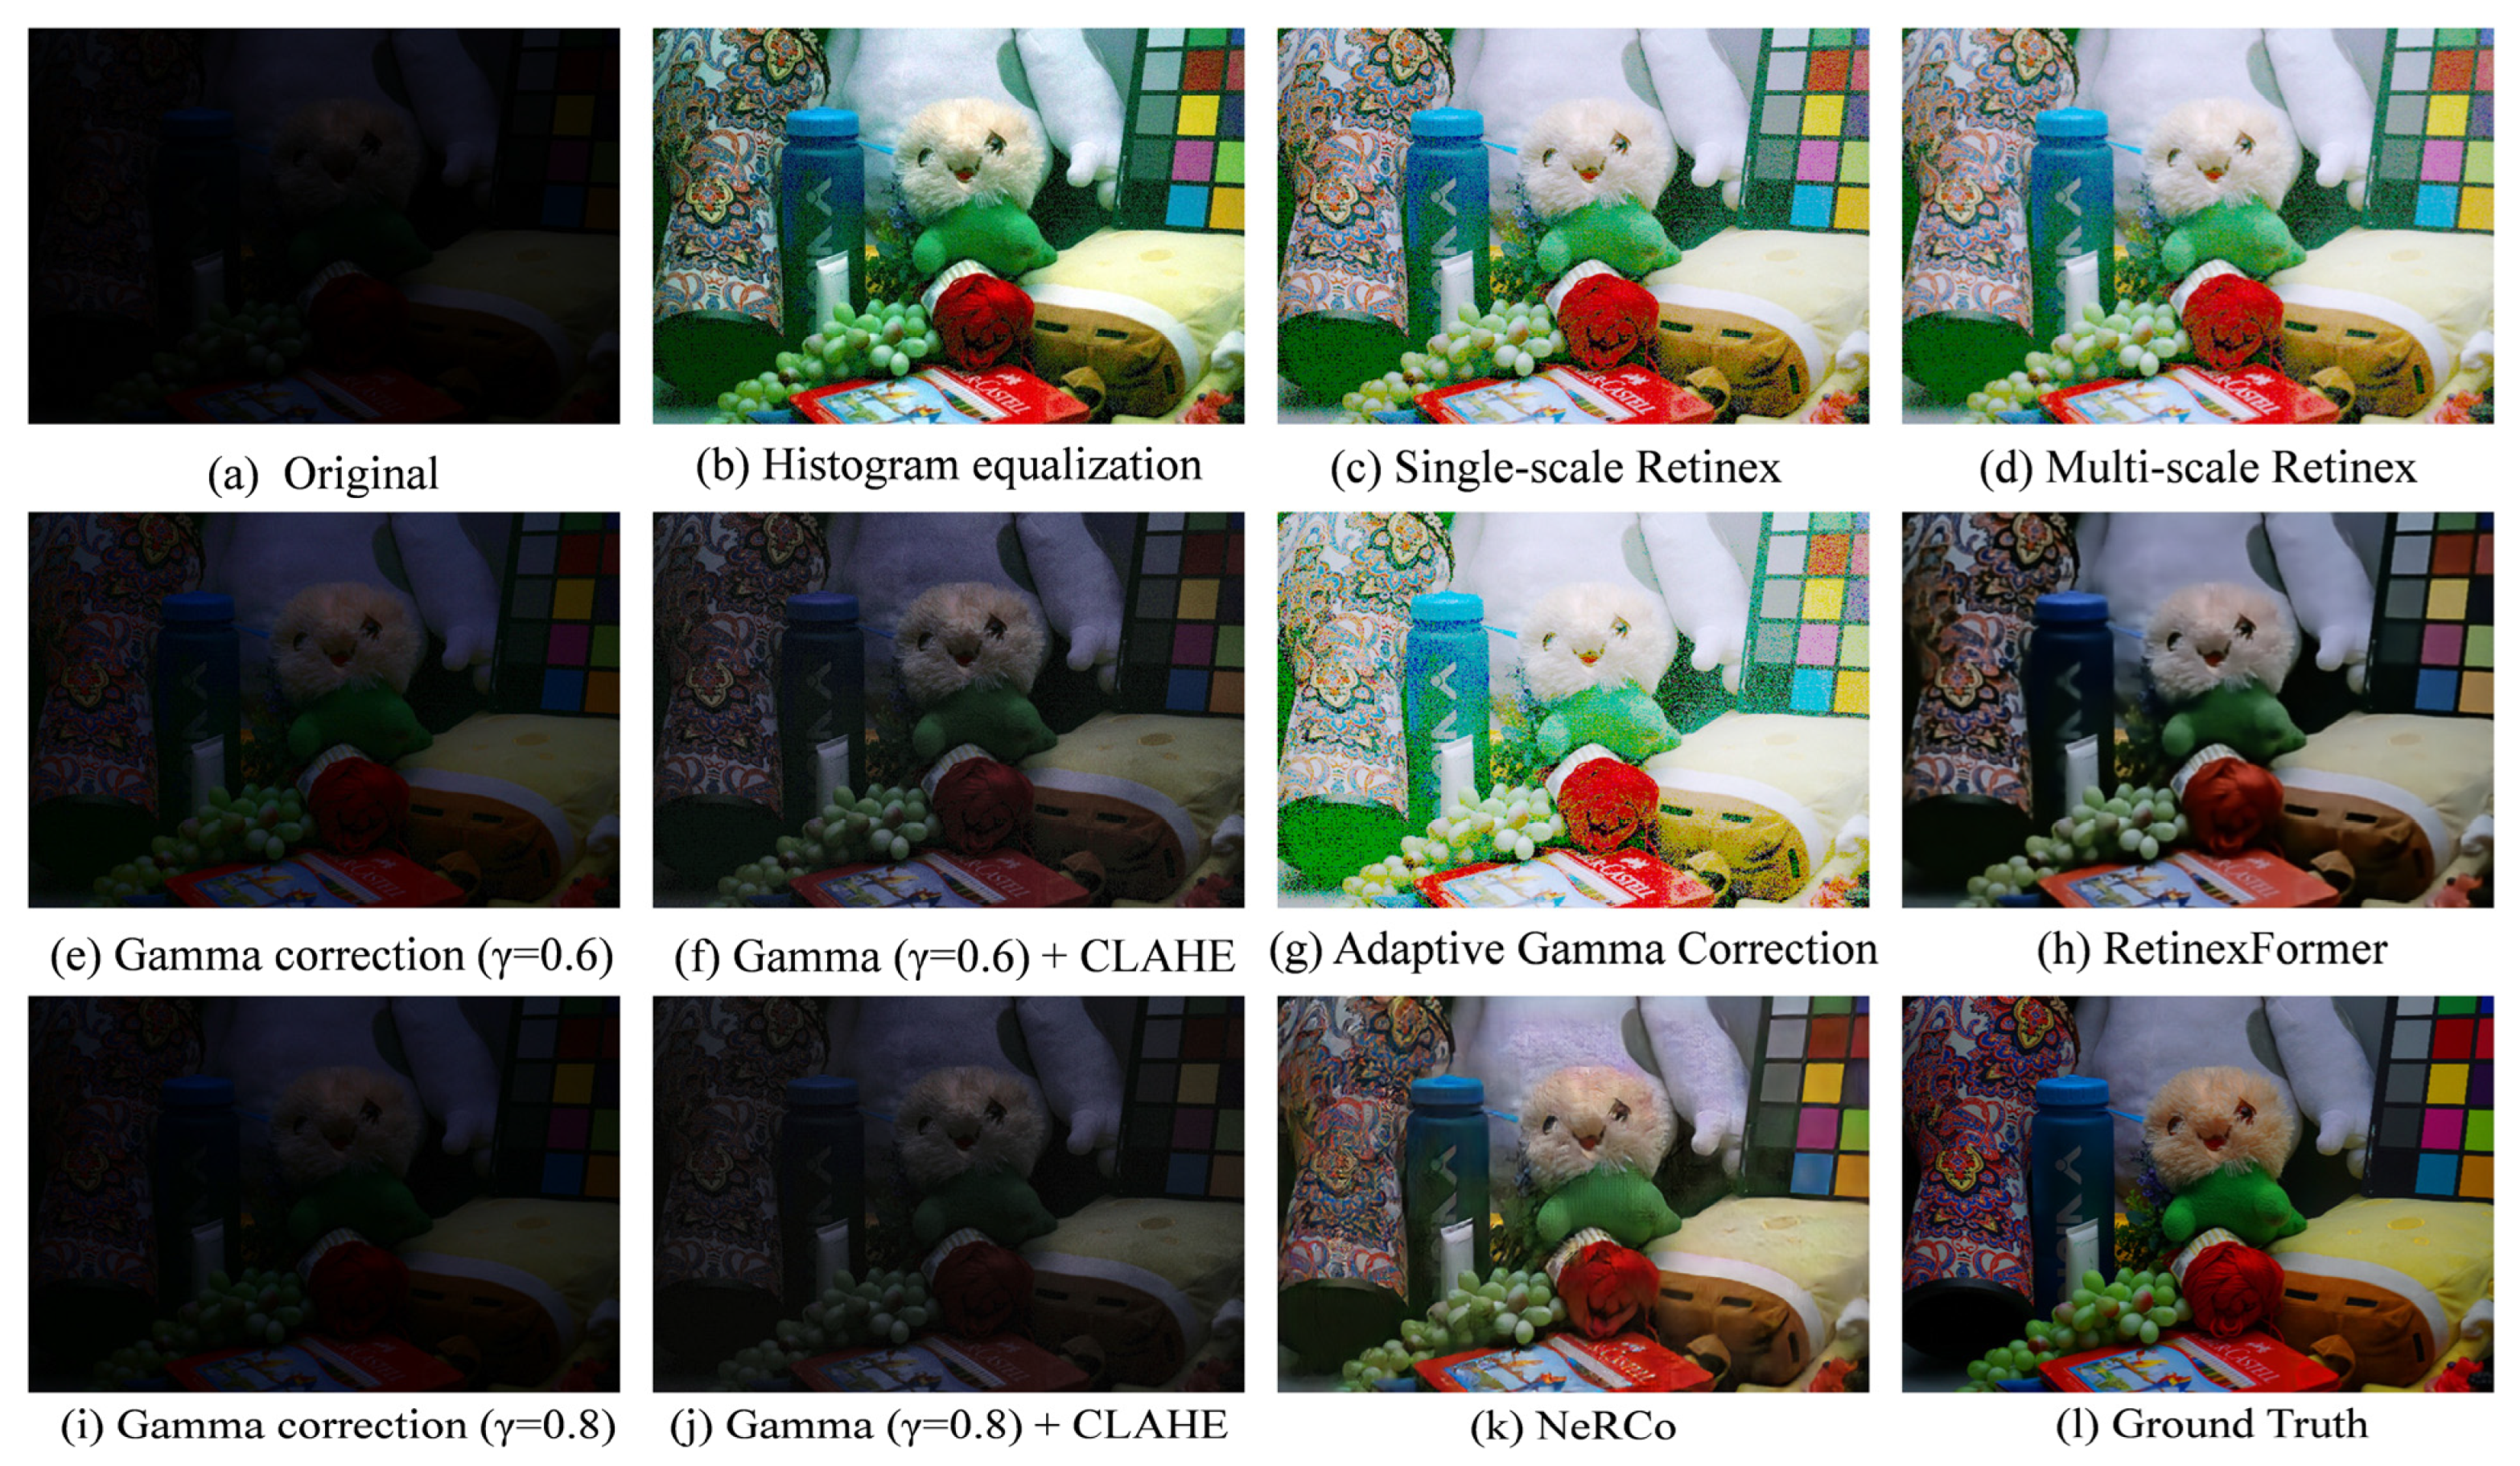
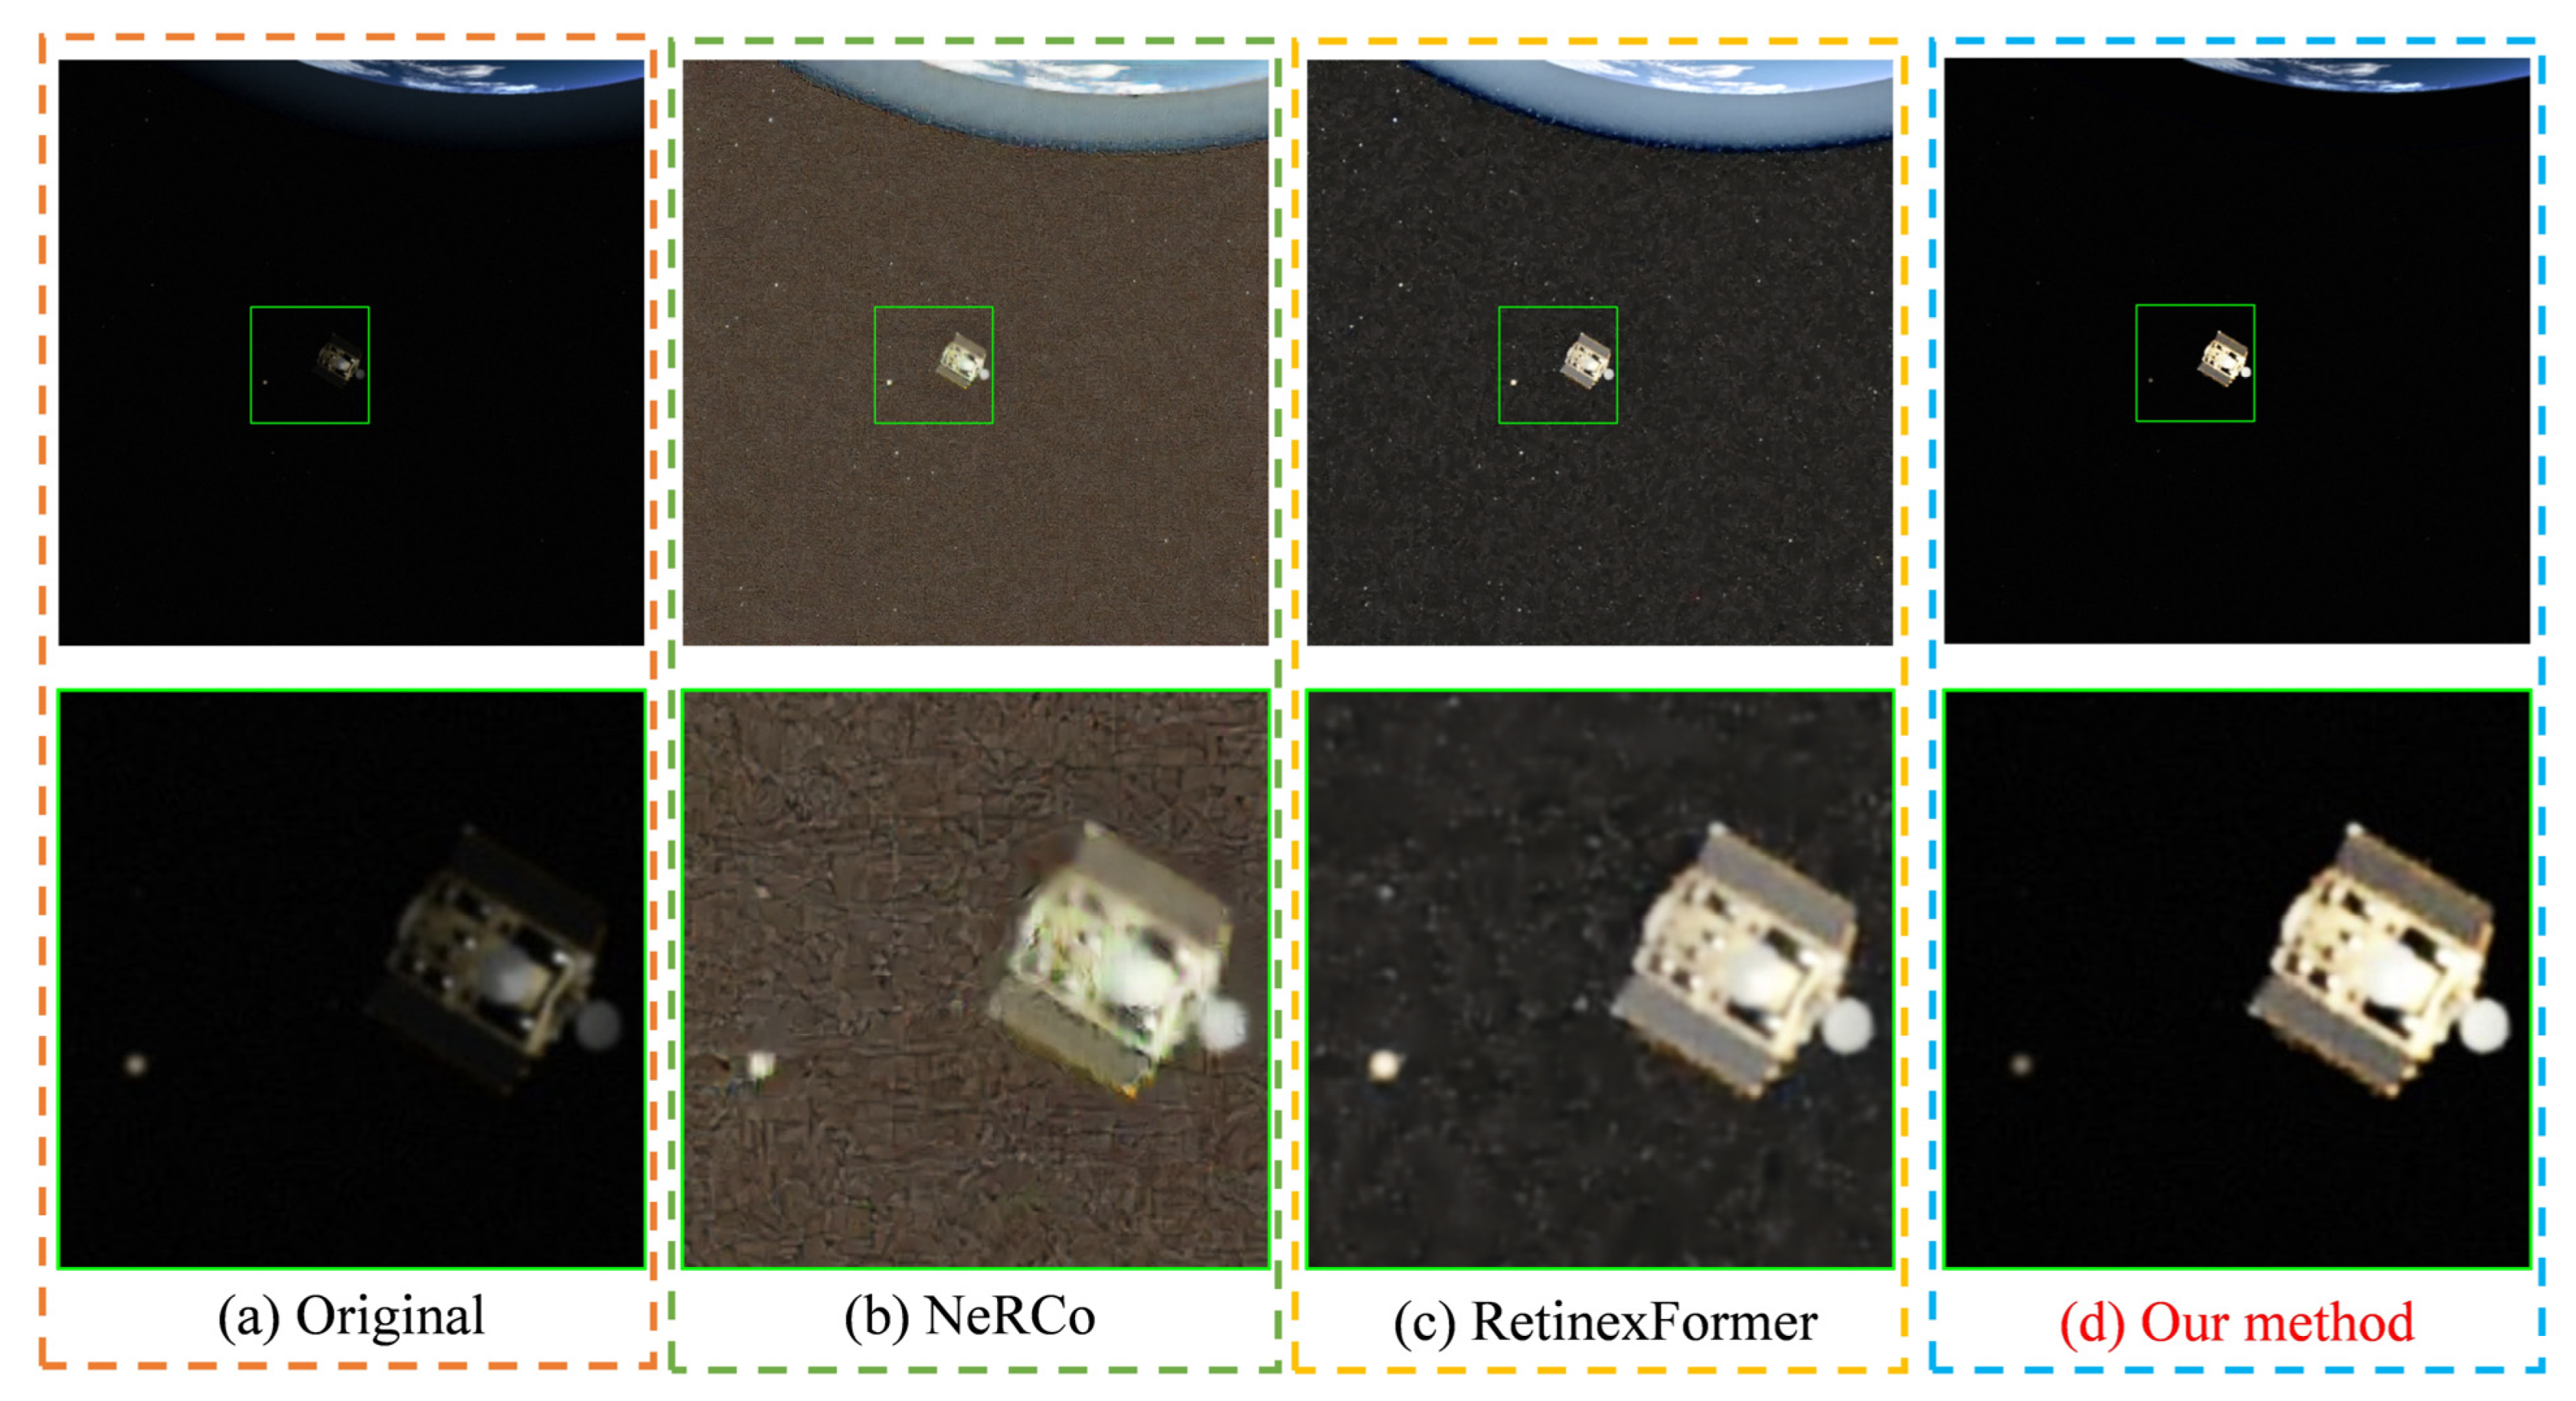
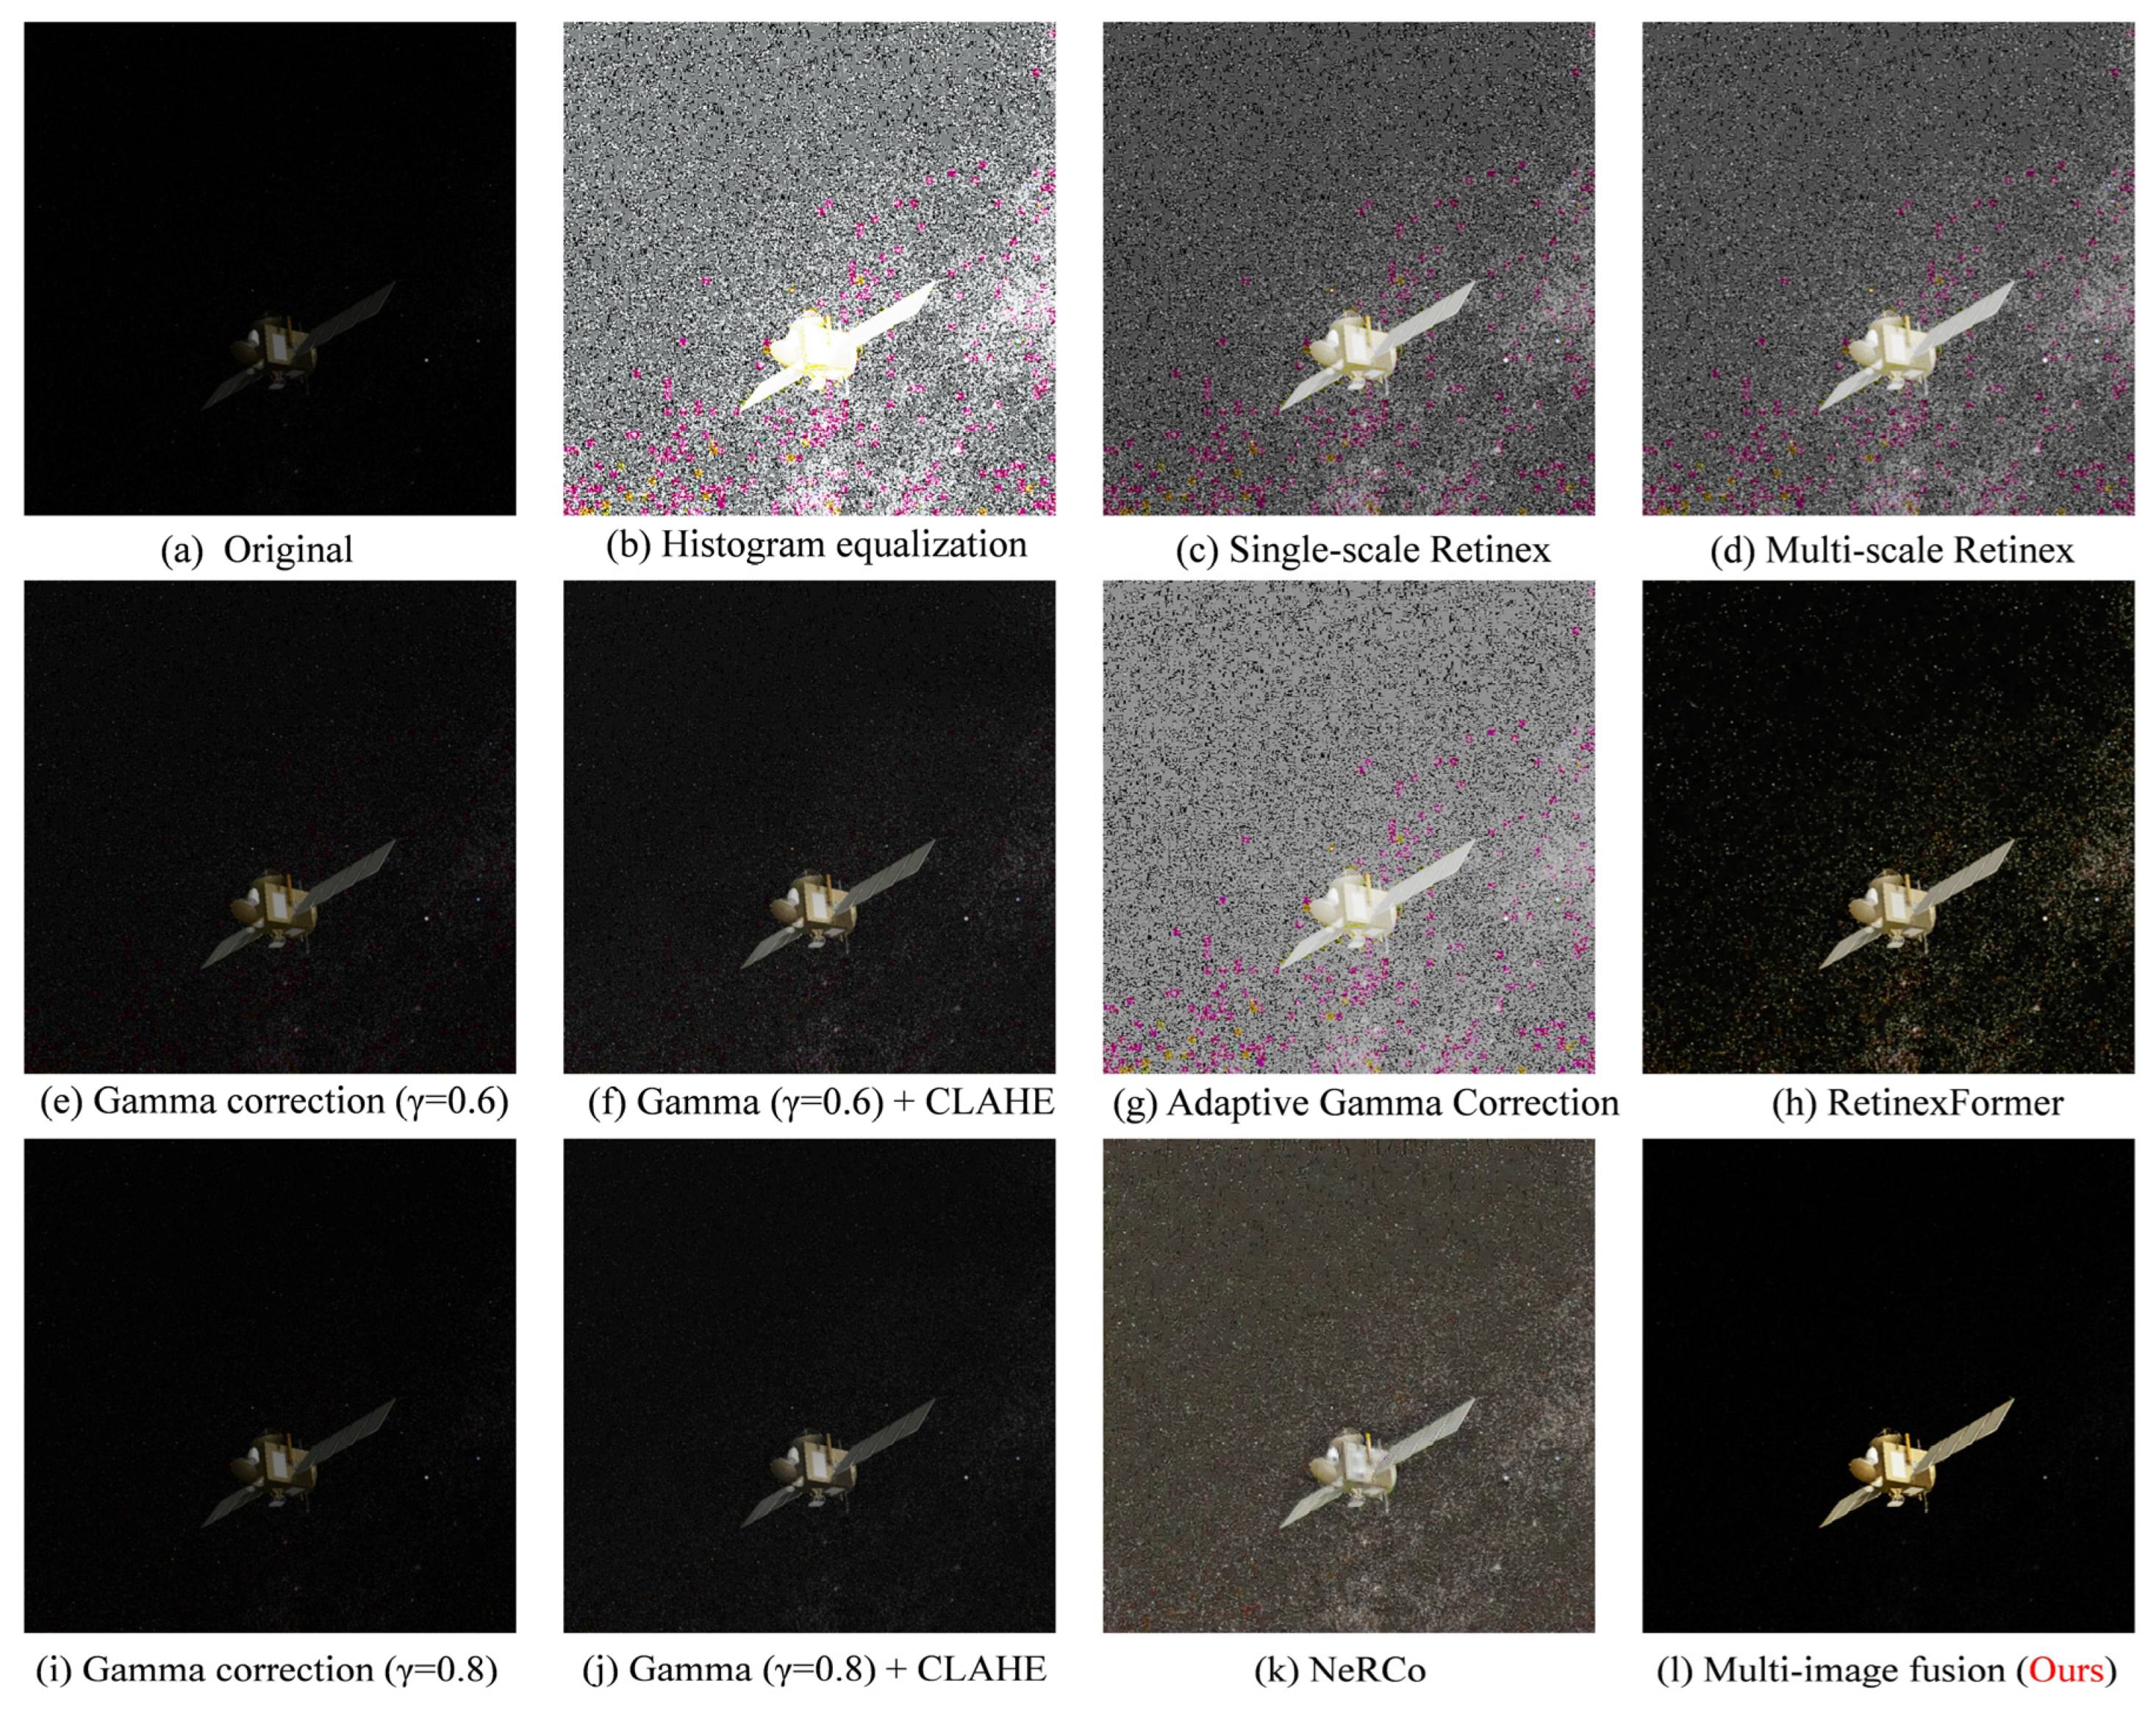
4.5. Visualization (Qualitative Comparison)

The original image serves as a reference for comparing images enhanced through various methods. Figure 15 provides a localized visual comparison with two state-of-the-art deep learning methods. A comparative analysis of the local views of satellite targets enhanced by different methods reveals that while the deep learning-based approaches, NeRCo and RetinexFormer, enhance satellite targets to some extent, they also introduce excessive noise during the enhancement process, ultimately degrading visual quality. In contrast, the proposed method not only effectively preserves and enhances fine details but also demonstrates superior capability in suppressing noise and artifacts, achieving significantly better visual results than the other two methods.
In addition, the method proposed in this paper demonstrates strong performance in suppressing the Earth halo. Figure 16 illustrates the halo suppression effect before and after enhancing deep-space background images.
The method proposed in this paper also effectively enhances low-light single satellite images. This method is applicable to many types of satellite images. Figure 17 and Figure 18 illustrate the visual comparisons of Jason and Aura satellite images before and after applying the proposed method, respectively.
Figure 19 presents a visual comparison of multiple enhancement methods on a satellite image containing the Earth region. Subsequently, we conduct a qualitative analysis.
The histogram equalization method effectively enhances the satellite target and presents space target information; however, it introduces excessive noise and artifacts, causing significant distortion in the color and brightness of the Earth region. The single-scale and multi-scale Retinex methods provide slightly improved visual results compared to histogram equalization but still introduce considerable noise and artifacts.
The gamma correction method, with a γ value of 0.6, enhances target details to some extent. When combined with the CLAHE method, it further improves detail clarity; however, it also amplifies the Earth halo effect, leading to a reduction in overall image quality. Conversely, when γ is set to 0.8, the enhancement effect is limited, yielding under-enhancement results. The adaptive gamma correction method improves satellite target visibility but introduces significant noise, compromising image quality. Among the deep learning-based approaches, NeRCo and RetinexFormer enhance satellite targets and improve texture details; however, they also introduce substantial noise into the deep-space background, adversely affecting the overall visual quality. In contrast, the proposed method not only enhances satellite targets while preserving fine details but also effectively suppresses interference from the Earth halo and minimizes the generation of noise and artifacts, ultimately achieving superior enhancement performance.
Figure 20 presents a visual comparison of single satellite images processed using various enhancement methods. Among these methods, histogram equalization produces the poorest results, causing severe distortion of the satellite target and introducing substantial noise, which significantly degrades image quality. Adaptive histogram equalization performs slightly better; however, it still introduces considerable noise and artifacts during the enhancement process.
Both the single-scale and multi-scale Retinex methods enhance satellite targets to some extent but also introduce a significant amount of noise. The gamma correction method achieves better performance compared to the aforementioned methods, yet it still introduces a slight amount of noise. The deep learning-based NeRCo method demonstrates suboptimal performance, as it enhances the target image while generating excessive noise, ultimately reducing image quality. The RetinexFormer method performs better than NeRCo but still introduces some noise during the enhancement process. In contrast, the proposed method achieves a better balance between target enhancement and noise suppression, effectively improving image quality.

4.6. Quantitative Evaluation

The experimental results of the proposed method are compared with those of other methods as follows. Table 3 provides the quantitative evaluation data for various low-light image enhancement methods applied to satellite images containing the Earth region, while Table 4 presents the results for single satellite images. In both tables, values highlighted in red indicate the best performance, whereas values in blue denote the second-best performance.
The experimental results show that the proposed method outperforms traditional methods and mainstream deep learning models in qualitative and quantitative evaluation. In the visualization comparison, the proposed method outperforms other methods in visual effects, especially in suppressing the interference of the Earth halo and eliminating noise artifacts. The visual comparisons are presented in Figure 19 and Figure 20. It can be observed that some traditional methods, such as gamma correction and CLAHE, fail to effectively enhance fine details, leading to under-enhancement results. Meanwhile, methods based on Retinex theory and deep learning, including SSR, NeRCo, and RetinexFormer, tend to blur details and amplify noise. In contrast, the proposed method not only enhances contrast and reveals finer details more clearly but also effectively suppresses the Earth halo.
In the quantitative evaluation, this study processed 10 types of representative artificial satellites, encompassing 3940 satellite images containing the Earth and 51,671 individual satellite images. When assessing images that include the Earth, the proposed method achieved PSNR exceeding 35.61 dB, which is more than 2.92 dB higher than the second-best method (gamma correction with γ = 0.8) and 6.18 dB higher than the deep learning–based RetinexFormer method. Additionally, the SSIM reached 0.782, greatly surpassing the scores of both NeRCo and RetinexFormer. For individual satellite images, the proposed method achieved a PSNR of over 50.79 dB and SSIM above 0.95, indicating that the enhancement method proposed in this paper can improve details while avoiding excessive image distortion and information loss, and effectively suppresses noise and artifacts.
These results demonstrate that our method can simultaneously enhance image contrast while mitigating halo artifacts and noise, achieving a well-balanced enhancement performance.

4.7. Efficiency Analysis

In order to evaluate the real-time performance of the proposed method, we conduct efficiency analysis from two aspects: theoretical computational complexity and actual running time test.

4.7.1. Computational Complexity Analysis

The main processing flow of the proposed method includes: image reading and preprocessing (brightness analysis and contrast enhancement), image denoising (edge detection, morphological processing, and connected domain extraction), and image fusion and result output. The computational complexity of each module is analyzed as follows: In the image preprocessing stage, the main operations include statistical distribution analysis of grayscale images, contrast enhancement, and adaptive gamma correction. These operations are pixel-by-pixel processing, with a time complexity of O(n), where n represents the total number of pixels in the image. In the image denoising stage, CUDA acceleration is implemented through GPU, and Canny edge detection, binarization, morphological processing, and connected domain extraction are performed in sequence. Canny edge detection and binarization are essentially linear scanning processes with a complexity of O(n); morphological opening operations use fixed-size kernels for local sliding window calculations, with a theoretical complexity of, where k represents the size of the structural element (kernel). Connected domain extraction completes region labeling by scanning the image twice, and the complexity is also O(n).
The time complexity of the overall processing flow of this method is O(n), where n is the number of image pixels. Each module, such as Canny edge detection and morphological processing, is a linear or local window operation, and most operations are completed on the GPU, which significantly improves the operating efficiency.

4.7.2. Runtime Test

To evaluate the efficiency of the proposed method, we tested images of different resolutions on the following platforms. The test environment is as follows:
  • CPU: Intel(R) Xeon(R) Platinum 8368 CPU @ 2.40 GHz;
  • GPU: NVIDIA RTX 4090, 24 GB VRAM;
  • Operating system: Ubuntu 20.04.
The experiment uses 10 types of satellite images from the SPARK 2021 dataset. For each type, 200 images are randomly selected. The proposed method is tested at three different resolutions: 256 × 256, 512 × 512, and 1024 × 1024. For each resolution, the average processing time (in milliseconds) and frame rate (Frames Per Second, FPS) are recorded. The detailed results for each satellite image type are presented in Table 5.
To more intuitively show how the performance changes with image resolution, we plotted a bar chart of the average processing time of different satellite images at three resolutions, as shown in Figure 21.
The results show that at a lower resolution (256 × 256), the average processing time is less than 75 ms, and the frame rate can reach more than 13 FPS, which meets the real-time processing requirements of most space scenarios. At a resolution of 1024 × 1024, although the processing time has increased, it can still reach about 5 FPS, showing good scalability and algorithm stability.
In future actual deployments, target detection can be combined to determine space targets, set a small sliding window, and only enhance and process the target area. This will further reduce the computational burden, improve the real-time response capability of the overall system, and meet the real-time processing requirements of applications in space scenes.

5. Conclusions

Since the existing low-light enhancement methods do not consider the particularity of the space environment, they are not effective in processing deep-space background targets. To address this problem, this study proposes a deep-space background low-light enhancement method based on multi-image fusion, which effectively solves the problems of Earth halo interference and color distortion, and significantly improves the visibility of details of satellite targets while ensuring high fidelity of the Earth region. The method achieves adaptive image enhancement through image preprocessing, dynamic adjustment of contrast, brightness, and noise removal, effectively suppresses the influence of the Earth halo, retains the detailed information of deep-space background, and effectively improves the image quality of targets in deep-space background. Experimental results show that the proposed method is superior to traditional methods and mainstream deep learning models in qualitative and quantitative evaluation. The method is suitable for various types of satellite image processing, especially when processing satellite images with high noise and low contrast, and has a good enhancement effect. However, the method has some limitations, such as the inability to suppress the halo completely and to process scenes where the target overlaps with the Earth region.
To address the limitations of existing halo suppression techniques, we plan to exploit spatial and contextual information modeling in future work. The current halo suppression method is mainly based on brightness threshold processing, ignoring the differences in spatial structure and texture features between the halo and the background in the image. To improve recognition accuracy, we plan to introduce a spatial context modeling mechanism, using super-pixel segmentation or edge-preserving region growing algorithm, combined with local texture direction, consistency, and other information, to accurately segment the halo edge area. Furthermore, we consider using graph neural networks (GNNs) to model the connection relationship between pixels or regions in the image. By modeling the image as a graph structure (such as a pixel adjacency graph or a super-pixel graph), each node represents a local region, and the weight of the edge is determined based on the spatial distance and feature similarity between regions, thereby constructing a weighted graph reflecting the internal structure of the image. The graph neural network is used to propagate contextual information on the structure and identify halo regions with continuity and diffusion characteristics.
As part of our future work, we aim to address the challenge of limited deep-space background image data. To this end, we plan to explore self-supervised learning and a few shot learning strategies, which are expected to improve the method’s performance under small-sample conditions. Moreover, in future practical deployments, we intend to integrate target detection to first locate space objects. Based on this, a small sliding window can be applied to enhance and process only the target region. This strategy is expected to further reduce computational burden, improve the real-time responsiveness of the system, and better satisfy the requirements of on-orbit imaging tasks.

Author Contributions

Conceptualization, H.W. and Q.L.; methodology, Q.L. and F.H.; software, F.H.; validation, F.H. and Z.R.; formal analysis, F.Z.; investigation, F.H.; resources, H.W.; data curation, F.H.; writing—original draft preparation, F.H.; writing—review and editing, Z.R., F.Z. and C.K.; visualization, F.H.; supervision, Q.L.; project administration, H.W.; funding acquisition, H.W. All authors have read and agreed to the published version of the manuscript.

Funding

This research received no external funding.

Institutional Review Board Statement

Not applicable.

Informed Consent Statement

Not applicable.

Data Availability Statement

The data supporting this study’s findings are available from the author upon reasonable request.

Conflicts of Interest

The authors declare no conflicts of interest.

References

  1. Zhou, B.-Z.; Cai, G.-P.; Liu, Y.-M.; Liu, P. Motion Prediction of a Non-Cooperative Space Target. Adv. Space Res. 2018, 61, 207–222. [Google Scholar] [CrossRef]
  2. Su, S.; Niu, W.; Li, Y.; Ren, C.; Peng, X.; Zheng, W.; Yang, Z. Dim and Small Space-Target Detection and Centroid Positioning Based on Motion Feature Learning. Remote Sens. 2023, 15, 2455. [Google Scholar] [CrossRef]
  3. Bian, H.; Cao, J.; Zhang, G.; Zhang, Z.; Li, C.; Dong, J. TYCOS: A Specialized Dataset for Typical Components of Satellites. Appl. Sci. 2024, 14, 4757. [Google Scholar] [CrossRef]
  4. Musallam, M.A.; Gaudilliere, V.; Ghorbel, E.; Al Ismaeil, K.; Perez, M.D.; Poucet, M.; Aouada, D. Spacecraft Recognition Leveraging Knowledge of Space Environment: Simulator, Dataset, Competition Design and Analysis. In Proceedings of the 2021 IEEE International Conference on Image Processing Challenges (ICIPC), Anchorage, AK, USA, 19–22 September 2021; IEEE: New York, NY, USA, 2021; pp. 11–15. [Google Scholar]
  5. Lv, P.-Y.; Sun, S.-L.; Lin, C.-Q.; Liu, G.-R. Space Moving Target Detection and Tracking Method in Complex Background. Infrared Phys. Technol. 2018, 91, 107–118. [Google Scholar] [CrossRef]
  6. Rao, B.S. Dynamic Histogram Equalization for Contrast Enhancement for Digital Images. Appl. Soft Comput. 2020, 89, 106114. [Google Scholar] [CrossRef]
  7. Abdullah-Al-Wadud, M.; Kabir, M.H.; Dewan, M.A.A.; Chae, O. A Dynamic Histogram Equalization for Image Contrast Enhancement. IEEE Trans. Consum. Electron. 2007, 53, 593–600. [Google Scholar] [CrossRef]
  8. Celik, T.; Tjahjadi, T. Contextual and Variational Contrast Enhancement. IEEE Trans. Image Process. 2011, 20, 3431–3441. [Google Scholar] [CrossRef]
  9. Rahman, S.; Rahman, M.M.; Abdullah-Al-Wadud, M.; Al-Quaderi, G.D.; Shoyaib, M. An Adaptive Gamma Correction for Image Enhancement. J. Image Video Proc. 2016, 2016, 35. [Google Scholar] [CrossRef]
  10. Chang, Y.; Jung, C.; Ke, P.; Song, H.; Hwang, J. Automatic Contrast-Limited Adaptive Histogram Equalization with Dual Gamma Correction. IEEE Access 2018, 6, 11782–11792. [Google Scholar] [CrossRef]
  11. Rahman, Z.; Jobson, D.J.; Woodell, G.A. Retinex Processing for Automatic Image Enhancement. J. Electron. Imaging 2004, 13, 100–110. [Google Scholar]
  12. Parihar, A.S.; Singh, K. A Study on Retinex Based Method for Image Enhancement. In Proceedings of the 2018 2nd International Conference on Inventive Systems and Control (ICISC), Coimbatore, India, 19–20 January 2018; IEEE: New York, NY, USA, 2018; pp. 619–624. [Google Scholar]
  13. Zotin, A. Fast Algorithm of Image Enhancement Based on Multi-Scale Retinex. Procedia Comput. Sci. 2018, 131, 6–14. [Google Scholar] [CrossRef]
  14. Cai, Y.; Bian, H.; Lin, J.; Wang, H.; Timofte, R.; Zhang, Y. Retinexformer: One-Stage Retinex-Based Transformer for Low-Light Image Enhancement. In Proceedings of the IEEE/CVF International Conference on Computer Vision, Paris, France, 1–6 October 2023; pp. 12504–12513. [Google Scholar]
  15. Yang, S.; Ding, M.; Wu, Y.; Li, Z.; Zhang, J. Implicit Neural Representation for Cooperative Low-Light Image Enhancement. In Proceedings of the IEEE/CVF International Conference on Computer Vision, Paris, France, 1–6 October 2023; pp. 12918–12927. [Google Scholar]
  16. Wei, C.; Wang, W.; Yang, W.; Liu, J. Deep Retinex Decomposition for Low-Light Enhancement. arXiv 2018, arXiv:1808.04560. [Google Scholar]
  17. Fu, X.; Zeng, D.; Huang, Y.; Zhang, X.-P.; Ding, X. A Weighted Variational Model for Simultaneous Reflectance and Illumination Estimation. In Proceedings of the IEEE Conference on Computer Vision and Pattern Recognition, Las Vegas, NV, USA, 27–30 June 2016; pp. 2782–2790. [Google Scholar]
  18. Guo, X.; Li, Y.; Ling, H. LIME: Low-Light Image Enhancement via Illumination Map Estimation. IEEE Trans. Image Process. 2016, 26, 982–993. [Google Scholar] [CrossRef]
  19. Zhang, Y.; Guo, X.; Ma, J.; Liu, W.; Zhang, J. Beyond Brightening Low-Light Images. Int. J. Comput. Vis. 2021, 129, 1013–1037. [Google Scholar] [CrossRef]
  20. Zhang, Y.; Zhang, J.; Guo, X. Kindling the Darkness: A Practical Low-Light Image Enhancer. In Proceedings of the 27th ACM International Conference on Multimedia, Amsterdam, The Netherlands, 15–19 October 2019; ACM: Nice, France, 2019; pp. 1632–1640. [Google Scholar]
  21. Chen, C.; Chen, Q.; Do, M.N.; Koltun, V. Seeing Motion in the Dark. In Proceedings of the IEEE/CVF International Conference on Computer Vision, Seoul, Republic of Korea, 27 October–2 November 2019; pp. 3185–3194. [Google Scholar]
  22. Ma, G.; Yue, X. An Improved Whale Optimization Algorithm Based on Multilevel Threshold Image Segmentation Using the Otsu Method. Eng. Appl. Artif. Intell. 2022, 113, 104960. [Google Scholar] [CrossRef]
  23. Sekehravani, E.A.; Babulak, E.; Masoodi, M. Implementing Canny Edge Detection Algorithm for Noisy Image. Bull. Electr. Eng. Inform. 2020, 9, 1404–1410. [Google Scholar] [CrossRef]
  24. Said, K.A.M.; Jambek, A.B. Analysis of Image Processing Using Morphological Erosion and Dilation. In Proceedings of the Journal of Physics: Conference Series; IOP Publishing: Philadelphia, PA, USA, 2021; Volume 2071, p. 012033. [Google Scholar]
  25. Li, X.; Zhou, F.; Tan, H.; Zhang, W.; Zhao, C. Multimodal Medical Image Fusion Based on Joint Bilateral Filter and Local Gradient Energy. Inf. Sci. 2021, 569, 302–325. [Google Scholar] [CrossRef]
  26. Kisantal, M.; Sharma, S.; Park, T.H.; Izzo, D.; Märtens, M.; D’Amico, S. Satellite Pose Estimation Challenge: Dataset, Competition Design, and Results. IEEE Trans. Aerosp. Electron. Syst. 2020, 56, 4083–4098. [Google Scholar] [CrossRef]
  27. Park, T.H.; Märtens, M.; Lecuyer, G.; Izzo, D.; D’Amico, S. SPEED+: Next-Generation Dataset for Spacecraft Pose Estimation across Domain Gap. In Proceedings of the 2022 IEEE Aerospace Conference (AERO), Big Sky, MT, USA, 5–12 March 2022; IEEE: New York, NY, USA, 2022; pp. 1–15. [Google Scholar]
  28. Park, T.H.; D’Amico, S. Rapid Abstraction of Spacecraft 3D Structure from Single 2D Image. In Proceedings of the AIAA SCITECH 2024 Forum, Orlando, FL, USA, 8–12 January 2024; American Institute of Aeronautics and Astronautics: Orlando, FL, USA, 2024. [Google Scholar]
  29. Ahmed, Z.; Park, T.H.; Bhattacharjee, A.; Razel-Rezai, R.; Graves, R.; Saarela, O.; Teramoto, R.; Vemulapalli, K.; D’Amico, S. SPEED-UE-Cube: A Machine Learning Dataset for Autonomous, Vision-Based Spacecraft Navigation. In Proceedings of the 46th Rocky Mountain AAS Guidance, Navigation and Control Conference, Breckenridge, CO, USA, 2–7 February 2024. [Google Scholar]
  30. Huang, S.-C.; Cheng, F.-C.; Chiu, Y.-S. Efficient Contrast Enhancement Using Adaptive Gamma Correction with Weighting Distribution. IEEE Trans. Image Process. 2012, 22, 1032–1041. [Google Scholar] [CrossRef]
  31. Hai, J.; Xuan, Z.; Yang, R.; Hao, Y.; Zou, F.; Lin, F.; Han, S. R2rnet: Low-Light Image Enhancement via Real-Low to Real-Normal Network. J. Vis. Commun. Image Represent. 2023, 90, 103712. [Google Scholar] [CrossRef]
  32. Wang, Z.; Bovik, A.C.; Sheikh, H.R.; Simoncelli, E.P. Image Quality Assessment: From Error Visibility to Structural Similarity. IEEE Trans. Image Process. 2004, 13, 600–612. [Google Scholar] [CrossRef]
  33. Zhang, R.; Isola, P.; Efros, A.A.; Shechtman, E.; Wang, O. The Unreasonable Effectiveness of Deep Features as a Perceptual Metric. In Proceedings of the IEEE Conference on Computer Vision and Pattern Recognition, Salt Lake City, UT, USA, 18–22 June 2018; pp. 586–595. [Google Scholar]
Figure 1. The architecture of low-light image enhancement methods for deep-space background.
Applsci 15 04837 g001
Figure 2. The workflow for the single satellite image enhancement process.
Applsci 15 04837 g002
Figure 3. The comparison of several single satellite images before and after enhancement.
Applsci 15 04837 g003
Figure 4. The flowchart for enhancing satellite images containing the Earth.
Applsci 15 04837 g004
Figure 5. The Earth region mask construction module.
Applsci 15 04837 g005
Figure 6. The comparison effect of our proposed method with the OTSU for binarization of images.
Applsci 15 04837 g006
Figure 7. An example of the process of extracting the Earth region. (a) Original image; (b) initial binary image; (c) binary image of the extracted part of the halo; (d) separate the halo from the Earth; (e) binary image of the Earth region (including halo); (f) select the highest rated contour; (g) final binary image of the Earth region; (h) extracted Earth region image.
Applsci 15 04837 g007
Figure 8. Flowchart of satellite target mask generation methodology.
Applsci 15 04837 g008
Figure 9. Several binary images utilized in the process of determining the target area mask. (a) Binary image of the original image; (b) binary image of the preprocessed image; (c) binary image of the extracted target; (d) the final target mask.
Applsci 15 04837 g009
Figure 10. Comparison of the target area masks and mapped images before and after denoising.
Applsci 15 04837 g010
Figure 11. Comparison of low-light images in the SPEED-UE-Cube dataset before and after processing.
Applsci 15 04837 g011
Figure 12. Visual comparison of different image enhancement methods in natural scenes.
Applsci 15 04837 g012
Figure 13. Experimental comparison of using edge detection extension and not.
Applsci 15 04837 g013
Figure 14. The results of ablation study. Please zoom in to compare more details.
Applsci 15 04837 g014
Figure 15. Localized visual comparison with two state-of-the-art deep learning methods.
Applsci 15 04837 g015
Figure 16. Halo suppression effect of deep-space background images.
Applsci 15 04837 g016
Figure 17. Visual comparison of single satellite images before and after enhancement.
Applsci 15 04837 g017
Figure 18. Visual comparison of single satellite images before and after enhancement.
Applsci 15 04837 g018
Figure 19. Visual comparison with multiple methods on satellite images containing Earth region.
Applsci 15 04837 g019
Figure 20. Visual comparison with multiple methods on the single satellite target image.
Applsci 15 04837 g020
Figure 21. Average processing time of different satellite images at three resolutions.
Applsci 15 04837 g021
Table 1. A comparison and analysis of existing datasets.
DatasetSPEEDSPEED+SPE3RSPEED-UE-CubeSPARK 2021
SceneSyntheticSynthetic and realSyntheticSyntheticSynthetic
IlluminationNoYesNoYesYes
BGD Noise 1NoNoNoNoYes
Bit Depth88243224
Resolution1920 × 12001920 × 1200256 × 2561920 × 12001024 × 1024
Categories4464111
ApplicationPose estimationPose estimationPose estimation and 3D ReconstructionPose estimation Pose estimation
1 BGD Noise denotes deep-space Background Noise.
Table 2. Key parameters in the experiment.
ParametersValueBasis for Selection
Exponential parameter p1.6Experimentally determined index parameters that balance contrast and detail retention.
Segment threshold m155Determined from the brightness characteristics of the target and background in satellite images.
OTSU grayscale limit range[20, 50]Experiments show that satellite image noise is mostly concentrated in the low gray area, and limiting the range can improve the threshold stability.
Percentage of regional expansion5%Balancing target integrity protection with over-extension risk.
Density thresholds0.8Ensure that the selection area has a compact form to avoid loose noise interference.
Table 3. Quantitative evaluation of multiple methods on satellite images containing Earth region.
Satellite NameMetricsSSR 1Gamma (γ = 0.6/0.8) 2Gamma + CLAHE
(γ = 0.6/0.8)
NeRCoRetineformerOurs
AcrimSatPSNR ↑28.9827.52 (31.17 3)27.59 (27.58)27.8027.4636.67 3
SSIM ↑0.10410.5102 (0.8321)0.3272 (0.5176)0.20120.20970.8724
LPIPS ↓0.8210.288 (0.096)0.488 (0.289)0.8040.7470.117
AquariusPSNR ↑28.9227.60 (31.38)27.59 (27.79)27.9827.5437.87
SSIM ↑0.10780.5046 (0.8330)0.2904 (0.4844)0.20660.22250.9003
LPIPS ↓0.8410.314 (0.104)0.535 (0.307)0.8190.7610.097
AuraPSNR ↑28.7527.53 (31.89)27.52 (27.71)27.7627.5435.65
SSIM ↑0.08050.4871 (0.8292)0.2580 (0.4482)0.11320.20060.7946
LPIPS ↓0.8340.317 (0.111)0.532 (0.315)0.8290.7480.245
CalipsoPSNR ↑28.8827.60 (32.33)27.57 (27.72)27.9727.6736.95
SSIM ↑0.07050.4635 (0.8177)0.2600 (0.4438)0.16720.20500.8107
LPIPS ↓0.8690.339 (0.119)0.541 (0.321)0.8370.7700.233
CloudSatPSNR ↑31.6231.44 (35.13)30.08 (30.58)27.7731.8738.05
SSIM ↑0.20770.5870 (0.8970)0.2873 (0.3783)0.10860.54630.9021
LPIPS ↓0.6650.241 (0.073)0.327 (0.217)0.6760.3570.040
CubeSatPSNR ↑28.8227.59 (31.81)27.61 (27.66)27.8927.5435.61
SSIM ↑0.07340.4810 (0.8214)0.2835 (0.4611)0.18990.22350.7820
LPIPS ↓0.8600.324 (0.112)0.529 (0.318)0.8360.7580.233
JasonPSNR ↑28.4327.61 (32.68)27.50 (27.60)27.9127.8237.34
SSIM ↑0.07240.4495 (0.8154)0.2494 (0.4123)0.14150.20810.8863
LPIPS ↓0.8500.334 (0.125)0.513 (0.321)0.8090.6910.126
Sentinel-6PSNR ↑28.7627.58 (32.52)27.55 (27.69)27.8427.8536.87
SSIM ↑0.07100.4559 (0.8142)0.2556 (0.4323)0.15780.21550.8235
LPIPS ↓0.8860.350 (0.124)0.549 (0.336)0.8630.7570.229
TerraPSNR ↑28.9227.52 (31.79)27.53 (27.70)27.8727.5736.70
SSIM ↑0.09170.4860 (0.8276)0.2676 (0.4504)0.18270.20630.8866
LPIPS ↓0.8540.322 (0.115)0.537 (0.323)0.8450.7540.100
TRMMPSNR ↑28.9227.49 (32.17)27.55 (27.70)27.9127.5737.42
SSIM ↑0.08620.4675 (0.8186)0.2637 (0.4454)0.16670.19980.8727
LPIPS ↓0.8770.338 (0.121)0.542 (0.325)0.8520.7780.160
1 SSR denotes Single-scale Retinex. 2 Gamma (γ = 0.6/0.8)) represents γ = 0.6 and γ = 0.8, respectively. 3 In the table, values highlighted in red indicate the best performance, whereas values in blue denote the second-best performance.
Table 4. Quantitative evaluation of low-light image enhancement methods on single satellite images.
Satellite NameMetricsSSRGamma (γ = 0.6/0.8)Gamma + CLAHE
(γ = 0.6/0.8)
NeRCoRetineformerOurs 1Ours_BGD 2
AcrimSatPSNR ↑28.8127.57 (37.45)30.14 (28.04)27.5528.9839.67 352.46 3
SSIM ↑0.02420.3202 (0.7539)0.2103 (0.3406)0.02250.21260.55500.9934
LPIPS ↓0.8800.370 (0.133)0.450 (0.343)0.8870.5900.2550.012
AquariusPSNR ↑29.0730.13 (40.85)26.69 (28.94)27.5937.4244.1152.44
SSIM ↑0.02360.2954 (0.7809)0.1380 (0.2445)0.01390.63570.81650.9952
LPIPS ↓0.9700.545 (0.195)0.645 (0.467)0.9400.4090.1730.010
AuraPSNR ↑29.2430.18 (40.28)27.10 (29.07)27.5735.5942.8451.01
SSIM ↑0.01160.2868 (0.7846)0.1305 (0.2415)0.01290.55810.79820.9927
LPIPS ↓0.9160.469 (0.167)0.567 (0.400)0.8750.4710.2700.013
CalipsoPSNR ↑30.1231.21 (42.05)27.11 (29.75)27.5039.1345.5855.71
SSIM ↑0.06500.3475 (0.8099)0.1392 (0.2411)0.00960.70990.86280.9960
LPIPS ↓0.9710.573 (0.190)0.673 (0.478)0.9650.3990.1690.009
CloudSatPSNR ↑33.2233.87 (41.84)31.04 (31.86)27.5535.4642.9253.88
SSIM ↑0.16330.5142 (0.8807)0.1697 (0.2572)0.00760.59450.84620.9522
LPIPS ↓0.6980.272 (0.082)0.335 (0.222)0.8160.3370.4800.006
CubeSatPSNR ↑30.3231.28 (42.23)27.03 (29.83)27.5539.0045.9458.73
SSIM ↑0.07110.3525 (0.8099)0.1414 (0.2418)0.00850.70360.86510.9986
LPIPS ↓0.9620.553 (0.182)0.649 (0.461)0.9710.4070.1690.005
JasonPSNR ↑30.1930.63 (40.94)27.14 (29.46)27.4936.7243.8053.83
SSIM ↑0.01690.2994 (0.7962)0.1288 (0.2386)0.01020.61440.82700.9946
LPIPS ↓0.9190.486 (0.170)0.584 (0.409)0.8910.4580.2640.011
Sentinel-6PSNR ↑29.8831.03 (41.78)27.07 (29.60)27.5639.1845.1453.39
SSIM ↑0.07100.3500 (0.8058)0.1446 (0.2464)0.01380.70730.84770.9929
LPIPS ↓0.9840.587 (0.192)0.686 (0.494)0.9770.3630.1390.012
TerraPSNR ↑29.9530.92 (41.33)27.31 (29.62)27.5237.4244.1953.80
SSIM ↑0.04230.3253 (0.8039)0.1343 (0.2407)0.01130.64250.83630.9940
LPIPS ↓0.9330.512 (0.174)0.610 (0.430)0.9120.4340.2310.010
TRMMPSNR ↑29.8030.47 (40.88)26.73 (29.24)27.5638.1944.0250.79
SSIM ↑0.04440.3222 (0.7922)0.1443 (0.2492)0.01490.66860.82330.9909
LPIPS ↓0.9860.573 (0.195)0.670 (0.486)0.9660.3800.1490.016
1 ‘Ours’ means only the target is enhanced without retaining the deep-space background. 2 ‘Ours_BDG’ denotes enhancing the target while retaining the deep-space background. 3 In the table, values highlighted in red indicate the best performance, whereas values in blue denote the second-best performance.
Table 5. Average processing time and frame rate (FPS) of satellite images at different resolutions.
ResolutionMetricAcrimSatAquariusAuraCalipsoCloudSatCubeSatJasonSentinel-6TerraTRMM
256 × 256Time (ms)71.6561.9273.7769.1467.8971.8469.5057.4568.2867.99
Frame rate (FPS)13.9616.1513.5514.4614.7313.9214.3917.4114.6514.71
512 × 512Time (ms)87.1294.8595.5392.5186.3192.0189.0686.0782.5193.83
Frame rate (FPS)11.4810.5410.4710.8111.5910.8711.2311.6212.1210.66
1024 × 1024Time (ms)188.25189.84184.89183.39184.22195.37194.13185.04178.80192.84
Frame rate (FPS)5.315.275.415.455.435.125.155.405.595.19
Disclaimer/Publisher’s Note: The statements, opinions and data contained in all publications are solely those of the individual author(s) and contributor(s) and not of MDPI and/or the editor(s). MDPI and/or the editor(s) disclaim responsibility for any injury to people or property resulting from any ideas, methods, instructions or products referred to in the content.

