

A Machine Learning Approach for the Prediction of Thermostable β-Glucosidases


Abstract
Featured Application
Abstract
1. Introduction
2. Related Works
3. Materials and Methods
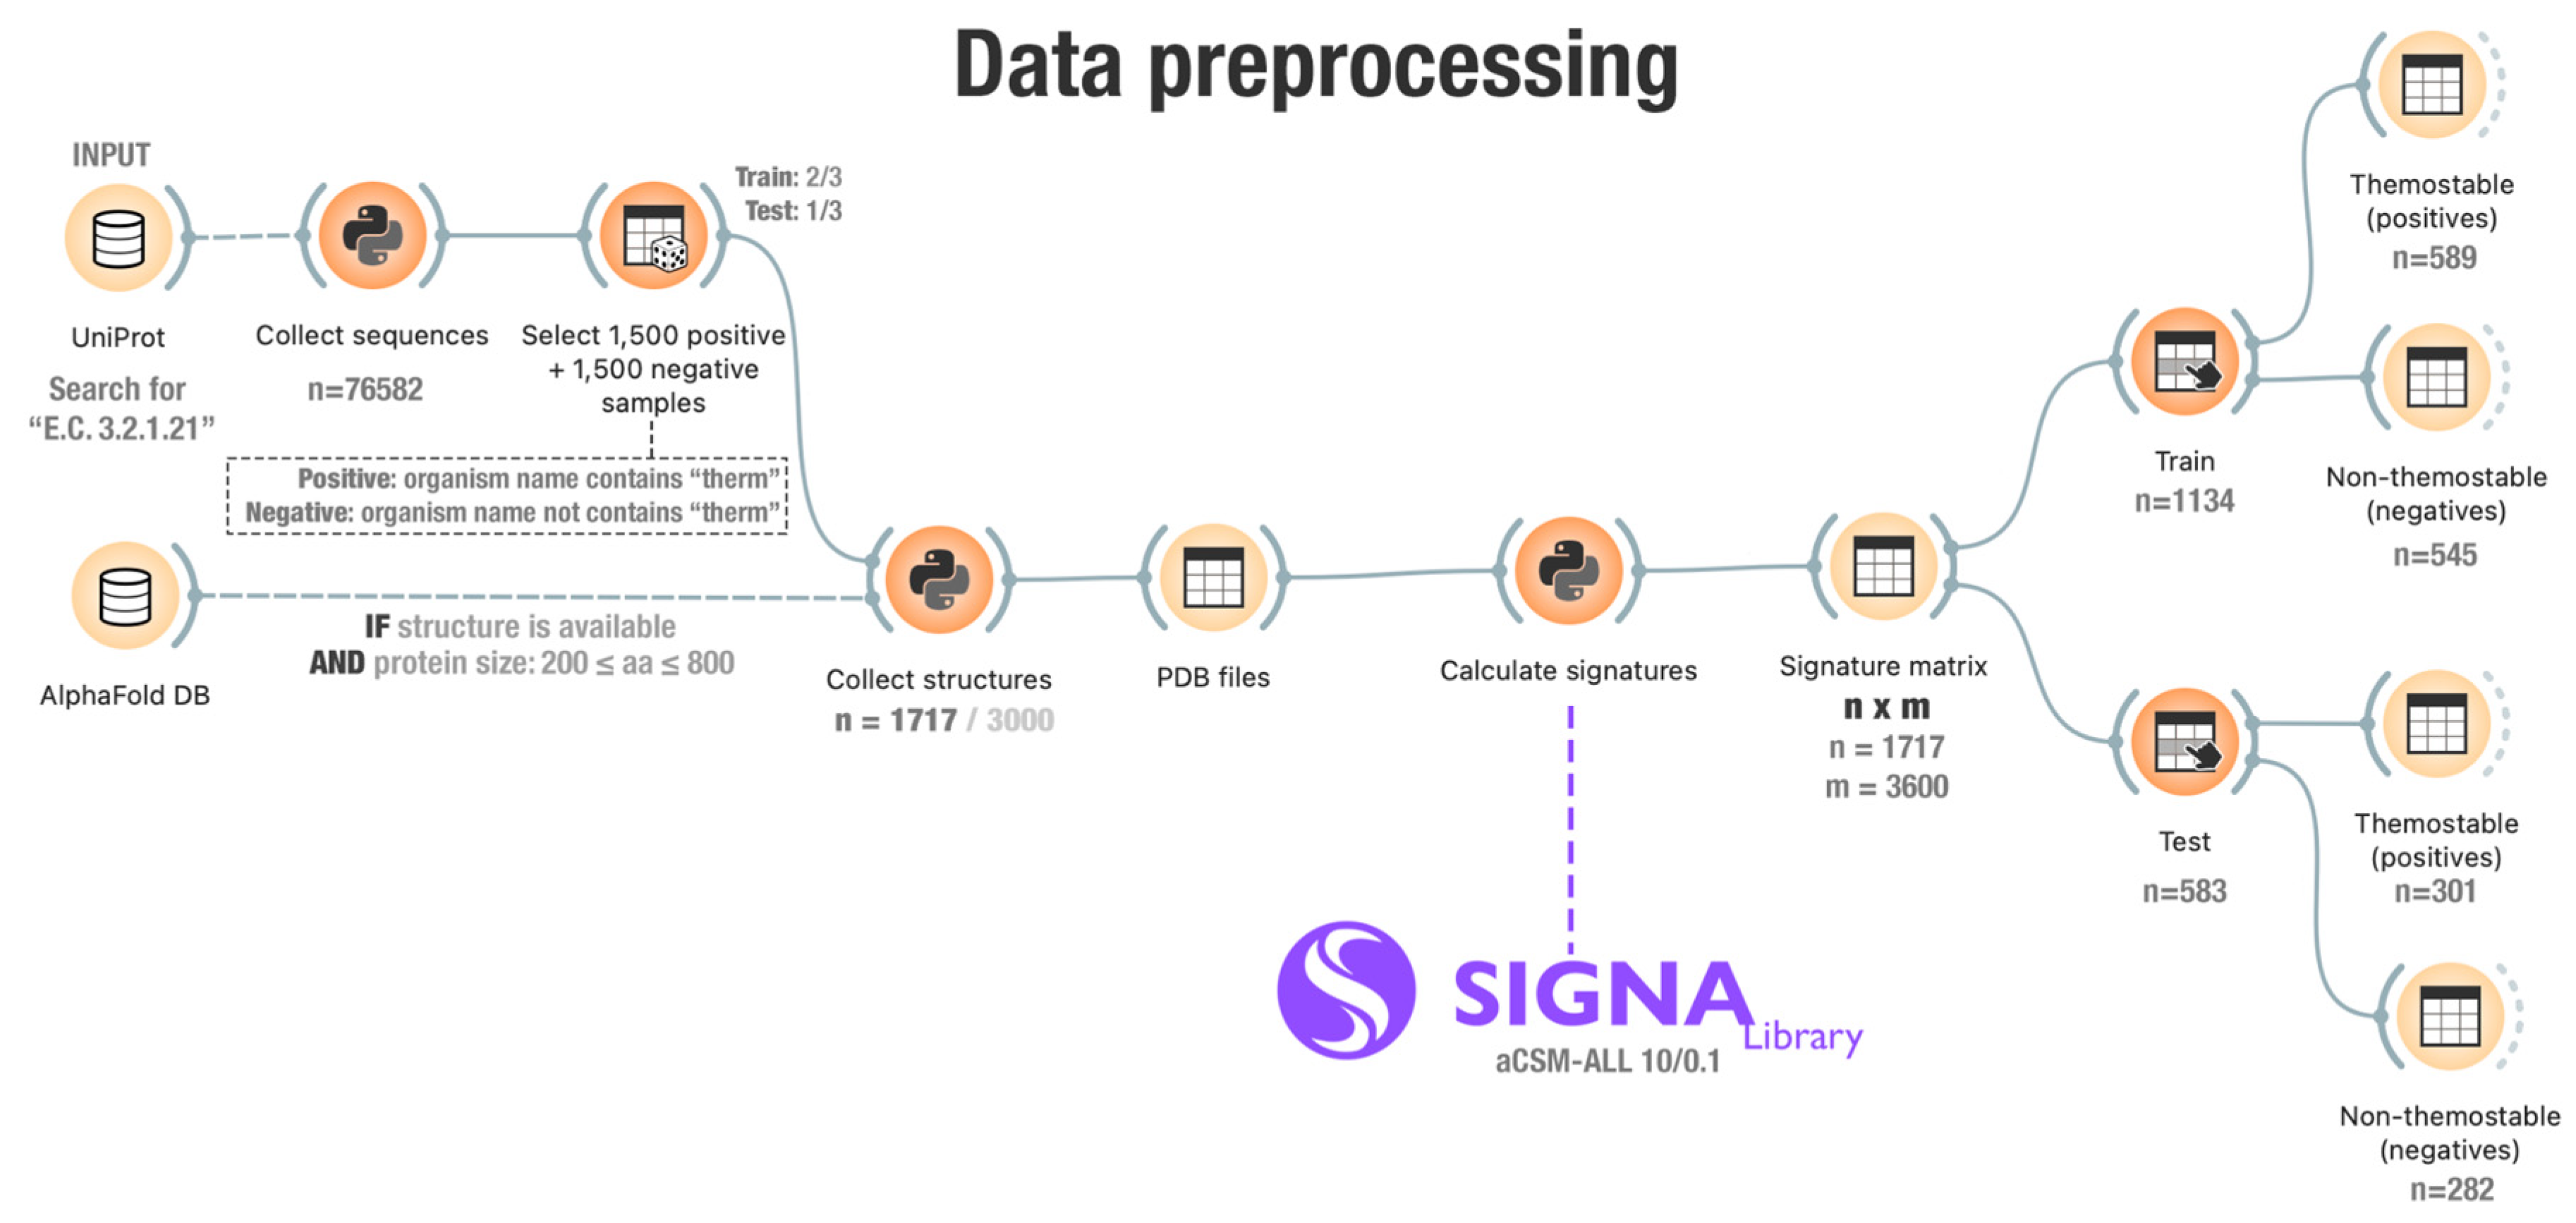
3.1. Data Collection
3.2. Structural Signatures Calculation
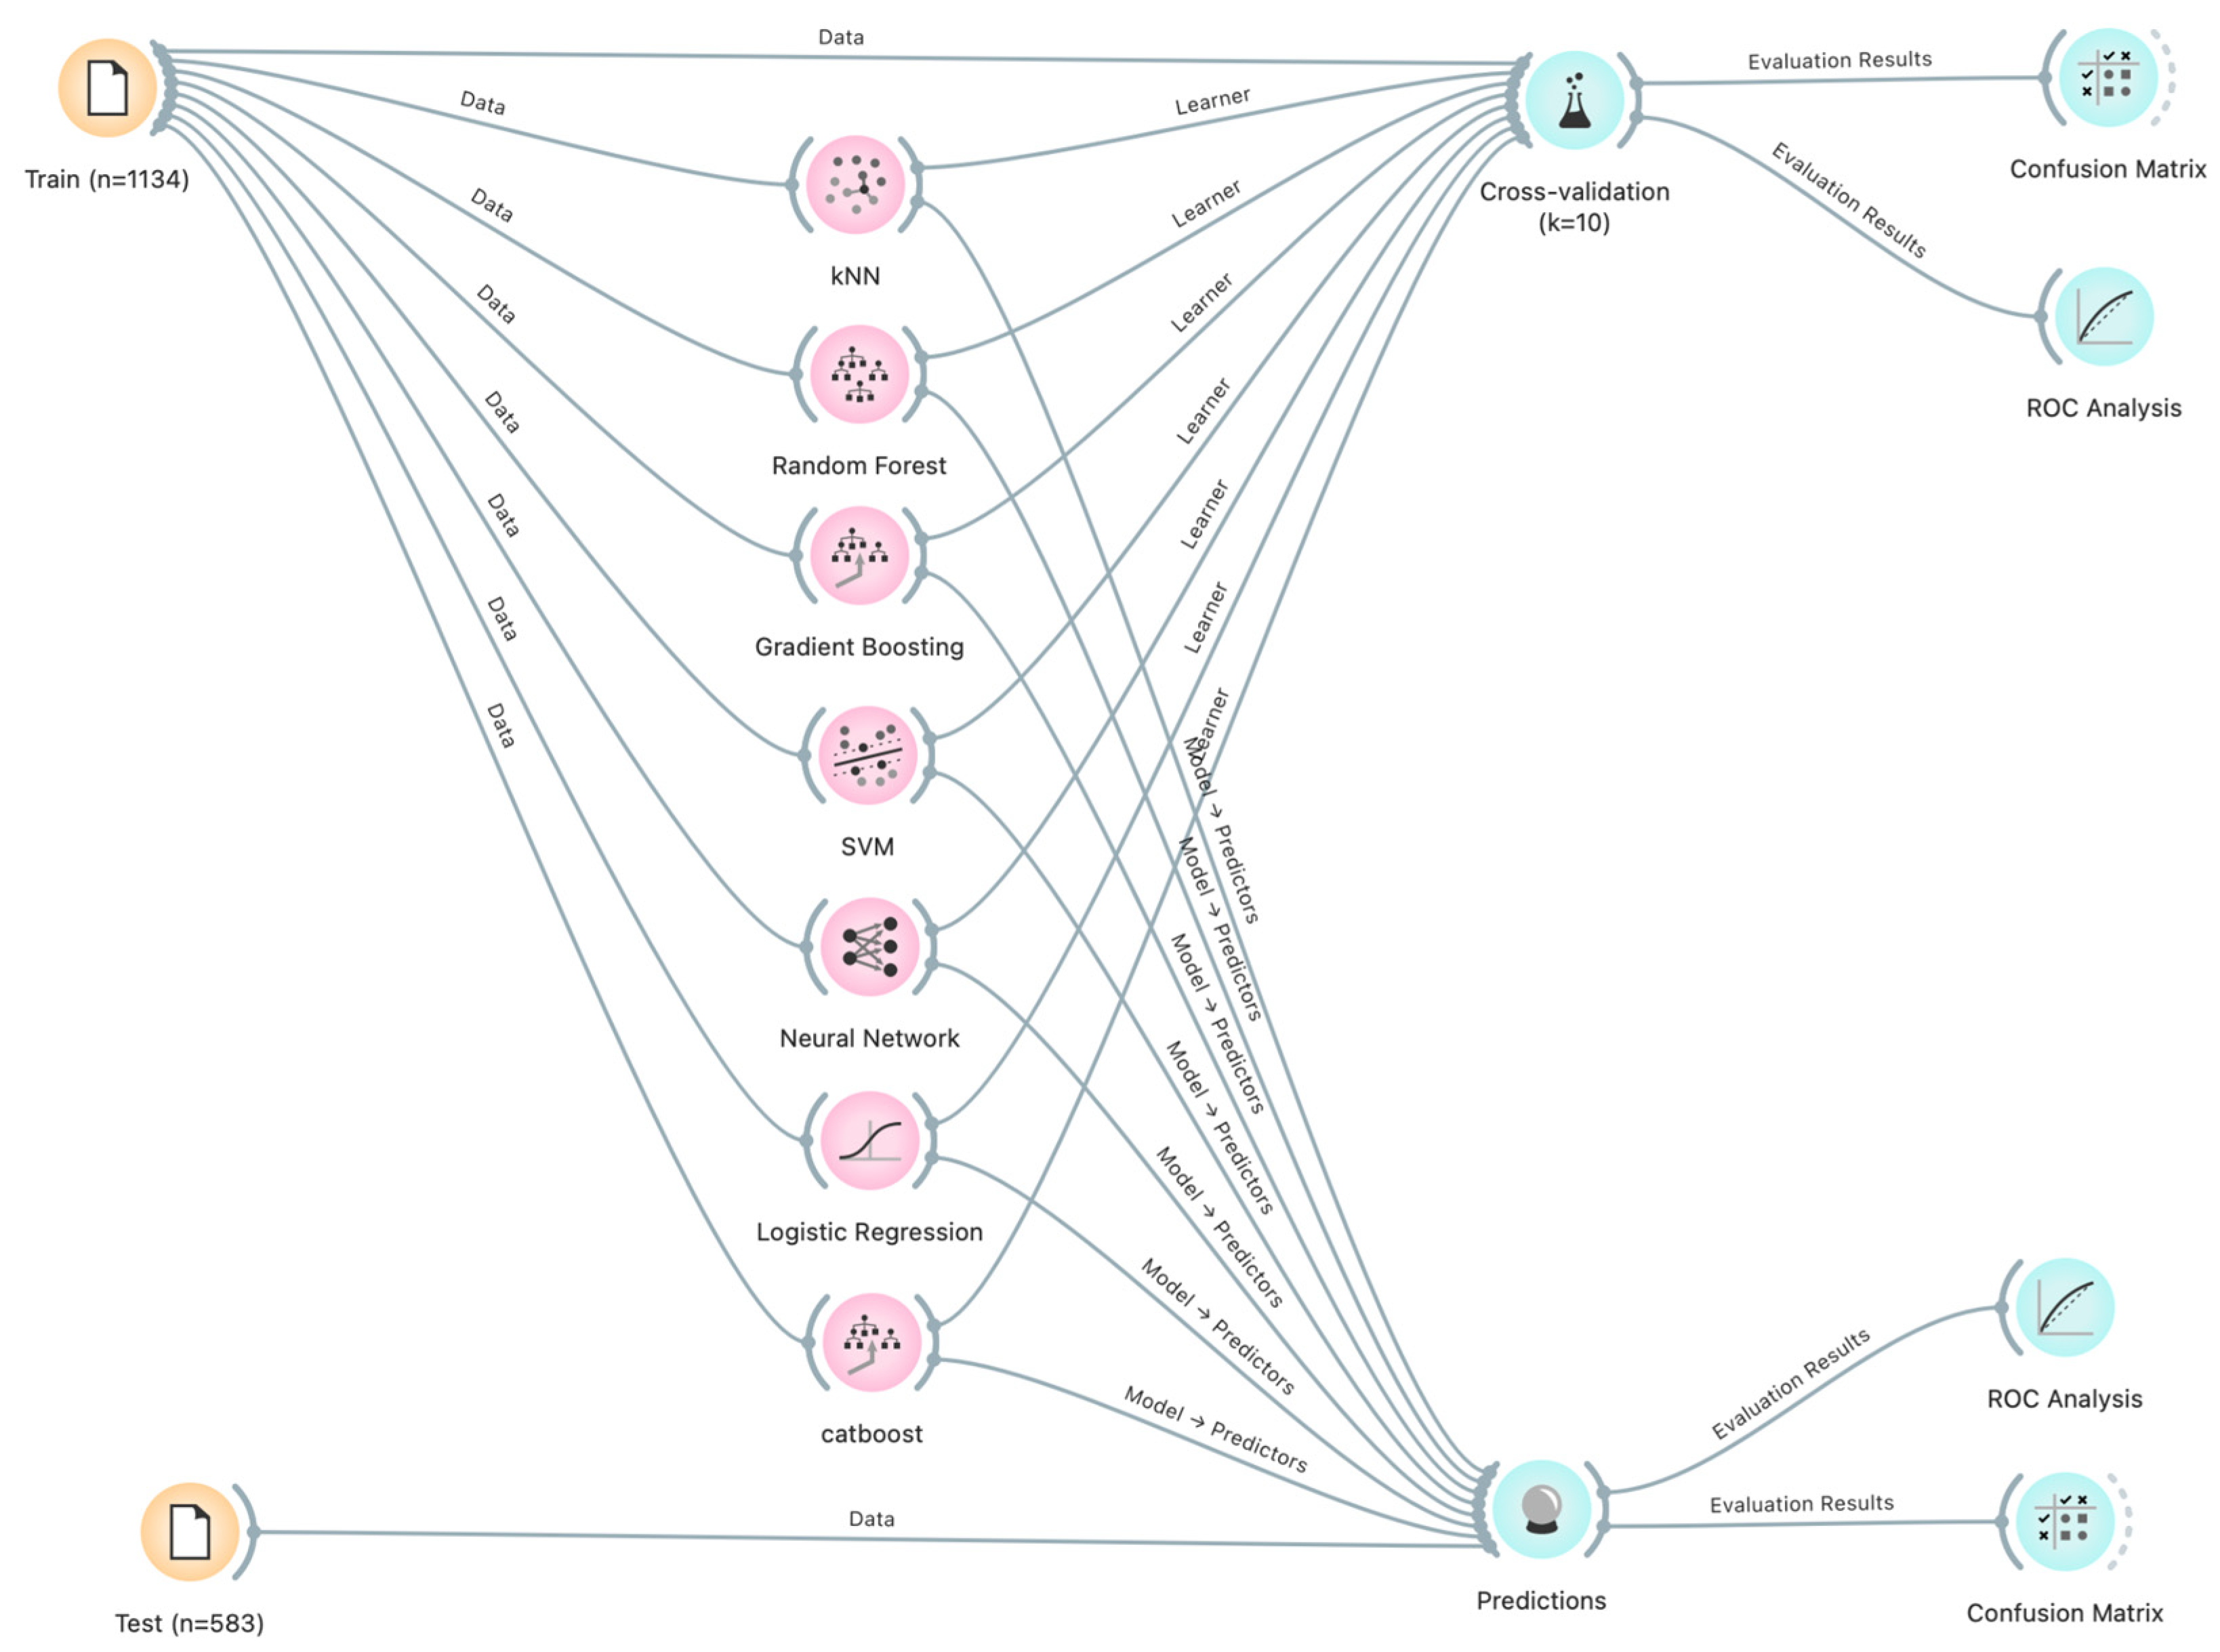
3.3. Machine Learning Models
- KNN—k = 5; metric: Euclidean, Weight: by distances;
- Random Forest—number of trees: 10; do not split subsets smaller than five;
- Gradient Boosting (scikit-learn)—number of trees: 500; learning rate: 0.9; limit of the depth of individual trees: three; do not split subsets smaller than two;
- SVM—cost (c): 1.00; regression loss epsilon: 0.1; kernel: linear; numerical tolerance: 0.001; iteration limit: 100;
- Neural Network (MLP)—neurons in hidden layers: “100”; activation: ReLu; solver: Adam; regularization alpha = 0.0001; the maximal number of iterations 200;
- Logistic Regression—regularization type: ridge (L2); strength C1;
- CatBoost (Gradient Boosting variation)—number of trees: 200; learning rate: 0.4; regularization lambda 0.09; limit depth of individual trees: 5.
3.4. Case Studies
4. Results and Discussion
4.1. Thermostability Patterns in Enzymes Obtained from Non-Thermostable Organisms
4.1.1. Case Study 1—Comparison to Another Tool
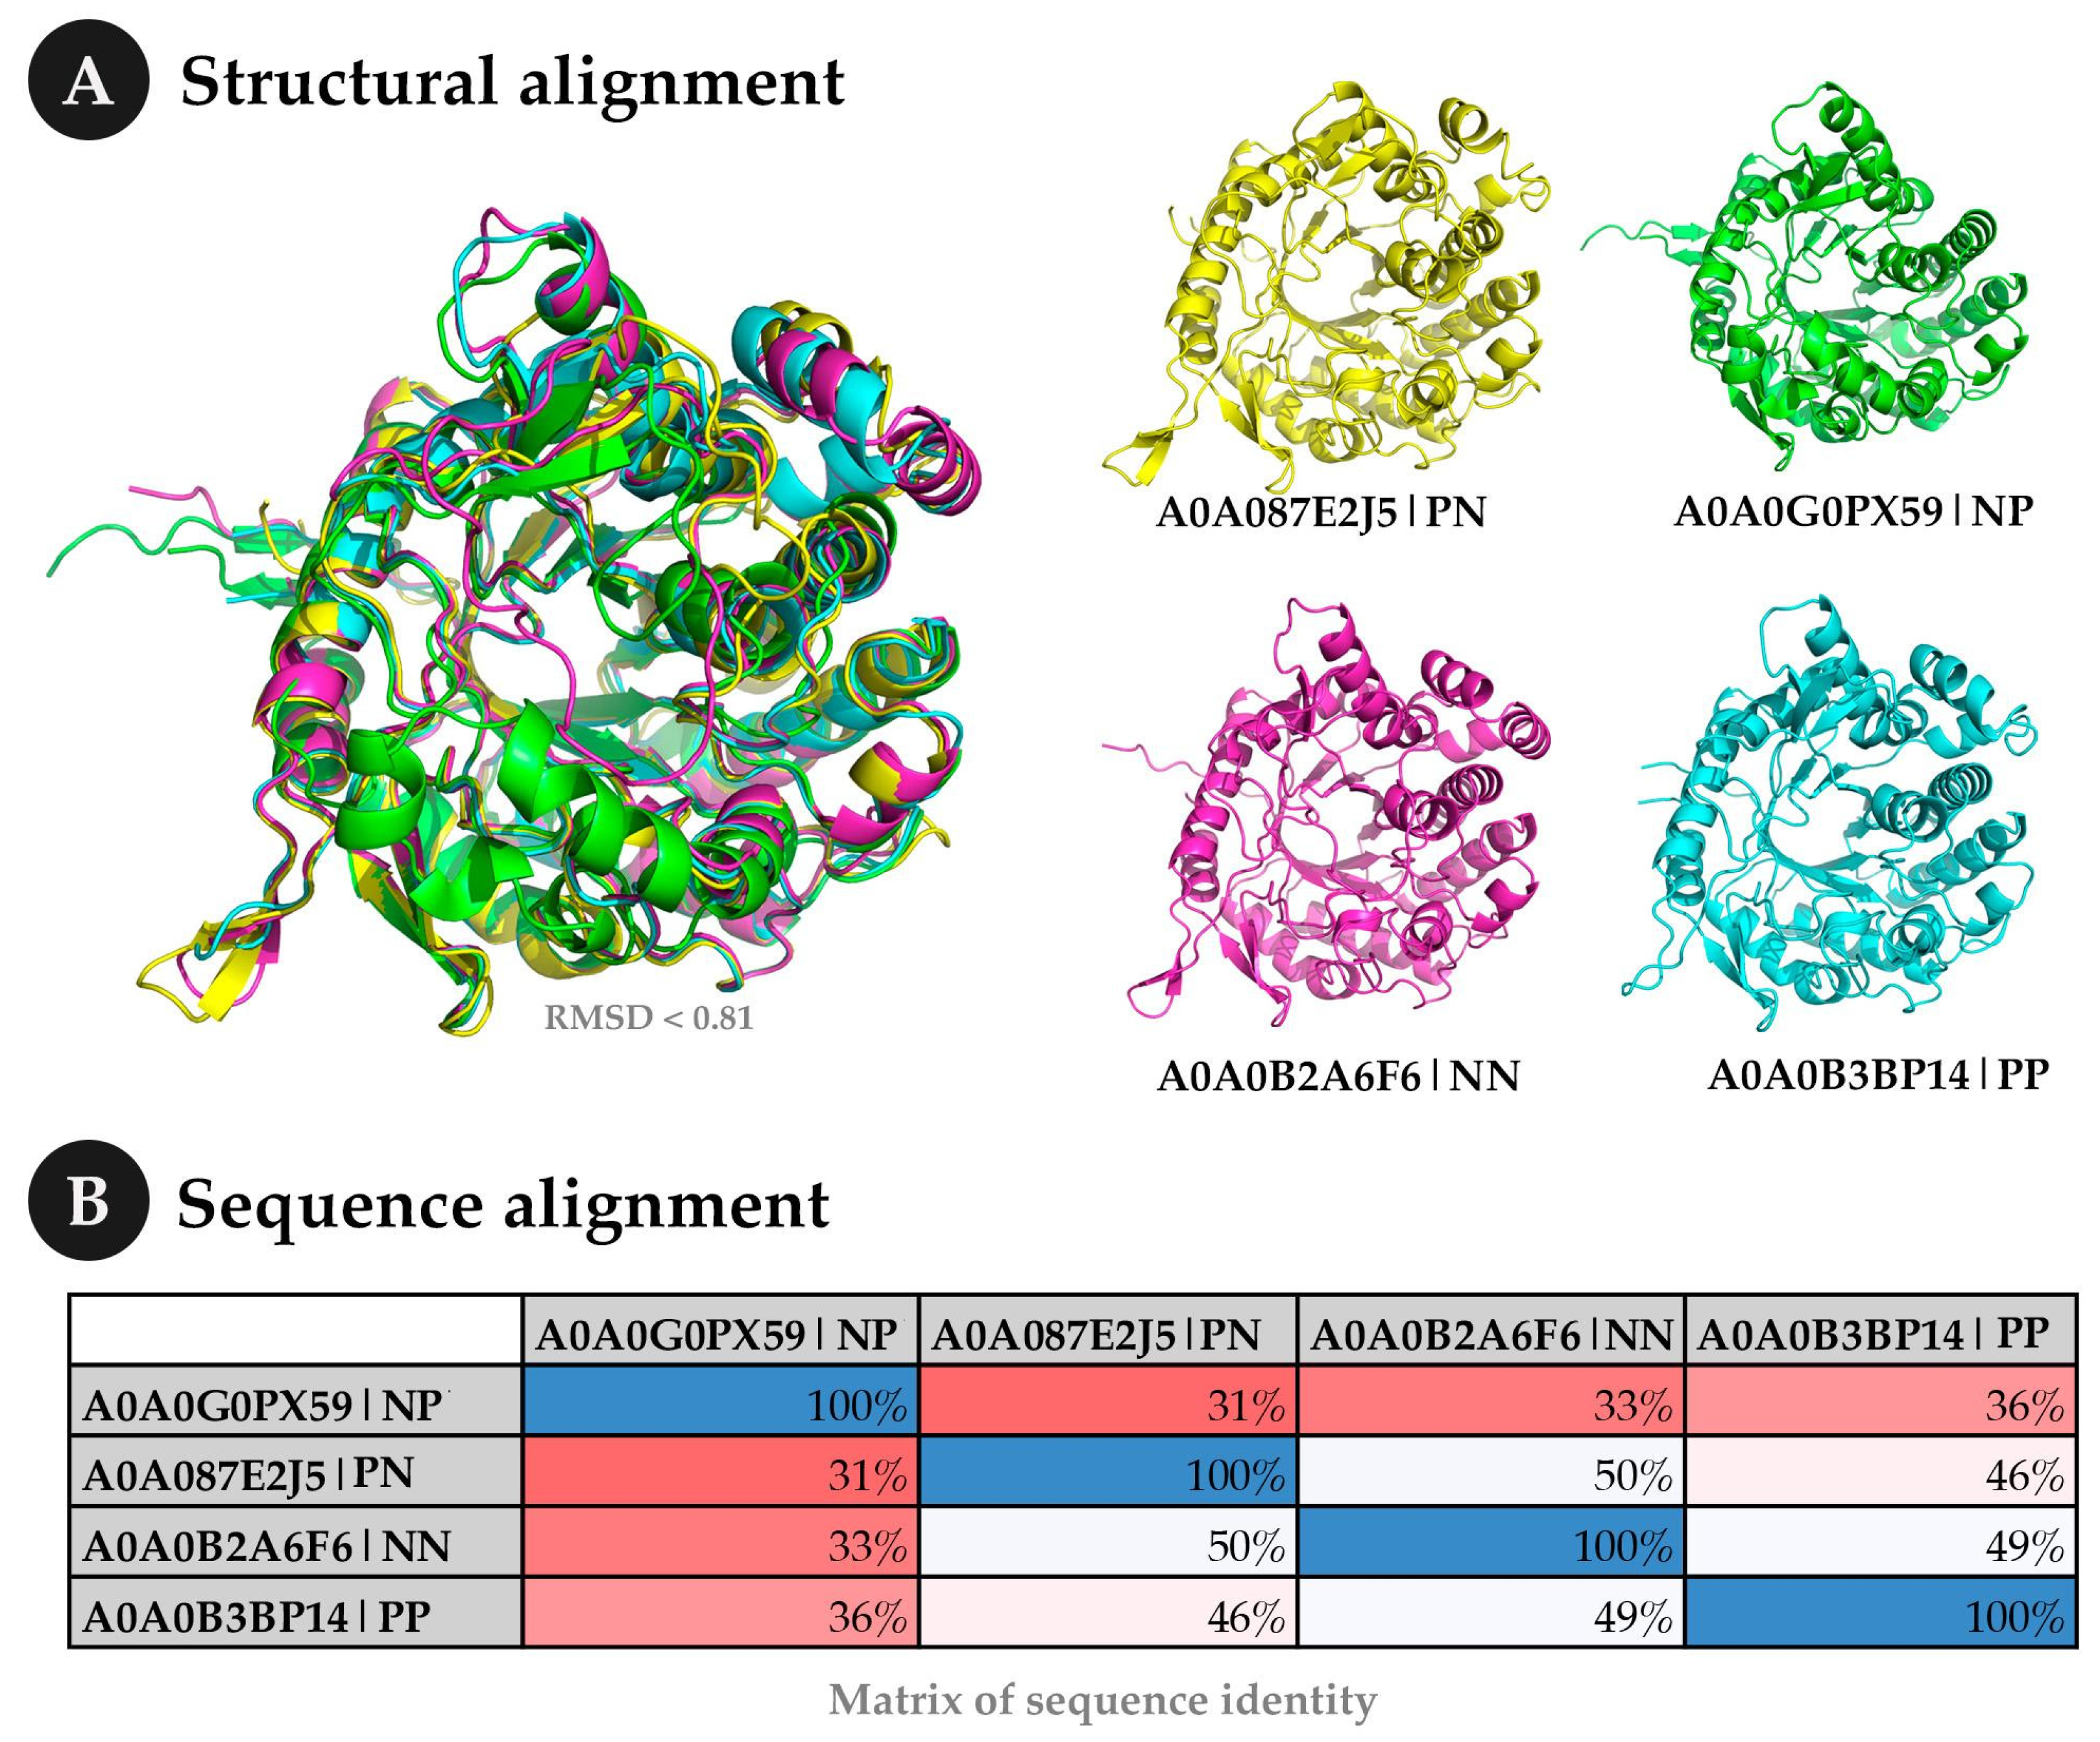
4.1.2. Case Study 2—Exploring Some Results in Detail
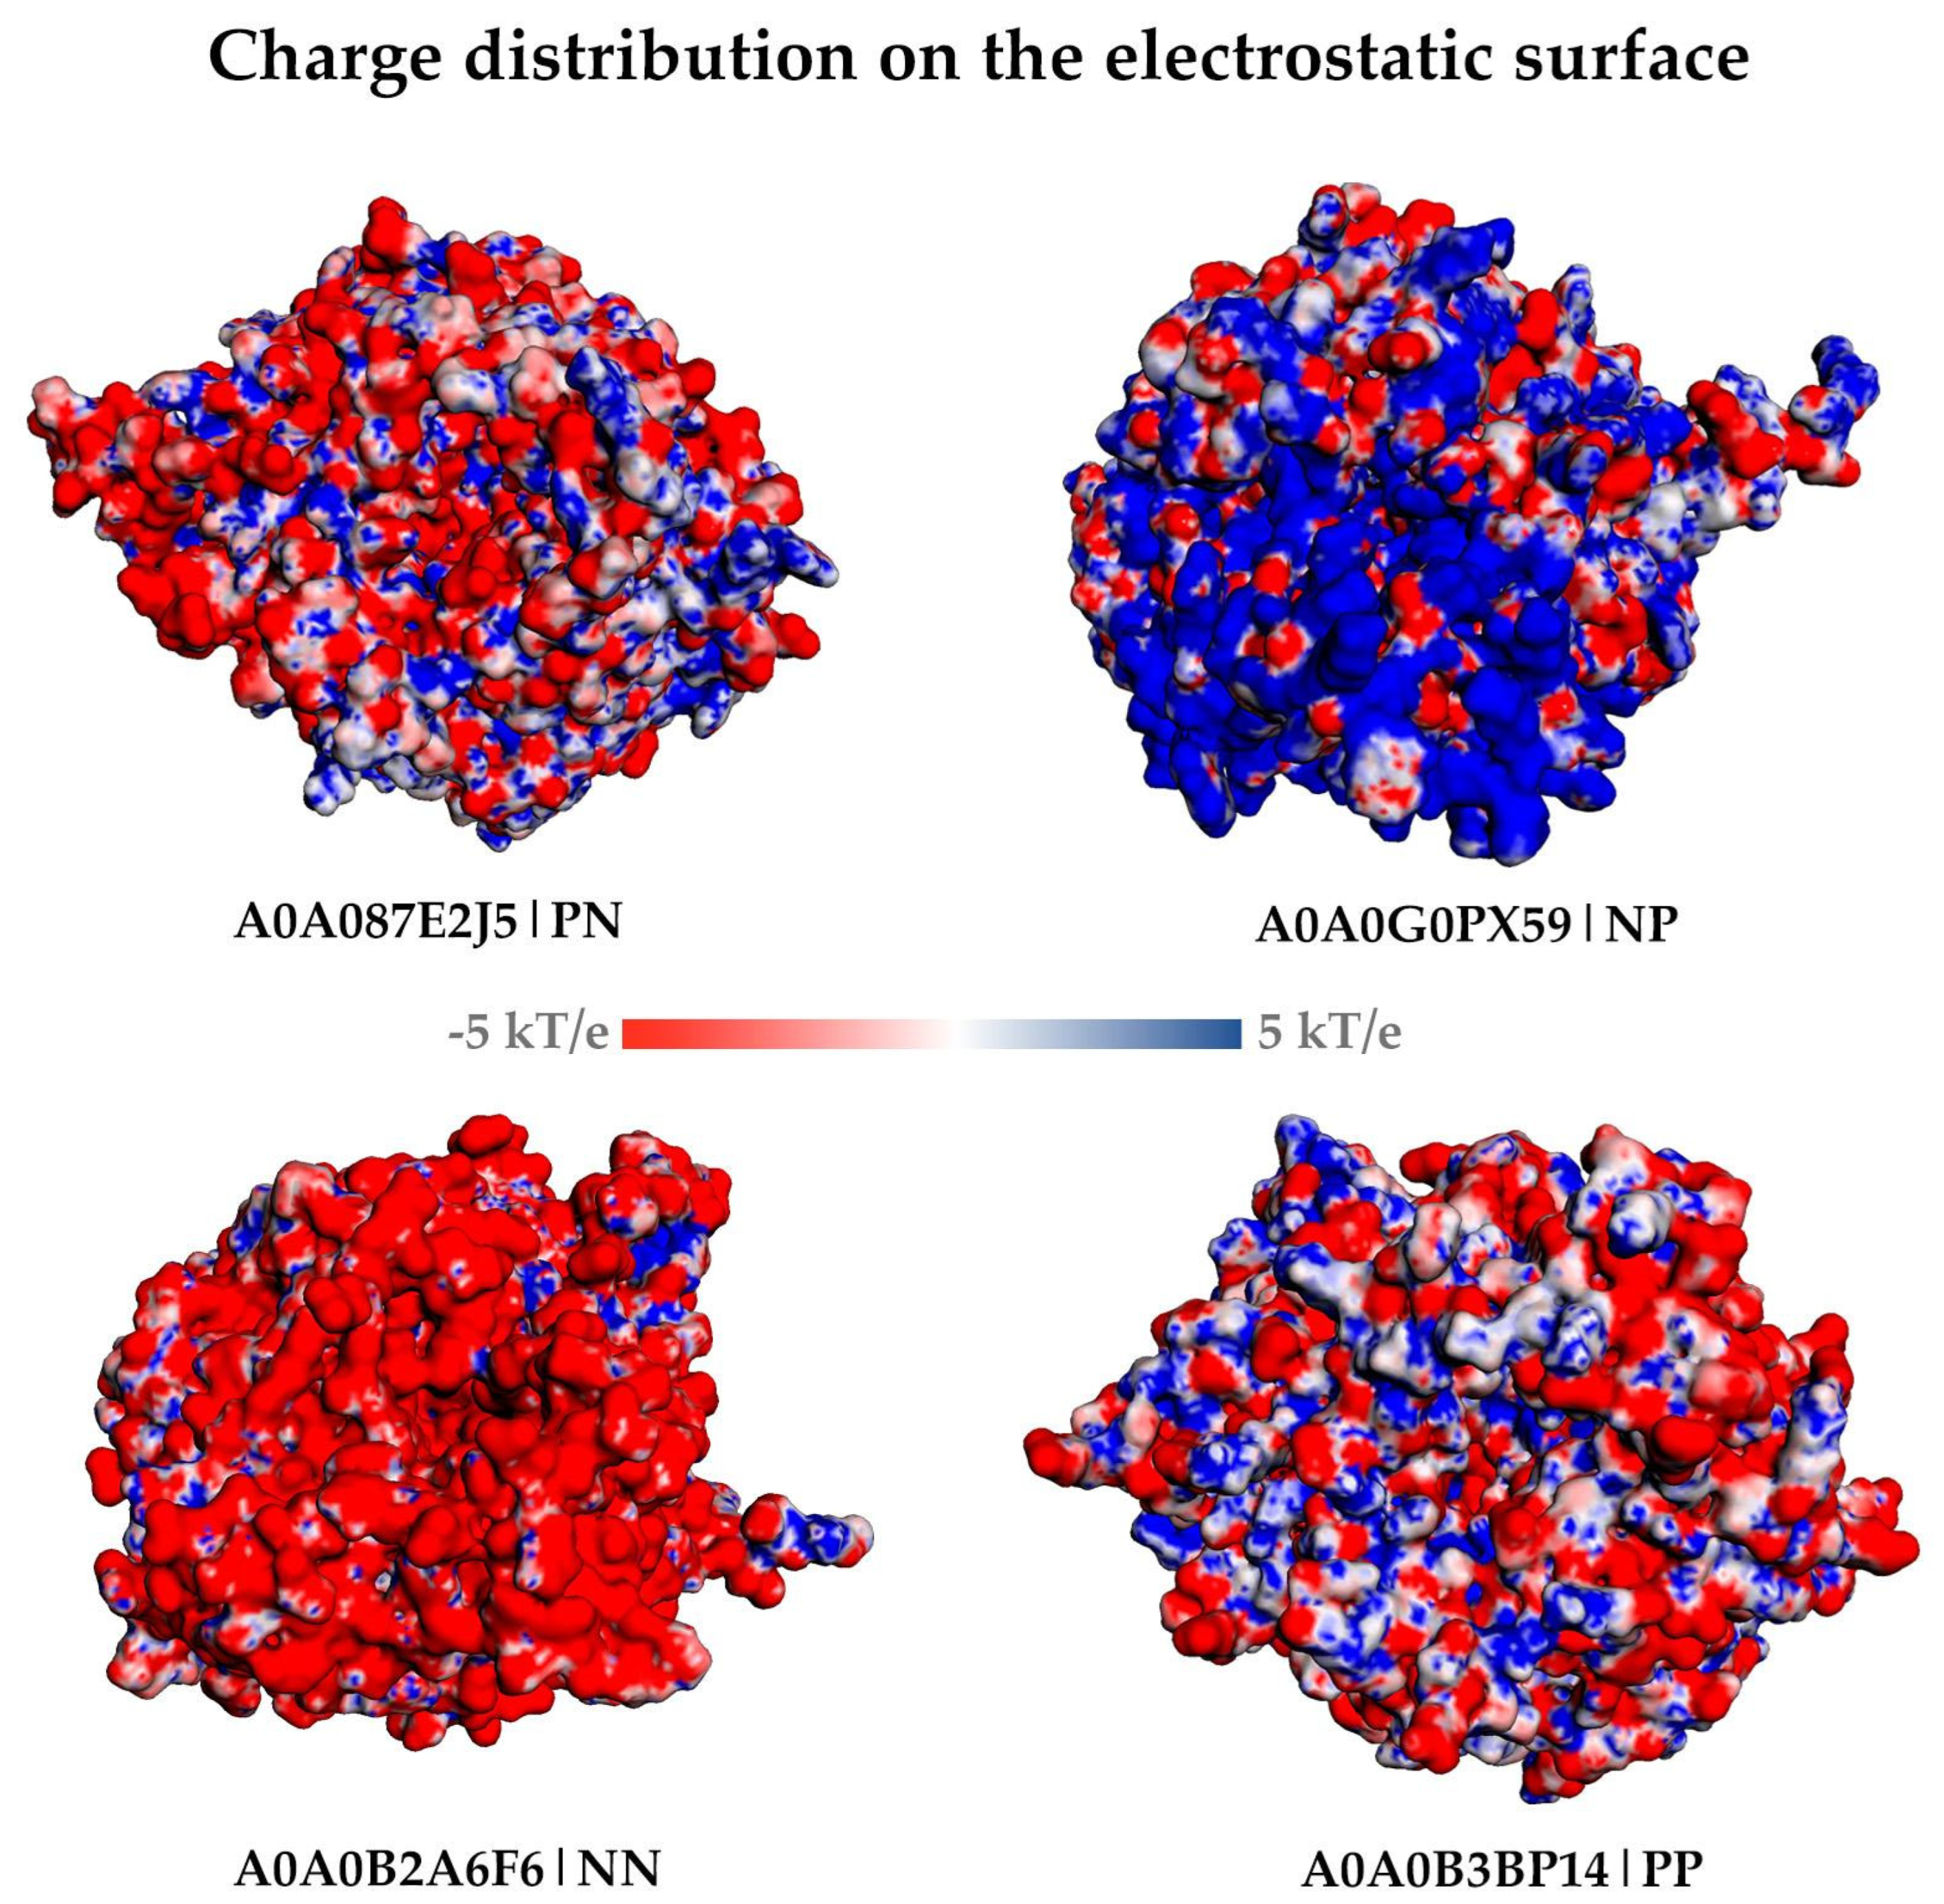
4.1.3. Differences in the Electrostatic Surface
4.1.4. β-Glucosidases from Thermophilic Organisms Are Less Unstable at High Temperatures
4.2. Limitations and Perspectives
5. Conclusions
Supplementary Materials
Funding
Institutional Review Board Statement
Informed Consent Statement
Data Availability Statement
Acknowledgments
Conflicts of Interest
References
- Uchima, C.A.; Tokuda, G.; Watanabe, H.; Kitamoto, K.; Arioka, M. Heterologous Expression in Pichia Pastoris and Characterization of an Endogenous Thermostable and High-Glucose-Tolerant β-Glucosidase from the Termite Nasutitermes Takasagoensis. Appl. Environ. Microbiol. 2012, 78, 4288–4293. [Google Scholar] [CrossRef] [PubMed]
- Uchiyama, T.; Yaoi, K.; Miyazaki, K. Glucose-Tolerant β-Glucosidase Retrieved from a Kusaya Gravy Metagenome. Front. Microbiol. 2015, 6, 548. [Google Scholar] [CrossRef]
- Dunning, J.; Lathrop, E.C. Saccharification of Agricultural Residues. Ind. Eng. Chem. 1945, 37, 24–29. [Google Scholar] [CrossRef]
- Meghana, M.; Shastri, Y. Sustainable Valorization of Sugar Industry Waste: Status, Opportunities, and Challenges. Bioresour. Technol. 2020, 303, 122929. [Google Scholar] [CrossRef]
- Badhan, A.; Chadha, B.; Kaur, J.; Saini, H.; Bhat, M. Production of Multiple Xylanolytic and Cellulolytic Enzymes by Thermophilic Fungus Myceliophthora sp. IMI 387099. Bioresour. Technol. 2007, 98, 504–510. [Google Scholar] [CrossRef] [PubMed]
- Santos, J.R.A.; Souto-Maior, A.M.; Gouveia, E.R.; Medina, C.M. Comparison of SHF and SSF processes from sugar cane bagasse for ethanol production by Saccharomyces cerevisiae. Quím. Nova 2010, 33, 904–908. [Google Scholar] [CrossRef]
- Kumar, R.; Singh, S.; Singh, O.V. Bioconversion of Lignocellulosic Biomass: Biochemical and Molecular Perspectives. J. Ind. Microbiol. Biotechnol. 2008, 35, 377–391. [Google Scholar] [CrossRef] [PubMed]
- Cairns, J.R.K.; Esen, A. β-Glucosidases. Cell. Mol. Life Sci. 2010, 67, 3389–3405. [Google Scholar] [CrossRef]
- Teugjas, H.; Väljamäe, P. Selecting β-Glucosidases to Support Cellulases in Cellulose Saccharification. Biotechnol. Biofuels 2013, 6, 105. [Google Scholar] [CrossRef]
- Yang, Y.; Zhang, X.; Yin, Q.; Fang, W.; Fang, Z.; Wang, X.; Zhang, X.; Xiao, Y. A Mechanism of Glucose Tolerance and Stimulation of GH1 β-Glucosidases. Sci. Rep. 2015, 5, 17296. [Google Scholar] [CrossRef]
- Salgado, J.C.S.; Meleiro, L.P.; Carli, S.; Ward, R.J. Glucose Tolerant and Glucose Stimulated β-Glucosidases—A Review. Bioresour. Technol. 2018, 267, 704–713. [Google Scholar] [CrossRef] [PubMed]
- Zhao, L.; Pang, Q.; Xie, J.; Pei, J.; Wang, F.; Fan, S. Enzymatic Properties of Thermoanaerobacterium Thermosaccharolyticum β-Glucosidase Fused to Clostridium Cellulovorans Cellulose Binding Domain and Its Application in Hydrolysis of Microcrystalline Cellulose. BMC Biotechnol. 2013, 13, 101. [Google Scholar] [CrossRef] [PubMed]
- Chamoli, S.; Kumar, P.; Navani, N.K.; Verma, A.K. Secretory Expression, Characterization and Docking Study of Glucose-Tolerant β-Glucosidase from B. Subtilis. Int. J. Biol. Macromol. 2016, 85, 425–433. [Google Scholar] [CrossRef]
- Philippidis, G.P.; Smith, T.K.; Wyman, C.E. Study of the Enzymatic Hydrolysis of Cellulose for Production of Fuel Ethanol by the Simultaneous Saccharification and Fermentation Process. Biotechnol. Bioeng. 1993, 41, 846–853. [Google Scholar] [CrossRef]
- Ouyang, B.; Wang, G.; Zhang, N.; Zuo, J.; Huang, Y.; Zhao, X. Recent Advances in β-Glucosidase Sequence and Structure Engineering: A Brief Review. Molecules 2023, 28, 4990. [Google Scholar] [CrossRef] [PubMed]
- Dadwal, A.; Sharma, S.; Satyanarayana, T. Thermostable Cellulose Saccharifying Microbial Enzymes: Characteristics, Recent Advances and Biotechnological Applications. Int. J. Biol. Macromol. 2021, 188, 226–244. [Google Scholar] [CrossRef]
- Oliveira Rocha, R.; Mariano, D.; Almeida, T.; Sulfierry, L.; Fischer, P.H.; Santos, L.; Caffarena, E.; Da Silveira, C.; Lamp, L.; Fernandez-Quintero, M.; et al. Thermostabilizing Mechanisms of Canonical Single Amino Acid Substitutions at a GH1 β-Glucosidase Probed by Multiple MD and Computational Approaches. Proteins Struct. Funct. Bioinform. 2022, 91, 218–236. [Google Scholar] [CrossRef]
- Martín, C.; Thomsen, M.H.; Hauggaard-Nielsen, H.; BelindaThomsen, A. Wet Oxidation Pretreatment, Enzymatic Hydrolysis and Simultaneous Saccharification and Fermentation of Clover–Ryegrass Mixtures. Bioresour. Technol. 2008, 99, 8777–8782. [Google Scholar] [CrossRef]
- Olofsson, K.; Bertilsson, M.; Lidén, G. A Short Review on SSF–an Interesting Process Option for Ethanol Production from Lignocellulosic Feedstocks. Biotechnol. Biofuels 2008, 1, 1–14. [Google Scholar] [CrossRef]
- Akram, F.; ul Haq, I.; Khan, M.A.; Hussain, Z.; Mukhtar, H.; Iqbal, K. Cloning with Kinetic and Thermodynamic Insight of a Novel Hyperthermostable β-Glucosidase from Thermotoga Naphthophila RKU-10T with Excellent Glucose Tolerance. J. Mol. Catal. B Enzym. 2016, 124, 92–104. [Google Scholar] [CrossRef]
- Bai, A.; Zhao, X.; Jin, Y.; Yang, G.; Feng, Y. A Novel Thermophilic β-Glucosidase from Caldicellulosiruptor Bescii: Characterization and Its Synergistic Catalysis with Other Cellulases. J. Mol. Catal. B Enzym. 2013, 85–86, 248–256. [Google Scholar] [CrossRef]
- Breves, R.; Bronnenmeier, K.; Wild, N.; Lottspeich, F.; Staudenbauer, W.L.; Hofemeister, J. Genes Encoding Two Different Beta-Glucosidases of Thermoanaerobacter Brockii Are Clustered in a Common Operon. Appl. Environ. Microbiol. 1997, 63, 3902–3910. [Google Scholar] [CrossRef]
- Cota, J.; Corrêa, T.L.R.; Damásio, A.R.L.; Diogo, J.A.; Hoffmam, Z.B.; Garcia, W.; Oliveira, L.C.; Prade, R.A.; Squina, F.M. Comparative Analysis of Three Hyperthermophilic GH1 and GH3 Family Members with Industrial Potential. New Biotechnol. 2015, 32, 13–20. [Google Scholar] [CrossRef] [PubMed]
- Jumper, J.; Evans, R.; Pritzel, A.; Green, T.; Figurnov, M.; Ronneberger, O.; Tunyasuvunakool, K.; Bates, R.; Žídek, A.; Potapenko, A.; et al. Highly Accurate Protein Structure Prediction with AlphaFold. Nature 2021, 596, 583–589. [Google Scholar] [CrossRef]
- Mariano, D.C.B.; Leite, C.; Santos, L.H.S.; Marins, L.F.; Machado, K.S.; Werhli, A.V.; Lima, L.H.F.; de Melo-Minardi, R.C. Characterization of Glucose-Tolerant β-Glucosidases Used in Biofuel Production under the Bioinformatics Perspective: A Systematic Review. Genet. Mol. Res. 2017, 16, gmr16039740. [Google Scholar] [CrossRef]
- Mariano, D.; Pantuza, N.; Santos, L.H.; Rocha, R.E.O.; de Lima, L.H.F.; Bleicher, L.; de Melo-Minardi, R.C. Glutantβase: A Database for Improving the Rational Design of Glucose-Tolerant β-Glucosidases. BMC Mol. Cell Biol. 2020, 21, 50. [Google Scholar] [CrossRef]
- Costa, L.S.C.; Mariano, D.C.B.; Rocha, R.E.O.; Kraml, J.; da Silveira, C.H.; Liedl, K.R.; de Melo-Minardi, R.C.; de Lima, L.H.F. Molecular Dynamics Gives New Insights into the Glucose Tolerance and Inhibition Mechanisms on β-Glucosidases. Molecules 2019, 24, 3215. [Google Scholar] [CrossRef] [PubMed]
- de Lima, L.H.F.; Fernandez-Quintéro, M.L.; Rocha, R.E.O.; Mariano, D.C.B.; de Melo-Minardi, R.C.; Liedl, K.R. Conformational Flexibility Correlates with Glucose Tolerance for Point Mutations in β-Glucosidases—A Computational Study. J. Biomol. Struct. Dyn. 2021, 39, 1621–1634. [Google Scholar] [CrossRef]
- Mariano, D.; Santos, L.H.; Machado, K.D.S.; Werhli, A.V.; de Lima, L.H.F.; de Melo-Minardi, R.C. A Computational Method to Propose Mutations in Enzymes Based on Structural Signature Variation (SSV). Int. J. Mol. Sci. 2019, 20, 333. [Google Scholar] [CrossRef]
- da Silveira, C.H.; Pires, D.E.V.; Minardi, R.C.; Ribeiro, C.; Veloso, C.J.M.; Lopes, J.C.D.; Meira, W.; Neshich, G.; Ramos, C.H.I.; Habesch, R.; et al. Protein Cutoff Scanning: A Comparative Analysis of Cutoff Dependent and Cutoff Free Methods for Prospecting Contacts in Proteins. Proteins 2009, 74, 727–743. [Google Scholar] [CrossRef]
- Pires, D.E.; de Melo-Minardi, R.C.; dos Santos, M.A.; da Silveira, C.H.; Santoro, M.M.; Meira, W. Cutoff Scanning Matrix (CSM): Structural Classification and Function Prediction by Protein Inter-Residue Distance Patterns. BMC Genom. 2011, 12, S12. [Google Scholar] [CrossRef] [PubMed]
- Watanabe, M.; Matsuzawa, T.; Yaoi, K. Rational Protein Design for Thermostabilization of Glycoside Hydrolases Based on Structural Analysis. Appl. Microbiol. Biotechnol. 2018, 102, 8677–8684. [Google Scholar] [CrossRef] [PubMed]
- Sharma, S.; Vaid, S.; Bhat, B.; Singh, S.; Bajaj, B.K. Thermostable Enzymes for Industrial Biotechnology. In Advances in Enzyme Technology; Elsevier: Amsterdam, The Netherlands, 2019; pp. 469–495. [Google Scholar]
- Ahmed, A.; Sumreen, A.; Bibi, A.; Batool, K. In Silico Approach to Elucidate Factors Associated with GH1 β-Glucosidase Thermostability. J. Pure Appl. Microbiol. 2019, 13, 1953–1968. [Google Scholar] [CrossRef]
- Rahban, M.; Zolghadri, S.; Salehi, N.; Ahmad, F.; Haertlé, T.; Rezaei-Ghaleh, N.; Sawyer, L.; Saboury, A.A. Thermal Stability Enhancement: Fundamental Concepts of Protein Engineering Strategies to Manipulate the Flexible Structure. Int. J. Biol. Macromol. 2022, 214, 642–654. [Google Scholar] [CrossRef] [PubMed]
- Erickson, E.; Gado, J.E.; Avilán, L.; Bratti, F.; Brizendine, R.K.; Cox, P.A.; Gill, R.; Graham, R.; Kim, D.-J.; König, G.; et al. Sourcing Thermotolerant Poly(Ethylene Terephthalate) Hydrolase Scaffolds from Natural Diversity. Nat. Commun. 2022, 13, 7850. [Google Scholar] [CrossRef]
- Consortium, T.U. UniProt: A Hub for Protein Information. Nucl. Acids Res. 2015, 43, D204–D212. [Google Scholar] [CrossRef]
- Varadi, M.; Bertoni, D.; Magana, P.; Paramval, U.; Pidruchna, I.; Radhakrishnan, M.; Tsenkov, M.; Nair, S.; Mirdita, M.; Yeo, J.; et al. AlphaFold Protein Structure Database in 2024: Providing Structure Coverage for over 214 Million Protein Sequences. Nucleic Acids Res. 2024, 52, D368–D375. [Google Scholar] [CrossRef]
- Pires, D.E.V.; de Melo-Minardi, R.C.; da Silveira, C.H.; Campos, F.F.; Meira, W. aCSM: Noise-Free Graph-Based Signatures to Large-Scale Receptor-Based Ligand Prediction. Bioinformatics 2013, 29, 855–861. [Google Scholar] [CrossRef]
- Martins, P.; Mariano, D.; Carvalho, F.C.; Bastos, L.L.; Moraes, L.; Paixão, V.; Cardoso de Melo-Minardi, R. Propedia v2.3: A Novel Representation Approach for the Peptide-Protein Interaction Database Using Graph-Based Structural Signatures. Front. Bioinform. 2023, 3, 1103103. [Google Scholar] [CrossRef]
- Demšar, J.; Zupan, B.; Leban, G.; Curk, T. Orange: From Experimental Machine Learning to Interactive Data Mining; Springer: Berlin/Heidelberg, Germany, 2004; pp. 537–539. [Google Scholar]
- Pudžiuvelytė, I.; Olechnovič, K.; Godliauskaite, E.; Sermokas, K.; Urbaitis, T.; Gasiunas, G.; Kazlauskas, D. TemStaPro: Protein Thermostability Prediction Using Sequence Representations from Protein Language Models. Bioinformatics 2024, 40, btae157. [Google Scholar] [CrossRef]
- Sievers, F.; Higgins, D.G. Clustal Omega, Accurate Alignment of Very Large Numbers of Sequences. Methods Mol. Biol. 2014, 1079, 105–116. [Google Scholar] [CrossRef]
- Schrödinger, L. The PyMOL Molecular Graphics System, V2.0.0; Schrödinger, LLC: New York, NY, USA, 2019. [Google Scholar]
- Jurrus, E.; Engel, D.; Star, K.; Monson, K.; Brandi, J.; Felberg, L.E.; Brookes, D.H.; Wilson, L.; Chen, J.; Liles, K.; et al. Improvements to the APBS Biomolecular Solvation Software Suite. Protein Sci. 2018, 27, 112–128. [Google Scholar] [CrossRef]
- Unni, S.; Huang, Y.; Hanson, R.M.; Tobias, M.; Krishnan, S.; Li, W.W.; Nielsen, J.E.; Baker, N.A. Web Servers and Services for Electrostatics Calculations with APBS and PDB2PQR. J. Comput. Chem. 2011, 32, 1488–1491. [Google Scholar] [CrossRef] [PubMed]
- Dolinsky, T.J.; Nielsen, J.E.; McCammon, J.A.; Baker, N.A. PDB2PQR: An Automated Pipeline for the Setup of Poisson–Boltzmann Electrostatics Calculations. Nucleic Acids Res 2004, 32, W665–W667. [Google Scholar] [CrossRef] [PubMed]
- Dolinsky, T.J.; Czodrowski, P.; Li, H.; Nielsen, J.E.; Jensen, J.H.; Klebe, G.; Baker, N.A. PDB2PQR: Expanding and Upgrading Automated Preparation of Biomolecular Structures for Molecular Simulations. Nucleic Acids Res. 2007, 35, W522–W525. [Google Scholar] [CrossRef]
- Kuriata, A.; Gierut, A.M.; Oleniecki, T.; Ciemny, M.P.; Kolinski, A.; Kurcinski, M.; Kmiecik, S. CABS-Flex 2.0: A Web Server for Fast Simulations of Flexibility of Protein Structures. Nucleic Acids Res. 2018, 46, W338–W343. [Google Scholar] [CrossRef] [PubMed]
- Jamroz, M.; Kolinski, A.; Kmiecik, S. CABS-Flex: Server for Fast Simulation of Protein Structure Fluctuations. Nucleic Acids Res. 2013, 41, W427–W431. [Google Scholar] [CrossRef]
- Cantarel, B.L.; Coutinho, P.M.; Rancurel, C.; Bernard, T.; Lombard, V.; Henrissat, B. The Carbohydrate-Active EnZymes Database (CAZy): An Expert Resource for Glycogenomics. Nucleic Acids Res. 2009, 37, D233–D238. [Google Scholar] [CrossRef]
- Peccati, F.; Alunno-Rufini, S.; Jiménez-Osés, G. Accurate Prediction of Enzyme Thermostabilization with Rosetta Using AlphaFold Ensembles. J. Chem. Inf. Model. 2023, 63, 898–909. [Google Scholar] [CrossRef]
- Radestock, S.; Gohlke, H. Protein Rigidity and Thermophilic Adaptation. Proteins Struct. Funct. Bioinform. 2011, 79, 1089–1108. [Google Scholar] [CrossRef]
- Feller, G. Protein Stability and Enzyme Activity at Extreme Biological Temperatures. J. Phys. Condens. Matter 2010, 22, 323101. [Google Scholar] [CrossRef] [PubMed]


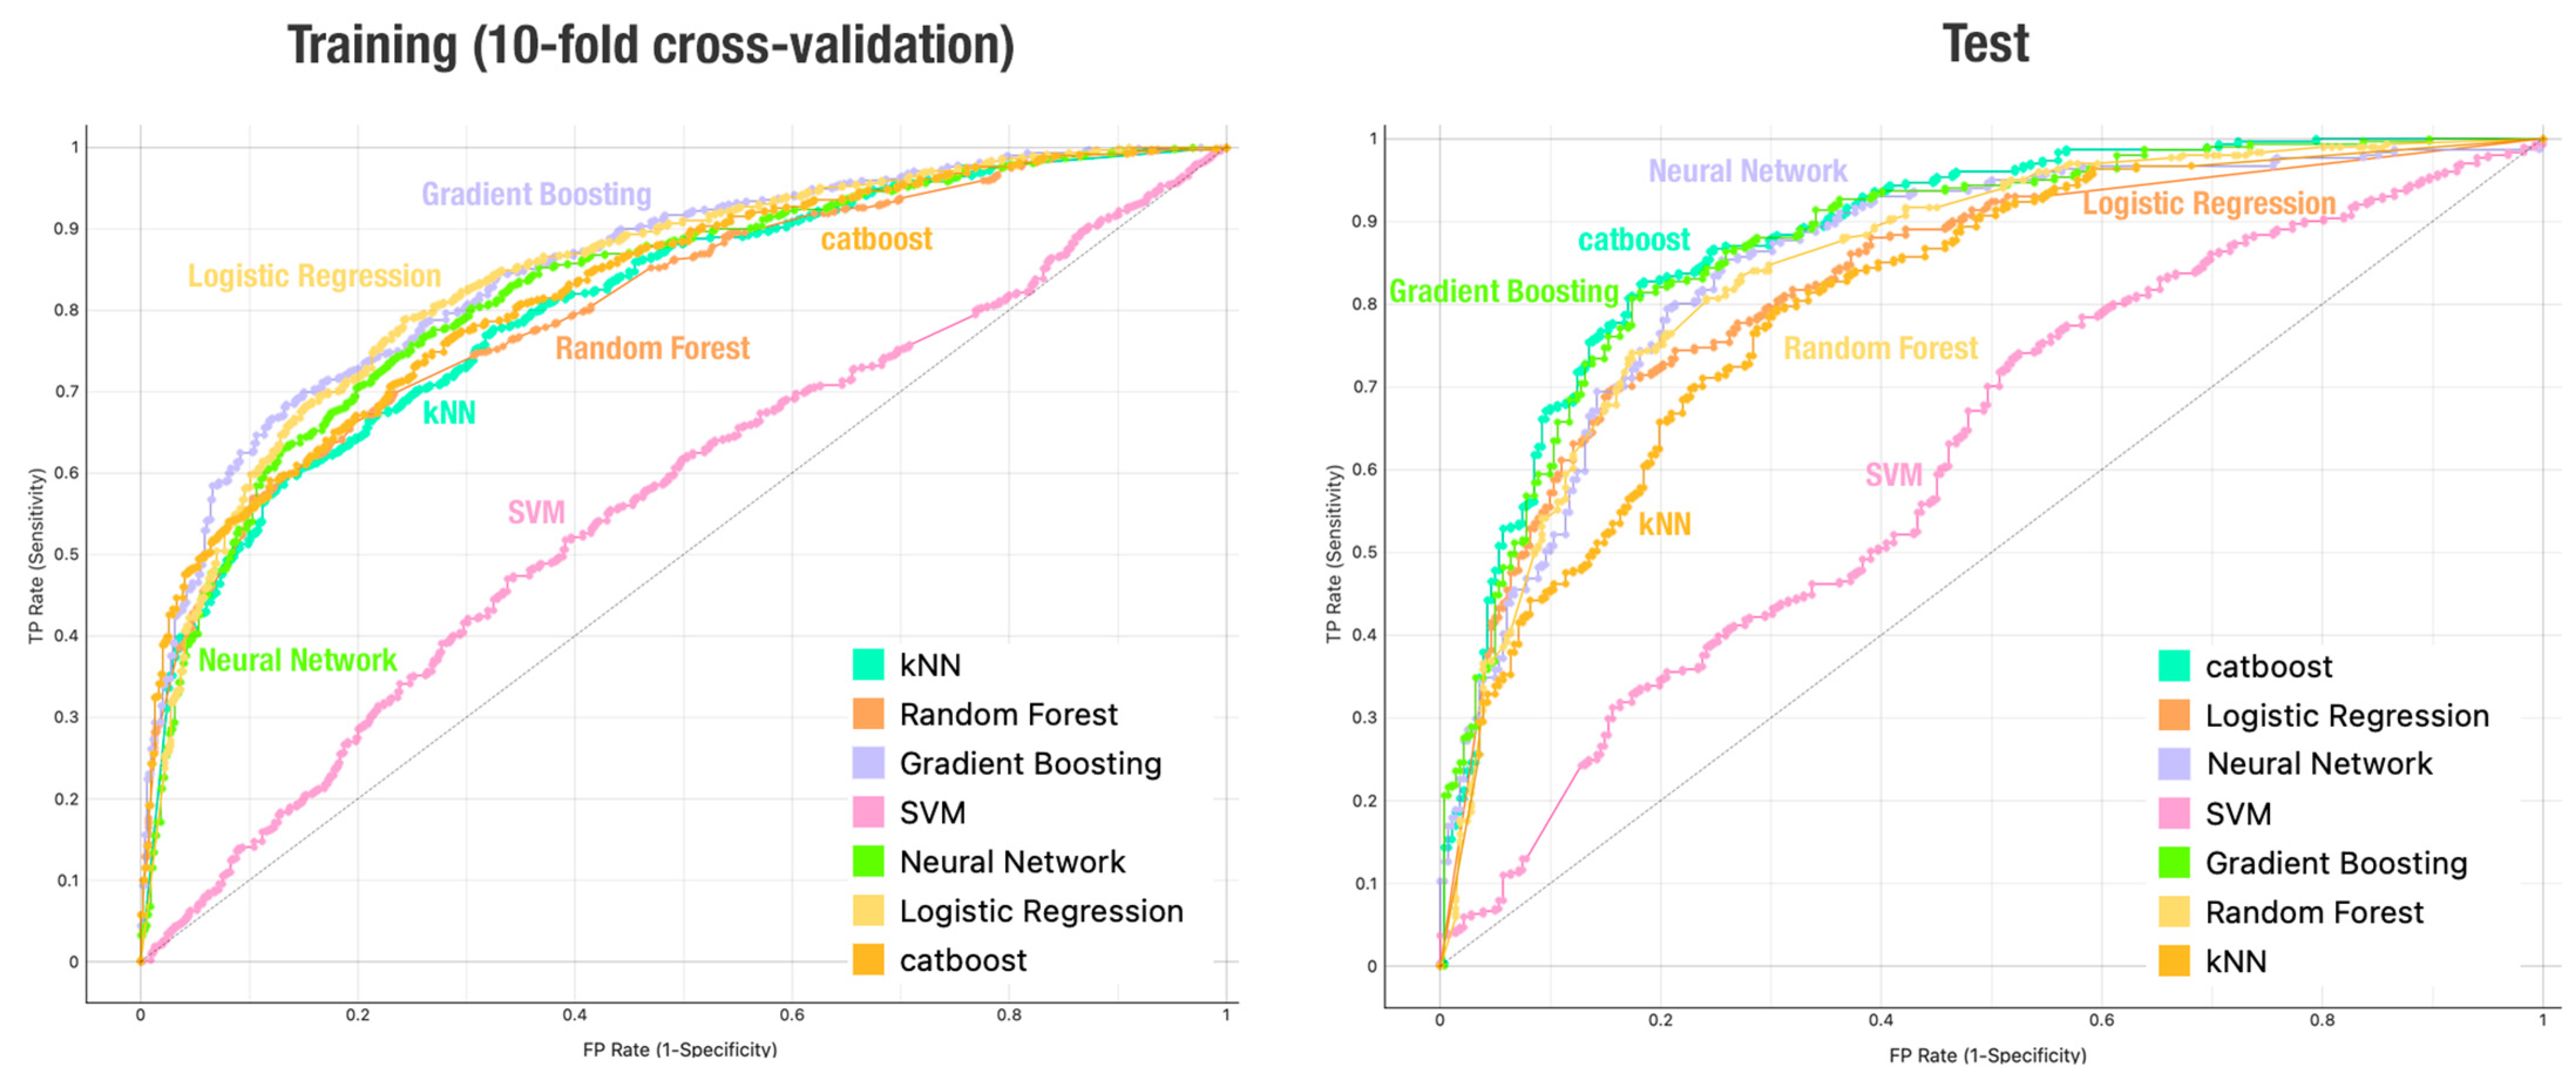
| Model | Accuracy | F1-Score | Precision | Recall | Specificity |
|---|---|---|---|---|---|
| Logistic Regression | 0.771 | 0.782 | 0.773 | 0.791 | 0.749 |
| Gradient Boosting | 0.762 | 0.774 | 0.764 | 0.784 | 0.738 |
| Neural Network | 0.748 | 0.764 | 0.742 | 0.788 | 0.705 |
| CatBoost | 0.741 | 0.754 | 0.743 | 0.766 | 0.714 |
| Random Forest | 0.730 | 0.729 | 0.763 | 0.698 | 0.765 |
| kNN | 0.723 | 0.738 | 0.725 | 0.752 | 0.692 |
| SVM | 0.558 | 0.610 | 0.563 | 0.664 | 0.444 |
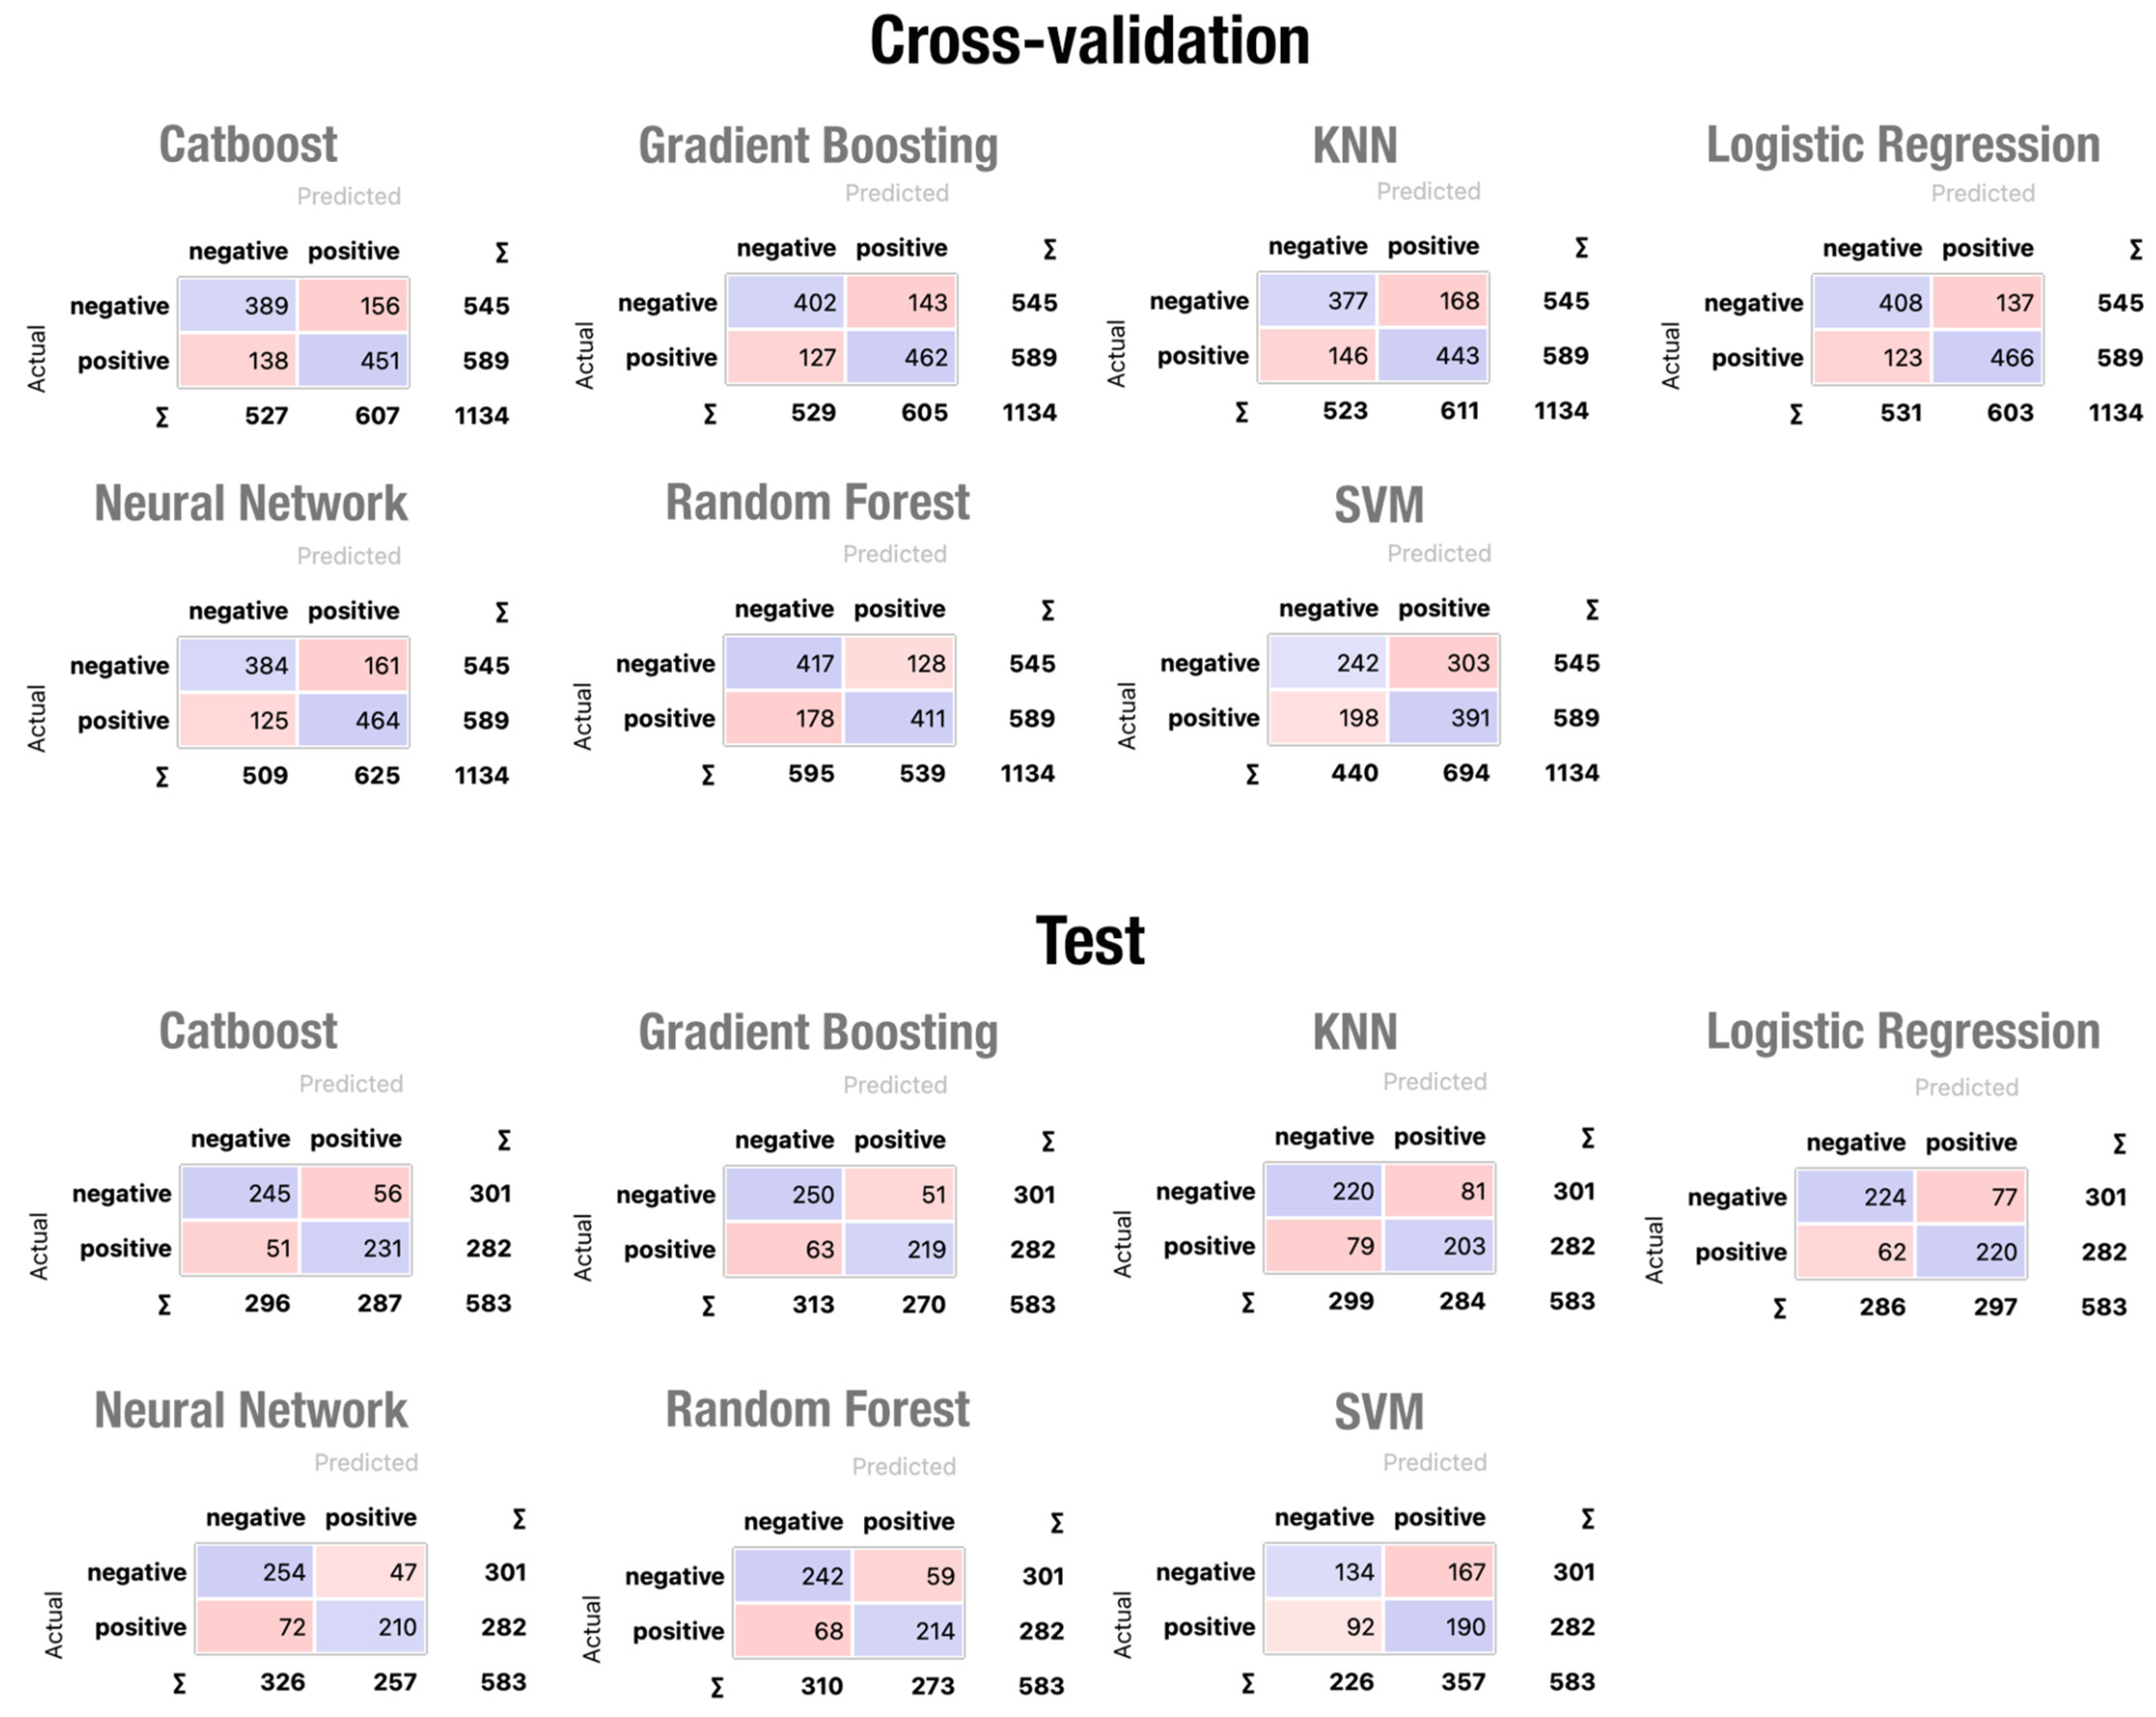
| Model | Accuracy | F1-Score | Precision | Recall | Specificity |
|---|---|---|---|---|---|
| CatBoost | 0.816 | 0.812 | 0.805 | 0.819 | 0.814 |
| Gradient Boosting | 0.804 | 0.793 | 0.811 | 0.777 | 0.831 |
| Neural Network | 0.796 | 0.779 | 0.817 | 0.745 | 0.844 |
| Random Forest | 0.782 | 0.771 | 0.784 | 0.759 | 0.804 |
| Logistic Regression | 0.762 | 0.760 | 0.741 | 0.780 | 0.744 |
| kNN | 0.726 | 0.717 | 0.715 | 0.720 | 0.731 |
| SVM | 0.556 | 0.595 | 0.532 | 0.674 | 0.445 |
| This Study | TemStaPro-t55 | |
|---|---|---|
| Accuracy | 0.816 | 0.662 |
| F1 | 0.812 | 0.516 |
| Precision | 0.805 | 0.840 |
| Recall | 0.819 | 0.372 |
| Specificity | 0.814 | 0.934 |
| TP | 231 | 105 |
| TN | 245 | 281 |
| FP | 56 | 20 |
| FN | 51 | 177 |
| Uniprot ID | Organism | Real Class | Prediction |
|---|---|---|---|
| A0A0B2A6F6 | Microbacterium mangrovi | Negative | Negative |
| A0A0B3BP14 | Thermoanaerobacter sp. YS13 | Positive | Positive |
| A0A0G0PX59 | Candidatus Falkowbacteria bacterium | Negative | Positive |
| A0A087E2J5 | Bifidobacterium thermacidophilum | Positive | Negative |
Disclaimer/Publisher’s Note: The statements, opinions and data contained in all publications are solely those of the individual author(s) and contributor(s) and not of MDPI and/or the editor(s). MDPI and/or the editor(s) disclaim responsibility for any injury to people or property resulting from any ideas, methods, instructions or products referred to in the content. |
© 2025 by the author. Licensee MDPI, Basel, Switzerland. This article is an open access article distributed under the terms and conditions of the Creative Commons Attribution (CC BY) license (https://creativecommons.org/licenses/by/4.0/).
Share and Cite
Mariano, D. A Machine Learning Approach for the Prediction of Thermostable β-Glucosidases. Appl. Sci. 2025, 15, 4839. https://doi.org/10.3390/app15094839
Mariano D. A Machine Learning Approach for the Prediction of Thermostable β-Glucosidases. Applied Sciences. 2025; 15(9):4839. https://doi.org/10.3390/app15094839
Chicago/Turabian StyleMariano, Diego. 2025. "A Machine Learning Approach for the Prediction of Thermostable β-Glucosidases" Applied Sciences 15, no. 9: 4839. https://doi.org/10.3390/app15094839
APA StyleMariano, D. (2025). A Machine Learning Approach for the Prediction of Thermostable β-Glucosidases. Applied Sciences, 15(9), 4839. https://doi.org/10.3390/app15094839