Article

Video Interpolation-Based Multi-Source Data Fusion Method for Laser Processing Melt Pool

1
State Key Laboratory of Featured Metal Materials and Life-Cycle Safety for Composite Structures, Guangxi University, Nanning 530004, China
2
Institute of Laser Intelligent Manufacturing and Precision Processing, School of Mechanical Engineering, Guangxi University, Nanning 530004, China
*
Author to whom correspondence should be addressed.
Appl. Sci. 2025, 15(9), 4850; https://doi.org/10.3390/app15094850 (registering DOI)
Submission received: 1 April 2025 / Revised: 21 April 2025 / Accepted: 24 April 2025 / Published: 27 April 2025

Abstract

:
In additive manufacturing processes, the metal melt pool is decisive for processing quality. A single sensor is incapable of fully capturing its physical characteristics and is prone to data inaccuracies. This study proposes a multi-sensor monitoring solution integrating an off-axis infrared thermal camera with an on-axis high-speed camera to address this issue; a multi-source data pre-processing procedure has been designed, a multi-source data fusion method based on video frame interpolation has been developed, and a self-supervised training strategy based on transfer learning has been introduced. Experimental results indicate that the proposed data fusion method can eliminate temperature anomalies caused by single emissivity and droplet splashing, generating highly credible fused data and significantly enhancing the stability of metal additive manufacturing and the quality of parts.

1. Introduction

Additive manufacturing technology is widely applied in the manufacturing industry due to its advantages, such as high manufacturing flexibility, short product manufacturing cycles, and high material utilization rates [1]. Metal additive manufacturing technology heats and melts materials through an electron beam or laser, achieving rapid melting and solidification of materials and forming complete parts through layer-by-layer processing [2]. In this process, the liquid metal region formed by the melting of metal materials is referred to as the melt pool. The formation, flow, and rapid solidification of the melt pool may lead to processing instability, resulting in defects such as porosity and cracks in the formed parts, which can severely impact the performance of the parts. Therefore, to ensure the quality and reliability of metal additive manufacturing parts, it is crucial to monitor the formation and solidification changes of the melt pool during the processing [3,4].
In situ monitoring technologies based on high-speed cameras, infrared thermal cameras, Laser Cladding Profilers, Acoustic Emission sensors, and other tools have been proven to be effective in additive manufacturing process monitoring [5,6]. However, since additive manufacturing is a complex process and a single sensor cannot fully capture its physical characteristics, multi-sensor joint monitoring has become a hot topic of research [6,7,8,9]. The advancement of deep learning technology has propelled the widespread application of multi-sensor joint monitoring techniques across multiple domains [10,11,12,13]. High-speed cameras and infrared thermal cameras have advantages in monitoring the dynamics of the melt pool and temperature distribution, and many studies combine these two types of sensors and integrate multi-source data through machine learning to monitor the behavior of the melt pool. Gaikwad et al. [8] designed an in-process monitoring setup consisting of high-speed melt pool imaging and melt pool temperature field imaging sensors to extract LPBF melt pool characteristics, including the morphology of the melt pool, the temperature distribution of the melt pool, and characteristics of the spatter, and used deep learning models for feature fusion to detect laser spot size deviation and predict the type and severity of porosity. Chen et al. [7] extracted temperature field, melt pool geometry, and acoustic features via an off-axis short-wavelength infrared thermal camera, a coaxial melt pool vision camera, and microphone sensor data, using machine learning models to integrate multi-sensor features with real-time robot tool-center-point positions to predict local quality in the L-DED process. Yu et al. [14] used CCD cameras and infrared thermal cameras to obtain the geometrical properties of and temperature field distribution features of the melt pool, designing a deep learning-based contour extraction algorithm to extract the area, length, and width of the melt pool, as well as an HOG algorithm based on trilinear interpolation to extract the temperature distribution characteristics of the side walls, and established a neural network-based model for predicting robotic trajectory deviation in wire arc additive manufacturing processes.
The aforementioned research on multi-source data for laser processing of the melt pool mainly focuses on feature-level fusion, which involves extracting and analyzing feature information from various data sources for subsequent monitoring and prediction tasks. However, the temperature distribution monitored by the infrared thermal camera is susceptible to the influence of factors such as the material’s emissivity and transmittance, which vary with temperature and material state, leading to monitoring errors [15]. These data errors affect the accuracy of feature extraction, reduce the precision of feature fusion, and may lead to misjudgment in process monitoring, ultimately resulting in a decline in processing quality. Unlike feature-level fusion, pixel-level fusion methods directly integrate the raw data provided by multiple sensors, compensating for errors during the data processing stage to provide high-information, low-error input data for subsequent data analysis. This study, concerning multi-source melt pool data obtained from an infrared thermal camera and a high-speed camera, proposes the use of data-level fusion methods to generate rich, low-error fusion data, addressing the inaccuracy of temperature distribution data from the infrared thermal camera and overcoming the limitations of insufficient information from a single data source.
Currently, multi-source data collected by high-speed cameras and infrared thermal cameras exhibit data errors, information discrepancies, and differences in data volumes. Moreover, the frame rate and resolution of high-speed cameras are both higher than those of infrared thermal cameras. In additive manufacturing monitoring with multiple sensors, downsampling methods are commonly used to balance data volume differences, but this limits the ability to effectively utilize disparate data for melt pool monitoring. Therefore, effectively integrating the distinctly different data obtained from high-speed cameras and infrared thermal cameras is a challenge in enhancing melt pool monitoring capabilities and ensuring processing quality. Deep learning-based video frame interpolation technology is commonly used to address the issue of insufficient frame rates in visual sensors, as this technology generates intermediate frames by analyzing the motion characteristics of the subject [16]. However, the non-linear motion characteristics of the melt pool in additive manufacturing and the difficulty of data acquisition make it challenging for models to effectively learn the motion features of the melt pool. In response to the differences in multi-source data, this paper proposes a multi-source data fusion method for laser processing melt pools based on video frame interpolation. This method combines video frame interpolation models with image fusion models and designs a training strategy based on pre-training to achieve the fusion of infrared and visible-light video data with different frame rates and information differences, thereby obtaining high-quality fused data, which are ultimately applied to the analysis of melt pool evolution behavior during the laser cladding process.
The structure of this paper is as follows: Section 2 describes the construction of the data acquisition system and the establishment of the dataset; Section 3 elaborates in detail on the multi-source data fusion method proposed in this study; Section 4 analyzes the experimental results and verifies the effectiveness of the proposed method; Section 5 summarizes the main contributions of this research and discusses future research directions.

2. Experiments and Data Preprocessing

2.1. Laser Cladding Experimental Platform and Experimental Design

The laser cladding experimental platform, as shown in Figure 1, consists of a laser cladding system and a multi-source data acquisition system. The laser cladding system includes a laser cladding head, a continuous 1080 nm laser with a maximum power of 2000 W, and a computer, with the cladding laser head mounted on a robotic arm that controls its motion. The multi-source data acquisition system is composed of a coaxial visible-light monitoring module and an off-axis temperature monitoring module connected to the laser cladding head via a beam-combination mirror.
The coaxial visible-light monitoring module includes a beam-combination mirror, an 808 nm filter, a high-speed camera, and an auxiliary light source. The high-speed camera (Revealer M230, Hefei, China) is coaxially connected to the filter and is introduced into the laser beam path through a 45° inclined beam combiner. This camera has a maximum frame rate of 25,000 FPS, a minimum exposure time of 1 μs, and a maximum resolution of 1920 × 1080. Equipped with an 808 nm laser as an auxiliary light source, during processing, the auxiliary light illuminates the processing area, reflects off the cladding head, and is projected onto the beam combiner by a focusing lens, reflected into the monitoring module by the beam combiner, and imaged by the high-speed camera. To ensure clear imaging of the melt pool and defects, the spatial resolution of the high-speed camera used in this study was 50 μm/pixel, with an optical distance of 503 mm, a field of view (FOV) of 96 mm × 54 mm, and a field-of-view angle of 12.5°. In the experiment, the high-speed camera collected visible-light data at a resolution of 1920 × 1080 and a frame rate of 100 FPS.
The off-axis temperature monitoring module is equipped with an infrared thermal camera (FLIR A615, Wilsonville, OR, USA) for capturing the temperature distribution in the melt pool area. The infrared thermal camera has a resolution of 640 × 480 and a frame rate of 50 FPS and is installed at a 45° angle to the Z-axis. To ensure the accuracy of monitoring, the infrared thermal camera should be positioned as close to the processing area as possible. At a working distance of 600 mm, the infrared thermal camera has an FOV of 128 mm × 96 mm, a field-of-view angle of 15.2°, and a spatial resolution of 200 μm/pixel. In the experiment, the infrared thermal camera collects infrared temperature distribution data at a resolution of 640 × 480 and a frame rate of 50 FPS.
In this experiment, a non-magnetic iron-based powder was selected as the material. The laser power was set to 1100 W, the laser spot diameter was 2.3 mm, the scanning speed was 9 mm/s, and the purity of the argon gas used reached 99.99%. The melt track was L-shaped, with the design details shown in Figure 1 within the blue dashed-line box. After adjusting the focal length of the two cameras, the visible-light data of the melt pool and the temperature distribution during the laser cladding process were recorded synchronously. A total of 694 visible-light images and 347 infrared temperature distribution images were collected in the experiment.

2.2. Data Preprocessing

In Section 2.1, the collected multi-source data of the melt pool had three issues. Firstly, the data contained a significant amount of noise, such as the temperature distribution of the cladding head included in the infrared temperature distribution data and the noise generated by light reflection in the visible-light data. Secondly, the multi-source data had not been registered. Due to the different installation positions of the infrared thermal camera and the high-speed camera, it is difficult to precisely align features from different sources during data fusion; hence, data registration is a necessary step. Lastly, deep learning models require a substantial amount of data support, and the volume of data obtained was insufficient to meet the needs of network model training. In response to these issues, this study proposes a multi-source data pre-processing method, as shown in Figure 2. This method includes data cleaning, data registration, ROI extraction, and data augmentation.
(1)
Data Cleaning: In this study, the data cleaning process consisted of two main stages. For visible-light data, the specular reflection part was removed using a manually designed IR mask. The design of the IR mask is shown in Figure 2, marking the cladding nozzle area as True and the rest as False. For infrared temperature distribution data, a threshold segmentation algorithm was first applied, with a threshold set to 90, to retain the temperature data of the melt pool area and droplet splash. Then, an 8-connected region analysis method was used to ensure that the melt pool area and the cladding head area were not connected in the image and were both complete. Finally, the temperature distribution of the cladding head was removed, and the temperature distribution of the melt pool was retained.
(2)
Data Registration: This study employed affine transformation to process images obtained from the infrared thermal camera to achieve registration between the visible-light and the infrared thermal camera processing areas. The affine transformation formula is as follows:
x y 1 = R 00 R 01 R 02 R 10 R 11 R 12 0 0 1 x y 1
where x y 1 represents the coordinates of a certain pixel in the original infrared image, x y 1 represents the corresponding coordinates after affine transformation, and R i j denotes the parameters in the affine transformation matrix.
(3)
ROI Extraction: After the affine transformation was completed, we proceeded with ROI extraction. Since the center of the transformed infrared image still corresponds to the cladding area, to ensure that the ROI regions of the visible-light and infrared images correspond to the same cladding area, the position of the laser light source is taken as the center of the ROI region. Based on the temperature distribution of the melt pool area, the resolution of the infrared image ROI region is set to 200 × 200 to maintain the characteristics of the temperature distribution of the melt pool and its surroundings, reducing feature loss. Considering the difference in spatial resolution between the high-speed camera and the infrared thermal camera, to ensure consistency in the spatial resolution of the multi-source data during image fusion and to retain as much image information as possible, the infrared data are upsampled to align spatially with the visible-light video data. The resolution of the visible-light image ROI region is also set to 200 × 200. To address potential data distortion during the upsampling process, this study included distortion compensation in the image fusion module to ensure the authenticity of the fused images.
(4)
Data Augmentation: The number of infrared data collected in the experiment was relatively small, only 347 images, while the number of visible-light data was larger, approximately 694 images. This study enhanced the infrared data to meet the data requirements for network model training and to enhance the model’s generalization ability for different processing conditions. Considering that the scanning directions in the experiment were along the X- and Y-axes, data diversity was increased through image rotation and flipping operations. Specific operations include flipping along the X-axis, the Y-axis, and in both directions, generating 7 new images from each image. After data augmentation, the number of infrared images increased to 2776, and the number of visible-light images increased to 5552. It should be noted that the optimal cladding quality is achieved within the laser cladding process window determined in the experiment, which can obtain a steady-state melt pool morphology. This enables the proposed multi-source data fusion method to have sufficient generalizability in the application of steady-state melt pool morphology in various laser processing processes. However, it must be acknowledged that the practicality under extreme conditions, such as large melt pool fluctuations, ultra-high-speed processing, and a high power density, still needs to be assessed.
This study constructed an image fusion dataset, a data fusion dataset, and two video frame interpolation datasets, all allocated in an 8:1:1 ratio for training, validation, and testing sets, respectively. Specific configurations are shown in Table 1. Dataset 1 comprises 2776 images of the melt pool temperature distribution and 2776 images of the visible-light melt pool morphology. This dataset was used to test the performance of the image fusion module. Dataset 2 contains 2776 images of the melt pool temperature distribution and 5552 images of the visible-light melt pool morphology. This dataset was used to test the performance of the proposed data fusion method and to simulate the application of the proposed method in a real processing scenario. The video frame interpolation module uses two types of datasets: Dataset 3, based on a pre-trained infrared video frame interpolation module, contains 2776 infrared images and 5552 visible-light images, where infrared images generate a set of data every 1 frame, totaling 2729 sets; visible-light melt pool morphologies generate a set every 1 frames, totaling 5505 sets, with each set containing 1 consecutive image. Dataset 4 is a pre-training dataset for the video frame interpolation model, containing 1388 infrared images, generating a set of data every 1 frame, totaling 1341 sets.

3. A Method for Multi-Source Data Fusion Based on Video Frame Interpolation

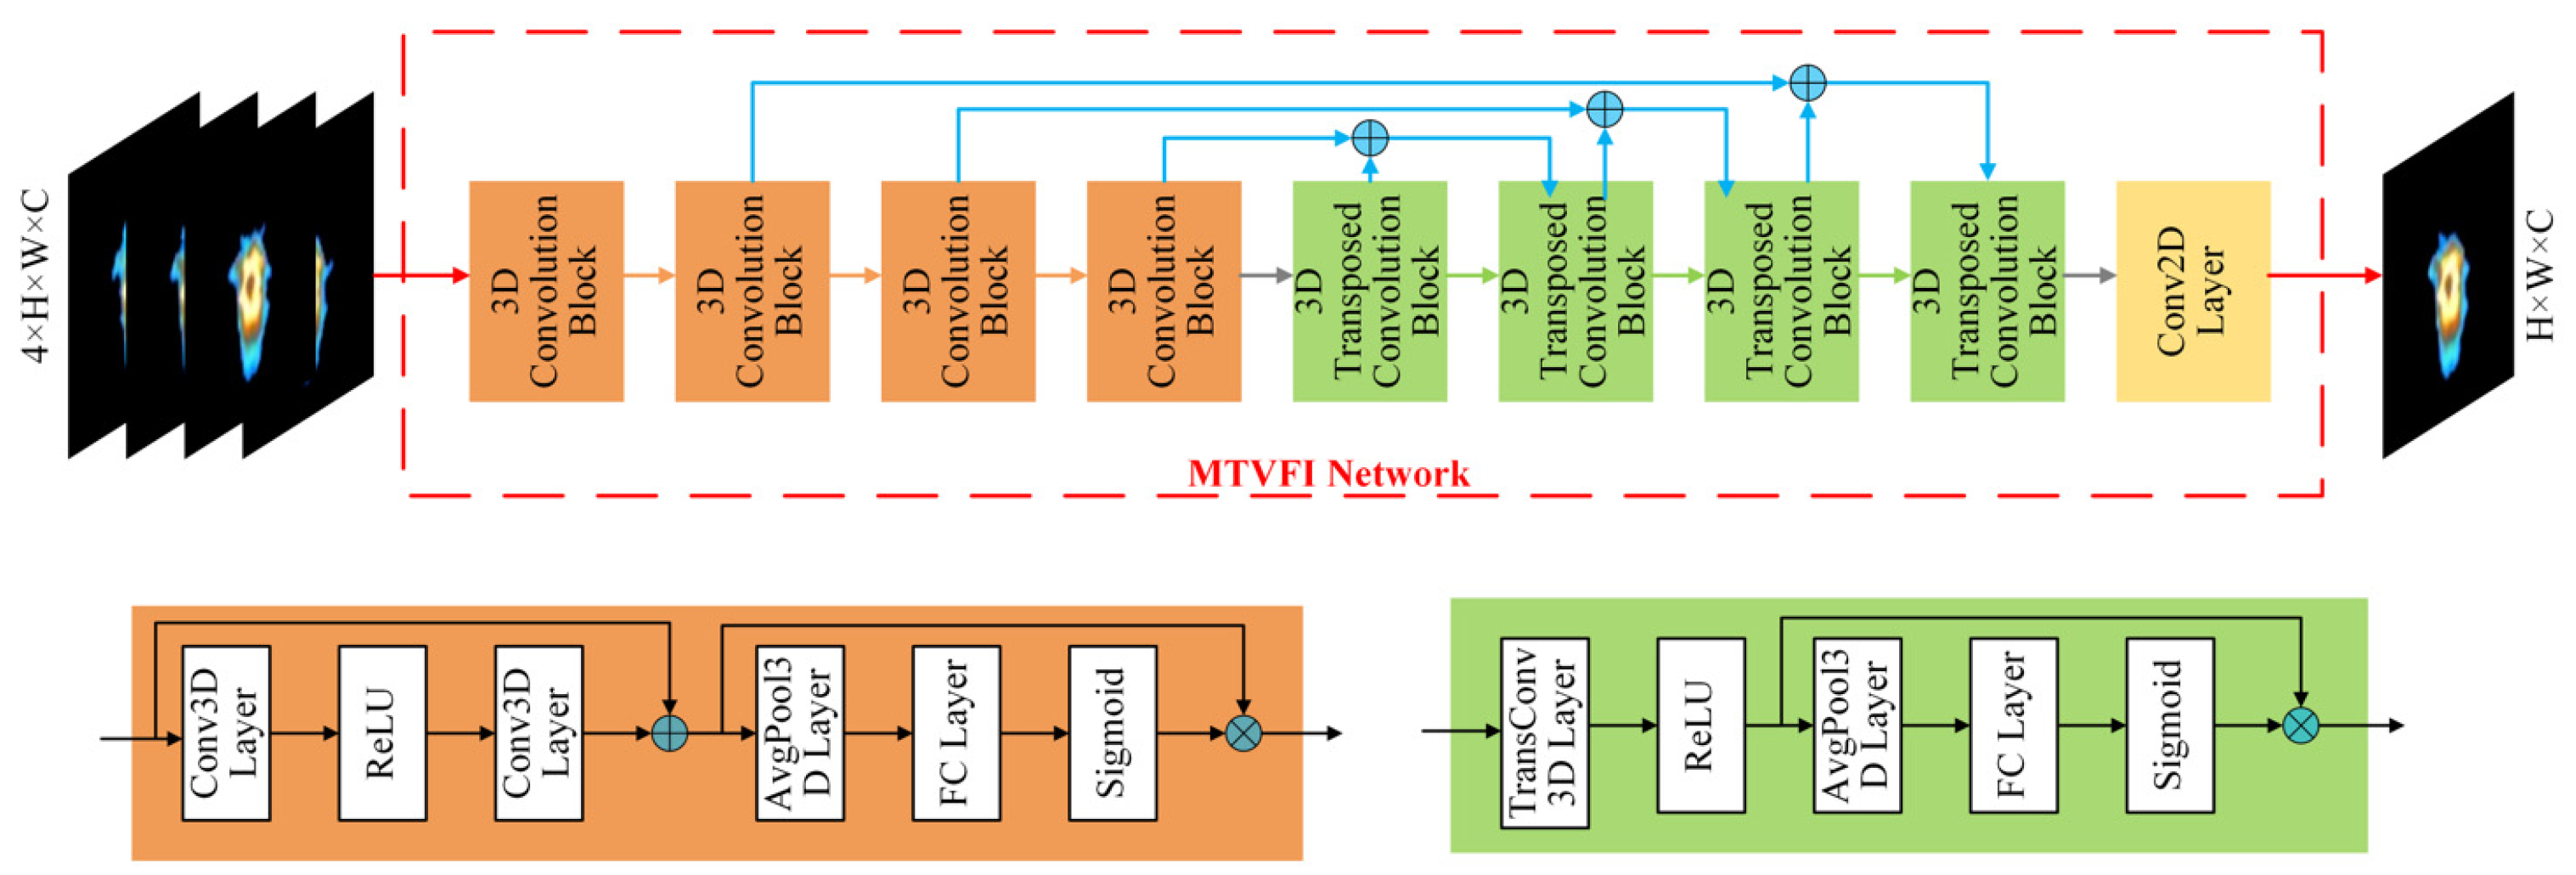
3.1. Infrared Video Frame Interpolation Network Model

In current research on melt pool temperature distribution based on infrared thermal cameras, there is an issue where the frame rate of infrared video is low while that of visible-light video is high. To balance the frame rates and supplement the dynamic changes in infrared video, this study designed a deep learning-based video frame interpolation module. Deep learning video frame interpolation models can be divided into optical flow methods and non-optical flow methods [12]. Optical flow methods calculate the motion information of objects by analyzing the temporal changes and inter-frame correlations of pixels in image sequences [17]. However, the characteristics of laser cladding melt pool images violate the fundamental principle of optical flow estimation, which is that the brightness of the same target remains constant across different frames. Therefore, this study employed non-optical flow methods. Currently, research on video frame interpolation based on non-optical flow methods has conducted in-depth analyses of issues such as large motion and occlusion and has introduced network structures such as 3D convolution [18], self-attention mechanisms [19], and deformable convolution networks [20]. Due to the rapid and non-linear changes in melt pool infrared videos, which are highly dependent on the spatiotemporal correlations of the melt pool motion, 3D space–time convolutions can learn the spatiotemporal features of melt pool infrared videos through convolution of multiple frames, generating interpolated frames with reasonable motion characteristics [21]. Tarun Kalluri et al. [18] proposed a video frame interpolation model based on 3D space–time convolutions, known as the FLAVR model. The model is capable of accurately obtaining the spatiotemporal features of video data without optical flow, learning the linear motion characteristics of the target, and generating high-confidence interpolated frames based solely on the original video in the absence of reference data. However, the motion of the melt pool exhibits non-linear high-dynamic characteristics and is susceptible to image noise in high-temperature environments. To address these issues, this study proposes the Melt Pool Thermal Video Frame Interpolation (MTVFI) model, the architecture of which is shown in Figure 3. A loss function based on the Structural Similarity Index Measure (SSIM) is designed to constrain the model to learn the non-linear motion features of the melt pool and reduce image noise. Moreover, considering the characteristics of multi-source data, a training strategy based on transfer learning is proposed in this study. Through an end-to-end spatiotemporal feature learning mechanism, the model achieves high-confidence frame interpolation without the need for explicit optical flow estimation, making it suitable for melt pool monitoring in metal additive manufacturing where reference values are lacking.
As shown in Figure 3, the MTVFI model takes a cluster of infrared images with a size of 4 × H × W × C as input and produces an interpolated infrared frame with a size of H × W × C , where H and W represent the width and height of the infrared images, respectively, and C is the number of channels in the infrared images, with C = 3 in this study.
The model structure mainly consists of four 3D convolution blocks, four 3D transposed convolution blocks, and a convolution2D layer. Each 3D convolution block includes two convolution3D layers, a ReLU activation function, an average pooling layer, a fully connected layer, and a Sigmoid activation function. The output of the second convolution3D layer is concatenated with the input of the first convolution3D layer to form the input for the average pooling layer, which is then multiplied with the output of the Sigmoid activation function along the channel axis to obtain the output of the 3D convolution block. This structure allows the model to focus more on the feature map dimensions highly related to the interpolated frames. The output of each 3D convolution block and its corresponding 3D transposed convolution block is connected via skip connections to the next layer’s 3D transposed convolution block to ensure the reuse of features from higher layers and to address the vanishing and degradation of gradients. The 3D transposed convolution block is structurally similar to the 3D convolution block, with the only difference being the replacement of the 3D convolution layer with a 3D transposed convolutional layer.
During laser processing, the infrared images of the melt pool contain rich temperature gradients and surrounding temperature information. To ensure that the model can accurately generate interpolated frames with precise temperature values and distributions and correctly learn the motion characteristics of the melt pool, this study designed a loss function suitable for the infrared temperature distribution of the melt pool based on the SSIM function. The SSIM-based loss function, as shown in Equation (2), consists of luminance similarity ( l x , y ), contrast similarity ( c x , y ), and structural similarity ( s x , y ), where x and y represent the source image and the generated interpolated frame image, respectively.
L x , y = l x , y c x , y s x , y
The formula for calculating brightness similarity is given by the following:
l x , y = 2 μ x μ y + C 1 μ x 2 + μ y 2 + C 1
where μ x and μ y represent the average brightness of the source image and the interpolated frame generated by the model, respectively, and C 1 is a constant.
Contrast similarity is the degree of light and dark changes in an image. By analyzing contrast similarity, ensure that the frame interpolation model pays attention to temperature gradients. The formula for calculating contrast similarity is given by the following:
c x , y = 2 σ x y + C 2 σ x 2 + σ y 2 + C 2
where N denotes the number of pixels, C 2 represents the constant image contrast, and σ x is the standard deviation of pixel values. The formula for calculating the standard deviation of pixel values ( σ x ) is given by the following:
σ x = 1 N 1 i = 1 N x i μ x 2 1 / 2
The formula for calculating the structural similarity index is given by the following:
s x , y = σ x y + C 3 σ x σ y + C 3
where C 3 is a constant and σ x y represents the normalized covariance, which is calculated using the following formula:
σ x y = 1 N 1 i = 1 N x i μ x y i μ y

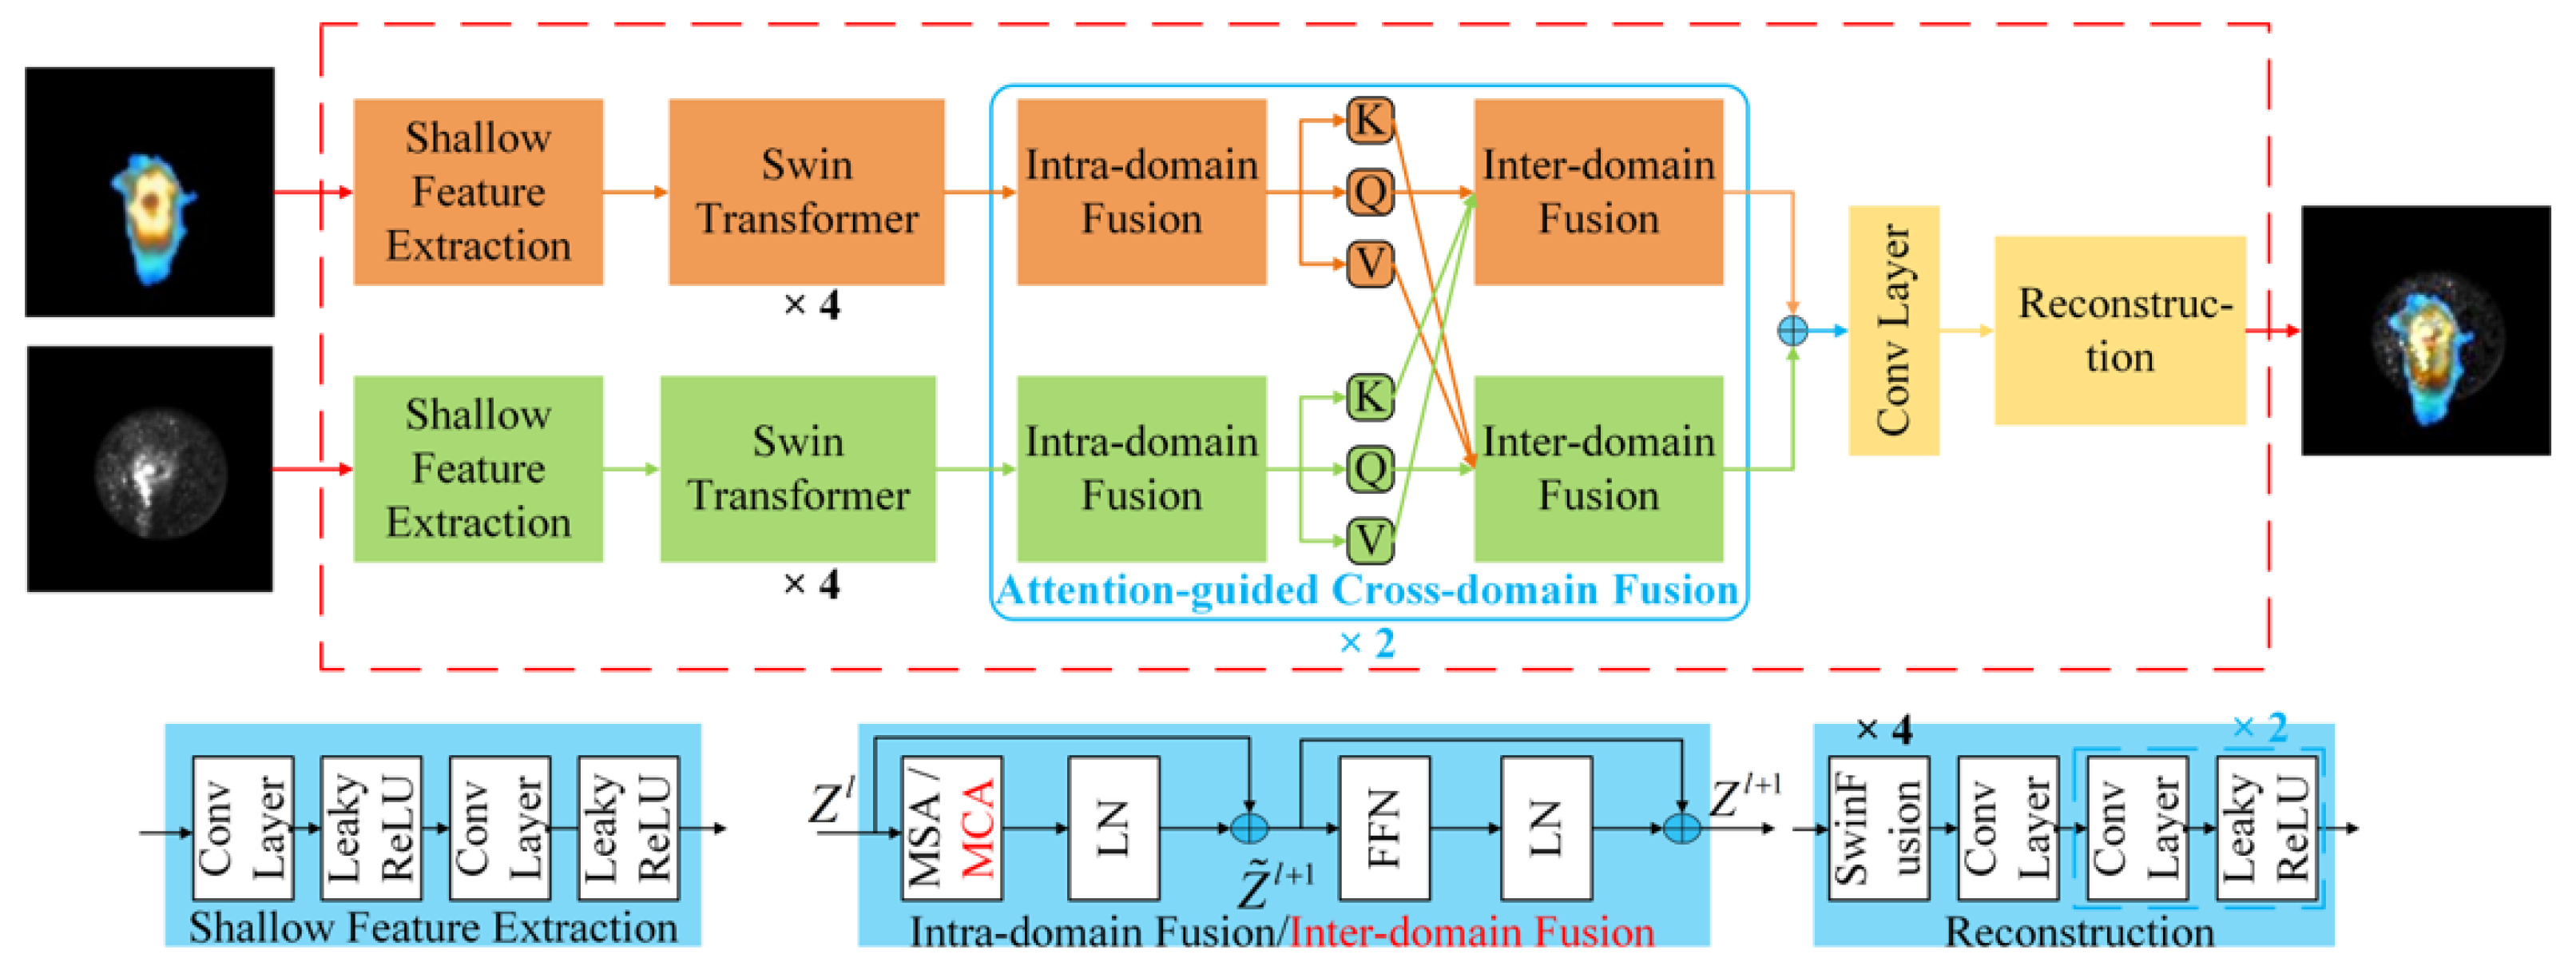
3.2. Infrared and Visible Image Fusion Network Model

Current multi-sensor monitoring technology primarily employs deep learning models to extract and fuse the differential features of multi-source data for melt pool monitoring. Although this method has successfully utilized the differential data within the multi-source data of the melt pool, it struggles to effectively address the error issues in multi-source data, such as abnormal temperature distributions in infrared images. Therefore, this paper designed an infrared and visible-light image fusion module. It uses a deep learning model to extract the differential information of multi-source data and generates high-information-content fused images at the data level. Additionally, a shifted-window mechanism is adopted to thoroughly learn the morphological features and temperature distribution of the melt pool, thereby alleviating the impact of abnormal temperature distributions in infrared images. To the best of the authors’ knowledge, this is the first application of a deep learning-based image fusion model to the monitoring of laser cladding melt pools. The core of infrared and visible image fusion algorithm design lies in how to integrate the thermal radiation information captured by infrared images with the reflected light information captured by visible-light images to enhance the expressive power of the fused image. With the advancement of deep learning, image fusion models based on CNN [22], AE [23], and GAN [24] have been proposed and have demonstrated excellent performance in various everyday environments. However, current research still falls short in the integration of cross-domain information. Ma et al. [25] proposed a universal image fusion model—the SwinFusion model—which utilizes the shifted-window mechanism of the Swin Transformer to design an attention-guided cross-domain fusion module, achieving global feature fusion by interacting with queries, keys, and values from different domains and integrating complementary features within the same domain and across domains. In infrared images of the melt pool, chromatic information directly reflects temperature information, while visible-light images contain morphological and detailed information of the melt pool. Therefore, the data fusion of melt pool infrared images and visible-light images must fully utilize complementary features at both local and global levels. The shifted-window mechanism ensures a high level of attention to multi-scale features [26]. Based on the SwinFusion model, this paper accomplishes the task of image fusion between infrared videos of laser processing melt pools and visible-light videos. The network structure of the image fusion model is shown in Figure 4, consisting of two shallow feature extractions, eight Swin transformers, two attention-guided cross-domain fusions, a convolutional layer, and a reconstruction.
The shallow feature extraction layer is used to extract shallow features from multi-source data, consisting of two convolutional layers and two leaky ReLU layers alternating with each other. Subsequently, four Swin Transformer layers are used to extract deep features and to balance the data errors caused by the different spatial resolutions of the original infrared and visible-light images.
The Attention-Guided Cross-Domain Fusion Module (ACFM) aims to mine and aggregate deep features extracted by the feature extraction module, including global contextual information within and between domains. The image fusion model includes two ACFM modules, each consisting of a self-attention-based intra-domain fusion unit and a cross-attention-based inter-domain fusion unit cascaded together. The self-attention-based intra-domain fusion unit includes Multi-Head Self-Attention (MSA), a Feed-Forward Network (FFN), and two Layer Normalizations (LNs). First, the input is divided into M × M non-overlapping local windows using the shifted-window mechanism, and features of size H × W × C are reshaped into features of size H W M 2 × M 2 × C , generating a total of H W M 2 windows. Then, the reshaped features are projected to obtain Q (query), K (key), and V (value).
Q , K , V = X W Q , X W K , X W V
where X M 2 × C represents the local window feature, while W Q C × C , W K C × C , and W V C × C are learnable weight matrices. The formula for the attention mechanism is as follows:
A t t e n t i o n Q , K , V = S o f t M a x Q K T d k V
where d k is the dimension of the key and S o f t M a x is the softmax function used to calculate the attention weights. The FFN consists of two multi-layer perceptrons (MLPs) and a GELU activation function, with layer normalization (LN) performed after each MSA and FFN. Additionally, residual connections are applied within both modules. The expressions for the intra-domain fusion unit are as follows:
Z l 1 = Q , K , V , Z ˜ l = L N W M S A Z l 1 + Q , Z l = L N F F N Z ˜ l + Z ˜ l
The cross-attention-based inter-domain fusion unit is designed to further integrate global interactions between different domains, where the inter-domain fusion unit uses Multi-Head Cross-Attention (MCA) instead of MSA to achieve global context exchange across domains. The inter-domain fusion unit is defined as follows:
Z ˜ 1 l 1 = Q 1 , K 2 , V 2 = X 1 W 1 Q , X 2 W 2 K , X 2 W 2 V , Z ˜ 2 l 1 = Q 2 , K 1 , V 1 = X 2 W 2 Q , X 1 W 1 K , X 1 W 1 V , Z ˜ i l = L N W M C A Z ˜ i l 1 + Q i , Z i l = L N F F N Z ˜ i l + Z ˜ i l , i 1 , 2
The shifted-window mechanism of the Swin Transformer layer is shown in Figure 5. At layer i, a regular window configuration is used. At layer i + 1, the window partitions are cyclically shifted M 2 , M 2 pixels to the upper left, ensuring communication and connection across windows.
After the ACFM module, a convolutional layer is used to aggregate information from different domains and serves as the input to the reconstruction module. The reconstruction module, composed of four Swin Transformer layers, three convolutional layers, and two Leaky ReLU activation functions, is responsible for reconstructing the image from a global perspective and generating the fused image. The kernel size of the convolutional layers in the reconstruction module is 3 × 3, with a stride of 1.
To ensure that the fused image retains sufficient structural and textural features and to adjust the intensity, the weighted sum of SSIM loss ( L s s i m ), texture loss ( L t e x t ), and intensity loss ( L i n t ) is used as the overall loss function, and its formula is as follows:
L I f , I 1 , I 2 = 10 L s s i m I f , I 1 , I 2 + 20 L t e x t I f , I 1 , I 2 + 20 L i n t I f , I 1 , I 2
SSIM loss ( L s s i m ) is composed of the loss function of the MTVFI model, and the formula is as follows:
L s s i m I f , I 1 , I 2 = 0.5 1 L I f , I 1 + 0.5 1 L I f , I 2
Texture loss is used to preserve and aggregate the textural details of the source images. This loss measures the textural information of the images through the Sobel gradient operator ( ), performs an absolute value operation, calculates the difference between the operation results of the fused image and the maximum operation results of the infrared and visible-light images, and finally applies l 1 n o r m to obtain the texture loss:
L t e x t I f , I 1 , I 2 = 1 H W I f max I 1 , I 2 1
The intensity loss is used to ensure that the intensity of the fused image is consistent with that of the source images, and its formula is as follows:
L i n t I f , I 1 , I 2 = 1 H W I f max I 1 , I 2 1

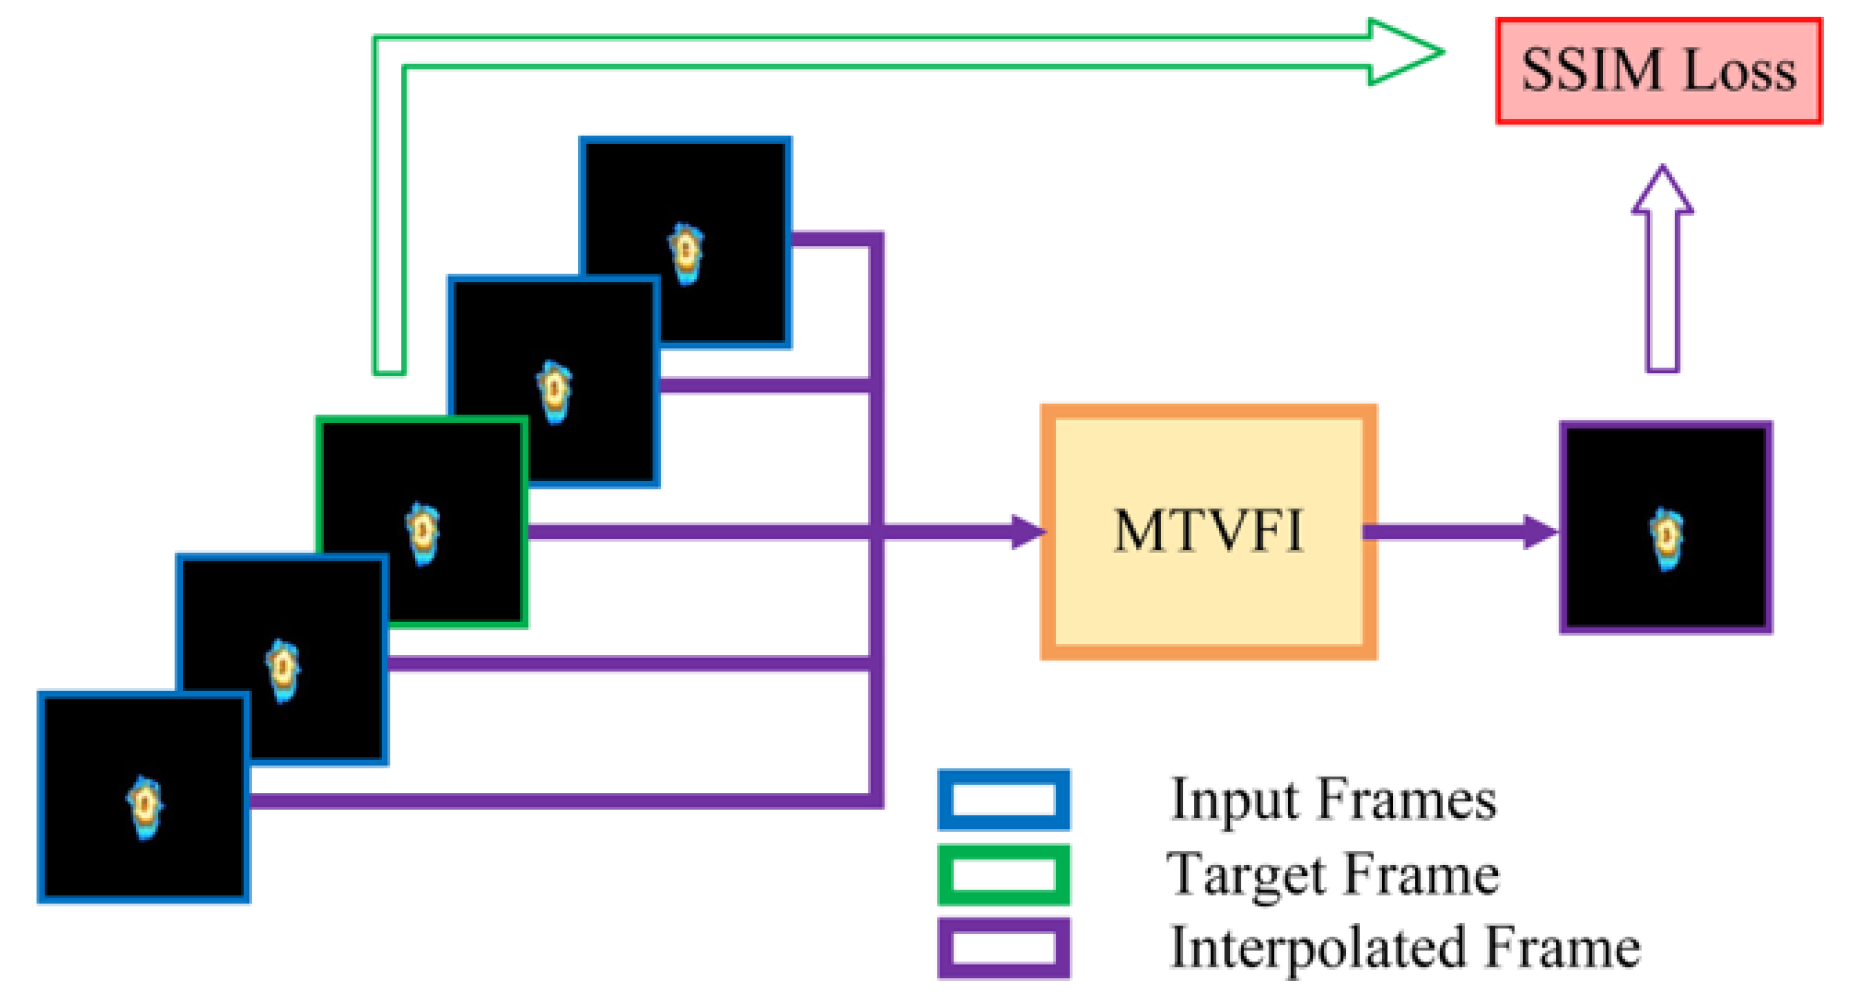
3.3. Self-Supervised Training Strategy Based on Transfer Learning

The training of deep learning models relies on the scale of the data, but obtaining large-scale visible-light and infrared data of the melt pool poses a challenge. This study proposes a self-supervised training strategy based on transfer learning, aimed at obtaining superior video frame interpolation and image fusion models with a small amount of training data. The strategy is divided into two steps: the first step is for video frame interpolation models, which are pre-trained on high-frame-rate visible-light datasets, then further optimized on low-frame-rate infrared datasets through transfer learning, and introduces self-supervised mechanisms to address the issue of lacking ground truth; the second step is for image fusion models, which are first trained on datasets composed of low-frame-rate heterogeneous image pairs and then retrained on datasets composed of high-frame-rate heterogeneous image pairs through transfer learning.
Specifically, to address the issue of low frame rates in infrared videos and the complexity of melt pool motion, in order to enable the model to effectively understand and compensate for the deficiencies in dynamic change characteristics of low-frame-rate infrared videos, this study proposes a transfer learning-based video frame interpolation training strategy. The core of the strategy is to pre-train the video frame interpolation model on high-frame-rate visible-light videos. At this stage, the model can deeply learn the high-dynamic motion characteristics of the melt pool, which are crucial for capturing and understanding the complex behaviors in the laser processing process. After pre-training is completed, we employ transfer learning methods to adapt these learned high-dynamic change characteristics to low-frame-rate infrared videos. Through this method, the model can not only recognize and understand the dynamic changes in low-frame-rate videos but also predict and fill in the missing information between frames, thereby achieving effective frame interpolation for infrared videos. The proposed transfer learning-based video frame interpolation training strategy not only increases the frame rate of low-frame-rate infrared videos but also enhances the model’s ability to capture dynamic change characteristics of low-frame-rate infrared videos, improving their visual and analytical coherence and providing richer information for further data analysis and melt pool mechanism analysis.
At the same time, due to the limited amount of multi-source melt pool data and the lack of precise ground truth, traditional supervised learning methods face challenges. Many studies have therefore turned to using artificially designed loss functions to guide the model to fit the data. Although this method can to some extent increase the model’s focus on specific features, it is often difficult to extract the complete dynamic change characteristics of the melt pool from low-frame-rate source data. To overcome this limitation, this study adopted a self-supervised training strategy that automatically samples training data from unlabeled videos to fully explore and learn the motion characteristics in the original data. As shown in Figure 6, the video frame interpolation model extracts a sequence of frames labeled { A 1 , A 2 , A 4 , A 5 } from the original video data during training. These frames serve as inputs for the video frame interpolation model to generate intermediate frames, denoted as A 3 . The generated intermediate frames, A 3 , are compared with the actual intermediate frames, A 3 , using SSIM loss to quantify the quality of the frames produced by the model, and the model is iteratively optimized based on this to ensure that the generated frames are visually highly consistent with the original video data. This self-supervised frame interpolation process not only reduces the dependence on annotated data but also enhances the model’s ability to capture the high-dynamic motion characteristics of the melt pool by learning the intrinsic relationships between frame sequences. To verify whether the video frame interpolation model has successfully learned the motion characteristics of the melt pool, this study performs 2× interpolation on infrared videos with a frame rate reduced to 0.5× and compares the interpolated frames with the actual frames. The experimental results demonstrate that the model not only effectively fills the information gaps between frames but also exhibits a high degree of accuracy and reliability in capturing dynamic characteristics, as detailed in Section 4.1.
To enhance the image fusion model’s ability to capture and understand the high-dynamic motion characteristics of the melt pool, we propose a transfer learning-based image fusion model training strategy. Specifically, the image fusion model is first pre-trained on Dataset 3, which consists of heterogeneous image pairs from the source infrared and visible-light videos that correspond in time, to establish a basic understanding and capturing ability of the melt pool motion characteristics. Subsequently, using transfer learning methods, the pre-trained model is transferred to Dataset 4, which consists of heterogeneous image pairs from the interpolated-frame infrared and visible-light videos that correspond in time, for further training, thereby further enhancing its ability to capture and understand the high-dynamic characteristics of the melt pool. This training strategy allows the model to extract low-dynamic and high-dynamic features from two types of video sources and effectively combine these features to generate an integrated image representation.
The above training is based on the selected computer, which runs on a Unix system with a GTX 3090 GPU and 24 GB of video memory, implemented in Python 3.7 based on the PyTorch (version 1.8) open-source framework and configured with CUDA 10.2, cuDNN 7.6.5, and other related environments to support the use of the GPU.

4. Results and Discussion

4.1. Video Frame Interpolation Module Evaluation

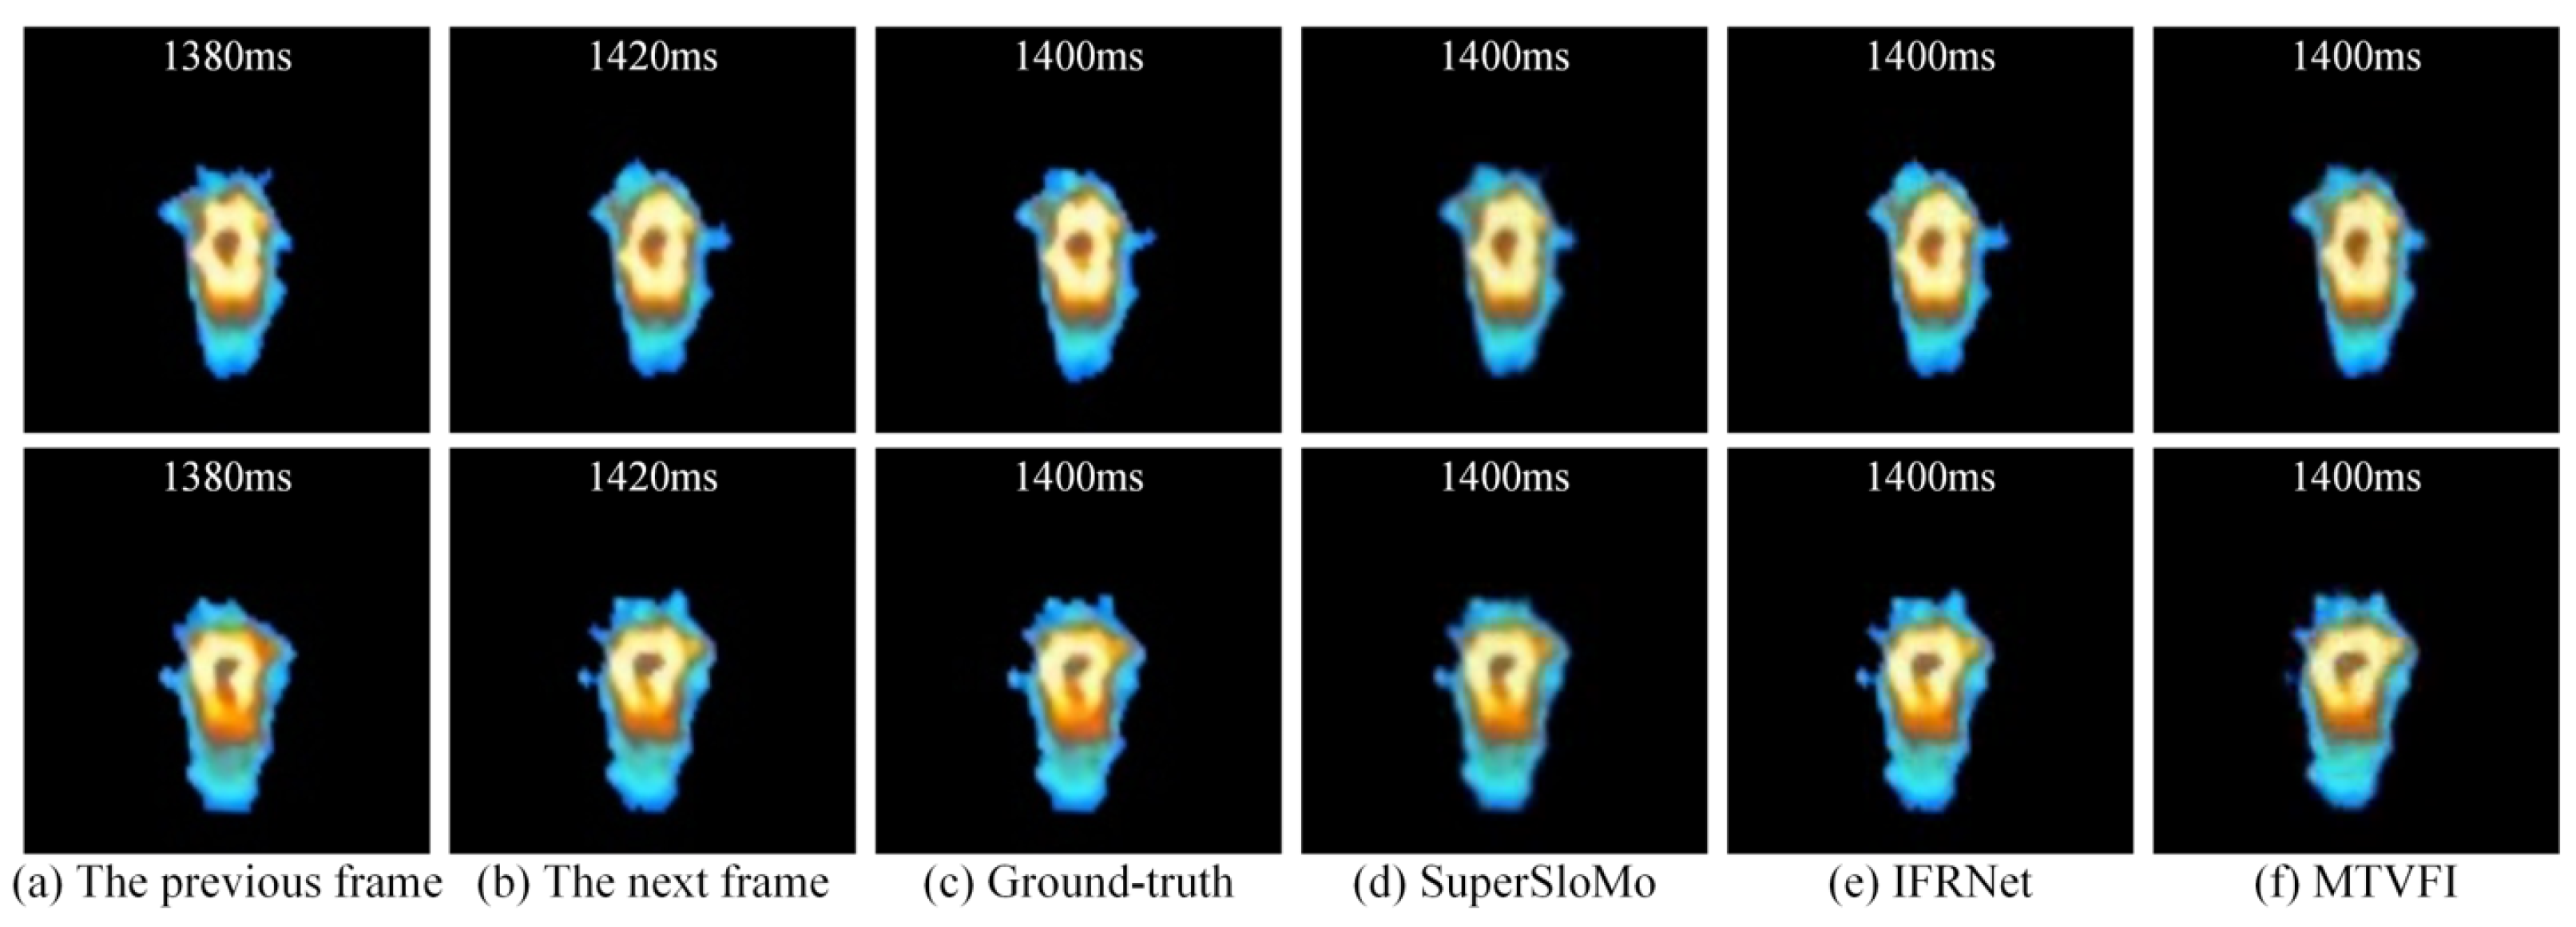
4.1.1. MTVFI Model Evaluation

Table 2 presents a performance comparison of our proposed MTVFI model and advanced video frame interpolation techniques, Super-SloMo and IFRNet, on the test set of Dataset 3. The performance evaluation was based on three key metrics: loss value, peak signal-to-noise ratio (PSNR), and structural similarity index (SSIM). The MTVFI model performed the best in the SSIM metric, indicating that its generated intermediate frames have a higher similarity to the ground truth and produce more accurate temperature distributions. In terms of the PSNR metric, the IFRNet model achieved the best results, while the MTVFI model demonstrated a suboptimal performance. This may be due to the MTVFI model’s insufficient attention to the external areas of the melt pool when deeply learning the motion characteristics of the melt pool, leading to biases in temperature estimation, affecting the PSNR performance. Nevertheless, the MTVFI demonstrated a unique advantage in capturing the dynamics of the melt pool, which is crucial for improving the accuracy of melt pool monitoring.

4.1.2. The Effectiveness of the Video Frame Interpolation Module

To verify the effectiveness of the video frame interpolation module in generating intermediate frames, this study downsampled the original 60 FPS infrared videos to 30 FPS, creating a video dataset (Dataset 4), as shown in Table 1. We compared and analyzed the consistency between the interpolated frames generated by the different models and the ground truth on the test set of Dataset 4 to evaluate the effectiveness of the models. In terms of qualitative validation, the consecutive image pairs (a–c) in Figure 7 demonstrate the actual frame interpolation effect, where (a) is the previous frame of the infrared source video, (b) is the next frame, (c) is the ground truth, and (d–f) display the intermediate frames generated by SuperSloMo, IFRNet, and the pre-trained MTVFI model, respectively.
The observation results indicate that the intermediate frames generated by the IFRNet model have an extremely high similarity to the next frame. This suggests that the model failed to accurately capture the motion characteristics of the melt pool. Although the SuperSloMo model can recognize certain motion characteristics of the melt pool, its generated intermediate frames exhibit blurriness in the edge areas of the melt pool, which indicates that the model has deficiencies in the precise recognition of melt pool motion and texture details. In contrast, the pre-trained MTVFI model has successfully learned the non-linear motion characteristics of the melt pool; the intermediate frames it generates are most similar to the ground truth in terms of texture details and temperature gradients, proving the effectiveness of the MTVFI model in the task of video frame interpolation for melt pool temperature distribution data.

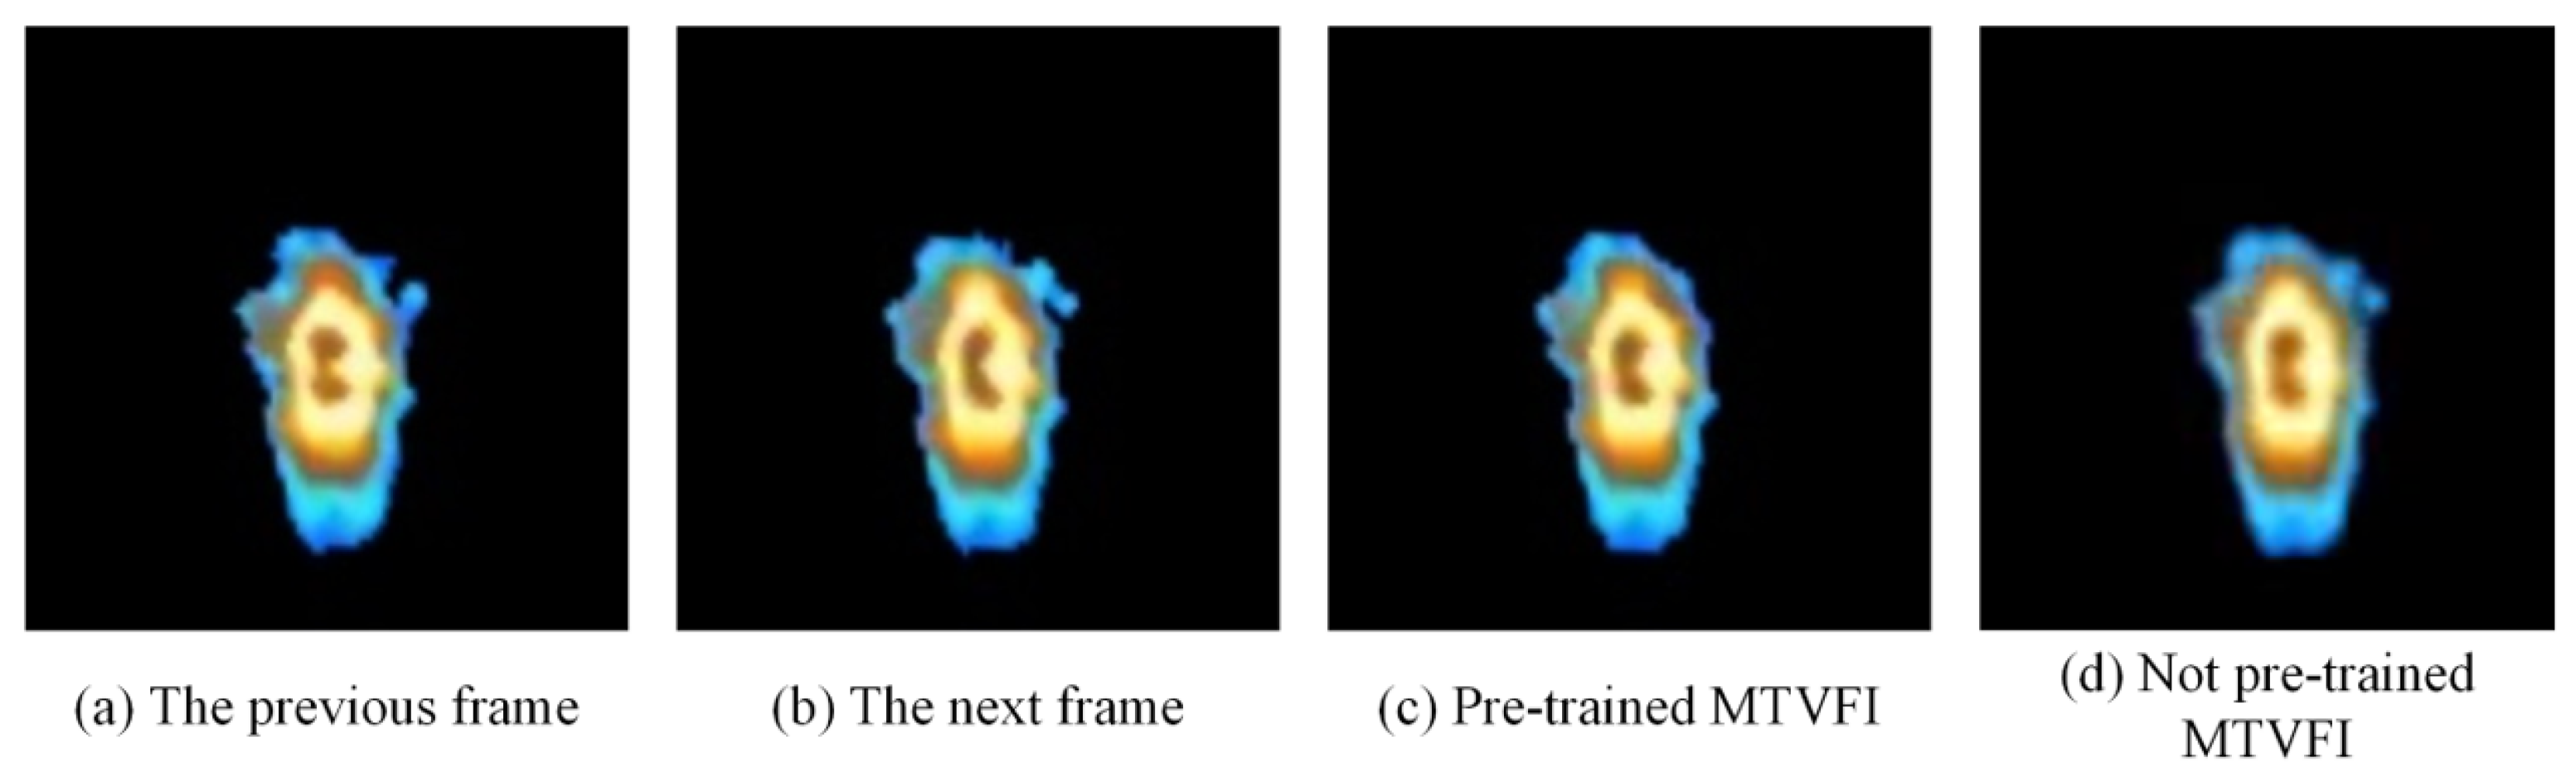
4.1.3. Analysis of Training Strategies Based on Pre-Training

Table 3 compares the results of the MTVFI model with pre-training on visible-light data and the MTVFI model without pre-training. The pre-trained MTVFI model performs best in terms of both PSNR and SSIM metrics, indicating that the interpolated frames it generates have a high degree of credibility. Figure 8 displays the interpolated frames generated from the comparative experiment based on the pre-training strategy: (a) is the previous frame of the infrared source video; (b) is the next frame; (c) is the interpolated frame generated by the pre-trained video frame interpolation module; (d) is the interpolated frame generated by the module without pre-training. Due to the limited amount of infrared data, the module without pre-training struggles to effectively learn the non-linear motion characteristics of the melt pool, leading to interpolated frames that only capture linear motion, resulting in blurred edges and structures more similar to the next frame. In contrast, the interpolated frames generated by the pre-training strategy can accurately learn the non-linear motion characteristics of the melt pool, producing frames with a higher degree of credibility. In Figure 8c, it can be observed that the uneven temperature at the top of the melt pool leads to abnormal motion of the melt pool, causing an increase in the temperature gradient at the center of the front end of the melt pool, while the temperature gradients on both sides decrease. The pre-trained MTVFI model can fully learn these non-linear motion characteristics of the melt pool, thereby generating interpolated frames with a higher degree of credibility.

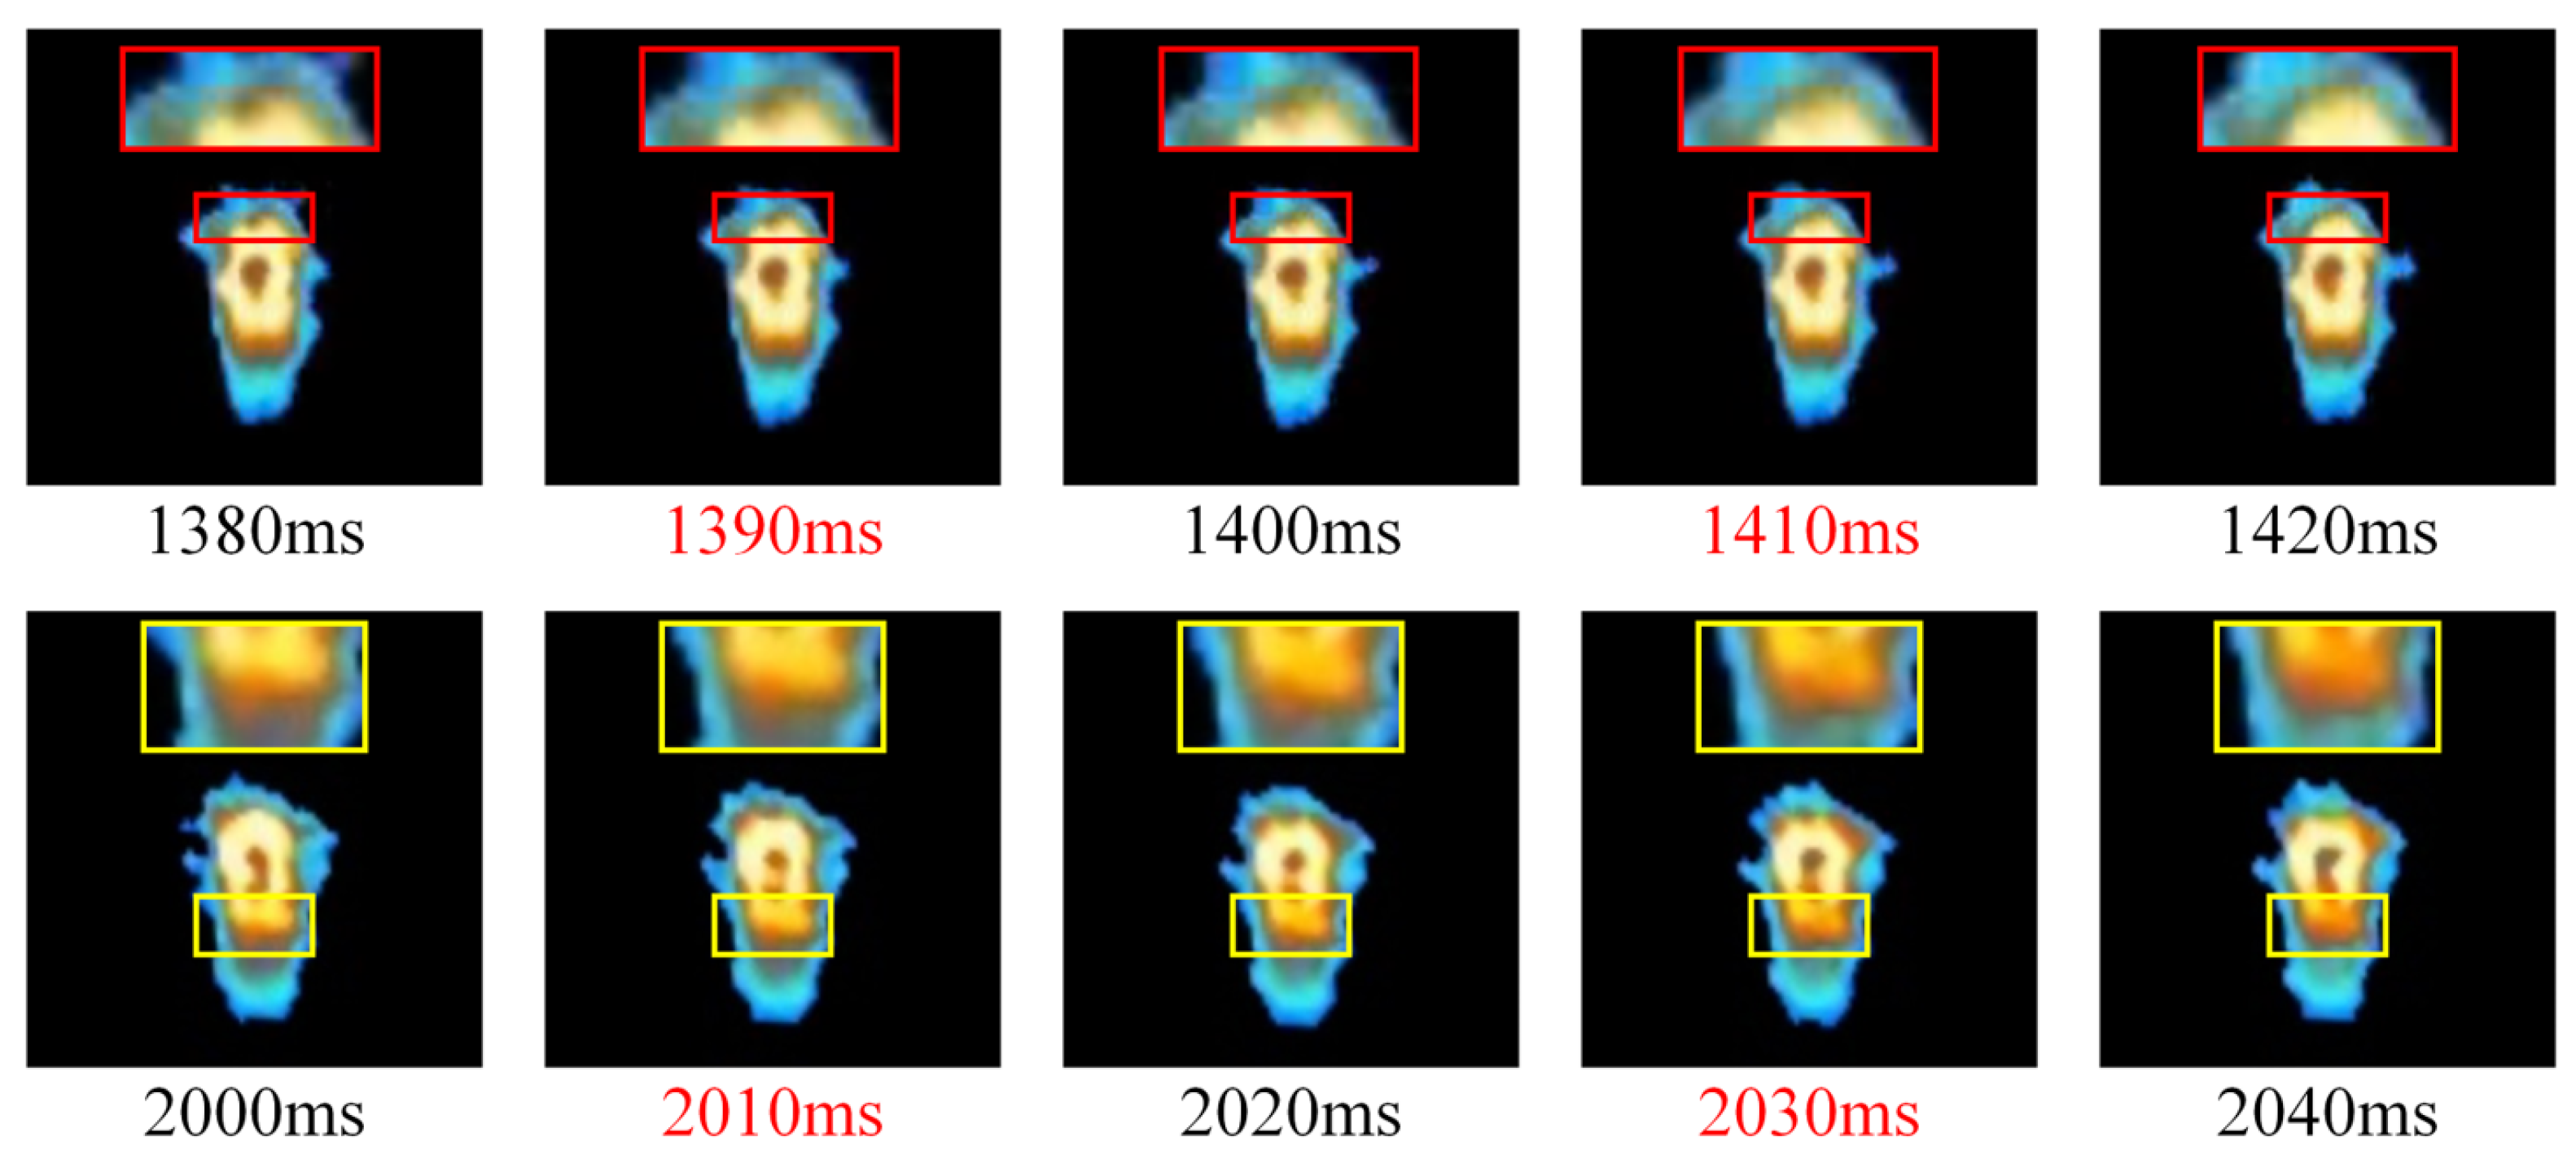
4.1.4. High-Dynamic Analysis of Melt Pool Temperature Distribution

To gain a deeper understanding of the dynamic behavior of the melt pool and to verify the effectiveness of the video frame interpolation module, we conducted a regional analysis of the melt pool motion in the interpolated infrared video. As shown in Figure 9, during the 1380–1420 ms time interval, melting occurred on both sides of the front end of the melt pool, while the central part did not fully melt. The pre-trained MTVFI model accurately captured the motion state of the melt pool, where the under-melted front end rapidly heated up and melted as the melt pool moved forward, and the melted parts on both sides converged under the influence of surface tension, causing the front sides to narrow.
A low-temperature area exists in the center of the melt pool, which is due to the violent convection and heat accumulation in the melt pool as the metal powder melts and merges into it, forming melt pool oscillations that cause the liquid metal to fragment and form high-temperature slags, thereby creating a low-temperature area in the center. The motion state of this low-temperature area is relatively random, posing a challenge for model learning; hence, there is a certain deviation between the center area in the generated intermediate frames and the actual observed values. The edge part of the melt pool’s central region has distinct motion characteristics and shows an overall stable trend of change, which the pre-trained MTVFI model has also learned.
During the solidification process in the tail area of the melt pool, the uneven temperature distribution of the melt pool leads to uneven solidification in this area. As shown in Figure 9, during the 2000–2040 ms period, the uneven temperature distribution at the tail of the melt pool is alleviated. This is due to the laser’s motion direction rotating by 90°, causing temperature accumulation on the right side of the melt pool and an increase in temperature on the right side. The MTVFI model learned this temperature variation trend and generated the correct temperature gradient. This indicates that the proposed video frame interpolation module can correctly learn the motion characteristics of the melt pool and can generate interpolated frames that include an accurate distribution of the melt pool’s temperature.
In summary, the proposed method effectively addresses the issue of frame-rate discrepancies in multi-source data and enhances the utilization of multi-source data for the melt pool. This provides robust data support for the monitoring of the high-dynamic thermal history of the melt pool.

4.2. Data Fusion Method Evaluation

4.2.1. Dynamic Analysis of Melt Pool

Figure 10 displays the dynamic behavior of the melt pool captured by the coaxial visible-light monitoring module, revealing the dynamic evolution of the melt pool formation process. At the initial stage of processing, metal powder is ejected and the machine arm accelerates. Once the arm’s speed reaches the scanning velocity, the laser begins to heat the metal powder and substrate, gradually forming the melt pool. Due to the substrate’s low initial temperature, rapid heat dissipation, and the poor stability of the melt pool, a large plume is produced. As the size of the melt pool increases and the substrate temperature rises, the plume gradually decreases, and by 180 ms, when the width of the melt pool stabilizes, the variation in the plume also becomes stable.

4.2.2. Performance of Image Fusion Module

This study validated the performance of the image fusion module by comparing it with advanced image fusion models. U2Fusion and EMFusion models were selected as controls. In cladding processing, the interaction between powder and substrate when heated and melted, the melt pool flow, and the rapid solidification can lead to unstable reactions, and different temperature distributions in the melt pool directly affect the shape and microstructure of the formed material. Therefore, comprehensive consideration was given to the temperature distribution and the morphology of the melt pool in the fused images. As shown in Figure 11, other models weakened the source image information. The U2Fusion model pays insufficient attention to temperature distribution, leading to inadequate retention of melt pool temperature characteristics and severe distortion of temperature gradient features. It also lacks attention to the morphology of the melt pool and surrounding information, resulting in a lack of texture details in the fused image. Although the EMFusion model retains the morphological features of the melt pool in visible-light images, it pays insufficient attention to temperature distribution information, leading to severe distortion and difficulty in accurately reflecting the temperature distribution. The image fusion module effectively retains the temperature distribution and morphological information of the melt pool, generating fused images rich in texture details and temperature values. At the same time, the data distortion caused by upsampling of infrared temperature distribution data is supplemented with a certain amount of information. In the low-temperature area at the center of the melt pool, where liquid metal fragments into high-temperature slag, the change in emissivity leads to inaccurate temperature detection. This phenomenon is mitigated in the fused images.
To present the results more intuitively, this study conducted a quantitative comparison of the three aforementioned models across five evaluation metrics, including PSNR [27], FMI [28], Qabf [29], MS-SSIM [30], Nabf [31], AG [27], SD [32], and SF [33]. The results, as shown in Table 4, indicate that the proposed image fusion module achieved the best results for all metrics except PSNR. The optimal AG metric indicates that the fused images produced by the image fusion module are richer in detail and have higher clarity. The best performance in SD and SF indicates that the fused images generated by the image fusion module are of the highest quality and the clearest. The best results in Qabf and FMI indicate that the image fusion module retains more structural information and features from the original images. The optimal results of the MS-SSIM metric indicate that the image fusion module pays higher attention to multi-scale feature extraction, which provides significant potential for its application in the field of multi-scale defect detection. Due to the image fusion module’s comprehensive integration of the global interactions of the source images, focusing more on important areas in infrared and visible-light images while ignoring less important areas, the resulting fused images have a lower PSNR compared to other models. The results indicate that our image fusion module performs optimally, generating fused images that enhance information extraction and fusion in the melt pool area while appropriately reducing information fusion in non-melt pool areas, thereby reducing the noise in the generated fused images.

4.2.3. Multi-Source Data Fusion for High-Dynamic Analysis

This study employed the proposed method for data fusion to obtain high-frame-rate fused images. Figure 12a demonstrates the evolution behavior of the melt pool based on the fused images, particularly the high-dynamic changes of the plume. Within 0–180 ms, during the formation of the melt pool, changes in the melt pool width lead to an unstable state of the plume. After 180 ms, the melt pool width stabilizes, and the plume also tends to stabilize, consistent with the analysis results in Section 4.2.1, indicating that plume stability is related to the melt pool width. Additionally, during the formation of the melt pool, the direction of the plume is related to the flicker of the melt pool temperature distribution, indicating that the stability of the melt pool temperature distribution directly affects the stability of the plume.
Figure 12b shows that in the initial stage of laser irradiation, the width, length, and area of the melt pool increase rapidly. After 500 ms, the growth rate slows down, and after 600 ms, the melt pool changes little, reaching a quasi-steady state. Continuous integration of metal powder causes fluctuations in the melt pool, leading to an asymmetric temperature distribution in the melt pool, with the length and area of the melt pool also fluctuating.
A low-temperature area formed by liquid splashes exists at the periphery of the melt pool temperature distribution. Figure 12c shows the temperature gradient formed by liquid droplet splashes around the melt pool. The fast splashing of droplets creates a trail, forming a prominent temperature area around the melt pool in the fused image.
Figure 12d shows that when melt metal enters the melt pool, it is affected by surface tension and Marangoni forces, moving towards the center of the melt pool and causing fluctuations in the melt pool after integration.
Due to the different emissivities of liquid metal, liquid–solid mixed metal, and solid metal, using a single emissivity to monitor the melt pool results in abnormal temperature distributions, leading to inaccurate monitoring of the melt pool morphology. Figure 13 demonstrates the results of melt pool contour extraction from infrared and fused images, using visible-light images as a reference for the true contour. It can be observed that temperature anomalies caused by droplet splashing and emissivity errors are quite evident, while the proposed method can effectively balance these temperature anomaly areas. This effect is attributed to the image fusion module’s ability to learn and highlight the splash features and melt pool morphology in visible-light images and accurately learn the temperature distribution and gradients of the melt pool. It retains the temperature gradients of the normal areas while emphasizing the morphology of the melt pool in temperature anomaly areas and reducing the intensity of the temperature distribution, thereby balancing the temperature anomalies. The results indicate that the proposed method can provide strong support for melt pool status monitoring and defect monitoring.
In summary, the proposed data fusion method effectively mitigates the abnormal melt pool temperatures caused by droplet splashing and emissivity errors. The fused data generated by this method incorporate accurate temperature distribution and high-dynamic motion characteristics of the melt pool, which facilitate precise analysis of the melt pool’s thermal history and enable the monitoring and localization of melt pool defects resulting from changes in temperature distribution. Additionally, the extraction results of the melt pool contour demonstrate the superiority of the proposed method over single-data-source approaches in melt pool condition monitoring, thereby providing robust data support for enhancing the accuracy of melt pool condition monitoring.

5. Conclusions

In this study, we proposed a multi-source data fusion method for metal additive manufacturing technology. Based on the understanding of the mechanism of metal melt pools, taking laser cladding as an example, we designed a multi-source data fusion method for melt pools. We constructed an experimental platform for laser cladding, monitoring the melt pool morphology with a high-speed camera in coaxial alignment and the temperature distribution with a thermal camera in an off-axis alignment, thereby acquiring multi-source data of the laser cladding melt pool. Preprocessing of multi-source data was conducted, including data cleansing, image registration, ROI extraction, and data augmentation, to construct multiple datasets for various models.
We designed a 3D convolution-based MTVFI model for frame interpolation of melt pool infrared videos to balance the frame-rate discrepancies among multi-source data and proposed a pre-training strategy based on high-frame-rate visible-light data. Experimental results indicate that the MTVFI model under this strategy can effectively extract high-dynamic motion features from high-frame-rate visible-light videos and generate interpolated frames with high credibility and rich information.
Additionally, we designed an image fusion module based on the SwinFusion image fusion model. Experimental results show that the generated fused images have low noise and rich structural information and features from the source images.
Dynamic analysis of the melt pool through the proposed multi-source data fusion method shows that, compared to dynamic analysis with single data, the proposed method has higher accuracy and can correct data errors caused by single-emissivity monitoring. Experimental results of melt pool contour monitoring show that this method can improve the accuracy of melt pool contour monitoring.
In summary, the multi-source data fusion method for additive manufacturing melt pools based on video frame interpolation can effectively utilize the differential information from multi-source data to generate melt pool fusion data that are high in information content and low in error, demonstrating advantages in melt pool morphology monitoring, with potential application value for melt pool defect detection and process optimization, contributing to improved process stability and part quality in metal additive manufacturing.

Author Contributions

Conceptualization, H.R. and Y.L.; Data curation, H.R.; Formal analysis, H.L.; Funding acquisition, Y.L.; Investigation, Y.L.; Methodology, H.R. and Y.L.; Project administration, Y.L.; Resources, Y.Z. and Y.L.; Software, H.R., Y.Z. and H.L.; Supervision, Y.Z. and H.L.; Validation, H.R., Y.Z. and H.L.; Visualization, H.R.; Writing—original draft, H.R.; Writing—review and editing, H.R., Y.Z., H.L. and Y.L. All authors have read and agreed to the published version of the manuscript.

Funding

The work was funded by the National Key R&D Program of China (Grant No. 2022YFB4601601), the Key R&D Program of Guangxi Province (Grant No. GKAB23026101), and the Guangxi Natural Science Foundation (Grant No. 2023GXNSFBA026287). The APC was paid by the authors.

Institutional Review Board Statement

Not applicable.

Informed Consent Statement

Not applicable.

Data Availability Statement

The dataset is not available due to institutional data sharing restrictions. The data presented in this study are available on request from the corresponding author.

Acknowledgments

The authors gratefully acknowledge the financial support from the National Key R&D Program of China (Grant No. 2022YFB4601601), the Key R&D Program of Guangxi Province (Grant No. GKAB23026101), and the Guangxi Natural Science Foundation (Grant No. 2023GXNSFBA026287). The APC was paid by the authors. Their contributions have been instrumental in the successful completion of this research.

Conflicts of Interest

The authors declare that they have no known competing financial interests or personal relationships that could have appeared to influence the work reported in this paper.

References

  1. Wang, J.C.; Zhu, R.; Liu, Y.J.; Zhang, L.C. Understanding melt pool characteristics in laser powder bed fusion: An overview of single- and multi-track melt pools for process optimization. Adv. Powder Mater. 2023, 2, 100137. [Google Scholar] [CrossRef]
  2. Yu, M.; Zhu, L.; Yang, Z.; Xu, L.; Ning, J.; Chang, B. A novel data-driven framework for enhancing the consistency of deposition contours and mechanical properties in metal additive manufacturing. Comput. Ind. 2024, 163, 104154. [Google Scholar] [CrossRef]
  3. Guo, S.R.; Liu, Y.Y.; Cui, L.J.; Cui, Y.H.; Li, X.L.; Chen, Y.Q.; Zheng, B. In-situ capture of melt pool signature in high-speed laser cladding using fully convolutional network. Opt. Lasers Eng. 2024, 176, 108113. [Google Scholar] [CrossRef]
  4. Tang, Z.J.; Liu, W.W.; Zhang, N.; Wang, Y.W.; Zhang, H.C. Real-time prediction of penetration depths of laser surface melting based on coaxial visual monitoring. Opt. Lasers Eng. 2020, 128, 106034. [Google Scholar] [CrossRef]
  5. Peng, X.; Kong, L.B. Defect extraction method for additive manufactured parts with improved learning-based image super-resolution and the Canny algorithm. Appl. Opt. 2022, 61, 8500–8507. [Google Scholar] [CrossRef] [PubMed]
  6. Grishin, M.Y.; Sdvizhenskii, P.A.; Asyutin, R.D.; Tretyakov, R.S.; Stavertiy, A.Y.; Pershin, S.M.; Liu, D.S.; Ledne, V.N. Combining thermal imaging and spectral pyrometry for express temperature mapping in additive manufacturing. Appl. Opt. 2023, 62, 335–341. [Google Scholar] [CrossRef]
  7. Chen, L.; Bi, G.; Yao, X.; Tan, C.; Su, J.; Ng, N.P.H.; Chew, Y.; Liu, K.; Moon, S.K. Multisensor fusion-based digital twin for localized quality prediction in robotic laser-directed energy deposition. Robot. Comput.-Integr. Manuf. 2023, 84, 102581. [Google Scholar] [CrossRef]
  8. Gaikwad, A.; Williams, R.J.; de Winton, H.; Bevans, B.D.; Smoqi, Z.; Rao, P.; Hooper, P.A. Multi phenomena melt pool sensor data fusion for enhanced process monitoring of laser powder bed fusion additive manufacturing. Mater. Des. 2022, 221, 110919. [Google Scholar] [CrossRef]
  9. Meriaudeau, F.; Truchetet, F. Control and optimization of the laser cladding process using matrix cameras and image processing. J. Laser Appl. 1996, 8, 317–324. [Google Scholar] [CrossRef]
  10. Tang, L.; Feng, L.; Axelsson, T.; Toerngren, M.; Wilkman, D. A deep learning based sensor fusion method to diagnose tightening errors. J. Manuf. Syst. 2023, 71, 59–69. [Google Scholar] [CrossRef]
  11. Guo, Z.; Zhang, Y.; Xiao, H.; Jayan, H.; Majeed, U.; Ashiagbor, K.; Jiang, S.; Zou, X. Multi-sensor fusion and deep learning for batch monitoring and real-time warning of apple spoilage. Food Control 2025, 172, 111174. [Google Scholar] [CrossRef]
  12. Shin, S.; Kwon, M.; Kim, S.; So, H. Prediction of Equivalence Ratio in Combustion Flame Using Chemiluminescence Emission and Deep Neural Network. Int. J. Energy Res. 2023, 2023, 3889951. [Google Scholar] [CrossRef]
  13. Thottempudi, P.; Jambek, A.B.B.; Kumar, V.; Acharya, B.; Moreira, F. Resilient object detection for autonomous vehicles: Integrating deep learning and sensor fusion in adverse conditions. Eng. Appl. Artif. Intell. 2025, 151, 110563. [Google Scholar] [CrossRef]
  14. Yu, R.; Tan, X.; He, S.; Huang, Y.; Wang, L.; Peng, Y.; Wang, K. Monitoring of robot trajectory deviation based on multimodal fusion perception in WAAM process. Measurement 2024, 224, 113933. [Google Scholar] [CrossRef]
  15. Zheng, L.; Zhang, Q.; Cao, H.; Wu, W.; Ma, H.; Ding, X.; Yang, J.; Duan, X.; Fan, S. Melt pool boundary extraction and its width prediction from infrared images in selective laser melting. Mater. Des. 2019, 183, 108110. [Google Scholar] [CrossRef]
  16. Dong, J.; Ota, K.; Dong, M.X. Video Frame Interpolation: A Comprehensive Survey. ACM Trans. Multimed. Comput. Commun. Appl. 2023, 19, 1–31. [Google Scholar] [CrossRef]
  17. Dosovitskiy, A.; Fischer, P.; Ilg, E.; Häusser, P.; Hazirbas, C.; Golkov, V.; van der Smagt, P.; Cremers, D.; Brox, T. FlowNet: Learning Optical Flow with Convolutional Networks. In Proceedings of the IEEE International Conference on Computer Vision, Santiago, Chile, 11–18 December 2015; pp. 2758–2766. [Google Scholar]
  18. Kalluri, T.; Pathak, D.; Chandraker, M.; Du, T. FLAVR: Flow-Agnostic Video Representations for Fast Frame Interpolation. In Proceedings of the 23rd IEEE/CVF Winter Conference on Applications of Computer Vision (WACV), Waikoloa, HI, USA, 3–7 January 2023; pp. 2070–2081. [Google Scholar]
  19. Choi, M.; Kim, H.; Han, B.; Xu, N.; Lee, K.M. Channel Attention Is All You Need for Video Frame Interpolation. In Proceedings of the 34th AAAI Conference on Artificial Intelligence/32nd Innovative Applications of Artificial Intelligence Conference/10th AAAI Symposium on Educational Advances in Artificial Intelligence, New York, NY, USA, 7–12 February 2020; pp. 10663–10671. [Google Scholar]
  20. Zhu, X.; Hu, H.; Lin, S.; Dai, J.; Soc, I.C. Deformable ConvNets v2: More Deformable, Better Results. In Proceedings of the IEEE/CVF Conference on Computer Vision and Pattern Recognition (CVPR), Long Beach, CA, USA, 16–20 June 2019; pp. 9300–9308. [Google Scholar]
  21. Tran, D.; Wang, H.; Torresani, L.; Ray, J.; LeCun, Y.; Paluri, M. A Closer Look at Spatiotemporal Convolutions for Action Recognition. arXiv 2018, arXiv:1711.11248. [Google Scholar]
  22. Han, D.; Li, L.; Guo, X.; Ma, J. Multi-exposure image fusion via deep perceptual enhancement. Inf. Fusion 2022, 79, 248–262. [Google Scholar] [CrossRef]
  23. Li, H.; Wu, X.-J.; Durrani, T. NestFuse: An Infrared and Visible Image Fusion Architecture Based on Nest Connection and Spatial/Channel Attention Models. IEEE Trans. Instrum. Meas. 2020, 69, 9645–9656. [Google Scholar] [CrossRef]
  24. Ma, J.; Xu, H.; Jiang, J.; Mei, X.; Zhang, X.-P. DDcGAN: A Dual-Discriminator Conditional Generative Adversarial Network for Multi-Resolution Image Fusion. IEEE Trans. Image Process. 2020, 29, 4980–4995. [Google Scholar] [CrossRef]
  25. Ma, J.; Tang, L.; Fan, F.; Huang, J.; Mei, X.; Ma, Y. SwinFusion: Cross-Domain Long-Range Learning for General Image Fusion via Swin Transformer. IEEE/CAA J. Autom. Sin. 2022, 9, 1200–1217. [Google Scholar] [CrossRef]
  26. Liu, Z.; Lin, Y.; Cao, Y.; Hu, H.; Wei, Y.; Zhang, Z.; Lin, S.; Guo, B. Swin Transformer: Hierarchical Vision Transformer using Shifted Windows. In Proceedings of the 18th IEEE/CVF International Conference on Computer Vision (ICCV), Electr Network, Montreal, QC, Canada, 11–17 October 2021; pp. 9992–10002. [Google Scholar]
  27. Ma, J.; Ma, Y.; Li, C. Infrared and visible image fusion methods and applications: A survey. Inf. Fusion 2019, 45, 153–178. [Google Scholar] [CrossRef]
  28. Haghighat, M.B.A.; Aghagolzadeh, A.; Seyedarabi, H. A non-reference image fusion metric based on mutual information of image features. Comput. Electr. Eng. 2011, 37, 744–756. [Google Scholar] [CrossRef]
  29. Xydeas, C.S.; Petrovic, V. Objective image fusion performance measure. Electron. Lett. 2000, 36, 308–309. [Google Scholar] [CrossRef]
  30. Wang, Z.; Simoncelli, E.P.; Bovik, A.C. Multi-scale structural similarity for image quality assessment. In Proceedings of the 37th Asilomar Conference on Signals, Systems and Computers, Pacific Grove, CA, USA, 9–12 November 2003; pp. 1398–1402. [Google Scholar]
  31. Petrovic, V.; Xydeas, C. Objective image fusion performance characterisation. In Proceedings of the 10th IEEE International Conference on Computer Vision (ICCV 2005), Beijing, China, 17–20 October 2005; pp. 1866–1871. [Google Scholar]
  32. Ma, J.; Liang, P.; Yu, W.; Chen, C.; Guo, X.; Wu, J.; Jiang, J. Infrared and visible image fusion via detail preserving adversarial learning. Inf. Fusion 2020, 54, 85–98. [Google Scholar] [CrossRef]
  33. Zheng, Y.; Essock, E.A.; Hansen, B.C.; Haun, A.M. A new metric based on extended spatial frequency and its application to DWT based fusion algorithms. Inf. Fusion 2007, 8, 177–192. [Google Scholar] [CrossRef]
Figure 1. Schematic diagram of the laser cladding experimental platform and experimental design.
Applsci 15 04850 g001
Figure 2. Data processing flow of infrared temperature distribution images and visible-light images.
Applsci 15 04850 g002
Figure 3. MTVFI framework for video frame interpolation.
Applsci 15 04850 g003
Figure 4. Image fusion network model.
Applsci 15 04850 g004
Figure 5. Schematic diagram of the shifted-window mechanism in Swin Transformer layers.
Applsci 15 04850 g005
Figure 6. The training process of the MTVFI model.
Applsci 15 04850 g006
Figure 7. Qualitative comparison of the MTVFI model with two other advanced video frame interpolation methods: (a) the previous frame of the infrared source video; (b) the next frame of the infrared source video; (c) the ground truth of the intermediate frame; (d) the intermediate frame generated by the SuperSloMo model; (e) the intermediate frame generated by the IFRNet model; (f) the intermediate frame generated by the pre-trained MTVFI model.
Applsci 15 04850 g007
Figure 8. Qualitative comparison of training strategies based on pre-training: (a) the previous frame of the infrared source video; (b) the next frame of the infrared source video; (c) the interpolated frame generated by the pre-trained MTVFI model; (d) the interpolated frame generated by the MTVFI model without pre-training.
Applsci 15 04850 g008
Figure 9. High-dynamic analysis of melt pool temperature distribution.
Applsci 15 04850 g009
Figure 10. Dynamic behavior of the melt pool captured by a co-axial high-speed camera.
Applsci 15 04850 g010
Figure 11. Qualitative comparison of different image fusion algorithms in the multi-source cladding dataset designed in this study: (a) the visible-light image (VIS image) of the melt pool; (b) the infrared image (IR image) of the melt pool; (c) the fused image generated by the U2Fusion model; (d) the fused image generated by the EMFusion model; (e) the fused image generated by the image fusion module.
Applsci 15 04850 g011
Figure 12. Dynamic analysis of multi-source data fusion: (a) high-dynamic changes in the melt pool plume based on the fused image; (b) analysis of melt pool fluctuations during the quasi-steady-state process of the melt pool from 500 ms to 600 ms; (c) droplet splashing caused by melt pool movement, with red arrows indicating the direction of splashing motion; (d) changes in the motion state of the melt pool during the process of melt metal entering the melt pool. The red circle indicates the splashing droplets, and the red arrow shows the direction of the droplets’ movement.
Applsci 15 04850 g012
Figure 13. Contour extraction results of the melt pool from infrared and fused images: (a) infrared image; (b) fused image generated using the proposed data fusion method; (c) visible-light image; (d) contours of the melt pool extracted from the infrared and fused images, as well as the real contour manually extracted from the visible-light image.
Applsci 15 04850 g013
Table 1. Dataset details.
DatasetsTypesMelt Pool Temperature DistributionVisible-Light Melt Pool Morphology
Dataset 1Training Set22202220
Validation Set278278
Test Set278278
Dataset 2Training Set44404440
Validation Set556556
Test Set556556
Dataset 3Training Set22204440
Validation Set278556
Test Set278556
Dataset 4Training Set1110/
Validation Set139/
Test Set139/
Table 2. Results of the video frame interpolation module for MTVFI and other models on Dataset 3.
ModelPSNRSSIM
Super-SloMo36.9170.982
IFRNet39.1140.991
MTVFI (our model)38.9080.992
Table 3. Quantitative comparison of training strategies based on pre-training.
ModelPSNRSSIM
PreTrain-MTVFI38.9080.992
MTVFI32.4900.966
Table 4. Quantitative results of the three fusion models. Bold indicates the best results.
ModelPSNRFMIQabfMS-SSIMNabfAGSDSF
U2Fusion73.080.9500.3420.9630.0650.65117.855.150
EMFusion73.920.9480.4350.9520.1230.65917.874.997
SwinFusion71.680.9510.6390.9830.0350.90223.766.460
Disclaimer/Publisher’s Note: The statements, opinions and data contained in all publications are solely those of the individual author(s) and contributor(s) and not of MDPI and/or the editor(s). MDPI and/or the editor(s) disclaim responsibility for any injury to people or property resulting from any ideas, methods, instructions or products referred to in the content.

