Abstract
Traditionally, departments of transportation (DOTs) have dispatched probe vehicles with dedicated vehicles and drivers for monitoring traffic conditions. Emerging assisted GPS (AGPS) and accelerometer-equipped smartphones offer new sources of raw data that arise from voluntarily-traveling smartphone users provided that their modes of transportation can correctly be identified. By introducing additional raster map layers that indicate the availability of each mode, it is possible to enhance the accuracy of mode detection results. Even in its simplest form, an artificial neural network (ANN) excels at pattern recognition with a relatively short processing timeframe once it is properly trained, which is suitable for real-time mode identification purposes. Dubai is one of the major cities in the Middle East and offers unique environments, such as a high density of extremely high-rise buildings that may introduce multi-path errors with GPS signals. This paper develops real-time mode identification ANNs enhanced with proposed mode availability geographic information system (GIS) layers, firstly for a universal mode detection and, secondly for an auto mode detection for the particular intelligent transportation system (ITS) application of traffic monitoring, and compares the results with existing approaches. It is found that ANN-based real-time mode identification, enhanced by mode availability GIS layers, significantly outperforms the existing methods.
1. Introduction and Related Works
Assessments of level of service (LOS) measures for various modes of transportation are crucial in monitoring and managing the performance of a transportation system network that consists of multiple available modes of transportation via inter-modal connection points. Traditionally, departments of transportation (DOTs) have used either fixed-point sensors or probe vehicles for traffic monitoring purposes. Fixed-point sensors include loop detectors and video cameras. Loop detectors embedded under the road surfaces sense fluctuations in electric currents as vehicles pass over it and estimate their speeds based on the time it took for vehicles to travel the distance between their two axles. Video cameras are either monitored by dedicated personnel at DOTs or enhanced with motion detection algorithms in efforts to estimate their speeds on screen that are often challenged by weather conditions affecting the accuracy, such as rainfall, making the road surface darker, or snowfall, making the road too bright. Fixed-point sensors are expensive, at first, with high capital costs associated with their installations, yet provide near-permanent raw data at economically feasible costs continuously afterwards. However, they are only capable of monitoring traffic conditions at those fixed points instead of throughout the route which can often result in misleading local traffic condition estimations. In order to overcome the issue, DOTs have regularly dispatched dedicated probe vehicles [1] with dedicated drivers and data logging personnel who are later replaced by conventional GPS data loggers in efforts to reduce labor costs. The collected data have been typically post-processed to estimate the traffic conditions throughout the route after the probes have run. This after-the-fact approach provides insights on near future traffic conditions for planning purposes which is not suitable for real-time traffic monitoring.
With an emergence and rapid market penetration rates of smartphones, there are new opportunities for collecting traffic data as smartphone users voluntarily travel throughout all sectors of transportation networks in all modes of transportation. The majority of smartphones are typically equipped with multiple sensors including assisted GPS (AGPS) chips, accelerometers, and magnetometers connected on an economically feasible data plan that continues to lower in costs. AGPS is an enhanced version of traditional GPS sensors that is typically assisted by cellular tower signals that improve the startup performance. If the mode of transportation a smartphone user is in can reliably be identified, technically speaking, the users can be considered as traffic probes themselves that are hovering over an entire transportation network and can provide enormous amounts of raw data that greatly benefit traffic monitoring and management applications in the field of intelligent transportation system (ITS).
Privacy issues associated with such an approach in data collection is beyond the scope of this paper. However, the users may still give consent to reliable smartphone apps to collect such data with expectations of valuable real-time traffic information or tax-related benefits from the government in return, for example. In fact, many users of Internet service providers, such as GoogleTM, and various other social network services (SNS) have given such consents to them in exchange of different forms of benefit.
Among all modes of transportation, an “auto” mode is especially useful for traffic monitoring purposes as it refers to standard private vehicles that have movement patterns that account for the majority of vehicles on the roads. The auto mode users are also the major audiences of real-time traffic information. A transit bus, for example, would not be a good candidate to be categorized as an auto mode. A transit bus on an uncongested road would still frequently stop and typically operates at a lower maximum speed than private vehicles. The traffic conditions the bus experiences are not generally considered as proper representations of current traffic conditions.
An artificial neural network (ANN) simulates a human brain that consists of neurons and excels at pattern recognition rather than analytically processing and formulating for a given phenomenon. Conventional GPS receivers are only capable of directly measuring location information from which acceleration data can only be post-estimated. Recent smartphone models have accelerometers that directly measure the acceleration or deceleration values. In addition, smartphones are also equipped with magnetometers that can measure the strength of electromagnetic fields in the vicinity. A well-trained ANN could determine the mode of transportation a user is in by observing the user’s GPS, accelerometer, and magnetometer related information such as speed, location, quality of GPS data, acceleration, and electromagnetic field measurements. As an analogy, a man with his eyes and ears covered may still be able to “feel” and determine whether he is in a typical car (auto mode) or a bus by sensing the physical characteristics around him, such as acceleration and deceleration patterns.
A geographic information system (GIS) is a platform on which traffic conditions can be spatially managed and is an important urban analysis tool in geoinformatics. Applying GIS-based spatial analyses on traffic-related data can enhance mode detection accuracies by considering available modes near the location where a mode estimation is made.
Dubai is a city with unique environmental factors that can affect mode detection accuracies. Due to the high density of high-rise buildings typically with a ratio of a building height to a street-canyon-width of above 100 to 1, GPS signals are prone to multi-path errors. The extremely hot outdoor temperature has introduced indoor walk modes at pathways connecting their metro and major destinations including the Dubai Mall, known as a Metro Link Bridge (https://thedubaimall.com/en/plan-your-visit/getting-here). It is interesting to see how the unique geographic factors play their roles as far as the ANN-based mode detection rates are concerned. For example, the high-rise buildings may tend to introduce noise in the GPS signals making location determination and associated speed information less accurate. The indoor pathways for pedestrians may block the direct line of sight to GPS satellites, which may also deteriorate the strength of the signal.
1.1. Artificial Intelligence in Civil Engineering
The field of civil engineering is considered as one of the oldest engineering disciplines which can also be seen as one of the most matured fields of engineering. With the advancements in computer technology accompanied by emerging artificial intelligence algorithms, there have been various attempts to utilize the artificial intelligence in various sectors in civil engineering. French et al. [2] have applied neural networks for forecasting rainfalls in the field of hydrology. Goh and Jeng et al. [3,4] have assessed seismic liquefaction potentials with neural networks in the field of geotechnical engineering. Tsai and Lee [5] and Mizumura [6] have used back-propagation neural networks and Kalman filtering for tidal-level and ocean data forecasting in the field of ocean engineering. Bassuoni and Nehdi [7] have developed a neuro-fuzzy based prediction model for the durability of self-consolidating concretes. Prasad et al. [8] have used ANNs for predicting compressive strength of various structural materials in the field of structural engineering. In the field of transportation engineering, traffic related forcasts often deal with classification problems and ITS applications, including traffic monitoring problem, can greatly benefit from using the ANNs.
1.2. Traffic Monitoring
Traffic monitoring requires remotely sensing the traffic conditions on desired locations on the roads. Smith et al. [9], in their pioneering work with wireless location technology (WLT)-based traffic monitoring, conducted multiple operational tests and concluded that there are many advantages, including the fact that the WLT offers a new platform for collecting traffic data spatially. The authors point out that there are associated sampling challenges that need to be addressed with concerted efforts in the future. Byon et al. [10] developed a GPS and GIS-integrated traffic monitoring system, named GISTT, whose main aim is to replace traditional traffic probes with dedicated data logging personnel with GPS data loggers. The study assumes that the GPS data loggers are always in the auto mode. Uno et al. [11] used GPS data for WLT-based transit performance monitoring services. Cathey and Dailey [12] attempted to utilize public transit vehicles that voluntarily travel on their routes regularly, for monitoring the general traffic by correlating the behaviors of transit buses to the general traffic. Due to the intrinsic nature of the bus mode that frequently stops even on uncongested roads for serving bus stops, the proposed method, at its best, is an indirect estimation of the actual general traffic conditions. Bar-Gera [13] implemented a WLT-based traffic monitoring system by solely using the triangulation of cell phone towers without the use of GPS signals on major highways. This approach results in relatively lower accuracies (100–300 m) and needs sufficiently large sample sizes in order to overcome the accuracy issues. In addition, the accuracy also depends on the density of cell tower distributions, which happen to be sufficiently high only near major roads which limits the method’s expandability into arterial roads. A GPS-based WLT can provide more accurate location information especially when AGPS chips are assisted with cell phone signals. (Zahradnik, F., Assisted GPS, A-GPS, AGPS, https://www.lifewire.com/assisted-gps-1683306) Zhong et al. [14] estimated passenger traffic flows of a transportation hub using mobile phone data using AGPS-enabled phones.
1.3. Transportation Mode Detection
Transportation mode detection is crucial for categorizing raw data collected from WLT-based methods into desired modes for specific ITS applications. Tsui and Shalaby [15] developed a fuzzy logic-based mode identification methodology for raw data collected from personal travel-survey GPS data loggers. The conventional GPS data loggers were carried by study participants for multiple days as they traveled in various modes of transportation. Then the collected data were post-processed in an attempt to estimate their travelled modes retroactively. This after-the-fact approach is suitable for transportation planning purposes rather than real-time applications, including traffic monitoring. Zong et al. [16] also used a similar GPS dataset for identifying travel modes for transportation planning purposes. Chen and Bierlaire [17] proposed a probabilistic method that predicted trip paths taken and their associated modes by using raw data from smartphone sensors including GPS and Bluetooth sensors. The method adopts a post-processing of data and is useful for ITS applications with longer time horizons. Gonzalez et al. [18] and Byon et al. [19] developed real-time mode identification methods with a conventional GPS receiver with ANNs. Their methods used both directly-measured and indirectly-processed data. Directly-measured GPS data are location and speed values, while the indirectly-processed data are acceleration values that are estimated by observing differential speed values with known sampling intervals. The studies find that an ANN-based mode detection approach is effective with reasonable accuracies. Byon et al. [20] enhanced the ANN-based mode detection by utilizing directly-measured acceleration values from smartphones and found that accelerometer values from smartphones did improve the mode detection performances. Recently, there are more specialized applications of mode detection. Maghrebi et al. [21] attempted to estimate travel modes from social media in hopes to utilize social network services as additional input data for mode detection. Cardoso et al. [22] focused on detecting the transportation mode for elderly care while Lan et al. [23] used kinetic energy-harvesting wearables for detecting the mode of transportation.
1.4. Statistical Considerations
For real-time traffic monitoring to be considered reliable, there needs to be a certain guideline for required sample sizes. Li et al. [24] investigated the sample size requirement for GPS-based traffic monitoring and asserted that existing methods either overestimate [25] or underestimate the required sample sizes. The authors found that, for reliably estimating travel times, delay and work-zone conditions require minimum sample sizes of 50, 20, 10, and eight for road sections with lengths of 0.5, 1.5, 2.5, and 3.3 km, respectively. The findings imply that, from the perspectives of GPS-based real-time traffic monitoring, there needs to be at least those minimum number of GPS receivers simultaneously on a particular section of the road. It could also be interpreted that the traffic monitoring procedure should wait until the minimum sufficient number of samples are collected prior to attempting to estimate the current traffic conditions when there are not enough simultaneous GPS probes. Assemi et al. [26] developed and validated a statistical model for travel mode identifications using smartphones.
2. Study Objective
The objective of this study is to develop an ANN-based real-time mode detection methodology that utilizes spatial analysis techniques and improves mode detection accuracies that would support various ITS applications in transportation geoinformatics. This paper assesses the feasibility of using proposed mode availability GIS layers for enhancing performances of transportation mode detection ANNs with data from smartphone sensors in Dubai. The GIS layers contain spatial information of available modes of transportation in a 2D space on a map of the study region. The developed ANNs are tested with three different experimental scenarios with varying choice sets of transportation modes, monitoring duration, device querying frequency, data collection time periods, and routes. The experimental scenarios are:
- Universal mode detection with a mode availability layer;
- Auto mode detection with mode availability layers;
- Peak (rush hour) versus non-peak (non-rush hour) period comparisons.
In all scenarios, performance of the newly-proposed method with mode availability GIS layers are compared with existing methods using conventional GPS data loggers and smartphone sensors.
3. Data Collection
Currently, Dubai has various modes of transportation available including; auto; metro; bus; tram; truck; walk (outdoor and indoor); bike; ferry and boat modes. (Road and Transport Authority of Dubai; https://traffic.rta.ae/trfesrv/public_resources/service-catalogue.do).
Ideally speaking, if all of these modes can be reliably estimated, many ITS applications can benefit from the results in the future. Figure 1 shows all currently-available modes of transportation in Dubai. This paper first develops a universal mode detection ANN that classifies the multiple modes of transportation. Then, a specific ITS application of traffic monitoring based on private vehicles, known as an auto mode, with ANNs is developed which can be useful, especially for transportation practitioners.
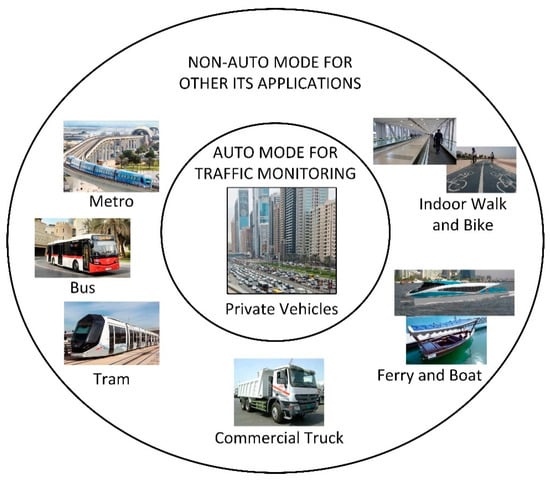
Figure 1.
Available modes of transportation in Dubai.
Conventional GPS data loggers (GL-750FL by Canmore Electronics Co. LTD, Hsinchu City, Taiwan, http://www.canmore.com.tw/product.php) and smartphones (Galaxy S8 by Samsung Electronics, Seoul, South Korea, with GPS, accelerometer, and magnetometer sensors, http://www.samsung.com/global/galaxy/galaxy-s8/) are dispatched along major routes of Dubai on different modes of transportation: auto, metro, bus, tram, truck, walk, bike, and water transit vehicles (ferries and boats). The devices have been attached on either side of the waist belt of data collection participants. The sampling rate is set at 1 Hz (once per second) for both devices. In the spring of 2017, in total, 110 weekday hours of data are collected including morning peak (7–9 a.m.), afternoon peak (5–7 p.m.), and non-peak periods (10 a.m.–2 p.m.). The morning peak, afternoon peak, and non-peak periods account for 25%, 25%, and 50% of all data, respectively. Sixty percent of the data are used to train the ANNs and 40% of the data are used as unseen data for evaluating the performance of the developed ANNs. The ratio between the training and validating data are arbitrarily chosen in such a way that the training phase is given with more data for building the ANNs. Analyses on the effect of varying ratios between the two datasets are beyond the scope of this paper. Ten people in total with 10 GPS data loggers and 10 smartphones have collected similar amounts of data from different modes of transportation.
The following criteria are considered for choosing routes and time slots for the data collection in Dubai.
- Representative routes of Dubai should share as many modes as possible in order for the different modes to experience similar physical surrounding conditions nearby so that the proposed ANN’s distinguishing power can focus on the characteristic variances among the different modes.
- The data should be collected from different types of roads (highways, arterial roads) from different regions of the city that would fairly represent the overall road conditions throughout the city.
- The data should be collected from both peak periods (rush hour) and non-peak periods (non-rush hour) because the traffic conditions are typically different between those time periods.
Figure 2 shows the study area with different routes for different modes. For the auto mode, major highways (E11, E44, and D63) and a loop of nearby arterial roads (318th, 8th, Al Thanya St., Al Marabea Rd., Al Waha St., and Umm Al Sheif Rd.) are chosen. For the metro mode, which operates on an elevated rail that is about 20 m above the ground, a section between Nakheel station and Al Rigga station is selected. For the bus mode, a transit Route 8 is chosen for its wide coverage throughout the city while Route C9 is chosen because it travels through the central business district (CBD) which is notorious for extremely high-rise buildings that may cause serious multi-path errors with GPS signals. For the tram mode, the Dubai Tram route is chosen, which is the only tram route available in Dubai. For the truck mode, highway E311, also known as a “truck road” is chosen which has intentionally been built in parallel with a major highway, E11, in order to reduce the load on E11. (Zaman, S., New highway connects Abu Dhabi to Dubai, Gulf News, http://gulfnews.com/news/uae/transport/new-highway-connects-abu-dhabi-to-dubai-1.1937213) For the walk and bike modes, the data are collected from Jumeira Beach due to the relatively higher density of the population using the two modes in the city. Due to the extremely hot weather, major metro stations are connected with indoor pathways that are elevated roughly 20 m above the ground to major shopping malls that often stretch over a few kilometers which introduces a new indoor-walk mode in Dubai. This enables collecting data from an indoor walk mode based on sufficiently-long indoor pathways that can provide consistent streams of raw data to the mode detection ANNs in this study. Dubai is located by the Persian Gulf and its waterways play a major role as a part of the overall transportation infrastructure. Ferries (Route F1 and F2) and “Abra” boats (B1 and B2) are chosen for the data collection. Abra boats refer to small motorized water taxis that operate in the Dubai Creek area.
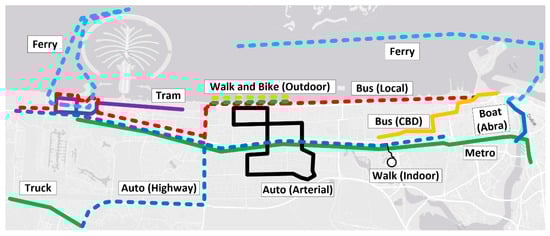
Figure 2.
Data collection area in Dubai in various modes of transportation.
4. Implementation of Mode Detection Artificial Neural Networks
A commercial package, Neurosolutions 7 (http://www.neurosolutions.com) is used for implementing the ANNs for various scenarios, training the ANNs, and computing the mode detection rates. Table 1 shows the common components of the software package and Figure 3 shows one of the most popular ANNs consisting of a single hidden layer, an input layer, and an output layer with a back-propagation algorithm. The particular design of ANN in Figure 3 is described in more detail in Section 7. If a transportation mode can correctly be identified with one of the simplest ANNs as adopted in this research with reasonable accuracies, more complex versions of it with sufficient fine-tuning would only improve the accuracies further.

Table 1.
Common components of Neurosolutions.
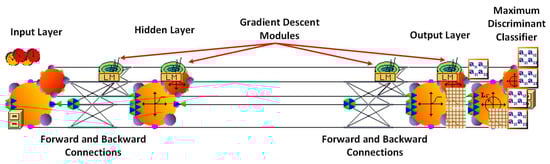
Figure 3.
Setup of a single-hidden-layer artificial neural network (ANN).
5. Empirical Analysis on Input Factors
Emerging smartphones are generally equipped with AGPS and magnetometer sensors. They can provide additional assistance in classifying the different modes. Byon et al. [20] find that those sensors are beneficial in detecting the transportation modes by producing more raw data in addition to the speed and acceleration values. For example, a boat mode, which usually operates with a wider view of the sky with less influences from buildings that would cause multi-path errors, can often see a greater number of satellites in view. Tram vehicles that run on electric motors with associated electronic parts generally produce higher electromagnetic fields. By utilizing the newly-available sensors from the smartphones, it is possible to further assist with classifying the mode with higher mode detection rates. Table 2 shows the summary of data collection in terms of the average number of satellites in view and average magnitudes of electromagnetic fields for each mode. The values of average number of satellites in view and average magnitude of magnetic field, are computed from the entire set of collected data in the field.
Table 2.
Distinctive input variables for each mode.
6. Building Mode Availability Layer
On a particular section of parallel roads, there are only a certain number of modes available and ANNs can utilize this additional input which can further aid the ANNs classifying capabilities. In this paper, a newly-developed type of GIS map layer in raster format, which contains binary (1 for available and 0 for not-available state) information is created. Mode-specific vector map layers are generated by selecting a particular subset of road networks corresponding to the availability of the mode throughout the map. Then, the newly-generated vector map is transformed into a raster map with 10 m × 10 m cells, where cells within a 100-m buffer of the road networks available with the particular mode are turned on. Once the newly-formed mode availability (MA) layers are prepared and ready to be accessed for each mode, raw data associated with any particular coordinates of GPS data from the field can be matched against those MA layers for checking the availability of each mode at that location (i.e., geocentric coordinates of x, y, z). This would form a new set of binary input factors to further aid the mode detection processes with ANNs. Figure 4 illustrates the concept of MA layers for each mode in a raster format. An auto mode is enabled in all sections in Figure 4 while the transit mode is available via points A-B-D-C and the metro mode is available via points C-D-E.
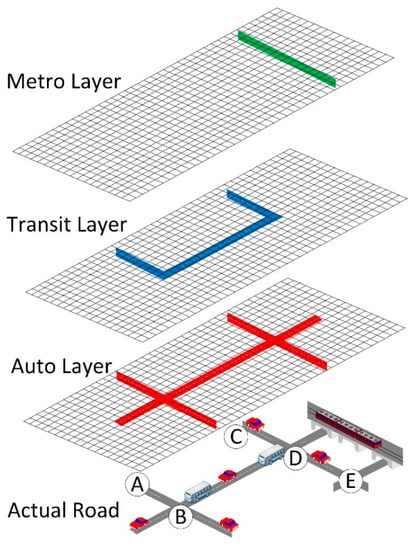
Figure 4.
Mode availability (MA) layers in a raster format.
ANNs are generally categorized as a “black box” approach, referring to the fact that there are no well-specified analytical relationships between input and output as mathematical functions. The method is also data-driven. To some, those facts may be viewed as major flaws as the approach is missing the understanding of phenomenon from the perspectives of intuitive mathematical reasoning. However, this very black-box approach indeed offers pattern recognition power that explorers search spaces that analytically approaching minds would not have even recognized they existed. In brief, the proposed MA approach produces binary (1 or 0) values for each cell on a raster map. When raw data are collected from within those “enabled” regions for a certain available mode, it gives additional stimulation to the ANNs and forces its mode classifying estimations towards the actual mode during the training phase. In other words, the extra stimulation would still help ANNs to estimate the actual mode more often than the case without the additional input, even when the output layer lists other non-available dummy modes among its output mode options.
7. Design of an Artificial Neural Network Classifier for Mode Detection
The characteristics of GPS data streams vary depending on the transportation mode in which the smartphones are located. In this paper, a pattern classification approach is adopted to identify the mode based on the characteristics of data streams from various sensors and mode availability layer. In its most general form, a typical neural network (NN) consists of multiple layers of neurons, connection weights among neurons, and associated nonlinear transfer functions within neurons. Multi-layer perceptrons (MLP) [27] have been used in the proposed ANNs. More specifically, one-hidden-layer MLP ANNs with McCulloch-Pitts (M-P) (Marsalli, M., McCulloch-Pitts Neurons, http://www.mind.ilstu.edu/curriculum/modOverview.php?modGUI=212) processing elements are used. The MLP is the most common supervised learning ANN. Supervised learning refers to the case where there are input and output pairs of data for training the network. For the mode identification, the input of GPS data used include speed, acceleration, and the average number of satellites in view, while the output includes the corresponding mode of transportation. If the mobile device or the server can store (and transmit) both current and a few recent GPS readings, the additional past speed and acceleration values can also be the input to the ANN to possibly improve the detection accuracy. The ANN maps each set of input data to the most probable mode. The training process adjusts connection weights between neurons as an entire set of training input data, also known as an epoch, is repeatedly passed through the network. All ANNs used in this paper consist of three layers of neurons connected in a feed-forward fashion, trained with the well-established, error-back-propagation algorithm. Depending on the specifics of each scenario, the number of inputs ranges from six (DL with two pings) to 220 (MAGIS with 20 pings) and the number of output classes is either seven (auto, bus, truck, tram, walk, bike, boat) or two (auto or non-auto). Seven output classes are used for classifying individual modes; i.e., auto, bus, truck, tram, walk, or bike. Two output classes are used when the classification is for auto vs. non-auto modes. As shown in Figure 5, the number of input variables varies depending on the monitoring duration and number of pings (n) per unit of time (as indicated as “Ping n” in Figure 5) in each scenario. For example, if the monitoring duration is 10 min and the number of pings or queries is 10 in that duration (one ping per minute), there are 10 speed values, 10 acceleration values, and 10 values for the number of satellites in view. Hyperbolic tangent functions are used as the nonlinear transfer functions in the M-P PEs (McCulloch-Pitts processing elements). The number of neurons (nodes) in the hidden layer is varied as 5, 10, 20, and 30. For different scenarios, different numbers of hidden nodes have been used, depending on the number of input variables and output classes. As a rule of thumb, having too many hidden nodes forces the NN to memorize the input-output training data, and leads to poorer generalization. Having too few hidden nodes, on the other hand, gives the NN difficulties in identifying and isolating the different classes. Therefore, it is desirable to keep the number of hidden nodes to a minimum without sacrificing the discriminating power. From the 110 h of collected data, for each scenario of data logger (DL), smartphone (SP), and smartphone with mode availability GIS (MAGIS), the entire set of data are shuffled randomly first. Then, 60% of the data are used to train the network and the remaining 40% are used for the validation process as unseen data. For example, in the case of the two pings –5 min scenario of DL, 10 different ANNs are formed with a randomly-shuffled set of data of which 60% of the data is used to train/develop the ANNs. Then, the average detection rate of those 10 runs of an identical scenario of two pings –5 min is considered as the resulting detection rate for the scenario. The ratio of training and validating data is set arbitrarily while assigning more data towards the training phase. The final number of hidden nodes used is determined after varying the number of hidden nodes over 10 to 20 trials. The number of nodes was kept to a minimum so long as performance of the network did not degrade compared with networks with a greater number of nodes. During the training processes, classification performance seemed to stabilize after 3000 epochs. If the error did not stabilize or continued to fluctuate after 3000 epochs, the number of hidden nodes is increased.
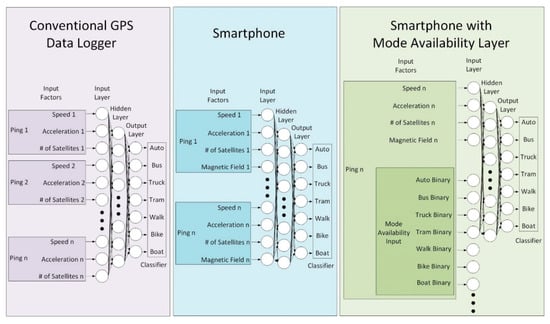
Figure 5.
Artificial neural network layout for universal mode detection with data logger (DL), smartphone (SP), and smartphone with mode availability GIS (MAGIS).
8. Experimental Scenarios and Results
This paper considers a few scenarios that effectively test the feasibility of the proposed ANN-based mode detection method with the developed MA layers. In order to compare the performances of the proposed method against existing methods, two existing methods are also carried on in addition to the proposed one. The two existing techniques are the conventional GPS data logger (DL) method and smartphone (SP) method. The DL approach uses a conventional GPS data logger that is capable of directly measuring its current location and speed. Indirectly-estimated acceleration values are produced from the speed values. In the case of the SP approach, the GPS location values are fixed quicker with the aid of signals from cell phone towers with the smartphones’ embedded AGPS chips. In addition, directly measured acceleration values from the accelerometers are collected in forms of absolute magnitude of 3D acceleration vectors. Finally, another measurement from a magnetometer further aids the mode detection.
The newly-proposed method involves using the smartphone approach with a mode availability GIS layers, namely the MAGIS method. The MAGIS requires pre-processing of a city’s road networks filtered for available mode routes information. However, once such GIS layers are built, the database can be easily maintained in the form of a live GIS database and can be easily updated as the routes for each mode can be modified in real-time in the database.
8.1. Universal Mode Detection with Smartphone with Mode Availability GIS (MAGIS)
Figure 5 shows the designs of ANNs for the universal mode detection for all modes of transportation based on their physical characteristics. Auto mode would typically experience the highest maximum speed, while transit buses would frequently accelerate and decelerate even during free-flow periods for serving transit stops. As Table 2 suggests, a boat mode would have a clearer view of the sky and “see” a greater number of satellites. In all of the above cases, observing a single particular set of data is not sufficient for reliably detecting the mode, as Li et al. [24] suggest. By making observations for a longer duration of time and sampling the data more frequently, it would give more opportunities for ANNs to capture particular sets of patterns for each mode and make more reliable mode estimations. In this scenario, 10 min of monitoring duration with five data samplings, also known as “pings”, are used for all three approaches of DL, SP, and MAGIS.
Table 3 and Figure 6 show the results from the universal mode detection using DL, SP, and MAGIS approaches. All three results show the highest values in its main diagonals, meaning that the proposed ANNs are detecting the correct modes the most among other modes. However, the mode detection rates of DL are the lowest among the three methods, probably due to its estimated acceleration values and lacking newly-available emerging input values from smartphones. The MAGIS performs significantly better than DL and SP methods due to its additional input factors from smartphone sensors and the binary input variables prepared from MA layers.
Table 3.
Results of universal mode detection rates (%) with DL, SP, and MAGIS.
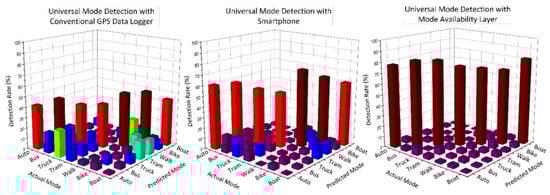
Figure 6.
Bar graphs of the results from universal mode detection with DL, SP, and MAGIS.
8.2. Auto Mode Detection with MAGIS
A particular ITS application of traffic monitoring is considered in this scenario. The traffic conditions experienced by private auto mode vehicles are usually considered as the general traffic flow because other modes of transportation, such as public transit or trucks, behave differently due to their specific roles, such as serving passengers at bus stops or carrying heavy loads of goods. Therefore, in the case of traffic monitoring, the mode detection among auto vs. non-auto modes are sufficient. This implies that all modes, other than the auto modes, are considered as non-auto modes altogether. In this section, raw data from non-auto modes are randomly shrunk down in size to match the size of the data from the auto mode with 50/50 ratio, in order to truly see the classifying power of the ANNs. Figure 7 shows the design layout of the ANNs for auto mode detection with DL, SP, and MAGIS approaches.
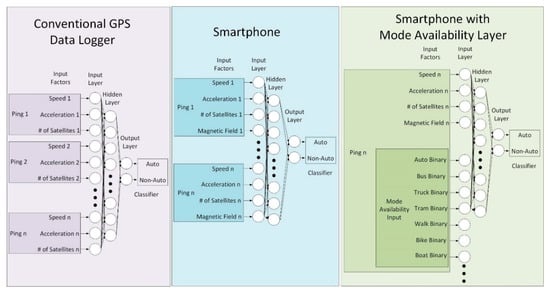
Figure 7.
Artificial neural network layout for auto mode detection with DL, SP, and MAGIS.
Table 4 and Figure 8 show the results of auto mode detection with DL, SP, and MAGIS approaches. When the actual mode of transportation is auto mode and its mode is correctly estimated as auto mode, it is denoted as an A-A detection rate. Similarly, if the actual mode is non-auto mode and the estimated mode is non-auto mode, it is denoted as an N-N detection rate. Ideally, if the A-A and N-N detection rates are both 100%, the mode detection is considered perfect.
Table 4.
Results of auto mode detection rates (%) with DL, SP, and MAGIS.
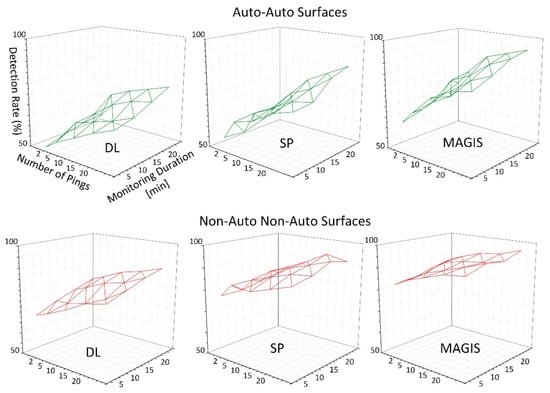
Figure 8.
A-A surface and N-N surface of auto mode detection with DL, SP, and MAGIS.
The results show the DL approach, while showing the main diagonal with the highest values for both A-A and N-N are all lower than the SP or MAGIS-based results. The MAGIS approach shows the highest rates for both A-A and N-N. The results are significantly higher than DL or SP approaches and it shows that the mode availability binary input does improve the detection rates for both A-A and N-N rates.
8.3. Peak Versus Nonpeak Auto Mode Detection with MAGIS
During rush hour, (7–9 a.m. and 5–7 p.m.) with 10 pings with 10 min duration scenario, the A-A rate is found to be 68%, 73%, 81%, for DL, SP, and MAGIS approaches, respectively. During the non-rush hour period (10 a.m.–2 p.m.) the A-A rate is found to be 56%, 67%, 74%, for DL, SP, and MAGIS approaches, respectively. It is interesting to note that the mode detection rates are better during the peak period. It seems that due to congestion, the vehicles tend to experience more fluctuations in accelerations and decelerations unique to each mode and it actually helps the ANNs to detect the intrinsic patterns embedded in each mode.
9. Future Research
The mode detection accuracies may be further improved by incorporating more complex ANNs with more hidden layers and varying the number of neurons. There is a need for a consistent guideline for optimizing the complexity of the designs and layout of the ANNs for the mode detection.
The MA layers can be implemented as an online database and be available for real-time access in the case of certain sections being unavailable due to accidents or temporarily paralyzed by grid-lock situations in the CBD.
Routes of certain modes of transportation are only available at particular ranges of elevations. For example, a boat mode usually operates at sea level, while elevated rails for the metro is always at higher elevations from the ground. Different transit bus routes may operate within different ranges of elevations. When combined with digital elevation models (DEM) it is possible to identify the mode of transportation more easily by incorporating the operating height information of each mode.
Currently in Dubai, where this study has been conducted, the metro trains operate above the ground. However, the majority of metro systems internationally operate underground. It is a challenge to enhance the proposed approach with underground applications without GPS data due to the blocked line of sight from GPS satellites to the metro users. It would be interesting to see how other sensors in smartphones, combined with mode availability layers, perform together for mode detection.
This paper briefly develops universal mode detection ANNs, followed by focusing on a particular ITS application of traffic monitoring. In the future, unique and specific ITS applications can be built for each mode. For example, for bike mode-related applications, the ANNs can further be optimized for detecting the bike mode followed by conducting slope analyses of the ground by processing the DEM with slope-determining GIS operations in 3D for the flattest route instead of the shortest route computations for the bike mode.
10. Conclusions
With advancements in computing technology and artificial intelligence algorithms, the field of civil engineering, which is often seen as a classic field of engineering, can benefit from the newly-available tools.
Traditionally, traffic monitoring requires fixed sensors with high capital costs that can only monitor a few fixed locations or probe vehicles with a dedicated vehicle and driver with an advantage of monitoring traffic conditions throughout the route, yet with high labor costs. There are existing methods that attempt to replace the probe vehicles with conventional GPS data loggers or smartphones with additional sensors that can automatically collect data as long as their mode of transportation can be reliably detected as an “auto” mode. This paper develops an artificial neural network (ANN)-based mode detection procedure enhanced with a mode availability (MA) GIS map layer, named as the MAGIS approach, which can detect various modes of transportation for potential future ITS applications and an auto mode for traffic monitoring purposes. A new approach of constructing MA layers in a raster format is proposed, traffic data associated with certain locations are queried against the MA layers, and the results in binary form are fed into the mode detection ANNs. A thorough data collection is carried out in Dubai where extremely tall buildings and indoor pathways offer unique environments to conduct this study. It is found that ANN-based mode detection enhanced with mode availability layers improve the detection accuracies significantly.
In the case of universal mode detection among seven different modes of transportation, including auto, bus, truck, tram, walk, bike, and boat, the proposed MAGIS approach has resulted in correct detection rates that range from 72 to 82% while the existing DL and SP methods resulted in correct detection rates from 42 to 53% and from 53 to 74%, respectively, for all modes of available transportation. In the case of the auto mode detection, the MAGIS approach produces correct detection rates ranging between 62% and 97% across all scenarios, while DL and SP methods have produced correct detection rates ranges between 49% and 89% and between 54% and 92%, respectively. Figure 9 shows the trends from the results. The proposed MAGIS approach can be adapted for cities with different sets of available modes as long as their MAGIS layers can be prepared and managed in parallel with the real-time operation of ANNs.
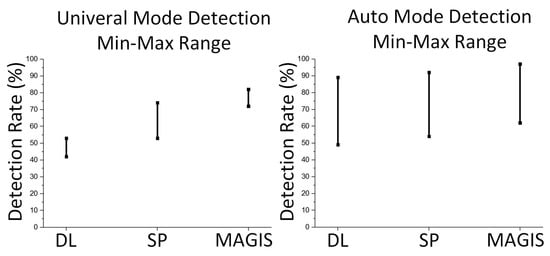
Figure 9.
Minimum and maximum mode detection rates of DL, SP, and MAGIS methods.
Acknowledgments
This research was conducted by the Transport-GIS Lab at the Khalifa University of Science and Technology (KUST) with an interdisciplinary team of faculties from departments of Civil Infrastructure and Environmental Engineering, Industrial and Systems Engineering, and Electrical and Computer Engineering funded by KUIRF Level 1 (2016) at KUST, and an ADEC Award for Research Excellence 2016–2017 in Abu Dhabi, UAE.
Author Contributions
Young-Ji Byon and Jun Su Ha conceived, designed, and analyzed the experiments; and Young-Ji Byon, Chung-Suk Cho, Tae-Yeon Kim, and Chan Yeob Yeun collected data, contributed the tools and wrote the paper.
Conflicts of Interest
The authors declare no conflict of interest.
References
- Tarnoff, P.J.; Bullock, D.M.; Young, S.E. Continuing Evolution of Travel Time Data Information Collection and Processing. In Proceedings of the Transportation Research Board 88th Annual Meeting, Washington, DC, USA, 1–15 January 2009. [Google Scholar]
- French, M.N.; Krajewski, W.F.; Cuykendall, R.R. Rainfall Forecasting in Space and Time Using a Neural Network. J. Hydrol. 1992, 137, 1–31. [Google Scholar] [CrossRef]
- Goh, A.C.T. Seismic Liquefaction Potential Assessed by Neural Networks. J. Geotech. Eng. 1994, 120, 1467–1480. [Google Scholar] [CrossRef]
- Jeng, D.S.; Lee, T.L.; Lin, C. Application of Artificial Neural Networks in Assessment of Chi-Chi Earthquake-induced Liquefaction. Asian J. Inf. Technol. 2003, 2, 190–198. [Google Scholar]
- Tsai, C.P.; Lee, T.L. Back-propagation Neural Network in Tidal-level Forecasting. J. Waterw. Port Coast. Ocean Eng. 1999, 125, 195–202. [Google Scholar] [CrossRef]
- Mizumura, K. Application of Kalman Filtering to Ocean Data. J. Waterw. Port Coast. Ocean Eng. 1984, 110, 334–343. [Google Scholar] [CrossRef]
- Bassuoni, M.T.; Nehdi, M.L. Neuro-fuzzy based Prediction of the Durability of Self-consolidating Concrete to Various Sodium Sulfate Exposure Regimes. Comput. Concr. 2008, 5, 573–597. [Google Scholar] [CrossRef]
- Prasad, B.K.R.; Eskandari, H.; Reddy, B.V.V. Prediction of Compressive Strength of SCC and HPC with High Volume Fly Ash using ANN. Constr. Build. Mater. 2009, 23, 117–128. [Google Scholar] [CrossRef]
- Smith, B.L.; Zhang, H.; Fontaine, M.; Green, M. Cellphone Probes as an ATMS Tool. In Research Project Report for the National ITS Implementation Research Center and US DOT University Transportation Center; Center for Transportation Studies at the University of Virginia: Charlottesville, VA, USA, 2003. [Google Scholar]
- Byon, Y.J.; Shalaby, A.; Abdulhai, B. GISTT: GPS-GIS Integrated System for Travel Time Surveys. In Proceedings of the Transportation Research Board 85th Annual Meeting Preprint CD-ROM, Washington, DC, USA, 22–26 January 2006. [Google Scholar]
- Uno, N.; Kurauchi, F.; Tamura, H.; Iida, Y. Using Bus Probe Data for Analysis of Travel Time Variability. J. Intell. Transp. Syst. 2009, 13, 2–15. [Google Scholar] [CrossRef]
- Cathey, F.W.; Dailey, D.J. Transit Vehicles as Traffic Probe Sensors. Transp. Res. Rec. J. Transp. Res. Board Natl. Acad. 2002, 1804, 23–30. [Google Scholar] [CrossRef]
- Bar-Gera, H. Evaluation of a Cellular Phone-Based System for Measurements of Traffic Speeds and Travel Times: A Case Study from Israel. J. Transp. Res. Board Natl. Acad. Part C Emerg. Technol. 2007, 15, 380–391. [Google Scholar] [CrossRef]
- Zhong, G.; Wan, X.; Zhang, J.; Yin, T.; Ran, B. Characterizing Passenger Flow for a Transportation Hub Based on Mobile Phone Data. IEEE Trans. Intell. Transp. Syst. 2017, 18, 1507–1518. [Google Scholar] [CrossRef]
- Tsui, A.; Shalaby, A. An Enhanced System for Link and Mode Identification for GPS-based Personal Travel Surveys. J. Transp. Res. Board Natl. Acad. 2006, 1972, 38–45. [Google Scholar] [CrossRef]
- Zong, F.; Yuan, Y.; Liu, J.; Bai, Y.; He, Y. Identifying travel mode with GPS data. Transp. Plan. Technol. 2017, 40, 242–255. [Google Scholar] [CrossRef]
- Chen, J.; Bierlaire, M. Probabilistic Multimodal Map-matching with Rich Smartphone Data. J. Intell. Transp. Syst. 2015, 19, 134–148. [Google Scholar] [CrossRef]
- Gonzalez, P.A.; Weinstein, J.S.; Barbeau, S.J.; Labrador, M.A.; Winters, P.L.; Georggi, N.L.; Perez, R. Automating mode detection for travel behavior analysis by using global positioning systems enabled mobile phones and neural networks. IET Intell. Transp. Syst. 2010, 4, 37–49. [Google Scholar] [CrossRef]
- Byon, Y.J.; Abdulhai, B.; Shalaby, A. Real-Time Transportation Mode Detection via Tracking Global Positioning System Mobile Devices. J. Intell. Transp. Syst. 2009, 13, 161–170. [Google Scholar] [CrossRef]
- Byon, Y.J.; Liang, S. Real-Time Transportation Mode Detection using Smartphones and Artificial Neural Networks: Performance Comparisons between Smartphones and Conventional Global Positioning System sensors. J. Intell. Transp. Syst. 2014, 18, 264–272. [Google Scholar] [CrossRef]
- Maghrebi, M.; Abbasi, A.; Waller, S.T. Transportation Application of Social Media: Travel Mode Extraction. In Proceedings of the 2016 IEEE 19th International Conference on Intelligent Transportation Systems (ITSC), Rio de Janeiro, Brazil, 1–4 November 2016. [Google Scholar]
- Cardoso, N.; Madureira, J.; Pereira, N. Smartphone-based Transport Mode Detection for Elderly Care. In Proceedings of the 2016 IEEE 18th International Conference on e-Health Networking, Applications and Services (Healthcom), Munich, Germany, 14–17 September 2016. [Google Scholar]
- Lan, G.; Xu, W.; Khalifa, S.; Hassan, M.; Hu, W. Transportation Mode Detection Using Kinetic Energy Harvesting Wearables. In Proceedings of the 2016 IEEE International Conference on Pervasive Computing and Communications, Sydney, Australia, 14–18 March 2016. [Google Scholar]
- Li, S.; Zhu, K.; van Gelder, B.H.W.; Nagle, J.; Tuttle, C. Reconsideration of Sample Size Requirements for Field Traffic Data Collection with Global Positioning System Devices. J. Transp. Res. Board Natl. Acad. 2002, 1804, 17–22. [Google Scholar] [CrossRef]
- Quiroga, C.A.; Bullock, D. Travel Time Information Using GPS and Dynamic Segmentation Techniques. J. Transp. Res. Board Natl. Acad. 1999, 1660, 48–57. [Google Scholar] [CrossRef]
- Assemi, B.; Safi, H.; Mesbah, M.; Ferreira, L. Developing and Validating a Statistical Model for Travel Mode Identification on Smartphones. IEEE Trans. Intell. Transp. Syst. 2016, 17, 1920–1931. [Google Scholar] [CrossRef]
- Principe, J.C.; Euliano, N.R.; Lefebvre, W.C. Neural and Adaptive Systems: Fundamentals through Simulations; Wiley: New York, NY, USA, 2000. [Google Scholar]


© 2017 by the authors. Licensee MDPI, Basel, Switzerland. This article is an open access article distributed under the terms and conditions of the Creative Commons Attribution (CC BY) license (http://creativecommons.org/licenses/by/4.0/).