Article

Experimental and Simulation Study of Low-Velocity Impact on Glass Fiber Composite Laminates with Reinforcing Shape Memory Alloys at Different Layer Positions

College of Aerospace and Civil Engineering, Harbin Engineering University, Harbin 150001, China
*
Author to whom correspondence should be addressed.
Appl. Sci. 2018, 8(12), 2405; https://doi.org/10.3390/app8122405
Submission received: 26 October 2018 / Revised: 19 November 2018 / Accepted: 23 November 2018 / Published: 27 November 2018

Abstract

:
The effects of shape memory alloy (SMA) wires on the damage behavior of glass fibers/epoxy resin composite laminates for the case of low-velocity impact are investigated experimentally and numerically. In this work, the low-velocity impact tests of SMAs/glass fibers/epoxy resin composite laminates are carried out. The elastic–plastic theory was adopted to simulate the mechanical behavior of SMA during the loading stage. The three-dimensional (3D) Hashin failure criterion is adopted in Abaqus/Explicit to model the damage initiation of composite laminates. The cohesive damage model is introduced to control the interface element and model the delamination failure. Moreover, the impact damage mechanisms of composite laminates are analyzed based on the experimental and numerical simulation results. These results show that the numerical results obtained in the present study have a reasonably good agreement with the experimental results. In addition, it is also found that impact damages are mainly caused by matrix cracks and delamination with no perforation for the case of 32-J impact energy, and impact damages are mainly caused by fibers breakage with perforation for the case of 64-J impact energy.

1. Introduction

Composite materials are widely used in aerospace structures due to their high strength-to-weight ratio [1,2]. However, their impact damage tolerance has been a major concern in engineering applications. It is well-known that the mechanical properties of composite laminates deteriorate and the structural stability of composite laminates decreases for the case of the low-velocity impact loading. In applications, the loading conditions are multitude and complex, such as impacts by dropped tools during maintenance, collision from gravels on the runway during takeoff and landing, bird strike, and impact of hails during flight [3,4]. Thus, improving the impact resistance and energy absorption capability of composite laminates is a very important task.
In the early 1960s, Buehler et al. [5,6] discovered the shape memory effect in an equiatomic Ni–Ti alloy. Afterward, it was discovered in some research studies that the Ni–Ti alloy exhibited fully recoverable transformation strains up to 8%, which could be also obtained in various forms, such as wires, strips, rods, tubes, and plates [7]. Due to the unique properties of shape memory alloy (SMA) wires, it was speculated that it may enhance the impact resistance of composites. Some studies on the impact response of SMA-reinforced composites have been reported in the literature. It is found that the impact resistance and energy absorption capability of composite laminates can be improved by embedding SMA into the composites. In the past three decades, a few experimental investigations were carried out for the impact response of SMA-reinforced composites. Aurrekoetxea et al. [8] investigated the effect of super-elastic SMAs on the impact behavior of fiber-reinforced composites. The results suggest that SMAs have a positive effect on the maximum absorbed energy. Kang et al. [9] identified the effect of SMAs on the damage behavior of laminates subjected to low-velocity impact at low temperatures of 293 K, 263 K, and 233 K. It is found that the impact damage behavior of the base laminates was slightly affected by the temperatures, but the deformation and damage of SMA laminates was affected by the temperatures. Pappadà et al. [10] evaluated the influence of the integration of thin super-elastic SMA wires into laminated composites on the impact behavior of the hybrid composites, and distinguished the influence of the martensitic transformation from the introduction of a pure metallic wire and super-elastic SMA wire by embedding unidirectional steel wires into the polymeric matrix. They also investigated the influence of the integration of thin super-elastic wires on preventing damage propagation in composite structures [11]. It was found that the super-elastic SMA fibers can absorb much more strain energy than other fibers before their failure. Roh et al. [12] found that the deflections of composite structures can be significantly reduced by changing the SMA volume fractions and temperature. Tsoi et al. [13] showed that the damage resistance of the SMA-reinforced composites under low-velocity impact can improve for some cases. Paine et al. [14] found that the impact resistance of the hybrid composites can improve by embedding the SMA fibers into composites.
Moreover, a few numerical investigations on the low-velocity impact responses of SMA-reinforced composites have been also conducted. For example, Meo et al. [15] conducted the finite element simulation for SMA-reinforced composite plates under low velocity impact. It is found that the impact damage of composites can be reduced significantly by embedding super-elastic shape memory alloys into a composite structure. Kim et al. [16] studied the low-velocity impact behavior of a shape memory alloy hybrid composite by using the Abaqus/Explicit program. Shariyat et al. [17] studied the accurate eccentric impact behavior for the preloaded SMA composite plates based on a novel mixed-order hyperbolic global–local theory. Birman et al. [18] presented an optimum approach to the design problem of composite plates subjected to low-velocity impact. Khalili et al. [19] investigated the effect of some important parameters on the impact behavior of the active thin-walled hybrid composite plates embedded with SMAs, and the Choi’s linearized Hertzian contact model is adopted in the impact analysis of the laminated hybrid composite plate. Shariyat et al. [20] conducted the impact analysis for the strain rate-dependent composite plates with SMA wires in a thermal–mechanical environment for the first time, and they proposed a set of coupled thermos-elasticity constitutive relations, and related contact models.
Although many efforts have been made to study the impact response in SMA-reinforced composite laminates, the scope of the investigations is still limited. Moreover, a comprehensive experimental study for the impact response of SMA-reinforced composites under different loading conditions is still lacking. In particular, an experiment supported numerical simulation, such as a finite element method (FEM) simulation of SMA-reinforced composites, has not been systematically performed. Furthermore, numerical simulation based on the effective damage analysis model, which has become increasingly important as a cost-effective and necessary method for the design of SMA-reinforced composite laminates, is scarce, if there is any at all.
The objective of the present work is to study the low-velocity impact response of SMA-reinforced composite laminates under non-perforation (32 J) and perforation (64 J) conditions by combining both experimental and numerical simulation approaches. The low-velocity impact test is performed by an Instron Dynatup 9250HV Drop Weight Impact Testing Machine at room temperature. The three-dimensional (3D) Hashin failure criterion is adopted in Abaqus/Explicit by using the user-defined subroutine (VUMAT) to model the damage initiation of composite laminates. The elastic–plastic theory was adopted to simulate the mechanical behavior of SMA during the loading stage.

2. Methods: Experiment and Numerical Simulation

2.1. Low-Velocity Impact Experimental Tests

In the impact experimental tests, the testing composite specimen has the dimension L x × L y × L z = 100 mm × 100 mm × ( n × 0.2 mm ) , in which n = 16 is the ply number of the glass fiber in the laminate. Composite laminates are composed of SMAs, glass fiber, and epoxy resin by a vacuum-assisted resin injection (VARI) process. SMA wires adopted super-elastic 55.9 wt.% Ni balance Ti wire with the diameter of 0.2 mm obtained from Jiangyin Fasten-PLT Materials Science Co., Ltd., Jiangsu, P.R. China. The glass fiber (GF) is unidirectional glass fiber (EDW800) with the layer thickness of 0.2 mm and the mass surface density of 200 g/m2. It was provided from Jiangsu Jiuding New Material Co., Ltd., Nantong, Jiangsu, P.R. China. The selected resin is epoxy vinyl ester resin (VER) 411, in which the matching curing agent and accelerating agent are methyl ethyl ketone peroxide (MEKP) and dimethylaniline; it was bought from Harbin Akihito composite material Co., Ltd., Harbin, P.R. China. Figure 1a represents the pure fiber-reinforced laminate with the stacking sequences of [0/90]8, and Figure 1b represents the SMA and fiber hybrid-reinforced laminates with the stacking sequences of [(0/90)4/SMA/(0/90)4], [0/SMA/90/(0/90)7], [0/SMA/90/(0/90)3/SMA/(0/90)4], respectively. Here, the stacking sequence mentioned above is from bottom to up, where the subscript indicates repeated times, and the numbers 0 and 90 are the ply angles of each layer glass fiber, in which the angles of 0 and 90 correspond to x and y directions (see Figure 1). In this work, the SMAs are stitched in laminate by two types: one is the whole surface (Figure 1c), and the other is the local surface (Figure 1d), and the SMA wires always parallel to the direction of the 0° fiber layup direction in all specimens. The diameters of SMAs is 0.2 mm, and the interval spacing between the two SMAs is 5 mm for all of the specimens. The thicknesses of laminates for all specimens mentioned above are all 3.2 mm.
The low-velocity impact tests are carried out by using a drop weight impact testing machine of Instron Dynatup 9250HV followed by ASTM D7136/D7136M-07, which is a standard test method for measuring the damage resistance of a fiber-reinforced polymer matrix composites to a drop-weight impact event. The hydraulic fixing device and circular clamp with a diameter of 76 mm are used to fix the specimens. A semispherical rigid impactor with a diameter of 14 mm and a total weight of eight kilograms (error ±0.1 kg) are used in the low-velocity impact tests. The impact energies in the low-velocity impact tests are 32 J and 64 J, respectively, and the relevant parameters of the hybrid composite laminates and the initial impact energy are listed in Table 1. Further details on the manufacturing process and low-velocity impact experimental tests of composite laminates are described according to the previous work of our research group [21].

2.2. Numerical Models

2.2.1. SMA Model

The SMA wires that are used in the experiment are the super-elastic 55.9 wt.% Ni balance Ti wire with the diameter of 0.2 mm, produced by Jiangyin Fasten-PLT Materials Science Co., Ltd. (Pelertech), Jiangsu, P.R. China. In Abaqus, the elastic–plastic theory following the von Mises (J2) yield criterion was adopted to simulate the mechanical behavior of SMA during the loading stage. The elasticity governing equations:
σ j i = λ δ i j ε k k e l + 2 μ ε i j e l
The plasticity yield function:
3 2 S i j S i j σ y ( ε ¯ p l ) = 0  
S i j = σ i j 1 3 δ i j σ k k  
The equivalent plastic strain:
ε ¯ p l = 0 t ε ¯ ˙ p l d t  
ε ¯ ˙ p l = 2 3 ε ˙ i j p l ε ˙ i j p l  
The plastic flow law:
ε ˙ i j p l = 2 3 S i j σ y ε ¯ ˙ p l  
where S i j is deviatoric stress, σ y is yield stress, ε ¯ p l is the equivalent plastic strain, and ε ¯ ˙ p l is the equivalent plastic strain rate. The schematic diagram of the stress–strain curve for Ni–Ti SMAs in the case of breaking is shown in Figure 2, and the yield stress versus equivalent plastic strain for the Ni–Ti SMA wires are tabulated in Table 2. The stress–strain data are input to define the SMA material behavior in the simulation.

2.2.2. Failure Criterion

The 3D Hashin failure criterion accounting for fiber failure and matrix failure is adopted in Abaqus/Explicit using a user-defined subroutine (VUMAT) to analyze the damage mechanisms of the composites. The tensile and compressive failure of fiber, and that of matrix can be expressed as [22,23,24]:
Fiber tension failure, d f t = 1 :
( σ 11 X T ) 2 + ( σ 12 S 12 ) 2 + ( σ 13 S 13 ) 2 1 ,   ( σ 11 > 0 )  
Fiber compression failure, d f c = 1 :
( σ 11 X C ) 2 1 ,   ( σ 11 < 0 )  
Matrix tension failure, d m t = 1 :
( σ 11 2 X T ) 2 + ( σ 12 S 12 ) 2 + ( σ 22 ) 2 Y T Y C + σ 22 Y T + Y C 1 ,   ( σ 22 + σ 33 > 0 )  
Matrix compression failure, d m c = 1 :
( σ 11 2 X T ) 2 + ( σ 12 S 12 ) 2 + ( σ 22 ) 2 Y T Y C + σ 22 Y T + Y C 1 ,   ( σ 22 + σ 33 < 0 )  
where d f t , d f c , d m t , and d m c are the damage variables for evaluating the tensile failure and compressive damage of the fiber and matrix, respectively. σ i j (i, j = 1, 2, 3) are the Cauchy stress tensor components. X T , X C , Y T , and Y C are the tensile and compressive strengths in the longitudinal and transverse directions, respectively. S 12 , S 13 , and S 23 are the shear strength in the fiber and transverse direction, fiber and thickness direction, and transverse and thickness direction, respectively. In this work, the initiation failure criterion is modeled based on 3D Hashin failure criterion by using a user-defined subroutine (VUMAT) that is adopted in Abaqus/Explicit to analyze the damage mechanisms of composite laminates. To ensure the stability during analysis, the failure elements will be eliminated from geometry, and will be not considered in further calculations. The material parameters of composites used in finite element (FE) simulation is listed in Table 3.

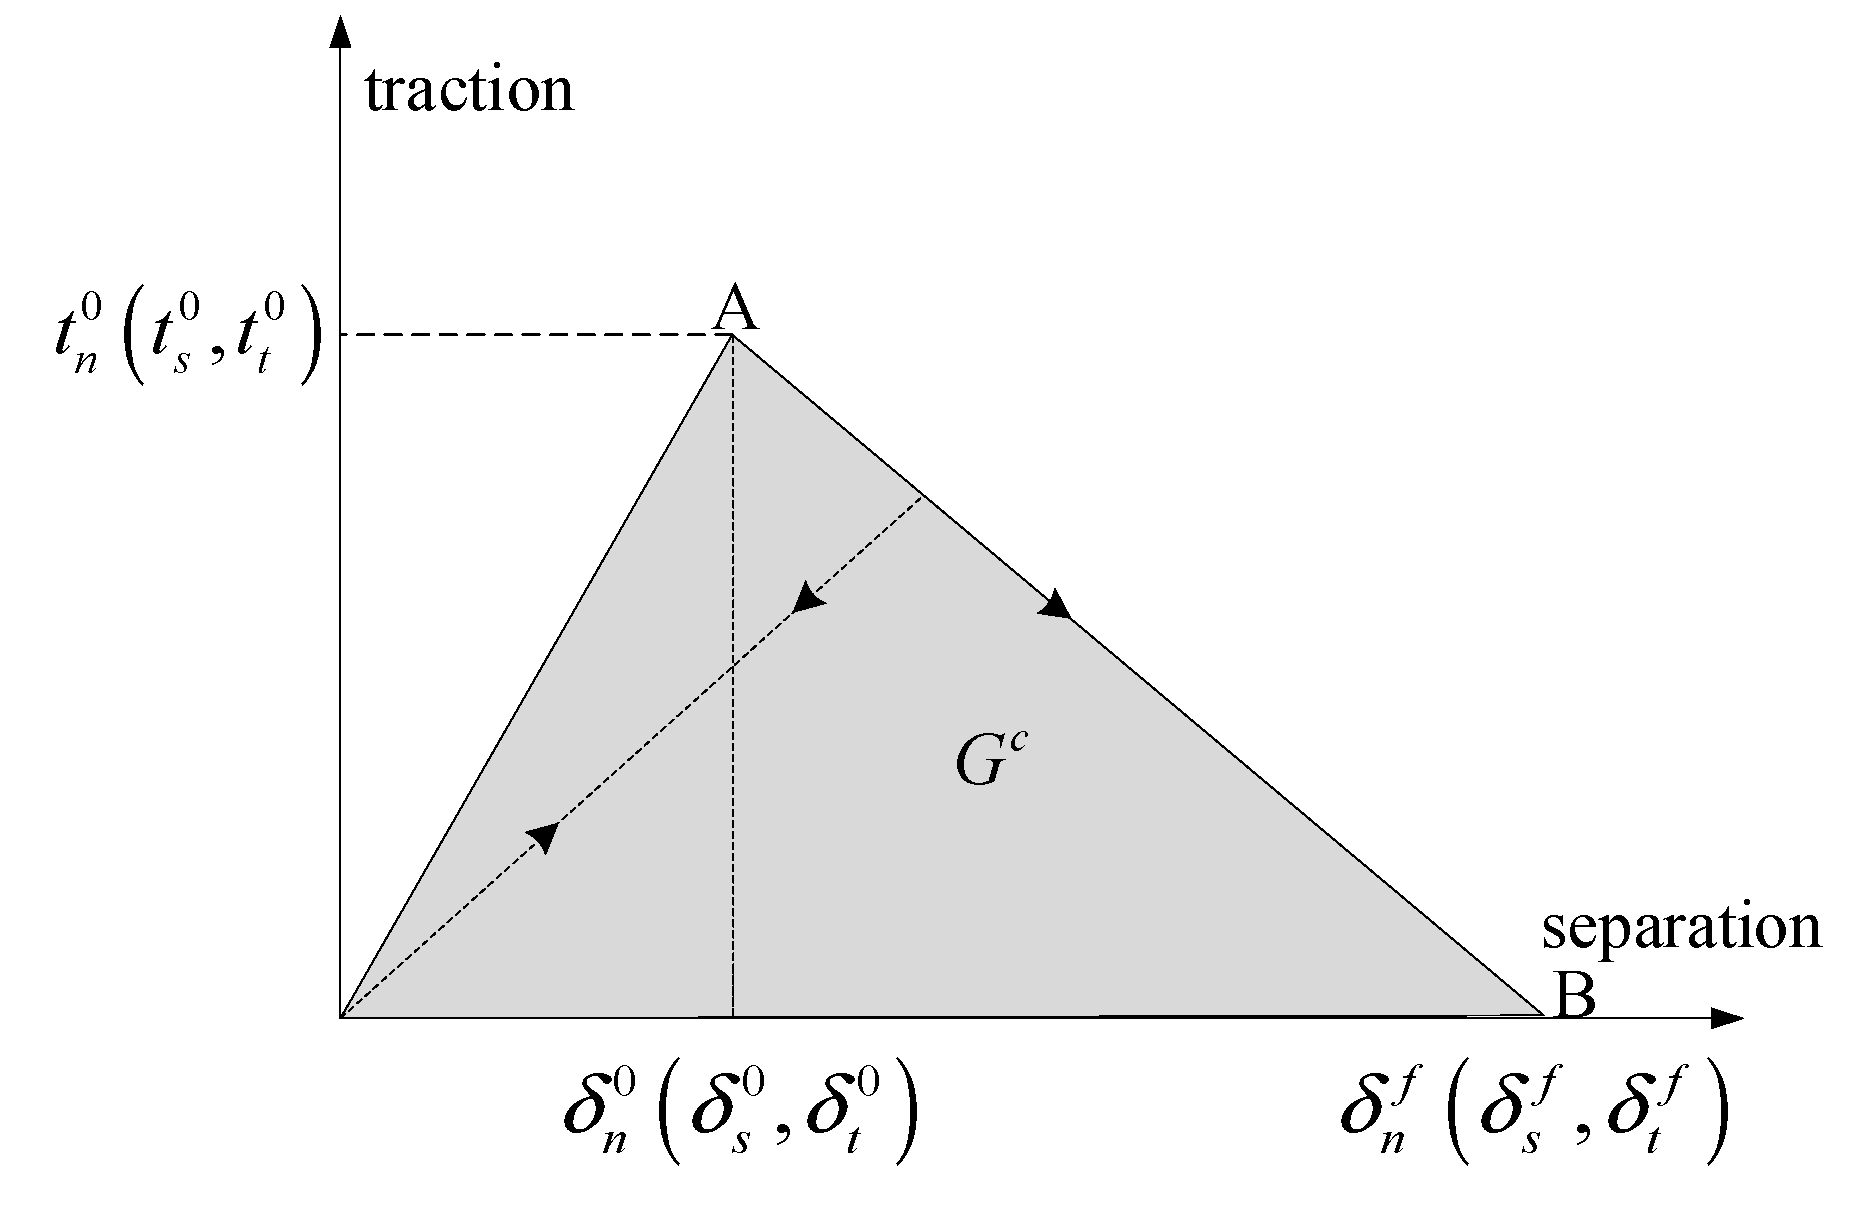
2.2.3. Interlaminar Damage Model

In the paper, the delamination between interlayer interfaces or SMA and layer interfaces are modeled by surface-based cohesive behavior in Abaqus/Explicit. The surface-based cohesive behavior is defined as a surface interaction property, and can be used to model the delamination at interfaces directly in terms of traction versus separation [25,26,27,28,29]. The available traction–separation model in Abaqus assumes initially linear elastic behavior, followed by the initiation and evolution of damage. The elastic behavior is written in terms of an elastic constitutive matrix that relates the normal and shear stresses to the normal and shear separations across the interface. The elastic behavior can then be written as:
t = { t n t s t τ } = [ K n n 0 0 0 K s s 0 0 0 K t t ] { δ n δ s δ t } = Κ δ
where nominal traction stress vector t consists of three components— t n , t s and t t —which represent the normal and two shear tractions, respectively. Here, we adopt the uncoupled traction–separation behavior, and the terms K n n , K s s , and K t t are not defined any dependencies on temperature or field variables. Abaqus uses default contact penalties to model the traction–separation behavior.
Damage modeling simulates the degradation and eventual failure of the bond between two cohesive surfaces. The failure mechanism consists of two ingredients: a damage initiation criterion and a damage evolution law. The initial response is assumed to be linear, and once a damage initiation criterion is met, damage can occur according to a user-defined damage evolution law. Figure 3 shows a typical traction–separation response with a failure mechanism.
Damage initiation refers to the beginning of degradation of the cohesive response at a contact point. The process of degradation begins when the contact stresses satisfy certain damage initiation criteria. Damage is assumed to initiate when a quadratic interaction function involving the contact stress ratios reaches a value of one. This criterion can be represented as:
{ t n t n 0 } 2 + { t s t s 0 } 2 + { t t t t 0 } 2 = 1  
where, t n 0 , t s 0 , and t t 0 represent the peak values of the contact stress when the separation is either purely normal to the interface or purely in the first or the second shear direction, respectively.
The damage evolution law describes the rate at which the cohesive stiffness is degraded once the corresponding initiation criterion is reached. Damage evolution can be defined based on the energy that is dissipated as a result of the damage process, which is also called the fracture energy. The fracture energy is equal to the area under the traction–separation curve in Figure 3. Unloading subsequent to damage initiation is always assumed to occur linearly toward the origin of the traction–separation plane, as shown in Figure 3. Reloading subsequent to unloading also occurs along the same linear path until the softening envelope (line AB) is reached. Once the softening envelope is reached, further reloading follows this envelope, as indicated by the arrow in Figure 3. The dependence of the fracture energy on the mode mix is defined based on a power law fracture criterion. The power law criterion states that failure under mixed-mode conditions is governed by a power law interaction of the energies that are required to cause failure in the individual (normal and two shear) modes. It is given by:
{ G n G n c } α + { G s G s c } α + { G t G t c } α = 1  
where, G n c , G s c , and G t c refer to the critical fracture energies that are required to cause failure in the normal, first, and second shear directions, respectively. The cohesive parameters values that are adopted in the simulation are listed in Table 4.

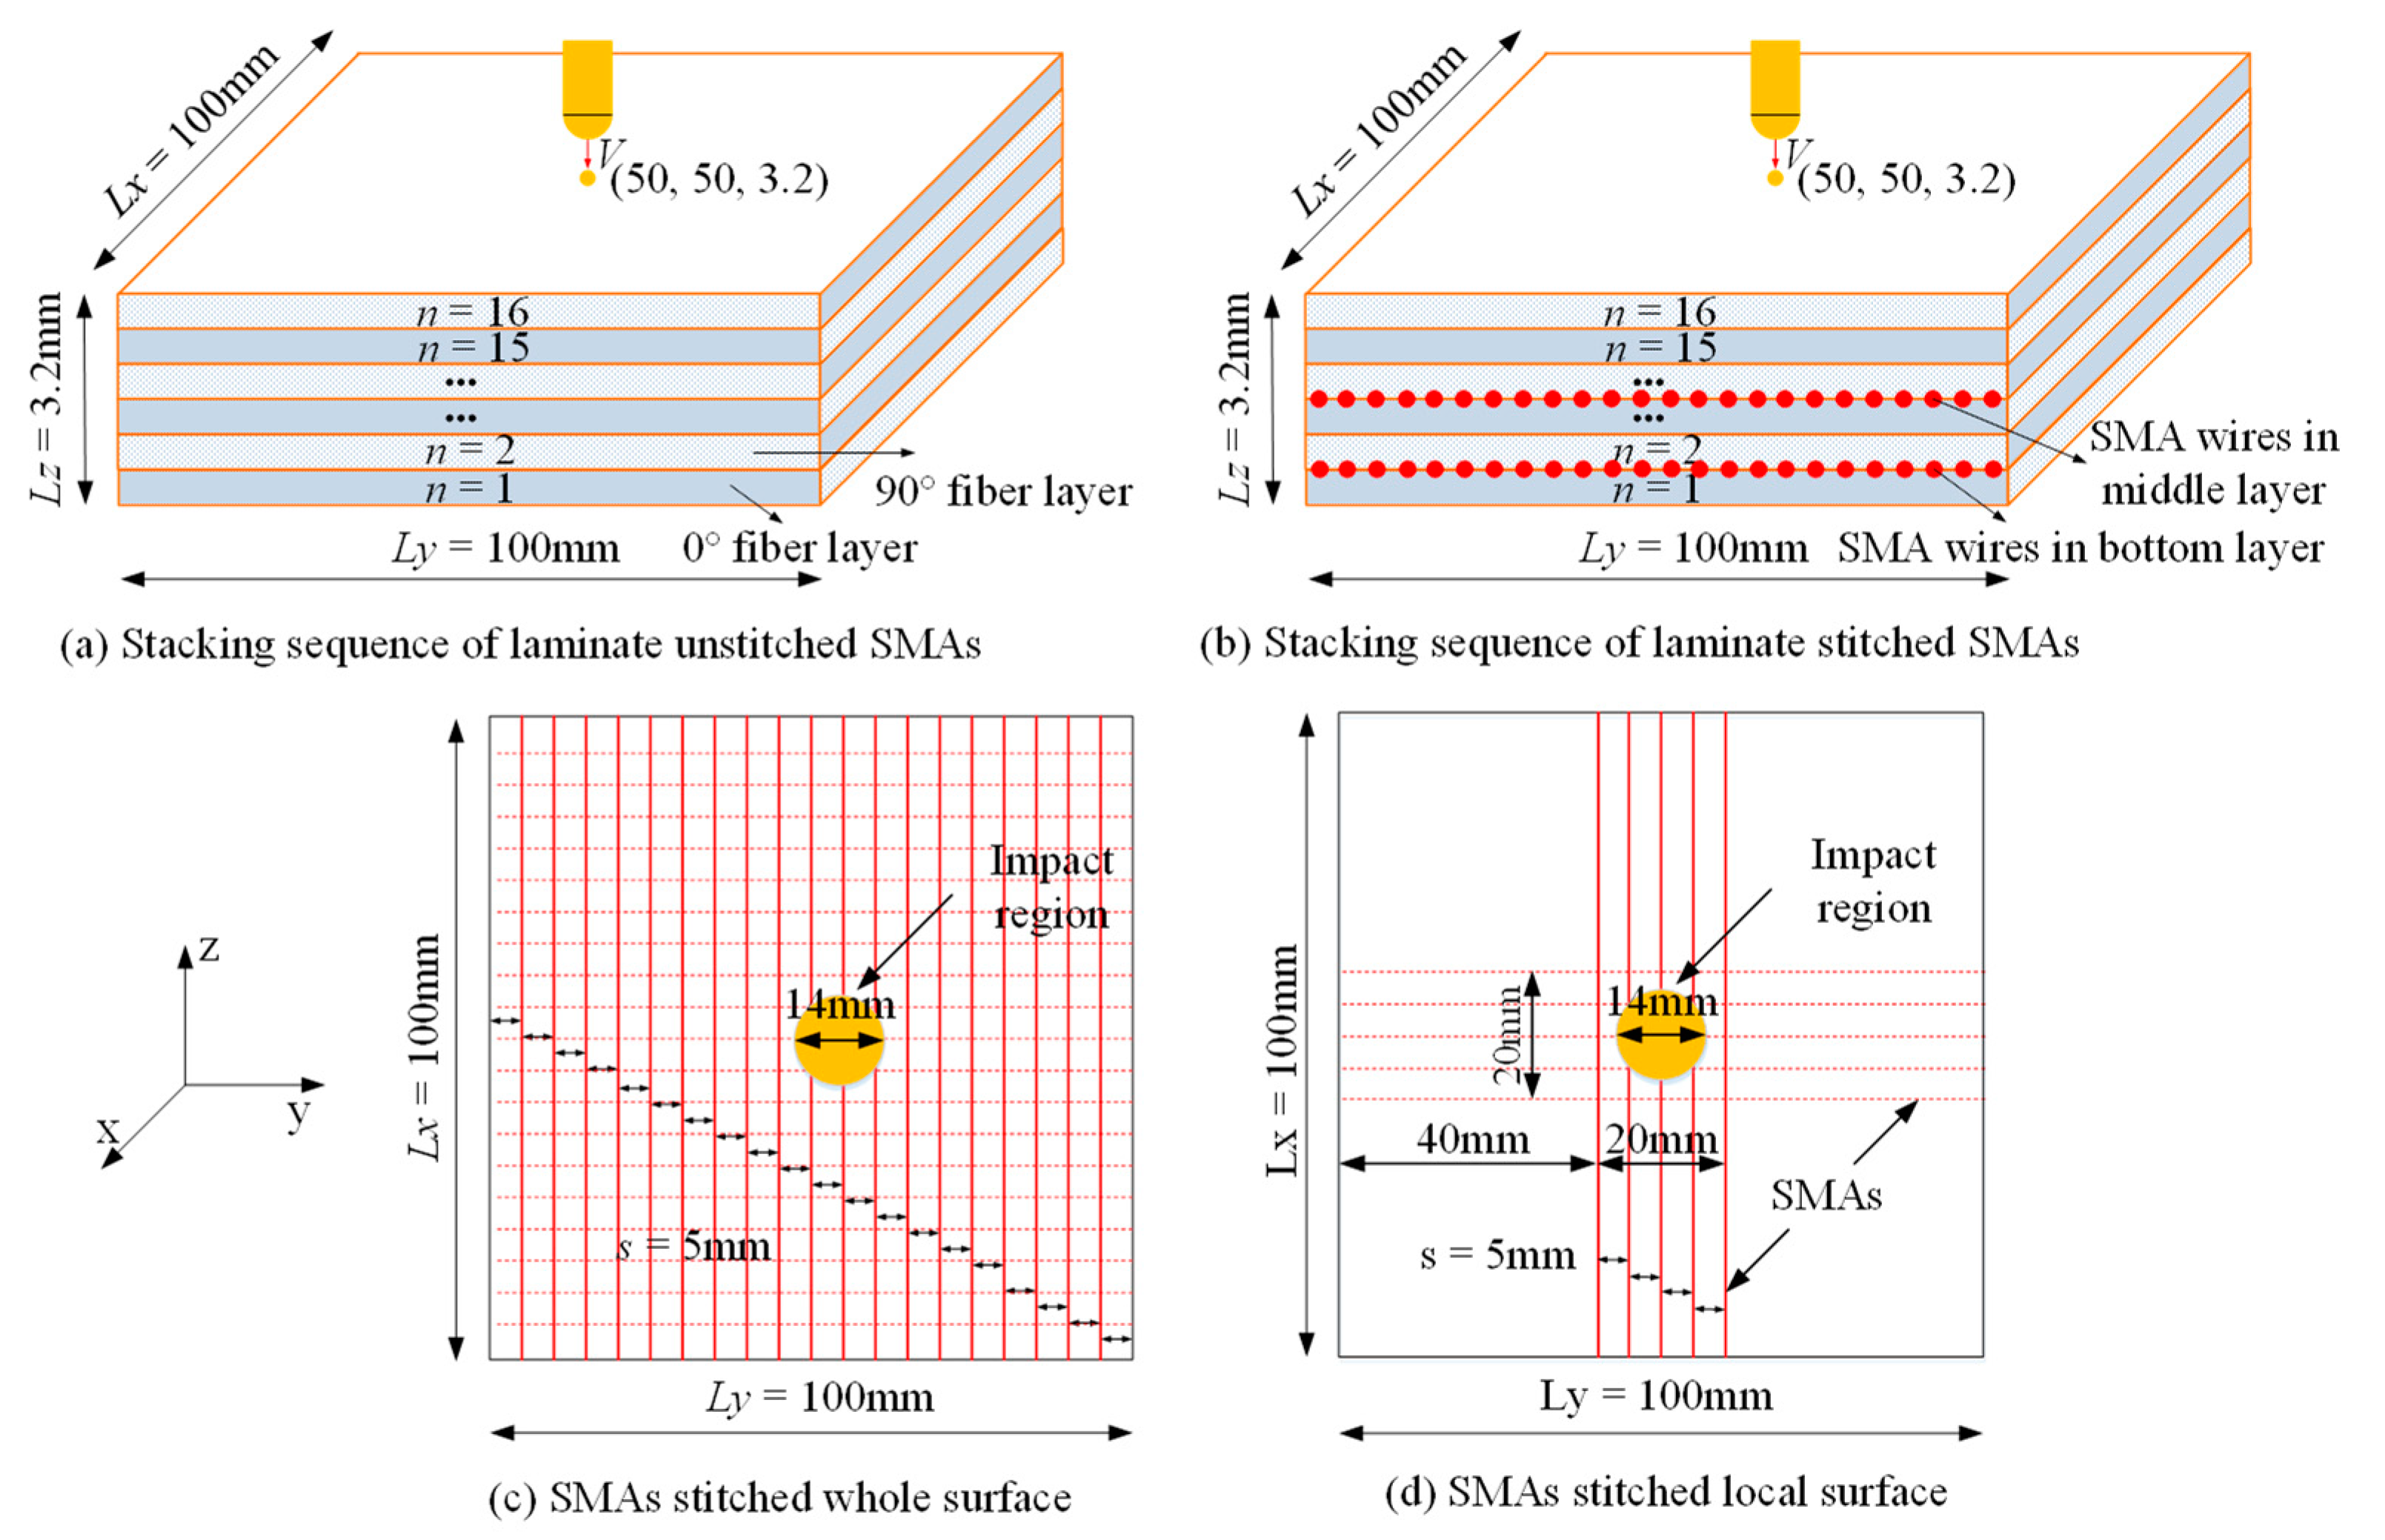
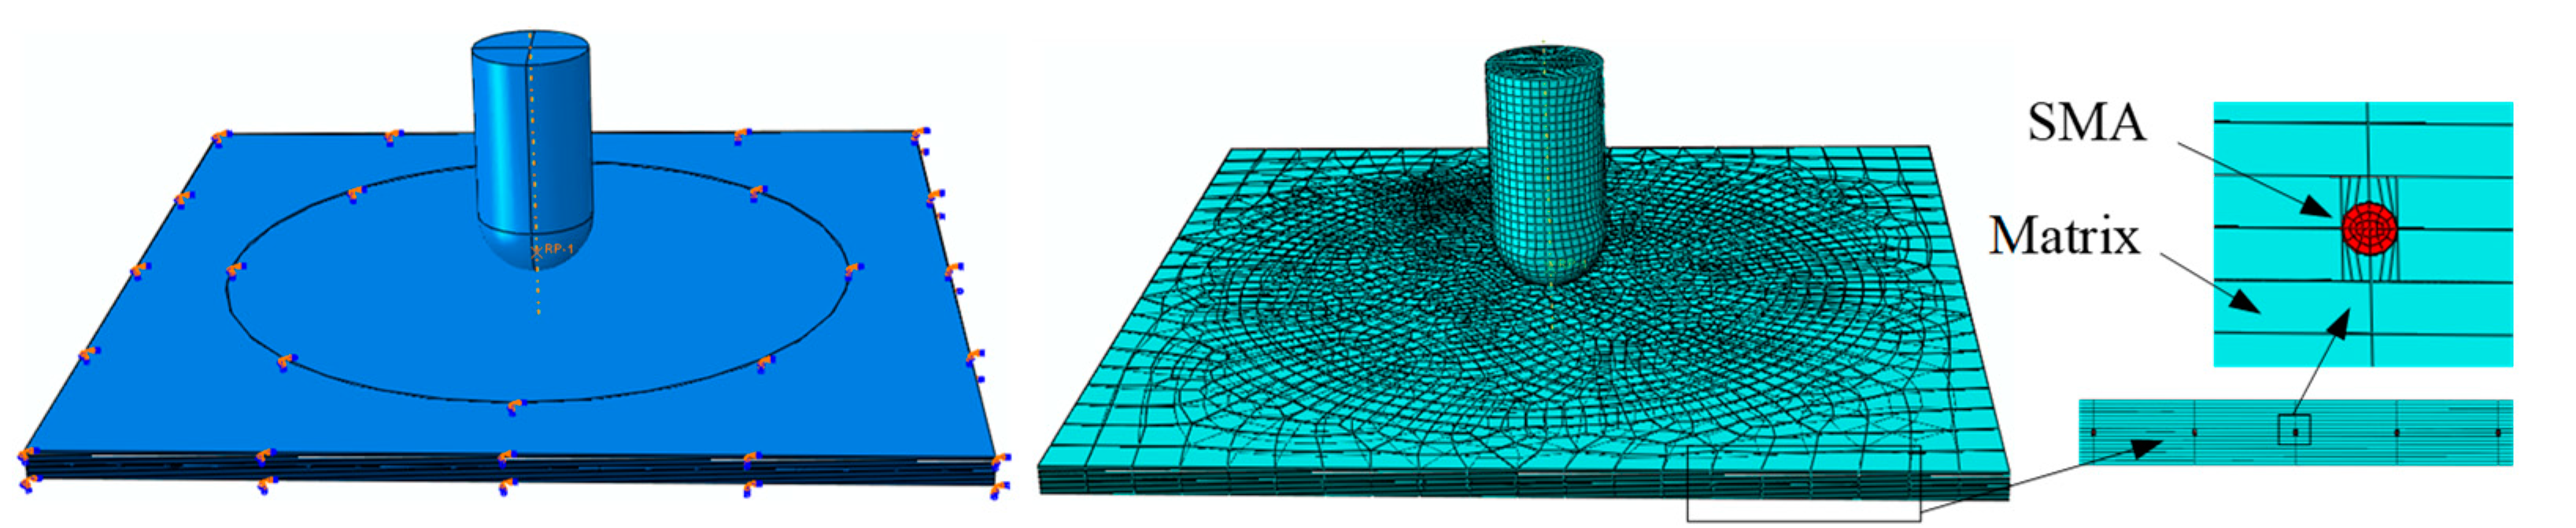
2.2.4. Modeling of Composite Laminates

The finite element model of SMA-reinforced composite laminates is generated and analyzed by ABAQUS/Explicit, and the FE model of composite laminates is identical to the experimental setup (see Figure 1). Here, the impactor is modeled as a cylindrical rigid body, and since the mass density of the spherical impactor is 7800 kg/m3, the mass density of the cylindrical impactor entered in Abaqus should be converted to 2012903 kg/m3 based on the actual model shape and size of the impactor. The fixed boundary condition is adopted with 48 fully constrained supports that are applied symmetrically to the upper and lower surfaces at the edges of the specimen and the circular rings clamp regions, and the displacements and rotation angles in the x, y, and z direction are all set as zero. Fiber and resin are considered as a whole, and SMA wires are used as reinforcement; both are meshed using an eight-node linear brick, reduced integration hourglass control (C3D8R). Furthermore, to improve computational efficiency and reduce computational time, the accuracy of the mesh sizes and densities is needed. It should be noted that some mesh elements will be eliminated from analysis, such as when a specified mesh element lost its load capability and was accompanied by significant deformation after the impact. Figure 4 shows the finite element model of the laminate under impact loading. Figure 5 shows the schematic diagram of different types of laminates under different impact energies.

3. Results and Discussions

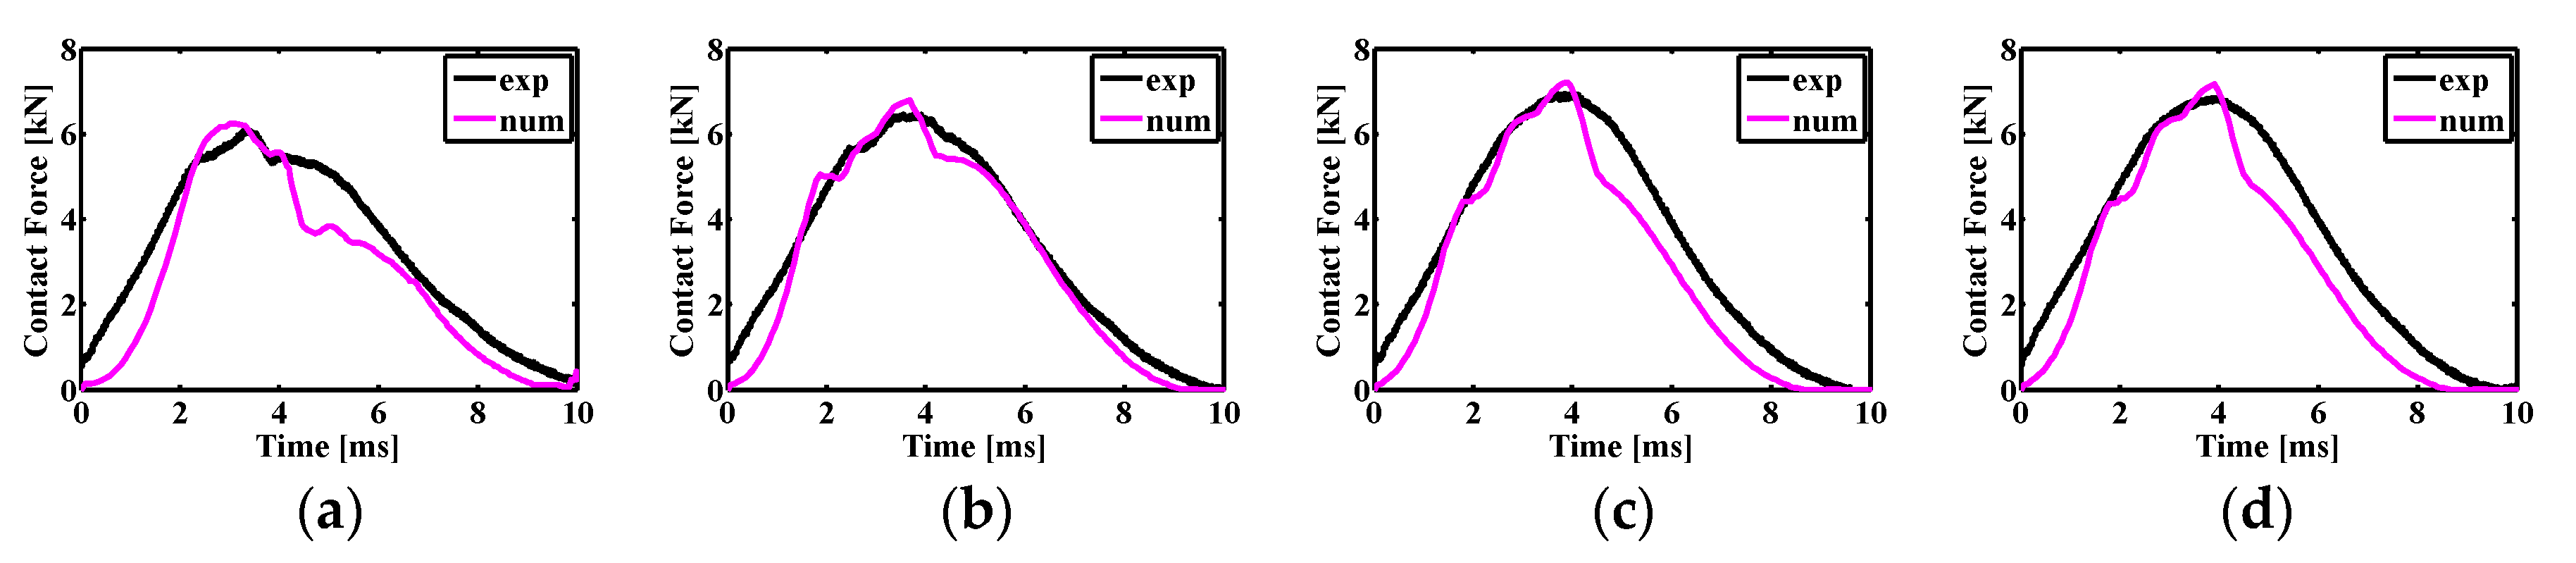
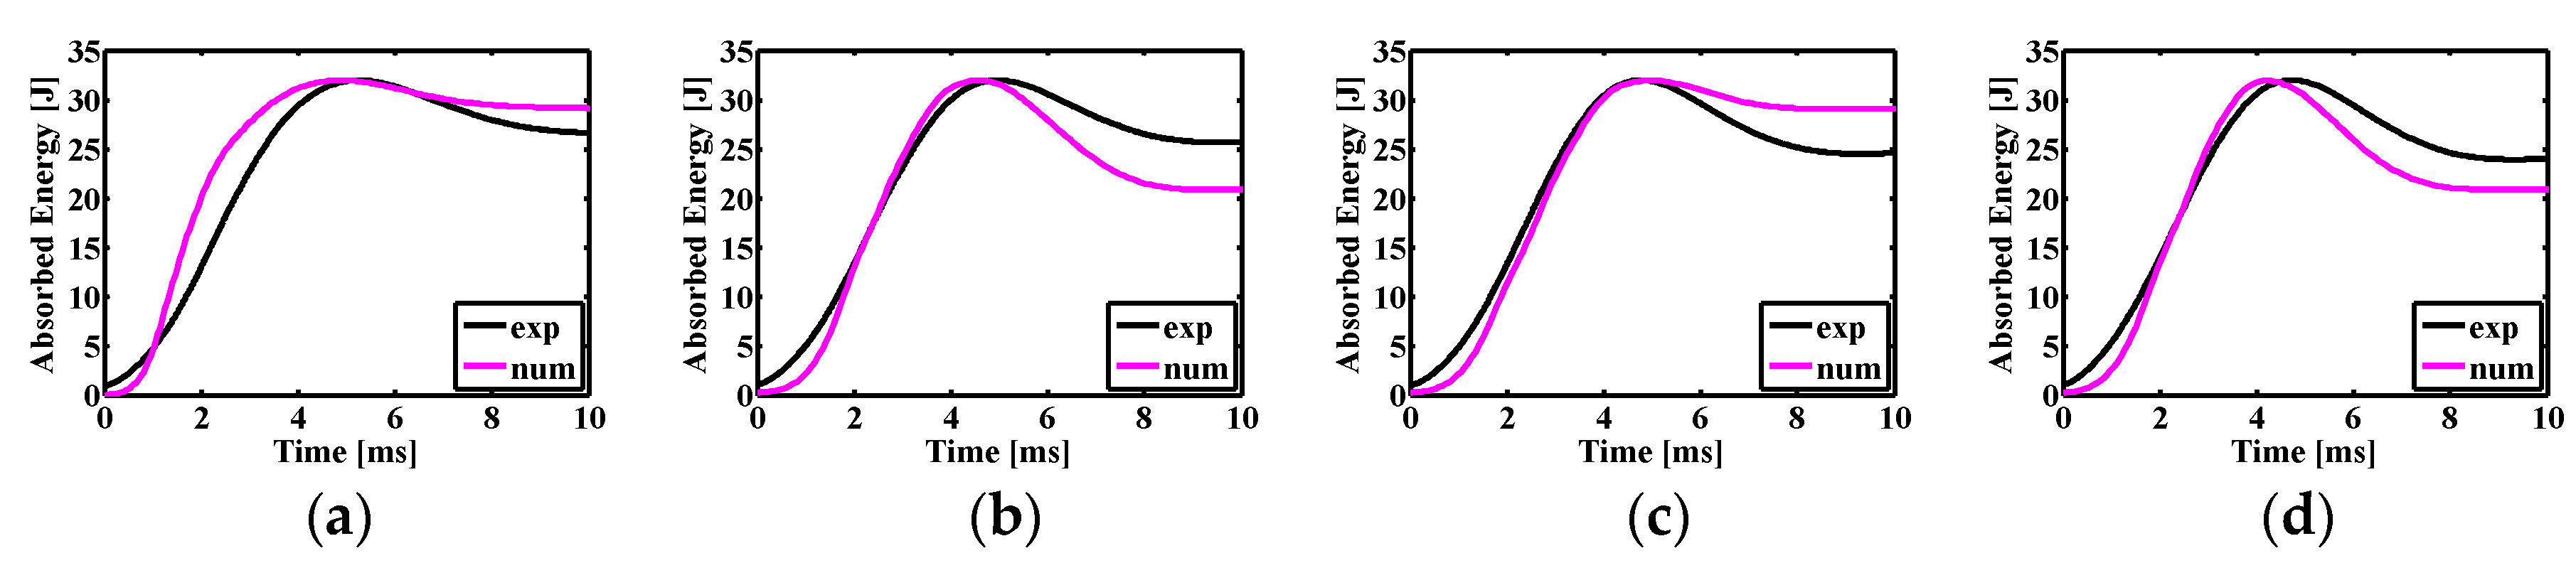
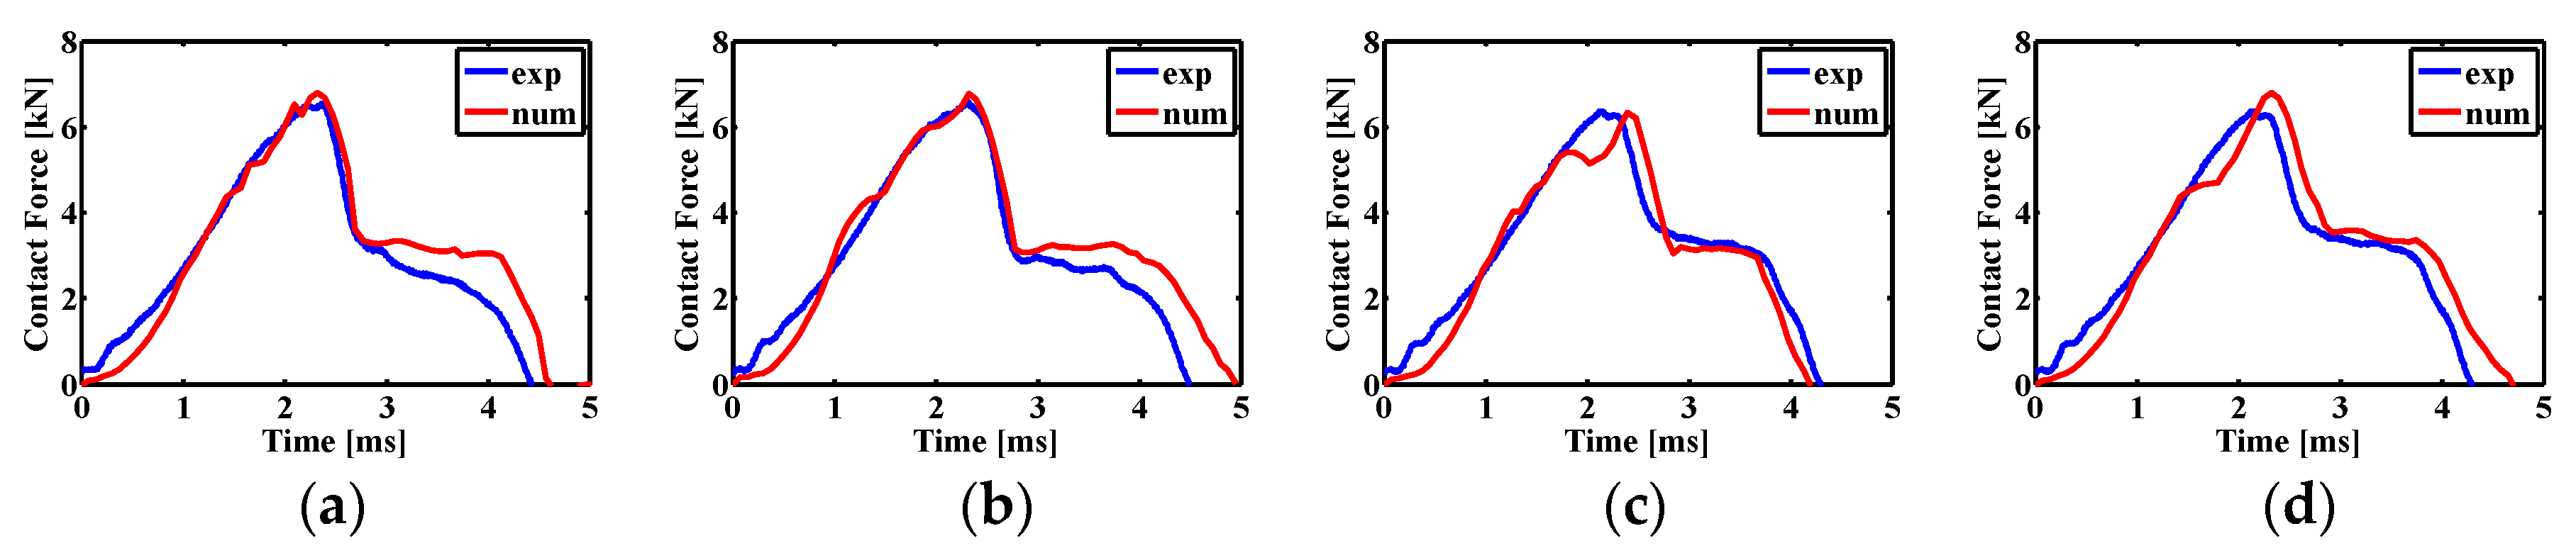
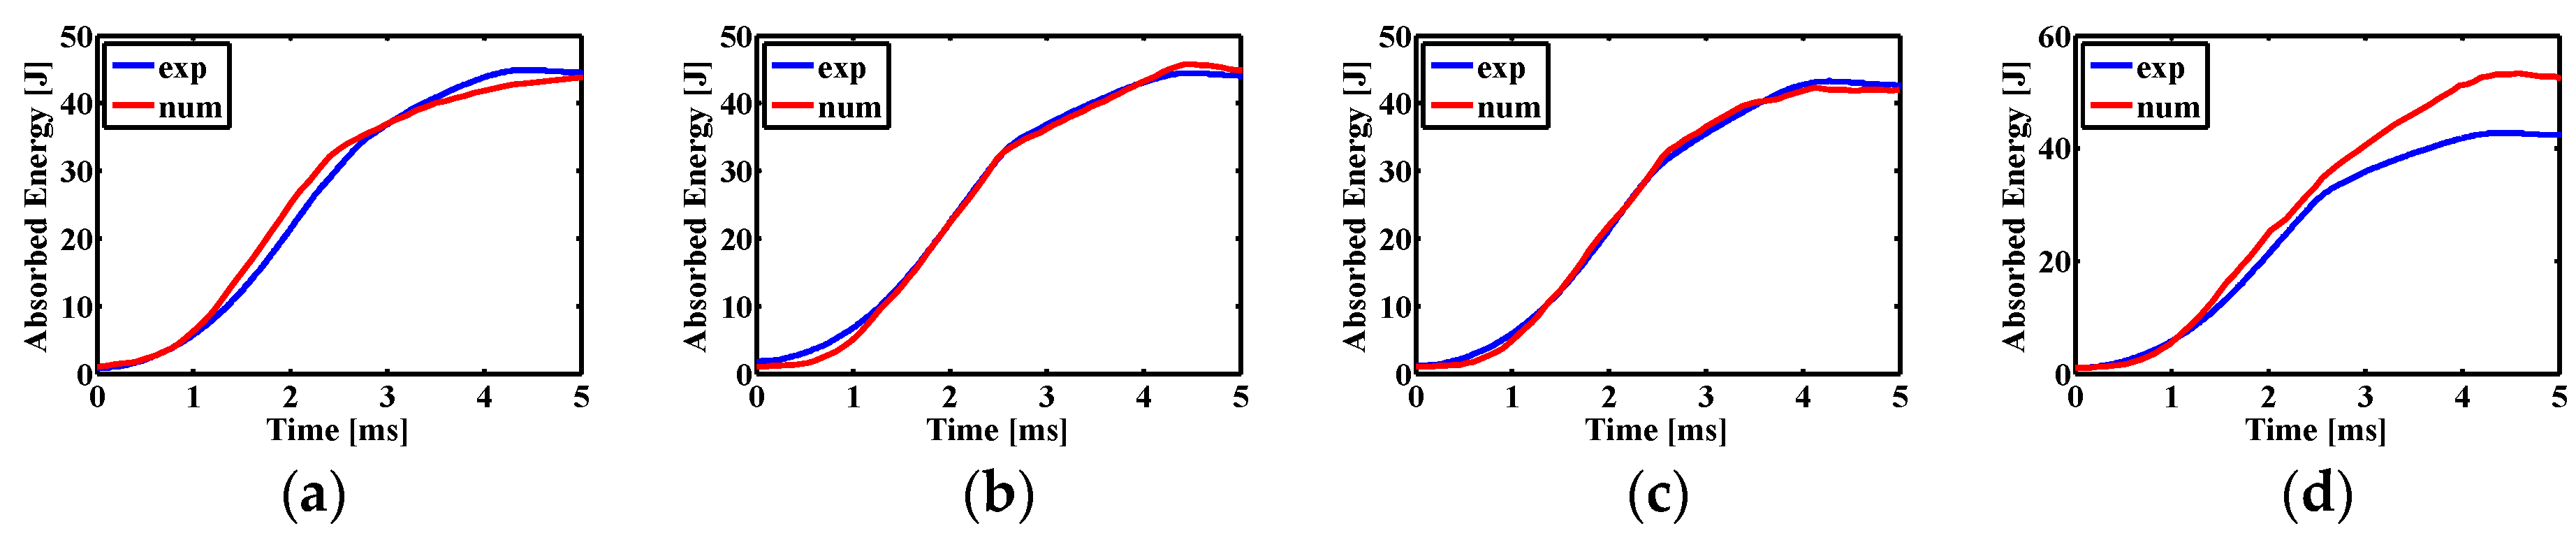
3.1. Impact Dynamics

The contact force and absorbed energy are two important parameters in low-velocity impact analysis process. Therefore, the contact force histories and absorbed energy histories from the experiments and simulations are clearly presented in this section.
The typical force–time (f-t) history curve consists of an ascending section of loading until reaching a peak force, and a descending section of unloading. In the f-t curve, the oscillations demonstrate the possibility of failures in the material caused by the reduced stiffness of the material, and no sudden force drop implies that the material have higher resistance under low-velocity impact. The peak force on the f-t curve is an important index to evaluate the load capacity of composite laminates after impact. Before reaching the peak force value, the smooth trend on the f-t curve represents the elastic response of composite laminates, and the first sudden force drop reveals the development of a crack on the impacted side of composite laminates or the occurrence of delamination. After reaching the peak force value, a sudden drop in the magnitude of force indicates the occurrence of perforation on the impacted side of composite laminates.
Figure 6 shows the typical force–time history curves for different laminates from experimental and numerical results for the case of 32 J of impact energy, and (a)-(d) indicate the laminate types of I, II, III and IV, respectively. As seen from Figure 6, the f-t curve obtained by numerical simulations matches well with the f-t curve obtained by experiments, except for that of the laminate of [0/90]8. It is remarkable that the numerical simulation can predict the peak force values well in all specimens, and the level of peak force values obtained from numerical calculations is almost identical to the level of peak force values obtained from experimental tests. Moreover, in terms of peak force, the laminate-stitched SMAs have a larger load capacity than the laminate-unstitched SMAs. In terms of the trend of the f-t curve, the laminate-stitched SMAs have smaller damages than the laminate-unstitched SMAs.
The absorbed energy of composite laminates is relevant to the area under the force–time history curve, which can be calculated by the following equation:
E a = V 0 0 t F t d t 1 2 m ( V 0 V t ) 2  
where E a is the absorbed energy of composite laminates subjected to low-velocity impact, V 0 and m are the impactor’s initial velocity and mass, respectively, and F t and V t are the impact force and impact velocity at time t , respectively.
Figure 7 show the absorbed energy–time (e-t) history curves for different laminates from experimental and numerical results for the case of 32 J of impact energy, and (a)-(d) indicate the laminate types of I, II, III and IV, respectively. As seen from Figure 7, the e-t curve obtained by numerical simulations does not match very well with the e-t curve obtained by experiments. It is also found that the maximum absorbed energy values are predicted well in all of the test specimens, and the level of the maximum absorbed energy values obtained from the numerical calculations is almost identical to the level of the maximum absorbed energy values obtained from experimental tests. However, the absorbed energy in the final state is not well-predicted. It is remarkable that the numerical simulation can predict the maximum absorbed energy values, but it does not predict the ultimate energy absorption capacity of composite laminates specimens well in the no-perforation condition of the 32-J case.
In order to quantitatively capture the load-carrying capacity and energy absorption characteristics of the composite plate specimen, the specific values of peak force and absorbed energy for different laminates for the case of 32-J impact energy are listed in Table 5.
Figure 8 and Figure 9 show the typical force–time history curves and absorbed energy–time history curves for different laminates from experimental and numerical results for the case of 64-J impact energy, and (a)-(d) indicate the laminate types of V, VI, VII and VIII, respectively. As seen from Figure 8 and Figure 9, the f-t curve obtained by numerical simulations match well with the f-t curve obtained by the experiments in all of the specimens, and the e-t curve obtained by the numerical simulations matches well with the e-t curve obtained by experiments, except for the laminate type of [0/SMA/90/(0/90)3/SMA/(0/90)4]. Moreover, it is found that the FE model has better conformity with the experimental results in the perforation condition of the 64-J case than in the non-perforation condition of the 32-J case.
In order to quantitatively represent the carrying capacity and energy absorption characteristics, the specific values of peak force and absorbed energy for different laminates for the case of 64-J impact energy are listed in Table 6.

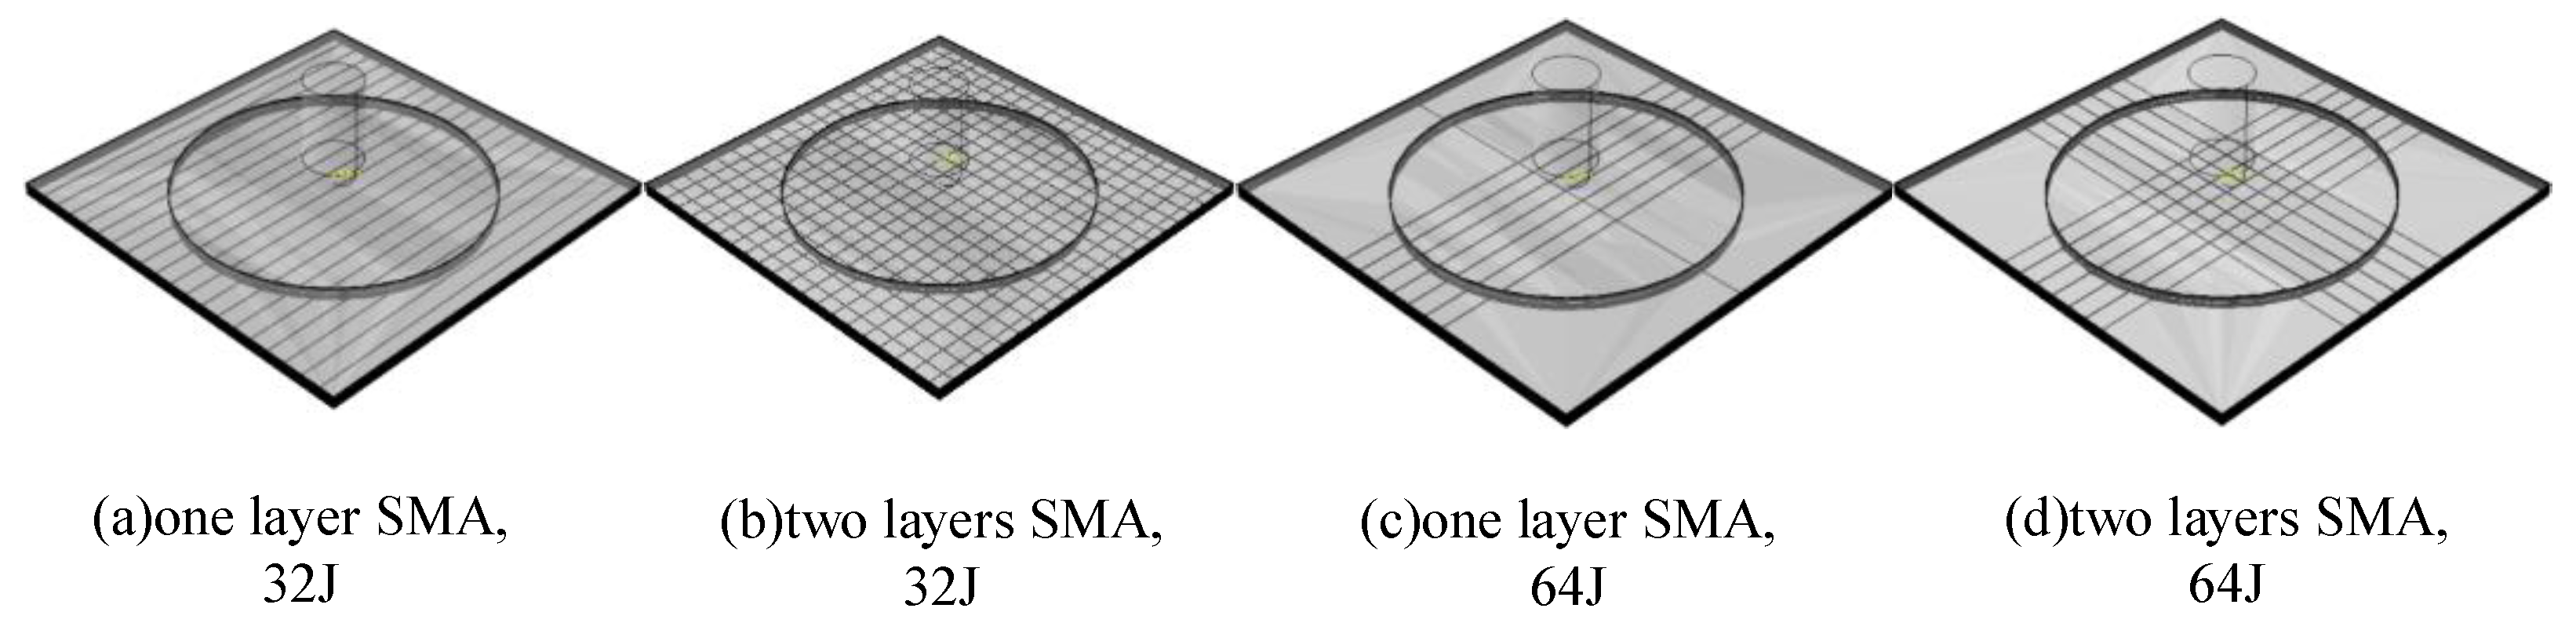
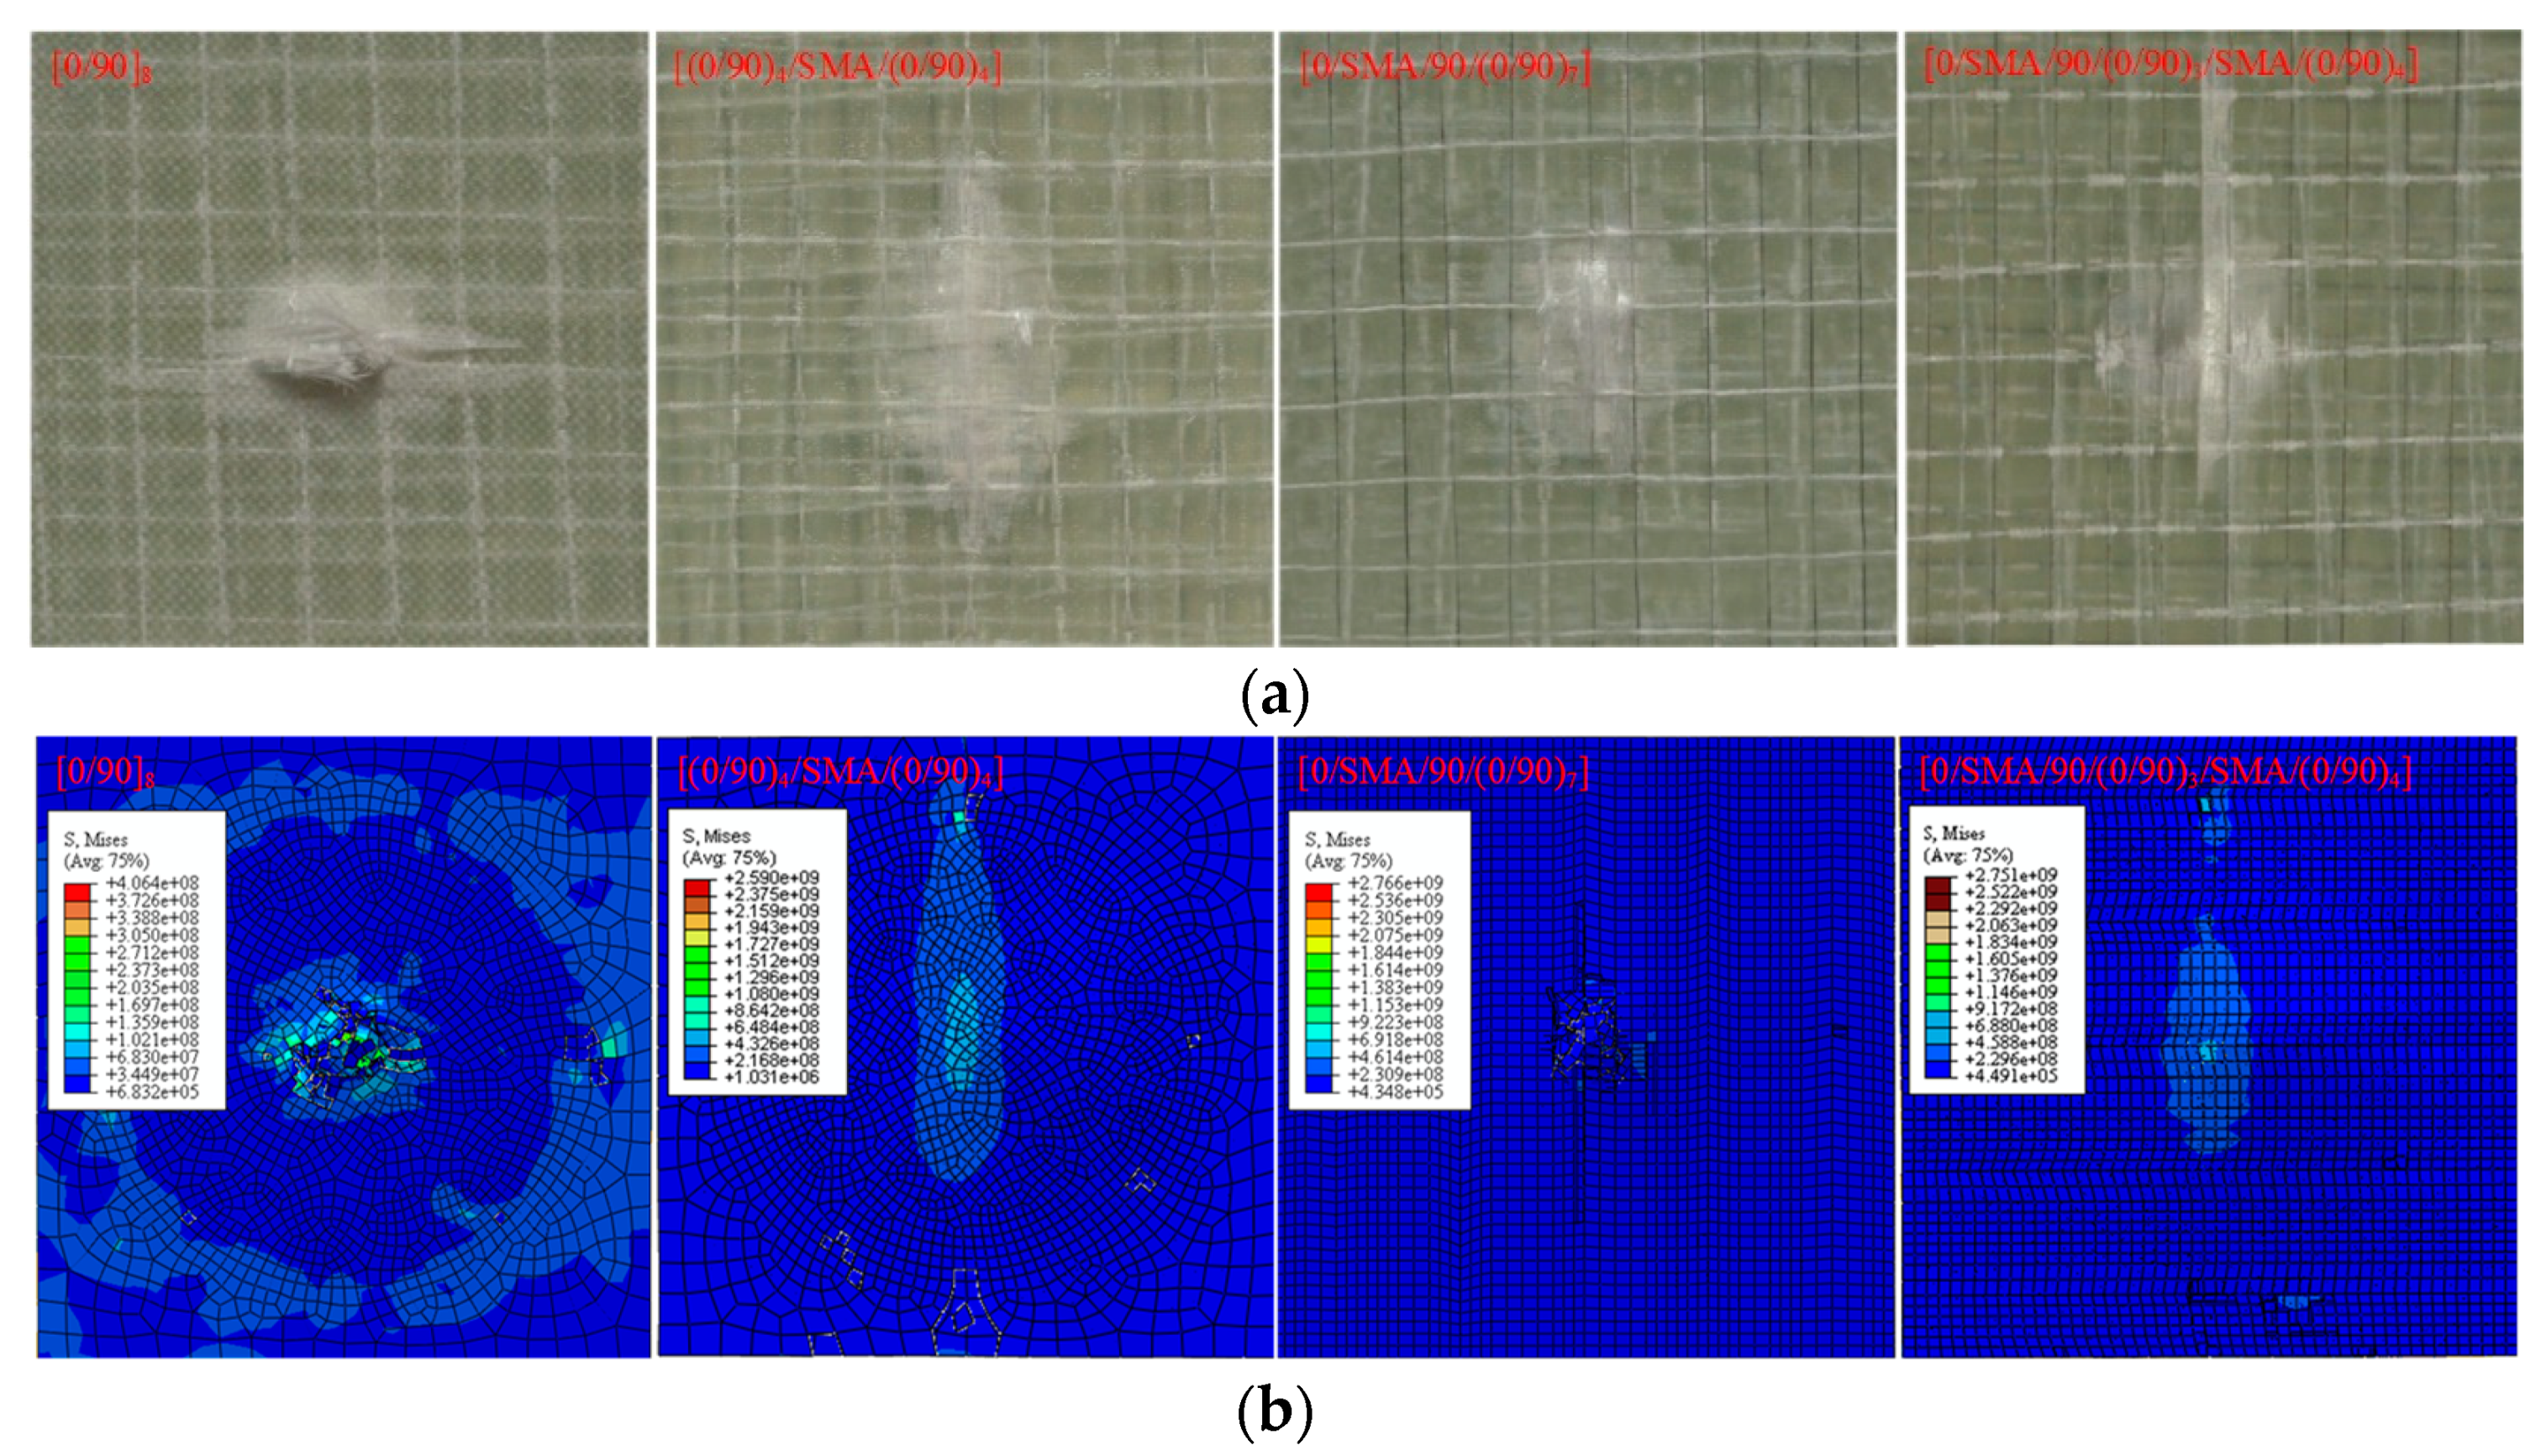
3.2. Damage Morphology

Figure 10 shows the damage comparison diagram for different laminates from the experimental and numerical results for the case of 32-J of impact energy. As seen from Figure 10, the damage diagrams of all of the composite laminates obtained by numerical simulations match well with those obtained by experiments. Besides, in terms of damage morphology, the laminate-stitched SMAs have smaller damage than the laminate-unstitched SMAs in the 32-J perforation condition.
Figure 11 shows the damage comparison diagram for different laminates from experimental and numerical results for the case of 64-J impact energy. As seen from Figure 11, the damage diagrams of all of the composite laminates obtained by numerical simulations match well with those obtained by experiments.

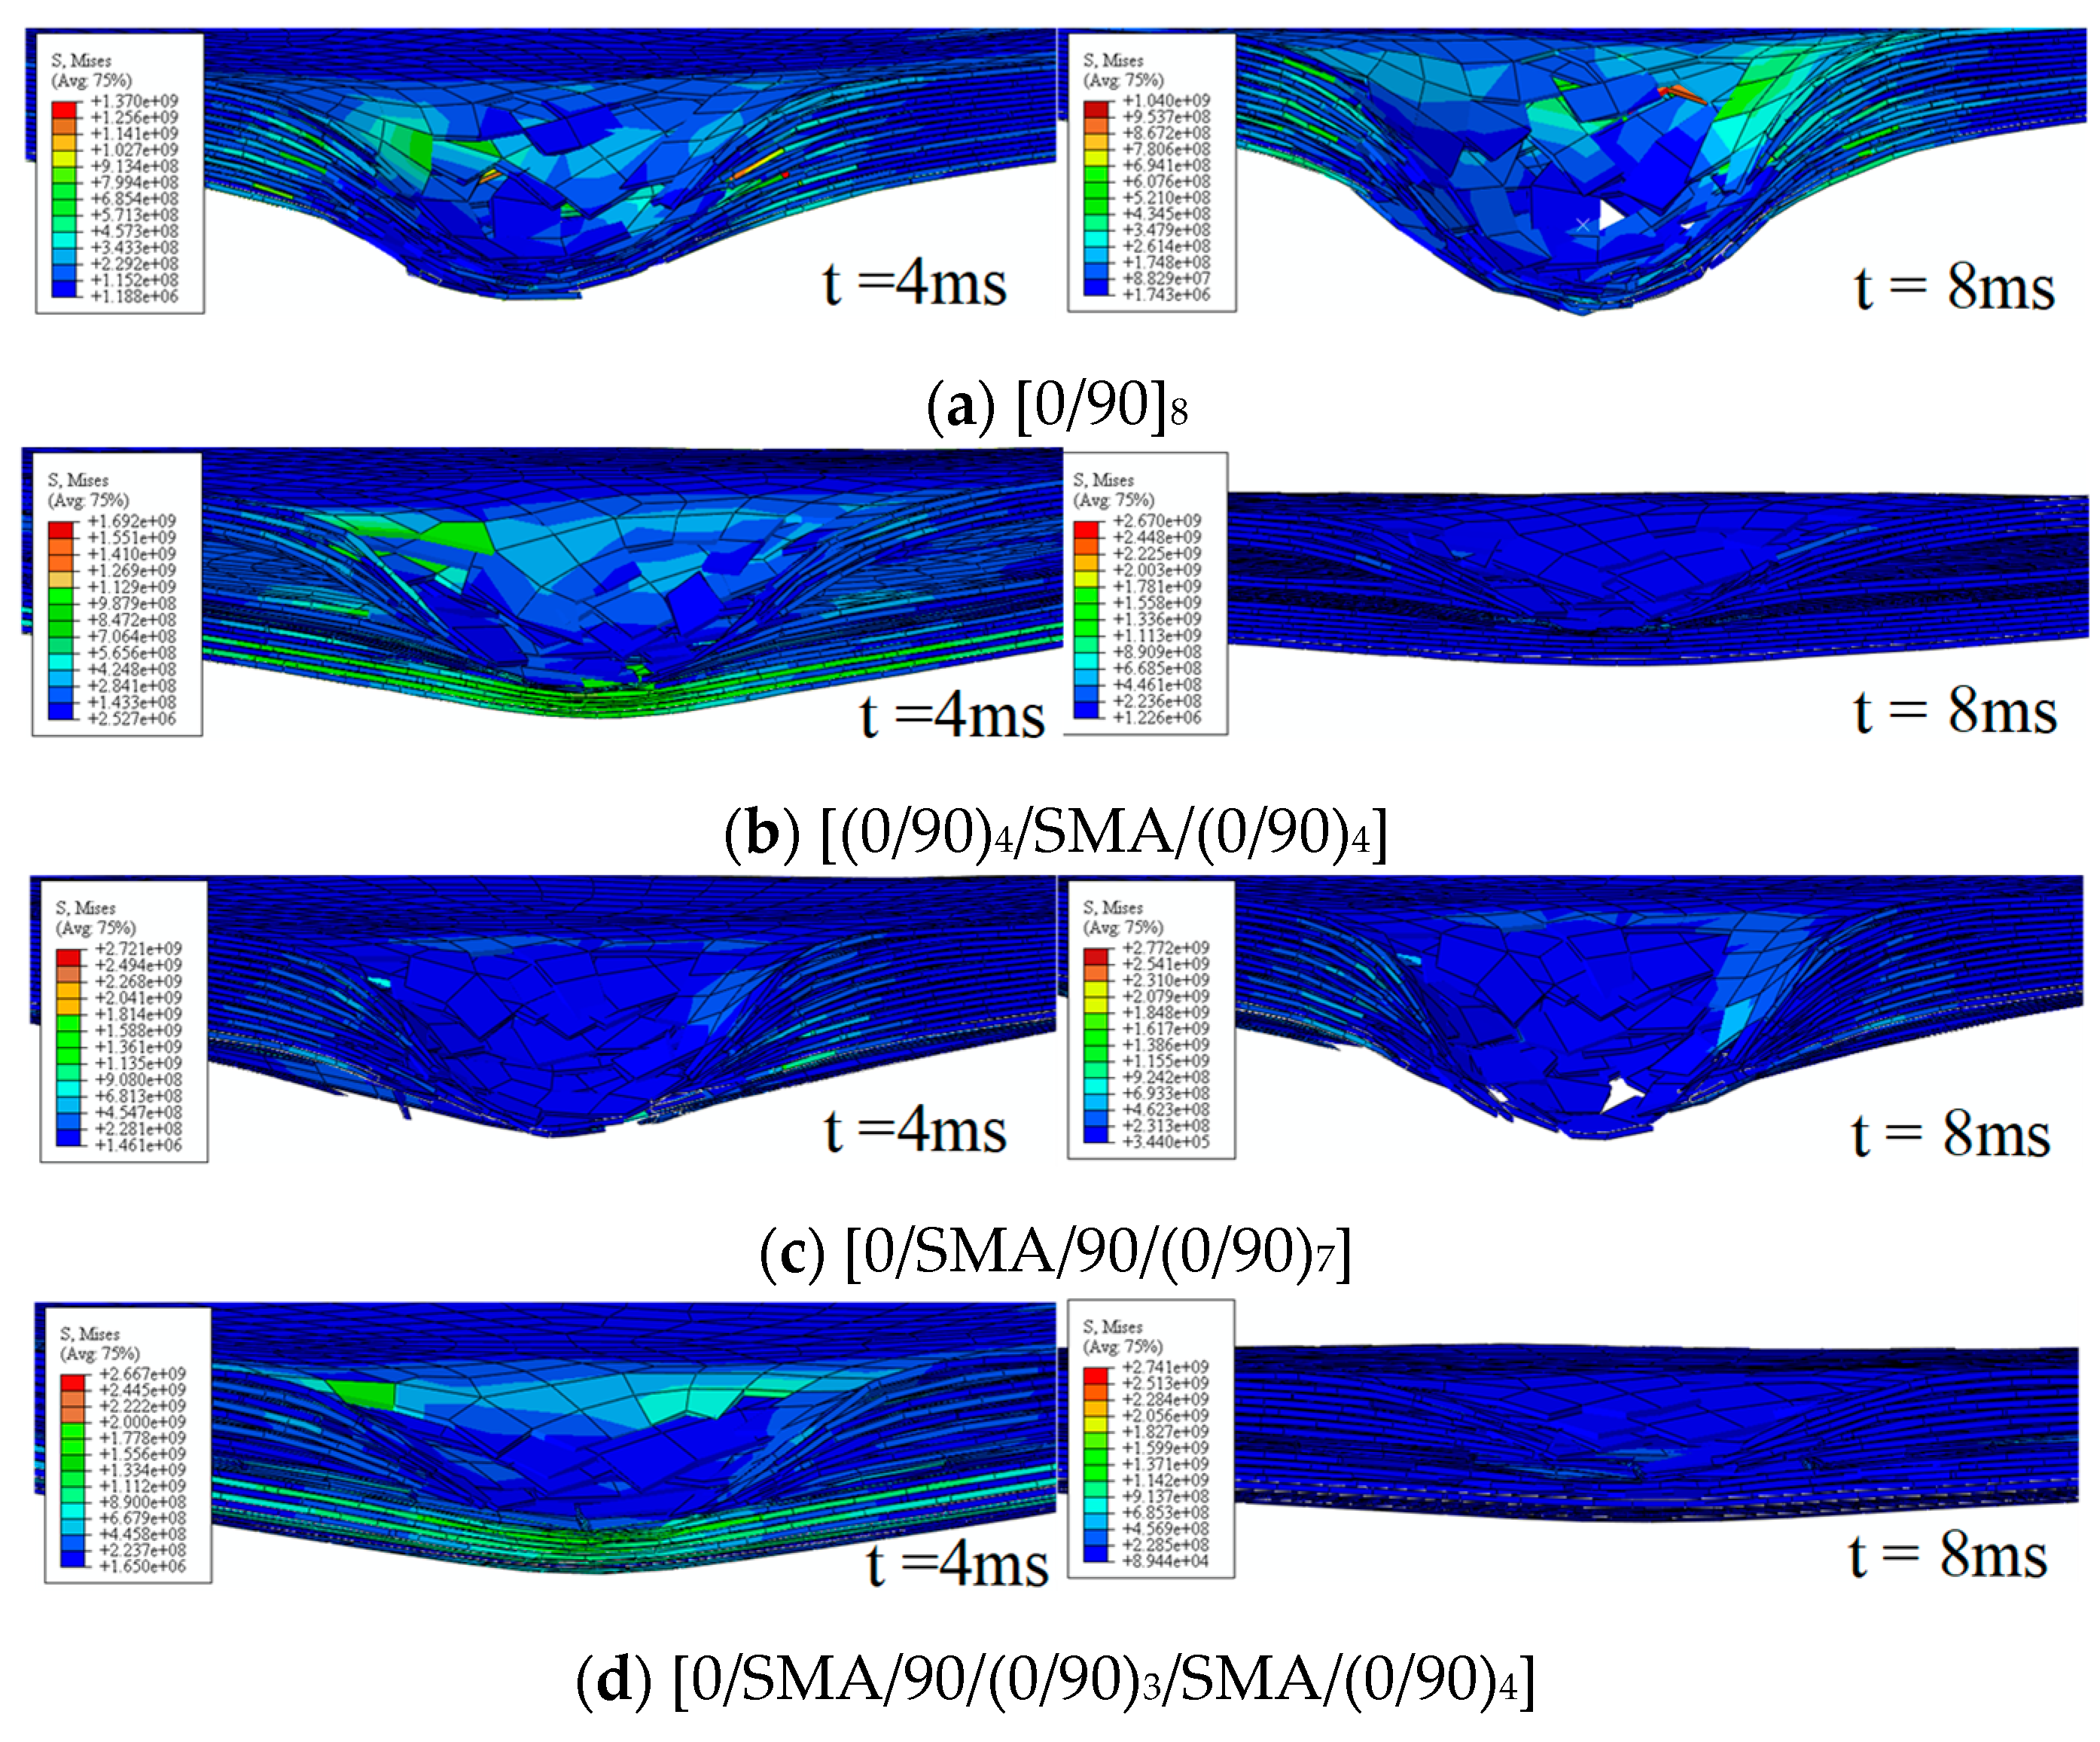
3.3. Impact Damage Mechanism

There are two types of impact damages in composite laminates: intra-ply damage and inter-ply damage. The intra-ply damage includes pull-out, matrix crack, fiber/matrix, debonding, and fiber breakage, and the inter-ply damage includes delamination [30,31]. Pull-out occurs due to the weaker interface between the fiber and matrix. Matrix cracks initiate at the upper layers of laminate that are in contact with the impactor, and are usually oriented in planes that are parallel to the fiber direction in unidirectional fiber composites. Fiber/matrix debonding occurs when the fiber is pulled out from the matrix. Fiber breakage occurs later than matrix crack and delamination in the impact process, and it is a precursor to catastrophic penetration mode. Delamination is caused by transverse impact after reaching a certain energy, and it develops in the presence of a matrix crack.
Figure 12 shows the cross-section contour plot of the Mises stress of composite laminates for the case of 32-J impact energy. The contour plot of Mises stress represents the stress distribution of composite laminates, and the von Mises stress is used to predict the yielding of materials under complex loading. From the contour plot of Mises stress, it can be seen that there is a write blank area, which refers to the failure elements that have been deleted. At the time of 4 ms, the laminate with stacking sequence [0/90]8 (Figure 12a) and [0/SMA/90/(0/90)7] (Figure 12c) show the damages, including indentation, matrix crack, delamination, and fiber breakage. The laminate with stacking sequence [(0/90)4/SMA/(0/90)4] (Figure 12b) and [0/SMA/90/(0/90)3/SMA/(0/90)4] (Figure 12d) represents the damages, including indentation, matrix crack, and delamination, without fiber breakage. At the time of 8 ms, the laminate with stacking sequence [0/90]8 (Figure 12a) and [0/SMA/90/(0/90)7] (Figure 12c) shows further, more serious damages compared that at 4 ms. However, the laminate with stacking sequence [(0/90)4/SMA/(0/90)4] (Figure 12b) and [0/SMA/90/(0/90)3/SMA/(0/90)4] (Figure 12d) represent smaller damages compared with those at the time of four ms. Furthermore, most of the Mises stress measurement data at the time of 8 ms in Figure 12b–d are smaller than the Mises stress values at the time of 4 ms. This is mainly due to the SMAs playing an active role in the impact process, which recovers part of the elastic strain of composite laminates in the non-perforation case. The other reason for different Mises stress values is because of the different stiffness of composite laminates in various directions.
Figure 13 shows the cross-section contour plot of Mises stress of composite laminates for the case of 64-J impact energy. In contour plot of Mises stress, the elements that reached yield strength have been also deleted. At the time of 1 ms, the damages status of all of the composite laminates show almost no difference, which is the early elastic stage in the impact process. At the time of 2.5 ms, the Mises stress values exhibit a significant difference in different laminate types. At the time of 4.5 ms, all of the composite laminates show delamination and fiber breakages, whereas the laminate-stitched SMAs have much smaller damage than the laminate-unstitched SMAs. In addition, the laminate with stacking sequence [(0/90)4/SMA/(0/90)4] exhibits SMAs bucking, which shows that part of the SMAs cannot recover in the impact perforation stage. The laminate with stacking sequence [0/SMA/90/(0/90)7] exhibits more serious damage than the laminate with stacking sequence [(0/90)4/SMA/(0/90)4]; this is because embedding SMAs into the bottom of the laminate tears the bottom surface layer more easily. The laminate with stacking sequence [0/SMA/90/(0/90)3/SMA/(0/90)4] exhibits smaller damage compared to the laminate with stacking sequence [(0/90)4/SMA/(0/90)4] and [0/SMA/90/(0/90)7]. This shows that the load capacity and impact resistance of two layers of laminate-stitched SMAs is better than one layer of laminate-stitched SMA.

4. Conclusions

Based on the above analysis, we may draw the following conclusions:
(1)
The reported numerical results show a reasonable agreement with the experimental results.
(2)
Local indentation, delamination, and matrix crack are the main damage mechanisms of composite laminates at the initial stage of the impact, and fiber breakage occurs later than matrix fracture and delamination during the impact penetration process.
(3)
For the case of 32-J impact energy, impact damages are mainly caused by matrix cracks and delamination in the interlayers or the SMA–composite interface of composite laminates. For the case of 64-J impact energy, impact damages are mainly caused by fiber breakage in composite laminates.
(4)
The impact resistance property of composite laminates can be significantly improved by embedding the SMA wires into the composites.

Author Contributions

M.S. conceived, designed and performed the numerical simulation, wrote and revised the paper; M.C. analyzed the data; Z.W. provided the funding; H.L. performed the modeling guidance; X.S. modified the language of the manuscript.

Funding

This work is financially supported by the National Natural Science Foundation of China, grant number 11472086.

Conflicts of Interest

The authors declare no conflict of interest.

References

  1. Haider, M.F.; Majumdar, P.K.; Angeloni, S.; Reifsnider, K.L. Nonlinear anisotropic electrical response of carbon fiber-reinforced polymer composites. J. Compos. Mater. 2018, 52, 1017–1032. [Google Scholar] [CrossRef]
  2. Atas, C.; Sayman, O. An overall view on impact response of woven fabric composite plates. Compos. Struct. 2008, 82, 336–345. [Google Scholar] [CrossRef]
  3. Sevkat, E.; Liaw, B.; Delale, F. Drop-weight impact response of hybrid composites impacted by impactor of various geometries. Mater. Des. 2013, 52, 67–77. [Google Scholar] [CrossRef]
  4. De Moura, M.; Marques, A.T. Prediction of low velocity impact damage in carbon epoxy laminates. Compos. A Appl. Sci. Manuf. 2002, 33, 361–368. [Google Scholar] [CrossRef]
  5. Buehler, W.J.; Gilfrich, J.V.; Wiley, R.C. Effect of low-temperature phase changes on the mechanical properties of alloys near composition TiNi. J. Appl. Phys. 1963, 34, 1475–1477. [Google Scholar] [CrossRef]
  6. Buehler, W.J.; Wiley, R.C. Nickel-Base Alloys. U.S. Patent 3174851, 1965. [Google Scholar]
  7. Lagoudas, D.C. Shape Memory Alloys; Springer: Boston, MA, USA, 2008; ISBN 978-0-387-47685-8. [Google Scholar]
  8. Aurrekoetxea, J.; Zurbitu, J.; de Mendibil, I.O.; Agirregomezkorta, A.; Sánchez-Soto, M.; Sarrionandia, M. Effect of superelastic shape memory alloy wires on the impact behavior of carbon fiber reinforced in situ polymerized poly (butylene terephthalate) composites. Mater. Lett. 2011, 65, 863–865. [Google Scholar] [CrossRef]
  9. Kang, K.W.; Kim, J.K. Effect of shape memory alloy on impact damage behavior and residual properties of glass/epoxy laminates under low temperature. Compos. Struct. 2009, 88, 455–460. [Google Scholar] [CrossRef]
  10. Pappadà, S.; Gren, P.; Tatar, K.; Gustafson, T.; Rametta, R.; Rossini, E.; Maffezzoli, A. Mechanical and vibration characteristics of laminated composite plates embedding shape memory alloy superelastic wires. J. Mater. Eng. Perform. 2009, 18, 531–537. [Google Scholar] [CrossRef]
  11. Pappadà, S.; Rametta, R.; Toia, L.; Coda, A.; Fumagalli, L.; Maffezzoli, A. Embedding of superelastic SMA wires into composite structures: Evaluation of impact properties. J. Mater. Eng. Perform. 2009, 18, 522–530. [Google Scholar] [CrossRef]
  12. Roh, J.H.; Kim, J.H. Hybrid smart composite plate under low velocity impact. Compos. Struct. 2002, 56, 175–182. [Google Scholar] [CrossRef]
  13. Tsoi, K.A.; Stalmans, R.; Schrooten, J.; Wevers, M.; Mai, Y.W. Impact damage behaviour of shape memory alloy composites. Mater. Sci. Eng. A 2003, 342, 207–215. [Google Scholar] [CrossRef]
  14. Paine, J.S.N.; Rogers, C.A. The response of SMA hybrid composite materials to low velocity impact. J. Intell. Mater. Syst. Struct. 1994, 5, 530–535. [Google Scholar] [CrossRef]
  15. Meo, M.; Antonucci, E.; Duclaux, P.; Giordano, M. Finite element simulation of low velocity impact on shape memory alloy composite plates. Compos. Struct. 2005, 71, 337–342. [Google Scholar] [CrossRef]
  16. Kim, E.H.; Lee, I.; Roh, J.H.; Choi, R.H.; Koo, K.N. Effects of shape memory alloys on low velocity impact characteristics of composite plate. Compos. Struct. 2011, 93, 2903–2909. [Google Scholar] [CrossRef]
  17. Shariyat, M.; Hosseini, S.H. Accurate eccentric impact analysis of the preloaded SMA composite plates, based on a novel mixed-order hyperbolic global–local theory. Compos. Struct. 2015, 124, 140–151. [Google Scholar] [CrossRef]
  18. Birman, V.; Chandrashekhara, K.; Sain, S. An approach to optimization of shape memory alloy hybrid composite plates subjected to low-velocity impact. Compos. Part. B Eng. 1996, 27, 439–446. [Google Scholar] [CrossRef]
  19. Khalili, S.M.R.; Shokuhfar, A.; Malekzadeh, K.; Ghasemi, F.A. Low-velocity impact response of active thin-walled hybrid composite structures embedded with SMA wires. Thin. Wall. Struct. 2007, 45, 799–808. [Google Scholar] [CrossRef]
  20. Shariyat, M.; Niknami, A. Impact analysis of strain-rate-dependent composite plates with SMA wires in thermal environments: Proposing refined coupled thermoelasticity, constitutive, and contact models. Compos. Struct. 2016, 136, 191–203. [Google Scholar] [CrossRef]
  21. Sun, M.; Wang, Z.Q.; Yang, B.; Sun, X.K. Experimental investigation of GF/epoxy laminates with different SMAs positions subjected to low-velocity impact. Compos. Struct. 2017, 171, 170–184. [Google Scholar] [CrossRef]
  22. Hashin, Z.; Rotem, A. A fatigue failure criterion for fiber reinforced materials. J. Compos. Mater. 1973, 7, 448–464. [Google Scholar] [CrossRef]
  23. Hashin, Z. Failure Criteria for Unidirectional Fiber Composites. Int. J. Appl. Mech. 1980, 47, 329–334. [Google Scholar] [CrossRef]
  24. Puck, A.; Schürmann, H. Failure analysis of FRP laminates by means of physically based phenomenological models. Compos. Sci. Technol. 1998, 58, 1045–1067. [Google Scholar] [CrossRef]
  25. Shi, Y.; Swait, T.; Soutis, C. Modelling damage evolution in composite laminates subjected to low velocity impact. Compos. Struct. 2012, 94, 2902–2913. [Google Scholar] [CrossRef]
  26. Benzeggagh, M.L.; Kenane, M. Measurement of mixed-mode delamination fracture toughness of unidirectional glass/epoxy composites with mixed-mode bending apparatus. Compos. Sci. Technol. 1996, 56, 439–449. [Google Scholar] [CrossRef]
  27. Lopes, C.S.; Camanho, P.P.; Gürdal, Z.; Maimí, P.; González, E.V. Low-velocity impact damage on dispersed stacking sequence laminates. Part II: Numerical simulations. Compos. Sci. Technol. 2009, 69, 937–947. [Google Scholar] [CrossRef]
  28. Camanho, P.P.; Davila, C.G. Mixed-Mode Decohesion Finite Elements for the Simulation of Delamination in Composite Materials; NASA/TM-2002-211737; NASA Langley Research Center: Hampton, VA, USA, June 2002. [Google Scholar]
  29. Feng, D.; Aymerich, F. Finite element modelling of damage induced by low-velocity impact on composite laminates. Compos. Struct. 2014, 108, 161–171. [Google Scholar] [CrossRef]
  30. Anderson, T.L. Fracture Mechanics-Fundamentals and Applications; CRC Press: New York, NY, USA, 1995. [Google Scholar]
  31. Abrate, S. Impact Engineering of Composite Structures; Springer Science & Business Media: Berlin, Germany, 2011. [Google Scholar]
Figure 1. Schematic diagram of stacking sequence of hybrid composite laminates and impact region. SMA: shape memory alloy.
Applsci 08 02405 g001
Figure 2. Stress–strain diagram of Ni–Ti shape memory alloy wires.
Applsci 08 02405 g002
Figure 3. Typical traction–separation response.
Applsci 08 02405 g003
Figure 4. Finite element model of composite laminate under impact loading.
Applsci 08 02405 g004
Figure 5. Schematic diagram of different types of laminates under different impact energies.
Applsci 08 02405 g005
Figure 6. The comparison plots of force–time from experimental and numerical results for the case of 32 J of impact energy.
Applsci 08 02405 g006
Figure 7. The comparison plots of energy–time from experimental and numerical results for the case of 32 J of impact energy.
Applsci 08 02405 g007
Figure 8. The comparison plots of force–time from experimental and numerical results for the case of 64-J impact energy.
Applsci 08 02405 g008
Figure 9. The comparison plots of energy–time from experimental and numerical results for the case of 64-J impact energy.
Applsci 08 02405 g009
Figure 10. Comparison of non-impacted side diagram for the case of 32-J impact energy. (a) Results of experimental tests; (b) Results of numerical calculations.
Applsci 08 02405 g010
Figure 11. Comparison of non-impacted side diagram for the case of 64-J impact energy. (a) Results of experimental tests; (b) Results of numerical calculations.
Applsci 08 02405 g011
Figure 12. Cross-section contour plot of Mises stress (Pa) of composite laminates in the damage process for the case of 32-J impact energy.
Applsci 08 02405 g012
Figure 13. Cross-section contour plot of Mises stress (Pa) of composite laminates in the damage process for the case of 64-J impact energy.
Applsci 08 02405 g013
Table 1. The relevant parameters of hybrid composite laminates and the initial impact energy.
Codes/Stacking SequenceLayer Number of SMAsRoot Number of SMAsInitial Impact Energy (J)
I: [0/90]80032
II: [(0/90)4/SMA/(0/90)4]121
III: [0/SMA/90/(0/90)7]121
IV: [0/SMA/90/(0/90)3/SMA/(0/90)4]242
V: [0/90]80064
VI: [(0/90)4/SMA/(0/90)4]15
VII: [0/SMA/90/(0/90)7]15
VIII: [0/SMA/90/(0/90)3/SMA/(0/90)4]210
Table 2. Yield stress versus equivalent plastic strain for the Ni–Ti SMA wires.
Yield stress (MPa)440.3455.1453.1455.1451.4453.1453.4
Equivalent plastic strain00.0320.0450.0600.0740.0820.092
Yield stress (MPa)457.1492.6624.1772.2952.41111.91226.3
Equivalent plastic strain0.1020.1110.1210.1300.1410.1510.160
Note: Density of SMA = 6417 kg/m3, Young’s modulus = 20.2 GPa, Poisson ratio = 0.3.
Table 3. The material parameters of composites used in finite element (FE) simulation.
Mechanical Constants (Symbols)Values
Young’s modulus ( E 1 , E 2 , E 3 )55.2 GPa, 18.4 GPa, 18.4 GPa
Poisson’s ratio ( υ 12 , υ 13 , υ 23 )0.269, 0.269, 0.428
Shear modulus ( G 12 , G 13 , G 23 )13.8 GPa, 13.8 GPa, 13.8 GPa
Ultimate tensile stress ( X T , Y T , Z T )1656 MPa, 73.8 MPa, 73.8 MPa
Ultimate compressive stress ( X C , Y C , Z C )1656 MPa, 91.8 MPa, 91.8 MPa
Ultimate shear stress ( S 12 , S 13 , S 23 )117.6 MPa, 117.6 MPa, 117.6 MPa
Table 4. The cohesive parameters values adopted in simulation.
SymbolsInterlayer InterfacesSMA–Layer Interfaces
Cohesive damage (GPa/m) K n n , K s s , K s s 15, 15, 151.5, 1.5, 1.5
Initiation (MPa) σ n 0 , τ s 0 , τ t 0 123, 96, 9612.3, 19.6, 19.6
Evolution (N/m) G n c , G s c , G t c 0.831, 1.99, 1.990.167, 0.398, 0.398
Table 5. The impact parameters of various laminates for experiment and simulation under 32-J impact energy.
Stacking SequenceExperimentsSimulations
Peak Force
(kN)
Absorbed
Energy (J)
Peak Force
(kN)
Absorbed
Energy (J)
[0/90]86.101226.20396.248029.0969
[(0/90)4/SMA/(0/90)4]6.466625.06166.784520.9080
[0/SMA/90/(0/90)7]6.937024.00087.216629.0764
[0/SMA/90/(0/90)3/SMA/(0/90)4]6.856923.27867.150620.9550
Table 6. The impact parameters of various laminates for experiment and simulation under 64-J impact energy.
Stacking SequenceExperimentsSimulations
Peak Force
(kN)
Absorbed
Energy (J)
Peak Force
(kN)
Absorbed
Energy (J)
[0/90]86.443845.34946.799145.1237
[(0/90)4/SMA/(0/90)4]6.568843.88376.777144.9752
[0/SMA/90/(0/90)7]6.360543.36526.341841.9943
[0/SMA/90/(0/90)3/SMA/(0/90)4]6.554943.07966.799152.7428

