Article

Finite Element Analysis of Thermal Stress and Thermal Deformation in Typical Part during SLM

1
School of Mechano-Electronic Engineering, Xidian University, Xi’an 710071, China
2
Shaanxi Key Laboratory of Surface Engineering and Remanufacturing, Xi’an University, Xi’an 710065, China
*
Author to whom correspondence should be addressed.
Appl. Sci. 2019, 9(11), 2231; https://doi.org/10.3390/app9112231
Submission received: 6 April 2019 / Revised: 17 May 2019 / Accepted: 28 May 2019 / Published: 30 May 2019

Abstract

:

Featured Application

Simulation of stress distribution and deformation in additive manufacturing.

Abstract

Selective laser melting (SLM) constitutes an additive manufacturing (AM) method. Many issues such as thermal strain and macro-thermal deformation, which are caused by the thermal stress of different process parameters, are not clear. In this paper, an efficient and fast manufacturing simulation method was researched based on a moving heat source model and an elastoplastic theory of welding simulation, which was studied based on the thermodynamic coupling algorithm with a software-developed application for the SLM process. Subsequently, typical case results of thin and hollow plate part formation and the corresponding performances were simulated in detail. The results demonstrated that the effective thermal stress increased as the layer height increased from the surface layer to the substrate, while the thermal strain followed an approximate change rule. In addition, the stress was released from the underlying substrate when the support was removed. Moreover, the largest single axis plane stress was changed from tension to compression from the edge to the center, finally reaching equilibrium. In particular, maximum macro thermal deformation occurred at the printed support structure to the samples, displaying similar results in other locations such as the corners. Finally, the effectiveness of the simulation could be verified from the realistic printed part, which could provide proof for the quality prediction of the part that is actually forming.

1. Introduction

Due to the complex processing technology of thin and hollow plate parts, negative production and material loss occur through traditional machining. However, technology, along with the development of additive manufacturing (AM), have become the preferred forming process plan for small quantities of complex parts [1,2]. Selective laser melting (SLM) is a typical rapid forming technology [1,3]. However, in practice, the metal powder is spread layer by layer followed by laser melting in SLM, which can produce a molten pool with a low-sized area and high temperature. Additionally, the temperature gradient is produced from high heat as well as being simultaneously transferred to the surrounding powder or printed body formation quickly [3,4,5], which makes the molten pool rapidly cool within microseconds. In addition, the molten pool shrinks, and thermal stress with the surrounding solid is produced under the interaction of condensation. When the stress is significantly high, macroscopic geometry deformation is produced, which is caused by the warping and cracking of the printed parts due to thermal stress. Therefore, a high number of printed parts failed to be produced, resulting in high amounts of material waste. Consequently, in this paper, the thermal field, thermal stress, and thermal deformation were researched, which were analyzed to develop the finite element method (FEM) analysis of welding.
Many scholars have studied molten pool formation and the temperature field mechanism [6,7,8,9,10,11]. Van et al. (2015) [6] reported that the temperature history could be measured with four thermocouples during experimentation, while the curves between experimental and numerical temperatures were compared. Foroozmehr et al. (2016) [10] indicated that the ANSYS simulation agreed well with the experimental results, including temperature distribution, depth, width, and length of the melting pool. These were evaluated for each track by simultaneously considering the optical penetration depth of the laser at different scanning speeds. Zohdi (2018) [11] researched thermal conduction to simulate the curing and solidification of the filament.
In recent years, the research on thermal stress in hot-melt solidification has increased from experimental research [12,13,14] to extensive simulation [15,16,17,18,19,20,21,22,23,24,25]. Since most predicted variables in the process are very difficult to measure experimentally, melting temperature field and thermal stress field simulations were developed based on the finite element method. Hussein et al. (2013) [17] developed 3D-FEM of ANSYS parametric design language (APDL) for the temperature and stress field analyses, predicting the melt pool size and value of von Mises stresses within five tracks for different scanning speeds (the model size was 10 × 1 × 1 mm). Criales et al. (2016) [18] produced a 2D temperature profile and melt pool geometry of the In 625 (1 × 0.6 (mm) for SLM. Additionally, the effects of the material properties and process parameters on the predicted temperature profile along the center of the laser beam path were simulated. Zhao et al. (2017) [24] built a 3D thermos–elastic–plastic model to analyze the melt pool size and horizontal/vertical normal stresses of the Ti6Al4V product through direct metal laser sintering (DMLS), for which the simulation model size was 1.5 × 1.5 × 2 mm. Li et al. (2018) [26] investigated the modeling residual stress through ANSYS (APDL) of the four layers. The stress increased with the number of printed layers and the maximum stress occurred at the middle plane of the printed part (0.5 × 0.5 × 0.2 mm). Ali et al. (2018) [27] achieved enhanced volumetric heat source penetration to simulate the melt pool size and residual stress values during the SLM of a Ti6Al4V part (30 × 30 × 10 mm). Luo et al. (2018) [28] used the ANSYS APDL language to simulate the model (1 × 0.26 × 0.025 mm) molten pool and residual stress under different laser power values (8–14 W) as well as scanning speeds (100–400 mm/s). It was verified through experimental thermal stress results that the stress was mainly concentrated at the middle of the first scanning track, the terminal of each scanning track, and the edges of the forming surface.
However, for this traditional finite element simulation, it was required to establish a finite element life–death model, a heat source movement algorithm based on ANSYS, ABAQUS, or MATLAB, along with a high amount of cell grid data processing for the calculation efficiency to exceed the technological requirements. Therefore, in the previous literature, only a few temperature fields (track 5 [17]) or simple model thermal field simulations have been completed through an expansion in the mesh size or decrease in the process parameters. In contrast, the influence of multi layers (such as through melting) was not clear during the layer-by-layer processing and the integral forming simulation of typical parts was almost non-existent.
Similarly, few reports with related experiments, analysis, and statistical studies exist on the manufacturing error evaluation of AM under thermal stress. Arni and Gupta (2001) [29] studied the planar error. Rattanawong et al. (2001) [30] and Masood et al. (2002) [31] calculated the volume error of AM. Nagahanumaiah et al. (2008) [32], Ollison and Berisso (2010) [33], and Lynn et al. (2000) [34] conducted several experiments and statistical studies to analyze the relationship between partial errors and process parameters during AM. Paul and Anand (2011) [35] analyzed the cylindrical errors of AM parts through geometric modeling techniques. Moreover, Paul and Anand (2013) [36] developed a statistical analysis method to calculate the influence of metal shrinkage on the shape error of AM parts as well as to generate parametric equations to associate the errors caused by shrinkage to the process parameters. In addition, Paul et al. (2014) [37] analyzed part deformation conditions of the SLM technique through forming errors. Additionally, an error model evaluation simulation of parts, formed during melting and solidification shrinkage (0.1/0.2 mm), was developed.
According to the literature, the universal applicability of such results is so limited that the experimental research could not be regularly conducted during SLM. Simultaneously, low efficiency simulation has led to the negative overall effect of certain parts through poor predictions, especially during variable cross-section forming. As an example, a certain amount of stress concentration caused failure, but it was difficult to measure and simulate. Consequently, the efficient simulation of complex parts on forming quality has higher practical significance.
The research object of this paper was a typical thin and hollow plate part. The structure had a thin panel and a water cooling channel at the middle of the panel for heat dissipation, while a barbed water nozzle interface with the hose was provided with the panel. In traditional processes, it is also necessary to combine the milling with a traditional machining center, along with the welding of the upper and lower boards to manufacture this part. Therefore, quality control is difficult. Consequently, an enterprise will attempt to adopt an SLM process. However, due to the warping caused by thermal deformation, many problems still exist in actual production such as the high flatness errors of the panel, the imprecision of the cylindricity values of the two nozzles, and the variation in the center distance between the two nozzles. As the new process would still produce a high amount of waste, a thermodynamic coupling algorithm based on welding software was developed in this paper, while the forming process simulation of a part was conducted. The stress simulation results in the height direction and in the plane position of the sample were analyzed, along with the statistical deformation data. Finally, the validity of the algorithm was proven by the experimental sample results.

2. Mobile Heat Source and Thermal–Mechanical Coupling Algorithm

2.1. Heat Source

The laser source was a Gaussian heat source, with the maximum heat flux density that decays exponentially far away from the center, which can be described according to [17]
q = q 0 exp ( 2 r 2 ω 2 )
where q is the heat flux density (J/m2·s); r is the radial distance from the beam center; ω is the radius of the beam; and q0 is the intensity of the beam at r = 0:
q 0 = 2 P A π ω 2
q ( r ) = 2 A P π ω 2 exp ( 2 r 2 ω 2 )
where P is the power of laser (W) and A is the absorptivity of the powder material, which can be calculated as 1 minus the reflectivity of the material and the transmissivity of light (usually, the absorptivity is considered 0.7 for 316L stainless steel).
Next, the heat source model was given a picture, as shown in Figure 1a. The scanning paths of the heat source are drawn in Figure 1b, which is the moving path of the laser source by layer to layer in different directions. Each layer path changed by 30 degrees, which cycled from 0 to 180 (0, 30, 60, 90, 120, 0, 30, etc.).

2.2. Heat-Transfer Equation

According to the definition of the heat flux density per unit cross-sectional area of the object,
q r = k Δ T d r
where k is the thermal conductivity (W/m K); Δ T is the temperature difference from high to low (K); dr is the thickness of the material in the current layer (m). When Equation (4) is combined with Equation (3), the temperature difference can be used to calculate:
Δ T = 2 A P d r π ω 2 k exp ( 2 r 2 ω 2 ) .
Furthermore, the heat transfer equation is
ρ c p T t = ( k Δ T )
where ρ is the material density (kg/m3), c is the specific heat capacity (J/kg K), and t is the interaction time.
The porosity of the powder can be calculated as
ϕ = ρ b u l k ρ p o w e r ρ b u l k .
Consequently,
ρ p o w e r = ( 1 ϕ ) ρ b u l k
k p o w e r = ( 1 ϕ ) k b u l k .
The thermal equilibrium equation satisfies the following classical 3D heat conduction equation, given by [17]
ρ c T t = x ( k T x ) + y ( k T y ) + z ( k T z ) + Q
where Q = q*(s*t) l (x, y, z, t) is the volumetric heat generation (W/m3).

2.3. Thermal–Mechanical Coupling

The thermal strain is described in the case where the temperature field distribution is known [17]:
ε t h = T r e f t α e ( T ) d T α e Δ T
where ε is the strain, αe is the coefficient of thermal expansion (1/K), and Tref is the reference temperature at the previous layer.
For the overall elastic strain,
{ ε i i } = { ε f } + { ε t h } .

2.4. Stress–Strain Equations

The material is in an elastic state as each layer of powder begins to melt with the laser beam. For simplified isotropic materials, the thermal strain equation can be obtained through the constitutive equations of elasticity theory [17]:
ε i i = 1 E [ σ i i μ ( σ j j + σ k k ) ] + a e Δ T , ε j j ... , ε k k ... ; γ i j = τ i j G , γ j k ... , γ i k ... ( i , j , k x , y , z )
where γ is the shearing strain; E, μ, and G are the modulus of elasticity, Poisson’s ratio, and shear modulus, respectively.
The thermal stress equation can be obtained through the thermal strain equation solution:
σ i i = E ( 1 μ ) ε j j + μ ( ε i i + ε k k ) a e T ( 1 + μ ) ( 1 + μ ) ( 1 + 2 μ ) , σ j j ... , σ k k ... ; τ i j = γ i j G , τ J K ... , τ i k ... ( i , j , k x , y , z ) .
As the melting temperature increases, the stress–strain increases, and the material enters a plastic state. According to the Mises yield criterion and the Prandtl–Resus flow criterion, the incremental constitutive equation is used to calculate the elastic–plastic strain:
d ε i i = d ε i i e + d ε i i p , d ε j j ... , d ε k k ... ; d γ i j = d γ i j e + d γ i j p , d γ j k ... , d γ k i ... ( i , j , k x , y , z )
d ε i i = 1 2 G d σ i i + d λ σ i i , d ε j j ... , d ε k k ... ;   d γ i j = 1 G d τ i j + 2 d λ τ i j , d γ j k ... , d γ i k ... d γ i j = 1 G d τ i j + 2 d λ τ i j , d γ j k ... , d γ i k ...
( i , j , k x , y , z )
where is the positive instantaneous constant
d λ = 3 d ε i i p 2 σ s , ( σ s = 1 2 ( σ 1 σ 2 ) 2 + ( σ 2 σ 3 ) 2 + ( σ 3 σ 1 ) 2 )
and the effective stress is calculated as follows:
σ e f f = σ 1 2 + σ 2 2 + σ 3 2 + 2 γ ( σ 1 σ 2 + σ 2 σ 3 + σ 3 σ 1 ) .

2.5. Initial Conditions and Boundary Conditions

The initial condition of room temperature and some attribute parameters distributed throughout at time t = 0 can be applied as
T0 = 20 °C (293 K)
σ,ε,τ,γ | t=20 = 0
u, v, w | t=20 = 0
where u, v, and w is the displacement in three directions—x, y, and z, respectively.
Meanwhile, as the natural convection and surrounding radiation with the gases were considered, the boundary conditions of the simulation model can be defined. The heat flux at the boundary is equal to the laser heat flux at the boundary unit.
k ( T n ) w = q ( r ) w
where n is the normal direction of the model surface, and w is the model border.
k ( T n ) w = h ( T w T f ) + ε σ ( T w 4 T f 4 )
where h is the heat transfer coefficient at the model surface; Tw is the temperature of the model surface; Tf is the temperature of the surrounding gas. ε is the radiation coefficient of the black body, and σ is the Stefan–Boltzmann constant.
Next, according to the input laser parameters such as P, r, A, and v as well as the property parameters of the material at different temperatures T, such as k, c, ρ, α, E, μ, and G, the software established the stiffness matrix to solve the stress balance equation (Navier equation), which can be obtained through the displacement of any unit [ u i , v i , w i ] . Through the Cauchy equation, the stress–strain value of any unit can be solved by Equations (13)–(18).

2.6. Material Properties of 316L

The basic properties and the thermal properties of 316L stainless steel powder and solid 316L at different temperatures are shown in Table 1. Meanwhile, the mechanical properties of printed 316L are anisotropic in practice [38,39]. However, it is very difficult to obtain the whole basic parameter data of the anisotropic materials of 316L and was conducted on simplification processing as isotropic for the thermodynamic simulation in this model.

3. Simulation Process and Operation

3.1. Simulation Flow

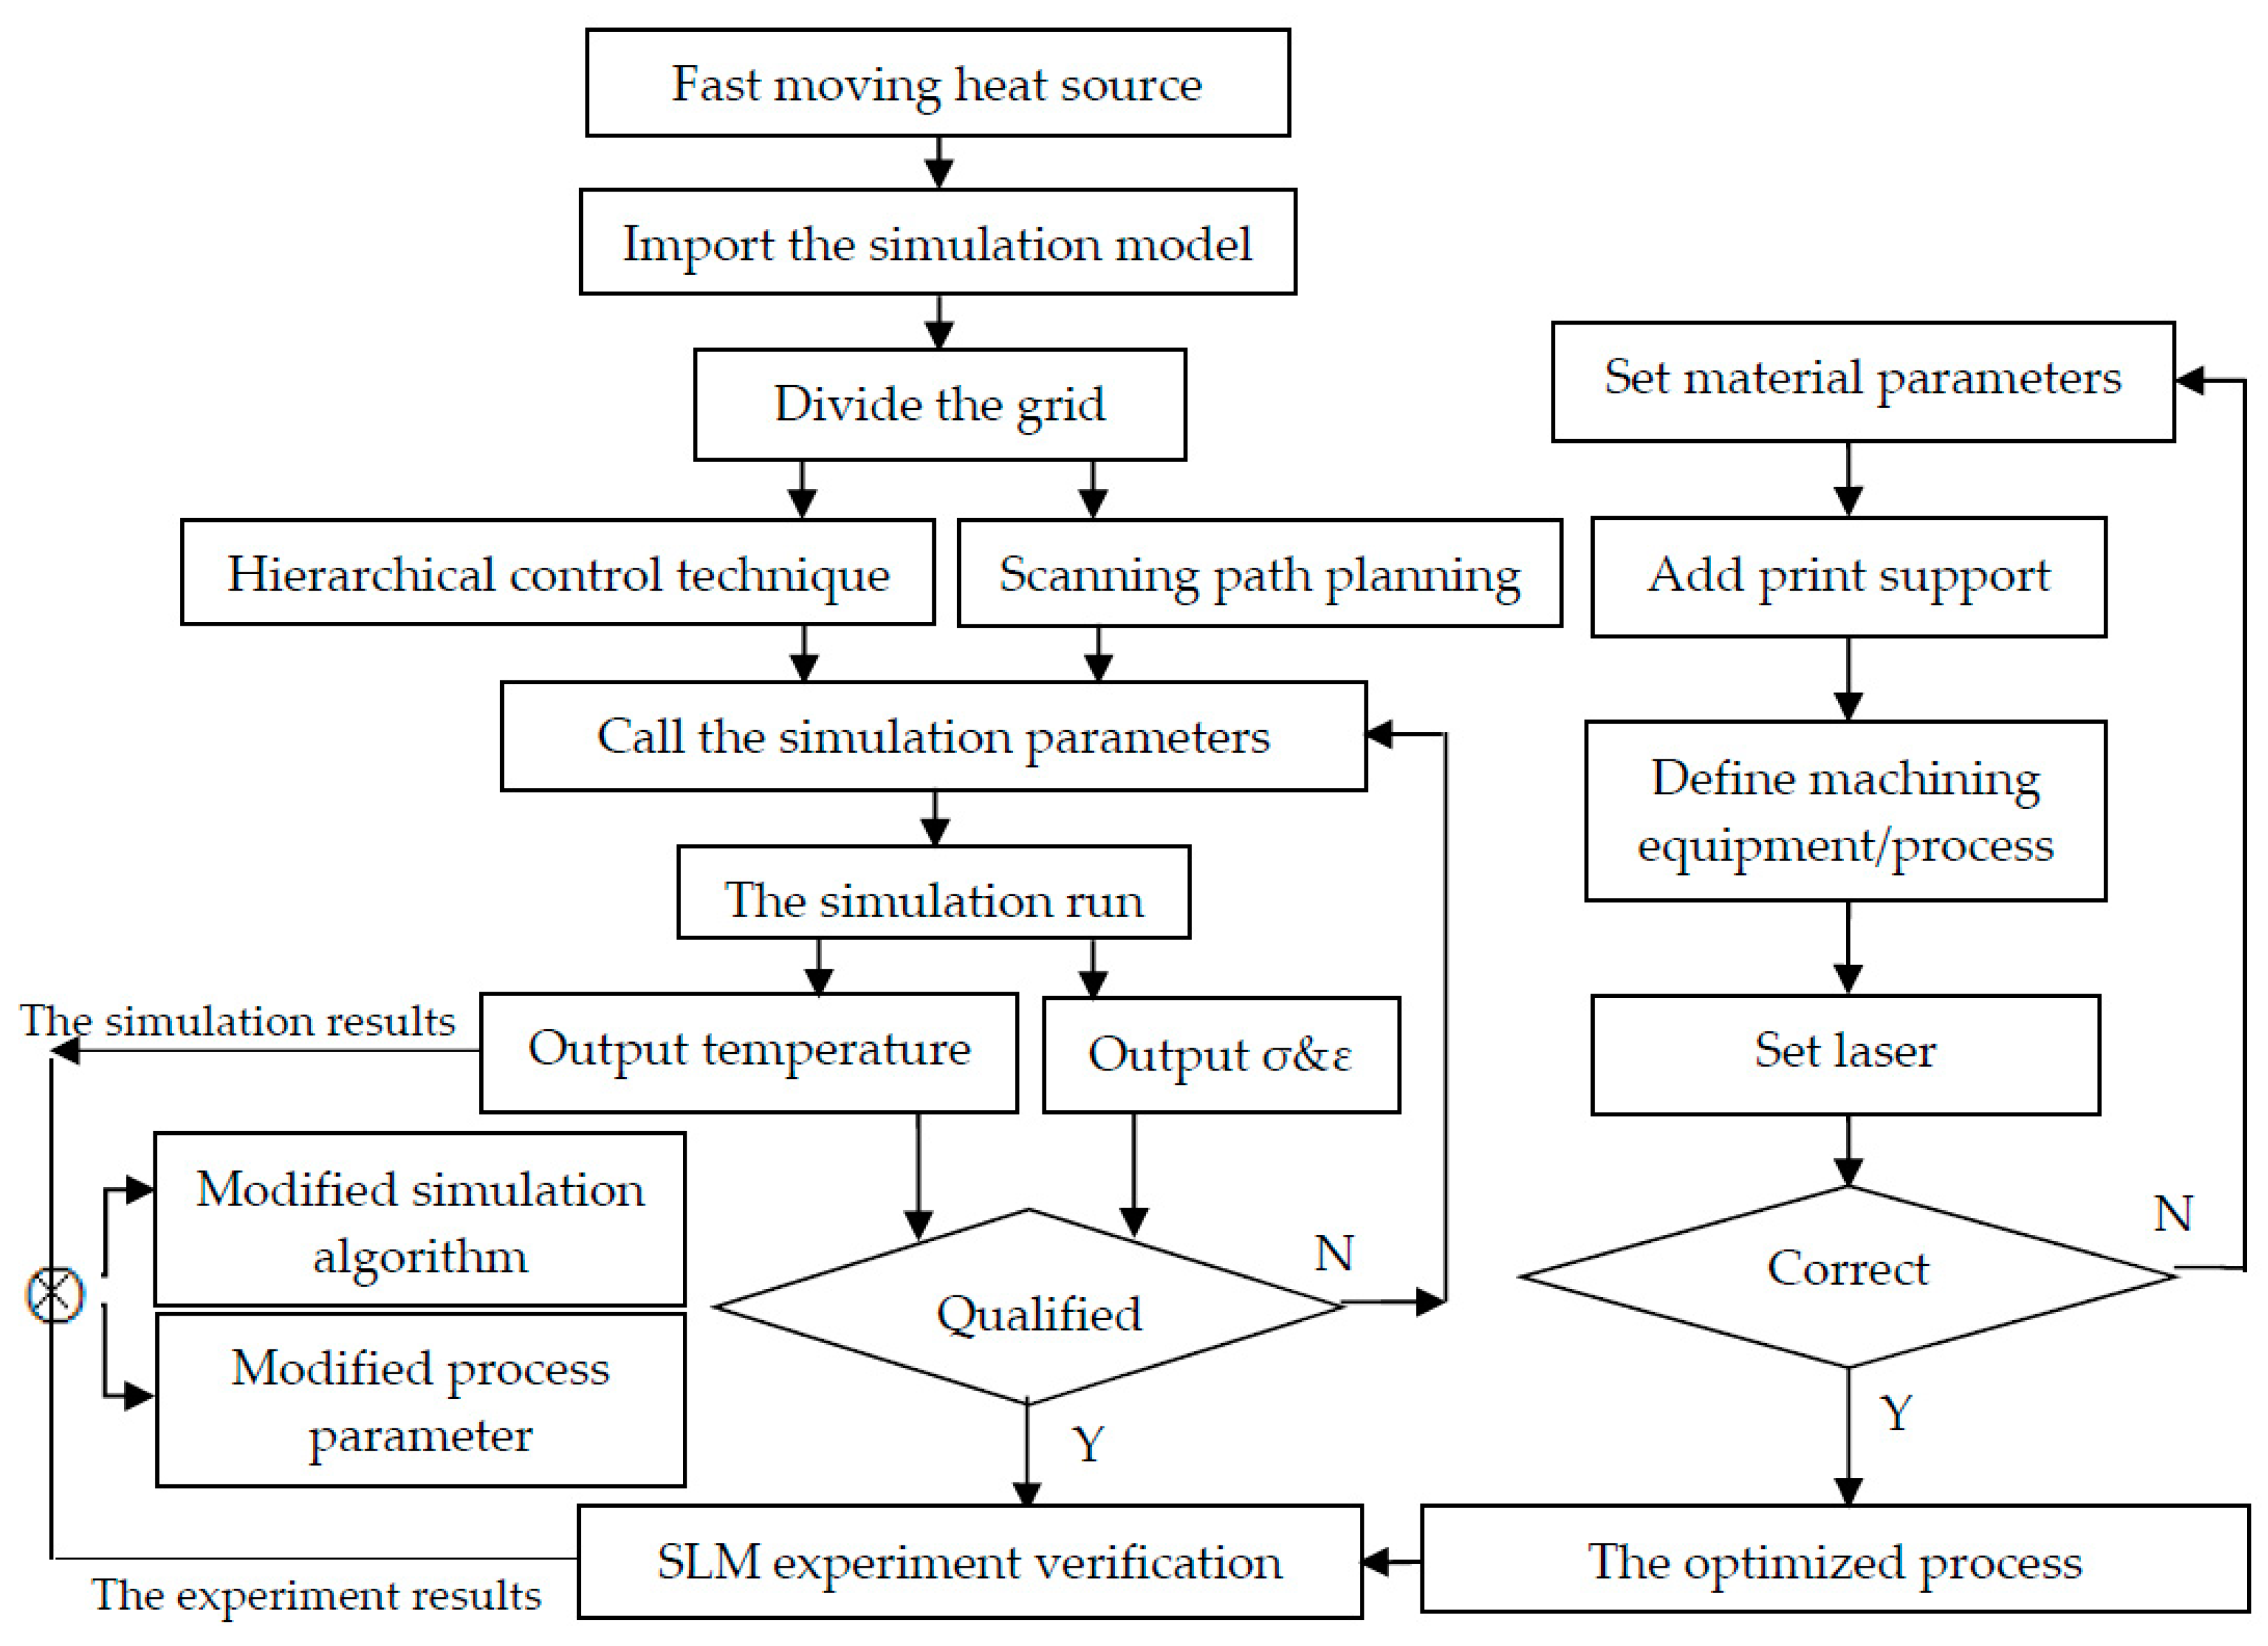
The simulation methodology is presented in Figure 2. This simulation included two aspects. On one hand, the heat source definition, the heat transfer mode, and the thermal–mechanical coupling calculations were carried out, based on the finite element theory. On this basis, the simulation model was utilized for a layered slice, whereas the layer thickness data were added to the processing technology file. In addition to the scanning path development, a common path striped pattern was input to the processing technology file. On the other hand, process parameters such as the material properties, printing support, process equipment, and laser parameter settings could be set within the corresponding parameter window. Moreover, the reasonable value could be modified on the basis of previous simulation results.

3.2. Simulation Parameters

According to the current resources, the simulation was performed with a PC (8 cores, 3.60 GHz CPU, and 32GB memory). The surface grid of the model was 0.5 mm. Additionally, the main laser parameters and process parameters are presented in Table 2.

3.3. Simulation Runs

The original 3D model of the component was designed as presented in Figure 3a. It included a panel with a relatively flat surface, a water-cooling channel, an internal connection with the water nozzle as well as many external cooling fins on the plate. Based on the above thermal–mechanical algorithm and software platform simulation, the simulation produced a diagram, layer-by-layer, as presented in Figure 3b. This diagram contained a 3 mm support, and certain points were marked on the graph.
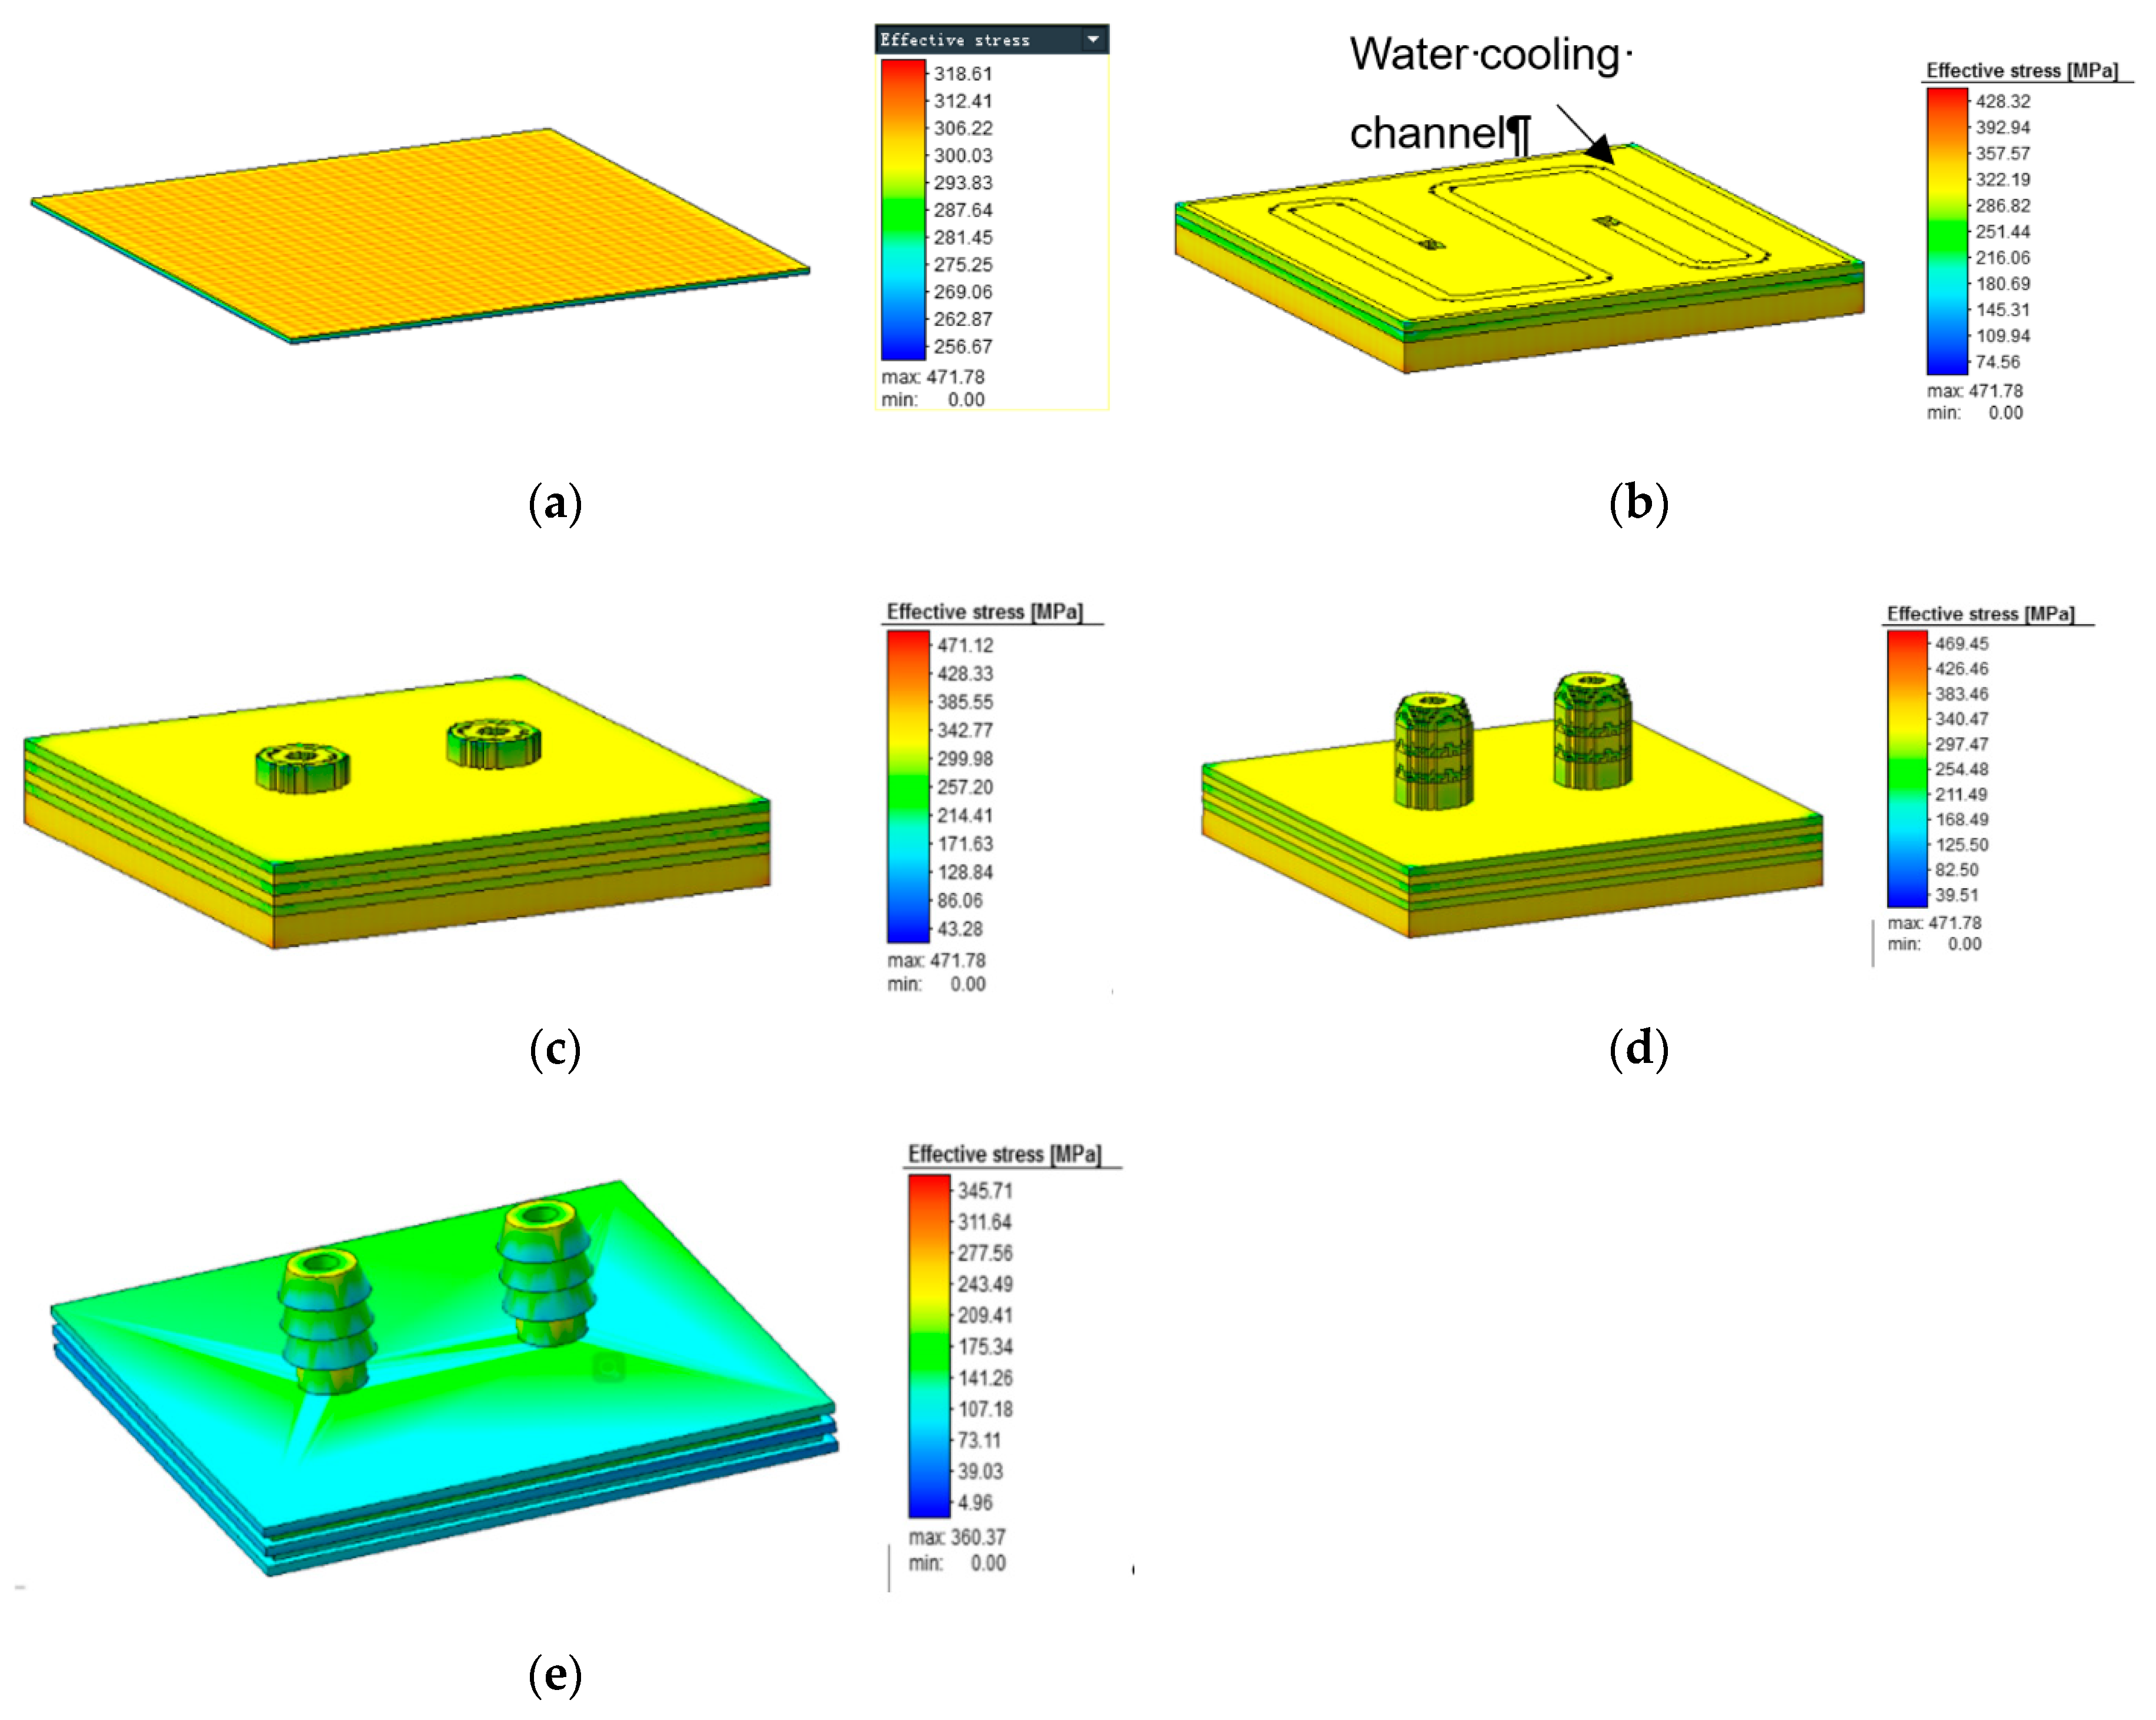
Subsequent to the finite element thermal–mechanical coupling solution, the stress nephograms of several forming stages are presented in Figure 4. Following laser melting, the melt solidification was achieved, while thermal stress regions were macroscopically generated for different temperature gradients as the cooling progressed. The reason for stress occurrence was that different molecular motion rates under different temperature gradients can cause different orientations and spacing of the crystals, resulting in stress formation with the slowest heat transfer point at the center, along with tension at the side and pressure in the center. Through the effective stress cloud diagram, it was observed that the plane stress was evenly distributed throughout the material. Furthermore, the four stages of the effective stress nephogram and its ruler are demonstrated in Figure 4a–d. From the first to the fourth stage, the stress value gradually increased, and the layer-by-layer cyclical superposition effect of the thermal stress from the base layer to the upper layer was produced as a result. This could be obtained because the lower layer was continuously heated and cooled by the upper layer. Following the formation of several hundred layers, the normal stress distribution of the model could be observed at the fourth stage. The stress value of the support part exceeded the solid stress value of the part from the cloud image color distribution. In addition, it can be observed in Figure 4e that the stress was reduced after the substrate was removed. Furthermore, this stress, following the thermal stress release, occurred as residual stress. Specifically, the existence of the above stresses would inevitably lead to strain generation and macroscopic thermal deformation. The simulation results are thoroughly analyzed in Section 4.

4. Emulation Results and Discussion

According to the thermo-mechanical coupling algorithm and stress–strain elasticity theory simulations, relevant data statistics were produced. The main conclusions are as follows.

4.1. Effective Stress and Strain

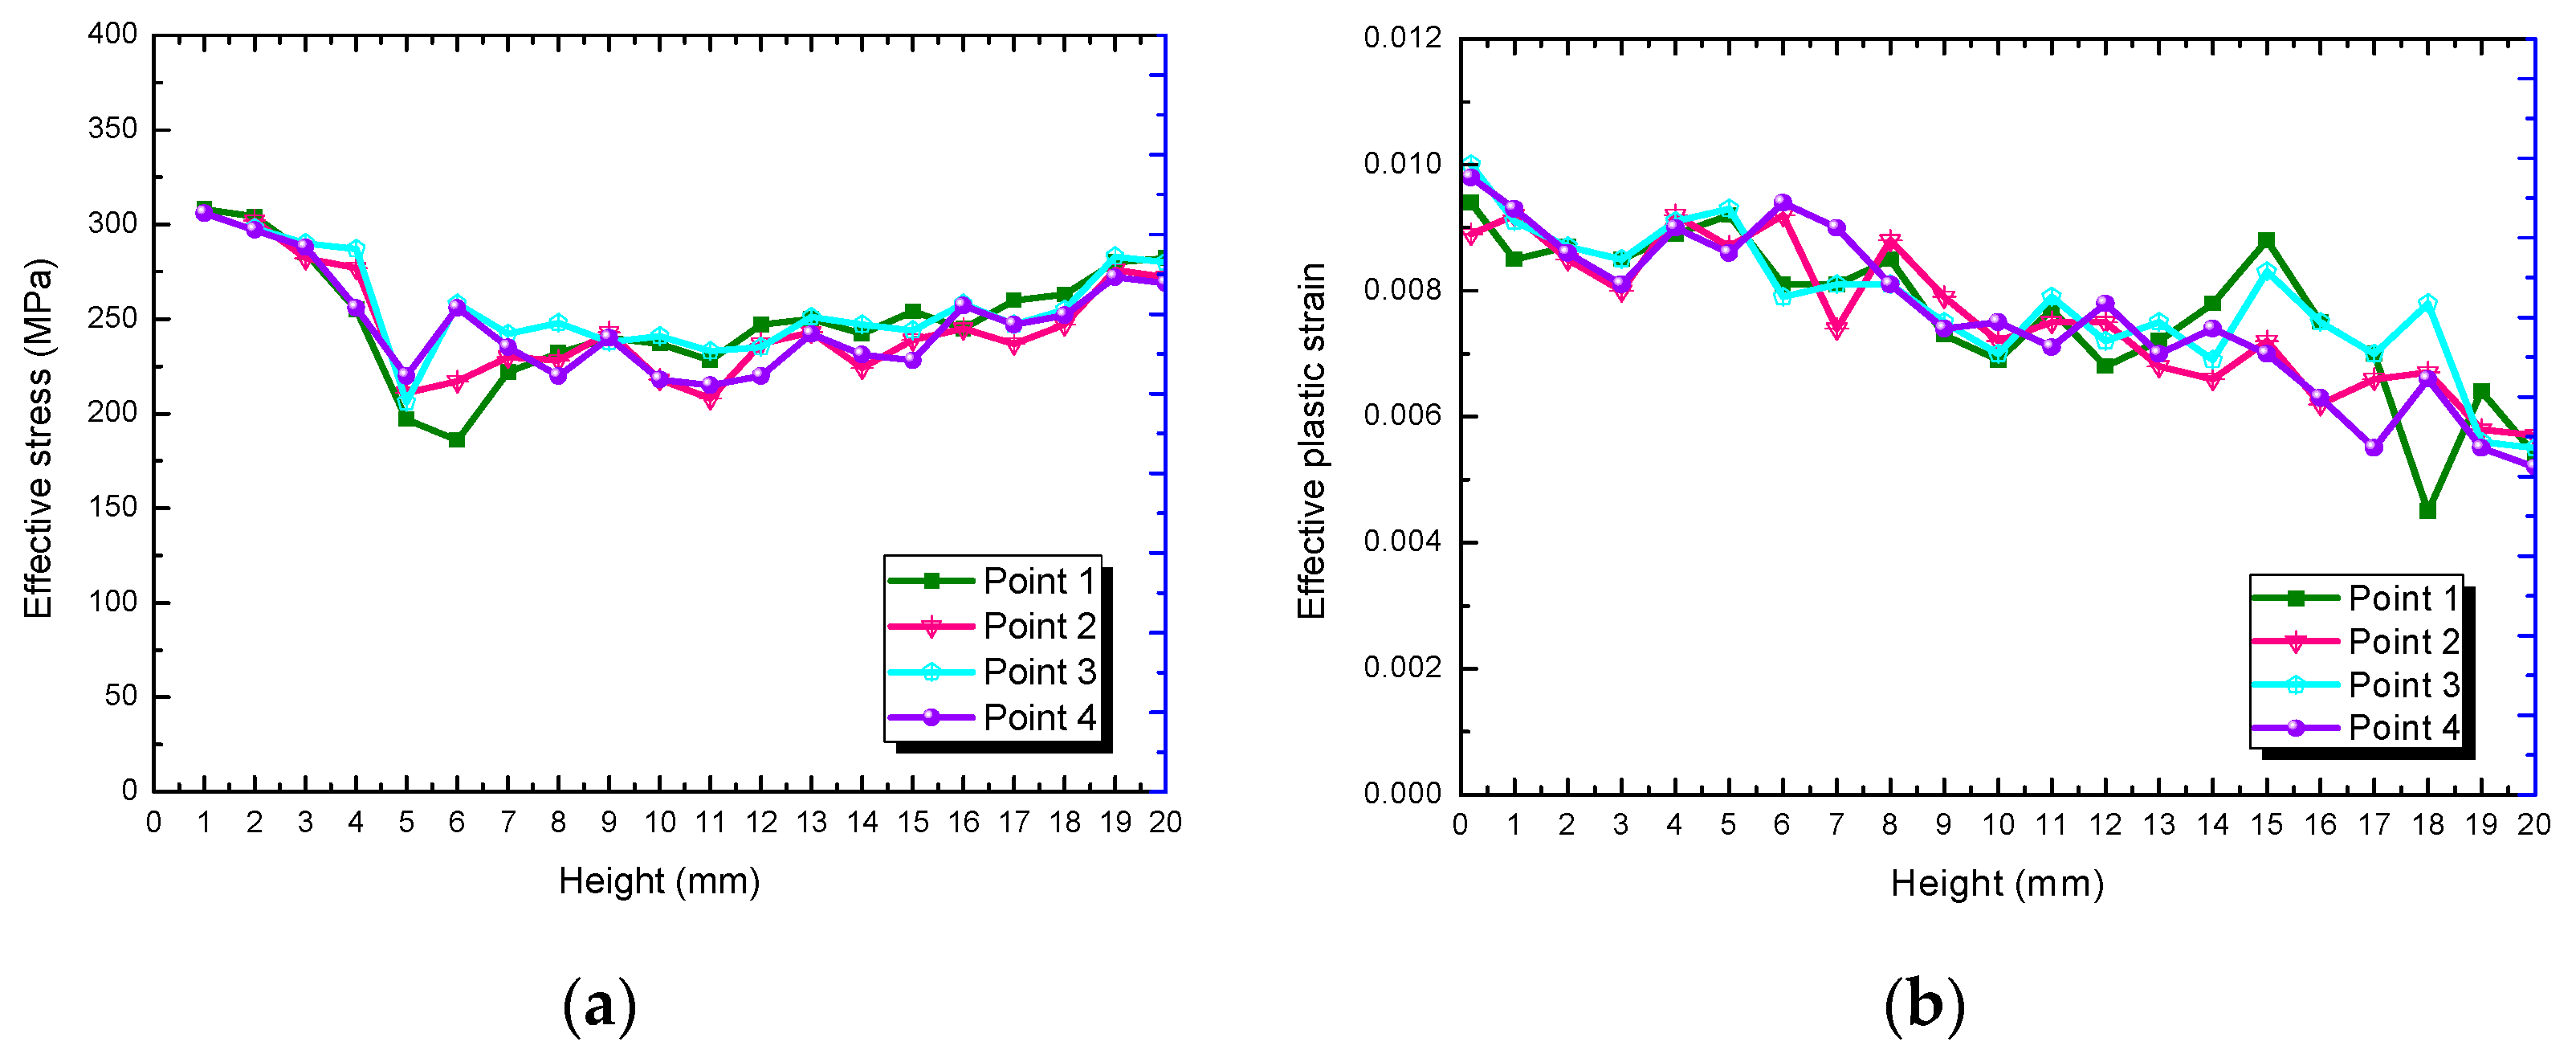
In the formation analysis of heat stress subsequent to different levels of height, each floor included four locations (Points 1–4, as shown in Figure 3b). As presented in Figure 5a, the printing started from the support layers to the height position of the plate layers at 4 mm, and the thermal stress gradually increased from the upper plate surface to the lower layer near the substrate as the layers accumulated. Since the heat transfer temperature gradient was the highest, it led to faster solidification and higher thermal stress at the base plate layer due to “metal solidification theory” [40,41]. As the other powders were formed through laser exposure, which caused the layer-by-layer circulation heating, the current printing layer produced a “micro annealing effect” of stress release before each layer. In contrast, its influence was lower than that of the stress-induced rapid solidification. Consequently, the bottom stress was the highest and the upward stress became slightly lower with the forming height. Moreover, water nozzles with barbs existed at the height of 4 mm. These were added with the new support, but the heat transfer medium was a panel of considerable temperature, which led to a reduction in the part cooling rate and the stress decrease in the curves. Following this, the curve entered the normal stress accumulation phase as before. Simultaneously, the thermal stress caused the thermal strain of the material, which constituted microcosmic thermal deformation [35]. From Figure 5a,b, it could be observed that the thermal plastic strain and thermal stress variations had the same tendency.
Furthermore, the effective stress extension from 0 to 4 mm in the large panel structure that was printed from the substrate was analyzed (single support layer was accumulated on a single basis), while the increase occurred as follows:
Through the least square method cubic polynomial fitting function curve,
f ( x ) = P 3 x 3 + P 2 x 2 + P 1 x + P 0 .
Through MATLAB calculations, P = 0.0196, −0.9584, 7.2315, and 289.6667 because
f ( x ) < 0 , x ( 1 , 20 )
Therefore, the thermal stress curve monotonically decreases from the substrate to the upper layer, and vice versa.

4.2. Stress Release in Removed Substrate

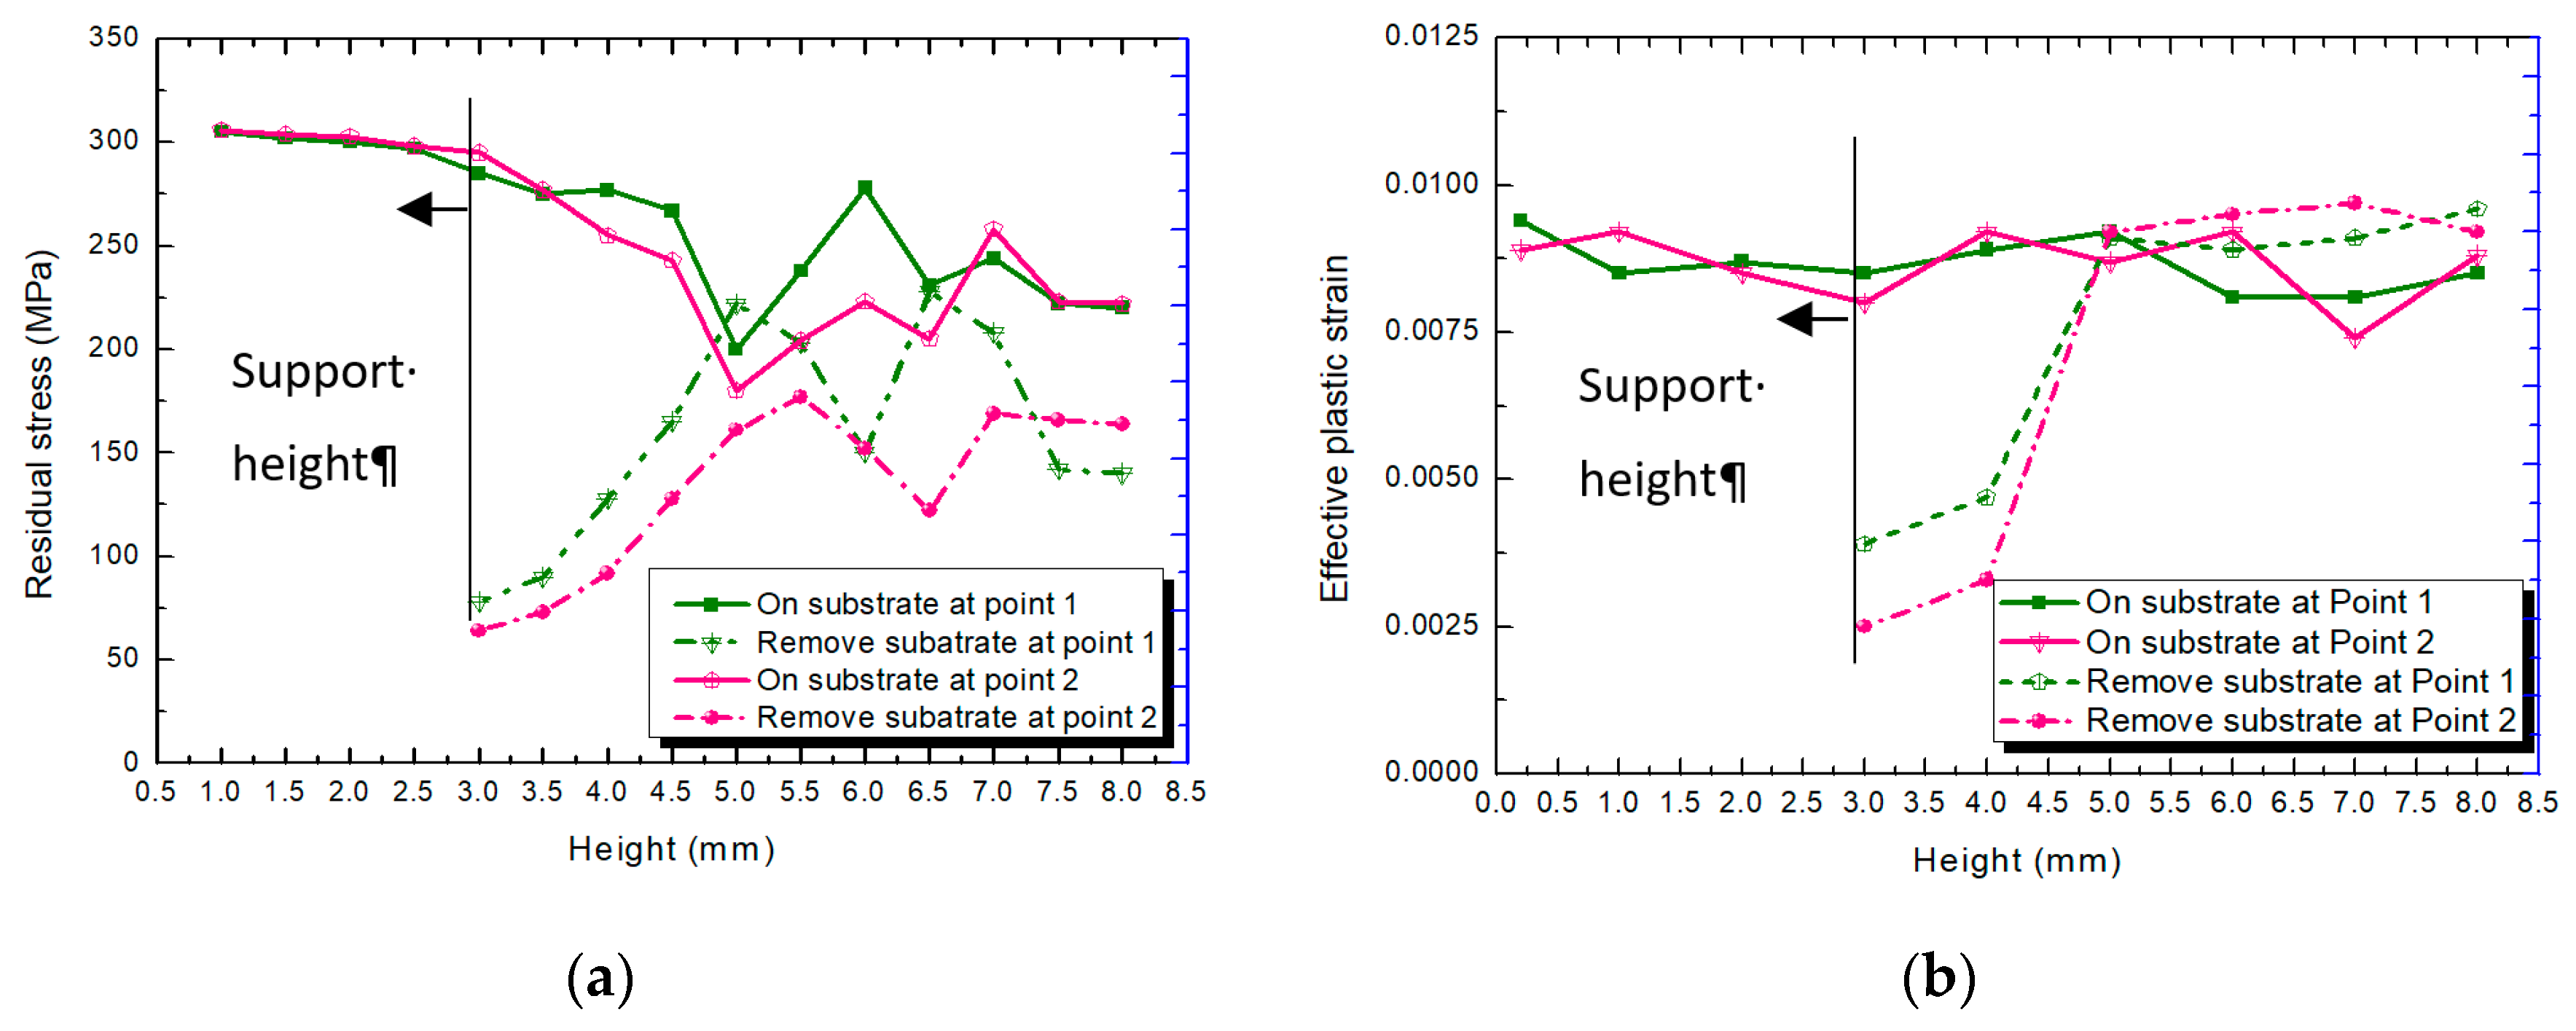
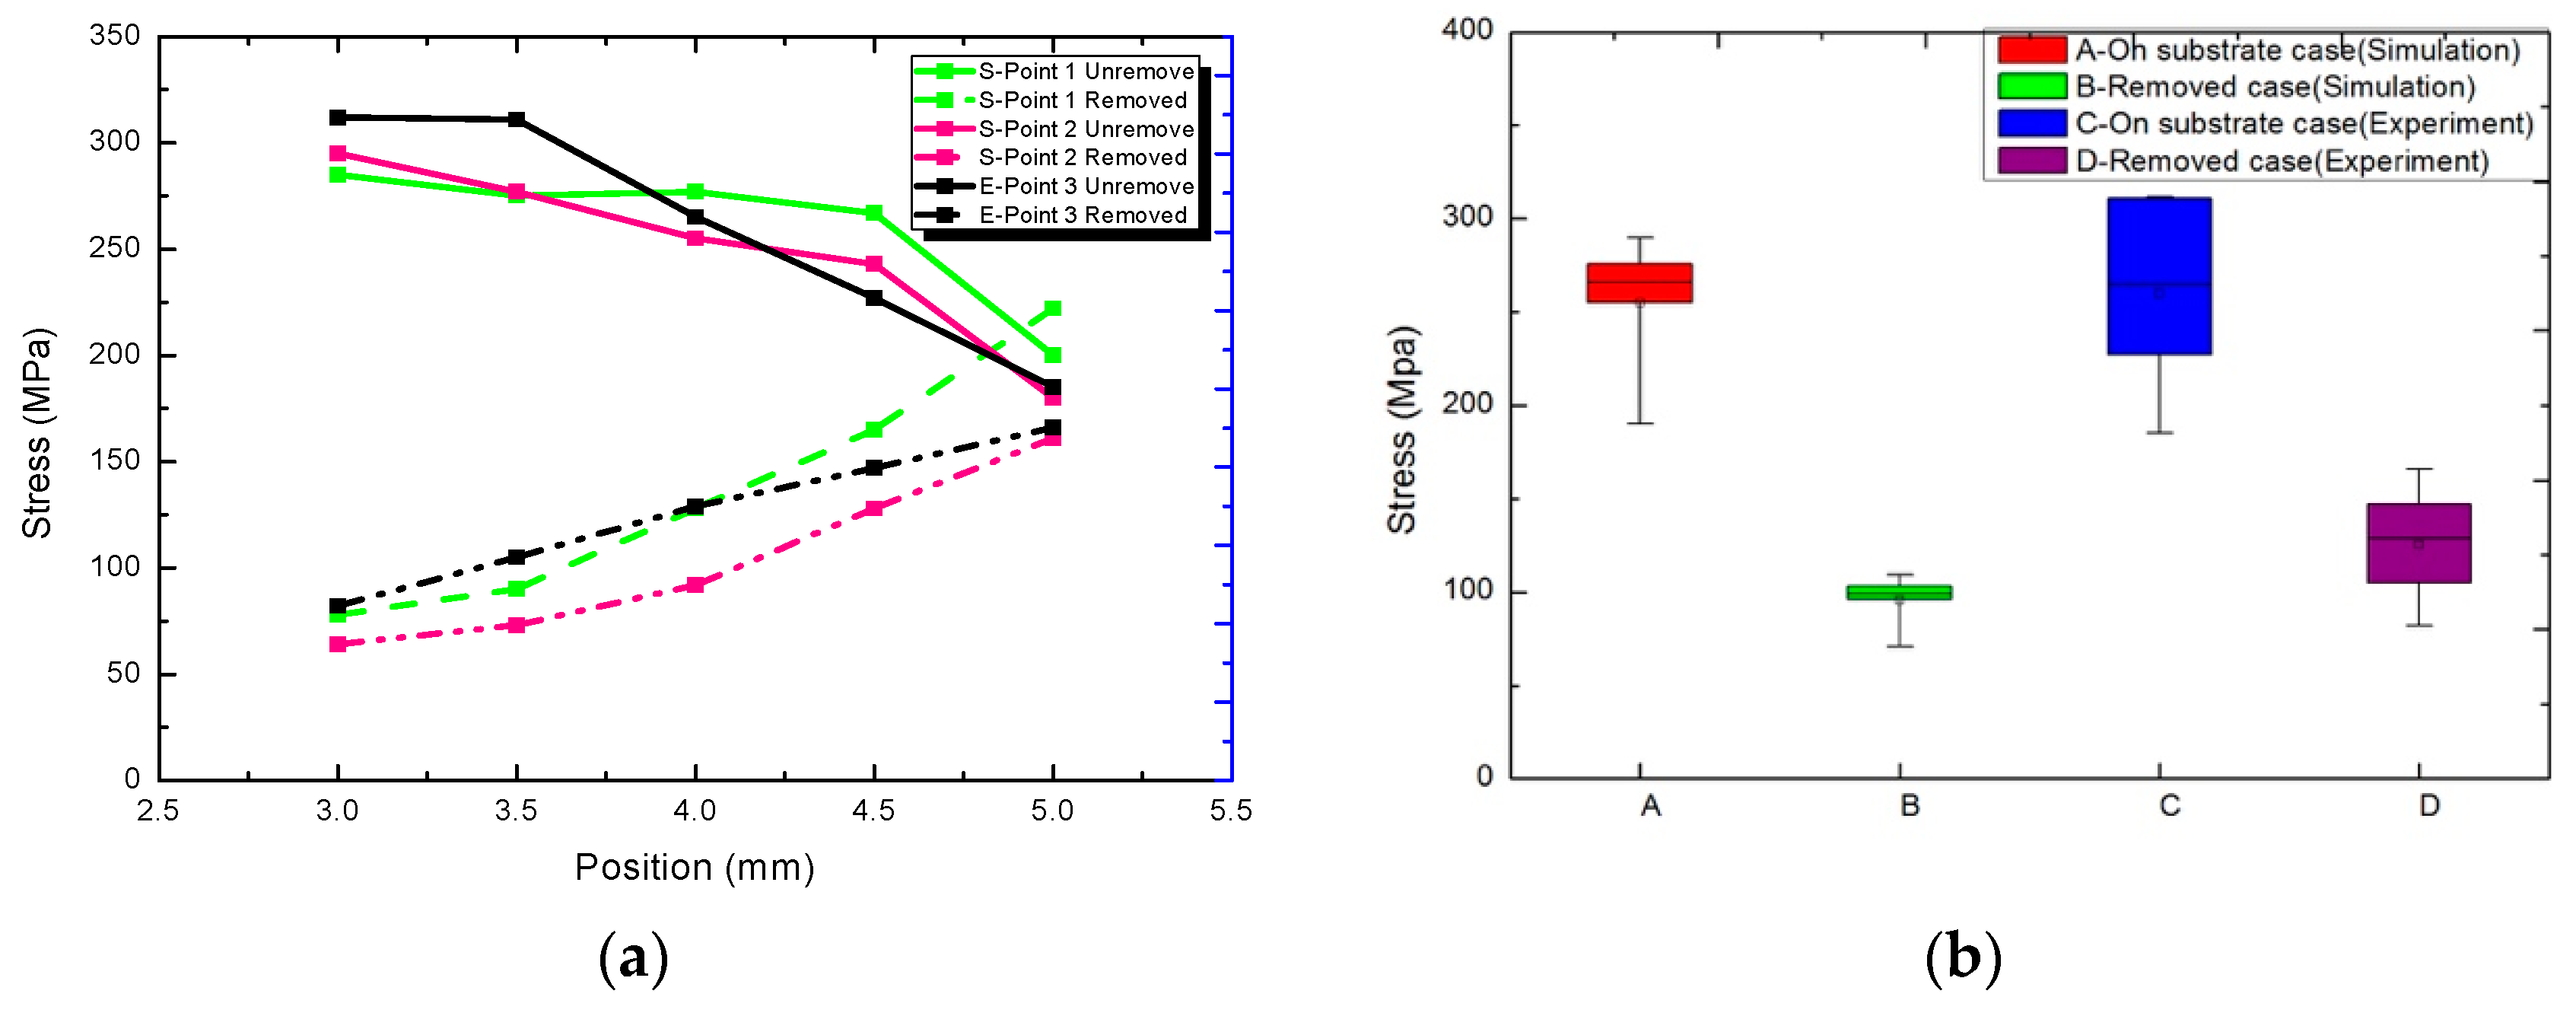
After the substrate processing was removed from the simulation, the Z negative direction constraint of the substrate was relieved. Under the action of stress, the inner bound crystal alignment and its grain boundary could be adjusted. Consequently, the stress could be released and the residual stresses of the parts could be formed. The effective stress distribution prior to and following the removal of the substrate could be observed from Point 1 to Point 2 in Figure 6a. It was quite clear that the closer the substrate, the higher the stress release, and the closer the proximity to the stress-free state at the bottom. When the parts reached the nozzle, the new support stresses could be preserved. As a result, both the residual stress and the thermal stress displayed an opposite trend prior to and following the direct removal of the substrate. Given that the internal molecules of the matrix severely changed the state of the crystal due to high thermal stress, the crystal was the first to make changes when the new equilibrium mechanism was obtained. This phenomenon conformed to the theory of the microstructure phase transition [41]. Additionally, the residual strain change trend was similar to the residual stress trend presented in Figure 6b. It could be observed that the simulation was more successful for the actual thermodynamic coupling.

4.3. X/Y/Z Uniaxial Plane Stress

Furthermore, the plane state of the uniaxial stresses of X, Y, and Z axes were analyzed at the panel height of 0.5 mm. As presented in Figure 7a, the uniaxial stress of X alternated between the two sides, which was in accordance with the relationship between the acting and reacting forces. Therefore, the plane stress tension was offset and the plane stress balance was reached. Figure 7b presents a similarity to the thermal stress distribution. The reason for this stress alternation was that following the melting of a layer of powder, the edge position was cooled first, thus becoming the stress distribution boundary. The subsequent solidification position caused the tension to increase as the central formation was symmetrical to the tensile stress on both sides of the boundary from the edge to the internal cooling center. Moreover, the internal solidification contraction produced contraction pressure, while as the cooling was extended to the center, the equilibrium compressive stress was produced. As presented in Figure 7a,b, from the center of geometry, the tension was drawn to the pressure zone and subsequently to the edge. Specifically, as presented in Figure 7c, the Z direction thermal stress cloud edge stress was high and the center tension was low, which led to the parts’ susceptibility to warping deformation.
The distributions of axial stress are presented in Figure 7d–f. σx expresses the stress variation law of the extended molten pool along the scanning direction, σy expresses the change law of thermal stress in the trajectory direction, and σz expresses the stress change principle along the layer thickness accumulation. Each group could be divided into three areas, as presented in Figure 7d–f. The stress in Area I was positive and the edge was cooled first, therefore producing high residual tensile stress. The stress in Area II was the maximum compressive stress of the opposite force. The stress in Area III was the pull force from the edge tensile stress to the center. From the graph of the σxyz comparison, the distribution curve regularity was the same, but the amplitude varied highly. Therefore, the maximum residual stress of 316L stainless steel under this process parameter was σxMax = 295 MPa, σyMax = 283 MPa, and σZMax = 305 MPa, while the residual stress was lower than the 316L yield strength of 310 Mp < σs < 500 MPa. Additionally, these values were lower than the tensile strength 600 MPa < σp < 750 MPa [42].

4.4. Thermal Deformation

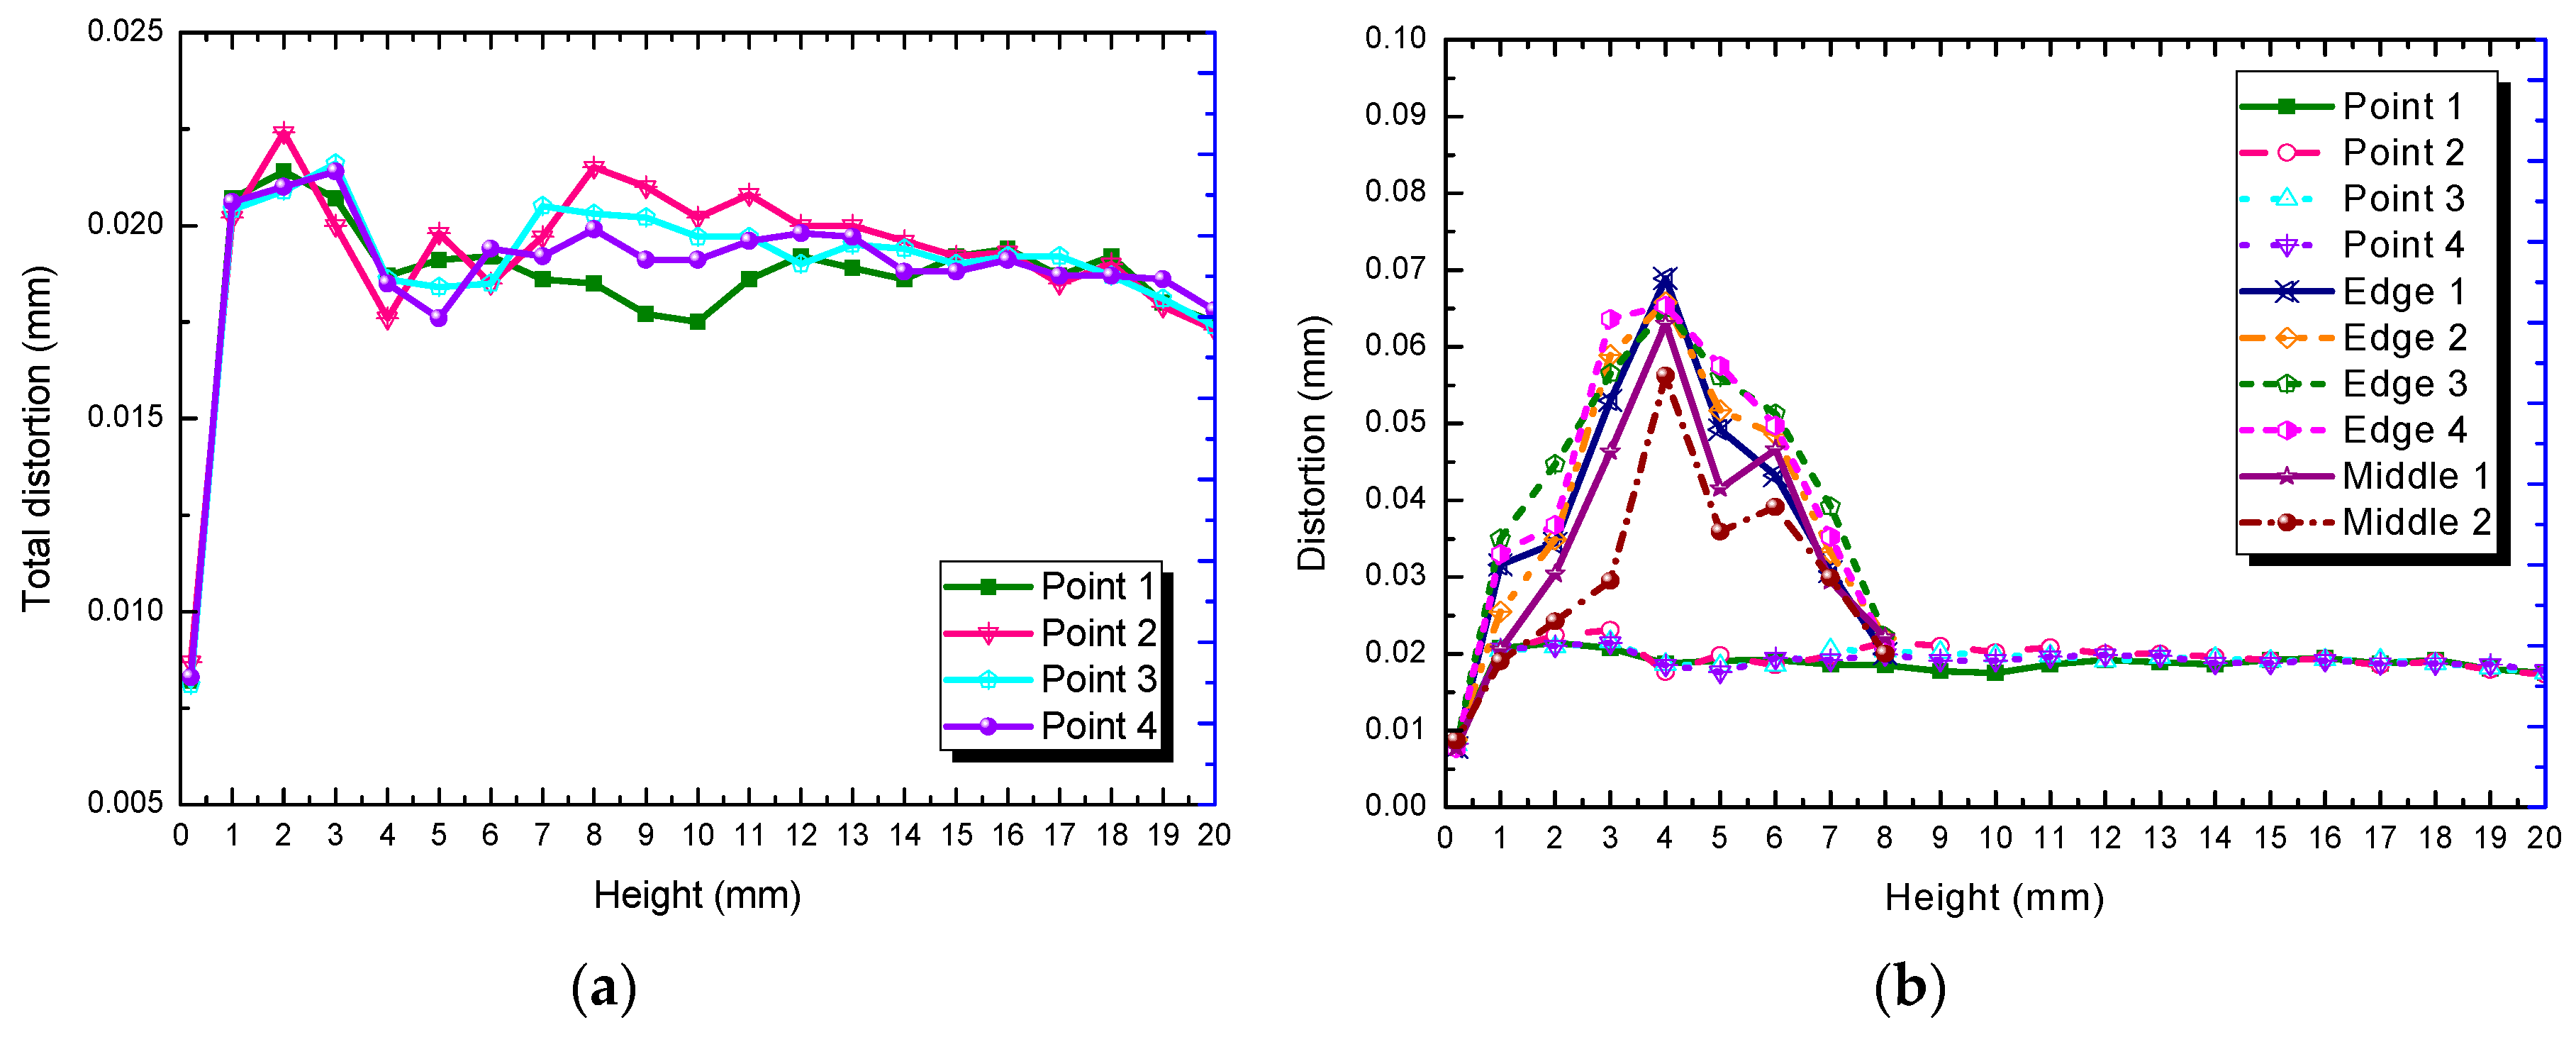
The total deformation of thermal deformation was analyzed, following the height interval of 1 mm. At the four edge points (Edge 1–4), the middle of the water nozzle (Point 1–4) and the midpoint of the boundary line (Middle 1–2) were considered, respectively. Consequently, the data of each point deformation with height are presented in Figure 8. It could be observed that the deformation amount of the four edges was the highest, whereas the maximum deformation occurred at the height of 3 mm from the supporting layer to the solid layer δMax = 0.068 mm (which could meet the tolerance of ±0.1 mm). The second deformation was at the surrounding edges where the minimum deformation was at the center of the part. Even if the part with the water nozzle increased in height, no large deformation occurred. It was clear that the deformation of the parts mainly occurred to handle the transition position of the large plane edge point, especially from the supporting layer to the solid layer.

5. Experimental Results and Analysis

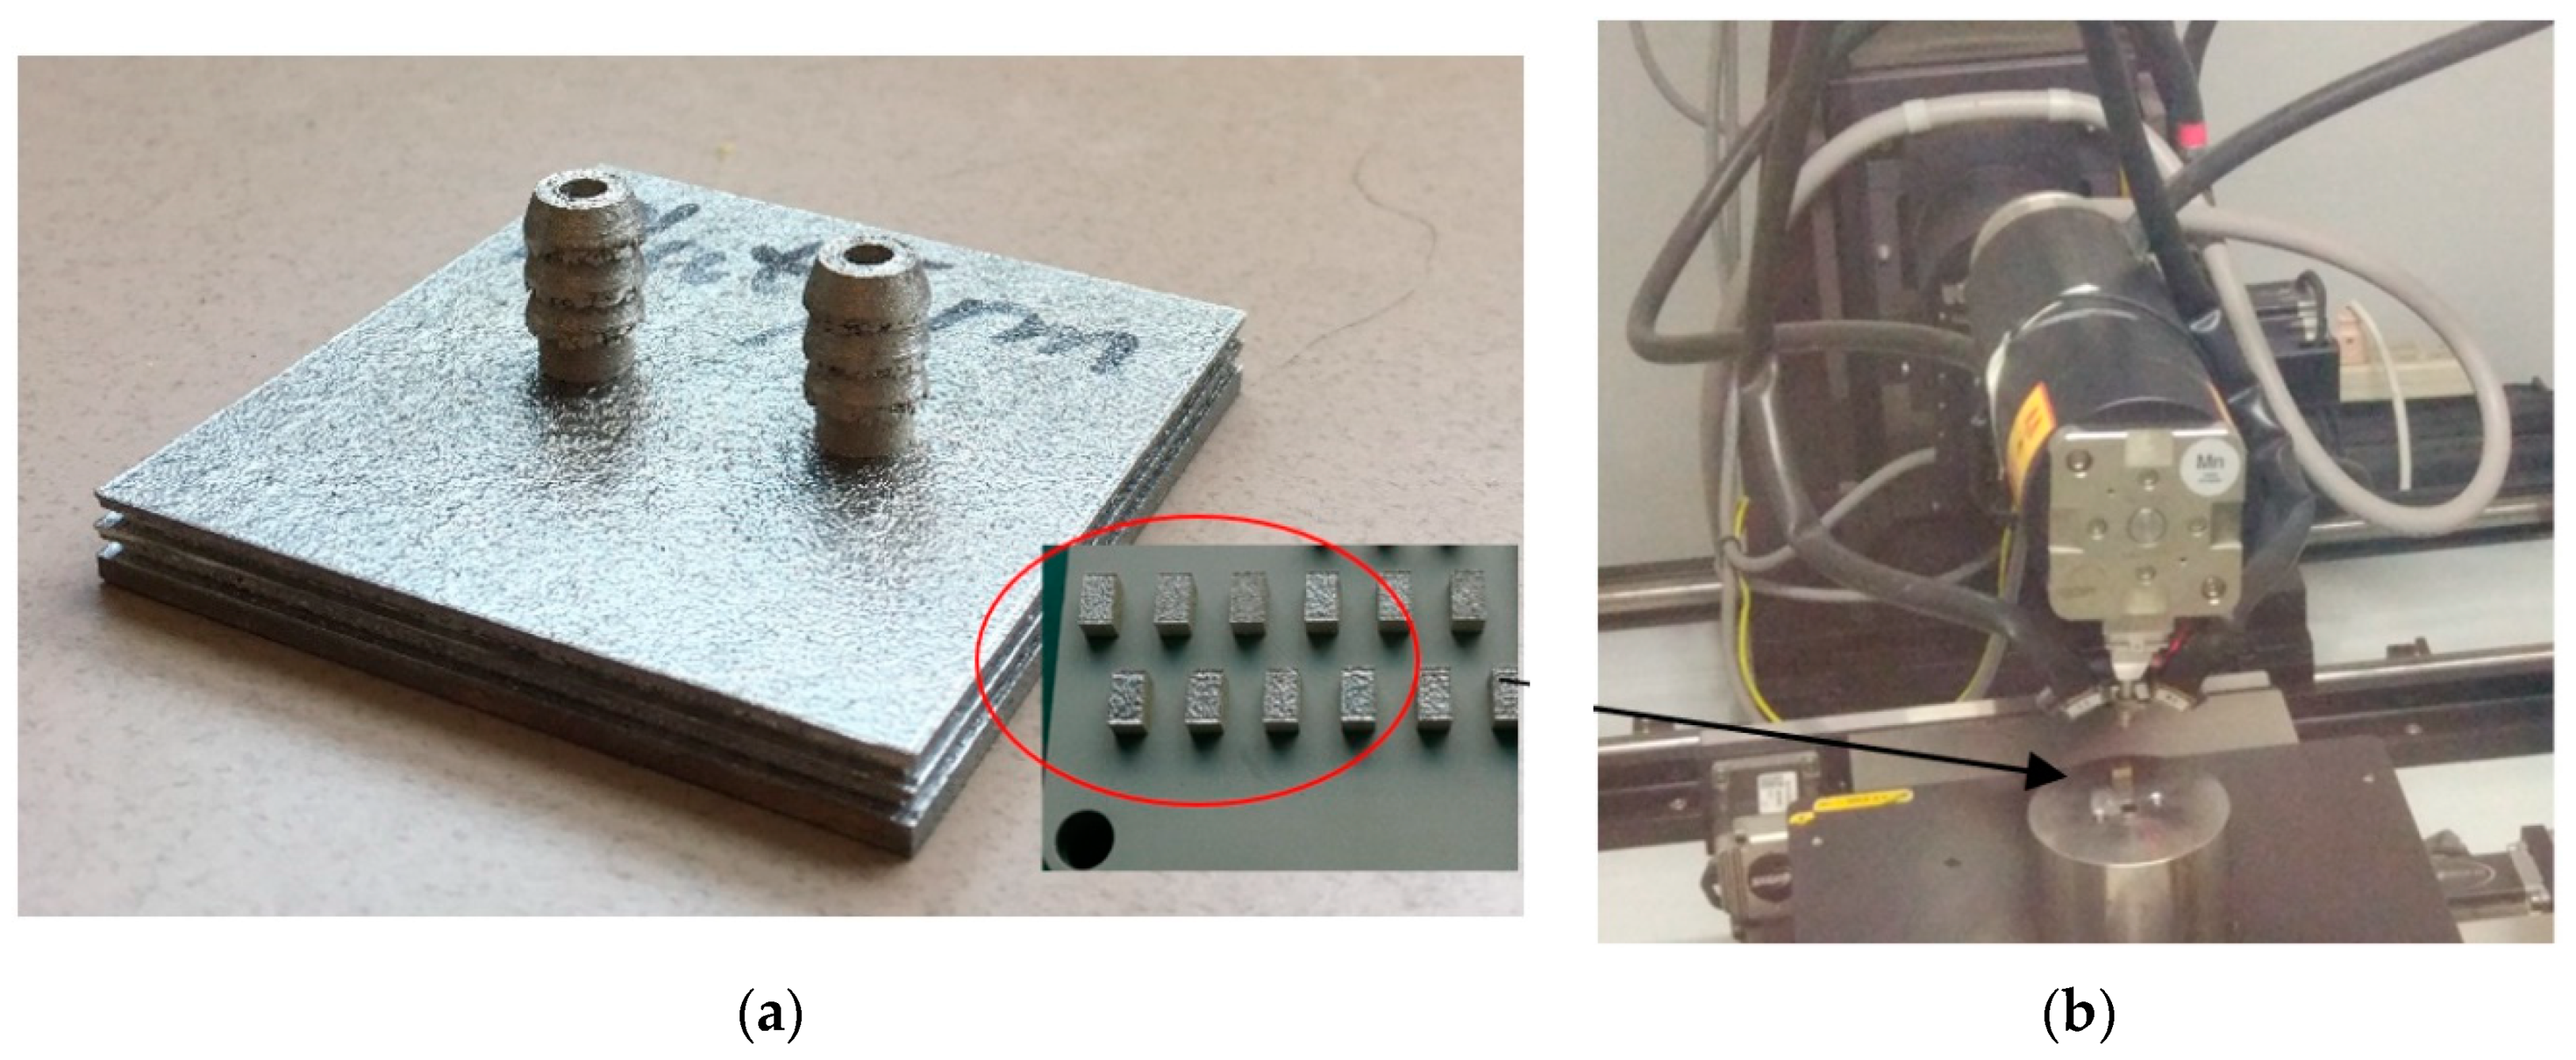
In order to verify the simulation results, typical parts were formed with a concept machine in SLM, as presented in Figure 9a. Additionally, a sample with the same process parameters was printed that only reflected the panel structure, while the size was 8 × 10 × 5 (mm). Subsequently, on the third day after forming, the residual stress was tested with a PROTO MG2000 XRD detector (Mn target, β from 20° to −20°, and 2θ ≈ 152.80°), as presented in Figure 9b. In the experiments, the electrolysis corrosion method was utilized to measure the different heights, while the thickness of the striped layer was approximately 0.5 mm.

5.1. Residual Stress

Figure 10 presents a comparison analysis diagram of the sample with the simulation and experimental data subsequently after forming. In order to unify the comparison range, the simulation data were only focused on 3–8 mm. The samples were tested on the substrates directly (substrate present) as well as subsequently with wire-electrode cutting (substrate removed), and the test data were drawn as a black curve, as presented in Figure 10a. The black solid line shows that the forming stress of the unremoved substrate was identical to the thermal stress trend in the simulation. Simultaneously, the residual stress trend of the stress release after the removal of the substrate was also consistent with the black dotted line trend. It can also be seen in Figure 10b that the values of the two sets of emulation stress deviation before and after the removal of the substrate were very small, and measurement errors of experimental stress might exist. However, the trend of stress release was consistent before and after the removal of the substrate. This proved the simulation algorithm’s validity.

5.2. Residual Deformation

Figure 11 presents the macroscopic deformation of the forming object. Figure 11a presents the physical image of a set of parameters that were not simulated. Moreover, the thermal deformation was quite high (δMax ≈ 2.3 mm). In particular, severe warping occurred at the edge and four corners, causing forming failure. However, it could be validated that the higher deformation position was at the corner and the maximum deformation amount was at the support of the solidified parts. On the other hand, the thermal deformation data were obtained through the selection of a better set of parameters from the simulation that was within the yield strength range of the material. The physical part of the corresponding process parameters is presented in Figure 11b. The design requirements of the parts were basically attained, and the best result could be optimized through the simulation to obtain improved part formation.

6. Conclusions

In this paper, the simulation of laser additive manufacturing was studied through thermodynamic coupling and elastoplastic theory. The simulation results demonstrated that the thermal stress and its strain corresponded to the geometrical deformation, when the part was quickly heated and the material rapidly solidified. Through simulation case analysis, the main conclusions were as follows:
  • According to the reasonable design simulation algorithm and process parameters, the simulation process of the SLM parts was completed. Consequently, the thermodynamic coupling algorithm was simple and effective, while the thermal stress and thermal strain data were calculated to draw the curve.
  • For the simulated sample, the thermal stress increased from the substrate to the upper surface layer by layer. While the stress was reduced when the substrate was removed, the stress decreased from the substrate to the upper surface.
  • For the forming plane, the uniaxial stress reached the tension and pressure equilibrium state. Through the σxyz comparison, the same three areas—Areas I, II, and III (in Figure 7d–f)—showed tensile and compressive stress, but the amplitude and breadth were highly different. Furthermore, the maximum residual stresses of the 316L stainless steel under these process parameters were σxMax = 295 MPa, σyMax = 283 MPa, and σzMax = 305 MPa.
  • The changes of strain and thermal stress trends were relative, while the macroscopic geometric deformation occurred. From the simulation results, it could be deduced that the thermal deformation and thermal stress were in positive proportion. The higher deformation occurred at the corner of the same plane and the maximum deformation amount was located at the support toward the solid parts.
  • After the simulation, a set of optimizing technological parameters in the experiment was printed in the case model. The characteristics of the experimentally formed parts were consistent with the simulation results. It was observed that the simulation analysis could effectively predict the quality of the forming parts, which proved instructive to the practical production.

Author Contributions

X.S. conceived and designed the experiments; P.B. designed and performed the simulation and experiments; J.D. compared and analyzed the experimental and simulation data.

Funding

This study was funded by the Key Research Projects of Shaanxi Provincial Department of Education (No. 18JS097) and the Shaanxi Key Laboratory of Surface Engineering and Remanufacturing Tianyuan Fund Project (No. tywl2019-07).

Acknowledgments

This work was supported by the Shaanxi Key Laboratory of Surface Engineering and Remanufacturing, CH. The authors are also grateful for the support of Prof. Shi, University of Cincinnati, UK.

Conflicts of Interest

The authors declare that they have no conflicts of interest.

References

  1. Hitzler, L.; Merkel, M.; Hall, W.; Öchsner, A. A Review of Metal Fabricated with Laser- and Powder-Bed Based Additive Manufacturing Techniques: Process, Nomenclature, Materials, Achievable Properties, and its Utilization in the Medical Sector. Adv. Eng. Mater. 2018, 20, 1700658. [Google Scholar] [CrossRef]
  2. Debroy, T.; Wei, H.; Zuback, J.; Mukherjee, T.; Zhang, W. Additive manufacturing of metallic components—Process, structure and properties. Prog. Mater Sci. 2018, 92, 112–224. [Google Scholar] [CrossRef]
  3. Yap, C.Y.; Chua, C.K.; Dong, Z.L.; Liu, Z.H.; Zhang, D.Q.; Loh, L.E. Review of selective laser melting: Materials and applications. Appl. Phys. Rev. 2015, 2, 041101. [Google Scholar] [CrossRef]
  4. Ren, X.; Shao, H.; Lin, T.; Zheng, H. 3d gel-printing—an additive manufacturing method for producing complex shape parts. Mater. Des. 2016, 101, 80–87. [Google Scholar] [CrossRef]
  5. Lee, H.; Lim, C.H.J.; Low, M.J.; Tham, N.; Murukeshan, V.M.; Kim, Y.J. Lasers in additive manufacturing: A review. Int. J. Precis. Eng. and Manuf. Green Technol. 2017, 4, 307–322. [Google Scholar] [CrossRef]
  6. Van Belle, L.; Agazzi, A. Inverse thermal analysis of melting pool in selective laser melting process. Key Eng. Mater. 2015, 651, 1519–1524. [Google Scholar] [CrossRef]
  7. Debroy, T.; Zhang, W.; Turner, J.; Babu, S.S. Building digital twins of 3d printing machines. Scr. Mater. 2017, 135, 119–124. [Google Scholar] [CrossRef]
  8. Khairallah, S.A.; Anderson, A.T.; Rubenchik, A.; King, W.E. Laser powder-bed fusion additive manufacturing: Physics of complex melt flow and formation mechanisms of pores, spatter, and denudation zones. Acta Mater. 2016, 108, 36–45. [Google Scholar] [CrossRef] [Green Version]
  9. Huang, Y.; Yang, L.J.; Du, X.Z.; Yang, Y.P. Finite element analysis of thermal behavior of metal powder during selective laser melting. Int. J. Therm. Sci. 2016, 104, 146–157. [Google Scholar] [CrossRef]
  10. Foroozmehr, A.; Badrossamay, M.; Foroozmehr, E.; Golabi, S. Finite element simulation of selective laser melting process considering optical penetration depth of laser in powder bed. Mater. Des. 2016, 89, 255–263. [Google Scholar] [CrossRef]
  11. Zohdi, T.I. Dynamic thermomechanical modeling and simulation of the design of rapid free-form 3d printing processes with evolutionary machine learning. Comput. Meth. Appl. Mech. Eng. 2018, 331, 343–362. [Google Scholar] [CrossRef]
  12. Wu, A.S.; Brown, D.W.; Kumar, M.; Gallegos, G.F.; King, W.E. An experimental investigation into additive manufacturing-induced residual stresses in 316l stainless steel. Metall. Mater. Trans. A 2014, 45, 6260–6270. [Google Scholar] [CrossRef]
  13. Liu, Y.; Yang, Y.; Wang, D. A study on the residual stress during selective laser melting (slm) of metallic powder. Int. J. Adv. Manuf. Technol. 2016, 87, 647–656. [Google Scholar] [CrossRef]
  14. An, K.; Yuan, L.; Dial, L.; Spinelli, I.; Stoica, A.D.; Gao, Y. Neutron residual stress measurement and numerical modeling in a curved thin-walled structure by laser powder bed fusion additive manufacturing. Mater. Des. 2017, 135, 122–132. [Google Scholar] [CrossRef]
  15. Matsumoto, M.; Shiomi, M.; Osakada, K.; Abe, F. Finite element analysis of single layer forming on metallic powder bed in rapid prototyping by selective laser processing. Int. J. Mach. Tools Manuf. 2002, 42, 61–67. [Google Scholar] [CrossRef]
  16. Krol, T.A.; Seidel, C.; Zaeh, M.F. Prioritization of process parameters for an efficient optimisation of additive manufacturing by means of a finite element method. Proced. Cirp. 2013, 12, 169–174. [Google Scholar] [CrossRef]
  17. Hussein, A.; Hao, L.; Yan, C.; Everson, R. Finite element simulation of the temperature and stress fields in single layers built without-support in selective laser melting. Mater. Des. 2013, 52, 638–647. [Google Scholar] [CrossRef]
  18. Criales, L.E.; Arısoy, Y.M.; Özel, T. Sensitivity analysis of material and process parameters in finite element modeling of selective laser melting of inconel 625. Int. J. Adv. Manuf. Technol. 2016, 86, 1–14. [Google Scholar] [CrossRef]
  19. Vastola, G.; Zhang, G.; Pei, Q.X.; Zhang, Y.W. Controlling of residual stress in additive manufacturing of ti6al4v by finite element modeling. Addit. Manuf. 2016, 12, 231–239. [Google Scholar] [CrossRef]
  20. Parry, L.; Ashcroft, I.A.; Wildman, R.D. Understanding the effect of laser scan strategy on residual stress in selective laser melting through thermo-mechanical simulation. Addit. Manuf. 2016, 12, 1–15. [Google Scholar] [CrossRef] [Green Version]
  21. Gu, D.; He, B. Finite element simulation and experimental investigation of residual stresses in selective laser melted ti–ni shape memory alloy. Comput. Mater. Sci. 2016, 117, 221–232. [Google Scholar] [CrossRef]
  22. Yang, Q.; Zhang, P.; Cheng, L.; Min, Z.; Chyu, M.; To, A.C. Finite element modeling and validation of thermomechanical behavior of ti-6al-4v in directed energy deposition additive manufacturing. Addit. Manuf. 2016, 12, 169–177. [Google Scholar] [CrossRef]
  23. Pei, W.; Wei, Z.; Zhen, C.; Li, J.; Zhang, S.; Du, J. Numerical simulation and parametric analysis of selective laser melting process of alsi10mg powder. Appl. Phys. A 2017, 123, 540. [Google Scholar] [CrossRef]
  24. Zhao, X.; Iyer, A.; Promoppatum, P.; Yao, S.C. Numerical modeling of the thermal behavior and residual stress in the direct metal laser sintering process of titanium alloy products. Addit. Manuf. 2017, 14, 126–136. [Google Scholar] [CrossRef]
  25. Belle, L.V. Numerical simulation of complex part manufactured by selective laser melting process. In Proceedings of the International Conference of Global Network for Innovative Technology and Awam International Conference in Civil Engineering, Penang, Malaysia, 8–9 August 2017. [Google Scholar]
  26. Li, Y.; Zhou, K.; Tan, P.; Shu, B.T.; Chua, C.K.; Leong, K.F. Modeling temperature and residual stress fields in selective laser melting. Int. J. Mech. Sci. 2018, 136, 24–35. [Google Scholar] [CrossRef]
  27. Ali, H.; Ghadbeigi, H.; Mumtaz, K. Residual stress development in selective laser-melted ti6al4v: A parametric thermal modelling approach. Int. J. Adv. Manuf. Technol. 2018, 97, 2621–2633. [Google Scholar] [CrossRef]
  28. Luo, C.; Qiu, J.; Yan, Y.; Yang, J.; Uher, C.; Tang, X. Finite element analysis of temperature and stress fields during the selective laser melting process of thermoelectric snte. J. Mater. Process. Technol. 2018, 261, 74–85. [Google Scholar] [CrossRef]
  29. Arni, R.; Gupta, S.K. Manufacturability analysis of flatness tolerances in solid freeform fabrication. J. Mech. Des. 2001, 123, 148–156. [Google Scholar] [CrossRef]
  30. Rattanawong, W.; Masood, S.H.; Iovenitti, P. A volumetric approach to part-build orientations in rapid prototyping. J. Mater. Process. Technol. 2001, 119, 348–353. [Google Scholar] [CrossRef]
  31. Masood, S.H.; Rattanawong, W. A generic part orientation system based on volumetric error in rapid prototyping. Int. J. Adv. Manuf. Technol. 2002, 19, 209–216. [Google Scholar] [CrossRef]
  32. Nagahanumaiah; Subburaj, K.; Ravi, B. Computer aided rapid tooling process selection and manufacturability evaluation for injection mold development. Comput. Ind. 2008, 59, 262–276. [Google Scholar] [CrossRef]
  33. Ollison, T.; Berisso, K. Three-dimensional printing build variables that impact cylindricity. J. Ind. Technol. 2010, 26, 1–10. [Google Scholar]
  34. Lynn-Charney, C.; Rosen, D.W. Usage of accuracy models in stereolithography process planning. Rapid Prototyp. J. 2000, 6, 77–87. [Google Scholar] [CrossRef]
  35. Paul, R.; Anand, S. Optimal part orientation in rapid manufacturing process for achieving geometric tolerances. J. Manuf. Syst. 2011, 30, 214–222. [Google Scholar] [CrossRef]
  36. Paul, R.; Anand, S. Material Shrinkage Modeling and Form Error Prediction in Additive Manufacturing Processes. In Proceedings of the 41st NAMRC 2013, University of Wisconsin-Madison, Madison, WI, USA, 10–14 June 2013. [Google Scholar]
  37. Paul, R.; Anand, S.; Gerner, F. Effect of thermal deformation on part errors in metal powder based additive manufacturing processes. J. Manuf. Sci. Eng. 2014, 136, 031009. [Google Scholar] [CrossRef]
  38. Hitzler, L.; Hirsch, J.; Heine, B.; Merkel, M.; Hall, W.; Öchsner, A. On the Anisotropic Mechanical Properties of Selective Laser Melted Stainless Steel. Materials 2017, 10, 1136. [Google Scholar] [CrossRef]
  39. Hitzler, L.; Hirsch, J.; Tomas, J.; Merkel, M.; Hall, W.; Öchsner, A. In-plane Anisotropy of Selective Laser Melted Stainless Steel: The Importance of the Rotation Angle Increment and the Limitation Window. Proc. Inst. Mech. Eng. Part L J. Mater. Des. Appl. 2018, 1464420718757068. [Google Scholar] [CrossRef]
  40. Thijs, L.; Kempen, K.; Kruth, J.P.; Van Humbeeck, J. Fine-structured aluminium products with controllable texture by selective laser melting of pre-alloyed alsi10mg powder. Acta Mater. 2013, 61, 1809–1819. [Google Scholar] [CrossRef]
  41. Sun, Z.; Tan, X.; Tor, S.B.; Yeong, W.Y. Selective laser melting of stainless steel 316L with low porosity and high build rates. Mater. Des. 2016, 104, 197–204. [Google Scholar] [CrossRef]
  42. Prashanth, K.G.; Eckert, J. Formation of metastable cellular microstructures in selective laser melted alloys. J. Alloys Compd. 2017, 707, 27–34. [Google Scholar] [CrossRef]
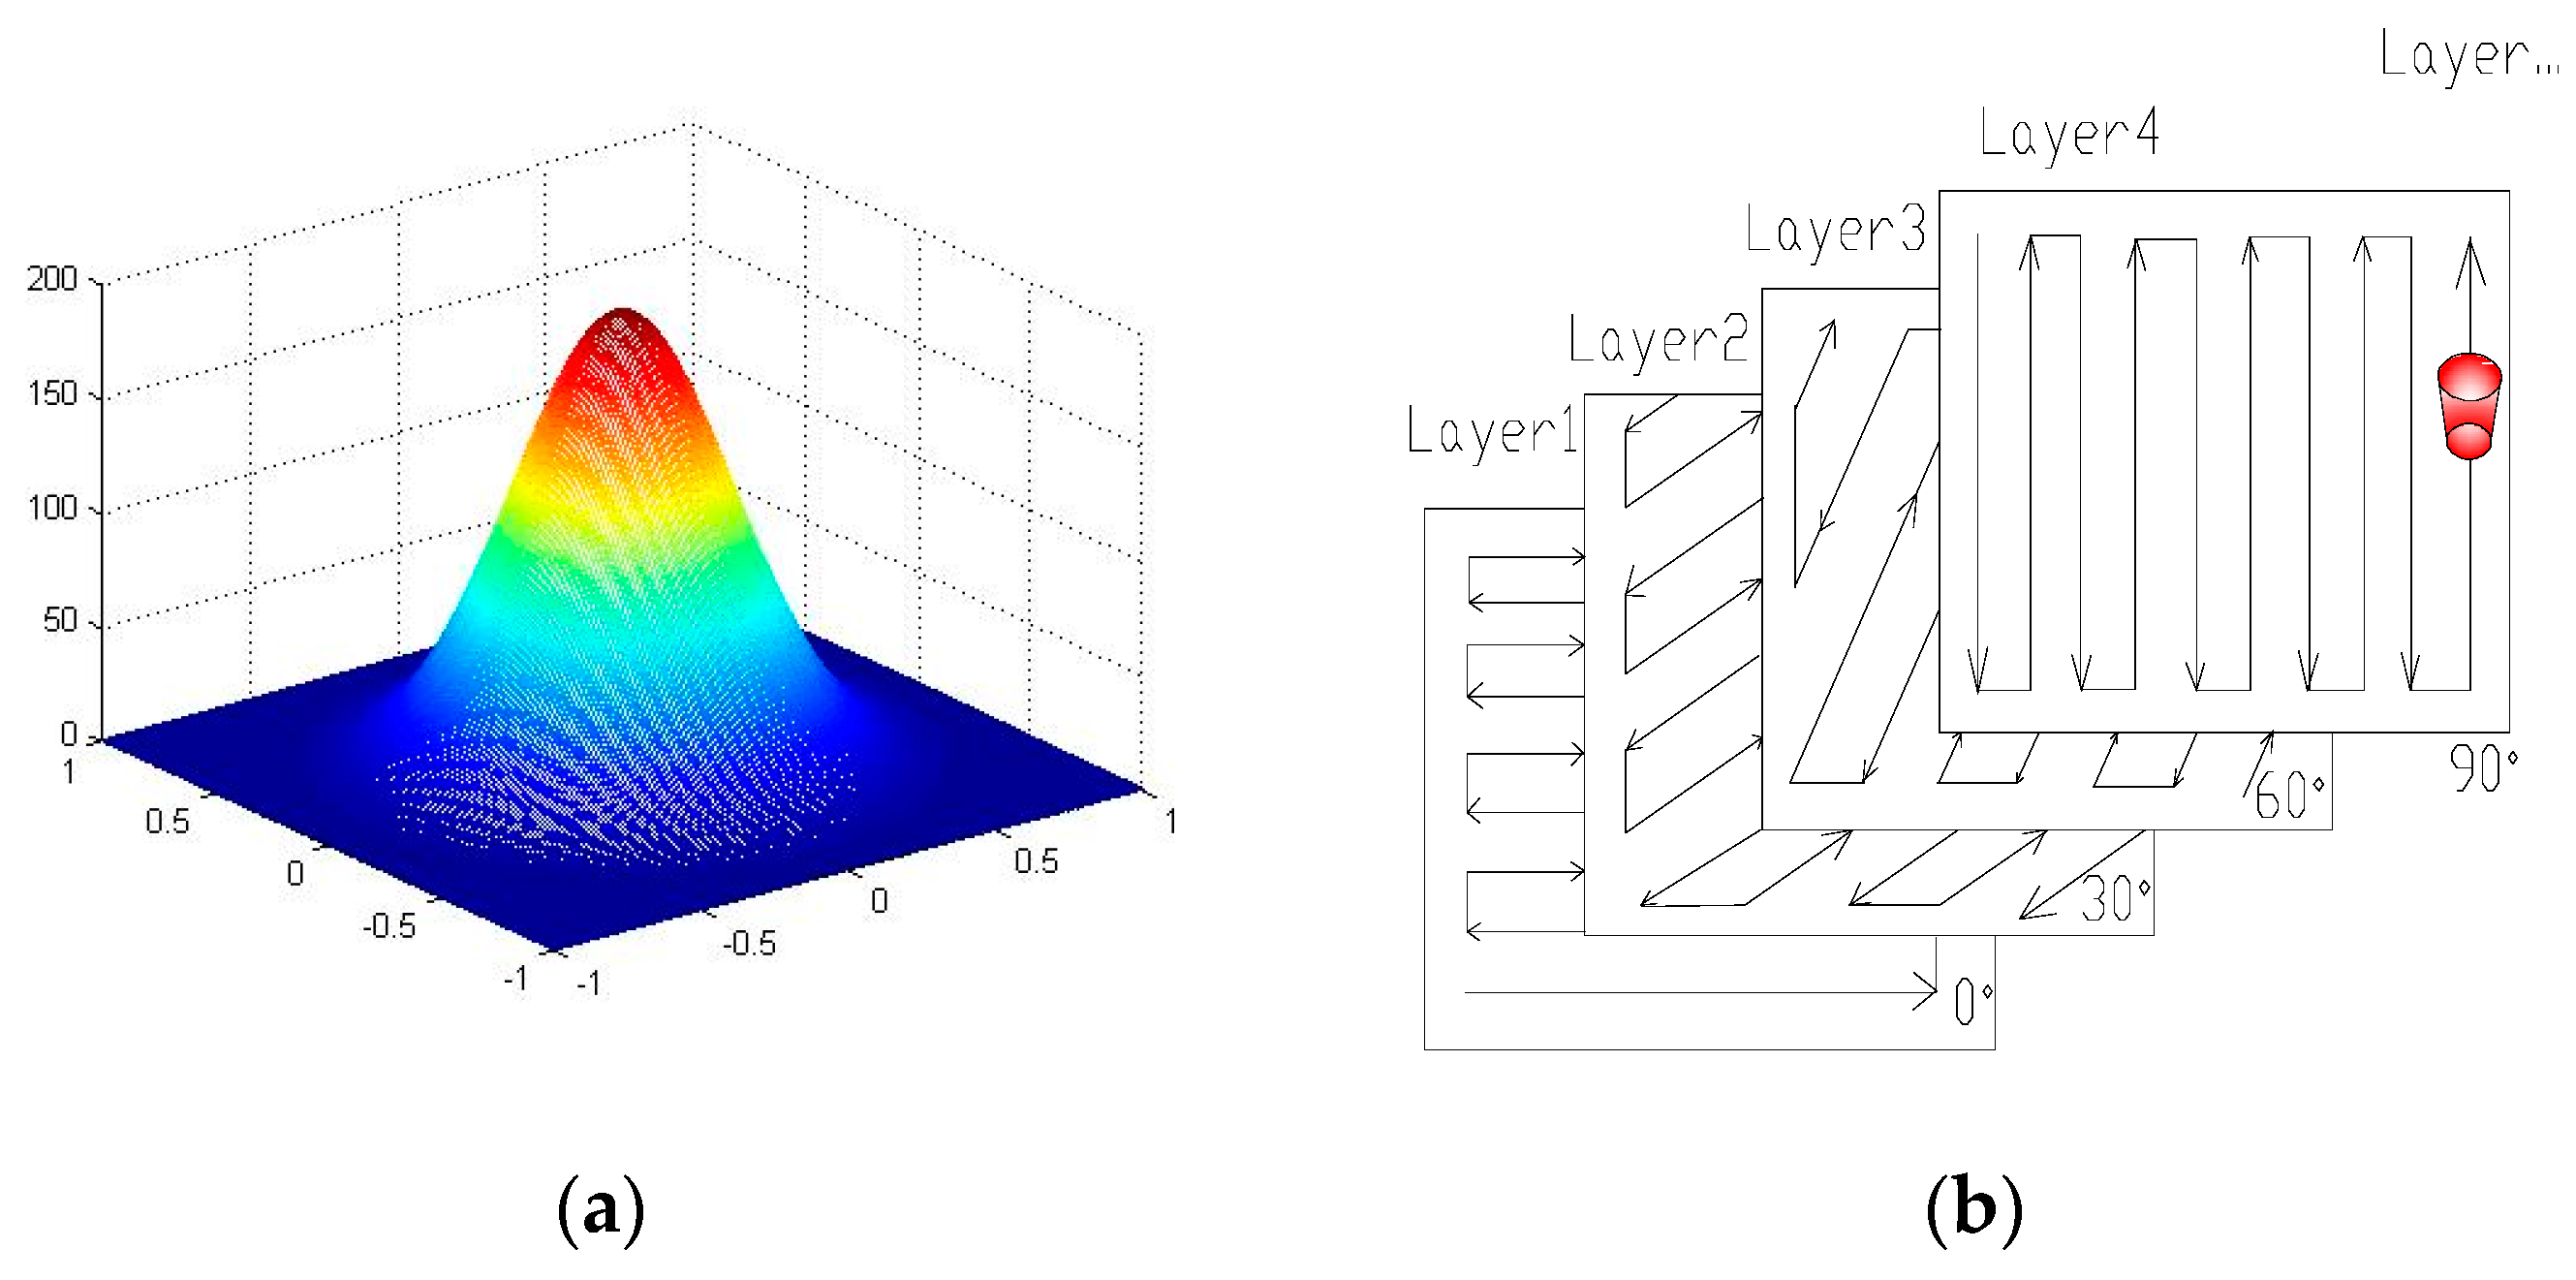
Figure 1. Heat source and scanning path. (a) Gaussian heat source; (b) layer-by-layer scanning path.
Applsci 09 02231 g001
Figure 2. Simulation development flow chart.
Applsci 09 02231 g002
Figure 3. Chart of simulation model. (a) 3D Model; (b) the forming model.
Applsci 09 02231 g003
Figure 4. Phase results of simulation. (a) First stage—support formation; (b) second stage—water cooling channel formation; (c) third stage—nozzle formation; (d) fourth stage—formation of the entire part; (e) fifth stage—support removal.
Applsci 09 02231 g004
Figure 5. Stress–strain curve from the bottom to the surface of the part. (a) Thermal stress; (b) thermal strain.
Applsci 09 02231 g005
Figure 6. Development trend of thermal–residual stress before and after the removal of the substrate: (a) residual Stress; (b) residual strain.
Applsci 09 02231 g006
Figure 7. Distribution trend of uniaxial thermal stress: (a) X-direction nephogram; (b) Y-direction nephogram; (c) Z-direction nephogram; (d) σx scattergram; (e) σy scattergram; (f) σz scattergram.
Applsci 09 02231 g007
Figure 8. Distribution trend of thermal distortion: (a) water nozzle; (b) various locations.
Applsci 09 02231 g008
Figure 9. Printed samples and XRD residual stress tests: (a) part and samples; (b) sample test.
Applsci 09 02231 g009
Figure 10. Residual stress value before and after removal of the substrate: (a) curve; (b) boxplot.
Applsci 09 02231 g010
Figure 11. Physical thermal deformation of forming: (a) serious deformation; (b) ordinary deformation.
Applsci 09 02231 g011
Table 1. Thermal physical parameters of 316L stainless steel (Date from literature [10]).
Temperature T(K)2731563171327933153
316L Stainless Steel PowderThermal conductivity, K (W/m K)00324045
Specific heat capacity, C (J/kg K)0110180290800
Density, ρ (kg/m3)47504450700060005750
Solid 316L Stainless SteelThermal conductivity, K (W/m K)1230324045
Specific heat capacity, C (J/kg K)470700820820820
Density, ρ (kg/m3)80007250700060005750
Thermal expansion, α (1/K)
Young’s modulus, E (GPa)
Poisson’s ratio, μ
12 × 10−6
206
0.3
14 × 10−6
20
0.4
14.2 × 10⁻⁶
13.5
0.41
14.5 × 10⁻⁶
0.2
0.43
15 × 10−6
0.02
0.45
Table 2. Simulation process parameters and laser energy values.
ParametersSimulationExperiment
Laser power100 W100 W
Scan speed500 mm/s500 mm/S
Thickness0.03 mm0.03 mm
Laser absorptivity0.70.7
Substrate Temperature 20 °C20 °C
Materials316L powder316L powder
EquipmentConcept