Article

Numerical Simulation of the Influence of Spur Dikes Spacing on Local Scour and Flow

State Key Laboratory of Eco-Hydraulics in Northwest Arid Region of China, School of Water Resources and Hydropower, Xi’an University of Technology, Xi’an 710048, China
*
Author to whom correspondence should be addressed.
Appl. Sci. 2019, 9(11), 2306; https://doi.org/10.3390/app9112306
Submission received: 26 March 2019 / Revised: 13 May 2019 / Accepted: 31 May 2019 / Published: 4 June 2019
(This article belongs to the Section Civil Engineering)

Abstract

:
The spacing of spur dikes is an important consideration for the layout of spur dike channels. This study focuses on the local scour morphology and flow field characteristics of spur dikes with different spacings. The results show that the maximum scour depth is generally found in the vicinity of the first spur dike head. With the increase of the spacing of spur dikes, the shielding effect of the first spur dike is weakened. The maximum velocity in the main flow zone is twice that of the approach flow velocity in the fixed bed. But it is approximately the same as the incoming velocity in equilibrium scouring. The maximum turbulent energy appears to be mainly located in the backflow area of the fourth spur dike in the fixed bed, while the maximum value appears at the second spur dike head in the movable bed. Further, the shear stress decreases as scouring develops. Pearson correlation analysis was carried out between scour depth and shear stress. The analysis results are significantly correlated, indicating that the bed shear stress plays a prominent role in the scouring process. These discoveries can serve as a guide to determine the most reasonable spacing of spur dikes.

1. Introduction

Investigation of the local scour and flow field around spur dikes has a long history and remains a significant research focus area. The spacing between spur dikes is an important parameter for developing an appropriate relationship between multiple spur dikes in a group. Barbhuiya et al. [1], Dey et al. [2], and Fukuoka et al. [3] studied the scour processes around grouped spur dikes on the basis of aspect ratios, i.e., L/l, where L is the length (distance) between two neighboring spur dikes, and l is the length of the spur dike. The maximum scour depth varies with the location of the spur dike under investigation. Usually, the maximum scour is found near the head of the first upstream spur dike, while the other scour depths vary due to the effect of neighboring spur dikes [4]. Zhang et al. [5] analyzed the scour problem of grouped spur dikes with spacing for 3l. Their study shows that the maximum scour depth of dikes along the groyne head is reduced, and the fourth spur dike scour depth can be ignored in a group of nine. Basser et al. [6] found that the maximum scour depth is located at the first spur dike. For spur dike stability, a protection spur dike is positioned before the first one to reduce the impact of the scour on spur dike safety. Use of the flume test revealed that the distance between the cover and first spur dikes must be 1.5–2 times the groyne length. Pandey et al. [7] concluded that the maximum scour depth always develops on the upstream side of the first spur dike. After this experimental study, it was found that the first spur dike was more affected than the second, but this finding can only be applied up to 4l spacing for the case of two spur dikes. When 4l spacing is exceeded, both spur dikes experience approximately the same amount of scour under clear-water conditions. Tominaga and Sadat [8] found that the scour depth and volume decrease with the increase of spur dike spacing when the spacing is less than 4l for an impermeable spur dike. When the spacing is 4l, the maximum scour depth decreases to 44% of the maximum scour depth for a single spur dike. Moreover, when the spur dike distance is 6l, the maximum scour depth and erosion volume are larger than when it is 4l. Considering the maximum scour depth and erosion volume, 4l is the most suitable distance for impermeable spur dike spacing.
The existence of the spur dike changes the flow field characteristics of the original flow field, creating complex hydrodynamic characteristics such as flow separation, vortex shedding, and dive flow, so that the local flow presents strong three-dimensional characteristics. Obtaining accurate flow field information has always been a topic of concern for science and engineering. Nakagawa et al. [9], Muto et al. [10], Choufu et al. [11], and Duan et al. [12] studied the flow behavior around spur dikes. Yaeger [13] studied mean flow and turbulence around a series of straight and angled spur dikes. Measurements showed that the turbulent intensities, Reynolds stresses, and turbulent kinetic energy increase considerably around spur dikes. The highest magnitude of bed shear stress and turbulent kinetic energy was consistently observed around the second spur dike in the series. Acharya [14] observed three-dimensional velocities of flow around spur dikes by Acoustic Doppler Velocimetry (ADV). The conclusion indicated that the initiation and development of local scour is determined by the turbulence intensity in the vertical direction rather than the bed shear stress. Higher shear stresses will transport more bed load, but not necessarily result in local scour. Molinas et al. [15] conducted an experimental study into flow velocity and shear stress. Considering the abutment protrusion ratios and flow conditions, they explained that the velocities near an abutment are magnified up to 1.5 times the approach flow velocity, and the shear stresses are enlarged up to 10 times the approach bed shear stress. Koken and Gogus [16] studied the effect of spur dike length on bed shear stress distribution. They found that the large bed shear stress values and pressure standard deviation values observed around the tip of the spur dike, beneath the upstream part of the main horseshoe vortex and beneath the separated shear layers, increase with increasing spur dike length.
There have been many studies into the flow field and local scour around single spur dikes, but fewer into grouped spur dikes. Moreover, most studies in the literature focus on spur dikes with fixed spacing, with comparatively few studies into the variation of the spacing. In this study, the local scour morphology and flow field characteristics of spur dikes with different spacings are investigated by a combination of the flume experiment and numerical simulation. Further, the variations in velocity, turbulent kinetic energy, and shear stress associated with variations in spur dike spacing are discussed.

2. Numerical Model

A brief introduction to various numerical models is provided below, including the governing equation, the calculation of the free water surface, and the sedimentation scour model.
In this study, turbulence was predicted by the renormalization group (RNG) turbulence model [17]. The governing partial differential equations were integrated over a series of control volumes covering the fluid domain with a staggered-grid finite difference method. The widely used semi-implicit method for press-linked equations (SIMPLE) procedure was included in the model for coupling the pressure and velocity. Further, explicit solver options were adopted in considering viscous stress, free surface pressure, and advection. Considering the complexity of flow around spur dikes, second order monotonicity preservation was employed in momentum advection. Finally, the fractional area volume obstacle representation (FAVOR) solution [18] was used to deal with model boundaries, and the volume of fluid (VOF) method proposed by Hirt and Nichols [19] was used to accurately predict the free surface.

2.1. Sedimentation Scour Model

The model calculates the full sediment transport process including bed-load transport, entrainment, deposition, and suspended load transport for each species [20].

2.1.1. Bed-load Transport

Bed-load transport is the mode of sediment transport due to rolling or bouncing over the surface of the packed bed of sediment.
q b , i = Φ i g ρ i ρ f ρ f d i 3 1 2
Φ i = β i θ i θ c r , i 1.5 c b , i
where q b , i is the volumetric bed-load transport rate in units of volume per width per time, Φ i is the dimensionless bed-load transport rate, g is gravity in absolute value, ρ i is the mass density of sediment grains, ρ f is the fluid density, d i is the grain diameter, β i is the bed-load coefficient, θ i is the Shields parameter, θ c r , i is the critical Shields parameter, and c b , i is the volume fraction of species i in the bed material.
θ i = τ g d i ρ i ρ f ,   θ c r , i = τ c r , i g d i ρ i ρ f
where τ is the bed shear stress, and τ c r , i is the critical bed shear stress.

2.1.2. Entrainment and Deposition

In the model, entrainment and deposition are treated as two opposing micro-processes that take place simultaneously. They are combined to determine the net rate of exchange between packed and suspended sediments. For entrainment, the velocity at which the grains leave the packed bed is termed the lifting velocity [21]:
u l i f t , i = n b α i d , i 0.3 θ i θ c r , i 1.5 g d i s i 1
d , i = d i g s i 1 ν f 2 1 / 3
where α i is the entrainment coefficient of species, usually a constant set as 0.018, n b is the outward normal vector of the packed bed surface, d , i is the dimensionless grain size, s i = ρ i / ρ f , and ν f is the kinematic viscosity of fluid.
Deposition takes place when suspended grains settle onto the packed bed due to the combined effect of gravity, buoyancy, and friction. The settling velocity [22] is expressed as follows:
u s e t t l e , i = g g 10.36 2 + 1.049 d , i 0.3 1 / 2 10.36 ν f d i
where g is the gravity acceleration, and u s e t t l e , i is assumed in the same direction as g .

2.1.3. Suspended Load Transport

Suspended sediment is typically of low concentration and advects with fluid flow. For each species, the suspended sediment concentration is calculated by solving its own transport equation.
C s , i t + C s , i u s , i = D C s , i
u s , i = u ¯ + u s e t t l e , i C s , i ρ i
where C s , i is the suspended sediment mass concentration, which is defined as the sediment mass per volume of fluid-sediment mixture, u s , i is the sediment velocity of species, D is the diffusivity, and u ¯ is the bulk velocity of the fluid-sediment mixture, which is obtained by solving the continuity and Navier–Stokes equations with a turbulence closure model.

3. Laboratory Experiments

A series of experiments were conducted on the local scouring around spur dikes at the State Key Laboratory Base of Eco-hydraulic Engineering in Arid Area, Xi’an University of Technology, China. In this study, three experimental cases were selected to test the performance of the numerical model. The spur dike group was composed of four equal-length and uniformly-spaced spur dikes. The spur dike spacings were 2l, 3l, and 4l in each of the three cases.
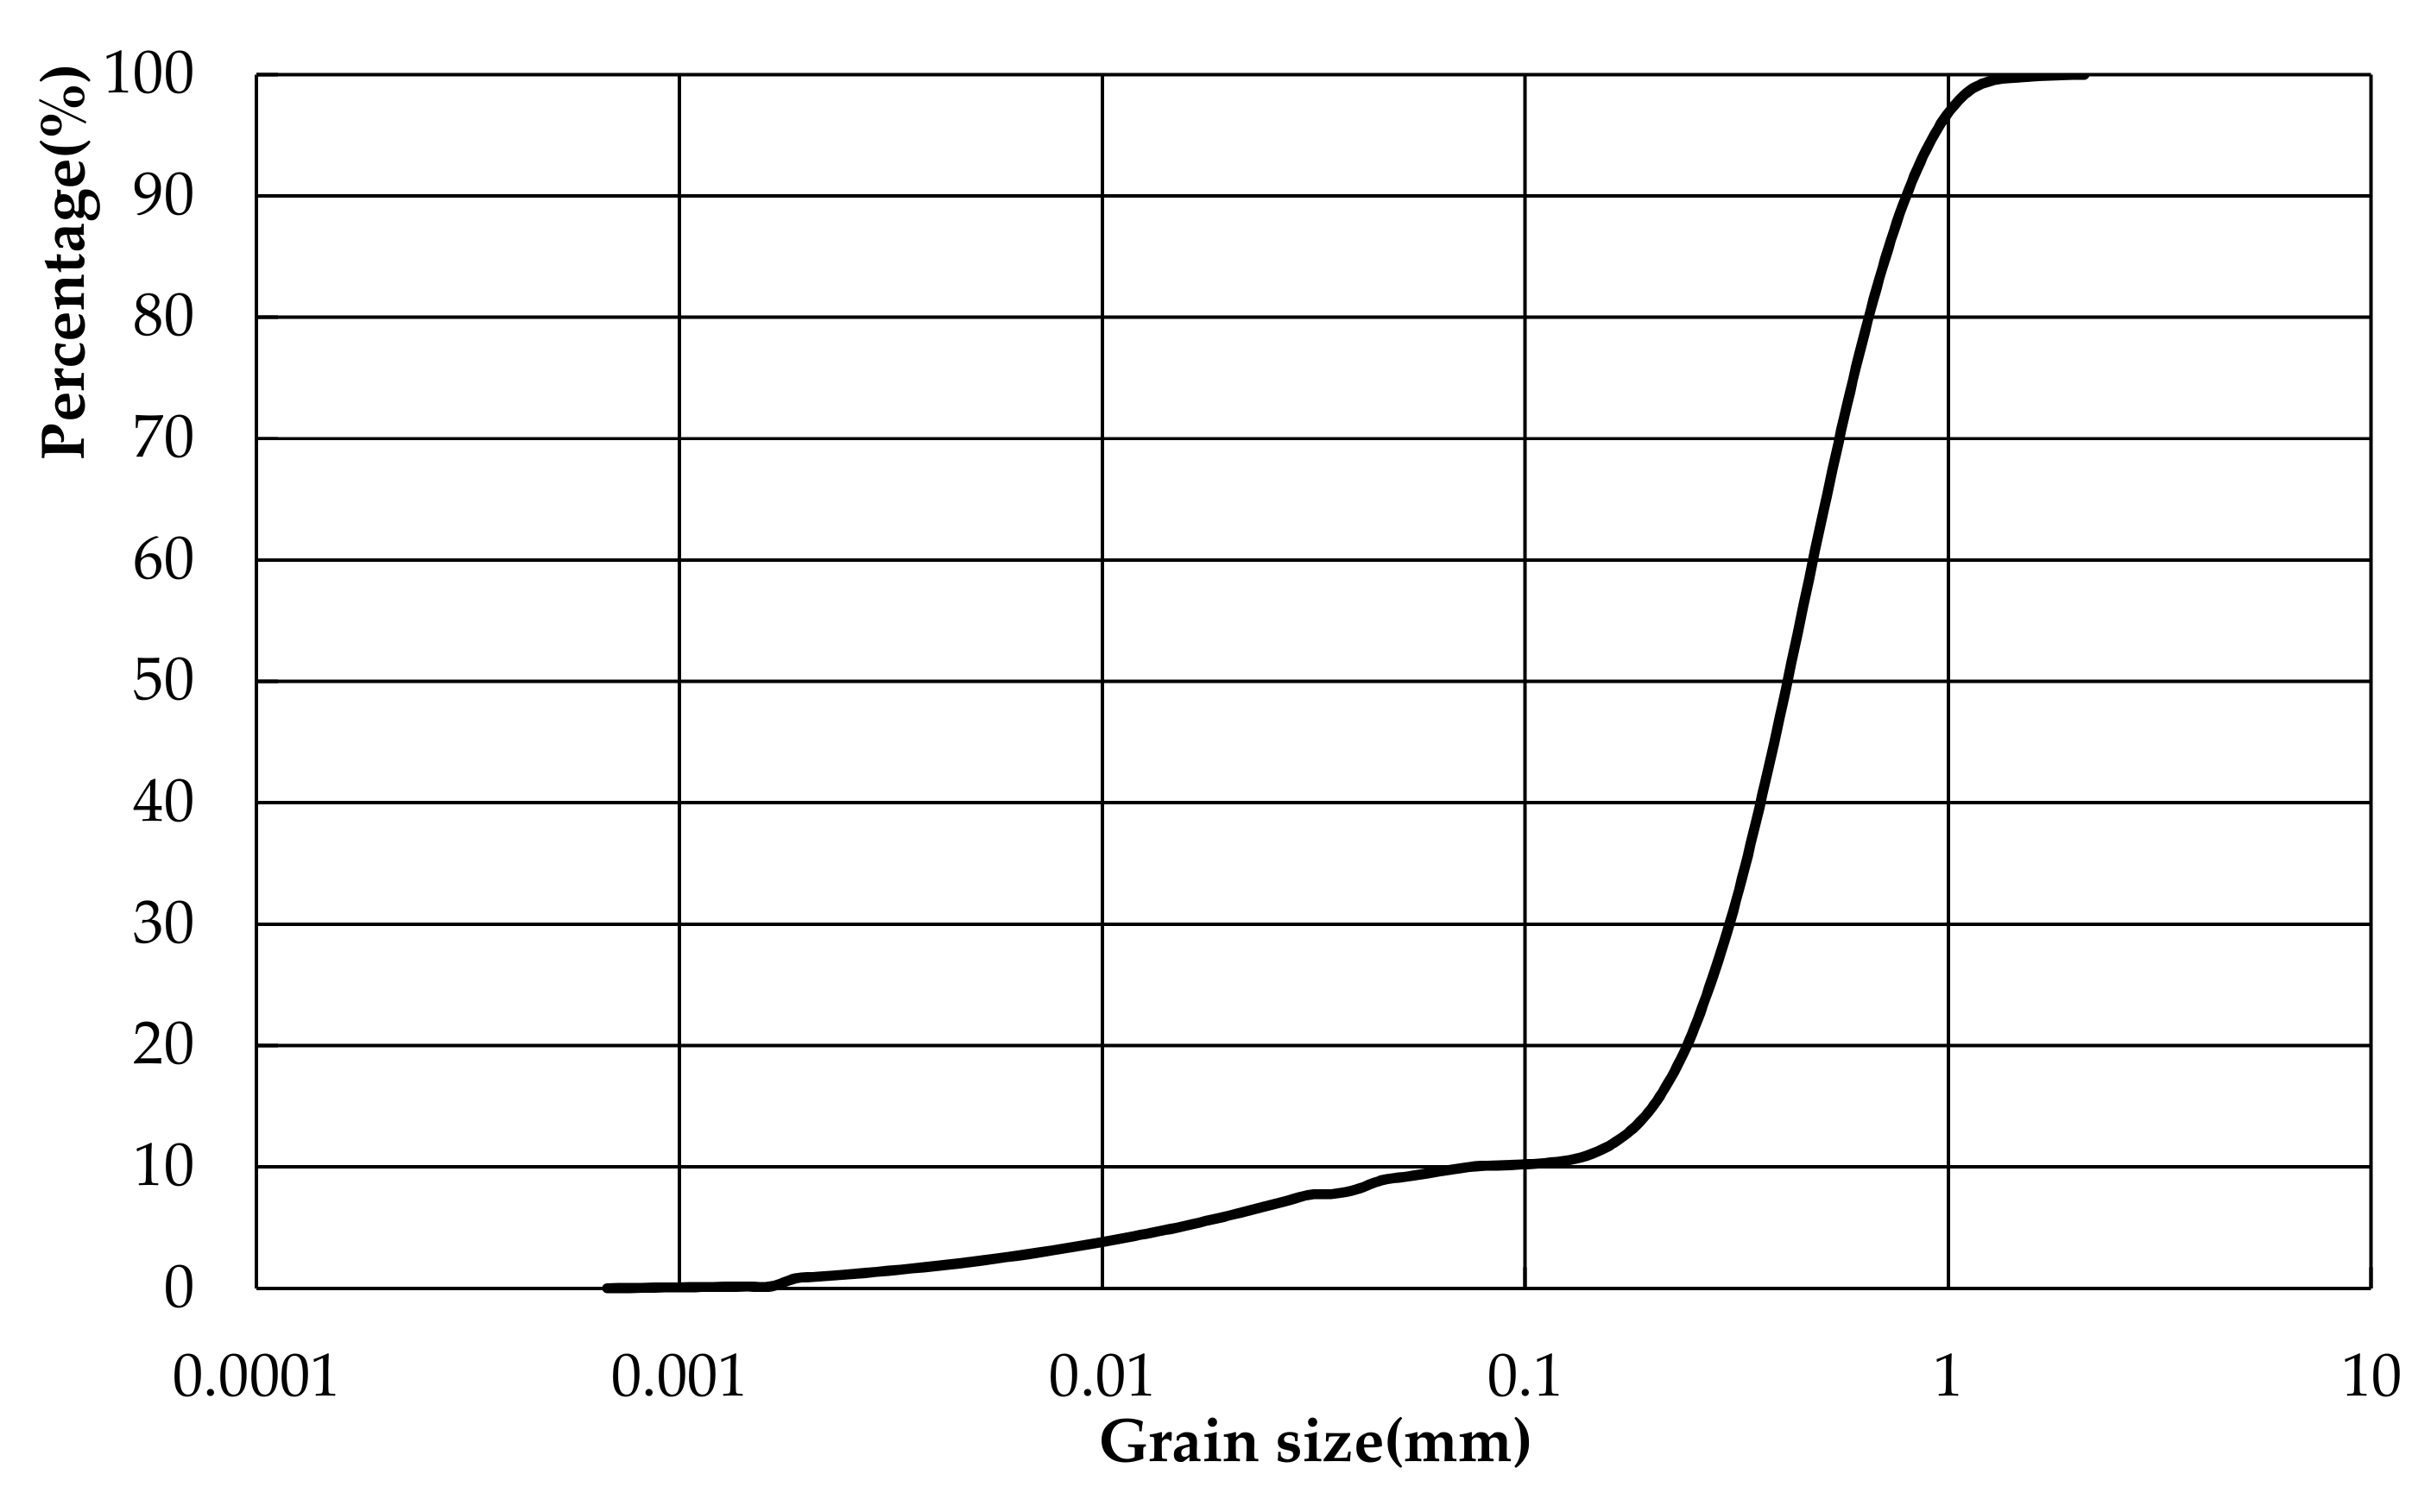
The flume channel was 10 m long, 40 cm wide and 50 cm deep, and consisted of the entrance tank, fixed bed, movable bed and sand recycle zone (Figure 1). The fixed bed was 200 cm long and was composed of gravel and coarse sand, to prevent water entering the sediment observation area pushing all the sediment to one place, and to thereby ensure the water could flow smoothly. The movable bed was 400 cm long and was covered with 20 cm of sand. In this area, a group of impermeable spur dikes were set perpendicular to the right side of the flume. The spur dikes were 10 cm long, 1 cm thick, and 50 cm high, in order to remain unsubmerged throughout the experiments. The first of four spur dikes was placed 100 cm into the observation area, with equal spacing between all four. The sediment grain size was selected to be D50 = 0.473 mm, with the sediment grading curve as shown in Figure 2. The hydraulic conditions under which the experiments were carried out are listed in Table 1. The experiments started with a flat bed and lasted two hours until a quasi-equilibrium condition was reached, with no further significant change in the bed surface. The experiments were conducted under clear-water scour conditions and no sediment was fed into the upstream area.

4. Computational Conditions

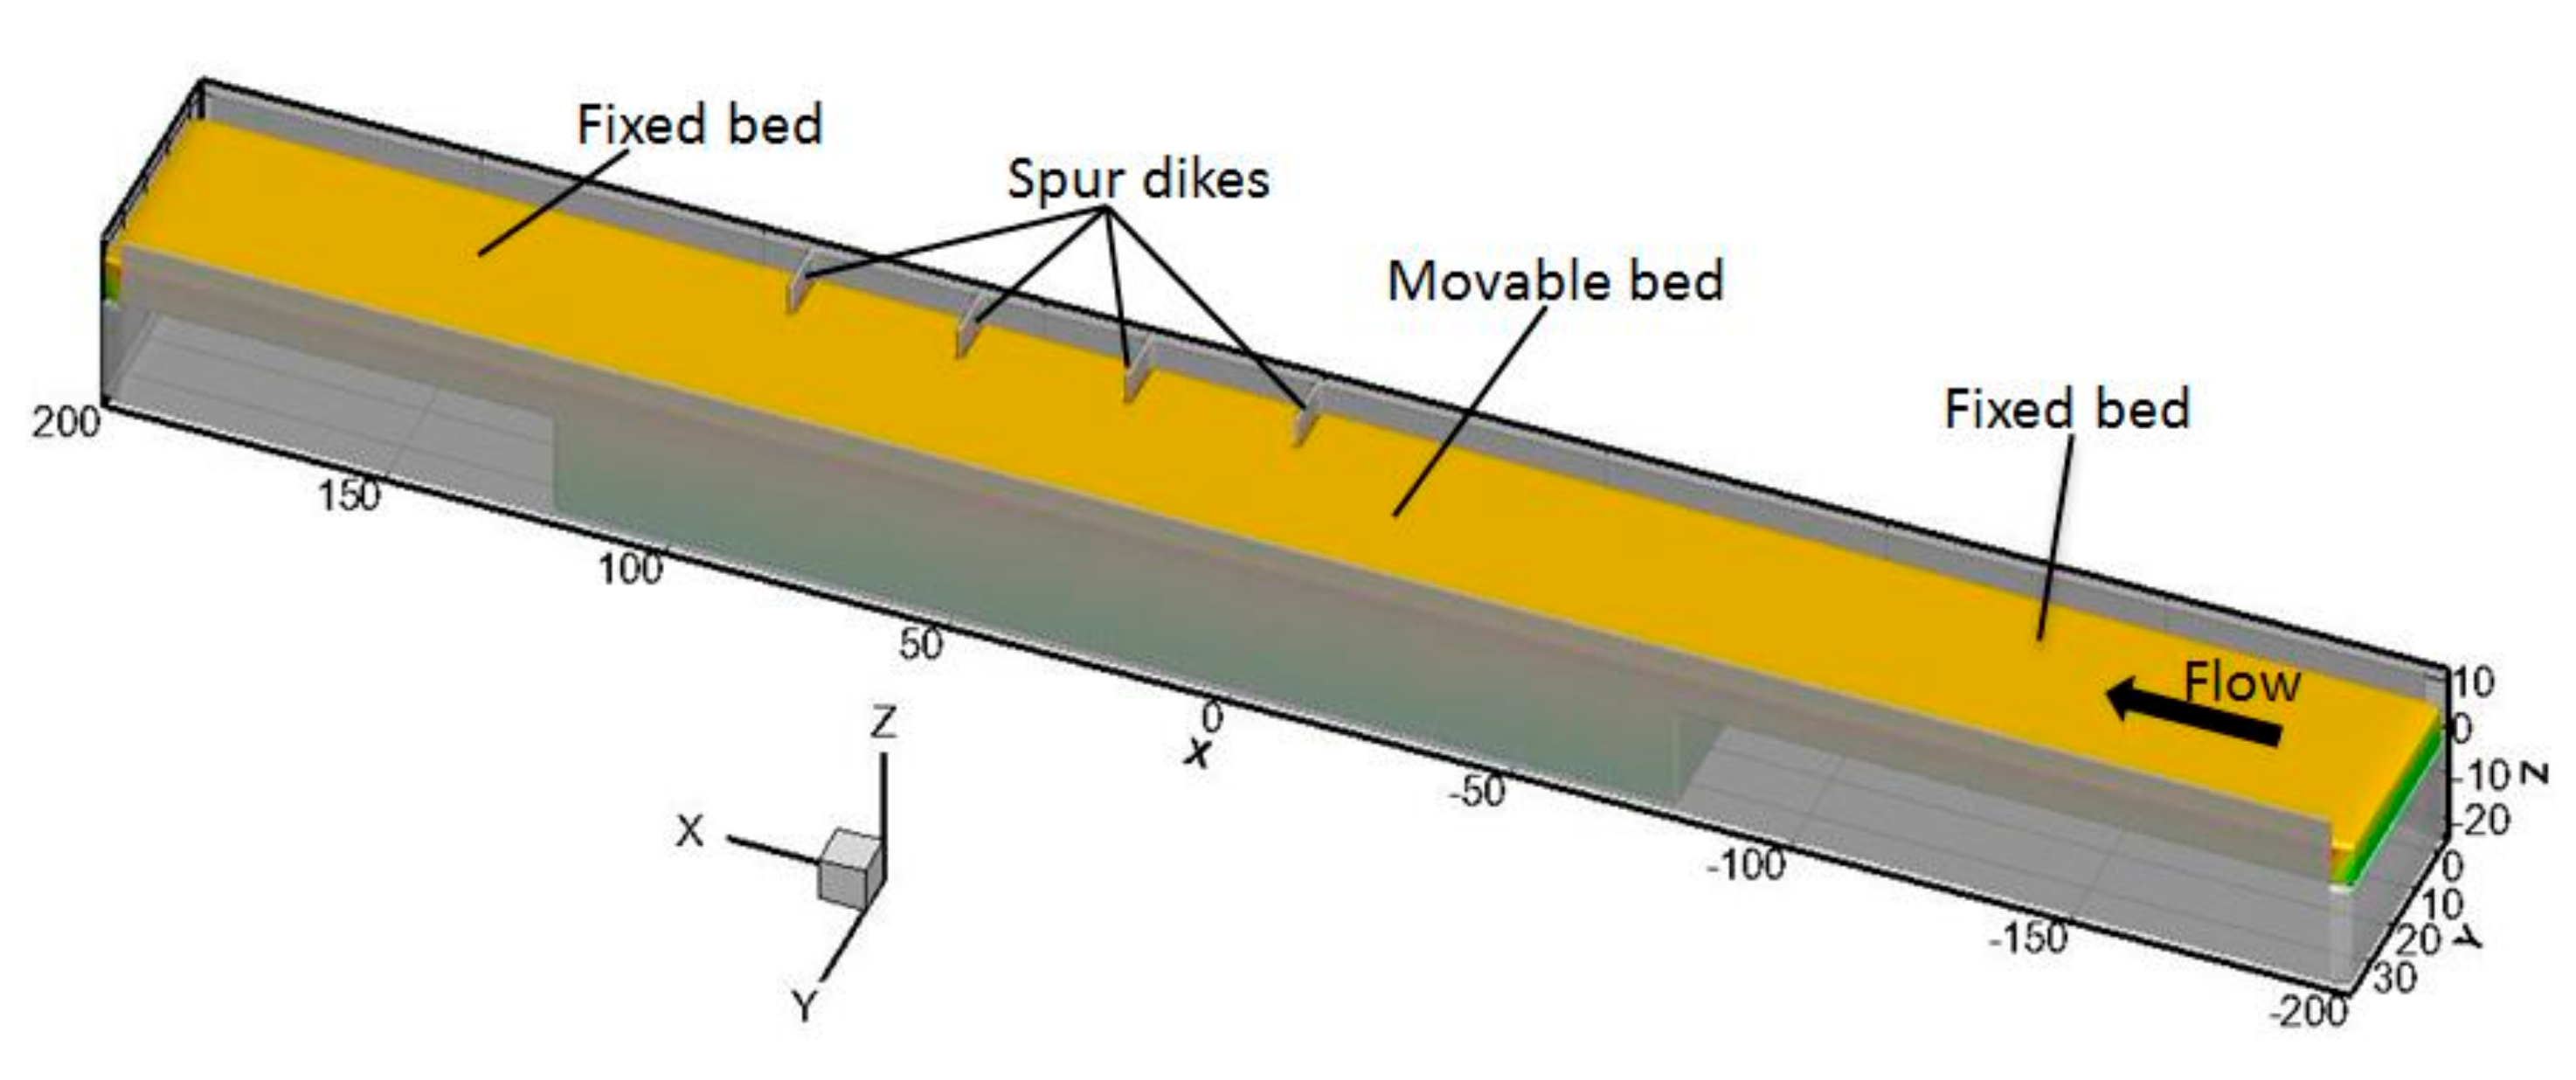
The computational domain was 400 cm long with a fixed bed of 200 cm and a movable bed of 200 cm (Figure 3). In order to ensure calculation stability, the inlet fixed bed section was constructed to be 120 cm long. The movable bed sediment section ranged from −80 to 120 cm with uniform particle size sediment. The outlet fixed bed section made up the rest of the computational domain. When the spacing was 2l, the four groynes were located at 0, 20, 40, and 60 cm; when the spacing was 3l, the four groynes were located at 0, 30, 60, and 90 cm; and when the spacing was 4l, the four groynes were located at −40, 0, 40, and 80 cm.

Grid Convergence Calculation

In the stage of model verification, the calculation regions were divided by 520,800; 1,223,768; 1,978,886 and 2,864,400 grid numbers to verify the effect of grid density on scouring depth. In the simulation process, a grid convergence index (GCI) [23] was computed to obtain an optimal solution in four grid resolutions. The results of the GCI calculations for each grid solution are listed in the following Table 2.
As shown in Table 2, the calculation results using a grid size of 0.5 cm and a grid size of 0.4 cm (the number of grids is 1,978,886 and 2,864,400 respectively) are analogues so that the grid size of 0.5 cm is sufficient to provide representative results. The analysis was based on scouring depth and yielded GCI values less than 2% for all simulated discharges.
A non-uniform structured grid was used in the simulation. The plan view of the computational grid in the vicinity of the spur-dikes group is shown in Figure 4. Due to the complexity of the flow field around the spur dikes, the size of the grid directly affects the accuracy of the calculation results. The surrounding of the spur-dikes group was partially encrypted in the horizontal direction, and the grid was evenly distributed in the vertical direction. The minimum grid size was 0.5 mm, the total grid number was 1,978,886, and the effective computing region of the grid was 1,541,800. The upstream inlet was the flow inlet with a discharge of 9620 cm3/s and a water depth of 9 cm, whereas the outlet was simply a free outflow. The VOF method was adopted for analysis of the upper surface to capture the free surface. All other boundaries were solid walls, and the standard wall function approach was employed in the near-wall area.

5. Results and Discussion

5.1. Local Scour and Bed Topographic Change

5.1.1. Qualitative Analysis

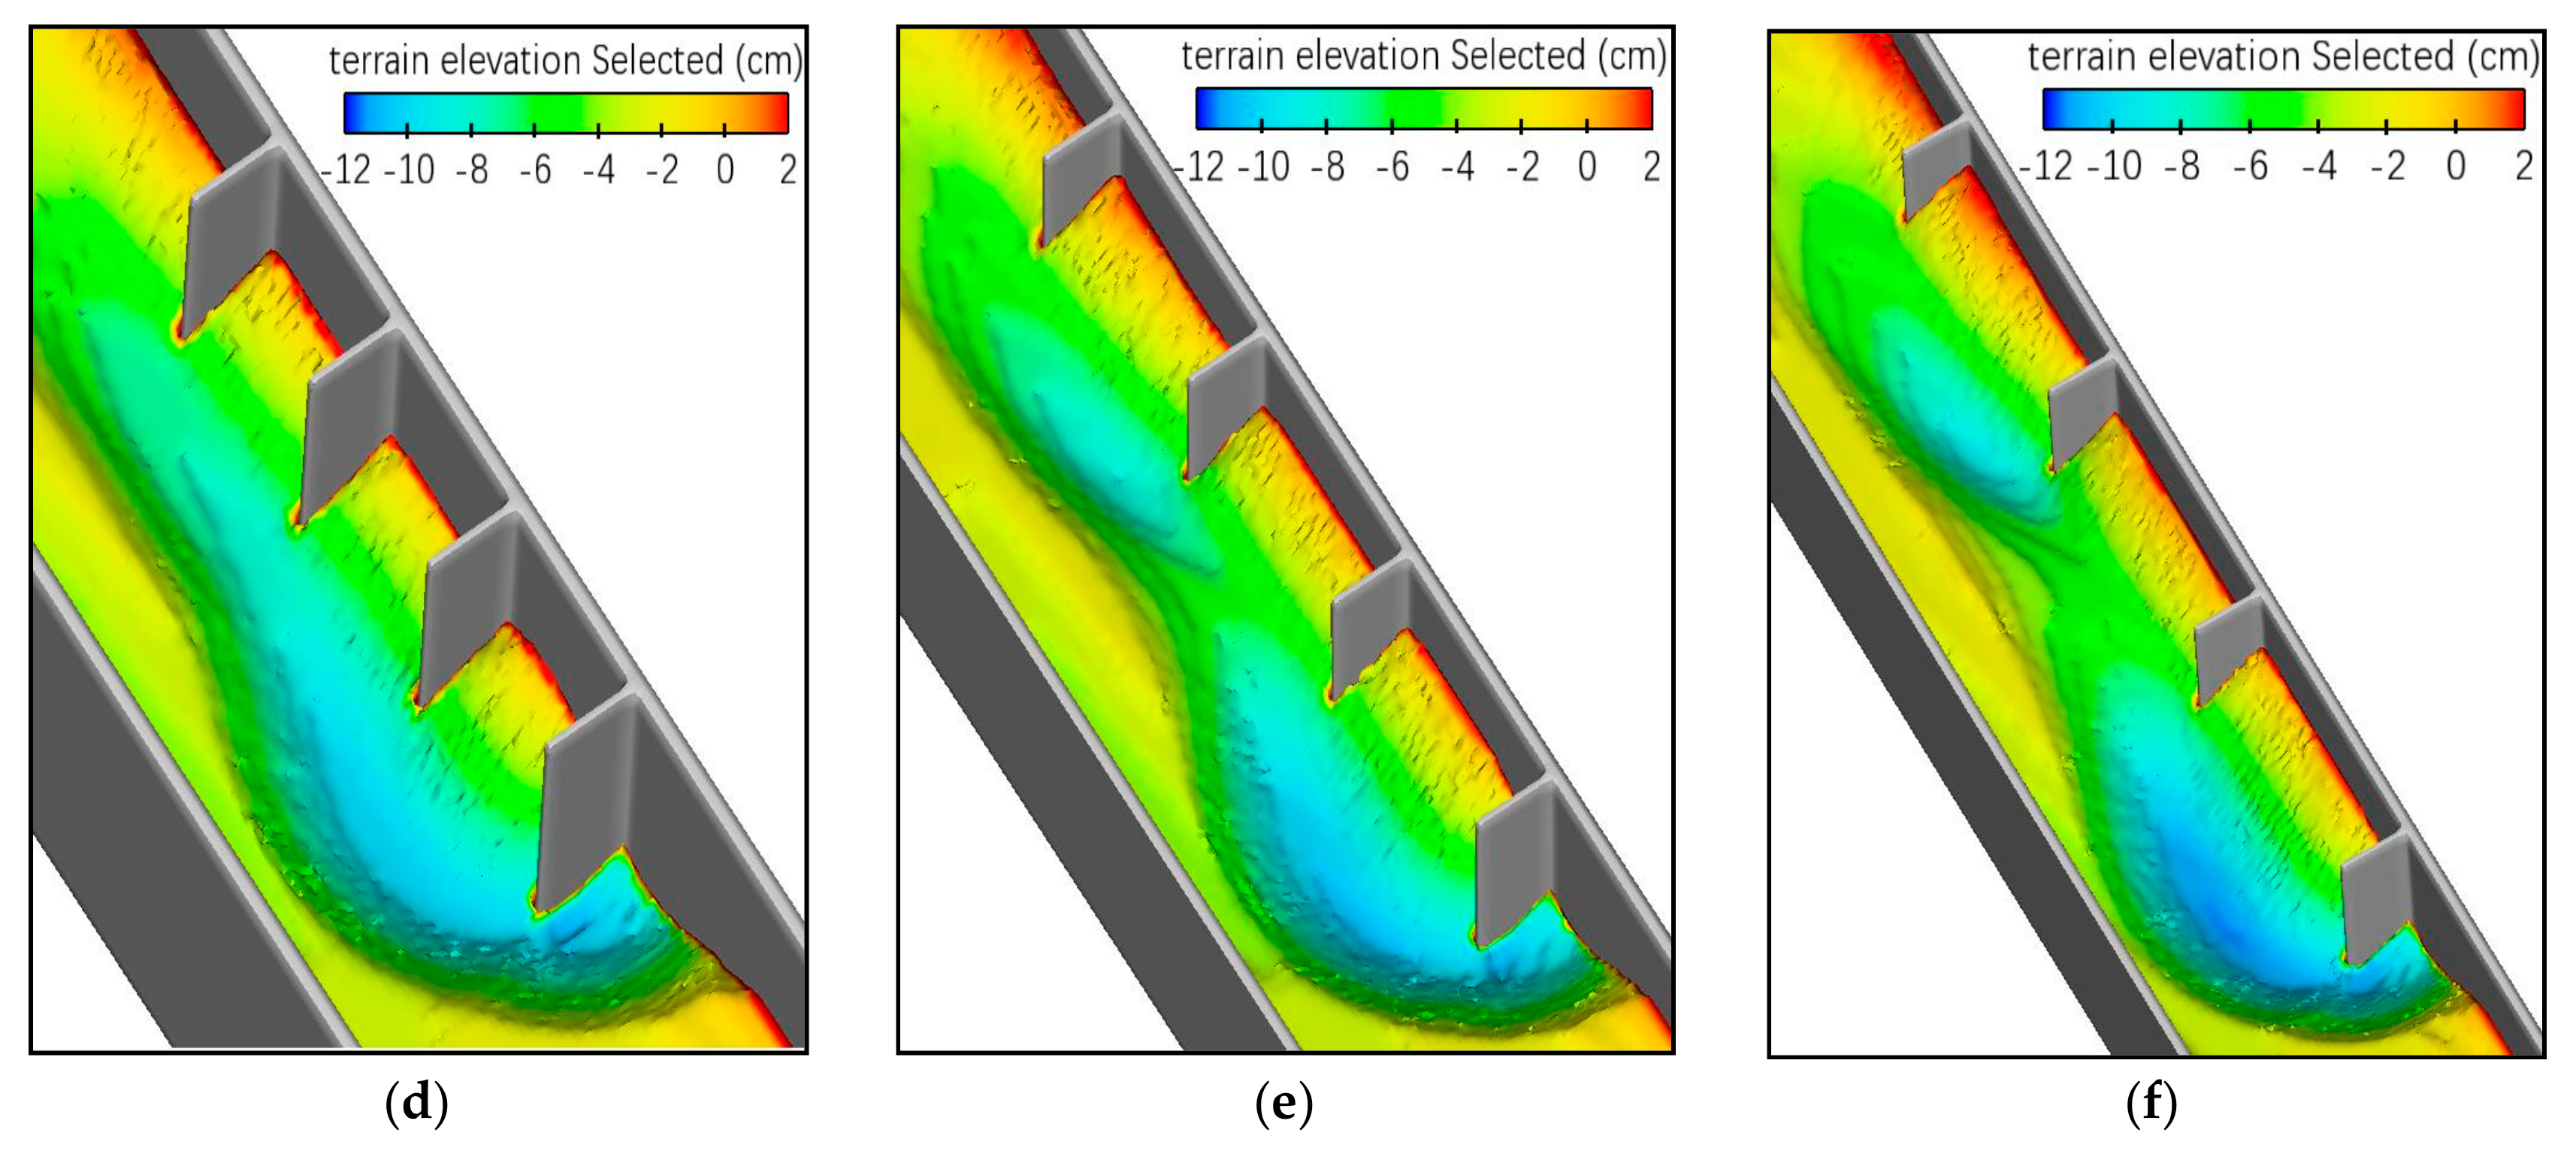
The bed configurations at the final stage are shown in Figure 5. The numerical model was able to predict most of the topographic features observed in the experiments, such as the mainstream erosion zone, the local scour hole, and the corresponding wake deposition in the proximity of the grouped spur dikes. When the inlet condition was determined, the bed configuration was related to the spacing of the grouped spur dikes. With the small spacing, the first spur dike’s shielding effect on the rear spur dikes was strong, but as the spacing grew larger, the shield effect weakened. As can be seen from Figure 5, as the spacing between spur dikes changed, the bed surface morphology changed accordingly, and the shielding effect of spur dike I also gradually changed. With respect to spur dike spacing, with a spacing of 2l, an integral scour zone was formed in the mainstream area, with the simulation results matching the experimental results. With a spacing of 3l, in the experimental results the scouring range of spur dike II was largely covered by the scour range of the spur dike I, as part of the spur dike I downstream scouring. The local scour holes of spur dike III and IV remained basically intact. The simulation results showed two scour pits. With a spacing of 4l, the experimental results showed that the shielding effect of spur dike I only partially affected a section of spur dike II. It can be clearly seen that the local scour morphology of each spur dike remained relatively complete, forming four largely independent scouring holes. In contrast to the experimental results, the simulation results show two separate scour pits, because the shielding effect of spur dike I only affects spur dike II, and the shielding effect of spur dike III only affects spur dike IV. Both the experimental result and the simulation result indicated that the shielding effect of the first spur dike was weakening. On the whole, the numerical simulations reproduce quite well the experimental outcomes under a qualitative point of view.

5.1.2. Quantitative Analysis

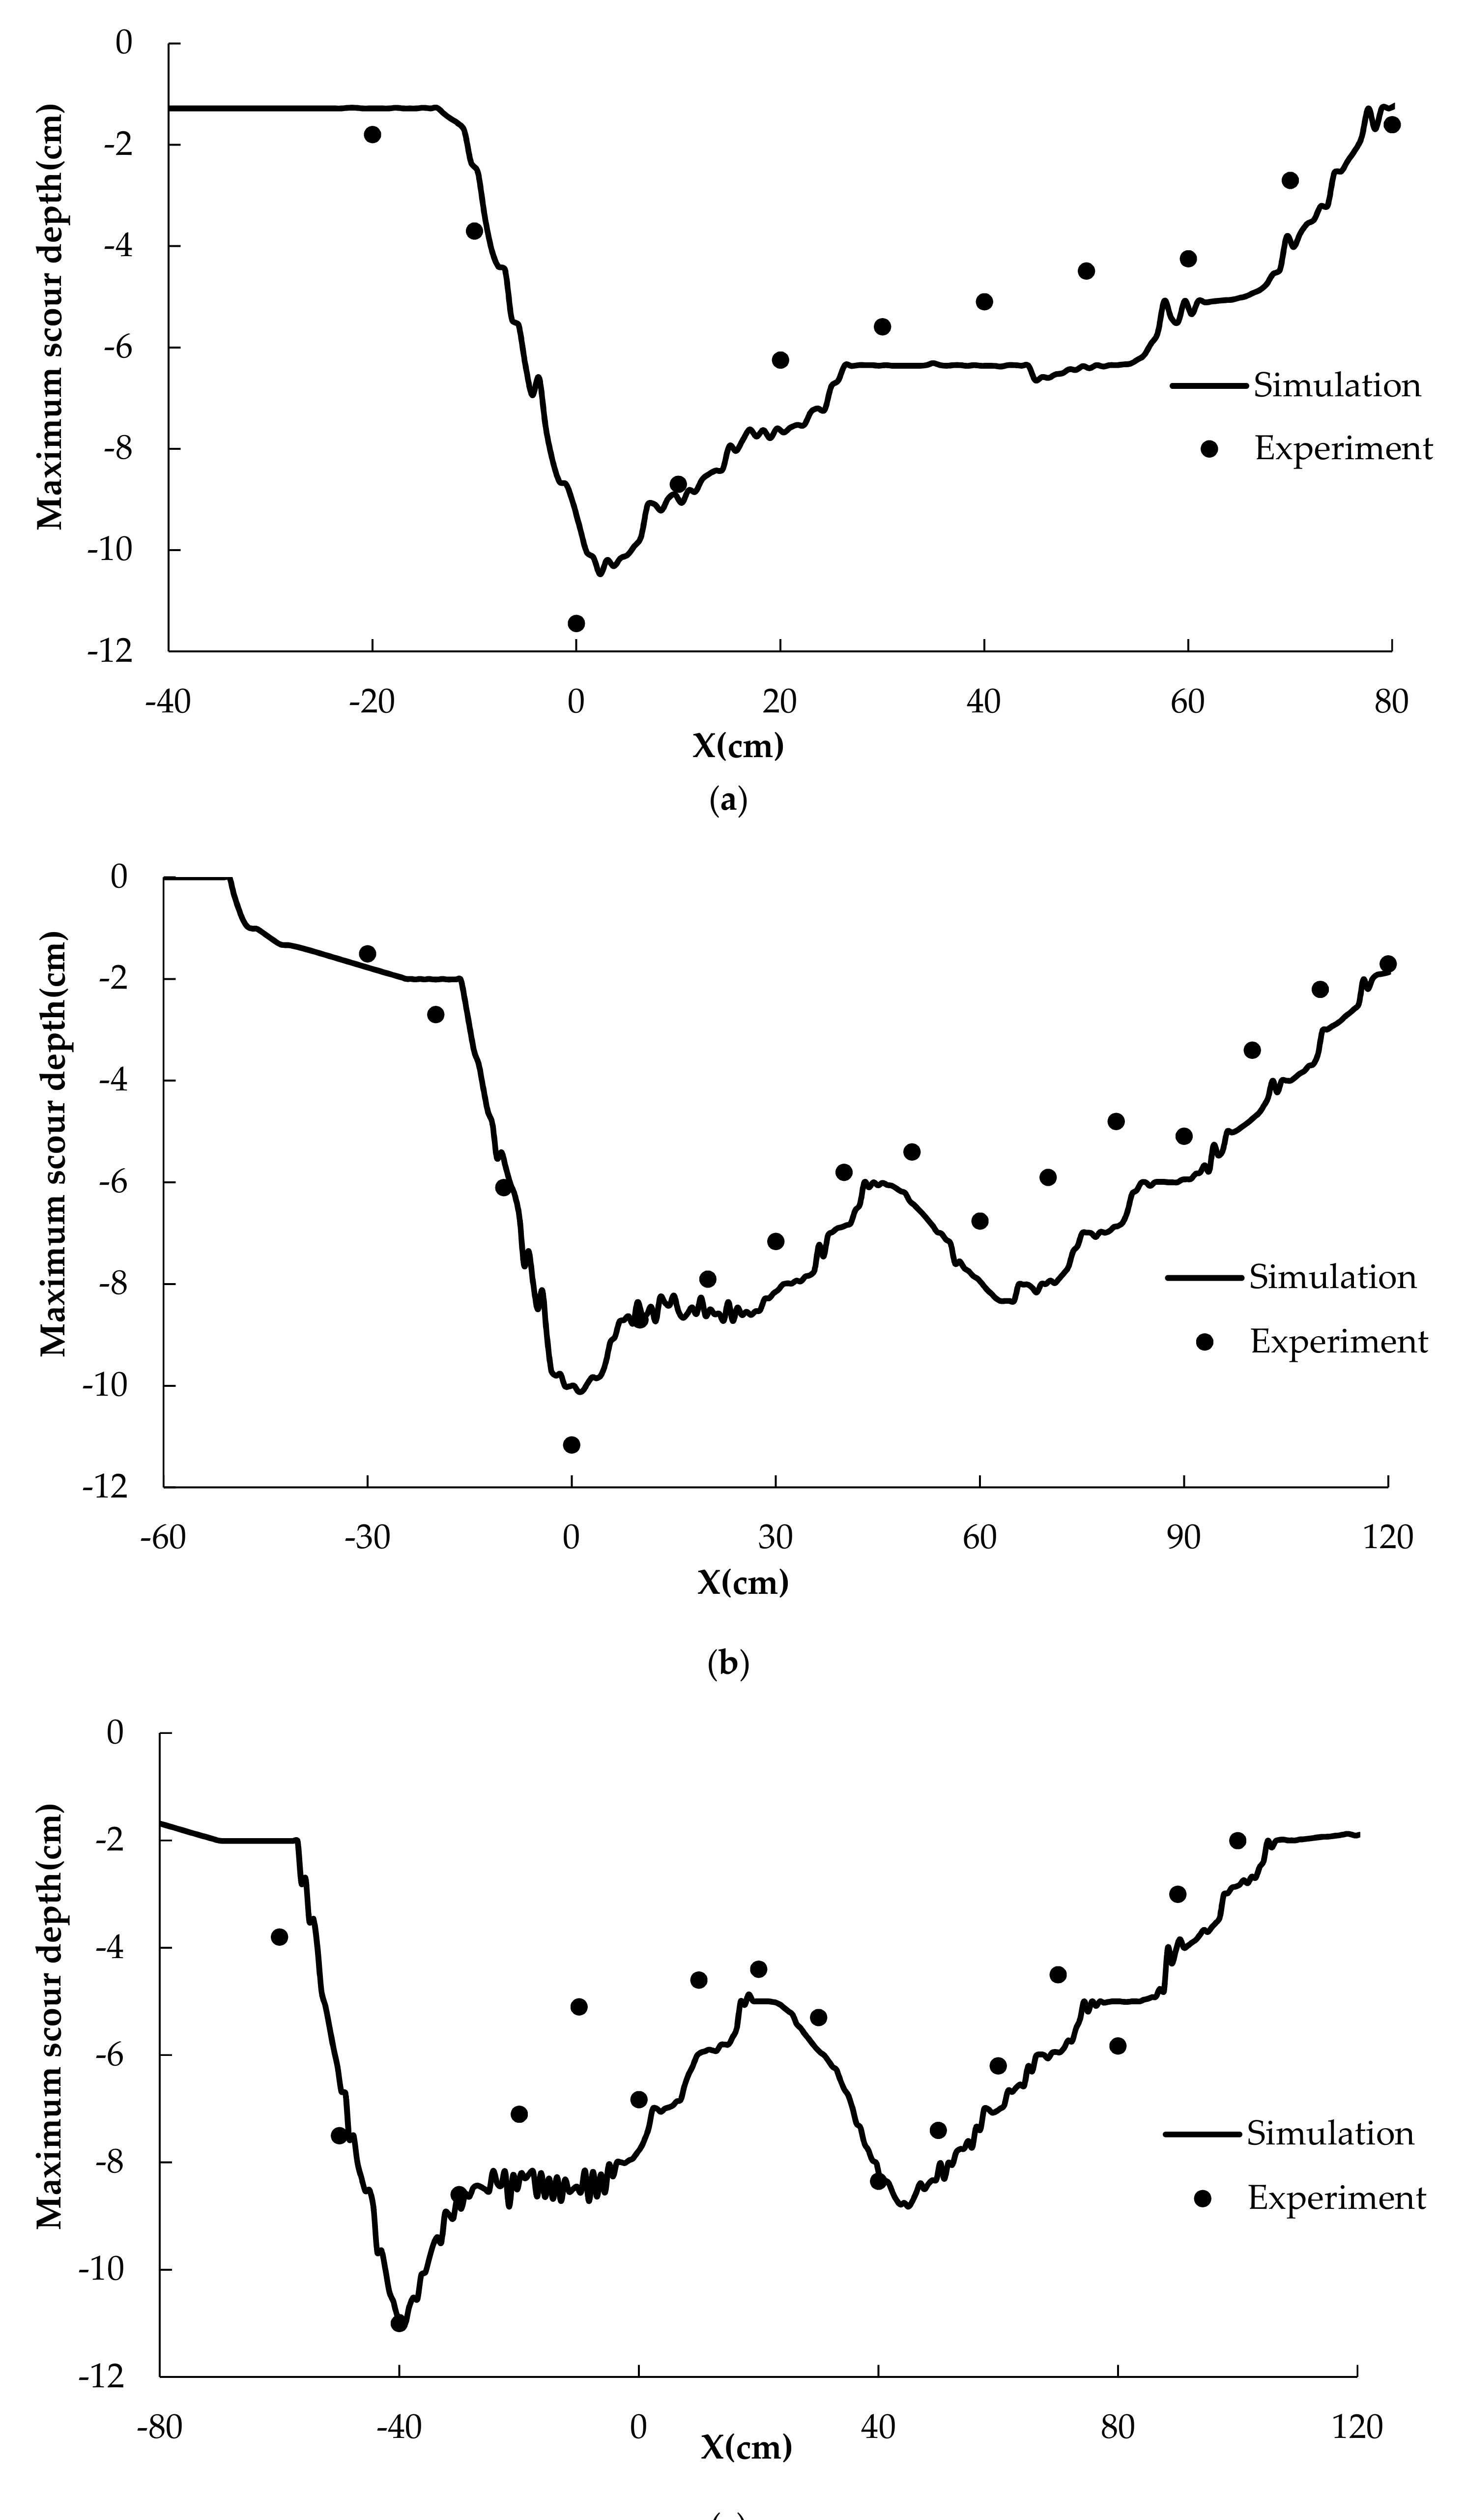
To test the results of the experiment and simulation intuitively, the local scour depth at the spur dike head is sketched in Figure 6 and listed in Table 3. According to the data in Figure 6 and Table 3, we can see that with the increase in spur dike spacing, the shielding effect of the first spur dike is weakened. This conclusion is consistent with the previous experimentally obtained conclusion. Although there are some differences between the simulation results and the experimental results, the conclusions about the shielding effect of the first spur dike can thus be considered reliable. The calculation needs can be satisfied in terms of local scouring morphology and bed deformation characteristics. On the whole, the numerical calculation reasonably reflected the experimental conclusion. Both experimental and numerical results indicated that the maximum scour depth formed in the vicinity of the first spur dike head (x = 0, y = 12.5 cm for 2l and 3l spacing, and x = −40, y = 12.5 cm for 4l spacing). The maximum local scour depths were 11.45, 11.16, and 11.01 cm in the 3 experiments. The simulated local scour depths were 10.48, 10.12, and 11 cm, corresponding to 92%, 91%, and 100% of those observed in the experiments, respectively. The relative error of local scour depths of other spur dikes is within 30%, mainly because the experiment involved non-uniform sediment and the simulation involved uniform sediment. At the same time, due to the different riverbed deformations of spur dikes I and II, the water flow structure changed, and eventually changed the scouring patterns of spur dikes III and IV. In summary, the different local scouring depths of spur dikes in different locations were mainly due to the difference in the shielding effect of the first spur dike in each case, which differed because the flow field structure around the spur dikes changed as the spacing of the grouped spur dikes was varied.

5.2. Flow Field Structure Analysis

The variation of the spacing of the spur dikes caused the change of the flow structure near them. Studying the changes in the flow field around a spur dike enables better analysis of the local scouring morphology. Numerical calculations were used to simulate the variation of the velocity field and streamlines, turbulent flow field, and shear stress on the fixed and moveable beds.

5.2.1. Velocity Field and Streamlines Analysis

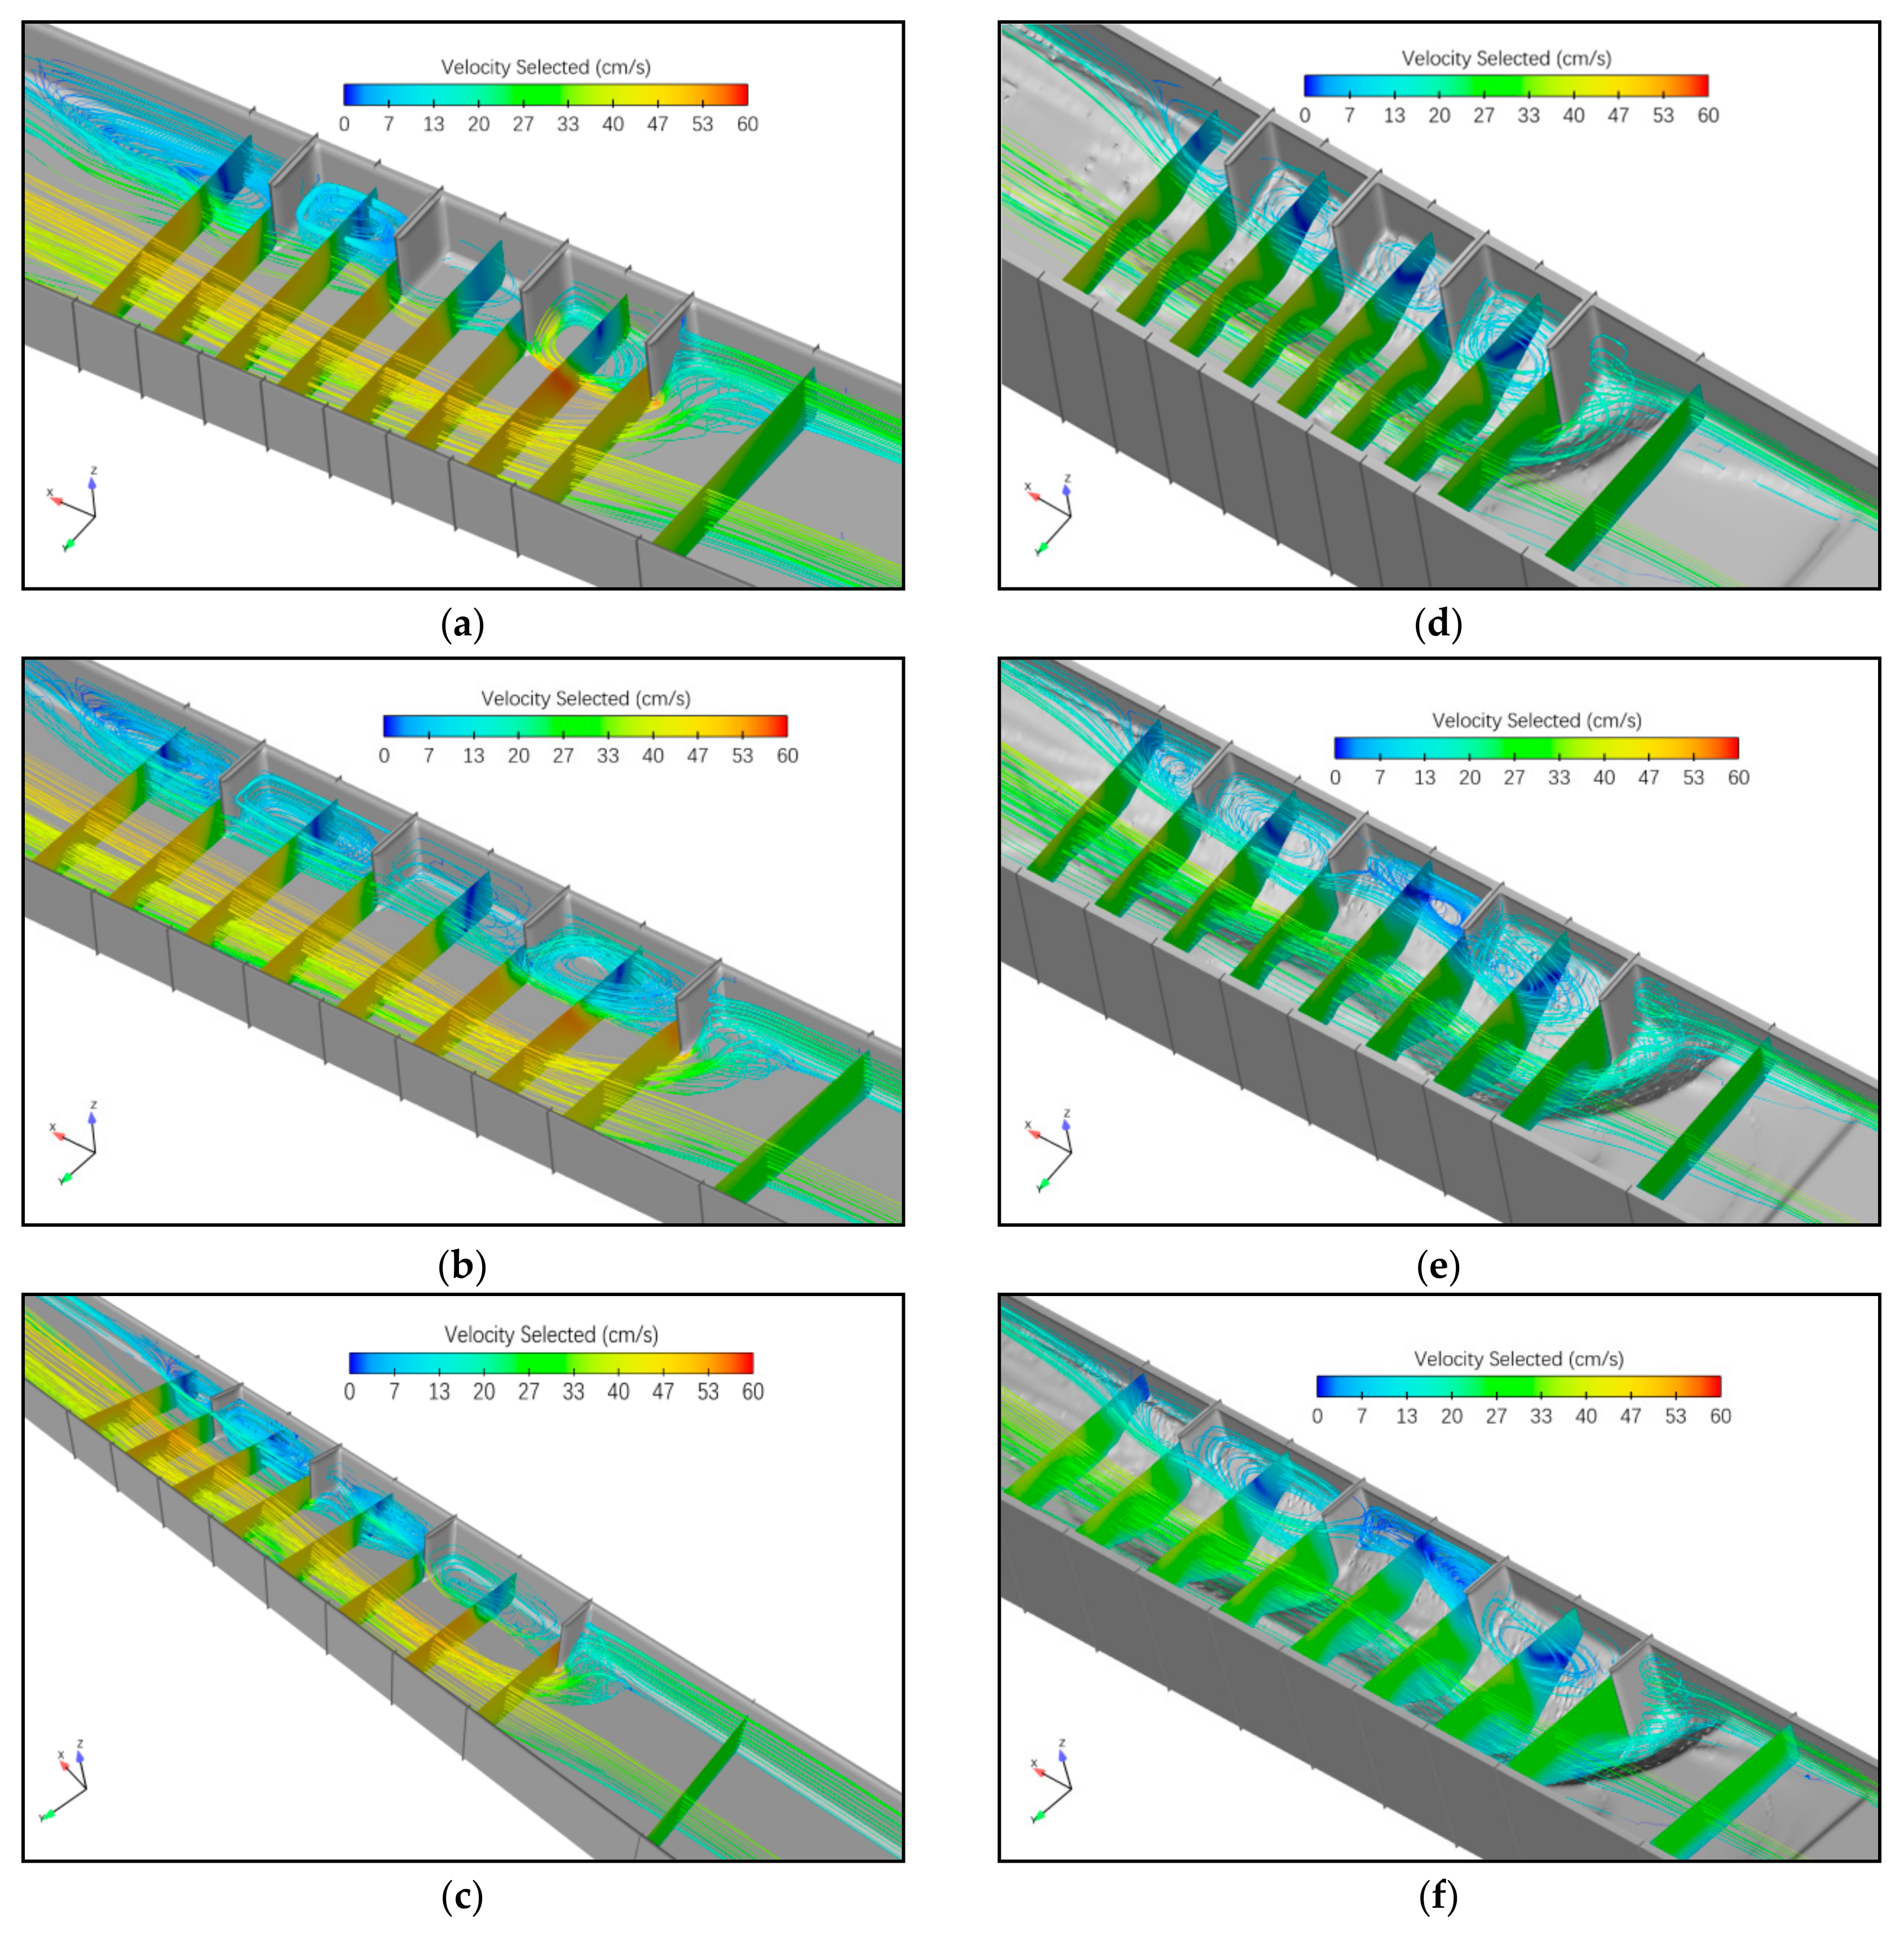
The velocity magnitude contours and the streamline diagram for the different spur dike spacing are shown in Figure 7. The left column shows the results of fixed bed tests, and the right shows the results of movable bed tests. The spacing from the top to the bottom is 2l, 3l and 4l, and there are nine velocity cross-sections. For the 2l spacing these are at x = −20, 0, 10, 20, 30, 40, 50, 60, and 70 cm; for the 3l spacing these are at x = −30, 0, 15, 30, 45, 60, 75, 90, and 105 cm; and for the 4l spacing, these are at x = −80, −40, −20, 0, 20, 40, 60, 80, and 100 cm. There are two typical longitudinal streamlines at y = 2 cm and 25 cm.
The mainstream was squeezed due to the narrowing effect of the spur dike when the water flow was close to the spur dike. The single-width flow increased, and the flow rate increased sharply, resulting in intense scouring of the riverbed. In the three cases, the maximum velocity (which is twice that of the approach flow velocity) appeared in the main flow area between spur dike I and spur dike II in the fixed bed. Similar conclusions were drawn in [15]. The velocity in the backflow area decreased and sedimentation occurred. The maximum flow velocity in the main flow zone decreased from approximately 53 cm/s in the fixed bed to approximately 33 cm/s in the last configuration. This is largely because as the scouring pit grows, the cross-sectional area of the flow increases and the flow velocity decreases. As the high-velocity mainstream area is close to the spur dike head, the scour is most significant near this point.
As can be seen from the streamlines of Figure 7, when the water flow was close to the spur dike, part of the flow blocked by the first spur dike was bent towards the head, resulting in a significant increase in flow velocity. This is the main source of sediment erosion. At the same time, a clockwise vortex was formed at the root of the spur dike, and backflow areas were formed between the spur dikes. The flow velocity in the backflow area decreased sharply, causing sediment to accumulate between spur dikes. The horizontal separation flow and the vertical downward flow existed simultaneously, which is also the reason why the flow field around the spur dike presents strong three-dimensional characteristics. The water flow around the first spur dike was divided into two parts. One part became the backflow area behind the spur dike, and the other part entered the mainstream and became part of the mainstream. The main flow was still downstream.

5.2.2. Turbulent Flow Field Analysis

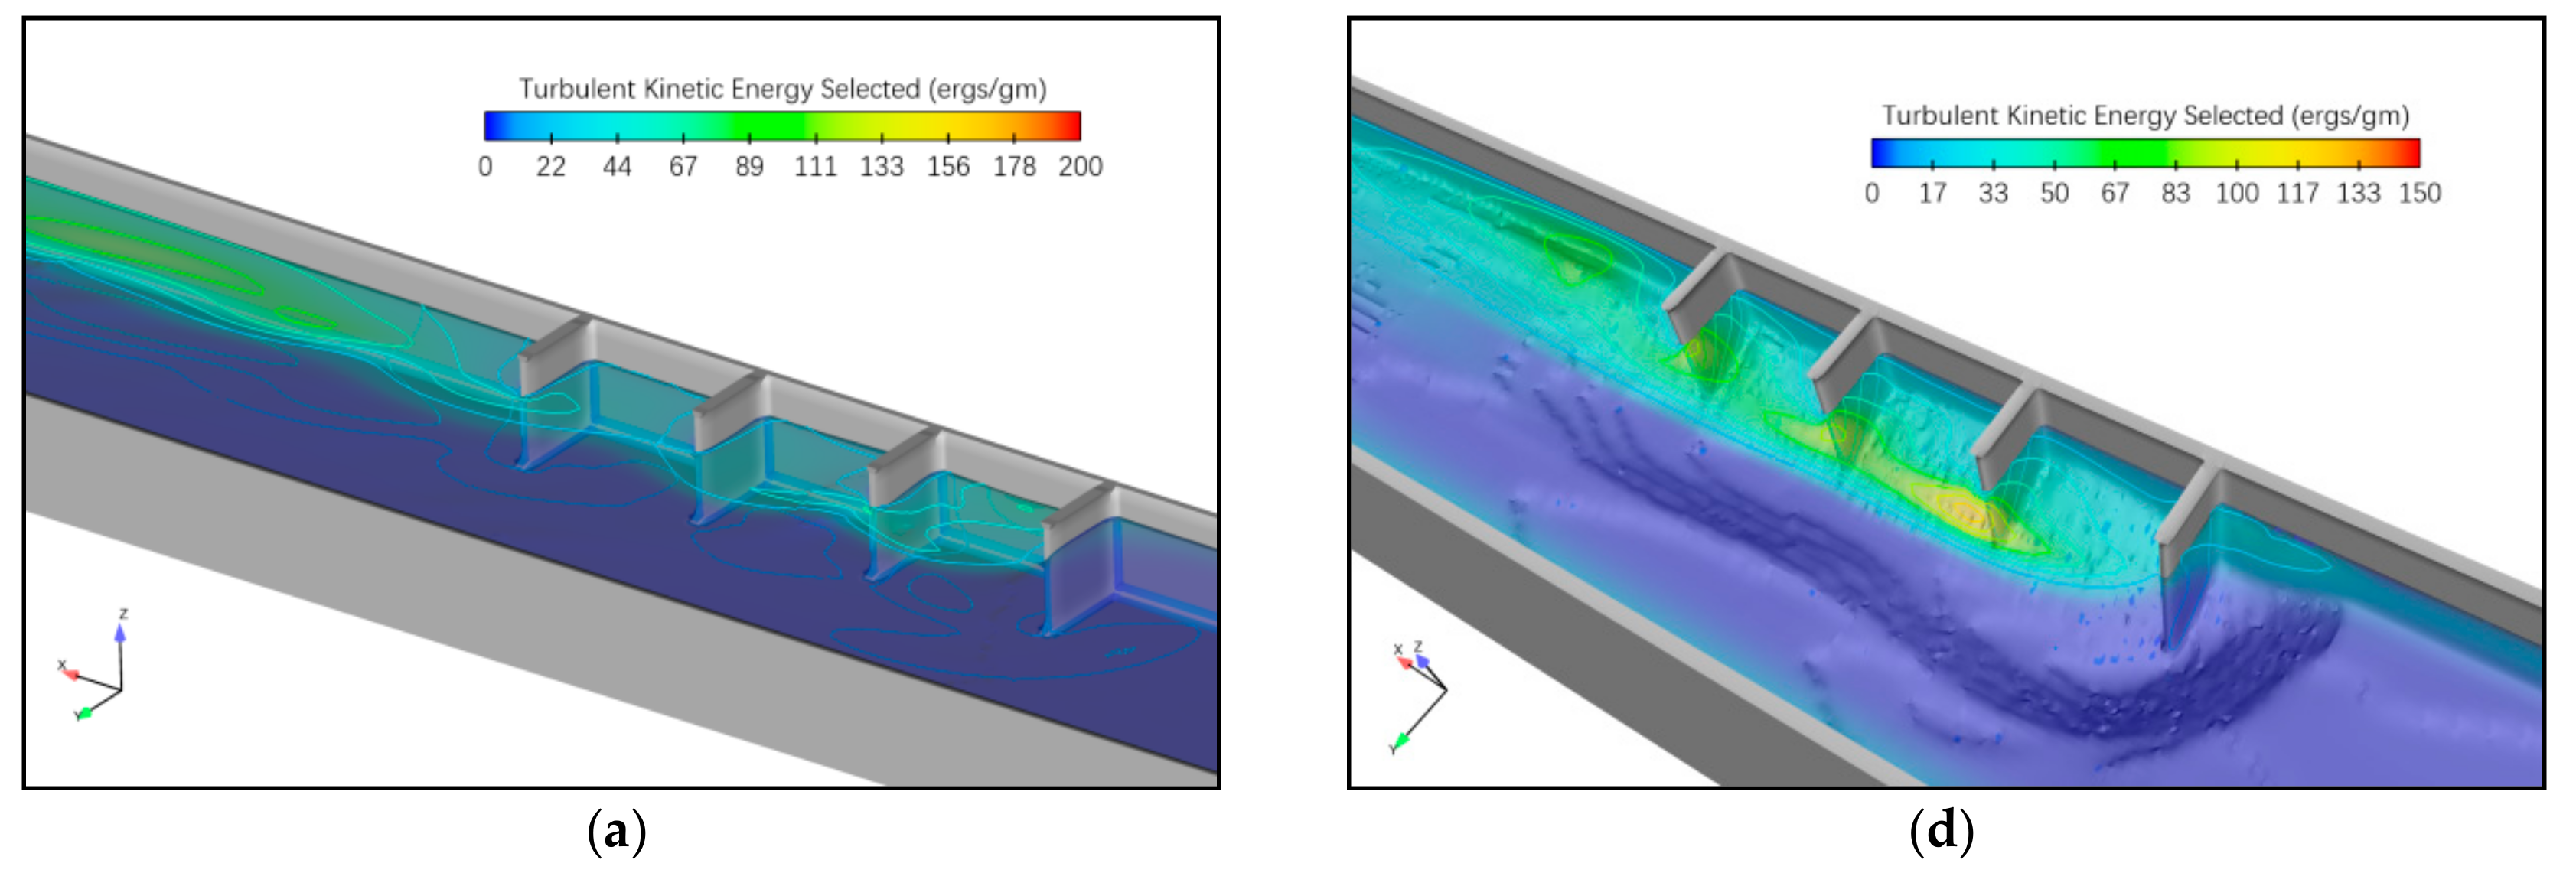
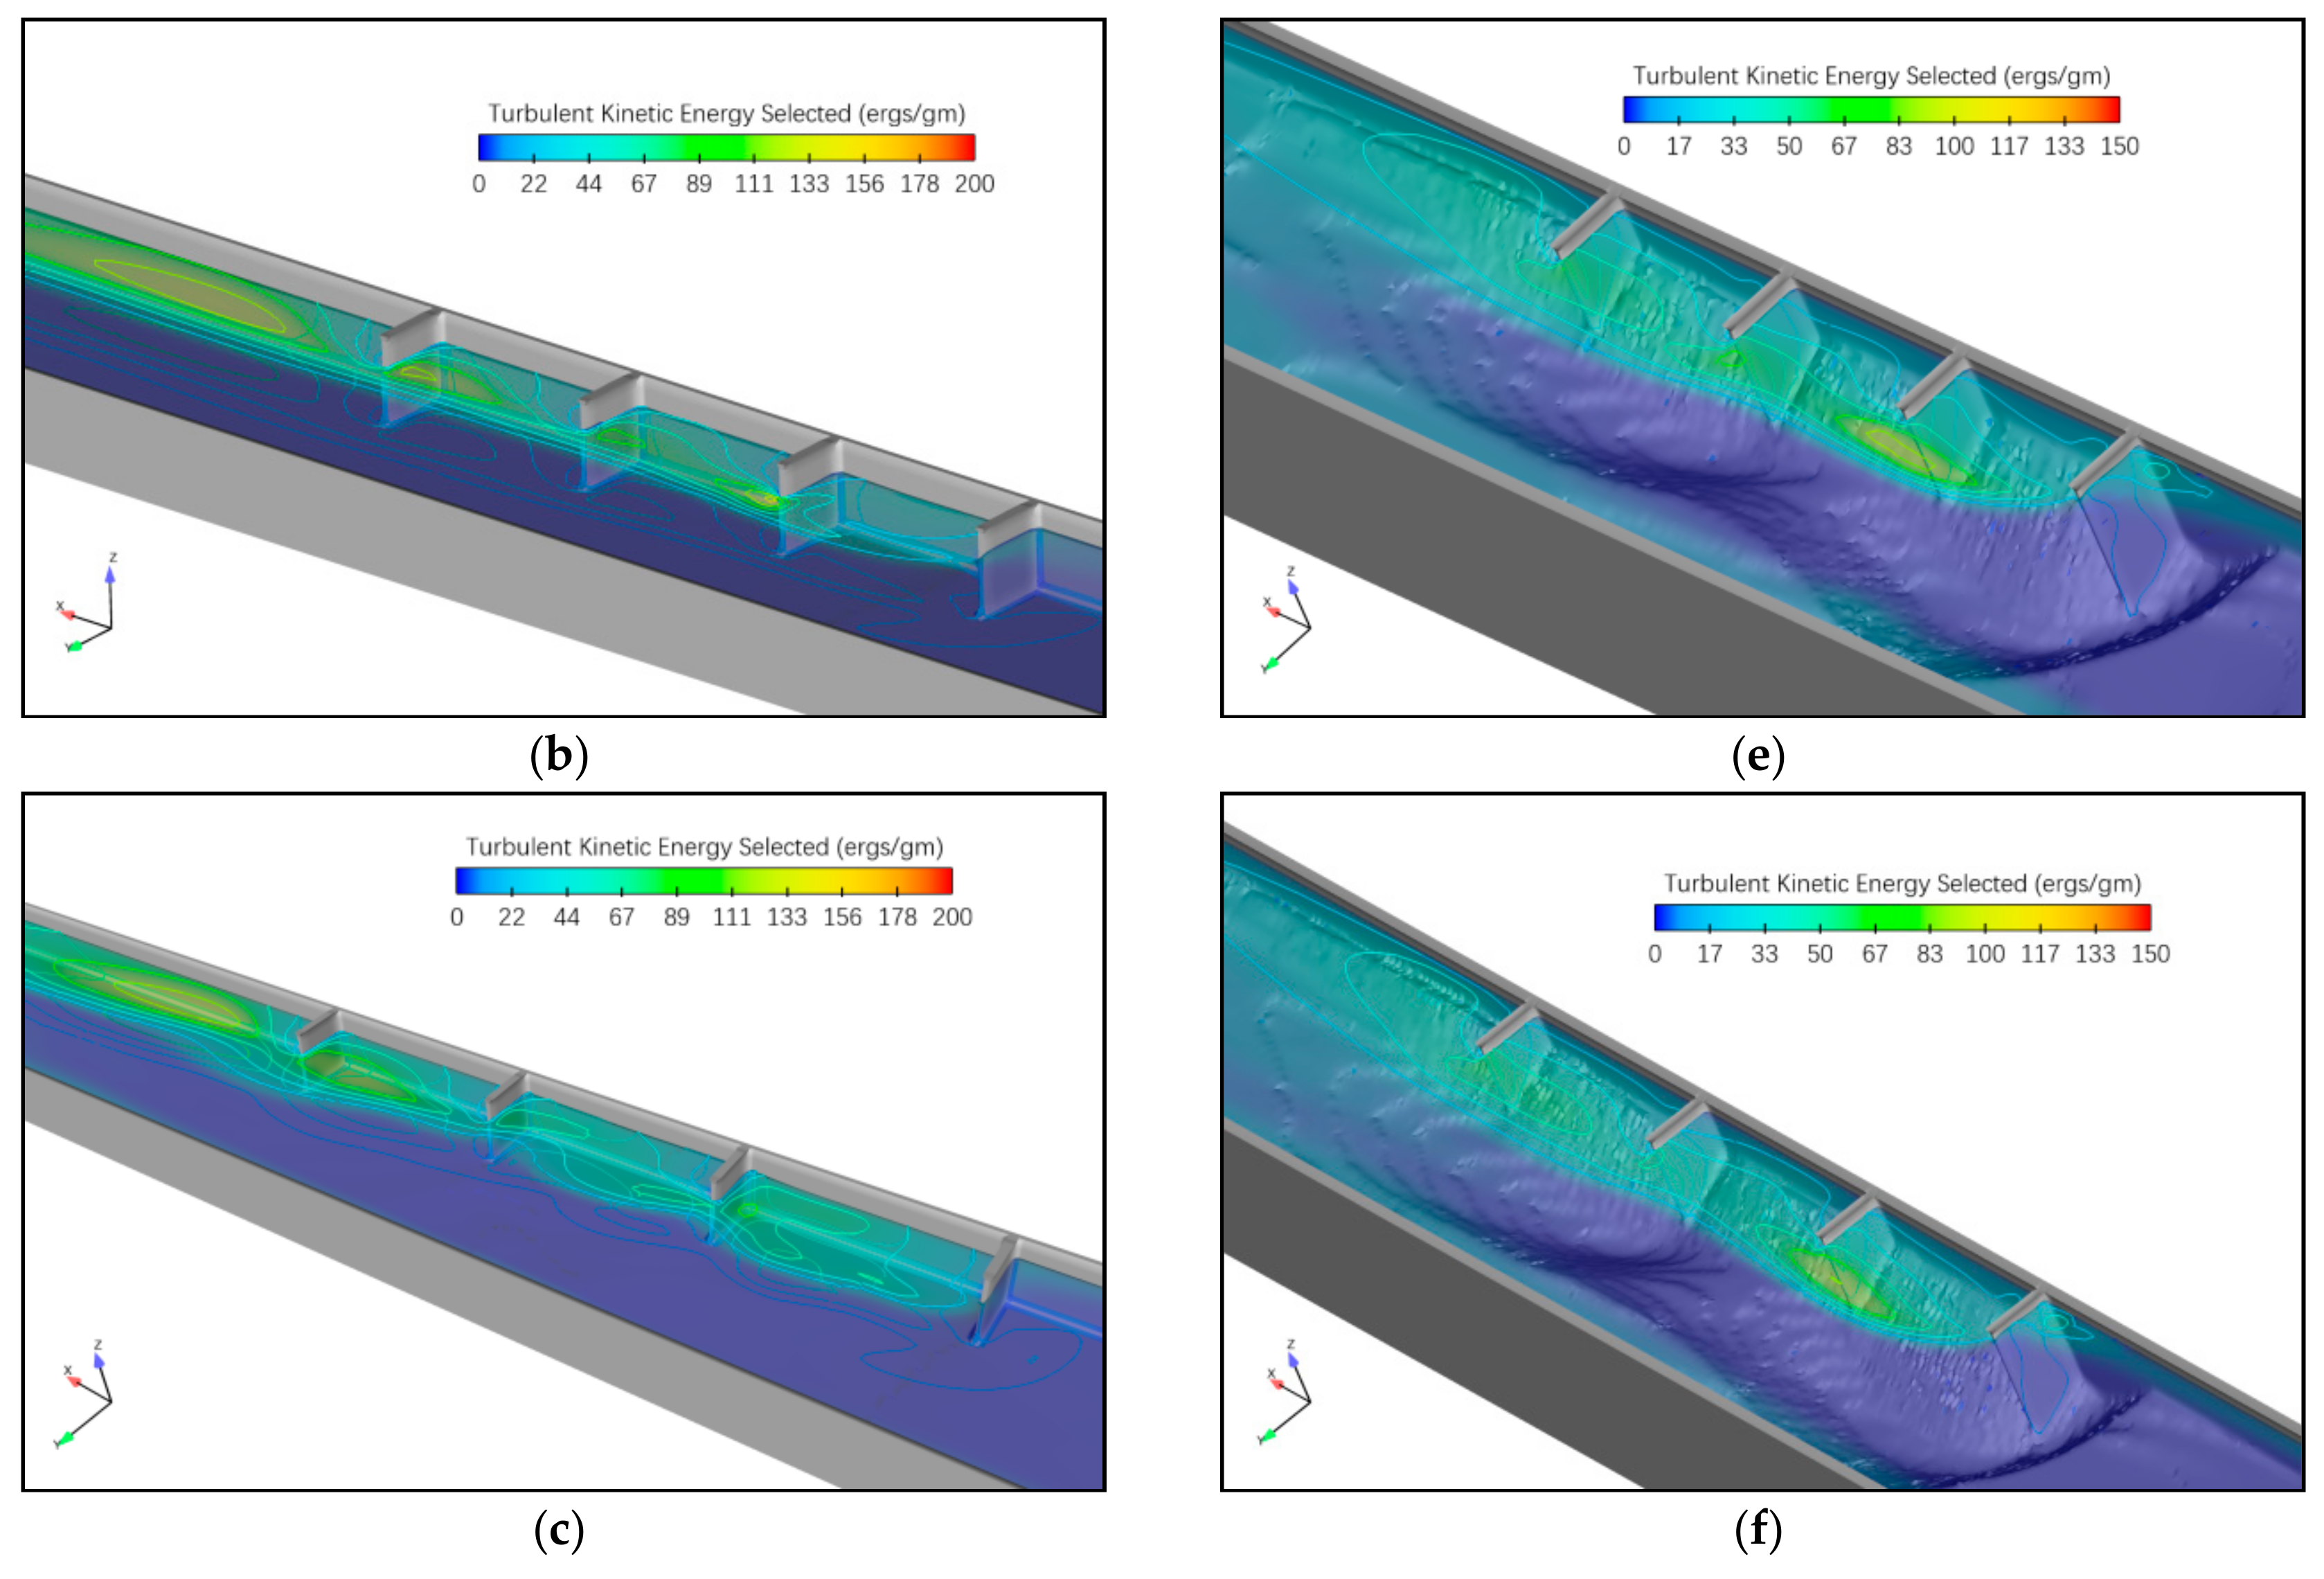
The turbulent energy contours of different spur dike spacings are shown in Figure 8. The more violent the fluid turbulence, the greater the degree of fluid collision and friction, and the greater the turbulence intensity and turbulence kinetic energy. The area with the maximum turbulent energy appeared at the junction of the high-velocity main flow area and the backflow area between spur dikes, especially in the backflow area of spur dike IV in the fixed bed. The maximum value of the turbulent kinetic energy was 98 ergs/gm, 121 ergs/gm, and 128 ergs/gm for the 2l, 3l, and 4l spacings, respectively. In the fixed bed, both on the flow surface and near the bed, the turbulent kinetic energy was large, whereas in the movable bed, the turbulent kinetic energy was only on the flow surface, and the maximum value appeared at the head of spur dike II. The maximum value of the turbulent kinetic energy was 106, 85, and 81 ergs/gm for the 2l, 3l, and 4l spacing, respectively.

5.2.3. Bed Shear Stress Analysis

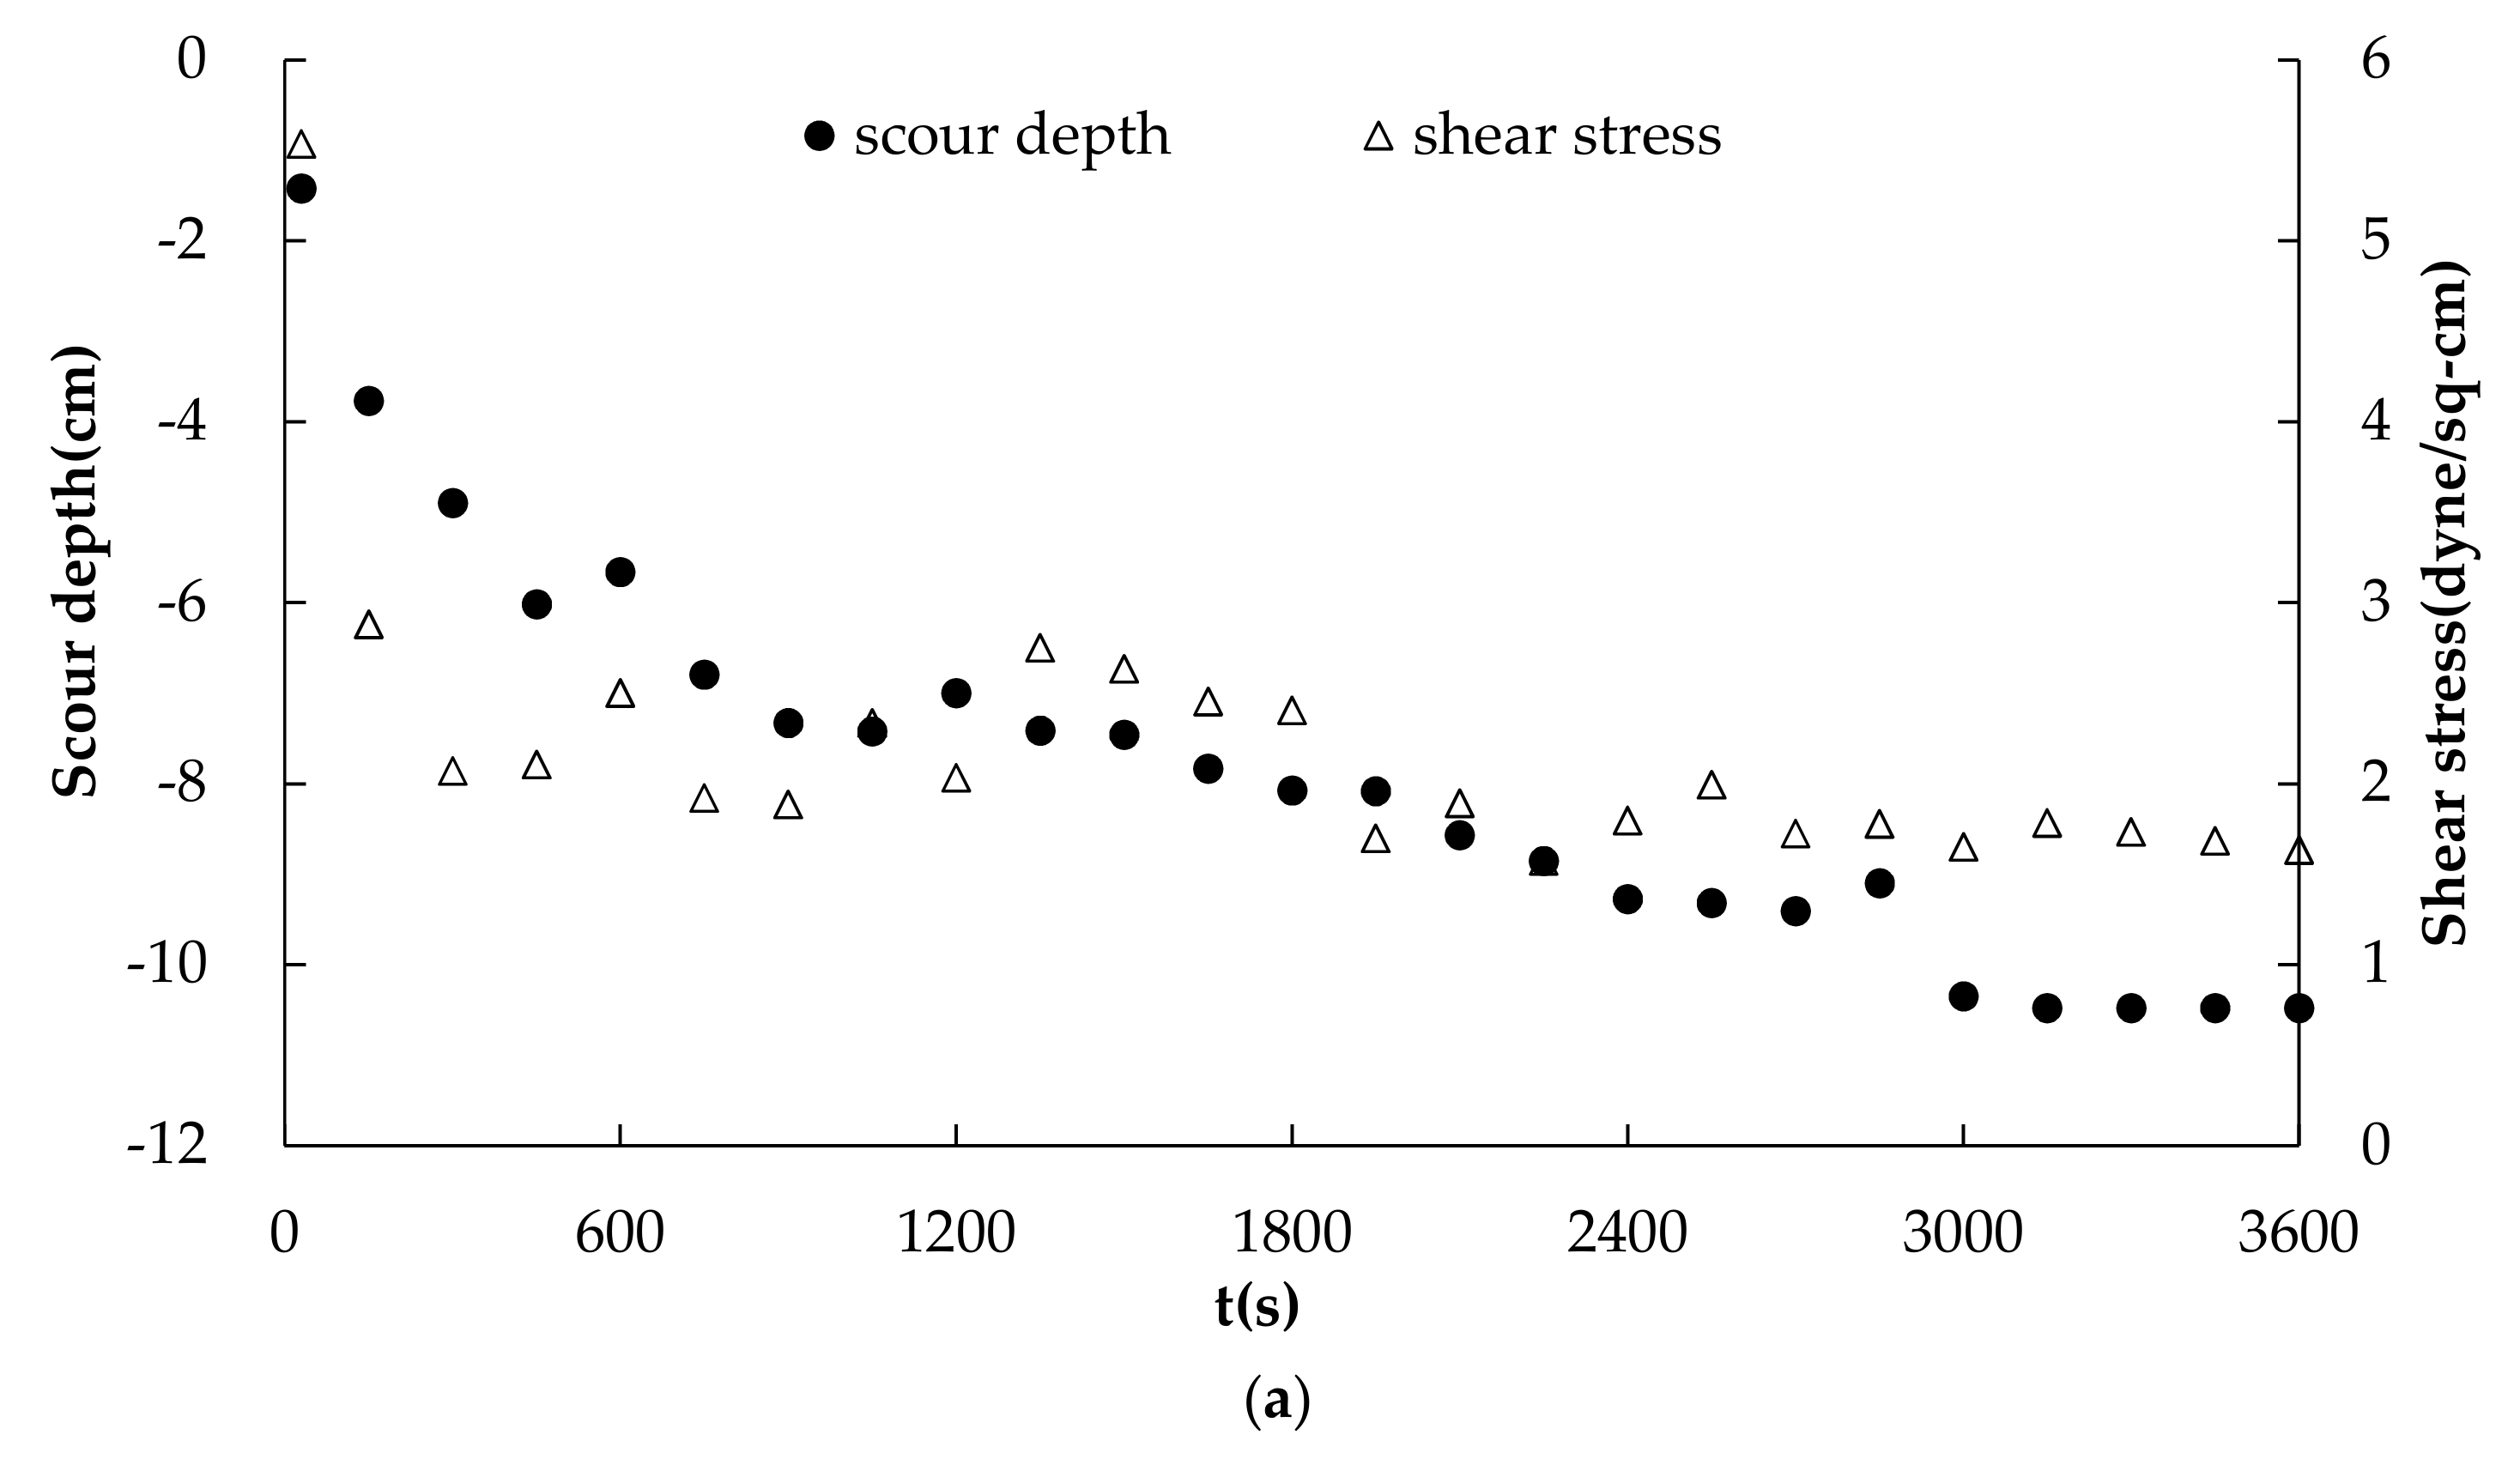
The shear stress contours of different spur dike spacings are shown in Figure 9. The maximum shear stress appeared in the main flow zone between spur dikes I and II on the fixed bed. The maximum shear stress reached 10.86, 9.44, and 10.19 dyne/cm2 for the spacings of 2l, 3l, and 4l, respectively, reaching up to 10 times that of the approach shear stress, as found in [12]. The high shear stress of the main flow area was close to the spur dike head, causing severe erosion at the head. At the final bed, the shear stress of the main flow zone decreased by 1–2 dyne/cm2. It can be seen that the sheer stress decreased with the increase of scour depth, and there is some correlation between these two factors. The time-variance correlation between scour depth and shear stress was analyzed, and the relationship curves are shown in Figure 10. The correlation values for scour depth and shear stress are listed in Table 4. Using the point of maximum scour depth (x = 0, y = 12.5 cm for 2l and 3l spacings, and x = −40, y = 12.5 cm for 4l spacing) as a reference point, 25 sets of data were selected for analysis. The Pearson correlations were 0.789, 0.863, and 0.968 for the 2l, 3l and 4l spacings, respectively. The significance test (2-tailed) results were all zero (0 < 0.05), meaning there was significant correlation. This indicates that the bed shear stress plays a prominent role in the scouring process.

6. Conclusions

In this paper, a sedimentation scour model was presented to simulate the variation of the local bed configuration around grouped spur dikes. The model calculated all aspects of the sediment transport process, including bed-load transport, entrainment, deposition, and suspended load transport for each species, using a stochastic approach. By applying the model to simulate sediment transport around grouped spur dikes in an experimental flume, it was found that the maximum scour depth formed in the vicinity of the first spur dike head. With the increase in spur dike spacing, the shielding effect of the first spur dike was weakened. On the whole, the numerical simulations reproduce quite well the experimental outcomes under a qualitative point of view.
The maximum velocity, which was twice the approach flow velocity, appeared in the main flow area between spur dike I and spur dike II in the fixed bed. The maximum flow velocity in the main flow zone in the final configuration essentially matched the incoming velocity. The streamline around spur dikes was obviously three-dimensional and was mainly characterized by the horizontal separation flow and the vertical downward flow. The area with the maximum turbulent energy appeared at the junction of the high-velocity main flow area and the backflow area between spur dikes, especially in the backflow area of spur dike IV in the fixed bed. In contrast, in the movable bed, the maximum value appeared at the head of spur dike II. The maximum shear stress appeared in the main flow zone between spur dikes I and II on the fixed bed and was up to 10 times the approach shear stress. With the development of scouring, the shear stress decreased. The analytic results correlate significantly, which indicates that bed shear stress plays a leading role in the scouring process.
Given the above results, there is a high potential for the understanding and subsequent variation of spur dike spacing to be put to practical use in real rivers. However, further refinement to the sedimentation scour model is necessary to account for non-uniform sediment. Moreover, fundamental experiments and numerical simulation are also needed to investigate realistic irregular border channels and hydraulic structures such as grouped spur dikes of unequal length and unequal spacing.

Author Contributions

J.N., G.L. and S.L. conceived and designed the framework of this study, analyzed and discussed the results, and wrote the paper. J.N. treated the test data and performed the model simulation.

Funding

This research was funded by Science and Technology Projects of the Shaanxi Water Conservancy Department [grant number 2017slkj-17], and Key R&D Program Projects in Shaanxi Province [grant number 2018SF-352], the National Natural Science Foundation-sponsored project [grant number 51579206], Xi’an University of Technology Doctoral Innovation Fund [grant number 310-252071507].

Conflicts of Interest

The authors declare no conflict of interest.

References

  1. Barbhuiya, A.K.; Dey, S. Local scour at abutments: A review. Sadhana 2004, 29, 449–476. [Google Scholar] [CrossRef]
  2. Dey, S.; Barbhuiya, A.K. Time variation of scour at abutments. J. Hydraul. Eng. 2005, 131, 11–23. [Google Scholar] [CrossRef]
  3. Fukuoka, S.; Nakagawa, N.; Sumi, T.; Zhang, H. Advances in River Sediment Research; Taylor & Francis Group: London, UK, 2013. [Google Scholar]
  4. Pandey, M.; Ahmad, Z.; Sharma, P.K. Scour around impermeable spur dikes: A review. ISH J. Hydraul. Eng. 2017, 1–20. [Google Scholar] [CrossRef]
  5. Zhang, H.; Nakagawa, H.; Ishigaki, T.; Muto, Y. Prediction of 3D Flow Field and Local Scouring Around Spur Dikes. Proc. Hydraul. Eng. 2005, 49, 1003–1008. [Google Scholar] [CrossRef]
  6. Basser, H.; Karami, H.; Shamshirband, S.; Jahangirzadeh, A.; Akib, S.; Saboohi, H. Predicting optimum parameters of a protective spur dike using soft computing methodologies–A comparative study. Comput. Fluids 2014, 97, 168–176. [Google Scholar] [CrossRef]
  7. Pandey, M. Flow Pattern and Scour Around Multiple Spur-Dikes in Channels. Master’s Thesis, Indian Institute of Technology Roorkee, Roorkee, India, 2014. [Google Scholar]
  8. Tominaga, A.; Sadat, S.H. Combination of permeable and impermeable spur dikes to reduce local scour and to create diverse river bed. In River Sedimentation: Proceedings of the 13th International Symposium on River Sedimentation (Stuttgart, Germany, 19–22 September, 2016); CRC Press: Boca Raton, FL, USA, 2016; Volume 101, pp. 19–22. [Google Scholar]
  9. Nakagawa, K.; Kawahara, Y.; Tamai, N. Experimental study on hydraulic characteristics of flows in embayments. Proc. Hydraul. Eng. 1995, 39, 595–600. [Google Scholar] [CrossRef]
  10. Muto, Y.; Imamoto, H.; Ishigaki, T. Turbulence characteristics of a shear flow in an embayment attached to a straight open channel. Adv. Hydro Sci. Eng. 2000, IV, 232–241. [Google Scholar]
  11. Choufu, L.; Abbasi, S.; Pourshahbaz, H.; Taghvaei, P.; Tfwala, S. Investigation of flow, erosion, and sedimentation pattern around varied groynes under different hydraulic and geometric conditions: A numerical study. Water 2019, 11, 235. [Google Scholar] [CrossRef]
  12. Duan, J.G. Mean Flow and Turbulence around a Laboratory Spur Dike. J. Hydraul. Eng. 2009, 135, 803–811. [Google Scholar] [CrossRef]
  13. Yaeger, M.A. Mean Flow and Turbulence around Two Series of Experimental Dikes; Department of Hydrology and Water Resources, The University of Arizona: Tucson, AZ, USA, 2009. [Google Scholar]
  14. Acharya, A. Experimental Study and Numerical Simulation of Flow and Sediment Transport around a Series of Spur Dikes; Department of Civil Engineering and Engineering Mechanics, The University of Arizona: Tucson, AZ, USA, 2011. [Google Scholar]
  15. Molinas, A.; Kheireldin, K.; Wu, B. Shear stress around vertical wall abutments. J. Hydraul. Eng. 1998, 124, 463–480. [Google Scholar] [CrossRef]
  16. Koken, M.; Gogus, M. Effect of spur dike length on the horseshoe vortex system and the bed shear stress distribution. J. Hydraul. Res. 2015, 53, 196–206. [Google Scholar] [CrossRef]
  17. Yakhot, V.; Orzag, S.A. Renormalization group analysis of turbulence: Basic theory. J. Sci. Comput. 1986, 1, 3–51. [Google Scholar] [CrossRef]
  18. Hirt, C.W.; Sicilian, J.M. A porosity technique for the definition of obstacles in rectangular cell meshes. In Proceedings of the 4th International Conference on Numerical Ship Hydrodynamics, Washington, DC, USA, 24–27 September 1985. [Google Scholar]
  19. Hirt, C.W.; Nichols, B.D. Volume of fluid (VOF) method for the dynamics of free boundaries. J. Comput. Phys. 1981, 39, 201–225. [Google Scholar] [CrossRef]
  20. Wei, G.; Brethour, J.M.; Gruenzner, M.; Burnham, J. Sedimentation Scour Model; Flow Science Report 03-14; Flow Science, Inc.: Santa Fe, NM, USA, 2014. [Google Scholar]
  21. Winterwerp, J.C.; Bakker, W.T.; Mastbergen, D.R.; van Rossum, H. Hyperconcentrated sand-water mixture flows over erodible bed. J. Hydraul. Eng. 1992, 118, 1508–1525. [Google Scholar] [CrossRef]
  22. Soulsby, R. Dynamics of Marine Sands; Thomas Telford Publications: London, UK, 1997. [Google Scholar]
  23. Elsayed, K.; Lacor, C. Numerical modeling of the flow field and performance in cyclones of different cone-tip diameters. Comput. Fluids 2011, 51, 48–59. [Google Scholar] [CrossRef]
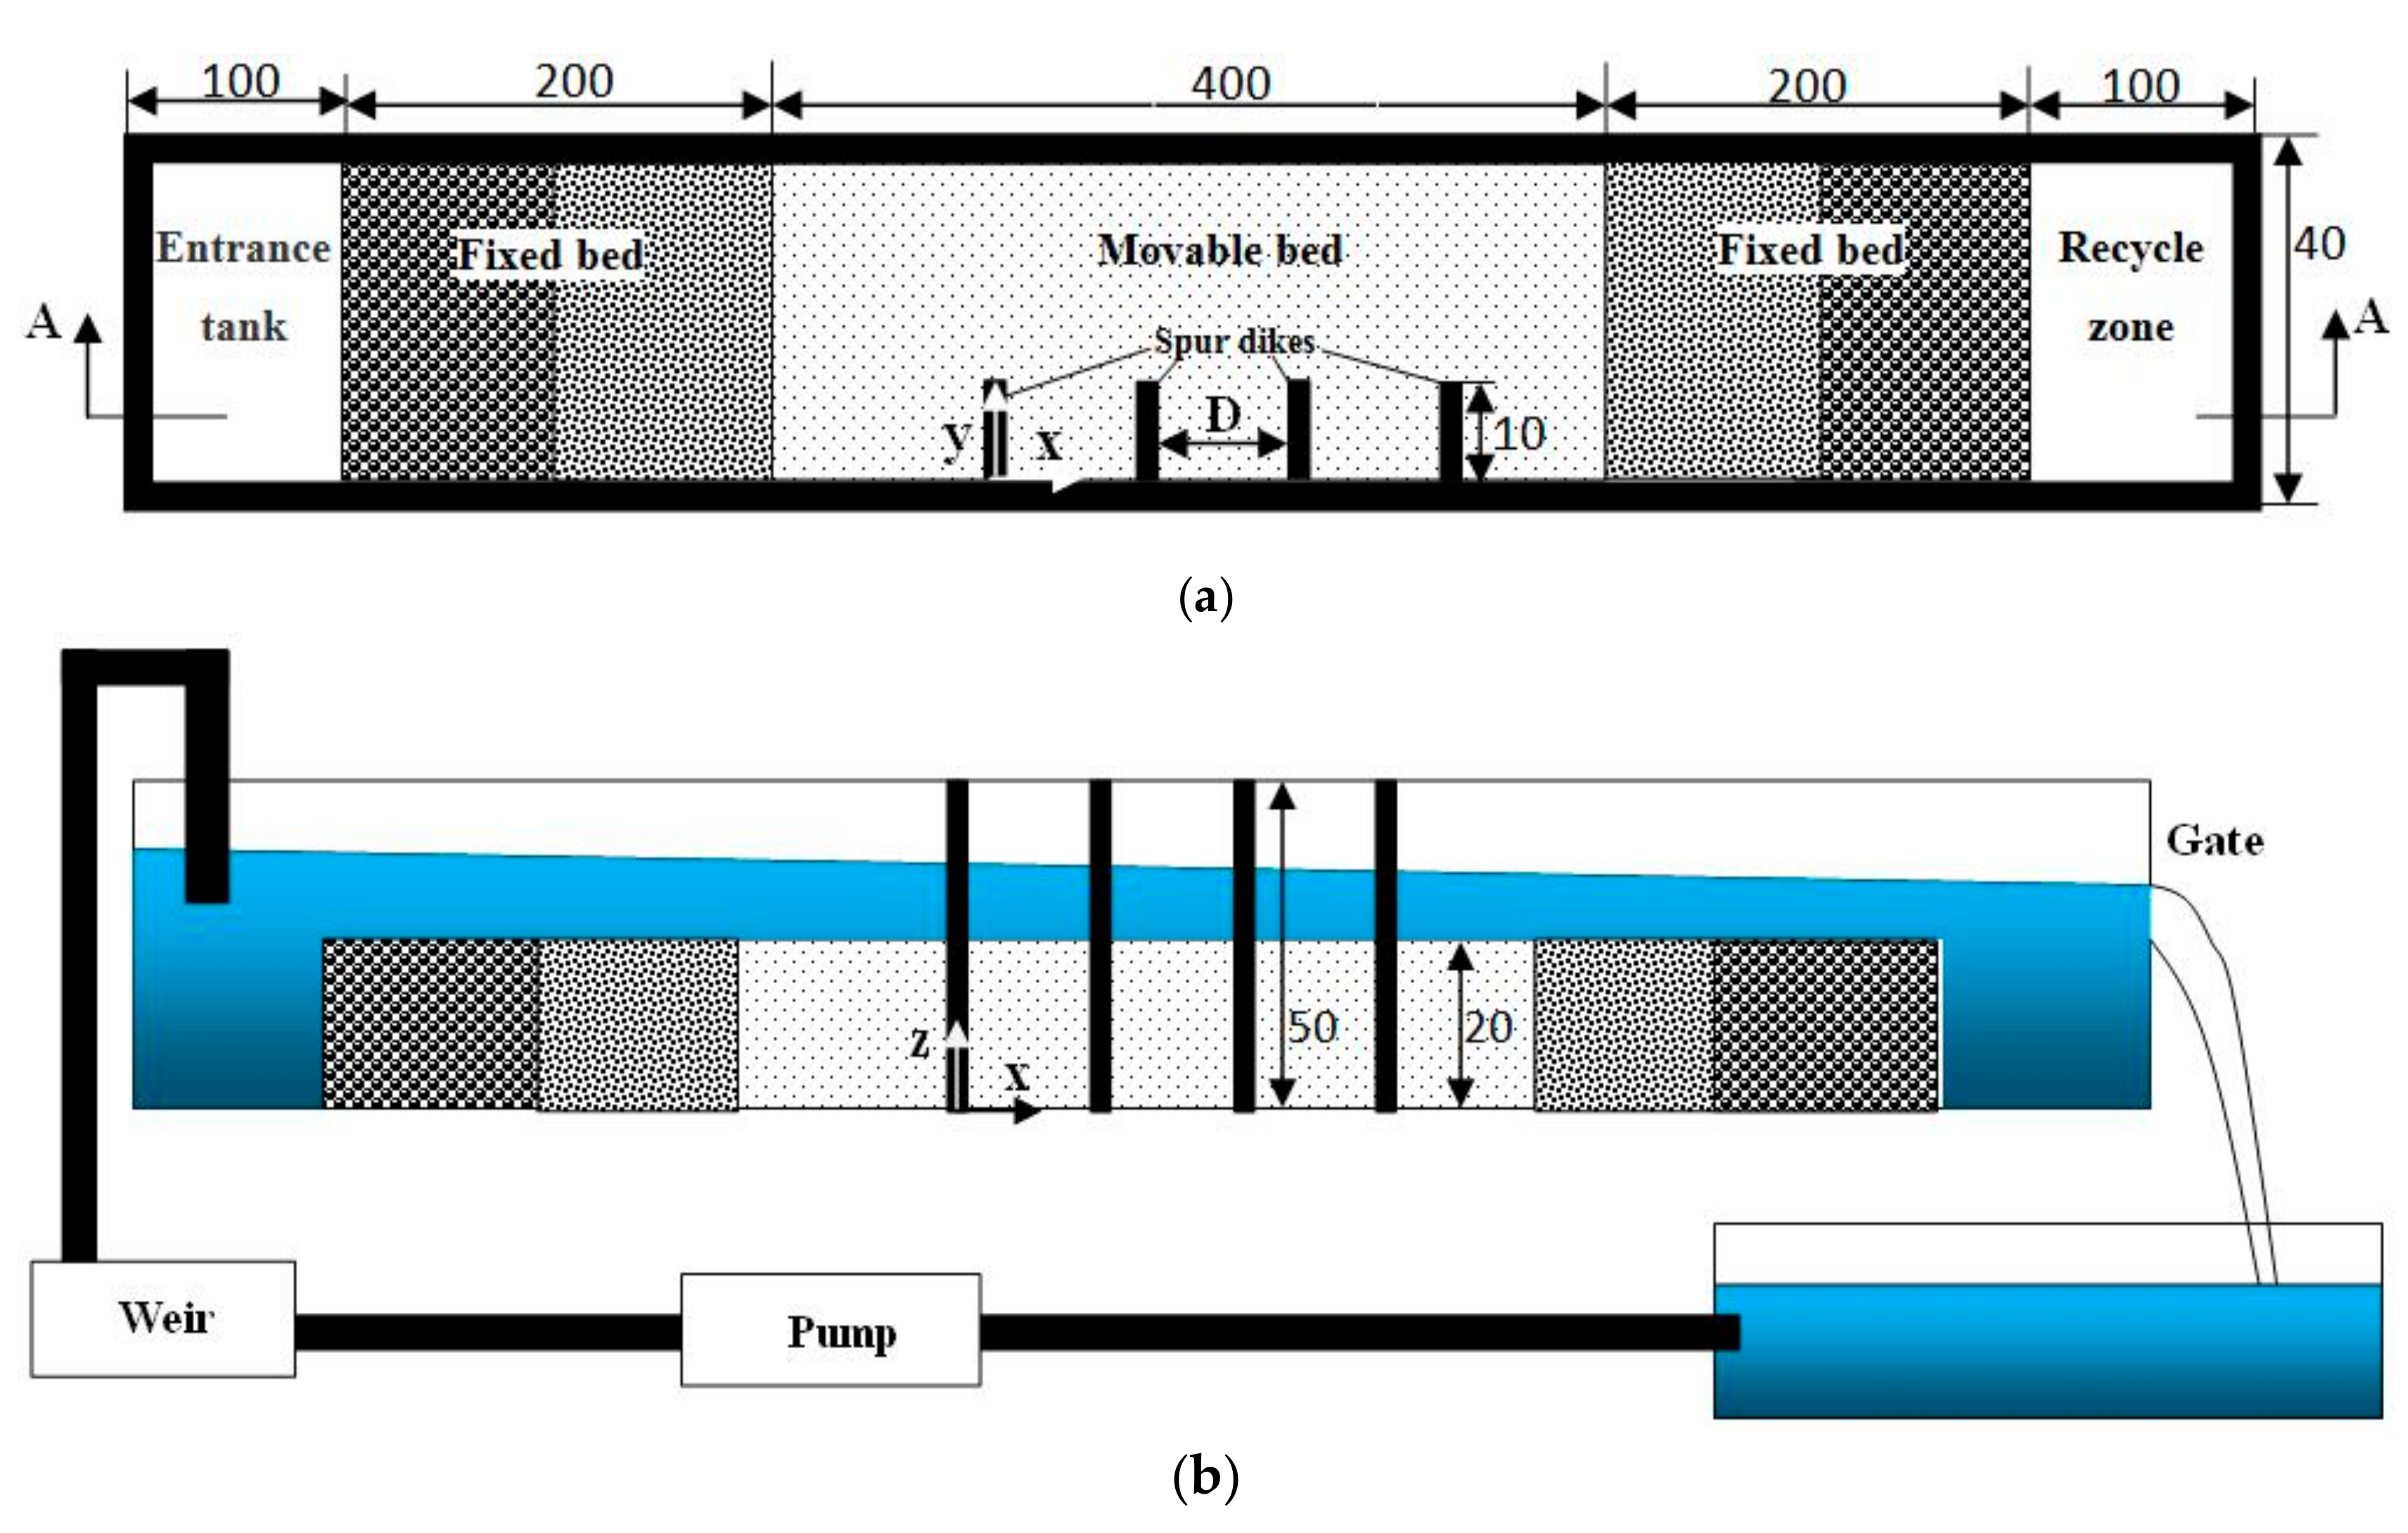
Figure 1. Experimental setup (a) plan view; (b) A-A sectional view (units: cm).
Applsci 09 02306 g001
Figure 2. Sediment grading curve.
Applsci 09 02306 g002
Figure 3. Computational domain (units: cm).
Applsci 09 02306 g003
Figure 4. The plan view of the computational grid.
Applsci 09 02306 g004
Figure 5. Final bed configuration with spur dikes spacing 2l, 3l, 4l. (a) experiment for 2l spacing; (b) experiment for 3l spacing; (c) experiment for 4l spacing; (d) simulation for 2l spacing; (e) simulation for 3l spacing; (f) simulation for 4l spacing.
Applsci 09 02306 g005aApplsci 09 02306 g005b
Figure 6. The local scour depth at the spur dike head. (a) for 2l spacing; (b) for 3l spacing; (c) for 4l spacing.
Applsci 09 02306 g006
Figure 7. The velocity magnitude contours and the streamline diagrams of different spur dike spacing. (a) fixed bed for 2l spacing; (b) fixed bed for 3l spacing; (c) fixed bed for 4l spacing; (d) movable bed for 2l spacing; (e) movable bed for 3l spacing; (f) movable bed for 4l spacing.
Applsci 09 02306 g007
Figure 8. The turbulent energy contours of different spur dike spacing. (a) fixed bed for 2l spacing; (b) fixed bed for 3l spacing; (c) fixed bed for 4l spacing; (d) movable bed for 2l spacing; (e) movable bed for 3l spacing; (f) movable bed for 4l spacing.
Applsci 09 02306 g008aApplsci 09 02306 g008b
Figure 9. The shear stress contours of different spur dike spacing. (a) fixed bed for 2l spacing; (b) fixed bed for 3l spacing; (c) fixed bed for 4l spacing; (d) movable bed for 2l spacing; (e) movable bed for 3l spacing; (f) movable bed for 4l spacing.
Applsci 09 02306 g009aApplsci 09 02306 g009b
Figure 10. The relationship curve of scour depth and shear stress. (a) for 2l spacing; (b) for 3l spacing; (c) for 4l spacing.
Applsci 09 02306 g010aApplsci 09 02306 g010b
Table 1. Hydraulic conditions.
Flow Discharge (l/s)9.62
Channel slop1/1000
Channel width (cm)40
Flow depth (cm)9
Flow velocity (m/s)0.267
Sediment grain size D50 (mm) 0.473
Sediment density (g/cm³)1.9
Reynolds number, Re = v R / ν 16,585
Froude number, F r = v / g h 0.28
Table 2. Grid convergence index (GCI) Calculation.
Grid NumberGrid Size (cm) F s = 1.25
r = d k d k + 1 ph (cm)Relative Error
ε = h k h k + 1 h k + 1
GCI (%)
G C I = F S ε r p 1 × 100
520,8001110.75
1,223,7680.751.33110.450.02870810.77
1,978,8860.51.5110.480.0028630.72
2,864,4000.41.25110.50.0019050.95
Table 3. The maximum scour depth of the spur dike heads.
CaseSpacingMaximum Scour Depth (cm)
IIIIIIIV
Experiment2l−11.45−6.25−5.1−4.25
3l−11.16−7.16−6.76−5.09
4l−11.01−6.83−8.35−5.83
Simulation2l−10.48−7.676−6.364−5.346
3l−10.12−8.115−8.107−5.94
4l−11−7.828−8.313−5.01
Table 4. The scour depth and shear stress correlations.
Scour Depth/Shear StressCorrelations
2l3l4l
Pearson Correlation0.7890.8630.968
Sig. (2-tailed)000
N252525