Article

A Method for Identification of Multisynaptic Boutons in Electron Microscopy Image Stack of Mouse Cortex

1
Faculty of Information Technology, Macau University of Science and Technology, Macau 999078, China
2
Institute of Automation, Chinese Academy of Sciences, Beijing 100190, China
*
Author to whom correspondence should be addressed.
Appl. Sci. 2019, 9(13), 2591; https://doi.org/10.3390/app9132591
Submission received: 30 April 2019 / Revised: 31 May 2019 / Accepted: 17 June 2019 / Published: 26 June 2019
(This article belongs to the Special Issue Advanced Intelligent Imaging Technology)

Abstract

:
Recent electron microscopy (EM) imaging techniques make the automatic acquisition of a large number of serial sections from brain samples possible. On the other hand, it has been proven that the multisynaptic bouton (MSB), a structure that consists of one presynaptic bouton and multiple postsynaptic spines, is closely related to sensory deprivation, brain trauma, and learning. Nevertheless, it is still a challenging task to analyze this essential structure from EM images due to factors such as imaging artifacts and the presence of complicated subcellular structures. In this paper, we present an effective way to identify the MSBs on EM images. Using normalized images as training data, two convolutional neural networks (CNNs) are trained to obtain the segmentation of synapses and the probability map of the neuronal membrane, respectively. Then, a series of follow-up operations are employed to obtain rectified segmentation of synapses and segmentation of neurons. By incorporating this information, the MSBs can be reasonably identified. The dataset in this study is an image stack of mouse cortex that contains 178 serial images with a size of 6004 pixels × 5174 pixels and a voxel resolution of 2 nm × 2 nm × 50 nm. The precision and recall on MSB detection are 68.57% and 94.12%, respectively. Experimental results demonstrate that our method is conducive to biologists’ research on MSBs’ properties.

1. Introduction

Electron microscopy (EM) connectomics is an ambitious research direction aimed at studying comprehensive brain connectivity maps using high-throughput, nanoscale microscopes [1]. The development of EM technologies has greatly promoted the progress of brain science and connectomics. Although EM provides sufficient resolution to reveal the invaluable information about structures such as neurons, mitochondria, and synapses [2], higher resolution results in a multiplication of the data volume. As is known to all, it is time-consuming and difficult to annotate large volumes of data manually. Therefore, there is an urgent need to develop automated algorithms to process the structures in EM images.
Much effort has been devoted to developing automated algorithms for analyzing the EM data. One of the main application scenarios is neuron segmentation. Recently, Januszewski et al. [3] used a method called flood-filling to segment and trace neurons in a dataset obtained by serial block-face scanning electron microscopy (SBF-SEM) from a male zebra finch brain. It is a recurrent neural network (RNN)-based method unifying the two steps of finding the boundary between synapses with edge detectors or machine learning classifiers and combining image pixels that are not separated by boundaries using algorithms such as watershed or image segmentation. Due to the important role of mitochondria in cell function, researchers have attempted to quantify important mitochondrial properties in recent years. Vitaladevuni et al. [4] designed a boosting-based classifier for texture features to detect and segment mitochondria in EM images. Lucchi et al. [5] considered not only texture features, but also features on the shape of mitochondria. Using the graph cut model, they performed high-precision stereo segmentation of mitochondria on superpixels. Synapses also play an important role in the nervous system, which allows neurons to transmit an electrical or chemical signal to other neurons. Staffler et al. [6] reported an automated detection method for synapses from conventionally en-bloc stained 3D electron microscopy image stacks, SynEM. It is based on a segmentation of the image data and focuses on classifying borders between neuronal processes as synaptic or non-synaptic. Xiao et al. [7] proposed a deep learning-based method for synapse 3D reconstruction, where the Dijkstra algorithm and GrabCut algorithm were used to segment the synaptic cleft.
In addition to the several structures just mentioned, multisynaptic boutons (MSBs) are also worthy of study. It has been proven that MSBs are closely related to sensory deprivation, brain trauma, and learning [8,9,10]. MSBs are boutons that make synaptic contacts with multiple postsynaptic structures. They were first seen in cat brain exactly 50 years ago [11] and have been observed in mice, rats, rabbits, cats, and monkeys [8,12,13,14,15,16]. Previous work showed that the formation of MSB can be induced by visual sensory deprivation, an enriched environment, brain lesion, motor skill learning, and auditory associative learning [12,13,14]. Dendritic spines are tiny protrusions from neuronal dendrites and form the postsynaptic component of the synapse in the brain [17,18,19,20]. Increasing the area or number of dendritic spines can result in more efficacious synaptic transmission and thus enhance the strength of neuronal connections [12,21,22]. Both dendritic spines and shafts can form MSBs [17,23]. Long-term potentiation (LTP), a major form of synapse plasticity, can result in increased spine number and elevated proportion of MSBs in rat hippocampus [12], consistent with the idea that MSB may represent a strengthened form of synaptic connection. Therefore, analyzing the structure and connectivity of MSBs is critical in understanding sensory experience- and learning-associated synaptic plasticity.
As mentioned above, MSBs are presynaptic boutons that are in contact with multiple postsynaptic structures. Unlike the single-synapse boutons, the special structure of MSBs determines that we have to identify them step by step. Inspired by the previous work focusing on bio-electron image processing, we propose an efficient way to identify the MSBs from serial EM images. We first use a CNN-based (convolutional neural network) algorithm to detect and segment the synapses. An effective algorithm for filtering the pseudo-synapses and the missed synapses is then used to optimize the results on synapses. Meanwhile, we design a residual network to predict the neuronal membrane and further obtain the segmentation of the neurons with an improved watershed-based algorithm. Based on the information of synapses and neurons obtained in the above steps, it is reasonable to identify the MSBs on serial EM images. Our method manages to automate MSBs’ detection and recognition, which will provide a powerful tool for neuroscience research on synaptic plasticity associated with learning and memory.

2. Materials

The biological specimen in this paper is mouse cortex (provided by the Institute of Neuroscience, Chinese Academy of Sciences). Automated tape-collecting ultra-microtomy scanning electron microscopy (ATUM-SEM) was used to obtain the image stack of the mouse cortex specimen of a volume of 12 µm × 10.35 µm × 8.9 µm (performed at the Institute of Automation, Chinese Academy of Sciences). The image stack consisted of 178 serial images with a size of 6004 pixels × 5174 pixels and a voxel resolution of 2 nm × 2 nm × 50 nm. Figure 1 presents the images and ground truth on the adjacent sections. The ground truth was manually labeled by three well-trained graduate students with cross-validation. A total of 1230 synapses were annotated for the whole image stack, and the neuron membrane of the former 5 images was annotated. The software FIJI was used for annotation, and the interface is shown in Figure 2. The database and the manually-labeled ground truth are available on the website (http://95.163.198.142/MiRA/synapse_deng/).

3. Methods

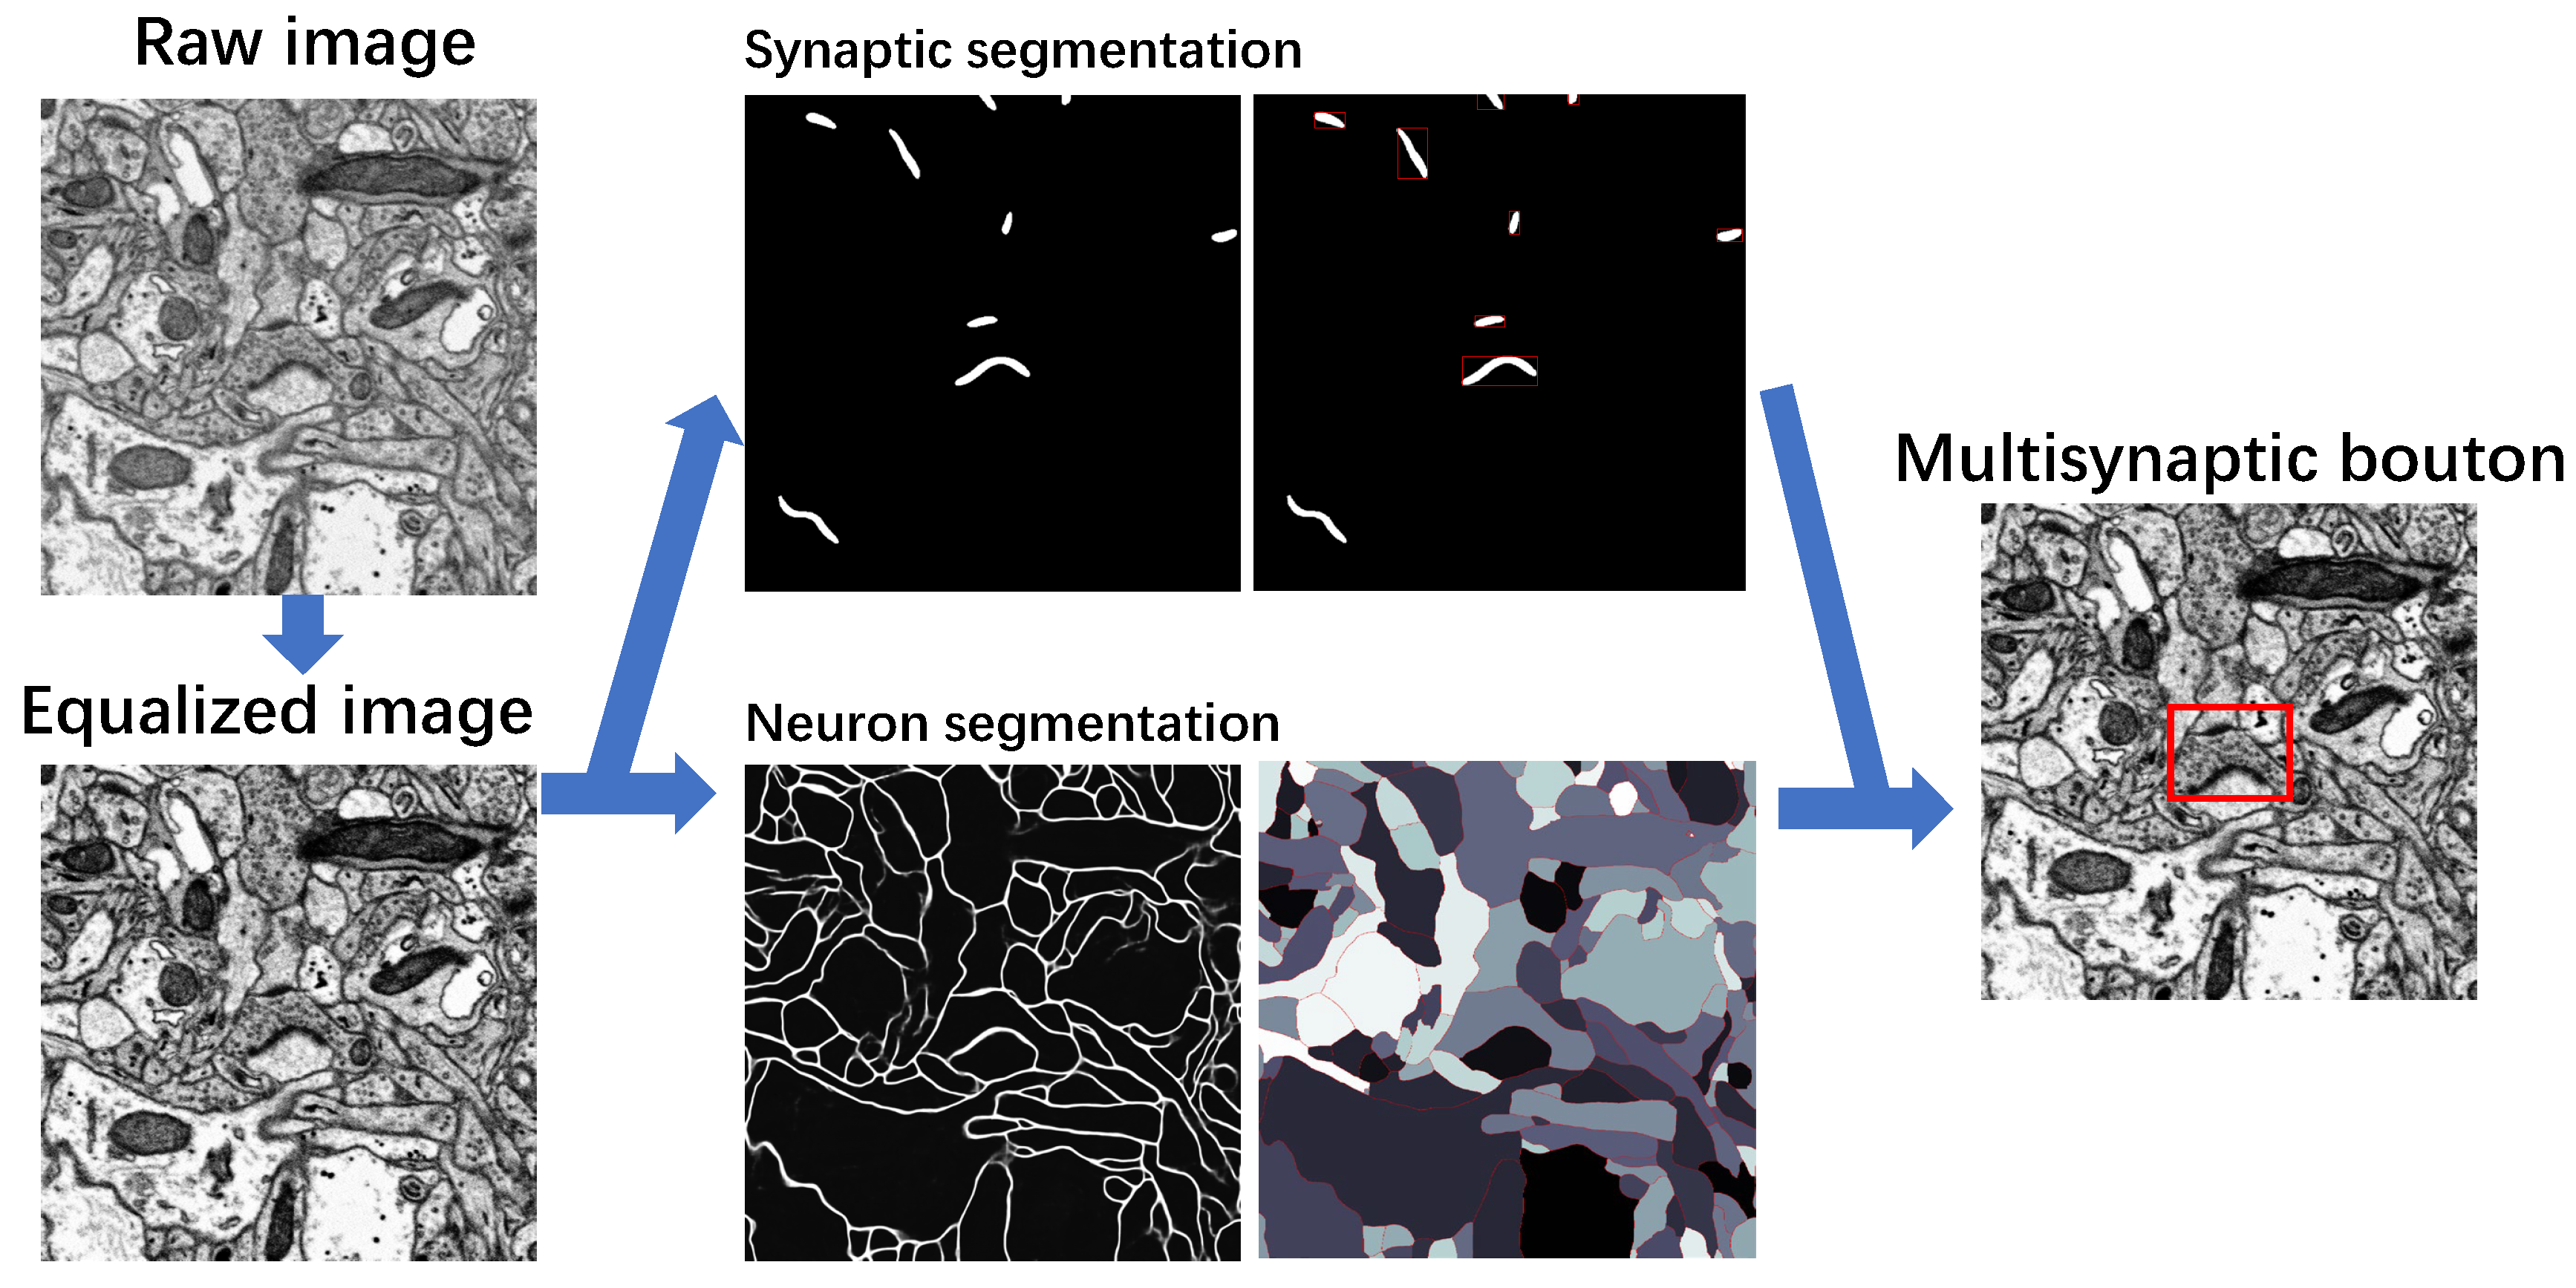
The main steps of MSBs detection are shown in Figure 3. Firstly, histogram equalization was performed on the image stack. Based on the equalized images, we located and segmented the synapses with the mask R-CNN. The contextual information was also applied to removing the false synapses and to make up the missed synapses. Meanwhile, we used a deep network to obtain the probability map of the neuronal membrane, from which we obtained the neuron segmentation with an improved marker-controlled watershed segmentation algorithm. Finally, the MSBs could be located by using the information of synapses and neurons.

3.1. Image Preprocessing

In order to reduce the effects of illumination and other factors on detecting and segmenting synapses and neurons, we transformed the intensity of the raw image to make the histogram equalized [24,25]. For each raw image I r a w , we first counted the gray-value histogram of the image.
h ( r k ) = n k ,
where r k is the k th gray scale ( k = 0 , 1 , , 255 ) and n k is the number of pixels with a gray value of r k . Then, we used the following transformation,
P ( r k ) = n k / n ,
where n = k = 1 L n k .
From Figure 4, we can notice that the contrast between foreground (synapses, the membrane of neurons) and background was more significant on the processed image.

3.2. Recognition of Synapse

In this section, we show the procedures for synapse detection and segmentation. Inspired by Hong et al. [26], we first adopted the MaskR-CNN (region-CNN) [27] to detect and segment synapses on the serial EM image stack. Then, an algorithm for filtering the pseudo-synapses and locating the missed synapses was used to rectify the preliminary results of synapses.

3.2.1. Detection and Segmentation with Mask R-CNN

The main idea of Mask R-CNN is to extend the original FasterR-CNN and add a branch to use the existing detection to predict the target in parallel. The architecture of the proposed network is illustrated in Figure 5. The first module is a fully-convolutional network (FCN) for extracting features over the input images. It outputs a feature map for each input image, where the foreground is more prominent. The next module, region proposal network (RPN), then generates region proposals over each feature map. It is a small network that slides over the feature maps. In the field of view of the sliding window, different possible regions (anchors) of different sizes are generated. All anchors are classified into foreground and background, where partial anchors belonging to the foreground are used to optimize regression parameters to correct the bounding boxes. The rectified foreground anchors that have great possibilities of containing targets are called “proposals”. Through an RoIAlign layer, the proposals on the corresponding feature maps are mapped into a fixed size. The fixed-size RoIs are imported in a network that consists of three branches, the classification branch, regression branch, and mask branch. The classification branch gives the probability that the object belongs to each class, while the regression branch fixes the position of the bounding box of the proposal once again. The mask branch is a small FCN applied to each RoI, predicting a segmentation mask.

3.2.2. Rectifying Detection Results of Synapses on the Serial EM Image Stack

Confirming the connection of objects on serial images in 3D is helpful in rectifying the detection results [28]. We present an algorithm for confirming the connection of synapses in 3D. We denote by P i , j the j th synapse on the i th section, in which the index j is randomly given. The algorithm includes the following steps:
  • For the synapse on the first section P 1 , j , we assign it a 3D serial number N 1 , j 3 d = j .
  • For the synapse on the i th section P i , j , ( i > 2 ) , we calculate the Euclidean distance between P i , j and { P i } i = i 3 i 1 . Denote by D j , j i , i the distance between P i , j and P i , j :
    D j , j i , i = c i , j c i , j 2 ,
    where c i , j is the centroid of the bounding box of P i , j .
  • Find the closest synapse to P i , j , and denote it by P i , j .
    argmin i , j { D j , 1 i , i 1 , D j , 2 i , i 1 , , D j , 1 i , i 3 , D j , 2 i , i 3 , } .
  • Verify if P i , j is the closest synapse to P i , j on the i th section. Find the closest synapse to P i , j on the i th section, and denote it by P i , j .
    argmin i , j { D j , 1 i , i , D j , 2 i , i , } .
    If j = j and the distance between P i , j and P i , j is smaller than a given threshold θ (according to the thickness of sections of 50 nm, i.e., 25 pixels in the x-y direction, we set θ = 100 ),
    D j , j i , i θ ,
    we consider that P i , j and P i , j are the same synapse appearing on different sections. Then, we assign the 3D serial number of P i , j to P i , j . If j j or Equation (6) is not satisfied, we consider that P i , j and P i , j are not the same synapse in the 3D perspective. We assign a new 3D serial number to P i , j .
With the algorithm for assigning the 3D serial number to synapses on the serial image stack, we give each synapse on the serial image stack a 3D serial number. The same synapses appearing on different sections have the same 3D serial number. Based on this, it is easy to count the number of synapses in the 3D perspective. A synapse is a spatial structure with a size of about 200 nm [7]. Therefore, one synapse should appear on at least 3 adjacent sections under the condition that the thickness of the section is 50 nm. We deleted the synapses that appeared on less than 3 layers, which were considered as pseudo-synapses. Meanwhile, in order to avoid the inaccuracy of synapse statistics caused by synapses that were missed, as shown in Figure 6, where the yellow rectangle indicates missed, while the red rectangles indicate correct detection, we also needed to locate the synapses that were missed. For the synapses with the same 3D serial number, if the layer numbers of the sections they are in was incoherent, it was likely that there were missed synapses on the the section with a discontinuous serial number.

3.3. Segmentation of Neuron

In this section, we introduce the procedures to obtain the segmentation of neurons. Firstly, a well-designed deep neural network is trained to output the probability map of the neuronal membrane. Then, a series of morphological operations are performed on the probability map to obtain neuron segmentation.

3.3.1. Probability Map of the Neuronal Membrane

For the recognition of the neuronal membrane, an efficient contextual residual network [29] was used in this study. It was first used on the public dataset ISBI (International Symposium on Biomedical Imaging) 2012, and the experimental results showed its effectiveness in the recognition of the neuronal membrane on EM images. The schematic diagram showing the training/testing process of the network that outputs the probability map of neuronal membrane is shown in Figure 7. The network consisted of two main parts: a ResNet38-like module and an expansive module. As for the ResNet38-like module, the first improvement is that a maximum pooling layer was added after the first convolutional layer, which greatly reduced the number of parameters. Following the max-pooling layer were 8 residual units, which can be divided into 6 blocks. Block 1 and Block 2 was composed of two residual units, respectively, each of which consisted of two convolutional layers with a kernel size of 3 × 3 . By setting the stride of kernels on the first convolutional layer of Block 1 and Block 2 to 2, they downsampled the image to 1/4 of the original size. For Block 3 and Block 4, each consisted of two convolutional layers. Correspondingly, Block 5 and Block 6 were composed of three residual units, respectively. In order to cope with the problem that the distribution of the training set was inconsistent with the distribution of the prediction set, that is the internal covariate shift (ICS) phenomenon, we used mini-batch normalization before the exponential linear units (ELUs) so that the result (each dimension of the output) had a mean of 0 and a variance of 1, which helped to increase the convergence speed and improve the prediction results. For the feature maps outputted by the max pooling layer, Block 1 and Block 6 were upsampled by fractional strided convolution with channels 64, kernel size 2 N × 2 N , and stride N ( N = 2 , 4 , and 8 for upsampling layers, respectively). The global information and local cues from different scales were then incorporated by summation-based skip connections. Unlike concatenation-based skip connections, summation-based skip connection provides a more thorough integration of multi-scale context cues and overcomes the vanishing gradient problem more efficiently. Finally, two convolutional layers and dropout ( p = 0.5 ) were used to refine the pixel-wise prediction and improve generalization ability.

3.3.2. Neuron Segmentation with the Marker-Controlled Watershed Algorithm

This section shows how to use a modified watershed-based segmentation method to separate neurons in a 2D EM image, and the workflow is shown in Figure 8. Based on the probability map of the neuronal membrane outputted from the network described in the above subsection, we first obtained the foreground marker. Then, we used watershed segmentation to separate the neurons under the guidance of the rectified foreground marker.
The watershed transform finds “catchment basins” and “watershed ridge lines” in an image by taking it as a surface where light pixels are high and dark pixels are low [30]. It is a natural way to segment neurons with the watershed-based algorithm under the hypothesis that the neurons and membranes are “catchment basins” and “watershed ridge lines”, respectively. Segmentation using the watershed transform works better if we can identify, or “mark”, foreground objects and background locations. Therefore, to make the segmentation result more accurate, we extracted a part of each neuron as the foreground mark. Here, we do not give the background mark. For each probability map of the neuronal membrane I (as shown in Figure 8A) whose pixel values in I varied from 0–255, we used the modified marker-controlled watershed segmentation following these basic procedures.
Firstly, we computed its complement I (as shown in Figure 8B):
I = 255 I .
Next, we found the markers of the foreground objects. These markers should be connected speckle pixels inside each of the neurons. We used opening-by-reconstruction and closing-by-reconstruction to make the internal part of each neuron “flatter” and denoted by I o b r c b r the clean image. The opening-by-reconstruction is an erosion followed by a morphological reconstruction, while the closing-by-reconstruction is a dilation followed by a morphological reconstruction. Reconstruction-based opening and closing are more effective than standard opening and closing at removing small blemishes without affecting the overall shapes of the objects. The dark spots and stem marks on the probability map of the neuronal membrane can be removed efficiently by performing these two operations. The detailed process is shown in Equation (8):
I e = I s e , I o b r = I e I , I o b r d = I o b r s e , I o b r c b r = 255 ( 255 I o b r d ) ( 255 I o b r ) ,
where , , are the erosion, dilation, and reconstruction operations, respectively. s e is a disk-shaped structuring element with a radius of 10 pixels. The regional maxima of I o b r c b r are foreground markers. We denoted by I f g m 1 (as shown in Figure 8C) the binary image of the foreground markers. To prevent the foreground markers in some objects from reaching the edge of the object, we shrunk them by a closing followed by an erosion:
I f g m 1 = r e g i o n a l M a x i m a ( I o b r c b r ) , I f g m 2 = I f g m 1 s e 2 , I f g m 3 = I f g m 2 s e 2 ,
where • is the close operation and s e 2 is a disk-shaped structuring element with a radius of 5 pixels. In addition, some connected components that have fewer than a certain number of pixels should also be removed because this algorithm tends to leave some stray isolated pixels. We denoted by I f g m (as shown in Figure 8D) the binary image of the rectified foreground marker.
Then, as described in Equation (10), we took the probability map I as the gradient magnitude image I g r a d and modified it using morphological reconstruction, so only the regional minima where I f g m is nonzero were preserved.
I g r a d = I , I g r a d 2 = I g r a d I f g m .
Lastly, we can obtain the segmentation of I by performing the watershed transform on the modified gradient magnitude image I g r a d 2 :
I l a b e l = watershed ( I g r a d 2 ) .
As can be seen from Figure 8E, the width of the boundary indicated by this red line was only one pixel. This was caused by the fact that we only gave the foreground mark without giving the background mark. This helps to integrate the synaptic segmentation information to locate multiple sites.

3.4. MSB Identification

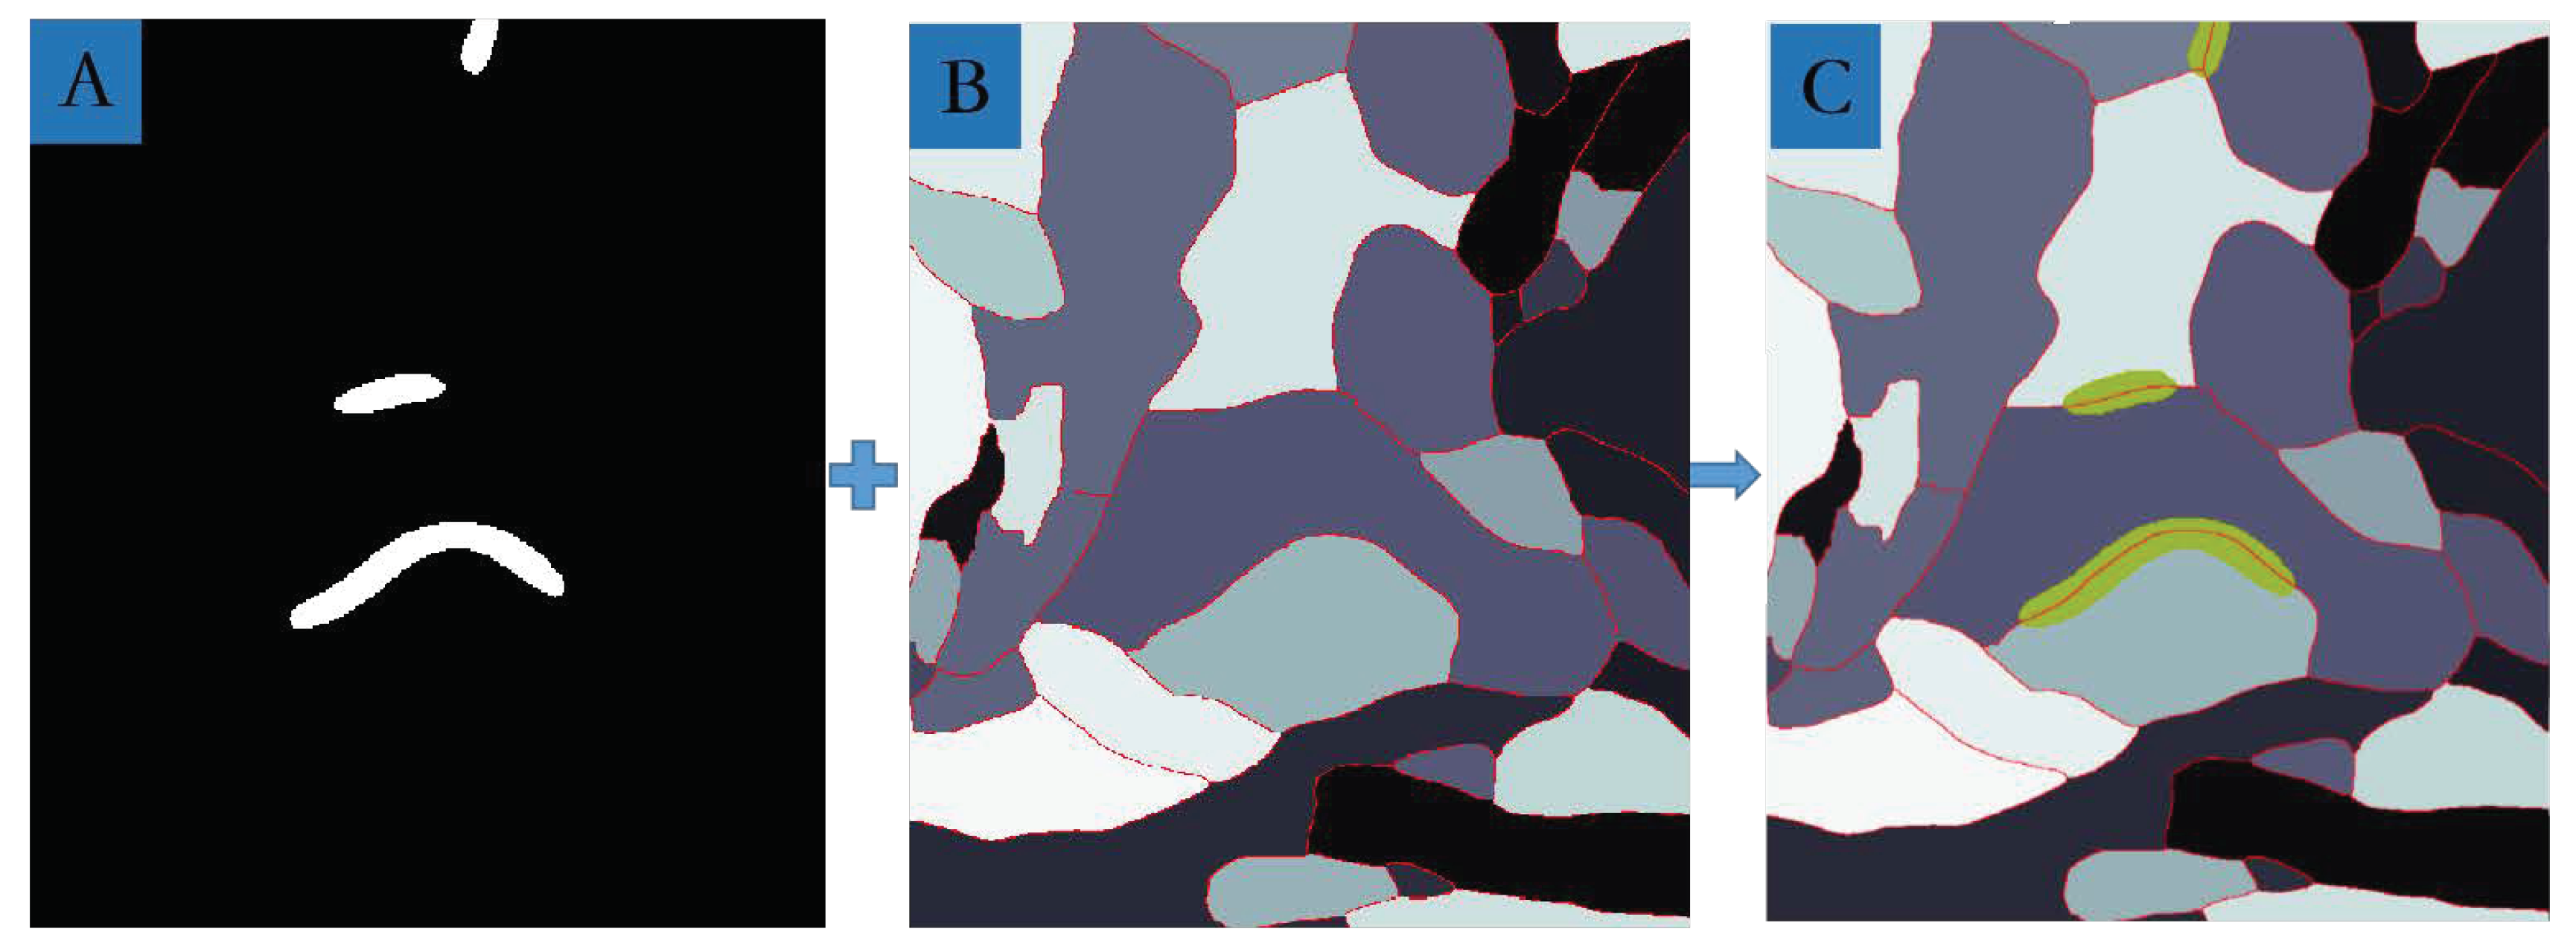
As shown in Figure 9, the MSBs can be positioned logically by incorporating the segmentations of neurons and synapses. For each synapse, we can know the labels of pre- and post-synaptic neurons by projecting the bounding box of the synapse onto the labeled segmentation of neurons. According to the morphological characteristics of MSB, it can be concluded that the neuron shared by several synaptic clefts was an MSB. Firstly, we located each synapse on the labeled segmentation of neurons. The two neurons with maximum frequency labels were considered as pre- and post-synaptic neurons corresponding to the synapse. Naturally, a neuron corresponding to multiple synapses, that is a neuron whose label frequency was more than 2 times, was considered to be an MSB.

4. Results

To demonstrate the effectiveness of the proposed algorithm, we counted the number of detected MSBs from our dataset and compared the results with the manually-labeled ground truth. The measurements we selected to evaluate the results of synapse detection were Precision and Recall.. Precision, also referred to as the positive predictive value, is the fraction of relevant instances among the retrieved instances, while R e c a l l is the fraction of relevant instances that have been retrieved over the total amount of relevant instances:
Precision = True Positives True Positives + False Positives ,
Recall = True Positives True Positives + False Negatives .
This study adopted the Jaccard similarity [31] as the evaluation measurement for segmentation, which is defined as the size of the intersection divided by the union of the two segmentation results in the field of image processing:
J ( S i , S j ) = | S i S j | | S i S j | ,
where S i and S j represent the ground truth and segmentation, respectively. Pixel-error and Rand-error [32] were used for evaluating the segmentation results of neurons. Pixel-error is the ratio of the number of misclassified pixels to the total number of pixels. Rand-error is the difference between one and the R a n d - i n d e x . The R a n d - i n d e x is a similarity evaluation method for two clusters that can be used to measure segmentation due to the fact that segmentation can be regarded as a cluster of pixels.
Pixel-error = Number of False Positive Pixels + Number of False Negative Pixels Number of Pixels ,
Rand-error = 1 Rand-index = 1 N 1 + N 2 C n 2 ,
where n is the number of pixels, N 1 is the number of pairs of pixels that are in the same connected object in the ground truth and in the same connected object in the segmentation results, and N 2 is the number of pairs of pixels that are in the different connected objects in the ground truth and in the different connected objects in the segmentation results
Due to the limitation of computer memory, we split each original image of size 6004 pixels × 5174 pixels into nine sub-images with a size of 2048 × 2048 in the experiment for training the Mask R-CNN. The overlapping pixels between adjacent sub-images in the x and y directions were 485 and 78, respectively.
For the 1602 sub-images, 630 sub-images were for training, while 270 sub-images were for verification, and the other 702 sub-images were for testing. The neuronal membrane of the former five images was manually annotated. The images with a size of 6004 pixels × 5174 pixels were split into sub-images with a size of 1024 pixels × 1024 pixels, each of which was further split into four images with a size of 512 pixels × 512 pixels. In total, 720 sub-images with a size of 512 pixels × 512 pixels were obtained, 450 sub-images for training, 150 sub-images for validation, and 120 sub-images for testing. To improve the robustness of the networks, we enlarged the training dataset by means of data augmentation, including rotation and flipping. In addition, reliability issues arise when the distribution of input training data differs from the distribution of the evaluation model [33]. Therefore, we randomly added Gaussian noise to the raw image (mean = 0, variance = 0.1) to make the model more robust during the training phase. The training and testing tasks were conducted on a server equipped with an Intel i7 CPU with 512 GB of main memory and a Tesla K40 GPU.
To illustrate the effectiveness of Mask R-CNN in the detection of synapses, we show the detection results of synapses using AdaBoost. From Figure 10, we can notice that the precision and recall were about 10.00% and 95.15%, respectively, under the default threshold (the default value of the minimum number of adjacent rectangles in which the target was detected was three). Besides, we show the comparison of the detection results on synapses in Figure 10 to illustrate the effectiveness of our algorithm for assigning a 3D serial number to synapses on the serial image stack and the algorithm for deleting pseudo-synapses and locating missed synapses. In total, we detected 13,036 synapses on the serial image stack. We found that there were 2027 synapses that only appeared on one section, which were considered as pseudo-synapses. With the algorithm for deleting pseudo-synapses and locating missed synapses, we removed these pseudo-synapses and located 445 missed synapses. As shown in Figure 10, the recall rate was increased from 97.15%–97.64%, and the accuracy rate was increased from 54.30%–62.12%.
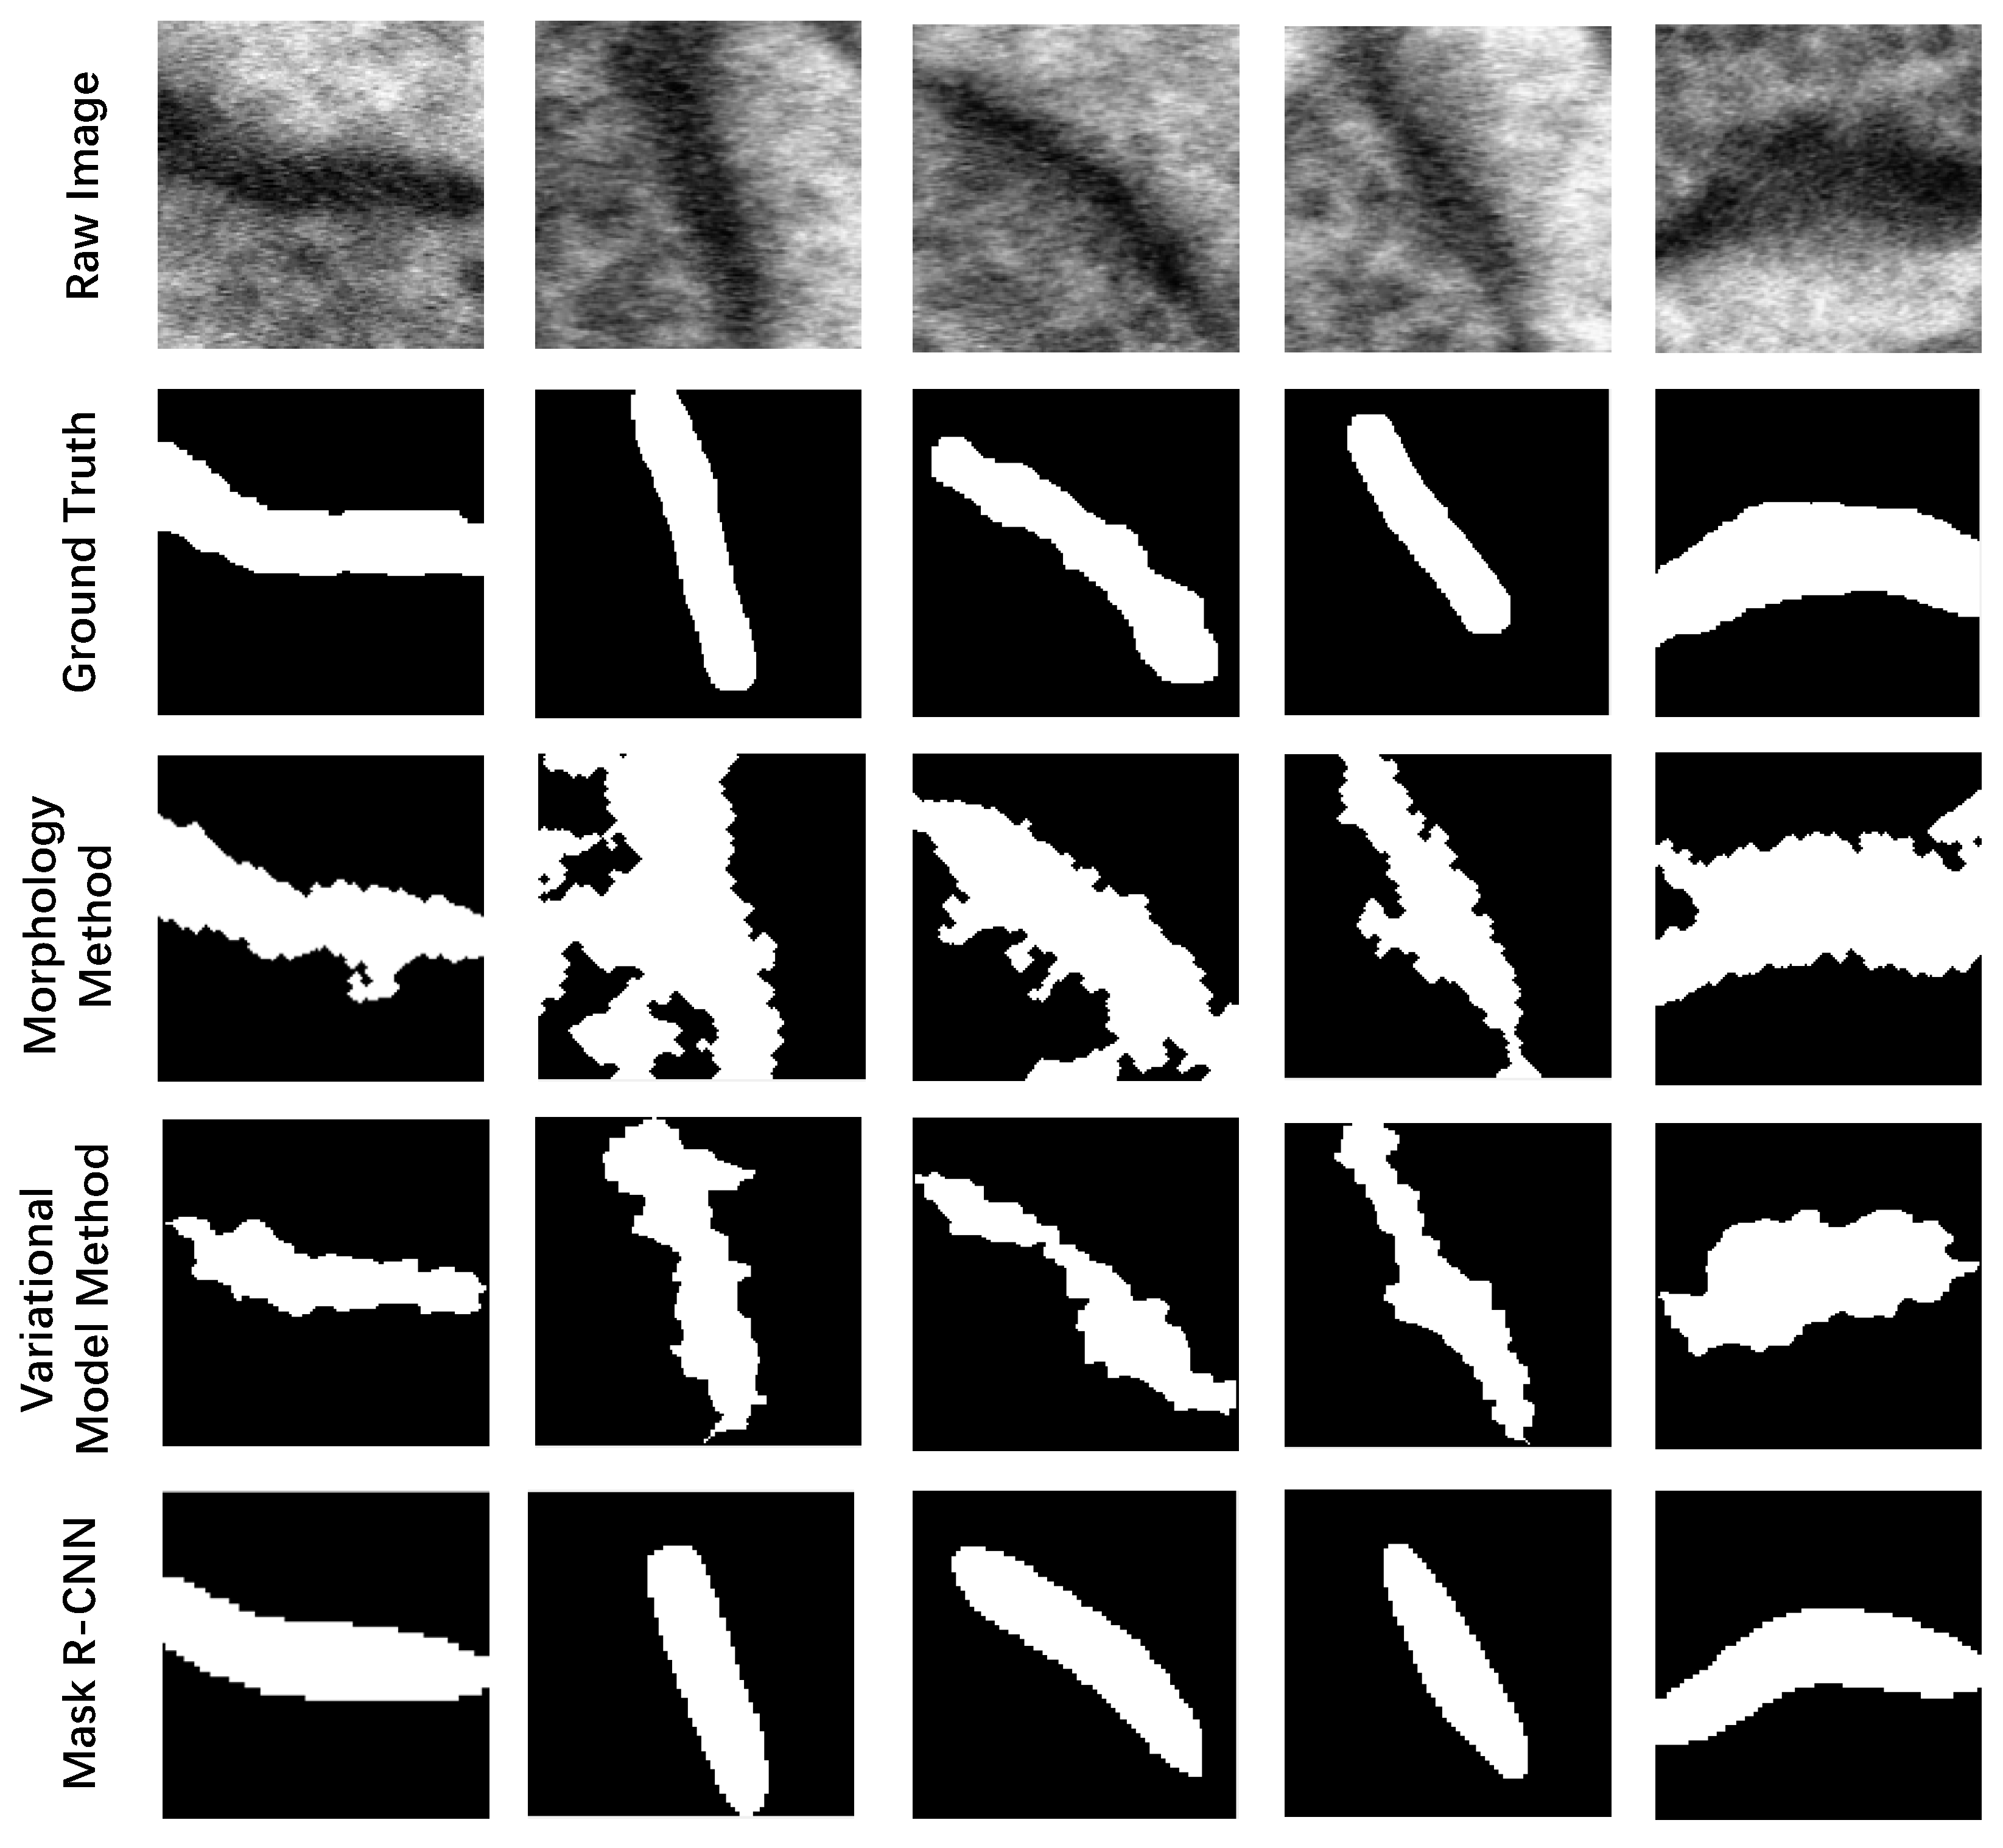
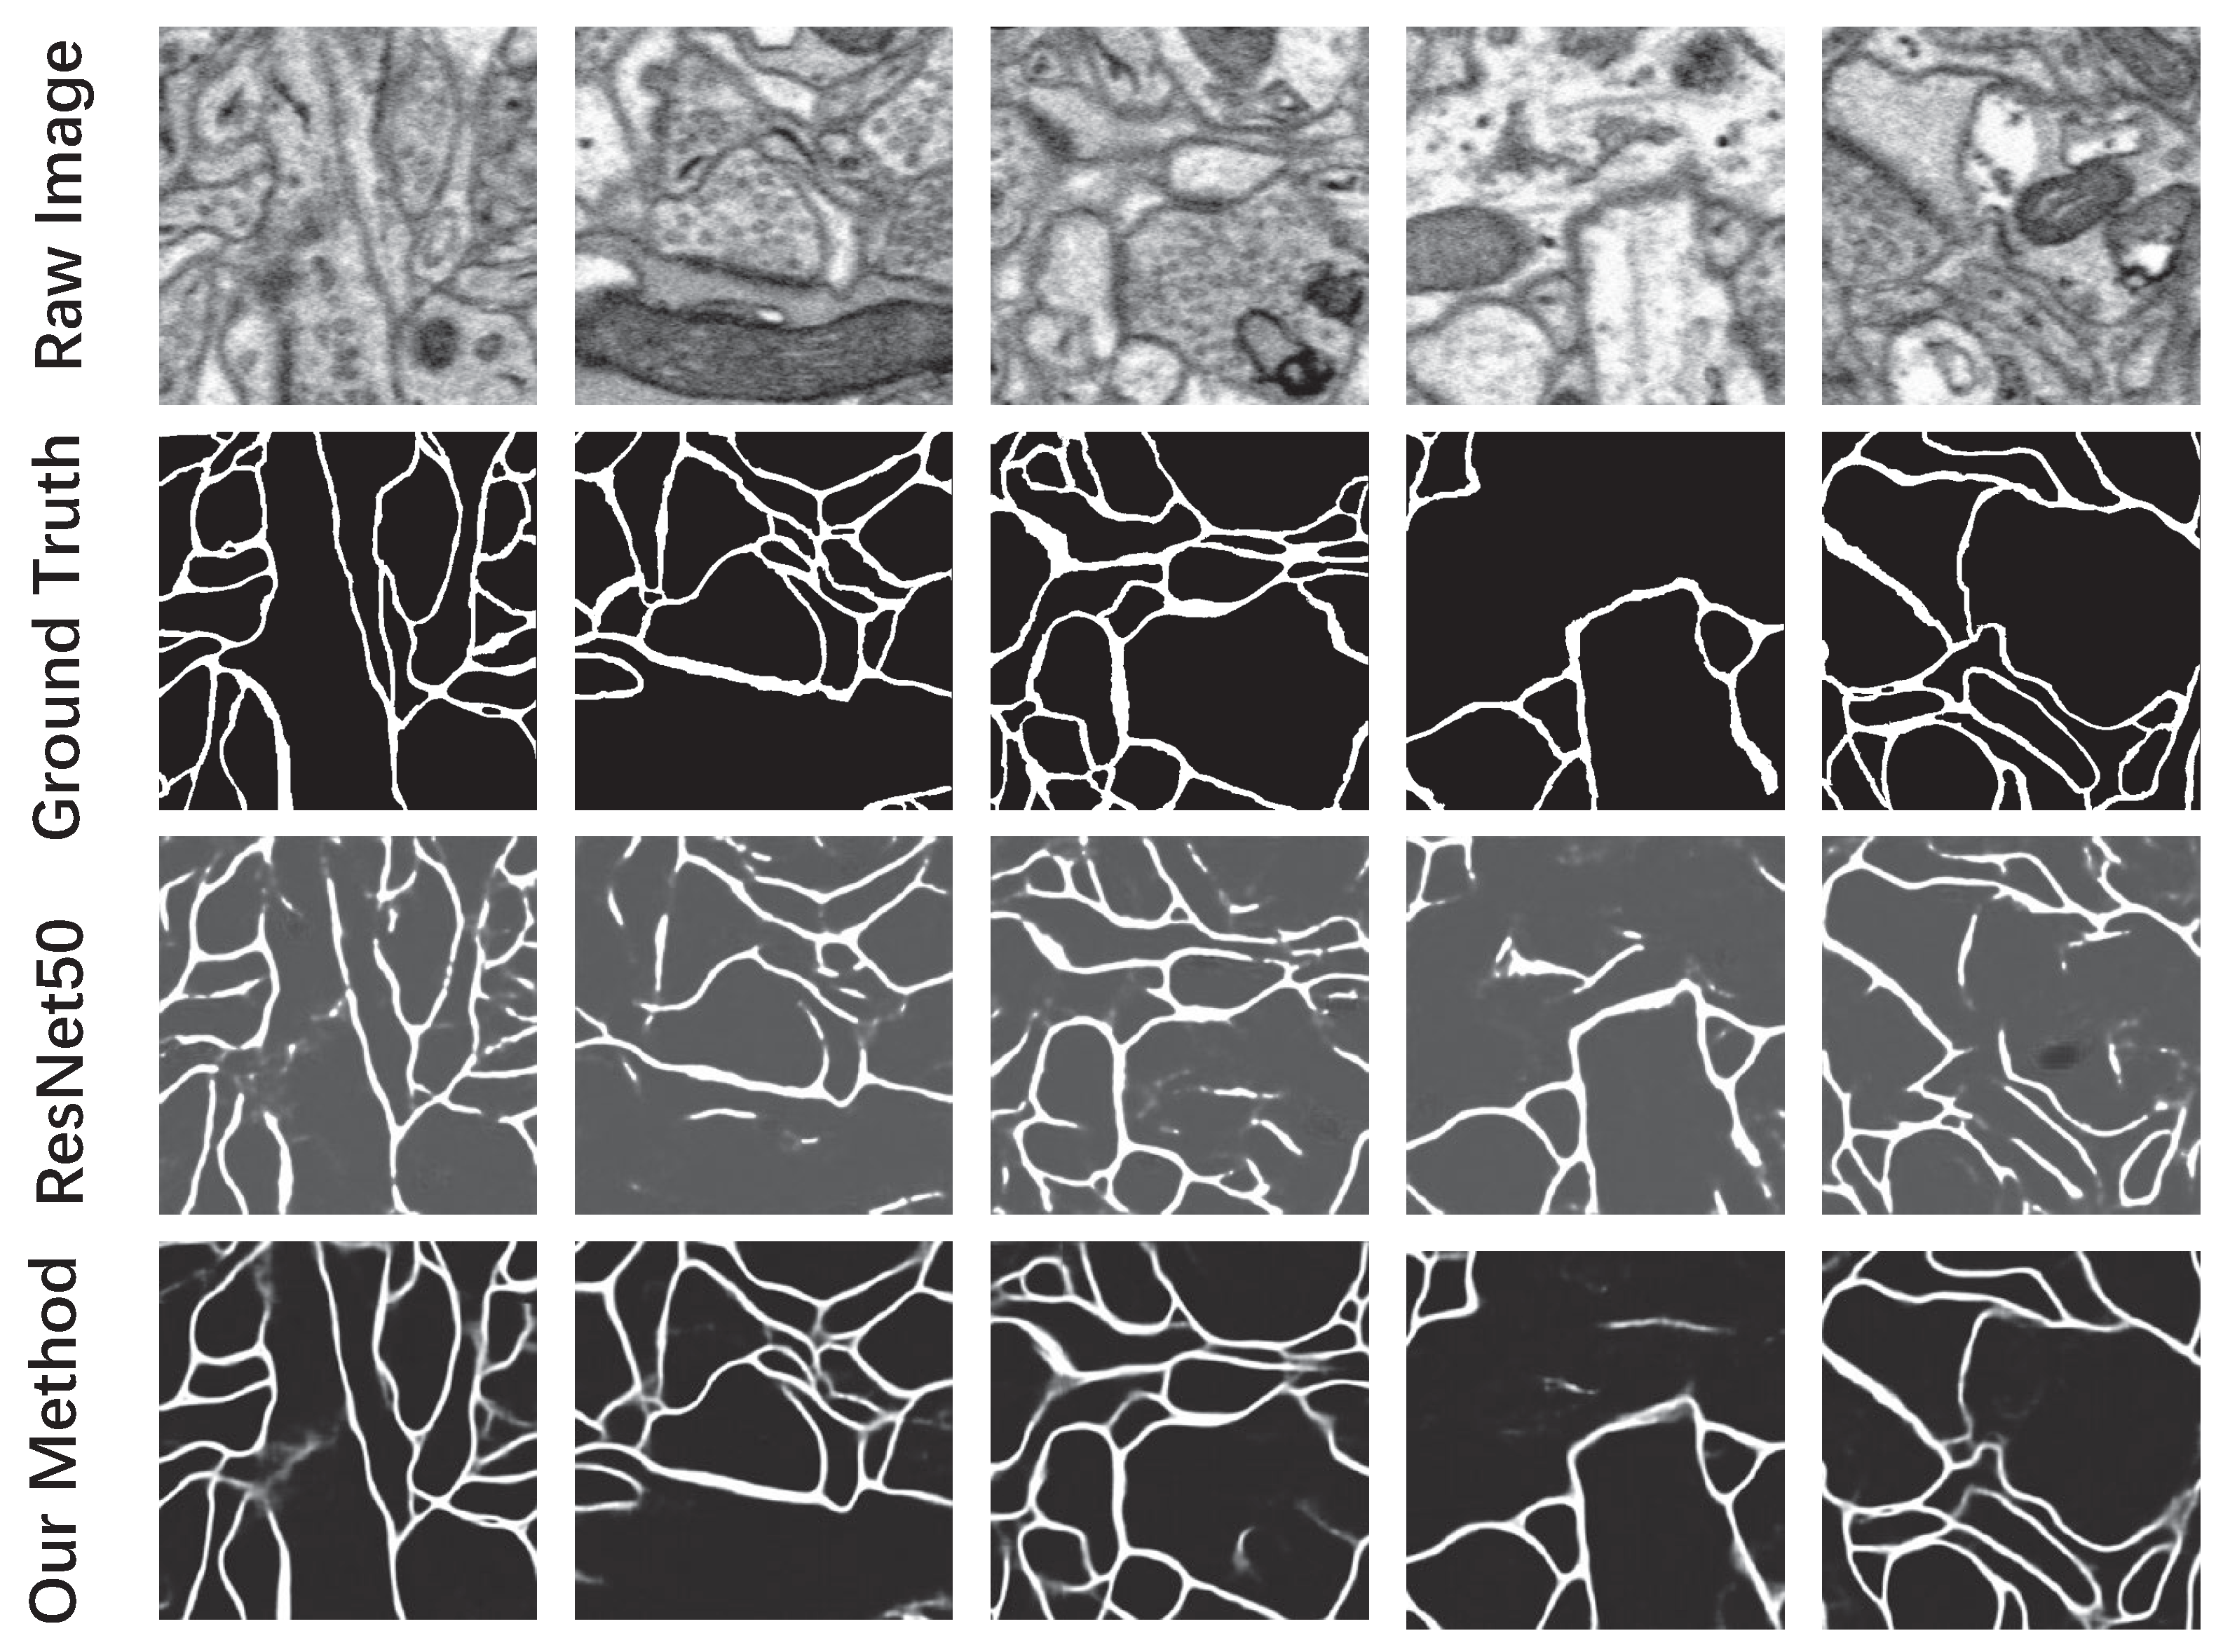
For the comparison of synapse segmentation results, the morphology-based method and a variational model-based method [34,35,36] were selected. As shown in Figure 11, the mask R-CNN was superior to the other two methods in maintaining the basic shape and edge smoothness and was basically consistent with the manually-annotated ground truth. The Jaccard similarity of the segmentation results of synapses is shown in Table 1. For the comparison of the segmentation results of neurons, the neuronal membrane prediction results of ResNet50 [37] are shown in Figure 12. Obviously, our approach was superior to ResNet50 in maintaining the neuronal membrane. The Pixel-error and Rand-error [32] of the segmentation results of neurons are shown in Table 2. In this way, the accuracy of the segmentation was guaranteed when the neurons were segmented based on the probability map of the neuronal membrane.
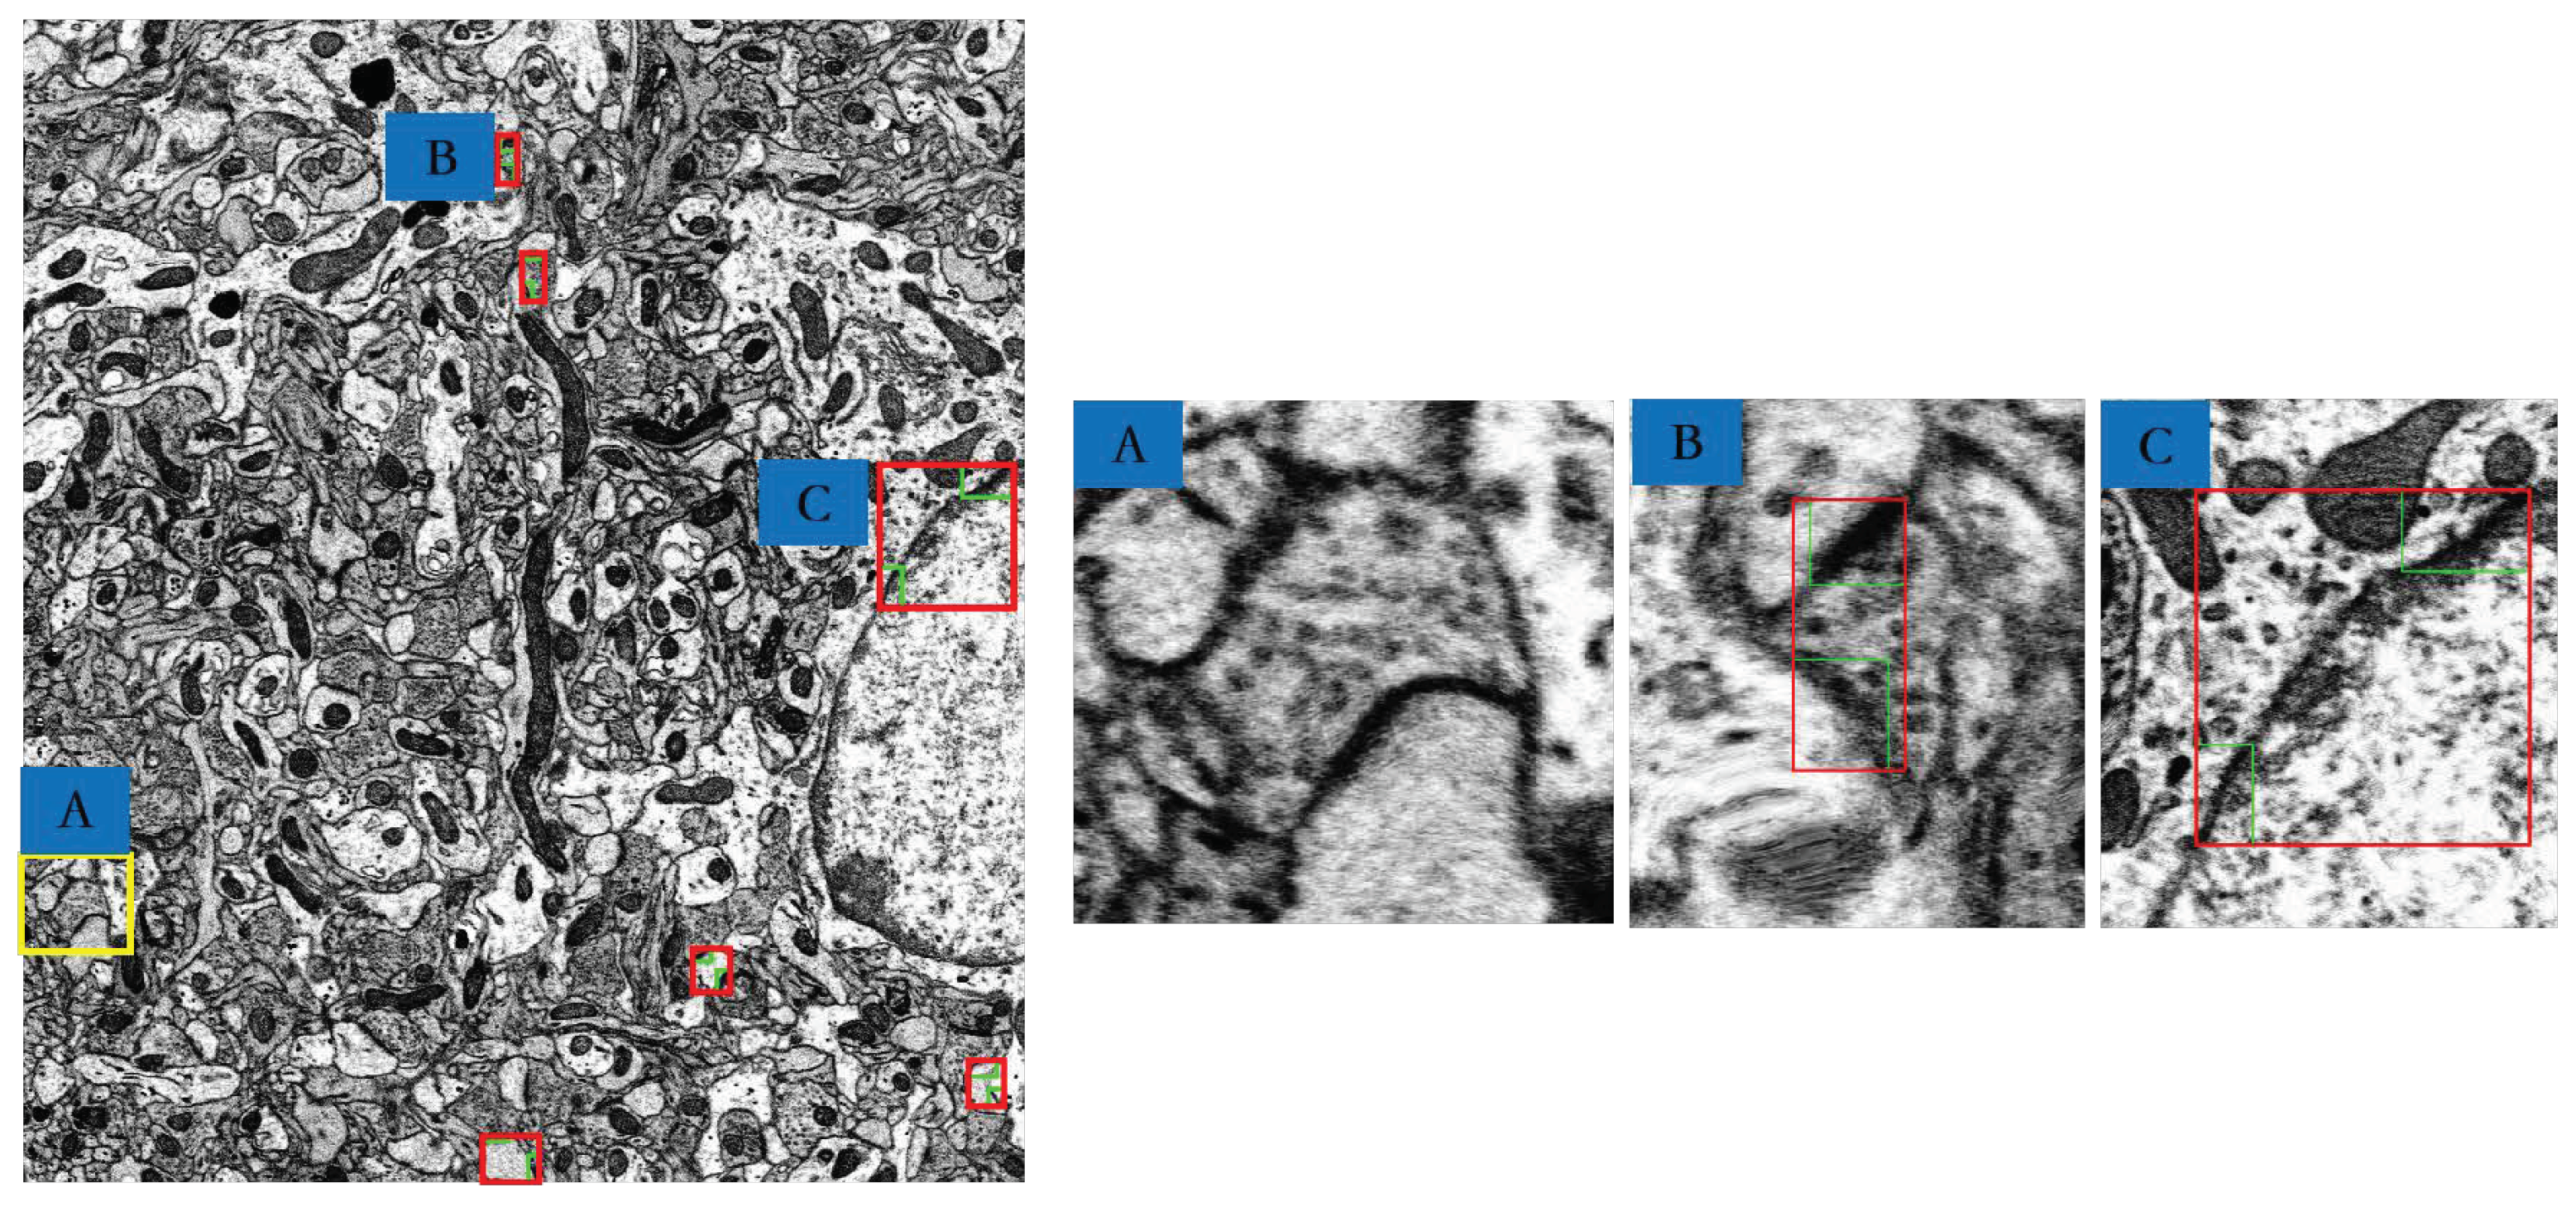
We list the number of misdetected MSBs and missed MSBs in 10 images in Table 3, where the first image is from the training set and the others images are from the test set. Figure 13 shows the identification results of MSBs on the 121th image. There were six MSBs identified, in which one MSB was missed (Figure 13A) and two MSBs were misidentified (Figure 13C). Figure 13B shows one of the four correctly-identified MSBs. The identified results on the whole image stack are available on the website mentioned above. According to our statistics, each section of a size of 12 µm × 11.3 µm from mouse cortex had about 5.1 MSBs. The precision and recall of our method on MSBs’ identification were 68.57% and 94.12%, respectively.
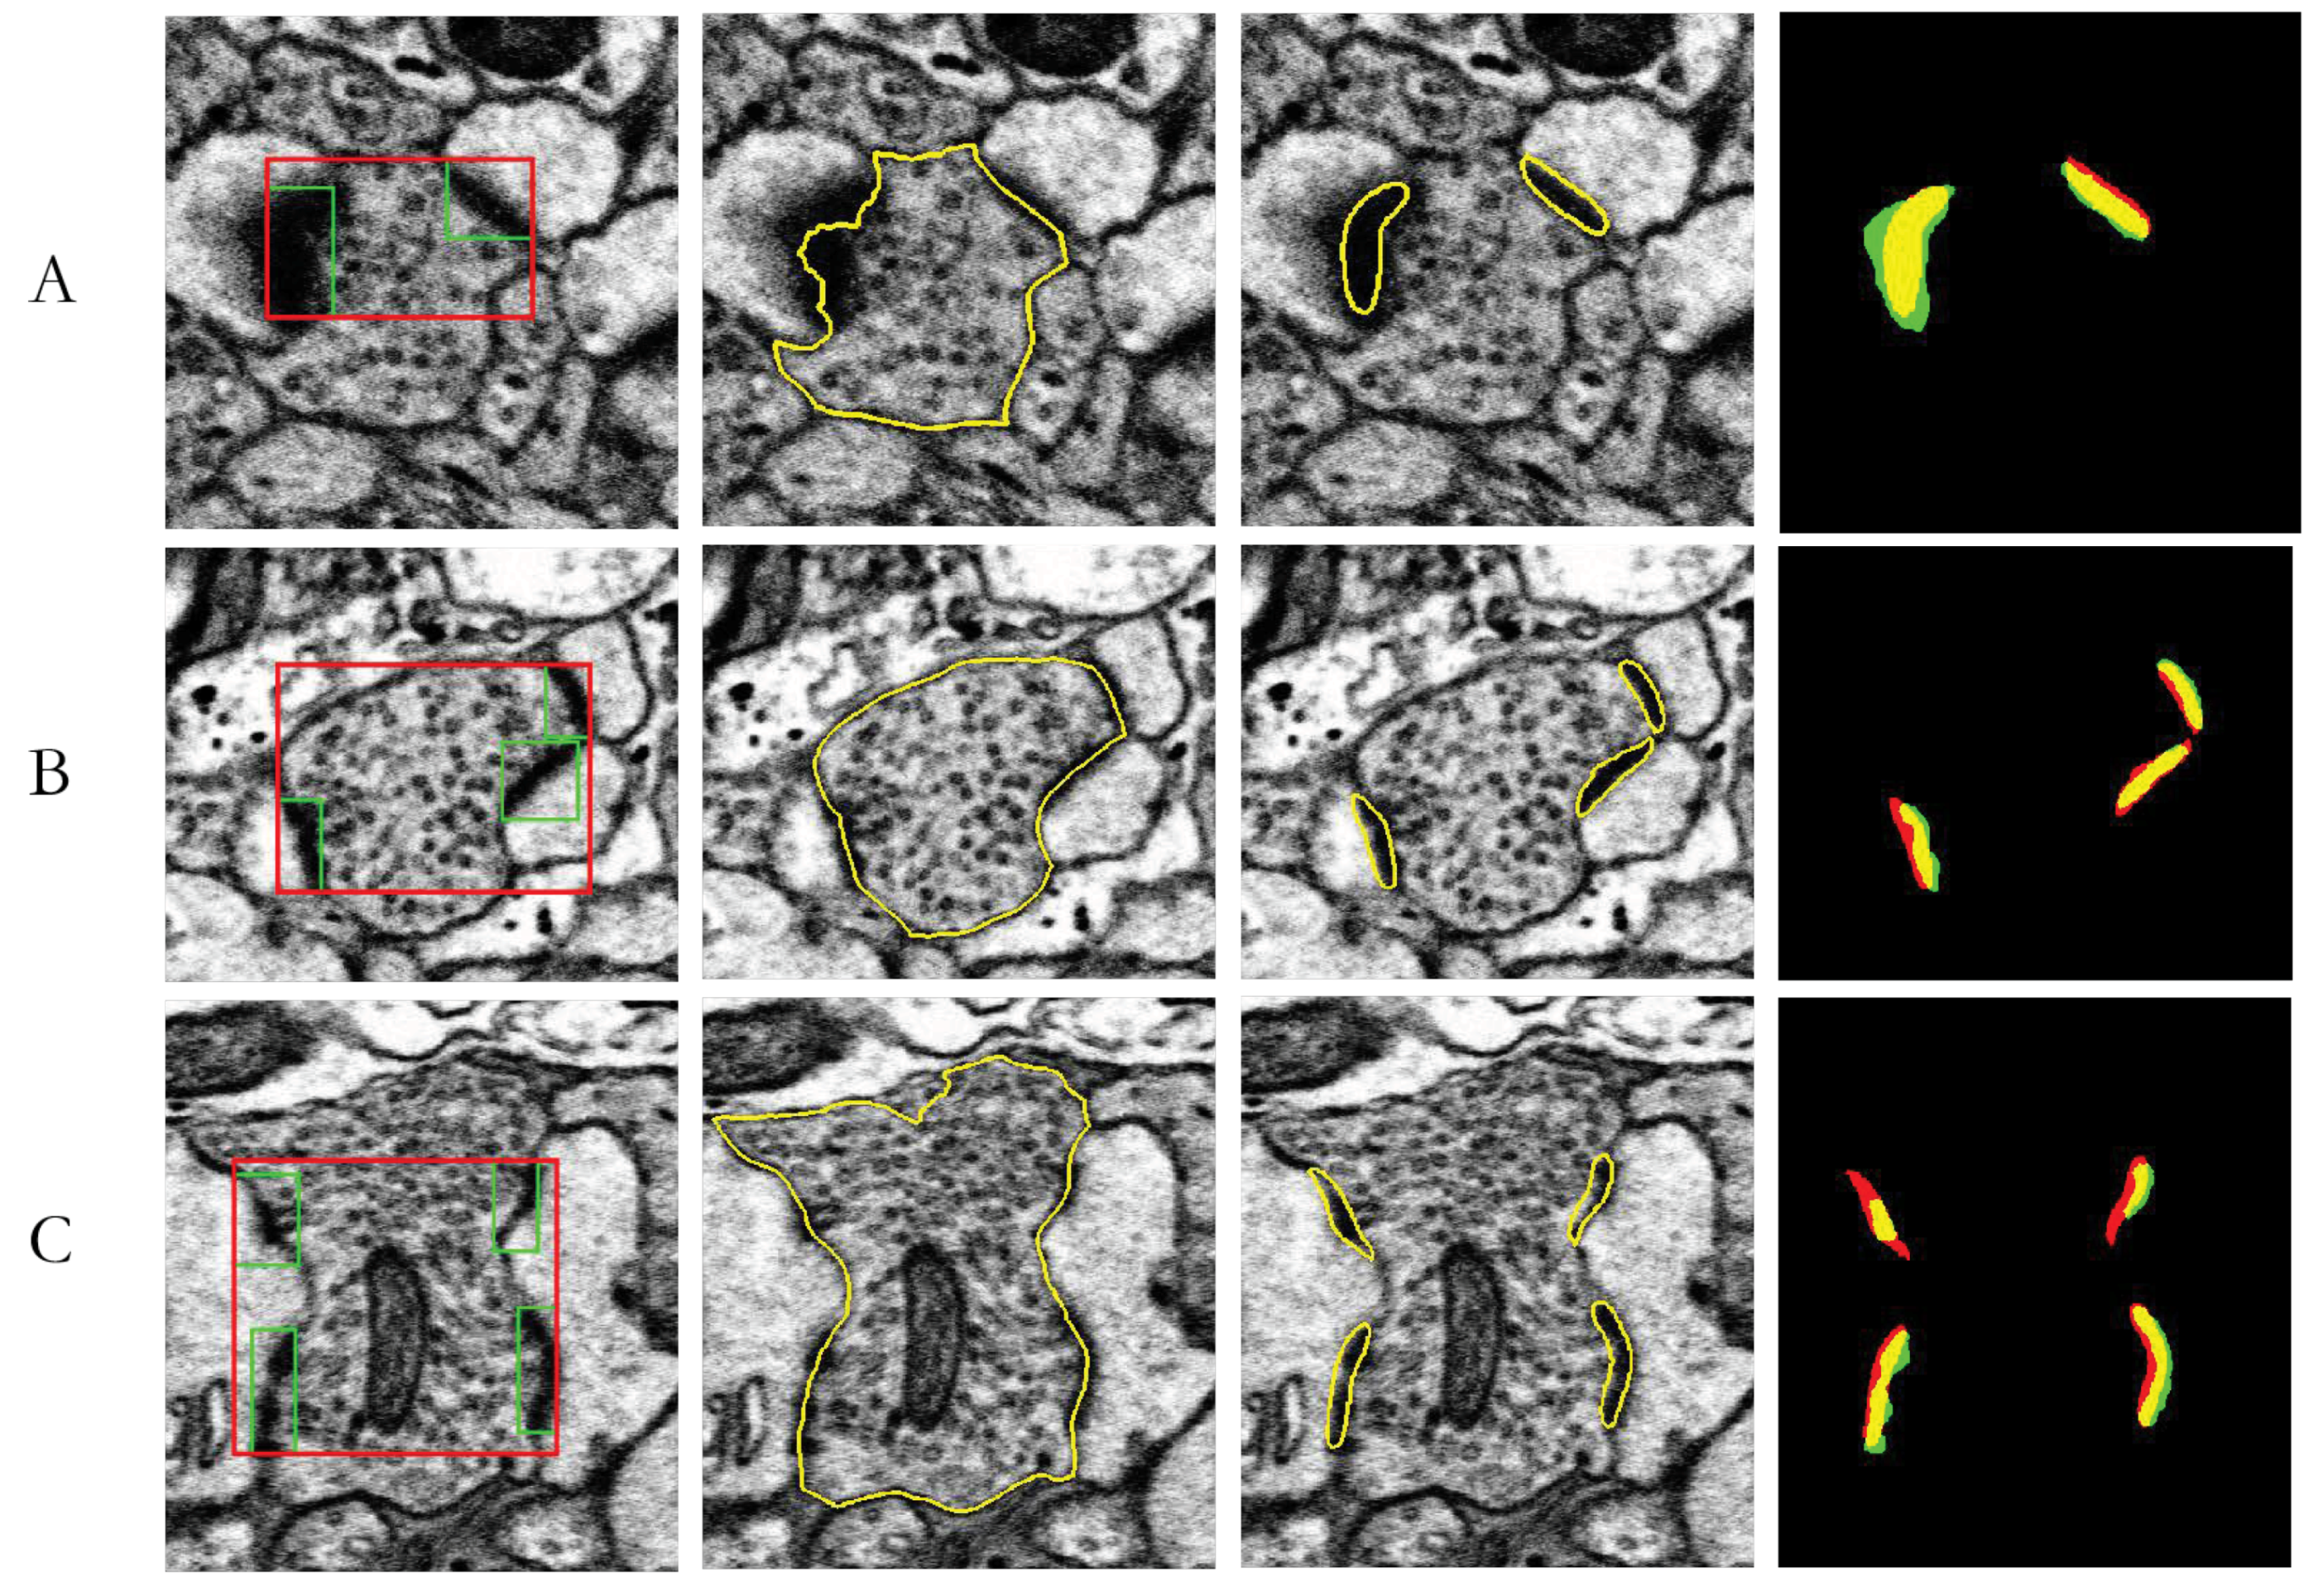
In Figure 14, we show three types of MSBs: Type A, one bouton to two synapses; Type B, one bouton to three synapses; and Type C, one bouton to four synapses. From left to right are raw images, bouton segmentations, synapse segmentations and the superimposed images of synapse segmentations and the manually-labeled ground truth of synapses. In the superimposed images, the yellow area is the overlapping area of segmentations and the manually-labeled ground truth, containing correctly-predicted pixels. The red area and green area consist of misclassified pixels and missing pixels, respectively. To evaluate the segmentation performance, we computed the Jaccard similarity between the synapse segmentations and the manually-labeled ground truth of synapses, as shown in Table 4. Table 5 shows the statistics of different types of MSBs: approximately 94.31% axon-two postsynaptic sites (dendrite spines or shafts), 4.99% axon-three postsynaptic sites (dendrite spines or shafts), and 0.70% axon-four postsynaptic sites (dendrite spines or shafts). The morphological changes in MSBs can induce pattern and functional strength alterations in neural connections, such as synchronous activity, learning, and memory [12,38]. Apart from the percentage ratio of different MSBs’ profiles, the area of the synapse, especially the presynaptic bouton and PSD (postsynaptic density) along the portion of the plasma membrane, are a characteristic feature of the synapses. The area of the presynaptic axon boutons and PSD are also shown in Table 4. The average area of the presynaptic axon boutons and PSD was 0.5731 µm2 and 0.0121 µm2, respectively. A previous study indicated that structural alterations of the presynaptic boutons and the PSD led to sustained changes in neurotransmitter release, which played an important role in synapse-specific forms of plasticity, as well as neuropathy [39]. Deep learning method application in MSBs’ detection and recognition will be a useful tool in neuroscience study. μ µ

5. Discussion

As shown in Figure 15, three types of MSBs were identified in mouse cortex: (1) axon-multiple dendritic shaft synapse, a single axon presynaptic terminal forming synapses with two or more postsynaptic dendritic shafts; (2) axon-multiple dendritic spine synapse, a single axon presynaptic bouton forming synaptic contact with two or more postsynaptic dendritic spines; (3) axon-dendritic shafts-dendritic spine, including a single axon terminal site forming synapses with one or more dendritic shafts and one or more dendritic spines. Kim et al. suggested that different types of MSBs have disparate effects on cerebellar synaptic transmission [40]. Therefore, it makes sense to classify the MSBs in more detail. For example, in many cases, it is necessary to analyze different groups of biological tissue data grouped by age or drug variables to further explore the role of different factors. Our method can be used to analyze the differences in the number or distribution of MSBs in different groups. Especially when the amount of data is large, the advantages of this automatic method are more obvious. Except for ATUM-SEM, current mainstream EM technologies include serial block-face scanning electron microscopy (SBF-SEM), serial section transmission electron microscopy (ssTEM), and focused ion beam scanning electron microscopy (FIB-SEM). Although each of these methods has its pros and cons, they all provide sufficient resolution to reveal invaluable information about structures such as neurons, mitochondria, and synapses. Therefore, our approach is also suitable for EM images of these types and data from other biological tissues.
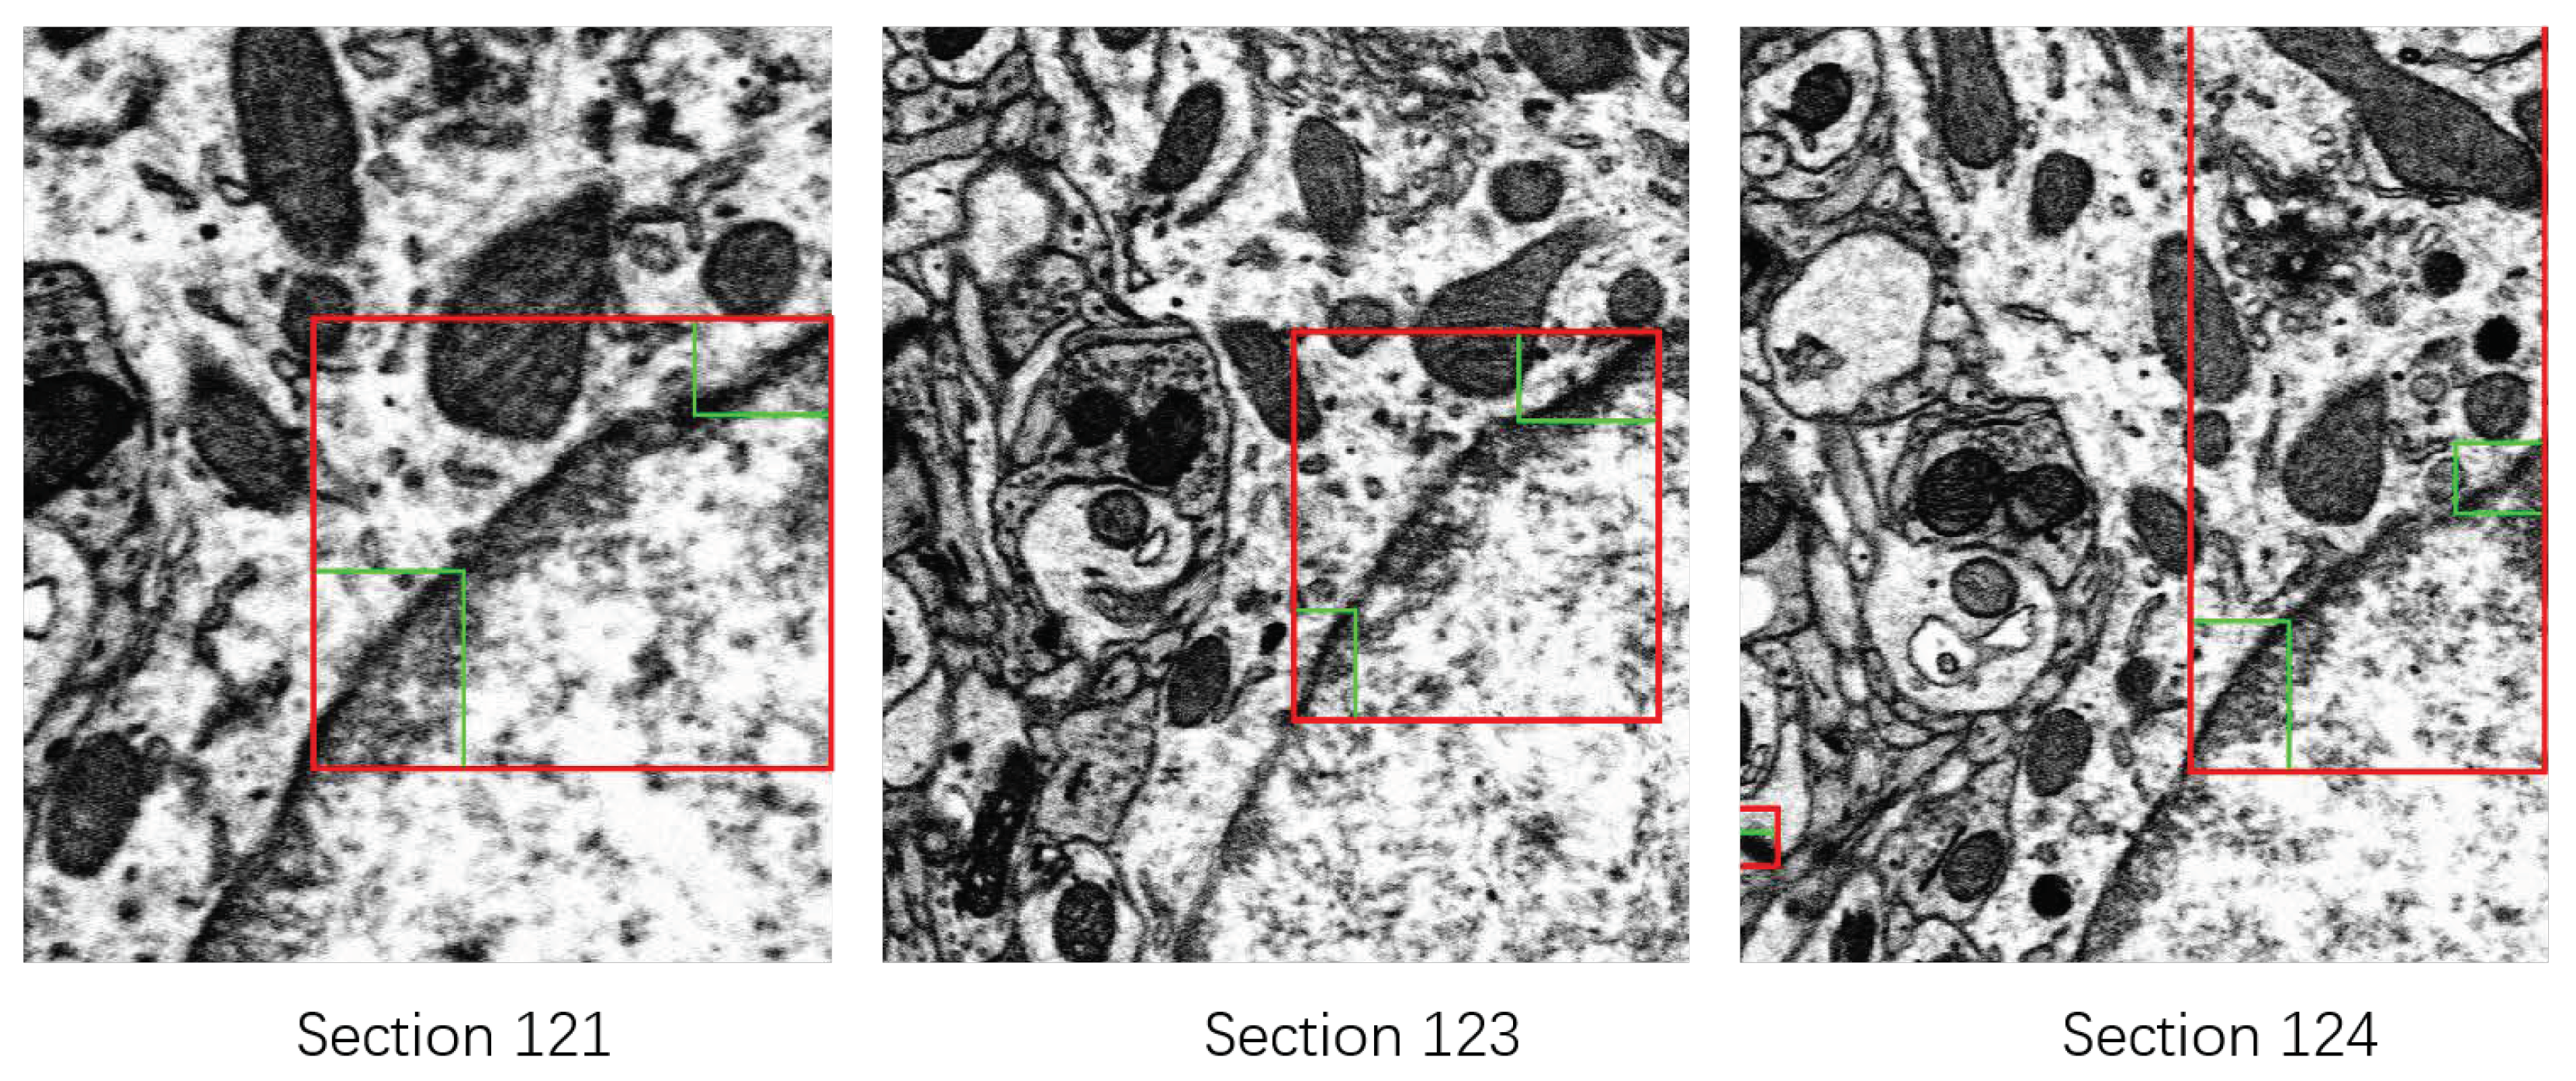
Though the recognition accuracy of our method was acceptable under the premise of a high recall rate, which is of great help to biologists’ research on MSBs, the proposed method will also fail in some cases. As shown in Figure 16, the MSBs were incorrectly identified in the same area of three adjacent images. Due to the misdetection of synapses on more than two serial images, our algorithm for deleting pseudo-synapses and locating missed synapses failed to remove pseudo-synapses and even mistakenly added synapses on the image “Section 122”. This was caused by the fact that the edges of soma were too similar in morphology to the synapses, which made them difficult to distinguish. In order to solve this problem, we needed to improve the robustness of the algorithm in synaptic detection. Similarly, over-segmentation or under-segmentation of neurons can also lead to missed or misdetected MSBs.
As mentioned above, our method relied on synaptic detection and neuron segmentation, so improving algorithm performance was one of our directions for improvement. Meanwhile, two networks that handled synapses and membrane structures separately were trained in this study. From the perspective of complexity, if the two networks can be combined into one, that is designing a multi-class segmentation network, the efficiency of the recognition algorithm would be greatly improved. The difficulty is that the synaptic cleft is located on the membrane of the neuron and is very prone to confusion.

6. Conclusions

In this paper, we presented an approach for identifying MSBs on a serial EM image stack of mouse cortex. According to the morphological characteristics of MSB, synapses and neurons were segmented in parallel on each image. For the detection and segmentation of synapses, Mask R-CNN was used followed by an algorithm for filtering the pseudo-synapses and making up the missed synapses. For neuron segmentation, an effective residual network was first used for predicting the neuronal membrane. Then, a morphology-based method was adopted to obtain segmentations of neurons from the probability map of the neuronal membrane outputted from the previous step. The MSBs, finally, were identified by incorporating the segmentations of synapses and neurons. The experimental results showed that the accuracy of recognition was acceptable under the premise of a high recall rate, which is of great help to biologists’ research on MSBs. The application and directions for improvement of the proposed method were also discussed.

Author Contributions

This paper is a result of the full collaboration of all the authors; conceptualization, H.D., C.M., H.H., and Q.X.; methodology, H.D., C.M., H.H., Q.X., and L.S.; validation, L.S.; formal analysis, H.D., C.M., H.H., and Q.X.; writing, H.D. and L.S.

Funding

The financial support of the Science and Technology Development Fund of Macau (No. 0024/2018/A1), the National Natural Science Foundation of China (No. 61673381), the Scientific Instrument Developing Project of the Chinese Academy of Sciences (No. YZ201671), the Strategic Priority Research Program of the Chinese Academy of Sciences (No. XDB32030200), and the Special Program of the Beijing Municipal Science & Technology Commission (No. Z181100000118002) is appreciated.

Acknowledgments

The work is supported by the Institute of Neuroscience, Chinese Academy of Sciences.

Conflicts of Interest

The authors declare no conflict of interest.

References

  1. Quan, T.; Hildebrand, D.G.; Jeong, W. Fusionnet: A deep fully residual convolutional neural network for image segmentation in connectomics. arXiv 2016, arXiv:1612.05360. [Google Scholar]
  2. Briggman, K.L.; Bock, D.D. Volume electron microscopy for neuronal circuit reconstruction. Curr. Opin. Neurobiol. 2012, 22, 154–161. [Google Scholar] [CrossRef] [PubMed] [Green Version]
  3. Januszewski, M.; Maitin-Shepard, J.; Li, P.; Kornfeld, J.; Denk, W.; Jain, V. High-precision automated reconstruction of neurons with flood-filling networks. arXiv 2016, arXiv:1611.00421. [Google Scholar] [CrossRef]
  4. Vitaladevuni, S.; Mishchenko, Y.; Genkin, A.; Chklovskii, D.; Harris, K. Mitochondria Detection in Electron Microscopy Images. In Workshop on Microscopic Image Analysis with Applications in Biology. 2008, Volume 42. Available online: https://webcache.googleusercontent.com/search?q=cache:XOIGQp_Yui8J:https://pdfs.semanticscholar.org/bde5/7551f74722159237d338ad961dae1847df76.pdf+&cd=1&hl=zh-CN&ct=clnk&gl=hk (accessed on 25 June 2019).
  5. Lucchi, A.; Smith, K.; Achanta, R.; Knott, G.; Fua, P. Supervoxel-based segmentation of mitochondria in em image stacks with learned shape features. IEEE Trans. Med. Imaging 2012, 31, 474–486. [Google Scholar] [CrossRef] [PubMed]
  6. Staffler, B.; Berning, M.; Boergens, K.M.; Gour, A.; van der Smagt, P.; Helmstaedter, M. SynEM, automated synapse detection for connectomics. Elife 2017, 6, e26414. [Google Scholar] [CrossRef]
  7. Xiao, C.; Li, W.; Deng, H.; Chen, X.; Yang, Y.; Xie, Q.; Han, H. Effective automated pipeline for 3D reconstruction of synapses based on deep learning. BMC Bioinform. 2018, 19, 263. [Google Scholar] [CrossRef] [PubMed]
  8. Friedlander, M.J.; Martin, K.A.; Wassenhove-Mccarthy, D. Effects of monocular visual deprivation on geniculocortical innervation of area 18 in cat. J. Neurosci. Off. J. Soc. Neurosci. 1991, 11, 3268. [Google Scholar] [CrossRef]
  9. Kea Joo, L.; In Sung, P.; Hyun, K.; Greenough, W.T.; Pak, D.T.S.; Im Joo, R. Motor skill training induces coordinated strengthening and weakening between neighboring synapses. J. Neurosci. Off. J. Soc. Neurosci. 2013, 33, 9794–9799. [Google Scholar]
  10. Jones, T.A.; Klintsova, A.Y.; Kilman, V.L.; Sirevaag, A.M.; Greenough, W.T. Induction of Multiple Synapses by Experience in the Visual Cortex of Adult Rats. Neurobiol. Learn. Mem. 1997, 68, 13–20. [Google Scholar] [CrossRef] [Green Version]
  11. Jones, E.G.; Powell, T.P. Morphological variations in the dendritic spines of the neocortex. J. Cell Sci. 1969, 5, 509–529. [Google Scholar]
  12. Toni, N.; Buchs, P.A.; Nikonenko, I.; Bron, C.R.; Muller, D. LTP promotes formation of multiple spine synapses between a single axon terminal and a dendrite. Nature 1999, 402, 421–425. [Google Scholar] [CrossRef] [PubMed]
  13. Yang, Y.; Liu, D.Q.; Huang, W.; Deng, J.; Sun, Y.; Zuo, Y.; Poo, M.M. Selective synaptic remodeling of amygdalocortical connections associated with fear memory. Nat. Neurosci. 2016, 19, 1348–1355. [Google Scholar] [CrossRef] [PubMed] [Green Version]
  14. Steward, O.; Vinsant, S.L.; Davis, L. The process of reinnervation in the dentate gyrus of adult rats: An ultrastructural study of changes in presynaptic terminals as a result of sprouting. J. Comp. Neurol. 1988, 267, 203–210. [Google Scholar] [CrossRef] [PubMed] [Green Version]
  15. Geinisman, Y.; Berry, R.W.; Disterhoft, J.F.; Power, J.M.; Van der Zee, E.A. Associative learning elicits the formation of multiple-synapse boutons. J. Neurosci. Off. J. Soc. Neurosci. 2001, 21, 5568–5573. [Google Scholar] [CrossRef]
  16. Yuko, H.; C Sehwan, P.; Janssen, W.G.M.; Michael, P.; Rapp, P.R.; Morrison, J.H. Synaptic characteristics of dentate gyrus axonal boutons and their relationships with aging, menopause, and memory in female rhesus monkeys. J. Neurosci. 2011, 31, 7737–7744. [Google Scholar]
  17. Zhou, W.; Li, H.; Zhou, X. 3D Dendrite Reconstruction and Spine Identification. In Proceedings of the International Conference on Medical Image Computing & Computer-assisted Intervention, New York, NY, USA, 6–10 September 2008. [Google Scholar]
  18. Moolman, D.L.; Vitolo, O.V.; Vonsattel, J.P.G.; Shelanski, M.L. Dendrite and dendritic spine alterations in alzheimer models. J. Neurocytol. 2004, 33, 377–387. [Google Scholar] [CrossRef] [PubMed]
  19. Eduard, K.; David, H.; Menahem, S. Dynamic regulation of spine-dendrite coupling in cultured hippocampal neurons. Eur. J. Neurosci. 2015, 20, 2649–2663. [Google Scholar]
  20. Fischer, M.; Kaech, S.; Knutti, D.; Andrew, M. Rapid Actin-Based Plasticity in Dendritic Spines. Neuron 1998, 20, 847–854. [Google Scholar] [CrossRef] [Green Version]
  21. Martinez-Cerdeno, V. Dendrite and spine modifications in autism and related neurodevelopmental disorders in patients and animal models. Dev. Neurobiol. 2017, 77, 393–404. [Google Scholar] [CrossRef]
  22. Segal, M.; Andersen, P. Dendritic spines shaped by synaptic activity. Curr. Opin. Neurobiol. 2000, 10, 582–586. [Google Scholar] [CrossRef]
  23. Matus, A. Actin-based plasticity in dendritic spines. Science 2000, 290, 754–758. [Google Scholar] [CrossRef]
  24. Wang, Y.; Yuan, Y.T.; Li, L.; Wang, J. Face recognition via collaborative representation based multiple one-dimensional embedding. Int. J. Wavelets Multiresolut. Inf. Process. 2016, 14, 1640003. [Google Scholar] [CrossRef]
  25. Xie, Q.; Chen, X.; Deng, H.; Liu, D.; Sun, Y.; Zhou, X.; Yang, Y.; Han, H. An automated pipeline for bouton, spine, and synapse detection of in vivo two-photon images. Biodata Min. 2017, 10, 40. [Google Scholar] [CrossRef] [PubMed] [Green Version]
  26. Hong, B.; Liu, J.; Li, W.; Xiao, C.; Xie, Q.; Han, H. Fully Automatic Synaptic Cleft Detection and Segmentation from EM Images Based on Deep Learning. In Proceedings of the International Conference on Brain Inspired Cognitive Systems, Xi’an, China, 7–8 July 2018; pp. 64–74. [Google Scholar]
  27. He, K.; Gkioxari, G.; Dollar, P.; Girshick, R. Mask R-CNN. IEEE Trans. Pattern Anal. Mach. Intell. 2017. [Google Scholar] [CrossRef]
  28. Li, W.; Liu, J.; Xiao, C.; Deng, H.; Xie, Q.; Han, H. A fast forward 3D connection algorithm for mitochondria and synapse segmentations from serial EM images. BioData Min. 2018, 11, 24. [Google Scholar] [CrossRef]
  29. Xiao, C.; Liu, J.; Chen, X.; Han, H.; Shu, C.; Xie, Q. Deep contextual residual network for electron microscopy image segmentation in connectomics. In Proceedings of the IEEE International Symposium on Biomedical Imaging, Washington, DC, USA, 4–7 April 2018; pp. 378–381. [Google Scholar]
  30. Liu, H.; Chen, Z.; Xie, C. Multiscale morphological watershed segmentation for gray level image. Int. J. Wavelets Multiresolut. Inf. Process. 2008, 4, 627–641. [Google Scholar] [CrossRef]
  31. Neumann, U.; Riemenschneider, M.; Sowa, J.P.; Baars, T.; Kalsch, J.; Canbay, A.; Heider, D. Compensation of feature selection biases accompanied with improved predictive performance for binary classification by using a novel ensemble feature selection approach. Biodata Min. 2016, 9, 36. [Google Scholar] [CrossRef]
  32. Unnikrishnan, R.; Pantofaru, C.; Hebert, M. Toward objective evaluation of image segmentation algorithms. IEEE Trans. Pattern Anal. Mach. Intell. 2007, 6, 929–944. [Google Scholar] [CrossRef]
  33. Lamb, A.; Binas, J.; Goyal, A.; Serdyuk, D.; Subramanian, S.; Mitliagkas, I.; Bengio, Y. Fortified networks: Improving the robustness of deep networks by modeling the manifold of hidden representations. arXiv 2018, arXiv:1804.02485. [Google Scholar]
  34. Unger, M.; Pock, T.; Bischof, H. Continuous globally optimal image segmentation with local constraints. In Computer Vision Winter Workshop. 2008, Volume 2008. Available online: https://www.semanticscholar.org/paper/Continuous-Globally-Optimal-Image-Segmentation-with-Unger-Pock/2781ccb8c9e8135b6063b19d117901b91b8d2fdd (accessed on 25 June 2019).
  35. Roberts, M.; Jeong, W.K.; Vázquez-Reina, A.; Unger, M.; Bischof, H.; Lichtman, J.; Pfister, H. Neural process reconstruction from sparse user scribbles. In Proceedings of the International Conference on Medical Image Computing and Computer-Assisted Intervention, Toronto, ON, Canada, 18–22 September 2011; pp. 621–628. [Google Scholar]
  36. Li, W.; Deng, H.; Rao, Q.; Xie, Q.; Chen, X.; Han, H. An automated pipeline for mitochondrial segmentation on atum-sem stacks. J. Bioinform. Comput. Biol. 2017, 15, 1750015. [Google Scholar] [CrossRef]
  37. He, K.; Zhang, X.; Ren, S.; Sun, J. Deep residual learning for image recognition. In Proceedings of the IEEE Conference on Computer Vision and Pattern Recognition, Las Vegas, NV, USA, 27–30 June 2016; pp. 770–778. [Google Scholar]
  38. Geinisman, Y. Structural synaptic modifications associated with hippocampal LTP and behavioral learning. Cerebral Cortex 2000, 10, 952–962. [Google Scholar] [CrossRef] [PubMed]
  39. Lalo, U.; Palygin, O.; Verkhratsky, A.; Grant, S.G.; Pankratov, Y. ATP from synaptic terminals and astrocytes regulates NMDA receptors and synaptic plasticity through PSD-95 multi-protein complex. Sci. Rep. 2016, 6, 33609. [Google Scholar] [CrossRef] [PubMed]
  40. Kim, H.W.; Oh, S.; Lee, S.H.; Lee, S.; Na, J.E.; Lee, K.J.; Rhyu, I.J. Different types of multiple-synapse boutons in the cerebellar cortex between physically enriched and ataxic mutant mice. Microsc. Res. Tech. 2018, 82, 25–32. [Google Scholar] [CrossRef] [PubMed]
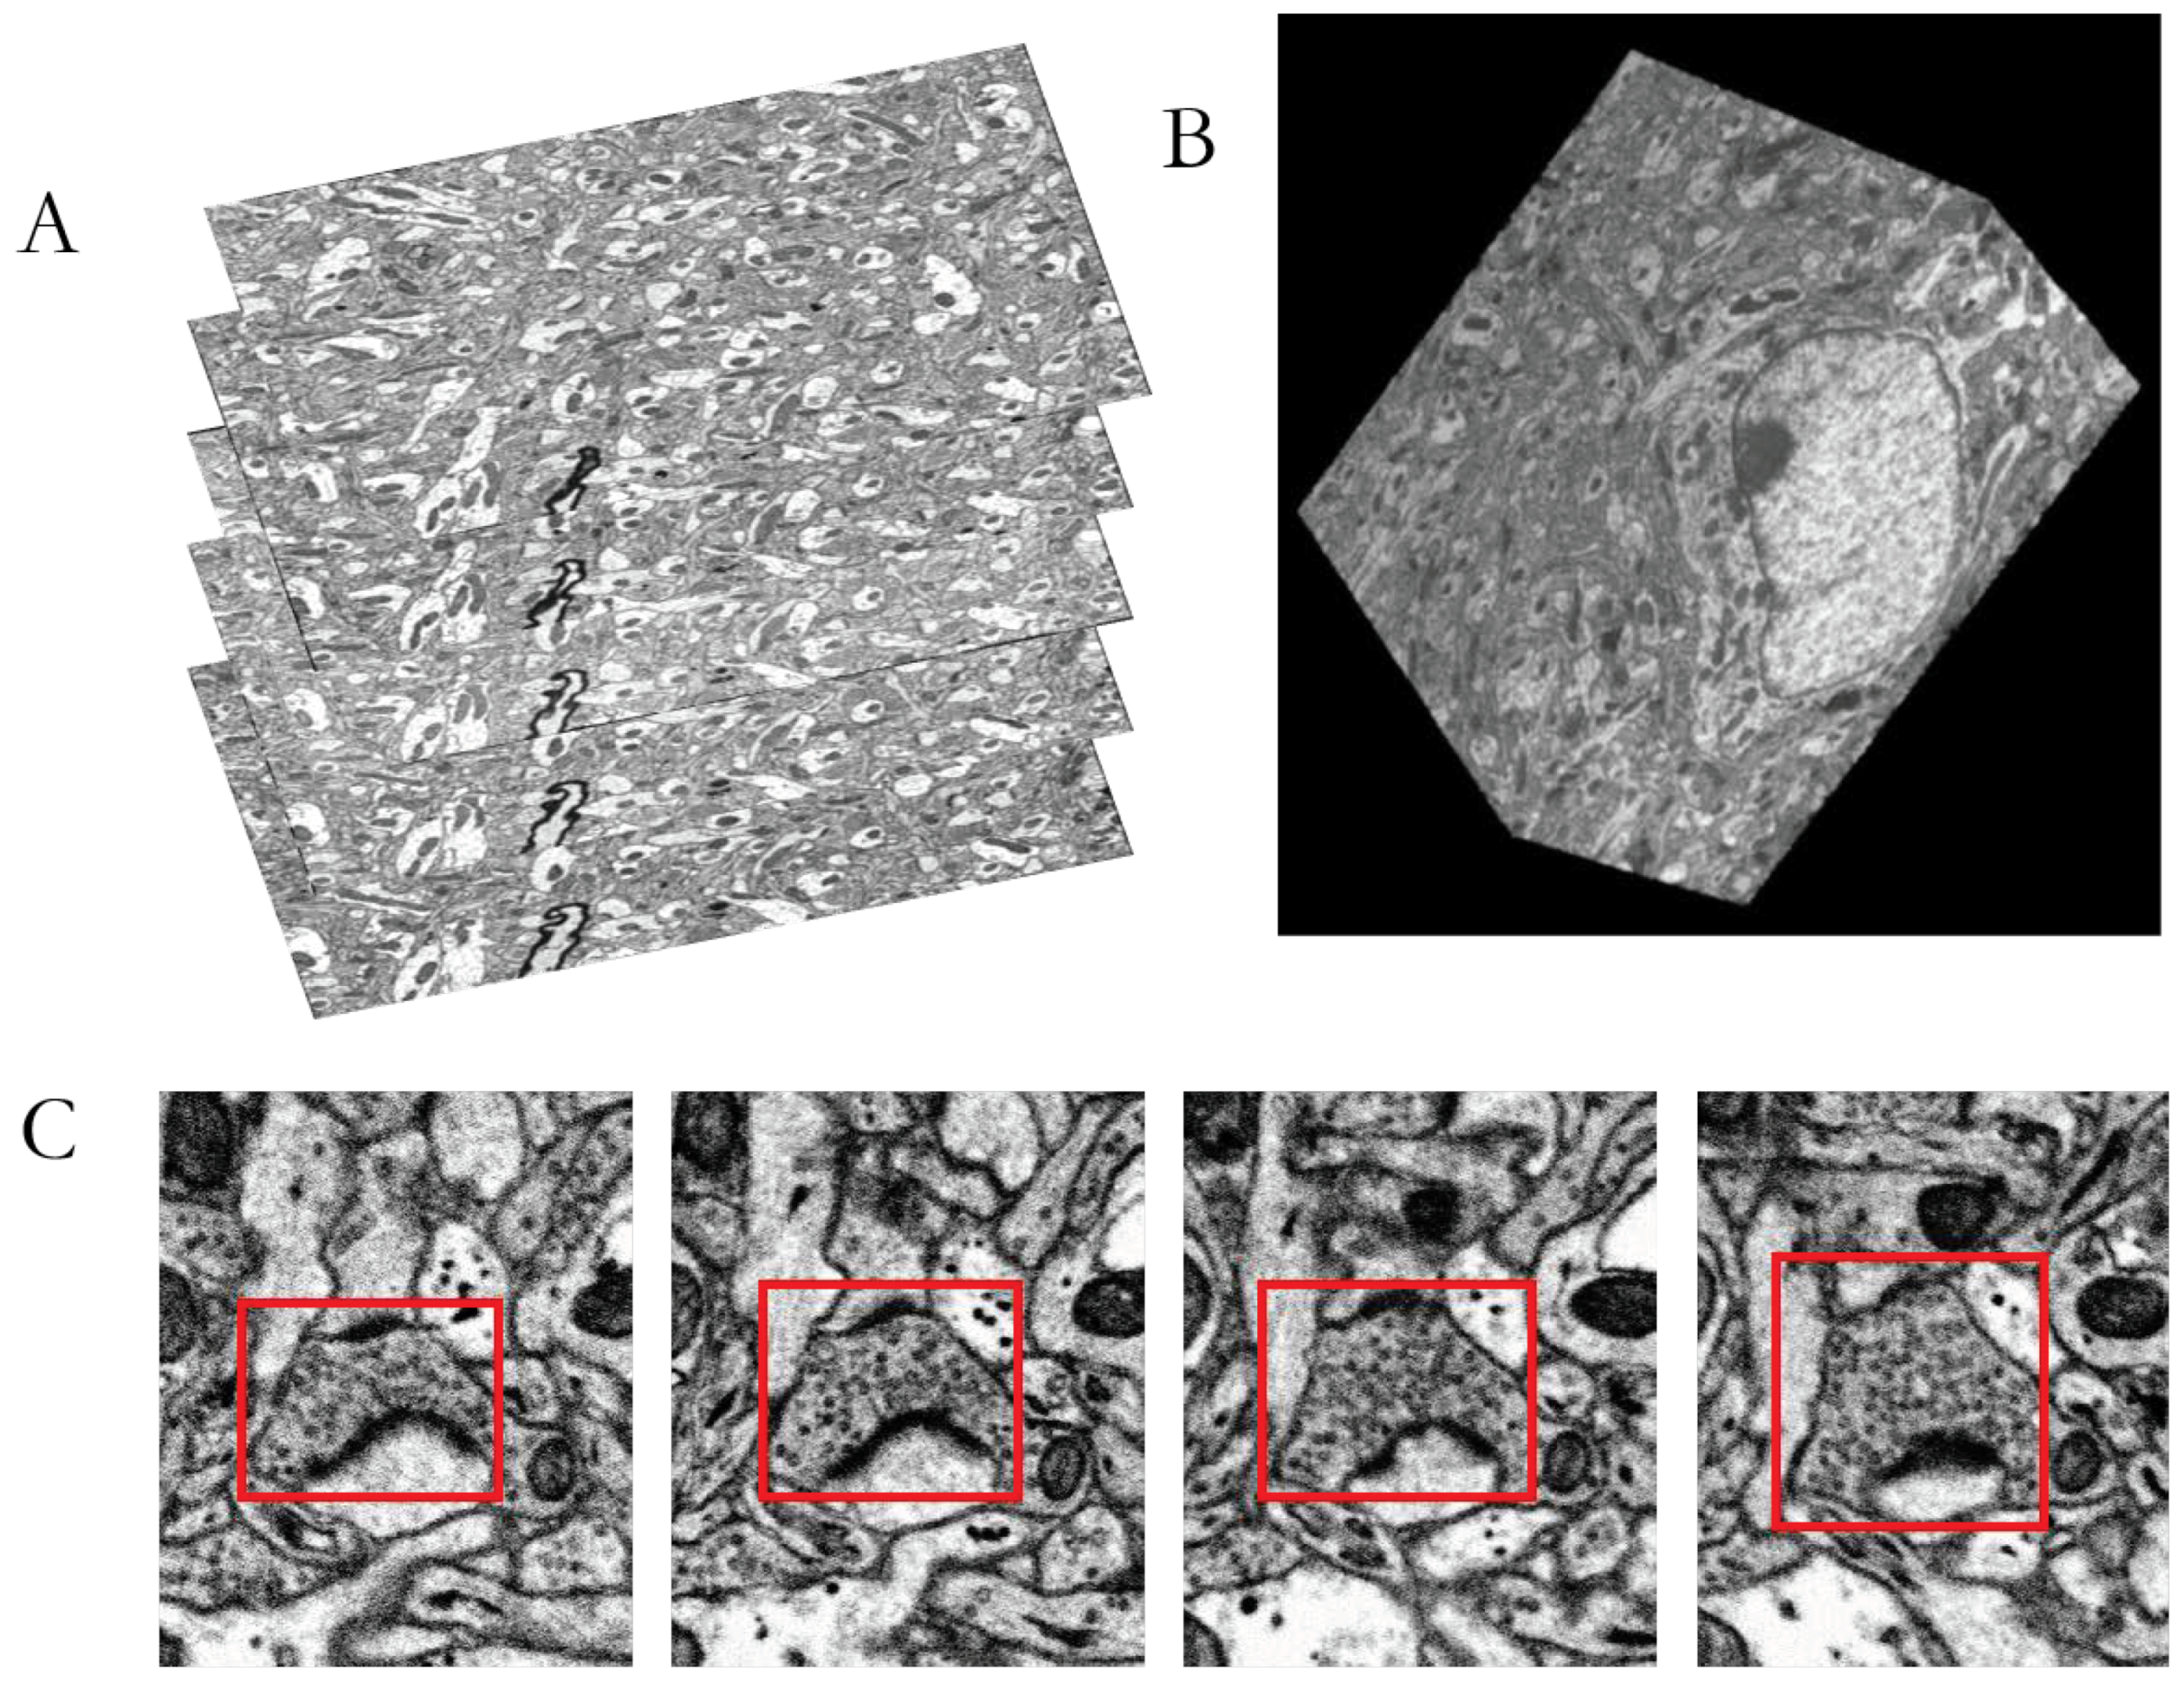
Figure 1. Datasets and multisynaptic boutons (MSBs). (A) Serial SEM images; (B) an anisotropic stack of neural tissue from mouse cortex acquired by Automated tape-collecting ultra-microtomy (ATUM)-SEM; (C) MSBs appearing on serial images.
Applsci 09 02591 g001
Figure 2. Interface of FIJI for labeling the ground truth. (A) Interface of FIJI for labeling synapse; (B) interface of FIJI for labeling neuronal membrane.
Applsci 09 02591 g002
Figure 3. The workflow of our method for MSB detection from a serial EM image stack.
Applsci 09 02591 g003
Figure 4. The raw image and image processed with histogram equalization. (A) Left: raw image; middle: zoomed area containing an MSB; right: histogram of the raw image; (B) left: image processed with histogram equalization; middle: zoomed area containing an MSB; right: histogram of the image processed with histogram equalization.
Applsci 09 02591 g004
Figure 5. The architecture of Mask R-CNN. RPN, region proposal network.
Applsci 09 02591 g005
Figure 6. Detection results of synapses on several serial images. The yellow rectangle indicates missed, while the red rectangles indicate correct detection.
Applsci 09 02591 g006
Figure 7. The network architecture for recognition of the neuronal membrane [29]. Red and green blocks annotated M, N, and S represent convolutional layers with channels M, kernel size N × N , and stride S; yellow blocks denoted N and S imply max pooling over N × N patches with stride S; blue blocks with M, N, and S denote deconvolution layers, and the parameters are similar to that of the convolutional layers; the purple box indicates the softmax layer; the red numbers above straight arrows imply the size of feature maps, while the numbers below straight arrows imply the channels of feature maps, and the numbers above curved arrows represent the repetitions of residual units.
Applsci 09 02591 g007
Figure 8. The workflow of segmenting neurons based on the probability map of the neuronal membrane. (A) Input probability map of the neuronal membrane; (B) the complement of the input probability map; (C) foreground marker; (D) rectified foreground marker; (E) neuron segmentation).
Applsci 09 02591 g008
Figure 9. The workflow of MSB identification. (A) Mask of synapses; (B) segmentation of neurons; (C) mask of synapses superimposed on the segmentation of neurons.
Applsci 09 02591 g009
Figure 10. Comparison of the detection results on synapses.
Applsci 09 02591 g010
Figure 11. The comparison of synapse segmentation results (Row 1: raw images; Row 2: the ground truth; Row 3: segmentation results of the morphology method; Row 4: segmentation results of the method in [34,35,36]; Row 5: segmentation results of Mask R-CNN).
Applsci 09 02591 g011
Figure 12. The comparison of neuronal membrane prediction (Row 1: raw images; Row 2: the ground truth; Row 3: prediction results of ResNet50 [37]; Row 4: prediction results of Mask R-CNN).
Applsci 09 02591 g012
Figure 13. Detection results of MSBs on the 121th image. (A) A missed MSB; (B) a correctly-detected MSB; (C) a misdetected MSB.
Applsci 09 02591 g013
Figure 14. Partial recognition results of MSB. From left to right: raw image, segmentation of neuron, segmentation of synapses, and the comparison of the segmentation of synapses and the ground truth of synapses, where the yellow pixels represent true positives, red pixels represent false positives, and green pixels represent false negatives.
Applsci 09 02591 g014
Figure 15. Three types of MSBs. (A) Axon-multiple dendritic shaft synapse; (B)axon-multiple dendritic spine synapse; (C) axon-dendritic shafts-dendritic spine; where the A in yellow is the axon, Sh in blue is the dendritic shaft, and Sp in red is the dendritic spine.)
Applsci 09 02591 g015
Figure 16. Misidentified MSBs on three adjacent images.
Applsci 09 02591 g016
Table 1. Comparison of synapse segmentation.
Morphology MethodVariational Model Method [34,35,36]Mask R-CNN
J(Synapses, Ground truth)19.21%18.49%65.55%
Table 2. Comparison of neuron segmentation.
Our MethodResNet50 [37]
Pixel-error5.61%7.81%
Rand-error [32]12.74%27.34%
Table 3. The numerical analysis of the identified results of MSBs in 10 images.
ImageManualOur Method
TotalFalse PositiveFalse Negative
Layer 181020
Layer 2171030
Layer 416710
Layer 613520
Layer 813421
Layer 1014730
Layer 1215621
Layer 1414741
Layer 16181130
Layer 1783300
Average5.172.20.3
Table 4. Statistics of MSBs in Figure 14.
J(Synapses, Ground truth)Area(Neuron) (µm2)Area(Synapse) (µm2)Area(Neuron)/Area(Synapses)
A62.54%0.20500.026612.98%
B57.48%0.36340.03349.20%
C48.40%0.64970.00487.40%
Table 5. Statistics of different types of MSBs.
Type AType BType CTotal
Numbers9465071003
Ratio94.31%4.99%0.7%100%