Article

Experimental Study on Rock-Like Specimens with Single Flaw under Hydro-Mechanical Coupling

1
Department of Geotechnical Engineering, Tongji University, Shanghai 200092, China
2
Key Laboratory of Geotechnical and Underground Engineering of Ministry of Education, Department of Geotechnical Engineering, Tongji University, Shanghai 200092, China
3
Department of Structure Engineering, Nagasaki University, Nagasaki 852-8521, Japan
4
China Fortune Land Development Co., Ltd., Jiaozuo 454950, China
*
Author to whom correspondence should be addressed.
Appl. Sci. 2019, 9(16), 3234; https://doi.org/10.3390/app9163234
Submission received: 3 July 2019 / Revised: 2 August 2019 / Accepted: 5 August 2019 / Published: 8 August 2019

Abstract

:

Featured Application

To study the mechanical properties and cracking behavior of jointed rock mass under hydro-mechanical coupling, a series of uniaxial compression tests, and conventional and hydraulic coupled triaxial compression tests were carried out on cylinder gypsum specimens with a single pre-existing flaw. Based on X-ray computed tomography (CT) and scanning electron microscope (SEM) observation, the mechanical properties and crack behavior were analyzed. The results could provide a useful reference for rock mass under hydro-mechanical coupling that may be conceptually extended to the field scale.

Abstract

In order to study the mechanical characteristics and cracking behavior of jointed rock mass under hydro-mechanical coupling, a series of uniaxial compression tests and triaxial compression tests were carried out on cylinder gypsum specimens with a single pre-existing flaw. Under different confining pressures, water pressure was injected on the pre-existing flaw surface through a water injection channel. The geometrical morphology and tensile or shear properties of the cracks were determined by X-ray computed tomography (CT) and scanning electron microscope (SEM). Based on the macro and micro observation, nine types of cracks that caused the specimen failure are summarized. The results of mechanical properties and crack behavior showed that the confining pressure inhibited the tensile cracks, and shear failure occurred under high confining pressure. The water pressure facilitated the initiation and extension of tensile crack, which made the specimens prone to tensile failure. However, under the condition of high confining pressure and low water pressure, the lubrication effect had a significant effect on the failure pattern, under which the specimens were prone to shear failure. This experimental research on mechanical properties and cracking behavior under hydro-mechanical coupling is expected to increase its fundamental understanding.

1. Introduction

Hydro-mechanical coupling effect should be considered in rock engineering, petroleum extraction, and enhanced geothermal exploitation. Yet the mechanical properties and cracking behavior of rock mass under hydro-mechanical coupling have not been comprehensively understood.
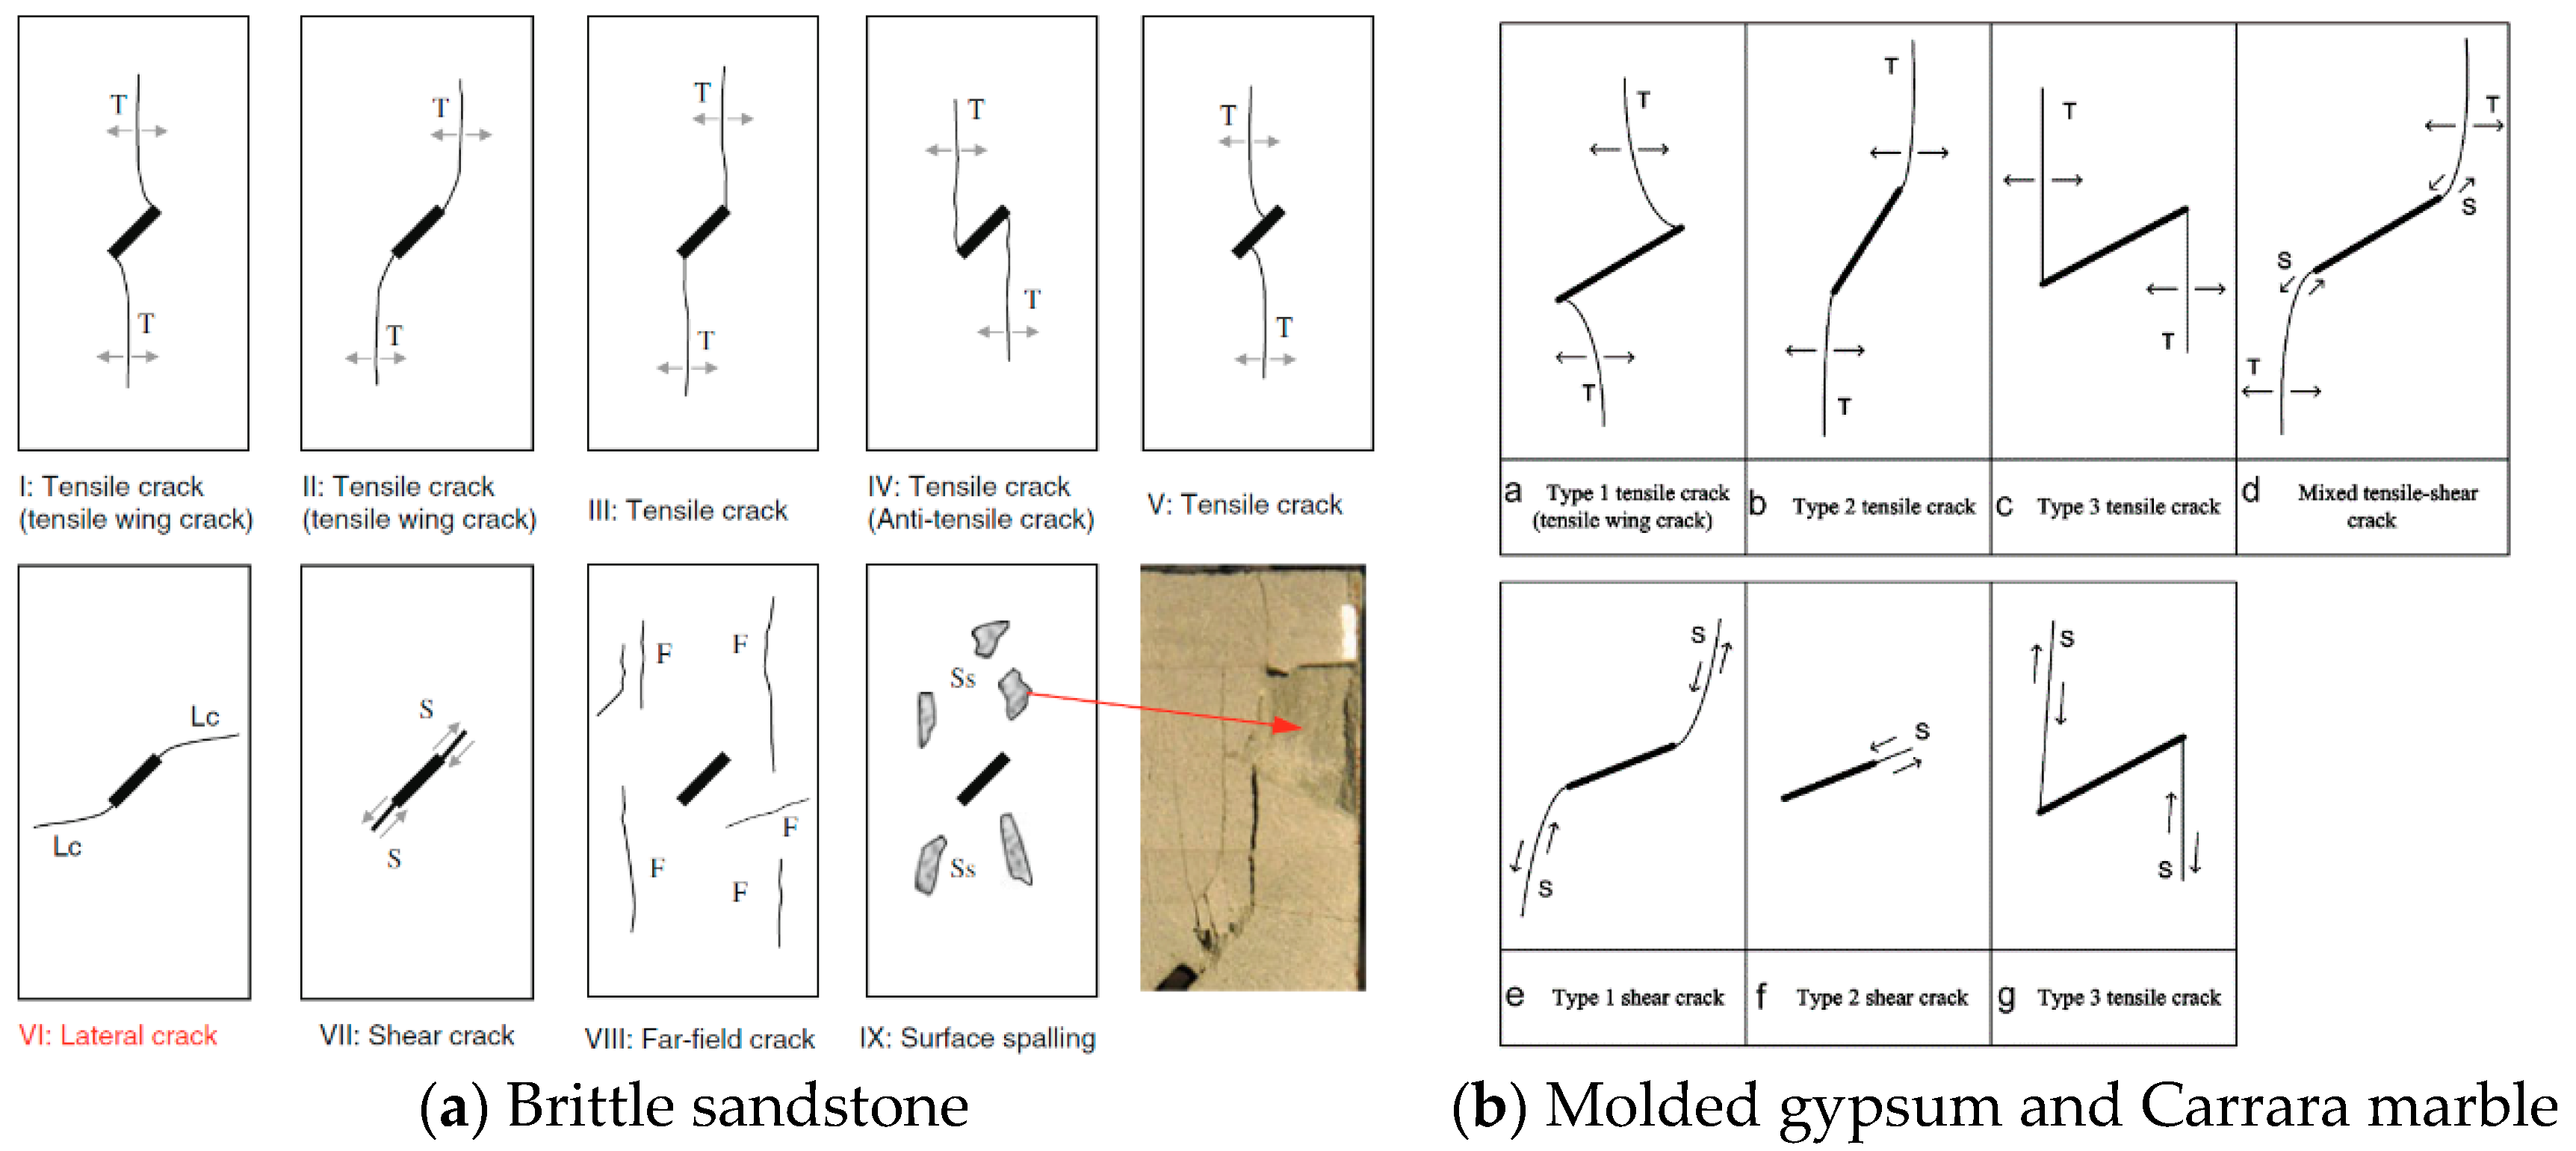
In the last decades, a series of related researches have been conducted to investigate the basic failure mechanism of jointed rock mass [1,2,3,4,5,6,7]. Scholars have summarized the crack types of fractured rock mass under uniaxial compression, and crack types initiated from the pre-existing flaws have been proposed. Wong and Einstein [8,9] investigated the cracking behaviors in modeled gypsum and Carrara marble specimens with a single flaw under uniaxial compression by a high-speed camera. Seven different crack types were identified based on their geometry and tensile or shear propagation mechanism. Yang [10] analyzed the failure mode and cracking process of sandstone specimens containing a single flaw under uniaxial compression, and proposed nine different crack types based on their geometry and crack propagation mechanism (tensile, shear, lateral crack, far-field crack, and surface spalling). In addition to uniaxial or biaxial compression tests [2,7,8,9,10,11,12,13,14], triaxial compression tests [15,16,17,18,19] are also used to study jointed rock masses. The cracking behavior is more complex and difficult to observe under three-dimensional conditions. However, many researches using three-dimensional conditions, judged the crack types by crack geometry [17,18,19,20,21]. They either refer directly to the crack types obtained by uniaxial or biaxial compression tests or they lack the detailed analysis of the mechanical (tensile/shear) properties and geometric characteristics of three-dimensional cracks.
Some new techniques can help determine crack geometries and propagation mechanisms. To investigate the three-dimensional (3D) cracking behavior of rock, X-ray computed tomography (CT) has been adopted to detect internal cracks [20,22,23,24,25]. The X-ray CT scanning overcame the difficulties in observations within nontransparent materials, and the spatial geometry can be determined in a nondestructive way. Additionally, the microscopic observation by a scanning electron microscope (SEM) provides a basis for judging the tensile or shear properties [21,26,27,28,29]. These studies provide evidence that CT scanning and SEM observation are effective ways to explore internal crack behavior and propagation mechanism (shear/tensile). However, hydro-mechanical coupling was not taken into account in these studies.
From the above introduction, crack geometries, propagation mechanisms, as well as the failure mode of jointed rock mass under hydro-mechanical coupling have not been adequately studied in past researches. This paper makes an effort to fill this gap by CT scanning and SEM observation. A conventional triaxial test, hydraulic coupled triaxial test, and a series of uniaxial compression tests were conducted, in which the cylinder gypsum specimens with a single pre-existing flaw were employed. Then the mechanical and cracking behavior was analyzed, and detailed investigations based on CT and SEM were carried out. Finally, nine types of cracks that led to specimen failure were summarized, and the effect of water pressure and confining pressure was discussed.

2. Specimen and Testing Procedure

2.1. Specimen Preparation

Rock-like materials are widely used to study jointed rock masses. In this study, specimens were made of a mixture of high-strength gypsum powder, water, and retarder at a ratio of 1:0.35:0.005 by weight. The underlying parameters of the material were determined: the uniaxial compressive strength was 27.3 MPa, the tensile strength was 1.4 MPa, Poisson’s ratio was 0.24, and elastic modulus was 19 GPa. The cylindrical specimens were φ 50   mm × 100   mm , which were made by mold. A pre-existing flaw was fabricated by inserting a piece of mica sheet that remained in the specimen, resulting in a single flaw with a width of 14 mm and thickness of 0.7 mm. The orientations of the mica sheet were predetermined by the mold to make specimens with different flaw inclination angles, and the inclination angle ( α ) varied from 0° to 90° in 15° increments. As shown in Figure 1a, in order to fill the flaws with water pressure, a water injection channel was drilled after curing two weeks. In order to control the variables, all specimens including intact specimens had the same water injection channel. The diameter of the water injection channel was 8 mm. In this paper, “intact specimen” denotes specimens without pre-existing flaws; “jointed specimen” denotes specimens with pre-existing flaws; “60° specimen” denotes jointed specimens with a 60° pre-existing flaw.
In order to evaluate the consistency of specimen preparation, two of the intact specimens and 15° specimens were randomly selected for a conventional triaxial test under confining pressure of 2 MPa and 6 MPa, respectively. As the stress–strain curves show in Figure 1b, the dispersion degrees of peak deviator stress, peak axial strain, peak annular strain, and elastic modulus were within 1.5%, indicating that these specimens have a good consistency.

2.2. Test Setup and Procedures

A uniaxial compression test, triaxial compression test, and hydraulic coupled triaxial test were conducted in this paper. The hydraulic coupled triaxial test was a triaxial compression test with water injected inside the specimen through a water injection channel simultaneously inside the pressure chamber, so that the flaw surface was filled with water pressure (this can be seen as the loading condition in Figure 2). The entire experiment was conducted in the Key Laboratory of Geotechnical and Underground Engineering at the Ministry of Education, Tongji University, Shanghai 200092, China.
The uniaxial compression test adopted a 300 kN rock mechanics servo pressure testing machine, which was made by Shanghai Hualong Test Instruments Co., LTD. The loading carried out with 0.02 mm/s until specimen failure. The conventional triaxial test and hydraulic coupled triaxial test were conducted using a GCTS RTX-3000 triaxial rock testing system (Figure 3). The RTX-3000 consists of a hydraulic station, a loading rack, a pressure chamber and a confining pressure and pore pressure supercharger, high-precision sensors, a microprocessor, and an analysis system. During the test, the axial stress was applied by a piston mounted, the confining pressure was applied by the confining fluid (silicone oil) in the pressure chamber, and the water pressure was applied by the pore pressure supercharger through the water injection channel.
The hydraulic coupled triaxial test procedure consists of five steps: First, adjust the pressure cushion to contact the specimen boundary. Second, apply the confining pressure to the target level at a rate of 0.4 MPa/min. Third, inject water at a rate of 0.1 MPa/s into the specimen through the water injection channel until the water pressure reaches the target level, then keep the stress condition for a moment to make sure the water pressure fulfills the pre-existing flaws. After that, apply the vertical loading at a rate of 0.1 mm/min (0.1% per minute) until the specimen is fractured. Finally, unload the water pressure, the confining pressure, and the axial pressure alternately. In the triaxial test, the loading procedure skips step 3 (applying water pressure). During the procedure, data including the deviator stress, axial strain, and radial strain were recorded every 0.1 s.
In order to prevent equipment damage caused by the fractured debris blocking the oil return hole, the specimens need to be wrapped in heat-shrinkable film so that the water pressure in the pre-existing flaw should smaller than the confining pressure, or the water pressure will burst the film. Table 1 below illustrates the experimental scheme. In the triaxial test, the confining pressure was 2 MPa, 4 MPa, and 6 MPa. In the hydraulic coupled triaxial test, the confining pressure was 2 MPa, 4 MPa, and 6 MPa, while the water pressure was 1 MPa, 3 MPa, and 5 MPa; the water pressure lower than the confining pressure. Throughout this paper, specimens are described by specimen number shown in Table 1. For example, “30-UCT” denotes a 30° specimen under uniaxial compression test; “45-4” denotes a 45° specimen under conventional triaxial compression test and the confining pressure (CP) is 4 MPa; “60-6-5” denotes a 60° specimen under hydraulic coupled triaxial test with 6 MPa confining pressure (CP) and 5 MPa water pressure (WP).
After the test, X-ray computed tomography (CT) was employed to investigate the internal cracks. The CT observation was carried out on Phoenix V|tome x m in Yinghua Inspection and testing (shanghai) Co., Ltd. The Phoenix V|tome x m is a high precision 16-bit micro-focus X-ray CT scanning device that enables high definition images and observes the internal fracture details. The X-ray CT scanning tests were performed at 235 kV and 140 μA for optimum image quality and contrast with a spatial resolution of 34.5 μm. Specimens were rotated continuously during the scanning with momentary stops every 0.21 degree approximately (1700 images/360°) to collect each projection and minimize the artifacts. Finally, the 3D spatial solid model of each specimen was obtained by computed tomography analysis.
Microscale observation based on a scanning electron microscope (SEM) was carried out after the test to investigate the crack mechanism. The scanning samples (10 mm wide × 5 mm thick × 8 mm high) were taken from the crack surfaces, and a layer of gold foil was sprayed on the sample surface. Nova NanoSEM 450 in Tongji University was employed, and the accelerating voltage was 10 KV for optimum image quality.

3. Results

3.1. Mechanical Properties

This section discusses the results of the axial stress–strain response, peak deviator stress, and the deformation characteristics obtained in the uniaxial compression test, conventional triaxial compression test, and hydraulic coupled triaxial test.

3.1.1. Stress–Strain Curve Behavior

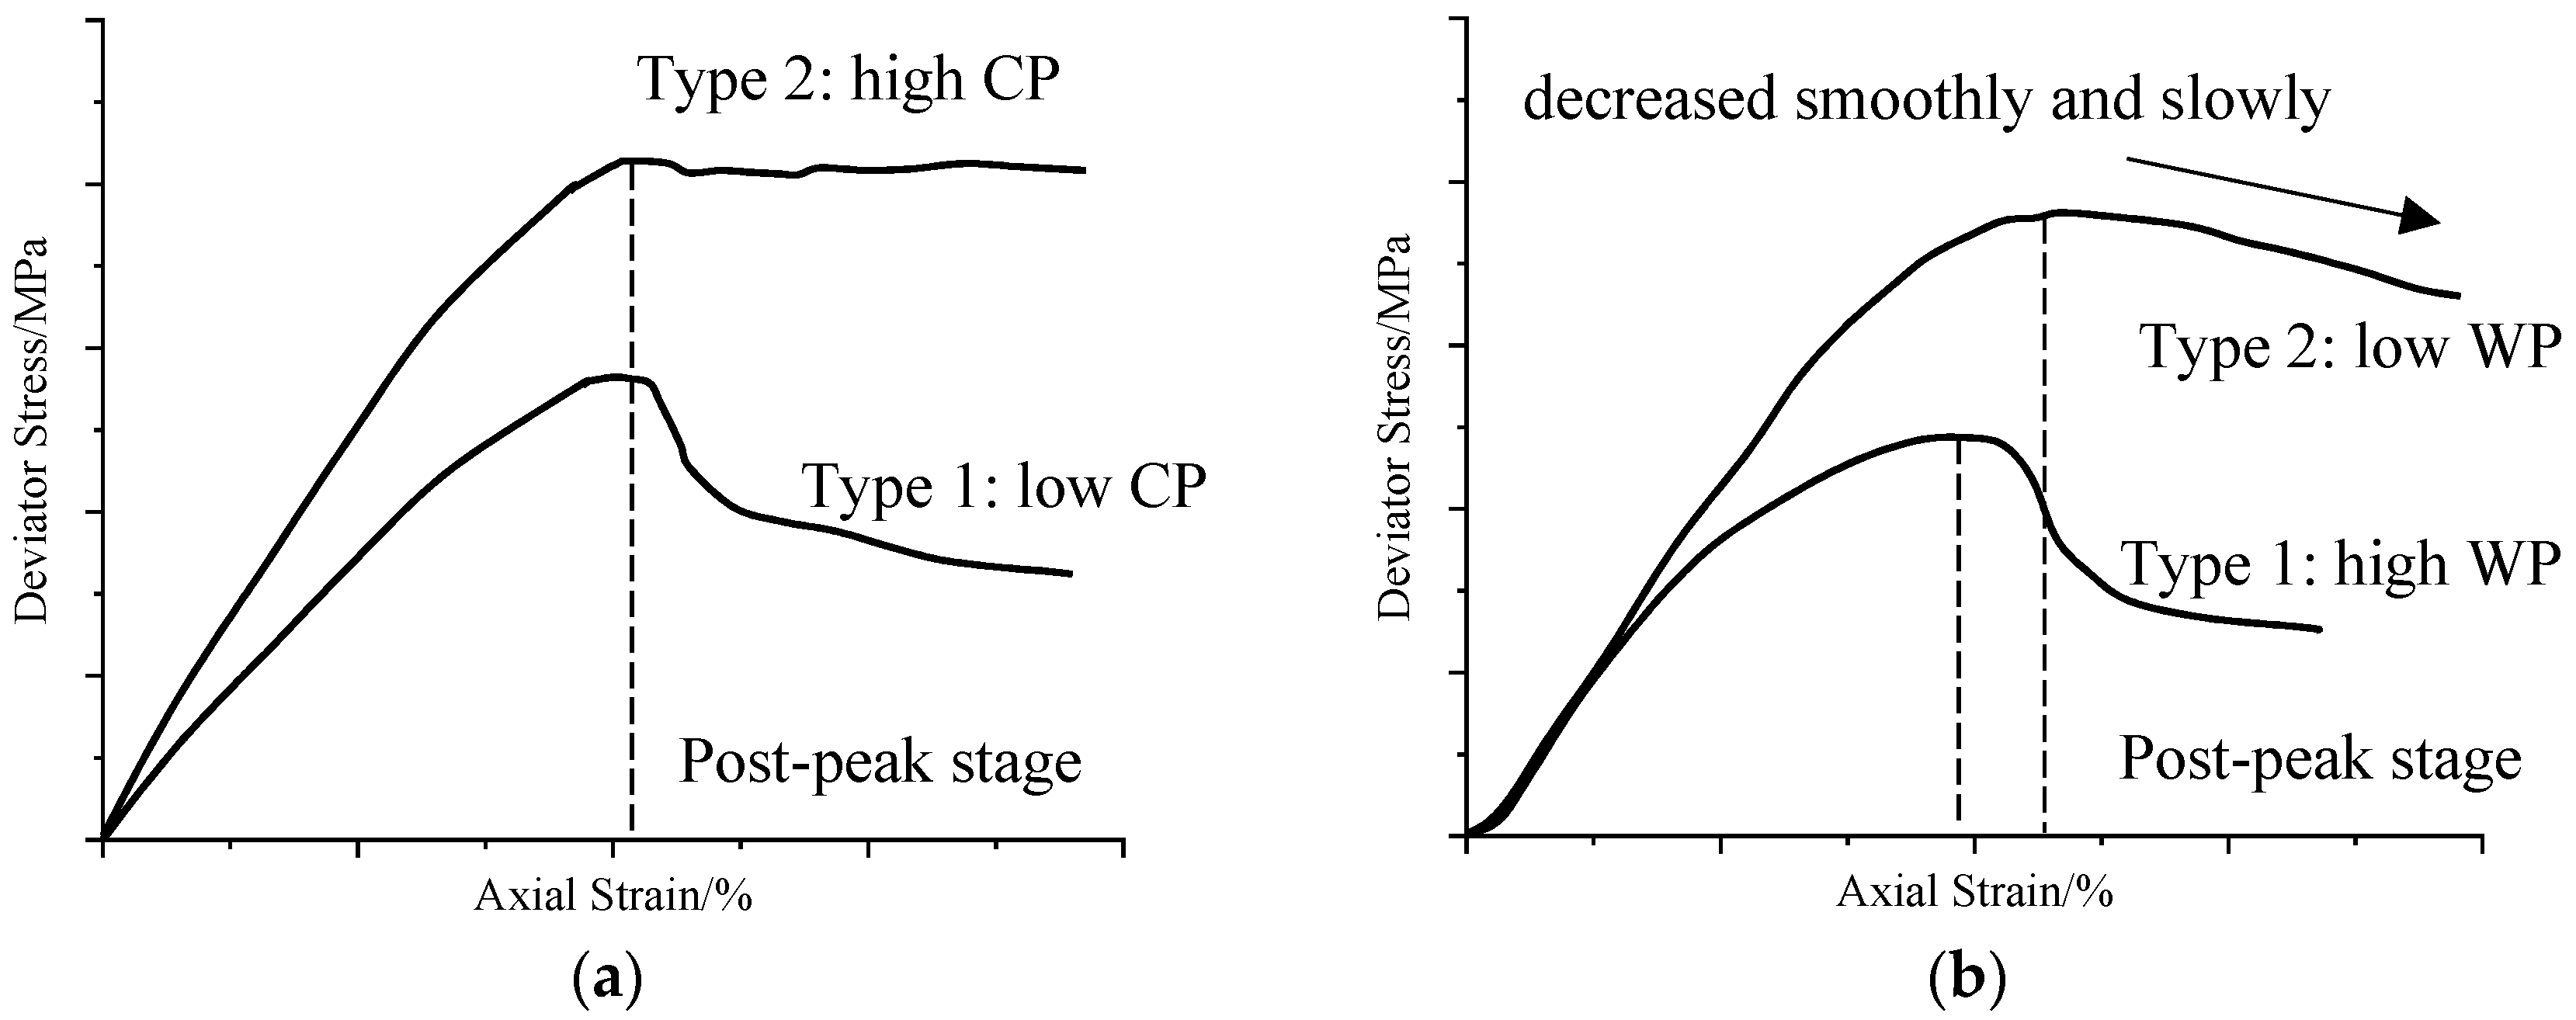
The stress–strain curve reflects the mechanical response of the specimens under loading. In the uniaxial compression test, all specimens showed the characteristics of brittle failure. In the triaxial compression test and hydraulic coupled triaxial test, the stress–strain curve varied with confining pressure and water pressure. With the increase of confining pressure, the failure mode of specimens transferred to ductile failure, and with the increase of water pressure, the failure mode changed to brittle failure. Figure 4 shows part of the stress–strain curves in these tests as an example. According to the test results in the triaxial compression test and hydraulic coupled triaxial test, the types of stress–strain curve are summarized, as shown in Figure 5.
In the triaxial compression test, all specimens showed a good linear relationship at the elastic compression stage, as shown in Figure 4a,b. The peak deviator stress increased with the confining pressure, and interestingly specimens with different inclination angles showed a different response to the confining pressure. The post-peak stage of 30°, 45°, and 60° specimens presented a smooth strain softening, and the stress–strain curve dropped gradually with post-peak loading (Figure 4a as an example). While 0°, 15°, 75°, and 90° specimens showed different trends that the drop range of the post-peak stress–strain curve decreased significantly with the increase of confining pressure. Under 6 MPa confining pressure, these specimens retained their peak deviator stress for a long time or decreased slightly (Figure 4b as an example). With the increase of confining pressure, the stress–strain curve of 0°, 15°, 75°, and 90° specimens seemed more easily transformed from type 1 to type 2 in Figure 5a than the other specimens. Confining pressure increased the slope at the elastic compression stage and the peak deviator stress, while the effect on yield strain was not significant. Under low confining pressure, the stress gradually dropped in the post-peak stage (type 1 in Figure 5a); under high confining pressure, the stress almost remained unchanged or just slightly dropped to residual strength (type 2 in Figure 5a). The stress–strain curves of shear failure specimens showed the former type, and the stress–strain curves of mixed failure specimens showed the latter.
In the hydraulic coupled triaxial test (Figure 4c,d) the elastic compression stage was relatively short and bent, except for the condition of 1 MPa water pressure and 6 MPa confining pressure. The peak deviator stress increased with confining pressure and decreased with water pressure. It seems that the water pressure offsets the confining pressure. The post-peak stage of the stress–strain curve was affected by the confining pressure, the water pressure, and the pre-existing flaw inclination angle. The curve dropped slightly with post-peak loading under 6 MPa confining pressure and 1 MPa water pressure (type 2 in Figure 5b), while the drop range observably increased with the increase of water pressure (type 1 in Figure 5b). There exists a small section of downward convex stage in the stress–strain curve. This stage was considered to be the initial crack closure stage, which was partially opened by the injection of water pressure in step 3 of the loading procedure. Under low water pressure and high confining pressure, the post-peak stress–strain curve decreased smoothly and slowly (type 2 in Figure 5b), and most of the specimens were fractured by shear failure mode. As the water pressure increased, the decline slope increased, and the specimens were fractured by tensile failure (type 1 in Figure 5b) in these cases.

3.1.2. Peak Deviator Stress

The peak deviator stress is the highest value of the stress–strain curve and equal to the triaxial compression strength minus the confining pressure value. Figure 6 shows the peak deviator stress of the specimens under different confining pressure, water pressure, and flaw inclination angle. As shown in Figure 6a, the strength increased with the confining pressure only, except for the 30-6 specimen. In the hydraulic coupled triaxial test, the strength was much lower than that of the triaxial compression test (Figure 6b–d). The dotted line shows the average strength under the same conditions. It can be seen whether the confining pressure (CP) was 2 MPa, 4 MPa or 6 MPa; the peak deviator stress decreased with the increase of water pressure (WP). That indicates the water pressure greatly reduced the strength, in other words, water pressure promoted the failure trend of the specimens. This means that rock mass in a stable state can be destabilized by the injection of water.
Figure 7 shows the linear fitted contour map of peak deviator stress; different colors indicate the magnitude of peak deviator stress. It can be seen that the confining pressure increased the peak deviator stress and water pressure weakened it. When the inclination angle was between 30° and 60°, the strength was the smallest, while the strength of 0° and 90° specimens was the largest and most similar to that of intact specimens. It is worth noting that the 15° flaw inclination angle interval is still relatively large and this trend needs further research.

3.1.3. Deformation Characteristics

The results of Young’s modulus and the axial strain at peak deviator stress are shown in Figure 8. In the triaxial compression test, there was no significant trend of peak axial strain under 4 MPa and 2 MPa confining pressure, while under 6 MPa confining pressure the peak strain increased significantly, except for 45° and 60° specimens. A possible explanation for this might be that the failure mode of the specimens under 6 MPa confining pressure was transformed into ductile failure, and the stress–strain curve behaved like type 2 in Figure 5a, which had a long yield platform so the peak axial strain increased. As shown in Figure 8b–d, both the intact specimens and the jointed specimens were weakened by water pressure in the hydraulic coupled triaxial test. Despite the discreteness, it can still be seen that Young’s modulus increased with confining pressure and decreased with water pressure.

3.2. Observation of Crack Characteristics

This section discusses the crack characteristics including surface crack, internal cracks, and the crack mechanism. Throughout this paper, the terms surface cracks, crack surfaces, and internal cracks are used. In the context of this paper, surface cracks are discontinuities observed directly from the specimen. Crack surfaces are the new surface in specimens formed by crack propagation. The internal cracks refer to the three-dimensional cracks in the specimens observed by X-ray computed tomography (CT).

3.2.1. Surface Crack Observation

The characteristics of cracks play an important role in determining the mechanism of cracks. It is a common method to study the cracking behavior by crack morphology of post failure specimens. This paper focuses on cracking behavior and failure mechanism under hydro-mechanical coupling.
For brevity, Figure 9 is an example to illustrate the application of surface crack observation in this paper. As shown in Figure 9, the 45° specimens showed typical wing cracks and distinct tensile characteristics under uniaxial loading. In the triaxial compression test, the cracks changed significantly with the increasing confining pressure. In the hydraulic coupled triaxial test, cracks were affected by coupled confining pressure and water pressure. A fragment of wing crack was observed in 45-2-1, and the crack geometry of 45-4-1 was very similar to that of 45-2; they all showed geometric characteristics of tensile crack, as shown in Figure 9. Under the confining pressure of 2 MPa and 4 MPa, the 1 MPa water pressure enhanced the tensile failure characteristics of the specimens. When the confining pressure was 6 MPa and water pressure was 1 MPa, the crack geometry showed typical shear characteristics with a slip plane. When water pressure increases, the failure mode changes. In 45-6-5 and 45-4-3, horizontal coupled cracks (HCCs) were found. The HCCs were also observed in 15-6-5 and 30-6-5, and previous studies showed the HCCs were different from any tensile wing cracks, shear cracks, secondary cracks or anti-wing cracks. Please refer to Zhou [21] for a detailed study of HCCs.

3.2.2. Internal Cracks Observation Based on X-ray Computed Tomography (CT)

Many related studies based on crack geometries and propagation mechanisms were obtained by surface crack observation. However, cracks are much more complex under three-dimensional conditions than plane conditions, so it is difficult for nontransparent material to obtain the crack characteristics only by surface crack observation. In order to determine the morphology of internal cracks, X-ray computed tomography (CT) was employed.
As shown in Figure 10a, specimens were scanned which generated a spatial model, and then the model was cut into slices every pixel (34.5 μm) along the thickness direction (i.e., x-axis) and the vertical direction (i.e., z-axis). Figure 10d and Figure 11e show the cross-sections of 30-4-1 specimen after failure; the corresponding spatial position of each slice is shown in Figure 10b and Figure 11c, respectively. The scales on the right of the pictures also indicate the spatial position relationship between the front vertical cross-sections and the horizontal cross-sections. Note that the original CT scanning images had some randomly distributed bubbles, which were removed without affecting the spatial cracks.
As shown in Figure 10, seven internal cracks can be observed in this specimen. Cracks, C1 and C2, were throughout the specimen and caused the failure. They coalesced at the upper tip of the preexisting flaw, while in most areas (x-axis from −12 mm to 25 mm); they were connected by C7, as shown in Figure 10d4. Judging by geometrical morphology, C3, C4, and C5 were tensile cracks that were not fully propagated. C3 and C4 formed macro-cracks, while they did not directly lead to specimen failure. It is possible that the specimen was fractured under the competition between C1-C2 and C3-C4, but the latter was preferred under the current test condition. The C5 was only a small fragment which ranged near the lower crack tip. C6 was a far-field crack on both sides of the water injection channel, which was similar to hydraulic fracture cracks in morphology. In 90° specimens under 5 MPa water pressure (90-6-5), cracks like C6 caused the failure. C7 was a horizontal coupled crack (HCC) that was not fully formed. As shown in Figure 10e4, the shaded area was C7.
CT observations show that not every specimen’s internal cracks were as complex as shown above. Generally, the internal cracks of pure tensile or pure shear failure specimens are relatively simple. Compared with specimens in triaxial and uniaxial compression tests, the internal cracks of specimens in a hydraulic coupled triaxial test are more complex due to hydro-mechanical coupling.

3.2.3. Crack Surface Observation

Surface and internal cracks observation are helpful to judge the crack shear or tensile properties from morphology. Some types of cracks with obvious features, for example, wing cracks, anti-wing cracks, and splitting cracks, are easy to identify and judge their probable mechanism. While some kinds of cracks are quite complicated and indistinguishable. In addition to direct observation of crack morphology, the crack surface after failure often contains a trace that may reflect the cracking behavior, which is helpful to judge the mechanism.
Figure 11 is an example to illustrate the application of crack surface observation in this paper. It is difficult to judge the tensile or shear properties of the cracks simply from the surface cracks shown in the left. However, evidence can be found from the crack surfaces shown on the right. The downward friction marks, the trace of shear slip, were observed far from the flaw tips, as shown in the red box and the bottom half of the blue box; while no distinct marks can be found near the flaw tip, as shown in the top half of the blue box. Based on this phenomenon, we can guess this type of crack was a tensile-shear mixed crack; the tensile fracture occurred near the pre-existing flaw tips and shear fracture occurred far from the tips, and the failure mode of 15-6-3 was a mixed failure. This type of mixed crack and mixed failure were very common in this experiment.

3.2.4. Microscope Observation Based on Scanning Electron Microscope (SEM)

Cracking behavior of hydro-mechanical coupling under three-dimensional conditions has not been fully studied and understood. Therefore, it needs convincing evidence more than macroscopic morphological observation to judge the tensile or shear properties. Microscale observation based on scanning electron microscope (SEM) provides another approach.
As we know, shear cracks develop friction sliding traces in the crack surfaces during their propagation. Before SEM observation, the crack surface is sprayed with gold foil, and the sliding traces will cause a different response of the gold foil to the electron beam. Compared to the direct observation of crack surface, SEM observation can find microscopic traces, especially when no difference can be observed directly. Figure 12 shows the SEM scanning images of the crack surface of two specimens and Figure 12d shows the positions of the three scanning samples. The scanning sample S1 shown in Figure 12a was taken from the crack surface of 30-6-1 specimen near the crack tip. Figure 12b,c were taken from the HCC surface of 30-6-5 specimen near the upper tip of the pre-existing flaw (scanning samples S2) and the edge of the specimen (scanning samples S3), respectively. By their microscopic characteristics, the crack mechanism can be determined.
As shown in Figure 12a, at 50× magnification, sliding traces can be seen on the crack surface in most of the field; the stripes indicate that the crack has undergone intense shearing. In Figure 12b, no such shear traces were observed at either 50 or 300× magnification. Even the authors searched higher magnification, but only a jumble of gypsum crystals was seen. Then the authors observed several scanning samples taken from the initial segment of the HCC. By moving the position of scanning samples under SEM to cover the whole scanning surface, no evidence of shear cracks was observed. This suggests that HCCs were formed by tensile stress. However, the characteristics of mixed cracks were observed in scanning samples taken from the ends of HCCs. Scanning sample S3 in Figure 12c is an example; no significant features can be seen at lower multiples, while mixed shear traces can be observed with the increase of magnification multiples. As shown in the red box, obvious tensile-shear mixed characteristics can be observed at 500× magnification. The upper left part of the white dotted line was dominated by shear failure, while the lower right part was dominated by tensile failure, and this feature can also be observed elsewhere in S3. This indicates that the crack in S3 was subjected to tensile-shear mixed effect. In fact, by further microscopic observation in other scanning samples, we found that many of them were not simply tensile or shear. However, even in the case of mixed failure, the main properties can be distinguished by the magnitude of shear characteristics under SEM. The microscope observation showed HCCs were tensile cracks when they just initiated from the outer tips of the pre-existing flaw, and tensile failure was dominant during the whole fracturing processes, while the HCCs became tensile and shear mixed cracks when the specimens were about to fail.

3.3. Crack Types Observed in This Experiment

Based on the macro and micro observation method, the author summarized the crack types observed in this experiment. Figure 13 shows the schematic diagram of different types of cracks that led the jointed specimen failure, including three kinds of tensile cracks, two kinds of shear cracks, three kinds of mixed cracks, and a horizontal coupled crack (HCC).
The type 1 tensile crack (T1) was a three-dimensional wing crack, and the type 2 tensile crack (T2) was the anti-wing crack. Both of them were usually observed in the uniaxial test and led to tensile failure. The type 3 tensile crack (T3) appeared when confining pressure was small or water pressure was large. The vertical splitting failure in 0° and 90° specimens were classified as type 3 tensile cracks (T3) in this study.
Due to the complexity of 3D cracking behavior in mixed failure specimens, different types of mixed cracks may be difficult to distinguish by geometry. In this paper, the authors divided them into three types by comparing the initiation mechanism, direction, and propagation properties (shear/tensile). The comparison between the crack types obtained by CT and SEM observation in this paper and those obtained by high-speed cameras in previous studies will be discussed in Section 4.
The morphology of type 1 mixed crack (M1) was similar to that of type 3 tensile crack (T3). Both of them initiated almost along the pre-existing flaw direction and bent inward in propagation. The difference was that M1 has an obvious shearing phenomenon near the flaw tips, while the shear sliding traces were rarely observed in T3. Additionally, the bending amplitude of M1 was smaller than that of T3. The initiation direction of type 2 mixed crack (M2) had a small angle with the pre-existing flaw and propagated along the initiation direction without bending. The initiation was a mixed failure dominated by tensile, while the crack surfaces far away from the tips were mainly formed by shear. The geometry of type 3 mixed crack (M3) was similar to that of M2. The difference was that the crack initiation position of M3 was not in two flaw tips, and the shear characteristics at the flaw tips were more obvious than M2.
Shear cracks appeared in specimens under high confining pressure, and the crack surfaces showed remarkable shear characteristics. The crack surfaces of type 1 shear crack (S1) passed through the pre-existing flaw, while the direction of type 2 shear crack (S2) was not consistent with the pre-existing flaw. S1 appeared in specimens under 6 MPa confining pressure in triaxial compression tests and hydraulic coupled triaxial test with 1 MPa water pressure. S2 usually occurred in 0° and 90° specimens both in conventional and hydraulic coupled triaxial tests.
The initiation of HCCs were dominated by tensile failure, and tensile-shear mixed failure occurred at the end of the propagation. The HCCs occurred when the crack inclination angle ranged from 15° to 45°, and under high water pressure. The other types of cracks, such as far-field cracks, secondary cracks, and slight end damage, were not the main cracks which caused specimen failure; therefore, these cracks were not concerned in this paper.

3.4. Effect of Confining Pressure on Cracking Behavior

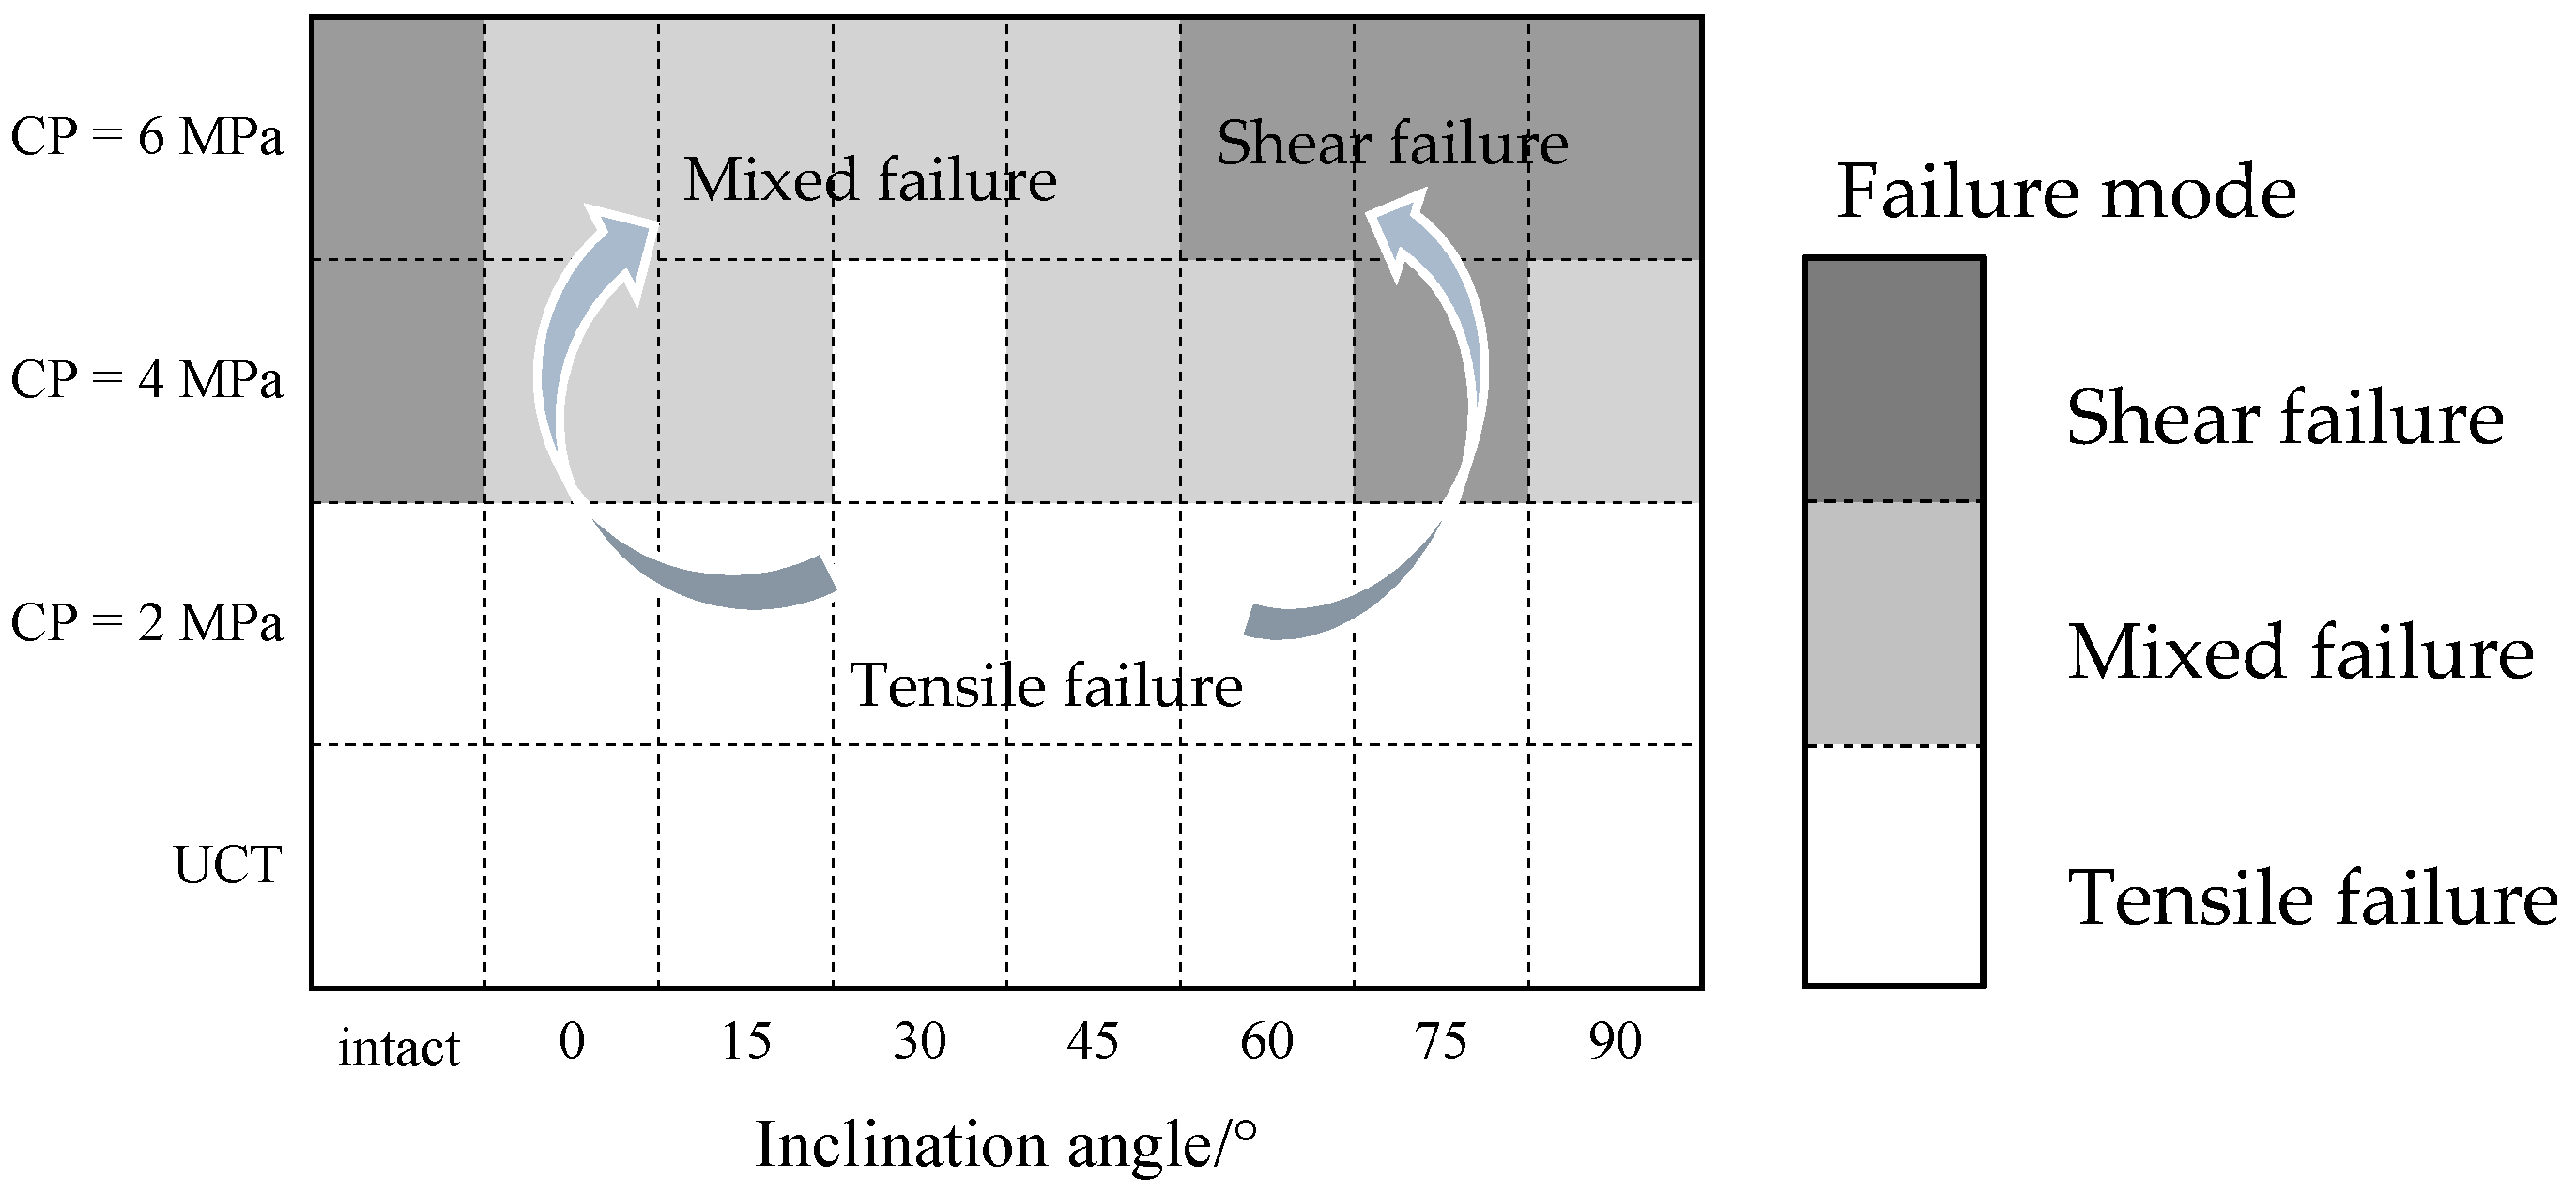
Based on geometries and propagation mechanisms, the main crack types that led the specimen failure was obtained. Table 2 shows the main crack types observed in uniaxial and triaxial compression tests. The letters in the table correspond to different crack types in Figure 12. According to the results in Table 2, the failure modes of specimens were obtained. Figure 14 shows the heat maps use colors as a way to distinguish different failure modes; each grid represents a test condition.
As shown in Table 2 and Figure 14, the confining pressure significantly affected the crack types of both intact and jointed specimens. In uniaxial compression tests and triaxial compression tests with 2 MPa confining pressure, the specimens were fractured by tensile cracks. With the increase of confining pressure, the failure mode transformed into mixed failure and shear failure. This phenomenon can be combined with the trend of the stress–strain curve. As shown in Figure 5a, the stress of shear failure remained nearly constant for a long time after yield (Type 2 in Figure 5a), while the stress–strain curves of tensile failure (Type 1 in Figure 5a) showed a gradual decline after the peak deviator stress.
Tensile cracks led to specimen failure under low confining pressure, but it rarely appeared under high confining pressure. Based on post-failure observations, it is probable that the initiation and propagation of tensile crack and shear crack compete with each other, while the confining pressure may inhibit the tensile crack propagation.

3.5. Effect of Water Pressure on Cracking Behavior

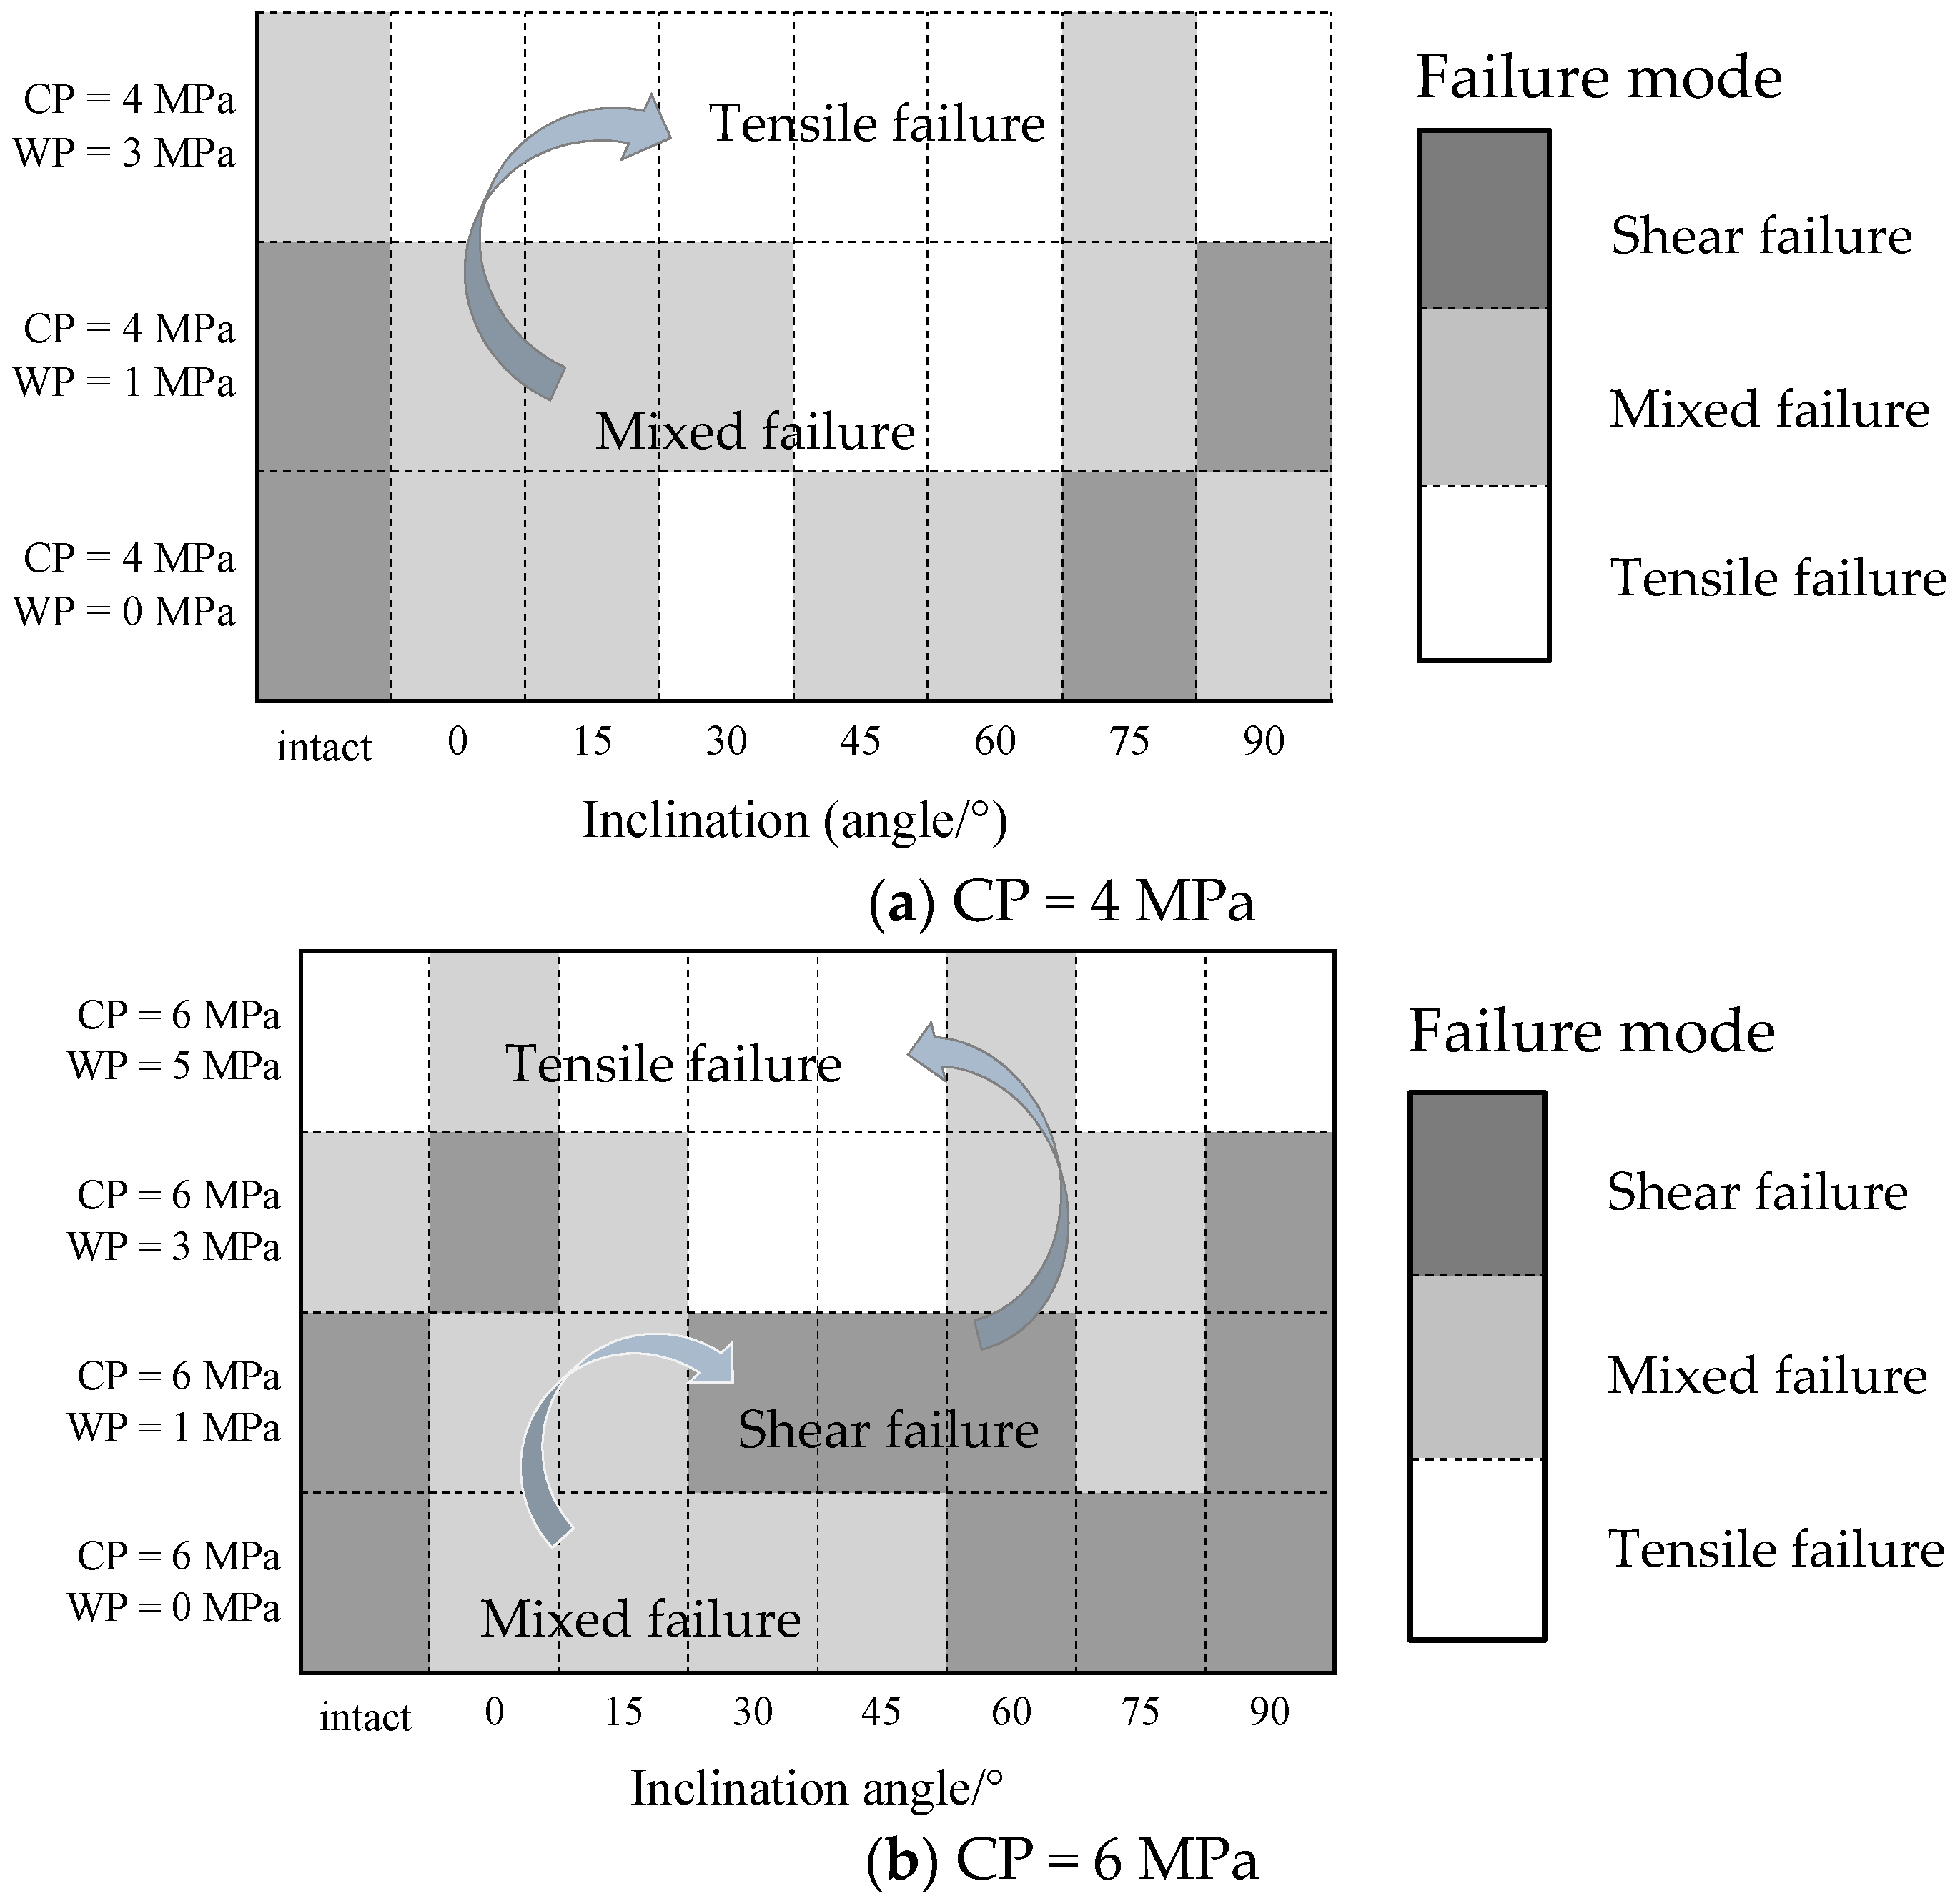
Water pressure greatly reduced the strength of jointed specimens, so that the mechanism of water in the failure process of the jointed rock mass is worthy of attention. Table 3 shows the crack types observed in hydraulic coupled triaxial tests. When the water pressure was 1 MPa, the confining pressure had a significant impact on the crack type. Most of the specimens under 2 MPa confining pressure were fractured by tensile cracks, while specimens were fractured by shear cracks or mixed cracks under 6 MPa confining pressure. With the increase of water pressure, more tensile cracks appeared to the specimens. This suggests that water pressure promotes the initiation and propagation of tensile cracks.
Figure 15 shows the heat maps of failure mode under 4 MPa and 6 MPa, respectively. When the confining pressure was 4 MPa (Figure 15a), the failure mode of the specimens changed from mixed failure to tensile failure as the water pressure increased. However, when the confining pressure was 6 MPa (Figure 15b), the shear characteristics of the specimens under 1 MPa water pressure were stronger than those of specimens in the conventional triaxial test, and the specimens changed from mixed failure to shear failure. With the further increase in water pressure, the observation results showed that water pressure significantly promoted the tensile failure of the specimens. Macroscopic and microscopic observations showed that 1 MPa water pressure made the specimens more prone to shear failure. It is possible that the lubrication of water reduced the resistance of the potential sliding surface, and the effect of this lubrication exceeds the effect of hydraulic pressure expansion force under 6 MPa confining pressure. When water pressure increased, tensile cracks were observed, and the results showed that specimens were prone to tensile failure. It seems like tensile cracks were more “easy” to initiation and propagation under high water pressure, possibly because of the expansion force exerted by water pressure.
The test results may suggest that the stress state at the crack tip and the interface friction coefficient were changed by the water pressure. The hydro-mechanical coupling may influence the fracture behavior by changing the energy release rate or stress intensity factor at the crack tip, which could provide a possible method for subsequent theoretical and numerical research.

3.6. Effect of Inclination Angle on Cracking Behavior

The internal cracks of 0° and 90° specimens were more complex than that of other specimens, and a secondary crack and end damage were more likely to appear. When the inclination angle was larger than 60°, the specimens were more prone to shear failure under high confining pressure. While 15°, 30°, and 45° specimens were prone to tensile failure and showed less sensitivity to confining pressure and more sensitivity to water pressure. Under the same working conditions, their tensile failure characteristics were stronger, and the shear characteristics were weaker. The inclination angle interval was 15°, and the regularity was not very significant. In the follow-up research, the authors intend to use the numerical simulation method to study more inclination angles.

4. Discussion

X-ray CT scanning overcame the difficulties in observations within nontransparent materials, and the spatial geometry was determined in a nondestructive way. Through microscopic observation based on SEM, the microscopic traces left during the initiation and propagation of the crack surface were obtained, which provide a basis for judging the tensile or shear properties of the cracks.
Figure 16 shows various crack types initiated from the pre-existing flaws identified by scholars. They used sandstone, molded gypsum and Carrara marble as materials for uniaxial compression tests; high-speed camera observed the damage process and obtained different crack types. Compared with the crack types summarized in this paper, the difference of tensile cracks is not obvious, but shear cracks and mixed cracks are more common in this experiment. In their uniaxial compression tests, the brittle rock specimens with a single flaw usually show tensile failure, while mixed failure and shear failure occur only in a few cases. However, under conventional and hydraulic coupled triaxial tests, the specimens are more prone to mixed failure and shear failure. Therefore, the shear crack types and mixed crack types in Figure 16 are different from those in Figure 12. Triaxial compression tests have the cases that the failure plane is not coplanar with the pre-existing flaw plane, which would not happen in uniaxial compression tests.
Macro observation, including surface and internal cracks, and micro observation based on SEM, provide evidence to determine the geometry and mechanism. Although the test results are derived from post-test observation rather than direct observation of the fracture process, the results also provide a useful reference for mechanical properties and cracking behavior under hydro-mechanical coupling. The results obtained in this laboratory study can be conceptually extended to the field scale since they indicate that the maximum bearable deviator stresses and the failure mode of jointed rock mass are significantly affected by the in-situ crustal stress as well as their coupled confined water pressure.

5. Conclusions

A series of uniaxial compression tests, conventional triaxial compression test, and hydraulic coupled triaxial test were conducted on cylinder gypsum specimens with a single pre-existing flaw. X-ray computed tomography (CT) and scanning electron microscope (SEM) were employed to determine internal cracks and the crack mechanism, respectively. The experimental research on mechanical properties and cracking behavior under hydro-mechanical coupling produced several results that contribute to its fundamental understanding.
(1)
The stress–strain curves of conventional and hydraulic coupling triaxial tests can be divided into two types according to post-peak behavior. The first type gradually declines after the peak, and the failure mode of these specimens were mostly tensile failures. The second type remained a long yield platform after the peak, and failure mode of these specimens were mostly shear failures.
(2)
Base on detailed macro and micro observation, nine types of cracks under hydro-mechanical coupling with different geometry and mechanisms (tensile, shear, or mixed) that led specimen failure were summarized. Though the results were obtained by macro and micro observation after failure, it still reflects the cracking behavior of jointed rock mass under hydro-mechanical coupling.
(3)
Specimens preferred to shear failure under high confining pressure, and the results showed confining pressure may inhibit the tensile cracks. The specimens were prone to tensile failure under high water pressure, and the results showed that water pressure may promote the tensile cracks. However, specimens preferred shear failure under high confining pressure and low water pressure, which may be because the lubrication of water reduced the resistance of the potential sliding surface, and the lubrication effect may exceed the expansion effect under that condition.

Author Contributions

Conceptualization, C.Z.; data curation, J.X.; formal analysis, J.X.; funding acquisition, C.Z.; investigation, J.X., S.Y. and C.M.; methodology, C.Z., S.Y. and H.M.; supervision, C.Z.; writing—original draft, J.X.; writing—review and editing, C.Z.

Funding

This research was funded by the National Key R&D Program of China (No. 2017YFC0805004), the National Natural Science Foundation of China (No. 41572262, No. 41202193, No. 41672265), the Shanghai Rising-Star Program (No. 17QC1400600), and the Shanghai Committee of Science and Technology (No. 14YF1403800). The project was supported by the National Key R&D Program of China (No. 2017YFC0806000) and the Shanghai Municipal Science and Technology Major Project (Grant No. 2017SHZDZX02).

Acknowledgments

The authors would like to thank Shaoxing University, Rock Mechanics and Geohazards Center for supporting the experiment.

Conflicts of Interest

The authors declare no conflicts of interest.

References

  1. Bieniawski, Z.T. Mechanism of Brittle Fracture of Rock: Part Ii—Experimental Studies. Int. J. Rock Mech. Min. Sci. Geomech. Abstr. 1967, 4, 407–423. [Google Scholar] [CrossRef]
  2. Bobet, A.; Einstein, H. Fracture coalescence in rock-type materials under uniaxial and biaxial compression. Int. J. Rock Mech. Min. Sci. 1998, 35, 863–888. [Google Scholar] [CrossRef]
  3. Brace, W.F.; Bombolakis, E.G. A note on brittle crack growth in compression. J. Geophys. Res. Space Phys. 1963, 68, 3709–3713. [Google Scholar] [CrossRef]
  4. Hoek, E.; Bieniawski, Z. Brittle fracture propagation in rock under compression. Int. J. Fract. 1965, 1, 137–155. [Google Scholar] [CrossRef]
  5. Morgan, S.P.; Johnson, C.A.; Einstein, H.H. Cracking processes in Barre granite: Fracture process zones and crack coalescence. Int. J. Fract. 2013, 180, 177–204. [Google Scholar] [CrossRef]
  6. Petit, J.-P.; Barquins, M. Can natural faults propagate under Mode II conditions? Tectonics 1988, 7, 1243–1256. [Google Scholar] [CrossRef]
  7. Zhao, C.; Zhou, Y.M.; Zhao, C.F.; Bao, C. Cracking Processes and Coalescence Modes in Rock-Like Specimens with Two Parallel Pre-existing Cracks. Rock Mech. Rock Eng. 2018, 51, 3377–3393. [Google Scholar] [CrossRef]
  8. Wong, L.; Einstein, H. Systematic evaluation of cracking behavior in specimens containing single flaws under uniaxial compression. Int. J. Rock Mech. Min. Sci. 2009, 46, 239–249. [Google Scholar] [CrossRef]
  9. Wong LN, Y.; Einstein, H.H. Crack Coalescence in Molded Gypsum and Carrara Marble: Part 1. Macroscopic Observations and Interpretation. Rock Mech. Rock Eng. 2009, 42, 475–511. [Google Scholar] [CrossRef]
  10. Yang, S.Q.; Jing, H.W. Strength Failure and Crack Coalescence Behavior of Brittle Sandstone Samples Containing a Single Fissure under Uniaxial Compression. Int. J. Fract. 2011, 168, 227–250. [Google Scholar] [CrossRef]
  11. Miao, S.; Pan, P.Z.; Wu, Z.; Li, S.; Zhao, S. Fracture Analysis of Sandstone with a Single Filled Flaw under Uniaxial Compression. Eng. Fract. Mech. 2018, 204, 319–343. [Google Scholar] [CrossRef]
  12. Yang, L.; Jiang, Y.; Li, B.; Li, S.; Gao, Y. Application of the expanded distinct element method for the study of crack growth in rock-like materials under uniaxial compression. Front. Struct. Civ. Eng. 2012, 6, 121–131. [Google Scholar] [CrossRef]
  13. Yang, S.Q. Crack Coalescence Behavior of Brittle Sandstone Samples Containing Two Coplanar Fissures in the Process of Deformation Failure. Eng. Fract. Mech. 2011, 78, 3059–3081. [Google Scholar] [CrossRef]
  14. Zhao, C.; Matsuda, H.; Morita, C.; Shen, M.R. Study on Failure Characteristic of Rock-Like Materials with an Open-Hole under Uniaxial Compression. Strain 2011, 47, 405–413. [Google Scholar] [CrossRef]
  15. Bruning, T.; Karakuş, M.; Nguyen, G.D.; Goodchild, D. Experimental Study on the Damage Evolution of Brittle Rock Under Triaxial Confinement with Full Circumferential Strain Control. Rock Mech. Rock Eng. 2018, 51, 3321–3341. [Google Scholar] [CrossRef]
  16. Huang, Y.-H.; Yang, S.-Q. Mechanical and cracking behavior of granite containing two coplanar flaws under conventional triaxial compression. Int. J. Damage Mech. 2018, 28, 590–610. [Google Scholar] [CrossRef]
  17. Huang, Y.-H.; Zhao, J.; Yang, S.-Q. Three-Dimensional Numerical Simulation on Triaxial Failure Mechanical Behavior of Rock-Like Specimen Containing Two Unparallel Fissures. Rock Mech. Rock Eng. 2016, 49, 4711–4729. [Google Scholar] [CrossRef]
  18. Le, H.; Sun, S.; Xu, C.; Li, L.; Liu, Y. Cracking Behaviors and Mechanical Properties of Rock-Like Specimens with Two Unparallel Flaws under Conventional Triaxial Compression. Adv. Civ. Eng. 2019, 2019, 5849703. [Google Scholar] [CrossRef]
  19. Wang, S.; Sloan, S.; Sheng, D.; Yang, S.; Tang, C. Numerical study of failure behaviour of pre-cracked rock specimens under conventional triaxial compression. Int. J. Solids Struct. 2014, 51, 1132–1148. [Google Scholar] [CrossRef] [Green Version]
  20. Yang, S.-Q.; Huang, Y.-H. An experimental study on deformation and failure mechanical behavior of granite containing a single fissure under different confining pressures. Environ. Earth Sci. 2017, 76, 340. [Google Scholar] [CrossRef]
  21. Zhou, Y.; Zhao, C.; Zhao, C.; Ma, C.; Xie, J. Experimental Study on the Fracturing Behaviors and Mechanical Properties of Cracks under Coupled Hydro-Mechanical Effects in Rock-Like Specimens. Water 2018, 10, 1355. [Google Scholar] [CrossRef]
  22. Nabawy, B.S.; David, C. X-Ray CT scanning imaging for the Nubia sandstone as a tool for characterizing its capillary properties. Geosci. J. 2016, 20, 691–704. [Google Scholar] [CrossRef]
  23. Xu, J.; Zhou, R.; Song, D.; Li, N.; Zhang, K.; Xi, D. Deformation and Damage Dynamic Characteristics of Coal-Rock Materials in Deep Coal Mines. Int. J. Damage Mech. 2019, 28, 58–78. [Google Scholar] [CrossRef]
  24. Zhao, G.-F.; Russell, A.R.; Zhao, X.; Khalili, N. Strain rate dependency of uniaxial tensile strength in Gosford sandstone by the Distinct Lattice Spring Model with X-ray micro CT. Int. J. Solids Struct. 2014, 51, 1587–1600. [Google Scholar] [CrossRef] [Green Version]
  25. Zhou, X.; Zhang, Y.; Ha, Q. Real-time computerized tomography (CT) experiments on limestone damage evolution during unloading. Theor. Appl. Fract. Mech. 2008, 50, 49–56. [Google Scholar] [CrossRef]
  26. Andreani, M.; Baronnet, A.; Boullier, A.M.; Gratier, J.P. A microstructural study of a “crack-seal” type serpentine vein using SEM and TEM techniques. Eur. J. Miner. 2004, 16, 585–595. [Google Scholar] [CrossRef]
  27. Cui, Z.; Han, W. In Situ Scanning Electron Microscope (SEM) Observations of Damage and Crack Growth of Shale. Microsc. Microanal. 2018, 24, 107–115. [Google Scholar] [CrossRef]
  28. Liu, Q.; Liu, Q.; Pan, Y.; Liu, X.; Kong, X.; Deng, P. Microcracking Mechanism Analysis of Rock Failure in Diametral Compression Tests. J. Mater. Civ. Eng. 2018, 30, 04018082. [Google Scholar] [CrossRef]
  29. Zhao, Y.; Huang, J.; Wang, R. Real-time SEM observations of the microfracturing process in rock during a compression test. Int. J. Rock Mech. Min. Sci. Géoméch. Abstr. 1993, 30, 643–652. [Google Scholar] [CrossRef]
Figure 1. (a) Schematic diagram of the specimen; (b) stress–strain curves for consistency evaluation.
Applsci 09 03234 g001
Figure 2. The loading condition of the hydraulic coupled triaxial test.
Applsci 09 03234 g002
Figure 3. GCTS RTX-3000 triaxial rock testing system.
Applsci 09 03234 g003
Figure 4. Part of stress–strain curves as an example. (a) 15° specimens in uniaxial and triaxial compression tests; (b) 15° specimens in hydraulic coupled triaxial tests; (c) 60° specimens in uniaxial and triaxial compression tests; (d) 60° specimens in hydraulic coupled triaxial tests; (e) 75° specimens in uniaxial and triaxial compression tests; (f) 75° specimens in hydraulic coupled triaxial tests.
Applsci 09 03234 g004
Figure 5. Sketch diagram of stress–strain curve types in triaxial tests. (a) Triaxial compression test; (b) hydraulic coupled triaxial test.
Applsci 09 03234 g005
Figure 6. Results of the peak deviator stress. (a) Uniaxial compression test and conventional triaxial compression test; (b), (c), and (d) hydraulic coupled triaxial compression test under 2 MPa, 4 MPa, and 6 MPa confining pressure, respectively.
Applsci 09 03234 g006
Figure 7. Spatial fitting diagram of peak deviator stress. (a) Uniaxial and triaxial compression test; (b) hydraulic coupled triaxial compression test under 6 MPa confining pressure.
Applsci 09 03234 g007
Figure 8. Results of Young’s modulus and the peak axial strain. (a) Uniaxial compression test and conventional triaxial compression test; (b), (c) and (d) hydraulic coupled triaxial test under 2 MPa, 4 MPa, and 6 MPa confining pressure, respectively.
Applsci 09 03234 g008
Figure 9. Surface crack photographs of 45° specimens after failure.
Applsci 09 03234 g009
Figure 10. Part of cross-sections of 30-4-1 specimen after failure. (a) Schematic diagram of space coordinate system; (b,c) schematic diagram of section cutting position; (d) front vertical cross-sections with different depths; (e) horizontal cross-sections with different heights.
Applsci 09 03234 g010
Figure 11. Crack surfaces of specimens after failure.
Applsci 09 03234 g011
Figure 12. Scanning electron microscope (SEM) scanning images of shear, tensile, and mixed cracks.
Applsci 09 03234 g012
Figure 13. Crack types caused specimens failure in this study.
Applsci 09 03234 g013
Figure 14. Failure mode of specimens under different confining pressure.
Applsci 09 03234 g014
Figure 15. Failure mode of specimens under different water pressure. (a) Under 4 MPa confining pressure; (b) under 6 MPa confining pressure.
Applsci 09 03234 g015
Figure 16. Various crack types obtained by scholars. (a) Brittle sandstone specimens by Yang and Jing [10]; (b) molded gypsum and Carrara marble specimens by Wong and Einstein [8,9].
Applsci 09 03234 g016
Table 1. Experimental scheme. α : inclination angle; UCT: uniaxial compression test; CP: confining pressure; WP: water pressure.
Experimental TypeSpecimen NumberSpecimenConfining PressureWater Pressure
Uniaxial compression test α UCT Intact, and 0°, 15°, 30°, 45°, 60°, 75°, 90° specimens--
Triaxial compression test α CP 2, 4, 6 MPa-
Hydraulic coupled triaxial test α CP WP 2 MPa1 MPa
4 MPa1, 3 MPa
6 MPa1, 3, 5 MPa
Table 2. Summary of all crack types observed in uniaxial and triaxial compression tests.
SpecimensUniaxialTriaxial
CP = 2 MPaCP = 4 MPaCP = 6 MPa
Intact specimenT3T3S2S2
0° specimenT1, T2T3M3M3
15° specimenT1T1M3M3
30° specimenT1, T2T3T3, T1M2
45° specimenT1T3M1, M2M1
60° specimenT1T3, T1M2S1
75° specimenT1, T2T3S2S1
90° specimenT3T3M3S2
NotesT1: type 1 tensile crackS2: type 2 shear crack
T2: type 2 tensile crackM1: type 1 mixed crack
T3: type 3 tensile crackM2: type 2 mixed crack
S1: type 1 shear crackM3: type 3 mixed crack
Table 3. Summary of all crack types observed in hydraulic coupled triaxial test.
SpecimensCP = 2 MPaCP = 4 MPaCP = 6 MPa
WP = 1 MPaWP = 1 MPaWP = 3 MPaWP = 1 MPaWP = 3 MPaWP = 5 MPa
Intact specimenS2S2M3S2M1T3
0° specimenT1M3T1M2, S2S2M2
15° specimenT1M3T3M2M2HCC, M2
30° specimenT3, T1M3T3S1T3HCC, T3
45° specimenT3T3HCC, M1S1T3HCC, M2
60° specimenT3T3T3S1M1M1
75° specimenM3M1M1M2M2T3
90° specimenT3S2T3S1S2T3
NoteThe marks have the same meaning as Table 2.