Article

Feasibility of a Quasi-Static Approach in Assessing Side-Wind Hazards for Running Vehicles

1
Institute of Construction and Environmental Engineering, Seoul National University, Seoul 08826, Korea
2
Department of Civil and Environmental Engineering, Seoul National University, Seoul 08826, Korea
3
Institute of Construction and Environmental Engineering, Seoul National University, Seoul 08826, Korea
*
Author to whom correspondence should be addressed.
Appl. Sci. 2019, 9(16), 3377; https://doi.org/10.3390/app9163377
Submission received: 18 July 2019 / Revised: 11 August 2019 / Accepted: 13 August 2019 / Published: 16 August 2019
(This article belongs to the Section Civil Engineering)

Abstract

:

Featured Application

This manuscript demonstrates the feasibility of using a quasi-static approach in assessing the risk level of operating a vehicle in a strong side wind. The proposed quasi-static model can be applied to the risk evaluation of wind-prone highways and to the establishment of traffic control strategies against side-wind hazards.

Abstract

This study is an examination into the feasibility of a quasi-static approach to evaluating the reaction forces that impact tires. This information could lend valuable insight into efforts to limit overturning and side-slip accidents of vehicles exposed to strong side winds. The performance of the quasi-static approach was evaluated by comparing the calculated tire forces with those created using TruckSim, which is a dynamic vehicle analysis software. Governing equations were formulated for two types of vehicles that are susceptible to the force of wind, vans, and trailers, by considering a force equilibrium, a compatibility condition, and several assumptions. The quasi-static approach for trailers is a novel expansion of the conventional approach to a two-axle vehicle. Proposed enhancements to the quasi-static approach reflect the additional rolling moment of a trailer. The curvature and the cant of a curved road were accounted for via centrifugal forces. Both uniform and turbulent wind conditions were considered in questioning the feasibility of this novel approach.

1. Introduction

Vehicles crossing long-span bridges over open seas are often exposed to strong side winds. Accidents involving side-slipped and overturned vehicles occur often on spans such as the Gwangan and Seohae Bridges in Korea. Typhoon Jebi hit Japan in 2018, and videos taken during Jebi showing a heavy truck overturned on a bridge are available on the internet [1]. Estimating the vulnerability of vehicles crossing sea bridges begins with an evaluation of the critical wind speed, which is defined as the point at which vehicles will side-slip or overturn. Once the critical wind speed curve is developed for different vehicle types, the risk assessment of a bridge in terms of vehicle safety for strong side winds can be estimated [2]. Accordingly, appropriate numerical analysis models are required for the evaluation of the critical wind speeds for vehicles.
The quasi-static model, which is basically utilizing static equilibrium equations, and the full dynamic model with sophisticate modeling of vehicle parts are two typical vehicle models utilized for the evaluation of the critical wind speed [3,4,5]. Both the quasi-static and the dynamic approaches have pros and cons.
The merit of the dynamic approach is that it simulates more realistic vehicle motions by considering various interactions among vehicle components based on vehicle dynamics. CarSim and TruckSim [6] are examples of the commercial software that is available to support the dynamic approach. The dynamic approach can simulate the time histories of vehicle responses for each part of a vehicle, which includes tire forces, displacement, and acceleration. The results can be used to assess not only vehicle safety but also discomfort experienced by drivers [7]. The construction of a reliable dynamic model, however, requires tremendous effort and detailed data, which are usually not available to general researchers. Furthermore, vehicles consist of many parts with different characteristics depending on the vehicle. These differing parts include tires, suspension springs, shock absorbers, and brake systems. Therefore, if there is a small error in the modeling of these components, the complexity of the dynamic model can cause a large propagation error [8].
The quasi-static vehicle model, on the other hand, is convenient to use, because it requires only a few basic dimensional and aerodynamic configurations of vehicle information. The quasi-static model is also intuitive because it focuses on the equilibrium condition of static forces acting on vehicles. For these reasons, the quasi-static model has been utilized for the risk assessment of vehicle safety in side winds, even though it is less realistic than the dynamic approach [2,9,10]. A very important question remains, however, as to whether the quasi-static model can accurately evaluate the tire reaction forces and/or the critical wind speeds with sufficient precision when it ignores the dynamic interactions between the mechanical parts of a vehicle. Baker [8] proved the feasibility of the quasi-static train model by using it to estimate the wheel load and comparing the results with estimations using the dynamic train model. However, there are no reports of a feasibility study for road vehicles.
Therefore, the focus of this study is to confirm the feasibility of the quasi-static approach in assessing the safety of vehicles exposed to strong side winds. Two types of vehicles, vans and trailers, were considered. The TruckSim software was utilized to provide target responses for the dynamic approach. The novel approach in this study includes three dimensions: (1) the proposition of a quasi-static approach for trailers; (2) a feasibility assessment of the proposed quasi-static approach by comparing the reaction forces of tires with that proposed by the full dynamic approach for turbulent wind; and (3) an enhancement of the conventional quasi-static approach based on a cause investigation of the differences identified between the two approaches.

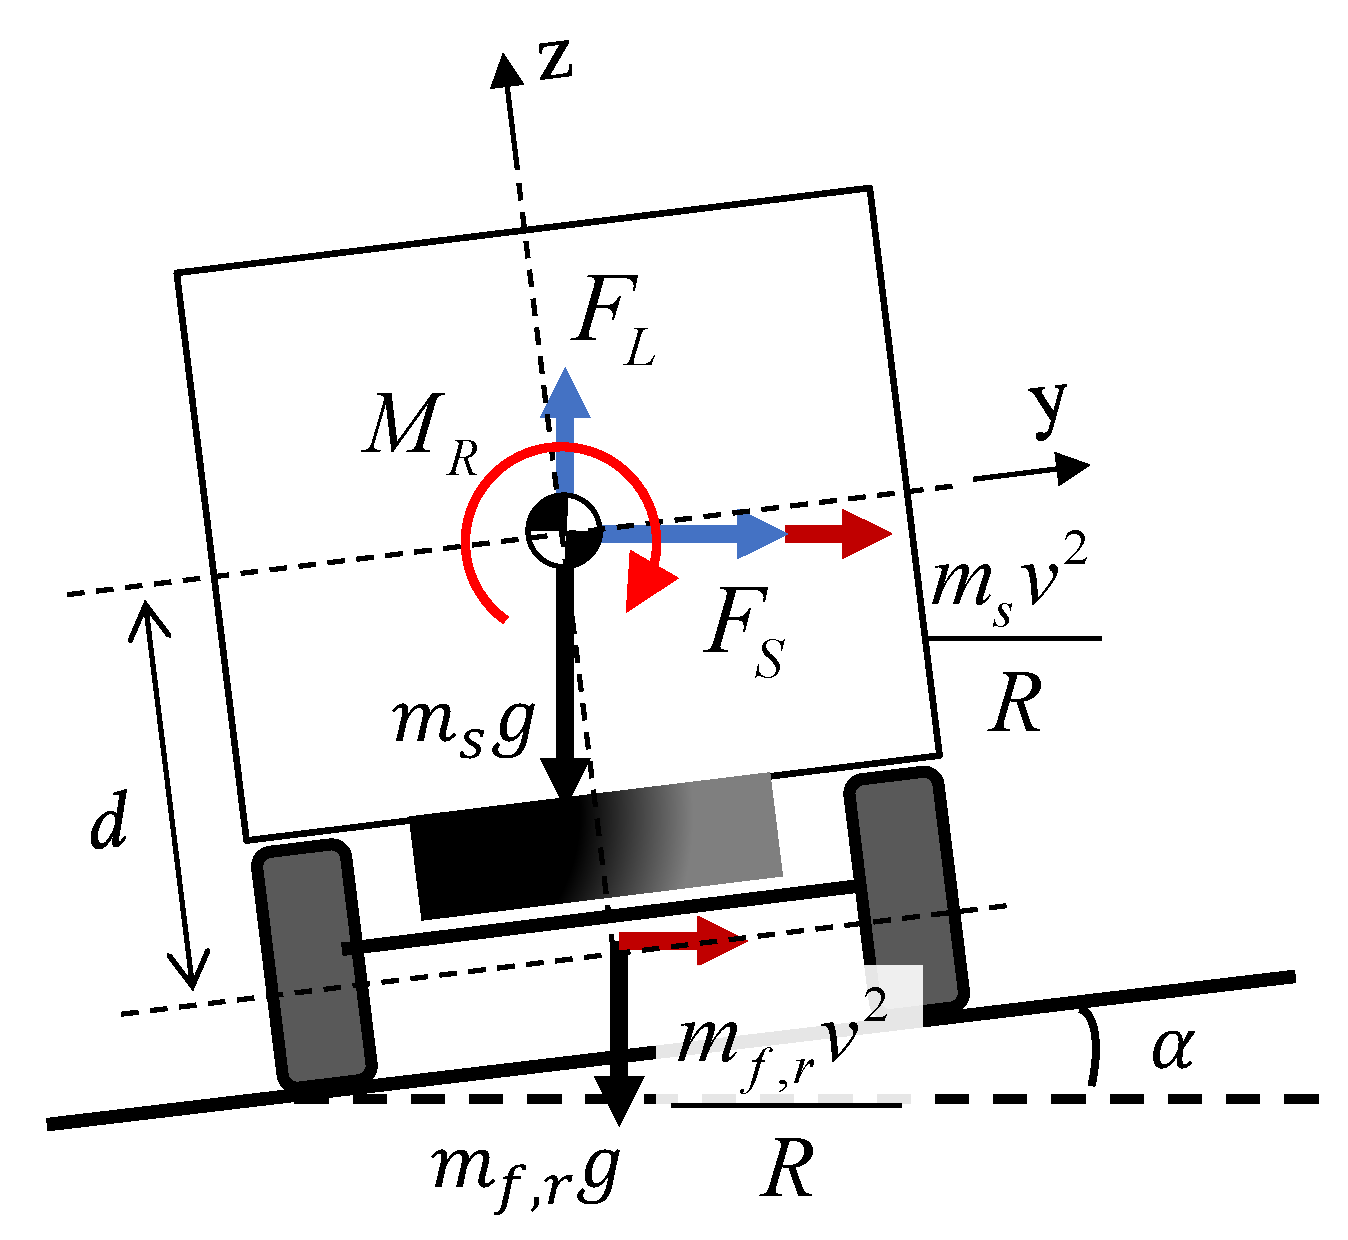
2. Quasi-Static Approach for the Evaluation of Tire Forces

Six equilibrium equations and additional assumptions were utilized for the evaluation of unknowns that include tire forces. This so-called quasi-static approach has been applied only to the two-axle types of vehicles tested in previous studies [2,3,10]. The present study, however, extended the procedure to trailers, which are more vulnerable to strong side winds [2].

2.1. Equations for Vehicles with Two Axles

In order to establish a two-axle, quasi-static vehicle model, the basic concept proposed by Baker [3] and Batista and Perkovič [10] was adopted. Six equilibrium equations for x, y, and z axes were derived to consider the longitudinal, lateral, and vertical tire forces, as shown in Figure 1. After adding the weight of the wheel, we obtained six equilibrium equations as follows.
i 1 q ( F z 1 + F z 3 ) + i 2 q ( F z 2 + F z 4 ) f R i   =   1 4 F z i   =   F D
i   =   1 4 F z i   =   ( m s + m f + m r ) g F L
F y f + F y r     =     F S
c 2 ( F z 3 + F z 4 F z 1 F z 2 )   =   M R + h c F S
a F y f b F y r + c 2 ( i 1 q f R ) ( F z 3 F z 1 ) + c 2 ( i 2 q f R ) ( F z 4 F z 2 )   =   M Y
b ( F z 2 + F z 4 ) a ( F z 1 + F z 3 )     =     ( m f a + m r b ) g + M P + h c F D
Equations (1)–(6) use the following designations: a and b are the distance of the front and rear axles from the center of gravity; c is the track width; h c is the vertical distance between the ground and the center of gravity; g is the acceleration of gravity (=9.81 m/s2); and, m s , m f , and m r are the masses of the sprung vehicle body, the front axle, and the rear axle, respectively. There are six wind-induced forces and moments: Drag force, F D ; lift force, F L ; side force, F S ; rolling moment, M R ; yawing moment, M Y ; and, pitching moment, M P . F z i (i = 1, 2, 3, 4) are the vertical reaction forces of tires, and F y i (i = f and r) are the lateral friction force of front and rear axles. The symbols i 1 and i 2 are variables that can only be 0 or 1 according to whether the corresponding axle is driven or not. Traction parameter q and rolling resistance coefficient f R are the ratio of vertical reaction forces to tire traction forces T i (i = 1, 2, 3, 4) and to rolling resistance forces F x i (i = 1, 2, 3, 4), respectively [3]. q is an unknown value which is estimated from Equations (1)–(6) whereas f R is a constant value which is determined by vehicle speed v (unit: km/h) according to Equation (7) [6].
f R   =   0.0041 0.0000256 × v
A compatibility condition whereby all wheel centers constantly lie on a plane was also introduced to solve the above seven unknowns. When the stiffness of all suspension was assumed to be equal, the compatibility condition was represented as shown by Equation (8) [3].
F z 1 F z 3 + F z 4 F z 2   =   0
Since the number of unknowns in the equations were equal, the tire forces of a vehicle could be determined for given levels of wind-induced forces and moments. The quasi-static approach suggested by Baker [3] and Batista and Perkovič [10], however, provided a negative contact force for the tires when one of the wheels had lost contact with the ground, which is unrealistic. Therefore, we established two modifications in order to calculate the tire forces under situations where any wheel loses contact with the ground. First, the vertical tire force, F z i , of the wheel being lifted up was fixed at 0 during the calculation. Second, the compatibility condition illustrated by Equation (8) was no longer effective. The tire forces could then be evaluated by considering the remaining three tires.

2.2. Equations for Trailers with One Axle and One Hitch Point

Tractor-trailers are exceedingly vulnerable to side winds. The trailer portion, in particular, is vulnerable to side winds due to its large surface area, and it only has one rear axle to resist overturning. Therefore, the present study simulated the quasi-static approach only for the trailer portion, as shown in Figure 2, with the assumption that the hitch point that connects trailer to tractor cannot resist the rolling, yawing, and pitching moments. Six equilibrium equations were developed for the same procedure in the case of two-axle vehicles, as shown in Equations (9)–(14).
T f R i   =   2 3 F z i   =   F D
i   =   1 3 F z i   =   ( m s + m r ) g F L
F y f + F y r   =   F S
c 2 ( F z 3 F z 2 ) + h T F y f   =   M R + h c F S
a F y f b F y r + c 2 f R ( F z 2 F z 3 )   =   M Y
b ( F z 2 + F z 3 ) a ( F z 1 ) + h T T   =   m r b g + M P + h c F D
In Equations (9)–(14), T is the traction force by the tractor, and h c and h T are the height of the center of gravity and the hitch point, respectively. Since Equations (9)–(14) include only six unknowns (one traction force, two lateral friction forces, and three vertical reaction forces), all the tire forces could be determined from the equilibrium equations.

2.3. Aerodynamic Forces and Moments

Based on the quasi-steady theory, aerodynamic forces and moments induced by side winds can be expressed as shown in Equations (15) and (16).
F D   =   C D A ρ V 2 2 F S   =   C S A ρ V 2 2 F L   =   C L A ρ V 2 2
M R   =   C R A h c ρ V 2 2 M P   =   C P A h c ρ V 2 2 M Y   =   C Y A h c ρ V 2 2
In Equations (15) and (16), C D , C S , C L , C R , C P , and C Y are the aerodynamic coefficients for drag force, side force, lift force, rolling moment, pitching moment, and yawing moment, which can be determined from wind tunnel tests or by computational fluid dynamic analysis; ρ is the air density (=1.225 kg/m3); V is the apparent wind speed; and A is the front area of the vehicle.
All aerodynamic coefficients are functions of the effective wind direction, ψ , which can be defined from the true wind speed vector w and the vehicle’s own speed vector v , as shown in Figure 3. When the true wind direction is β , the apparent wind speed vector V and effective wind direction ψ can be defined as shown in Equations (17) and (18).
| V | 2   =   ( | v | + | w | cos β ) 2 + | w | 2 sin 2 β
ψ   =   arctan | w | sin β | v | + | w | cos β

2.4. Effect of Road Conditions: Cant and Curvature

When the vehicle is running on a curved section of a bridge deck, the vehicle is subjected to additional centrifugal forces. Furthermore, the deck in a curved section inclines from the horizontal plane due to the cant by an angle α , which changes the direction of external forces, as shown in Figure 4. Those factors are taken into consideration, as shown by Equations (19)–(23).
F S '   =   ( F S + m t o t v 2 R ) cos α + ( F L m t o t g ) sin α
F L '   =   F L cos α ( F S + m t o t v 2 R ) sin α + m t o t g ( 1 cos α )
M R '   =   M R ( m f + m r ) ( v 2 R cos α g sin α ) · d
M Y '   =   M Y + ( m f · a m r · b ) ( v 2 R cos α g sin α )
M P '   =   M P + ( m f · a + m r · b ) ( v 2 R sin α g ( 1 cos α ) )
In Equations (19)–(23), R is the radius of the curvature for the curved section, and m t o t   =   m s + m f + m r . d is the vertical distance between the sprung mass and the center of the wheel. F S ' , F L ' , M R ' , M Y ' , and M P ' are the updated side, lift forces, and the rolling, yawing, and pitching moments along the tilted x, y, and z axes, respectively, as shown in Figure 4. For simplicity, the aerodynamic coefficients of the vehicle were assumed to have not changed due to the angle of the cant.
Road roughness and a driver model were not reflected in the quasi-static approach. Baker [8] has shown that the degree of the surface roughness effect on the vehicle behavior is negligible compared with wind turbulence. The impact of roughness on vehicle stability could also be further mitigated by the vehicle’s suspension and dampers. Therefore, leaving these minor factors as a future task, the next section focuses on an overall behavioral assessment. On the other hand, a driver behavior model is one of the influential factors that can induce large lateral and yaw displacement. Side-slip accidents can occur due to this large movement even though the friction forces of the tires have not reached a friction-limited state. As Chen and Chen [11] pointed out, however, since no driver model has been well established, it would be difficult to consider this complex factor during the risk assessment procedure. Therefore, in the following sections, the driver behavior model was not taken into consideration for the evaluation of tire forces.

3. Feasibility of the Quasi-Static Approach Under a Uniform Wind

The feasibility of the quasi-static approach in estimating reasonable tire forces was examined under uniform wind conditions with an incident angle of 90 degrees to the vehicle—i.e., perpendicular to one side of the vehicle. The quasi-static approach was validated using the commercial software TruckSim (v2017.1), which was developed by Mechanical Simulation Corporation [6] to provide various vehicle types, such as vans, busses, and trucks, with a sophisticated modeling capacity for optional suspension types, steering conditions, powertrain modeling, brake systems, and interaction mechanisms with a driver. The benchmarking responses for validation were the tire forces of two vehicle types—vans (vehicle with two axles) and trailers (vehicle with one axle and one hitch point)—under various wind speeds. As a numerical integration method, the Adams–Moulton second order method was adopted. This is an implicit linear multistep method that involves a prediction procedure at each half step. A time step of 0.001 s was selected, which was confirmed as a sufficiently small value via convergence testing.

3.1. Modeling Options

The modeling information for the two vehicle types was obtained from the built-in models in TruckSim, as shown in Table 1. Since the quasi-static approach assumes a ball hitch connection between the tractor and trailer, the default modeling in TruckSim was slightly modified to prevent a transfer of the rolling moment at the connection part. The aerodynamic coefficients of the two vehicle types follow the values given by Baker [12], as shown in Figure 5.

3.2. Comparison of Tire Forces Under Various Wind Speeds

Vertical reaction and lateral friction forces were evaluated for two vehicle types under a driving speed of 50 km/h on a flat straight road ( R   =   , α   =   0 % ). Since an initial vibration occurred in the dynamic approach, stabilized results were obtained by providing a sufficient simulation time of 30 s.
Uniform wind speeds were gradually increased at 10 m/s until one of the vertical tire forces reached zero. Figure 6 and Figure 7 show the variations in the tire forces for the van and trailer, respectively. The quasi-static approach provided tire forces that compared to those of the dynamic approach. The vertical reaction forces showed a certain difference between the quasi-static and dynamic approaches, while the lateral friction forces were quite similar in both approaches.
The differences in vertical reaction forces for the two vehicle types were further investigated. One interesting point was a tendency for differences according to the wind speeds in the two vehicle types. In the case of the van, the gap between the two approaches remained constant to the wind speed whereas the gap for the trailer increased with increases in the wind speed. This differing tendency implies that the main cause of the gap was from different sources for the two vehicle types.
In the case of the van, this gap was induced by the difference in suspension modeling between the two approaches. The dynamic approach with TruckSim analysis reflects the type of suspension (independent or solid), the differences in stiffness values for the front and rear axles, and the changeable location of the suspension for the solid type. Since the present study utilized the default van model provided by TruckSim, the stiffness and location of the suspensions were different in the front and rear axles. However, the quasi-static approach adopts an assumption of equal suspension stiffness and location for both the front and rear axles, which resulted in compatibility, as shown in Equation (8). Accordingly, both approaches showed a difference in the vertical reaction forces for the van, as shown in Figure 6a. In order to support this inference, we modified the van model for the dynamic approach so that the same stiffness values and location of suspension could be applied to both axles. Figure 8 shows similar vertical reaction forces in both approaches, which confirms that the difference in vertical reaction forces was induced from the suspension modeling between the two approaches, particularly for the van.
On the other hand, the gap for the trailer, as shown in Figure 7a, was due mainly to the additional rolling moment induced by the lateral displacement of the trailer body in the dynamic approach. According to the TruckSim analysis, the roll angle at the roll center and the lateral displacement of the trailer body were evaluated at approximately 3 degrees and 0.05 m, respectively, when the wind speed reached 19 m/s. The lateral displacement of the trailer body resulted in an additional rolling moment that reduced the vertical reaction force of the windward wheel, as illustrated in Figure 9. This additional moment was proportional to the lateral displacement, which is also highly dependent on wind speed. This effect of the addition of a rolling moment was not reflected in the derivation of the equilibrium equations for the quasi-static approach. This inference explains why the gap between the vertical reaction forces estimated by the two approaches increased with increases in the wind speed, as shown in Figure 7a. This issue was not induced in the van since the lateral displacement was limited, and because the center of gravity was relatively low. The inference was also confirmed by modifications of the trailer model with consideration of additional rolling moment.

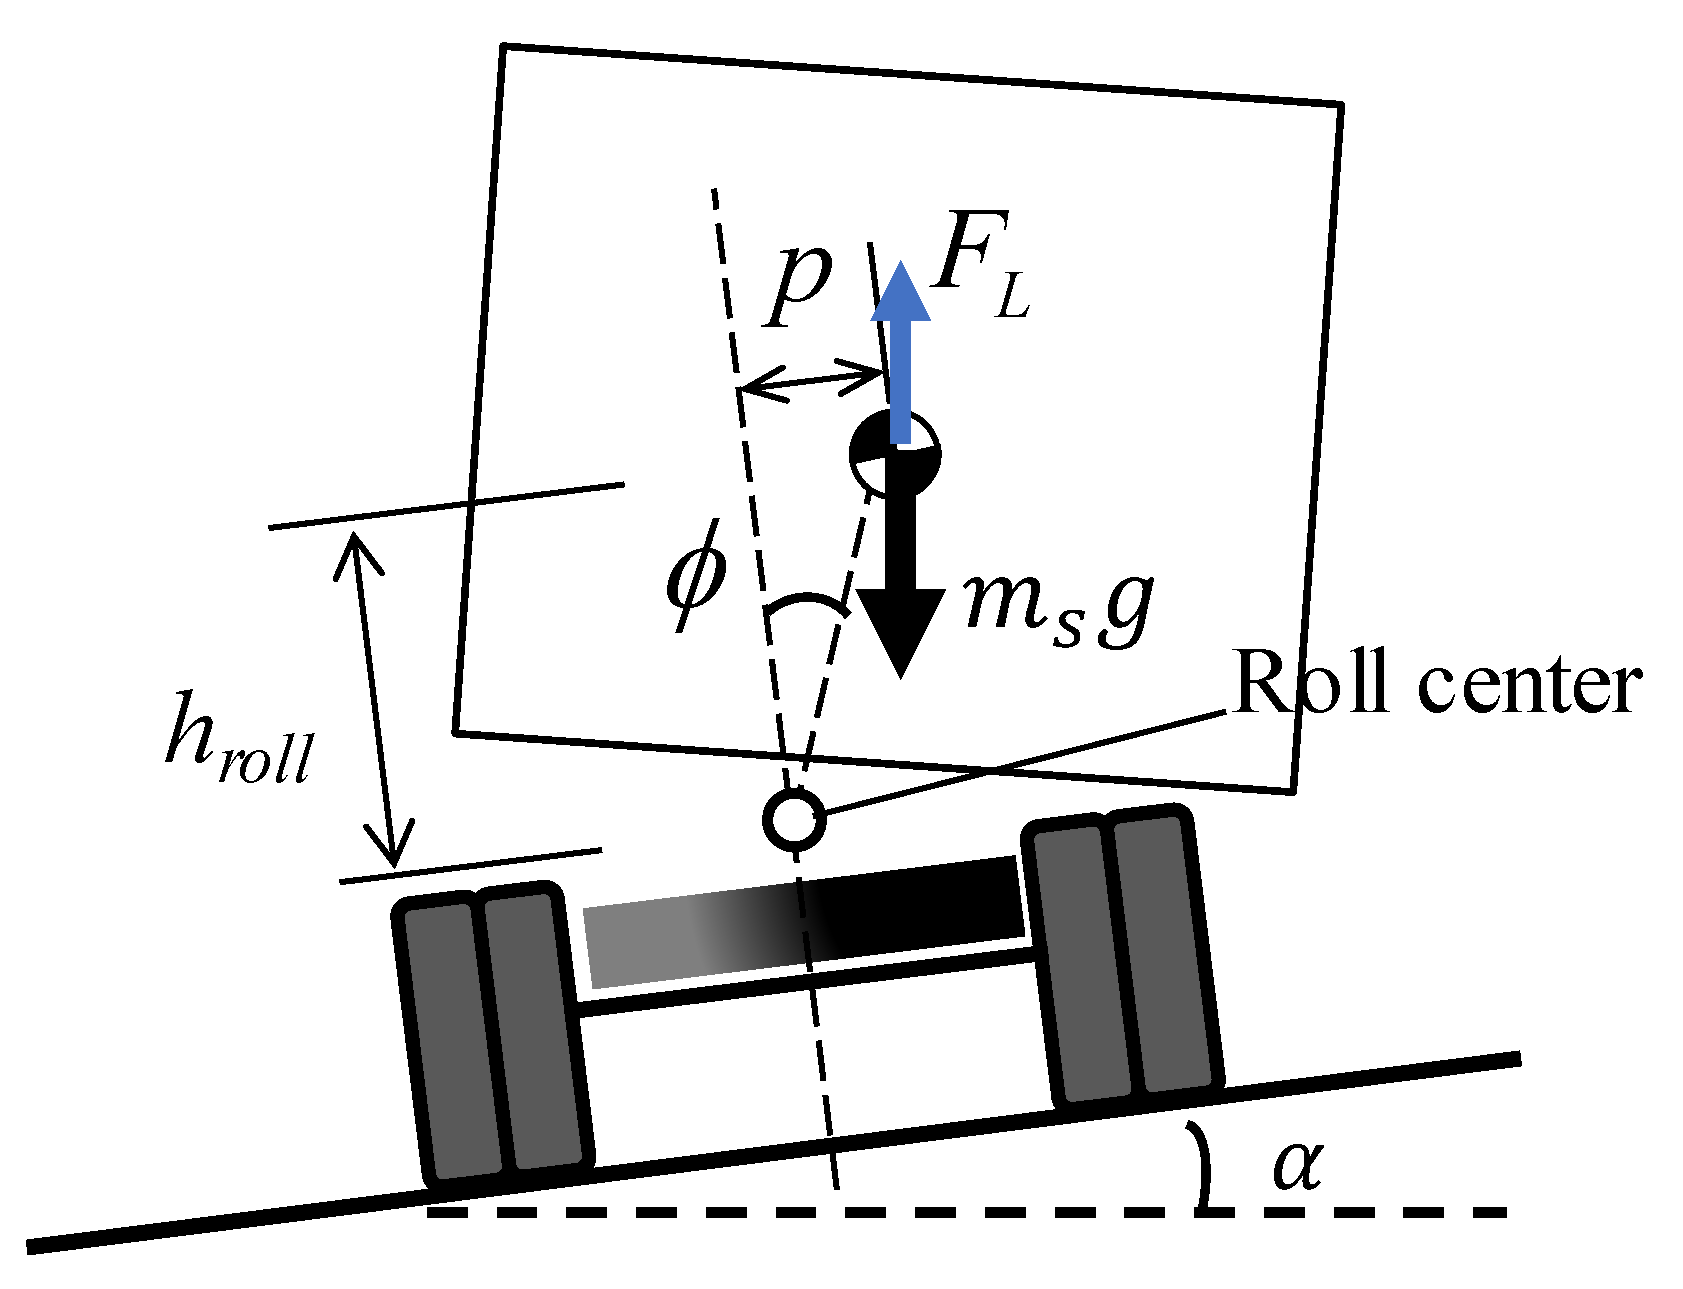
3.3. Enhanced Quasi-Static Approach Considering an Additional Rolling Moment

A modification of the equilibrium equation was proposed for an enhanced quasi-static approach that could consider an additional rolling moment for the trailer. According to Figure 9, the additional rolling moment can be calculated as shown by Equation (24).
M a   =   ( m s g F L ) p cos α
In Equation (24), M a is the additional rolling moment induced by the lateral displacement, p , of the sprung mass, m s . The trailer body rotates relative to the roll center of the sprung mass, as shown in Figure 9, and the lateral displacement, p , is proportional to the roll angle, ϕ , which results in Equation (25).
M a   =   ( m s g F L ) ϕ h r o l l cos α
In Equation (25), h r o l l is the height of the roll center from the road surface. If the roll stiffness of the trailer, K ϕ , is given, Equation (26) is the equilibrium.
K ϕ ϕ   =   M R + ( ( F S + m s v 2 R ) cos α + ( F L m s g ) sin α ) · h r o l l + M a
From Equations (25) and (26), the roll angle ϕ can be derived as follows, which is similar to an equation proposed by Gillespie [13].
ϕ   =   M R + ( ( F S + m s v 2 R ) cos α + ( F L m s g ) sin α ) · h r o l l K ϕ ( m s g F L ) h r o l l cos α  
From Equations (25) and (27), the additional rolling moment, M a , could be calculated. The additional moment, M a , should be added to the right-hand side of Equation (12), as shown in Equation (28), which results in an enhanced quasi-static approach for a trailer.
c 2 ( F z 3 F z 2 ) + h T F y f   =   M R ' + M a + h c F S '
Figure 10 clearly shows the enhancement in the estimated vertical reaction forces when the proposed enhanced quasi-static approach is utilized. The data for h r o l l (=1.035 m) and K ϕ (=8.5 kN·m/degree) were obtained from the TruckSim model. Accordingly, the accuracy of the vertical reaction force estimation for a trailer could be improved by adopting the proposed enhanced quasi-static approach when the roll stiffness information is available.

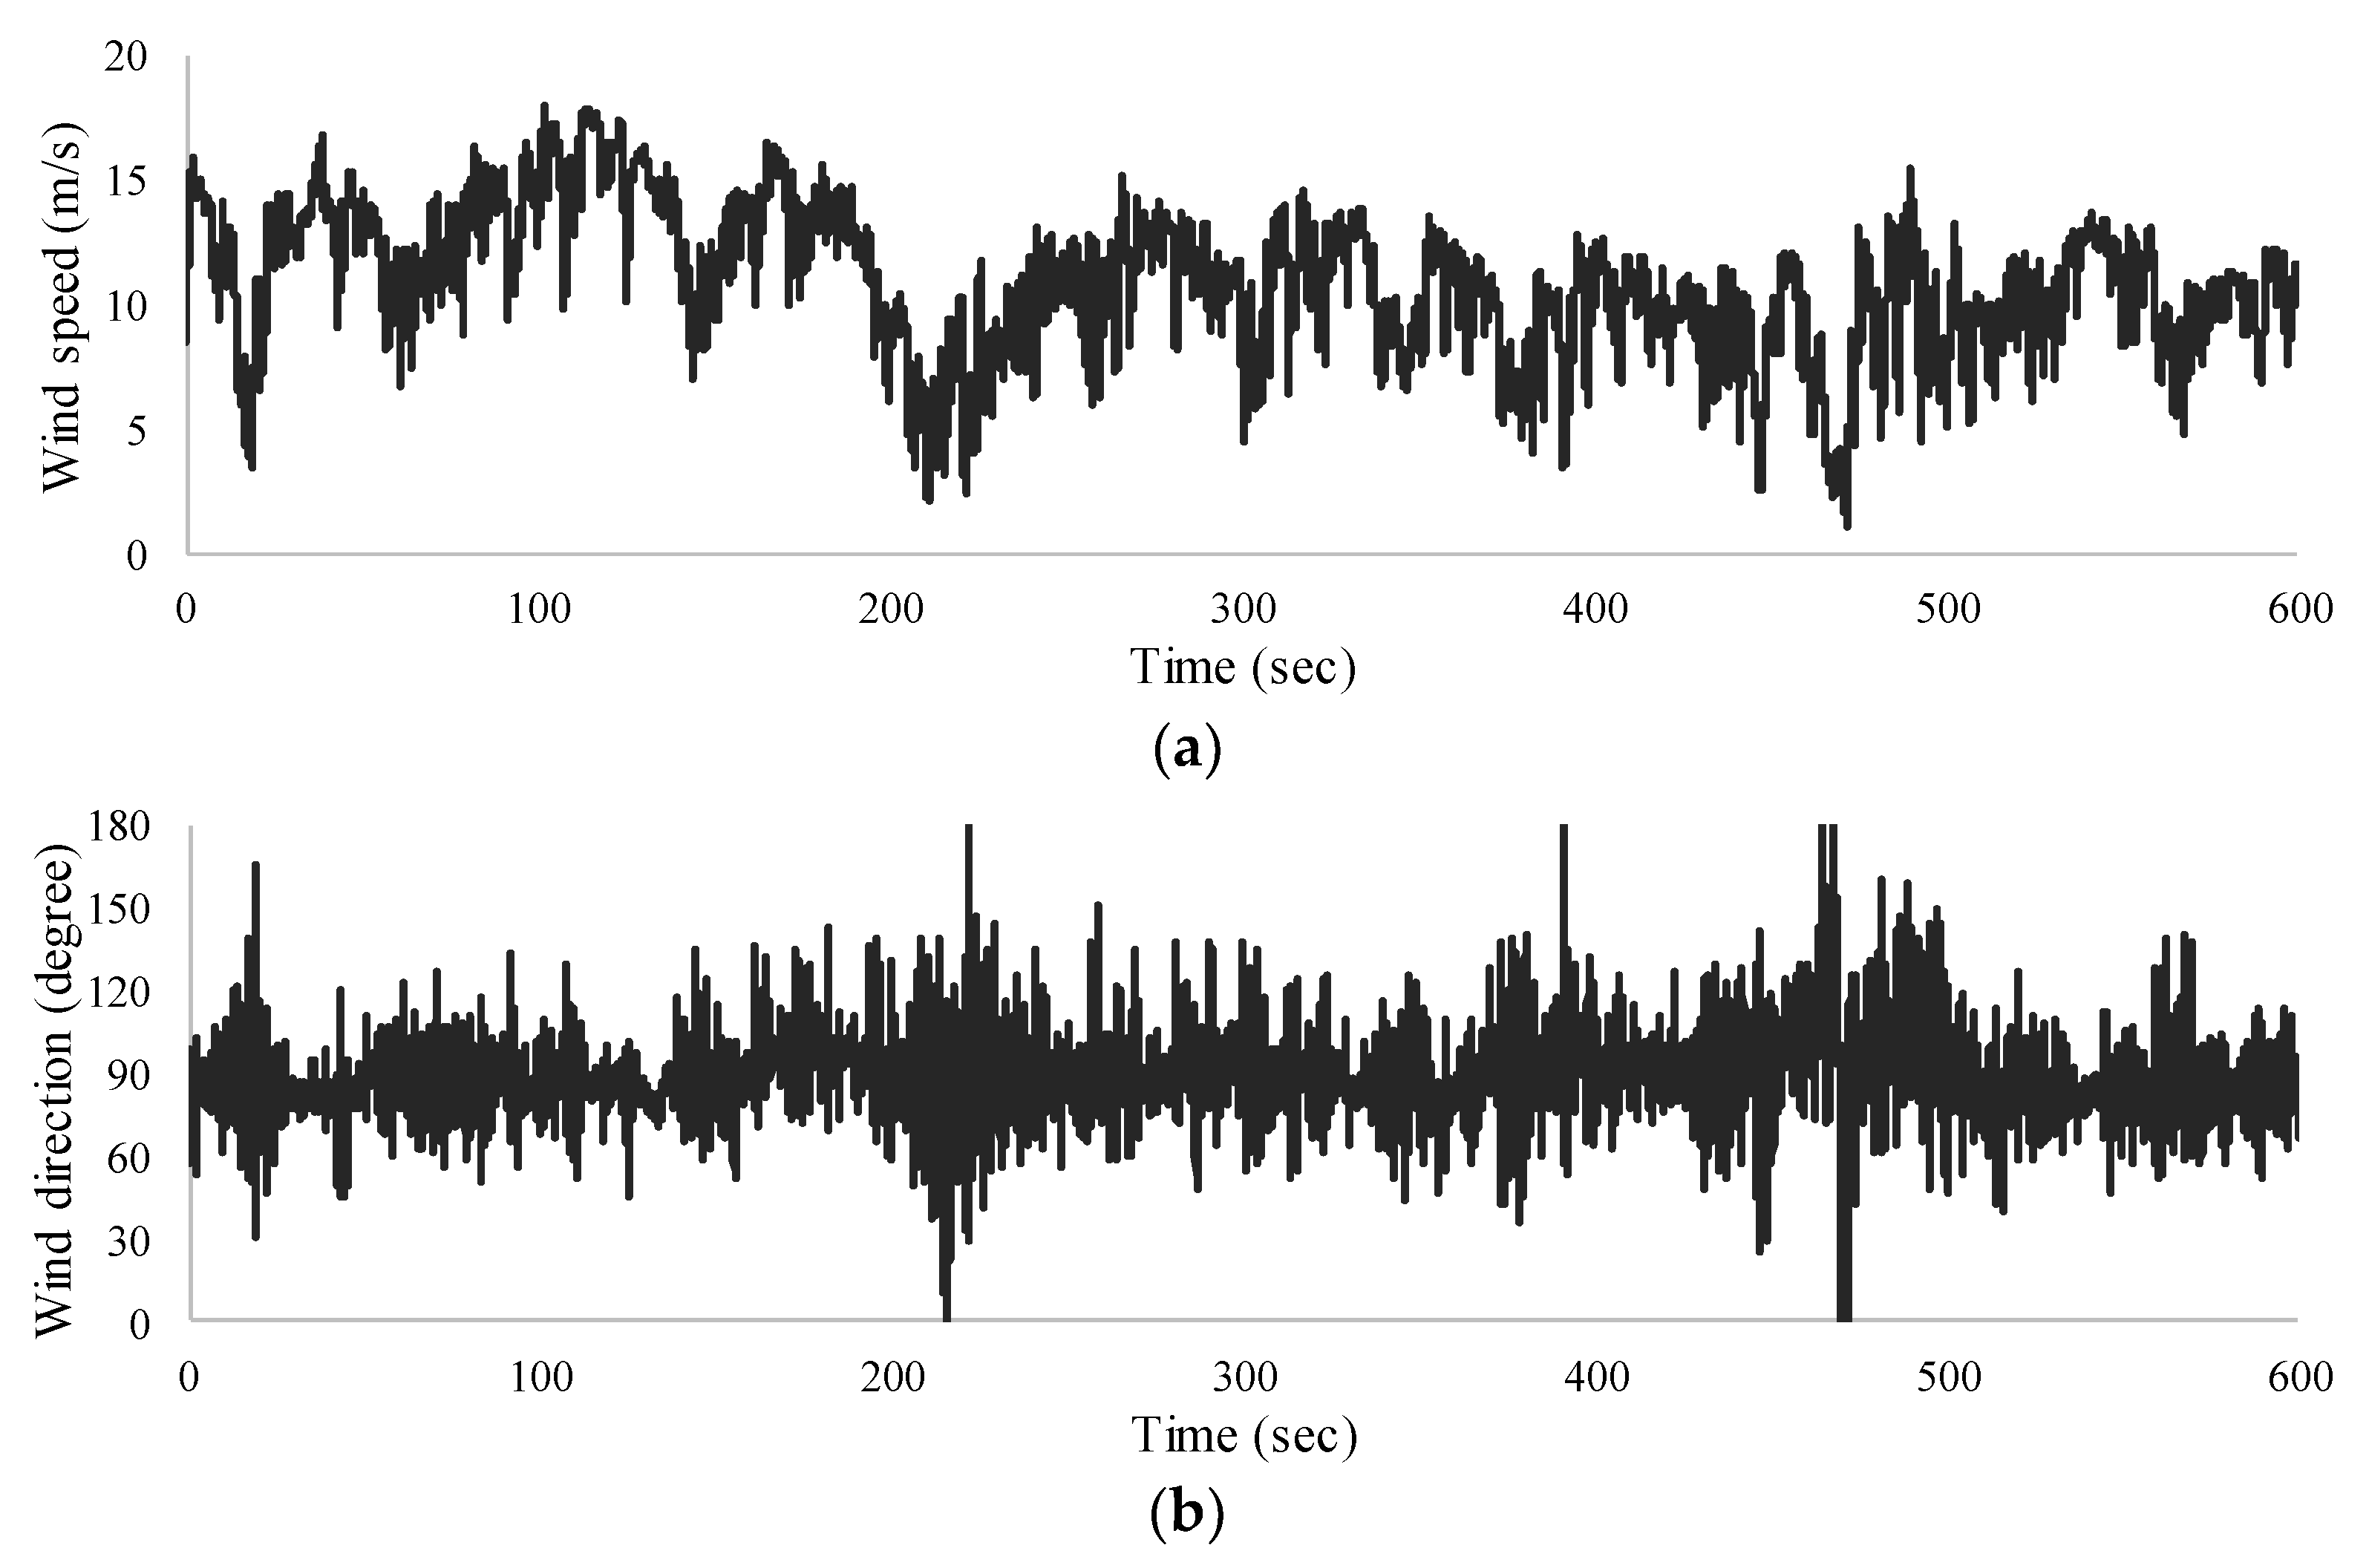
4. Feasibility of the Quasi-Static Approach Under Turbulent Winds

Since overturning and side-slip accidents are particularly vulnerable to high wind speeds during a short period of time, the vehicle safety must be assessed under turbulent wind conditions. Both wind speed and wind direction change over time. Accordingly, the feasibility of the quasi-static approach under time-varying wind conditions should be further examined. Gradual changes in the traveling direction of a vehicle and the cant effect for a curved road were also taken into consideration in the evaluation of tire forces. The time histories of the six components of aerodynamic forces were obtained using Equations (15) and (16) and fed into the equilibrium Equations (9)–(14) by neglecting the aerodynamic admittance effect due to turbulence.

4.1. Enhanced Quasi-Static Approach Considering an Additional Rolling Moment

The wind data measured at the tops of the pylons, located at 182 m from the sea level, of an actual sea-crossing cable-stayed bridge were utilized for the feasibility analysis of quasi-static and dynamic procedures for turbulent winds. The data were collected with a sampling rate of 100 Hz for a duration of 10 min during a typhoon. Since the wind speed measured at the top of the pylon was too high to investigate the triggering of vehicle instability, the magnitude of the wind speed was scaled down by half, as shown in Figure 11a. The time history of the wind direction is also given in Figure 11b. The 10 min average and standard deviations in wind speeds were 10.8 m/s and 2.9 m/s, respectively. Wind data for a duration of 1 min were utilized in the analysis. The wind direction was measured in the direction of a running vehicle at a starting point of 1 min for analysis in the clockwise direction. A vehicle speed of 40 km/h was assumed on a curved road with a curvature radius of 700 m at a cant of 2%. The total analysis time was 70 s, which includes the stabilization time, and the wind direction was modified according to the direction of a vehicle running on a curved road. The tire forces were evaluated at a time step of 0.01 s in the quasi-static approach and of 0.001 s in the dynamic approach.
Figure 12 and Figure 13 show the tire forces for the van and the trailer, respectively, for the 1 min turbulent wind. According to these figures, under turbulent wind conditions, the quasi-static approach also provided results that were comparable to those of the dynamic approach. First, we will discuss lateral friction forces. A comparison of the quasi-static and dynamic approaches in Figure 12b shows slight differences in the lateral friction forces of the front axle of the van. The difference originated from the application of sophisticated tire dynamics on a curved road in the TruckSim analysis, which was not further investigated in the present study. Meanwhile, Figure 13b shows that the lateral tire friction of the trailer obtained by the dynamic approach oscillated around that of the quasi-static approach, which was not observed under uniform wind conditions. This was due to the fluctuation components of wind velocity, which excited the trailer body in a dynamic fashion.
We identified larger differences in the vertical reaction forces than in the lateral friction forces, as shown in Figure 12a and Figure 13a. In the case of the van, the minimum vertical reaction forces from the quasi-static and dynamic approaches were 2.61 and 3.07 kN, respectively. However, when the same stiffness and the same position of the suspension springs was applied to all tires in the dynamic approach, the minimum vertical reaction force was reduced to 2.45 kN, which approximates that of the quasi-static approach. The cause of the difference was previously identified under a uniform wind velocity.
A difference of approximately 10% was identified between the two approaches with respect to the vertical reaction forces of the trailer, as shown in Figure 13a. As with uniform wind velocity, the enhanced quasi-static approach was also applied to the trailer. Figure 14a shows the time history of the vertical reaction forces acting on a windward tire obtained from the enhanced quasi-static approach, and Figure 14b lists the results for the first 10 s. As shown in Figure 14a, the enhanced quasi-static approach provided a vertical reaction force that approximated that of the dynamic approach. This illustrates how the difference in Figure 13a originated from the additional moment induced by the lateral displacement of the sprung mass, as was demonstrated in the uniform wind velocity case. As Figure 14b demonstrates, however, the phase and frequency for the two approaches changed within a smaller time duration due to the effect of the suspension model in the dynamic approach. However, this effect was not critical in estimating the magnitude of the vertical reaction forces of the tire. Accordingly, the feasibility of the enhanced quasi-static approach for the safety assessment of trailers was successfully demonstrated even under turbulent wind conditions.

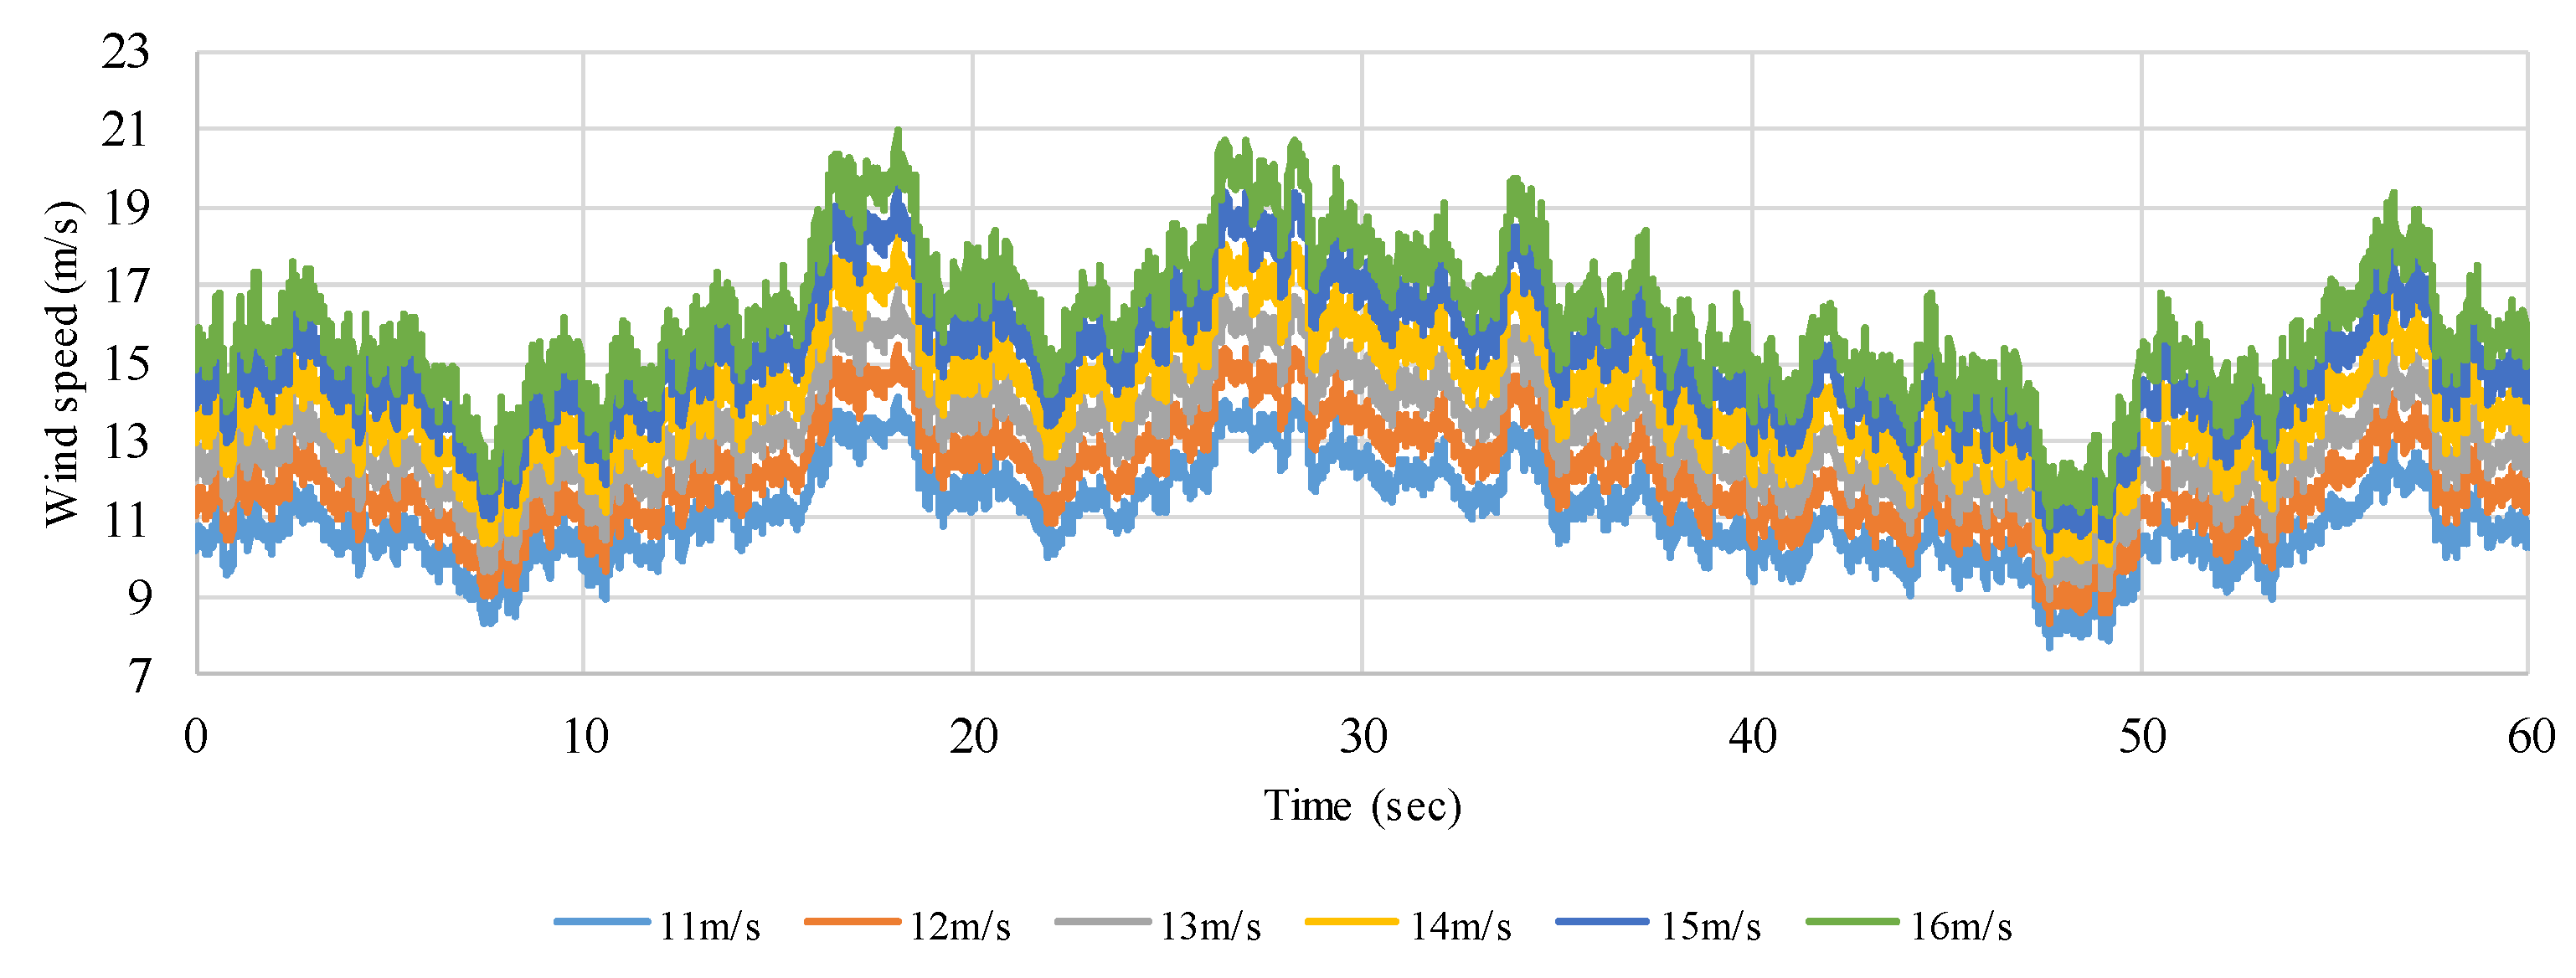
4.2. Comparison of Tire Forces Under Various Mean Wind Speeds

Variations in tire forces were further compared under various mean wind speeds. The data from 1 min fluctuations in horizontal wind speeds were artificially generated for various mean wind speeds by utilizing a wave-superposition approach to the Von-Karman spectrum [14]. Values for a turbulence intensity and length scale of 13.1% and 100 m, respectively, were assumed to approximate the approaching wind conditions for a sea-crossing bridge deck at the level of 50 m [15]. The mean wind speed was increased by an increment of 1 m/s. By applying the same random number for different wind speeds, we generated a similar pattern of time histories for turbulent wind speeds, as shown in Figure 15.
Minimum vertical reaction forces and maximum friction forces were obtained during 1 min patterns of turbulent winds for each mean wind speed. Moreover, based on the variations in tire forces, the critical wind speed was determined for both side-slip and overturning accidents. The limits for the states of the two accident types are defined as follows [2]:
  • Side-slip: when one of the axles reaches the friction limit
  • Overturning: when one of the vertical reaction forces of the tires becomes zero
The tire friction forces for the van were calculated, and the critical wind speed was determined regarding side-slip accidents, whereas the trailer was examined for an overturning accident based on the vertical reaction forces. The stability of each vehicle was evaluated under conditions whereby the vehicle was running on the same curved road described in Section 4.1. The coefficient of friction, μ , between the tire and the road surface was assumed to be 0.8 for a dry road condition [16]. The vehicle speed was set at 40 km/h, and the oncoming wind had an incident angle of 90 degrees to the vehicle direction as it entered the curved road ( R   =   700   m , α   =   2 % ).
The variations in the tire friction forces and critical wind speeds of the van were evaluated for the possibility of a side-slip accident. The front axle was examined for the possibility of a side-slip accident because the front axle reaches the friction limit state earlier than the rear axle does. The definition of the normalized friction force, F f ¯ , was introduced in Equation (29) as the friction force divided by the vertical tire forces. According to [17], the friction force increased in a linear fashion until the occurrence of tire slip, at which point it was saturated and road grip was lost when the normalized friction force reached friction coefficient, μ . Therefore, the friction limit state can be defined by Equation (29).
F f ¯   =   F y f 2 + ( F x 1 + F x 3 ) 2 F z 1 + F z 3 > μ
Figure 16 shows the normalized friction force of the van for the turbulent wind at different mean wind speeds. The normalized friction force was determined as the maximum value from among the 1 min applications of turbulent winds. The normalized friction force obtained from the quasi-static approach showed good agreement with that from the dynamic approach for all wind speeds. The critical wind speed was determined using Equation (29) for the occurrence of a side-slip accident for the van, which was determined to be approximately 21.0 m/s using both approaches.
In order to estimate the critical wind speed for trailers regarding an overturning accident, the vertical reaction forces of the windward tire were obtained for various mean wind speeds. Figure 17 compares the vertical reaction forces estimated using the quasi-static, the enhanced quasi-static, and the dynamic approaches. The differences between the vertical reaction forces estimated using the quasi-static approach and those estimated using the dynamic approach were a result of the additional rolling moment. Consequently, the critical wind speeds differed by approximately 1.3 m/s between the two approaches, as shown in Table 2. On the other hand, the enhanced quasi-static approach, which considers the additional roll moment, provided reaction forces that approximated those of the dynamic approach with a critical wind speed difference of only 0.2 m/s.
According to the findings from the above two case studies, the feasibilities of the quasi-static and the enhanced quasi-static model were confirmed for their use in estimating the tire forces and, as a result, predicting the critical wind speed, even under turbulent wind conditions. The proposed trailer model, however, had one limitation in that the resisting rolling moment at the ball hitch connection was not reflected. Since some large trailers are equipped with moment-resisting hitch models, it would be acceptable to underestimate the overturning safety using the proposed trailer model. This could be considered a conservative assessment of vehicle safety. One can also further develop the trailer model to accommodate a hitch model with high roll-stiffness based on the formulation done for the two-axle vehicle in the present study by assuming that the tractor and the trailer rotate together.

5. Conclusions

This paper examines the feasibility of using the quasi-static approach in evaluating the reaction forces of tires, which could be utilized to limit the occurrences of overturning and side-slip accidents of vehicles under strong side winds. The performance of the quasi-static approach was examined by comparing the calculated tire forces to calculations using the dynamic vehicle analysis software, TruckSim. The governing equations were formulated for two types of vehicle, vans and trailers, by taking force-equilibrium, compatibility conditions, and several assumptions into consideration. The centrifugal forces created by the curvature and cant of a curved road were also considered. Both uniform and turbulent wind conditions were applied. Based on this feasibility study, the following conclusions were drawn:
  • The quasi-static approach for the van model provided vertical and lateral tire forces that were similar to those estimated using the dynamic approach for both turbulent and uniform winds. However, the quasi-static approach showed a discrepancy in vertical forces when the stiffness of the suspensions differed between the front and rear axles. According to the present case study, however, this discrepancy in the quasi-static approach would not prevent it from being considered a conservative estimation of vehicle safety.
  • The quasi-static approach for the trailer model also created lateral tire forces similar to those created by the dynamic approach for both turbulent and uniform winds. However, the quasi-static approach returned a certain discrepancy in vertical forces by neglecting the additional rolling moment induced by a large lateral offset in the sprung mass. Accordingly, this study proposed an enhanced quasi-static approach for the trailer model, which added the rolling moment effect to the equilibrium equation. The vertical tire forces estimated by the enhanced quasi-static approach agreed well with those estimated by the dynamic analysis. However, additional information on both the roll stiffness and the position of the roll center are required for the enhanced quasi-static approach.
  • The realistic modeling of a suspension system in the dynamic approach resulted in an attenuation of the high-frequency components and a phase lag in the time history of the vertical tire force when the vehicle was exposed to turbulent winds. However, the magnitude and overall variations in the reaction forces of the quasi-static approach were in good agreement with those in the dynamic approach.
  • The critical wind speeds estimated by the quasi-static approach were almost identical to those used in the dynamic approach for the parameters of both side-slip and overturning accidents. Accordingly, the proposed quasi-static vehicle model is an efficient alternative to the dynamic model in estimating vehicle safety against strong side winds.

Author Contributions

Conceptualization, S.-J.K. and H.-K.K.; methodology, S.-J.K. and H.-K.K.; software, S.-J.K.; validation, S.-J.K. and H.-K.K.; formal analysis, S.-J.K.; investigation, S.-J.K.; writing—original draft preparation, S.-J.K.; writing—review and editing, H.-K.K.; supervision, H.-K.K.

Funding

This research was supported by a Grant (19SCIP-B119963-04) from the Ministry of Land, Infrastructure and Transport of the Korean Government through the Korea Bridge Design and Engineering Research Center (KBRC) at Seoul National University. This work was also supported by a National Research Foundation of Korea (NRF) grant funded by the Korean government (MSIT) (2017R1A2B4008973).

Conflicts of Interest

The authors declare no conflict of interest. The funders had no role in the design of the study; in the collection, analyses, or interpretation of data; in the writing of the manuscript, or in the decision to publish the results.

References

  1. The Weather Network. SCARY: Vehicles Are Thrown around on Bridge in Japan during Typhoon Jebi. Available online: https://www.youtube.com/watch?v=9yLx3mOxeVQ (accessed on 4 September 2018).
  2. Kim, S.J.; Yoo, C.H.; Kim, H.K. Vulnerability assessment for the hazards of crosswinds when vehicles cross a bridge deck. J. Wind Eng. Ind. Aerodyn. 2016, 156, 62–71. [Google Scholar] [CrossRef] [Green Version]
  3. Baker, C.J. A simplified analysis of various types of wind-induced road vehicle accidents. J. Wind Eng. Ind. Aerodyn. 1986, 22, 69–85. [Google Scholar] [CrossRef]
  4. Xu, Y.L.; Guo, W.H. Dynamic analysis of coupled road vehicle and cable-stayed bridge systems under turbulent wind. Eng. Struct. 2003, 25, 473–486. [Google Scholar] [CrossRef]
  5. Chen, S.R.; Cai, C.S. Accident assessment of vehicles on long-span bridges in windy environments. J. Wind Eng. Ind. Aerodyn. 2004, 92, 991–1024. [Google Scholar] [CrossRef]
  6. Mechanical Simulation Corporation. TruckSim User Manual; Mechanical Simulation Corporation: Ann Arbor, MI, USA, 2016. [Google Scholar]
  7. Zhou, Y.; Chen, S. Vehicle ride comfort analysis with whole-body vibration on long-span bridges subjected to crosswind. J. Wind. Eng. Ind. Aerodyn. 2016, 155, 126–140. [Google Scholar] [CrossRef] [Green Version]
  8. Baker, C.J. A framework for the consideration of the effects of crosswinds on trains. J. Wind Eng. Ind. Aerodyn. 2013, 123, 130–142. [Google Scholar] [CrossRef]
  9. Baker, C.J. Risk analysis of pedestrian and vehicle safety in windy environments. J. Wind Eng. Ind. Aerodyn. 2015, 147, 283–290. [Google Scholar] [CrossRef]
  10. Batista, M.; Perkovič, M. A simple static analysis of moving road vehicle under crosswind. J. Wind Eng. Ind. Aerodyn. 2014, 128, 105–113. [Google Scholar] [CrossRef]
  11. Chen, S.R.; Chen, F. Simulation-based assessment of vehicle safety behavior under hazardous driving conditions. J. Transp. Eng. 2009, 136, 304–315. [Google Scholar] [CrossRef]
  12. Baker, C.J. Measures to control vehicle movement at exposed sites during windy periods. J. Wind Eng. Ind. Aerodyn. 1987, 25, 151–161. [Google Scholar] [CrossRef]
  13. Gillespie, T.D. Fundamentals of Vehicle Dynamics; Society of Automotive Engineers: Warrendale, PA, USA, 1992. [Google Scholar]
  14. Simiu, E.; Scanlan, R.H. Wind Effects on Structures: Fundamentals and Applications to Design, 3rd ed.; John Wiley & Sons Inc.: New York, NY, USA, 1996. [Google Scholar]
  15. Strømmen, E. Theory of Bridge Aerodynamics, 2nd ed.; Springer Science & Business Media: Berlin, Germany, 2010. [Google Scholar]
  16. Gustafsson, F. Slip-based tire-road friction estimation. Automatica 1997, 33, 1087–1099. [Google Scholar] [CrossRef]
  17. Grip, H.F.; Imsland, L.; Johansen, T.A.; Kalkkuhl, J.C.; Suissa, A. Vehicle sideslip estimation. IEEE Control Syst. Mag. 2009, 29, 36–52. [Google Scholar]
Figure 1. Applied actions and corresponding tire forces of two-axle vehicles.
Applsci 09 03377 g001
Figure 2. Applied actions and corresponding tire forces of trailers.
Applsci 09 03377 g002
Figure 3. Vehicle speed v , true wind speed w , and apparent wind speed V .
Applsci 09 03377 g003
Figure 4. External forces acting on the vehicle on a curved road with a cant.
Applsci 09 03377 g004
Figure 5. Aerodynamic coefficients according to wind direction for: (a) van and (b) tractor-trailer.
Applsci 09 03377 g005aApplsci 09 03377 g005b
Figure 6. Tire forces of windward front axle of the van in uniform wind for: (a) vertical reaction force, (b) lateral friction force.
Applsci 09 03377 g006
Figure 7. Tire forces of the trailer in uniform wind: (a) vertical reaction force of windward wheel, (b) lateral friction force.
Applsci 09 03377 g007
Figure 8. Windward vertical reaction force of the van with equal stiffness of suspension in front and rear axles.
Applsci 09 03377 g008
Figure 9. Additional rolling moment induced by lateral displacement of sprung mass.
Applsci 09 03377 g009
Figure 10. Windward vertical reaction force of the trailer by the enhanced quasi-static approach.
Applsci 09 03377 g010
Figure 11. Time history of wind data: (a) wind speed and (b) wind direction.
Applsci 09 03377 g011
Figure 12. Time histories of tire forces of front axle of the van: (a) vertical and (b) lateral force.
Applsci 09 03377 g012aApplsci 09 03377 g012b
Figure 13. Time histories of reaction forces of the trailer: (a) vertical and (b) lateral force.
Applsci 09 03377 g013
Figure 14. Windward vertical reaction force of the enhanced quasi-static trailer model for (a) whole period and (b) first 10 s.
Applsci 09 03377 g014
Figure 15. Generated wind speed data for the mean wind speeds of 11 m/s–16 m/s.
Applsci 09 03377 g015
Figure 16. Normalized friction force on front axle of the van according to mean wind speed.
Applsci 09 03377 g016
Figure 17. Vertical reaction force of windward tire of each trailer model.
Applsci 09 03377 g017
Table 1. Dimensions and parameters of vehicle models.
Typea (m)b (m)c (m)hc (m)hT (m)A (m2)ms (ton)mf (ton)mr (ton)
Van1.351.751.630.71-6.82.100.150.53
Trailer5.224.781.861.941.107.26.00-0.67
Table 2. Determined critical wind speed for the overturning accident of the trailer.
Quasi-Static ApproachEnhanced Quasi-Static ApproachDynamic Approach
15.2 m/s14.1 m/s13.9 m/s

