Influence of Inflow Turbulence on the Flow Characteristics around a Circular Cylinder


Abstract
:Featured Application
Abstract
1. Introduction
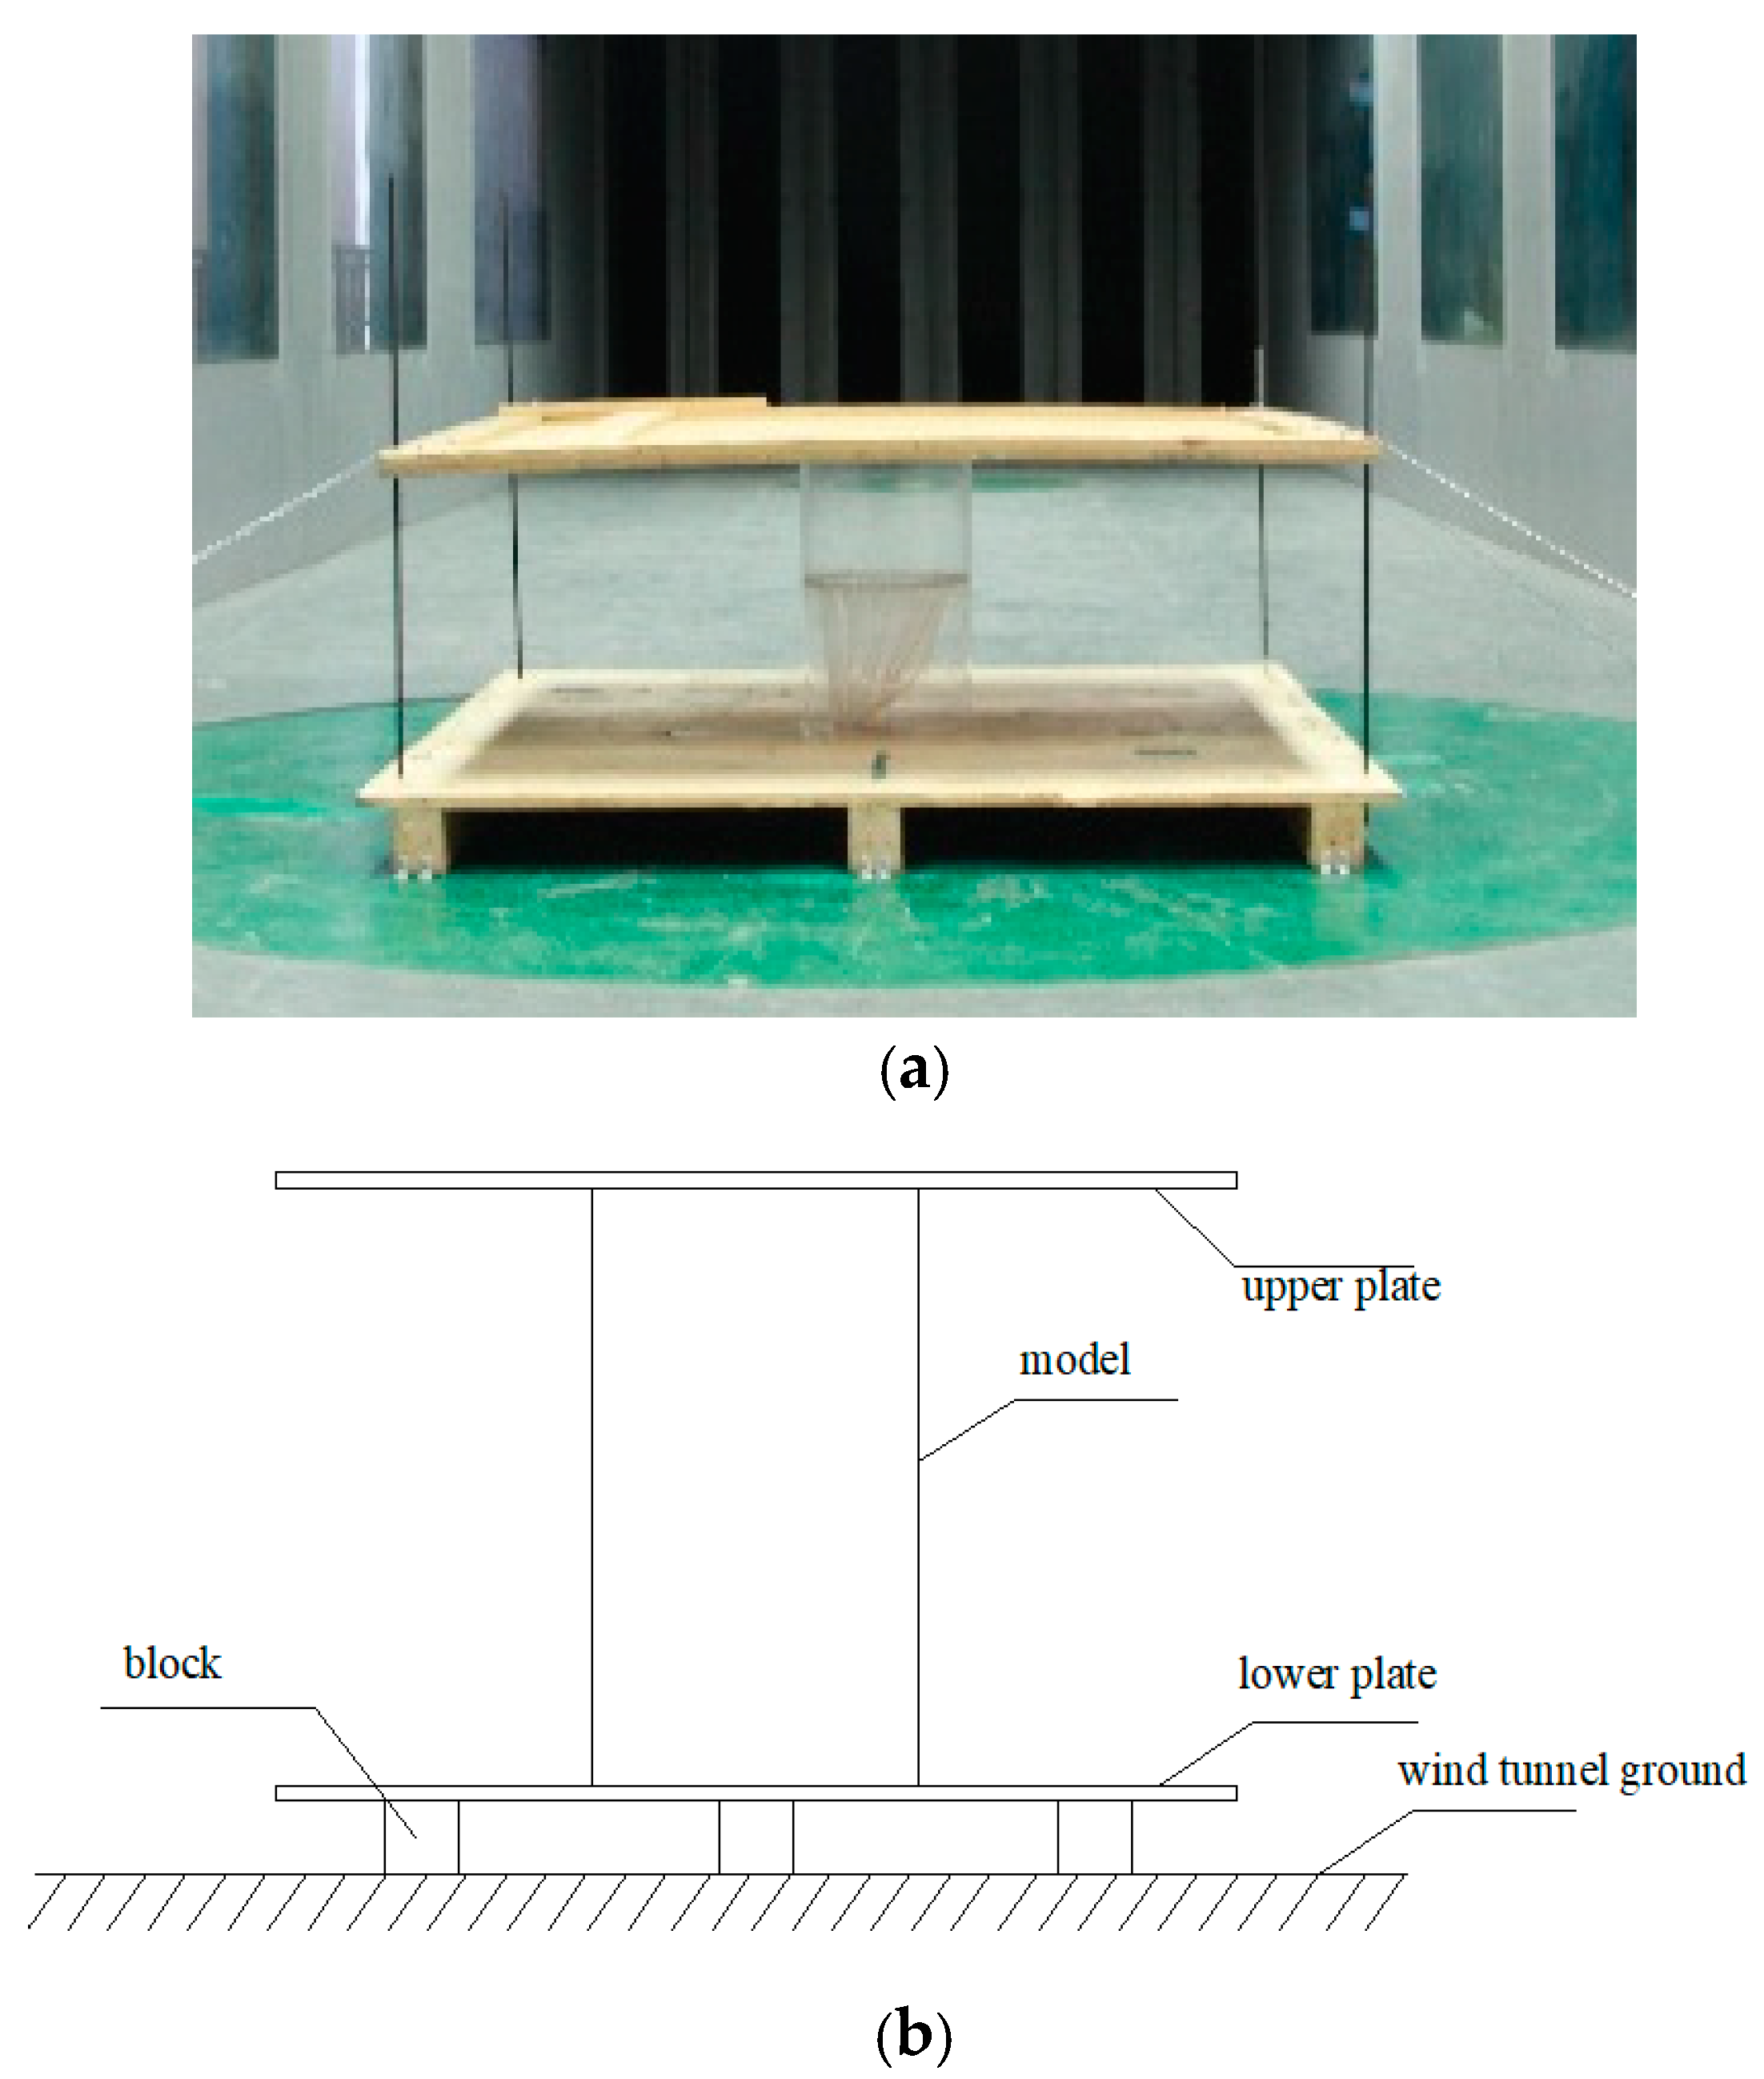
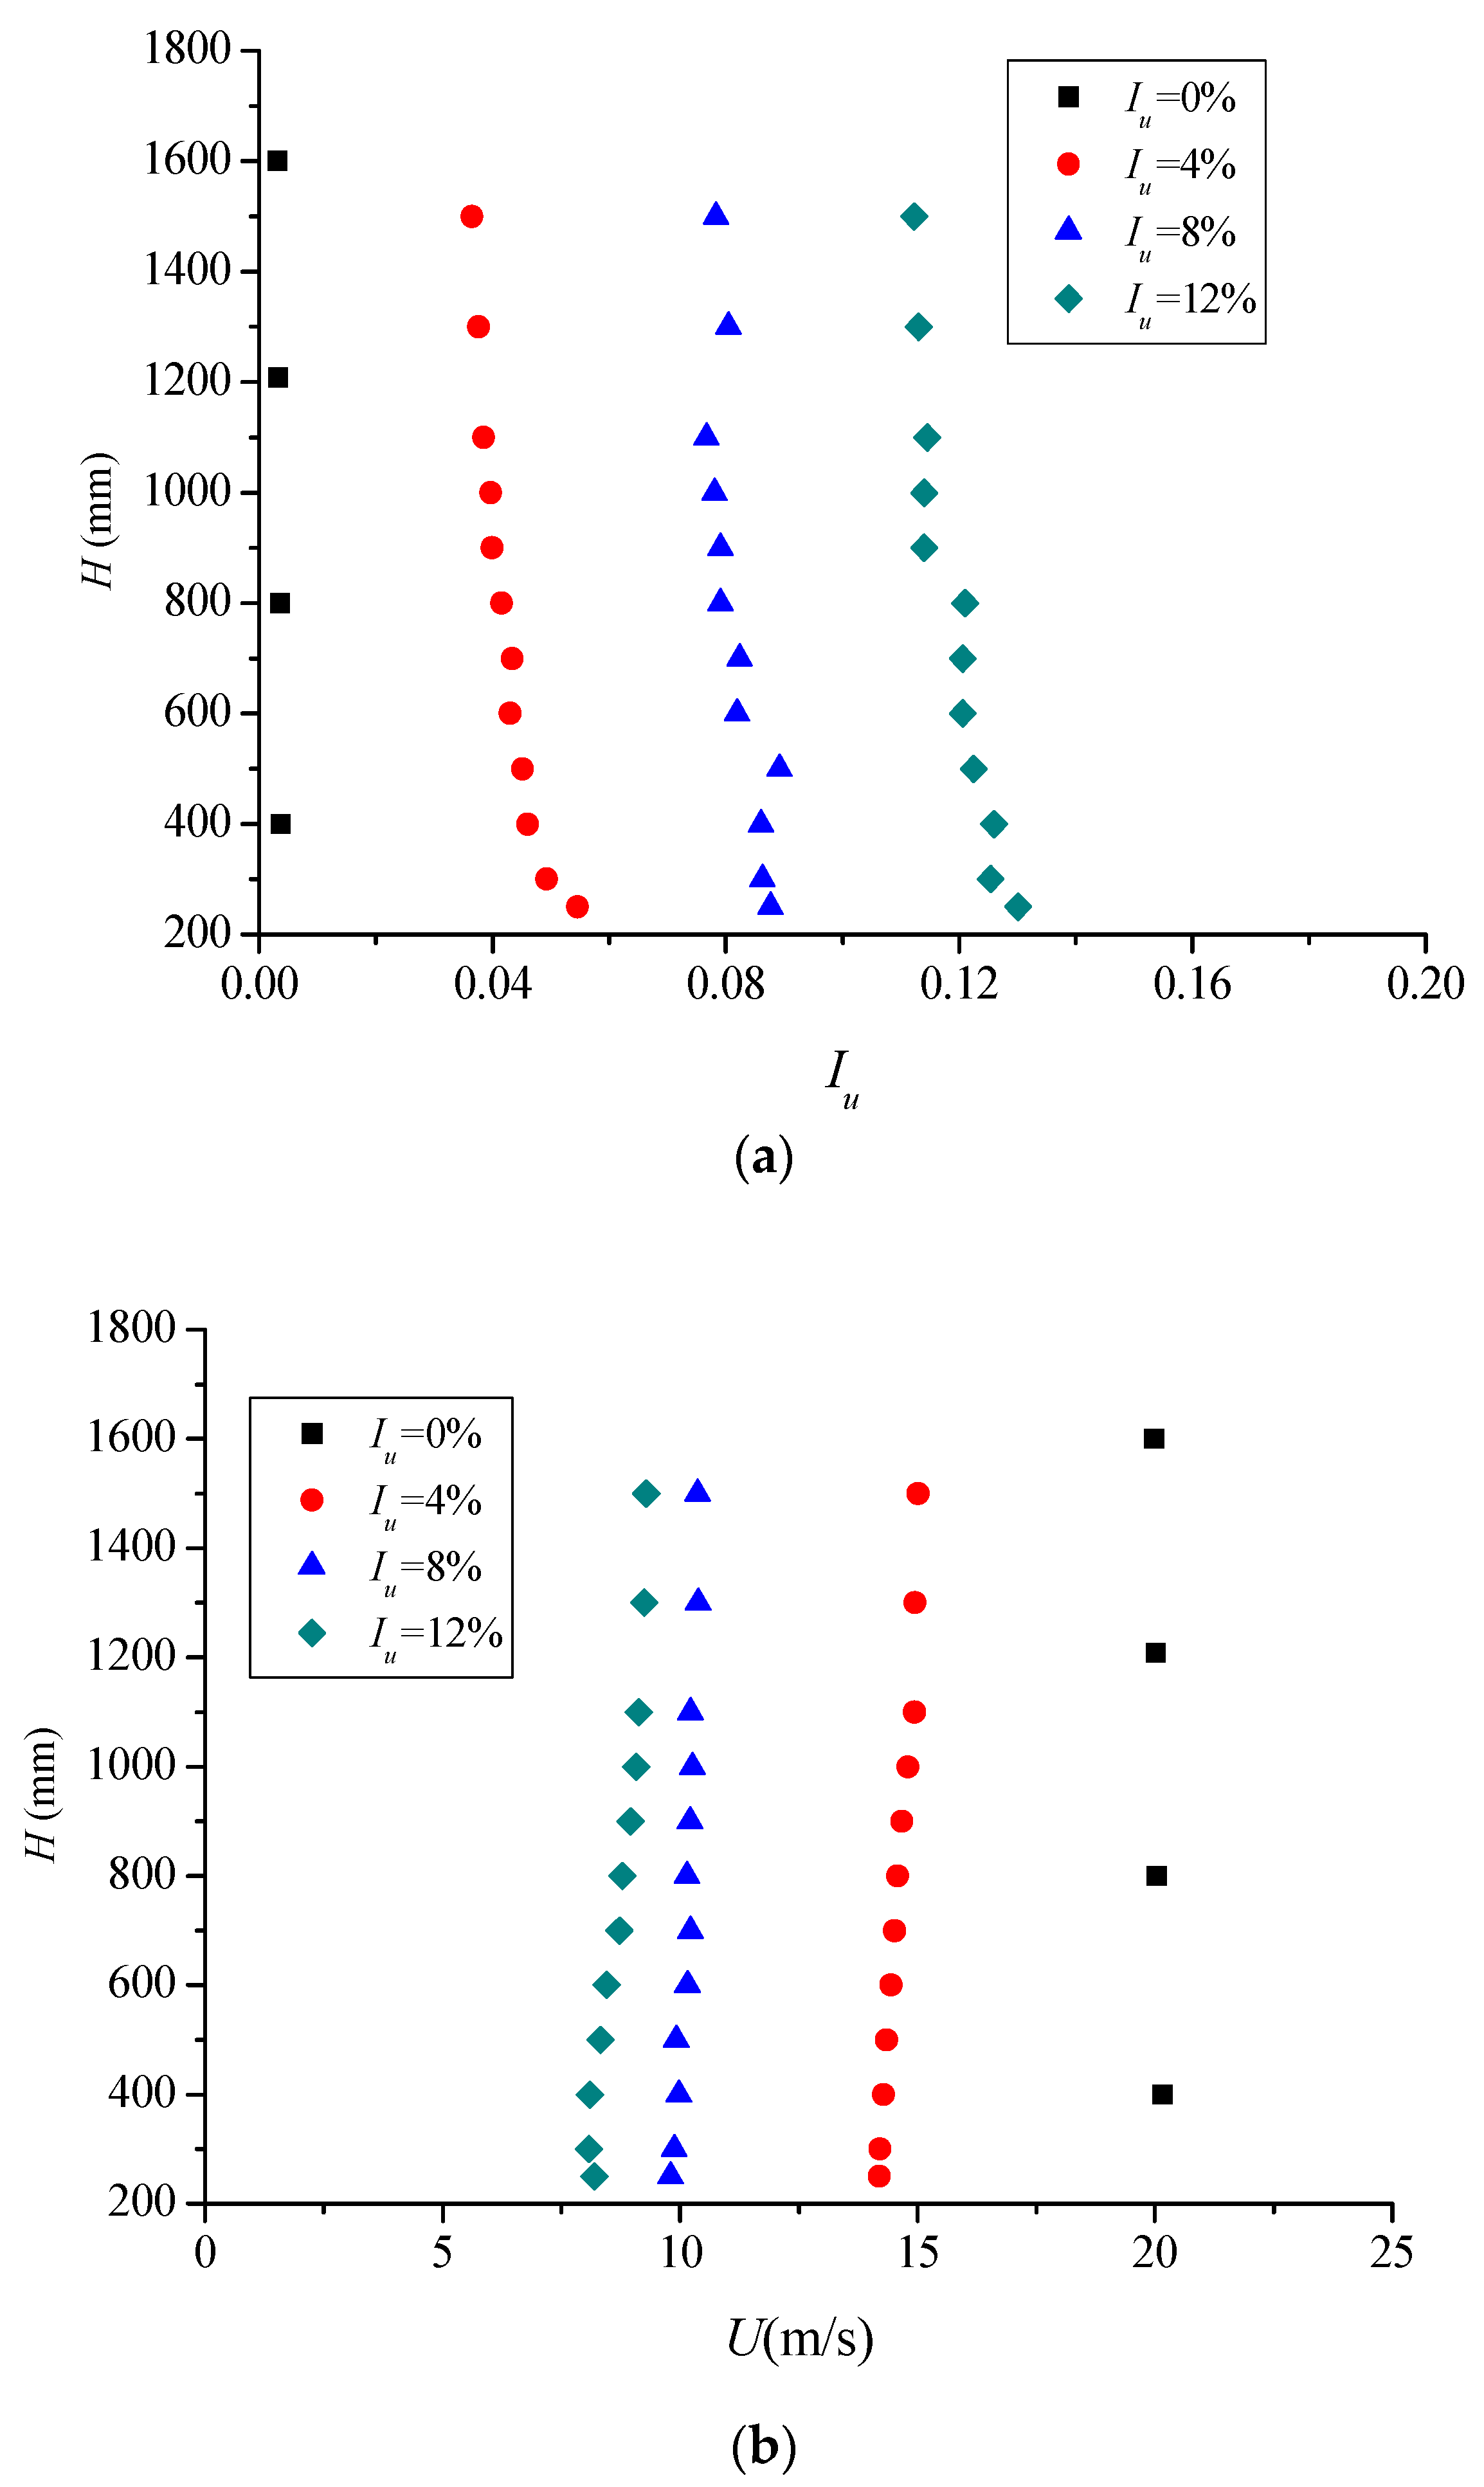
2. Setup of the Wind Tunnel Test
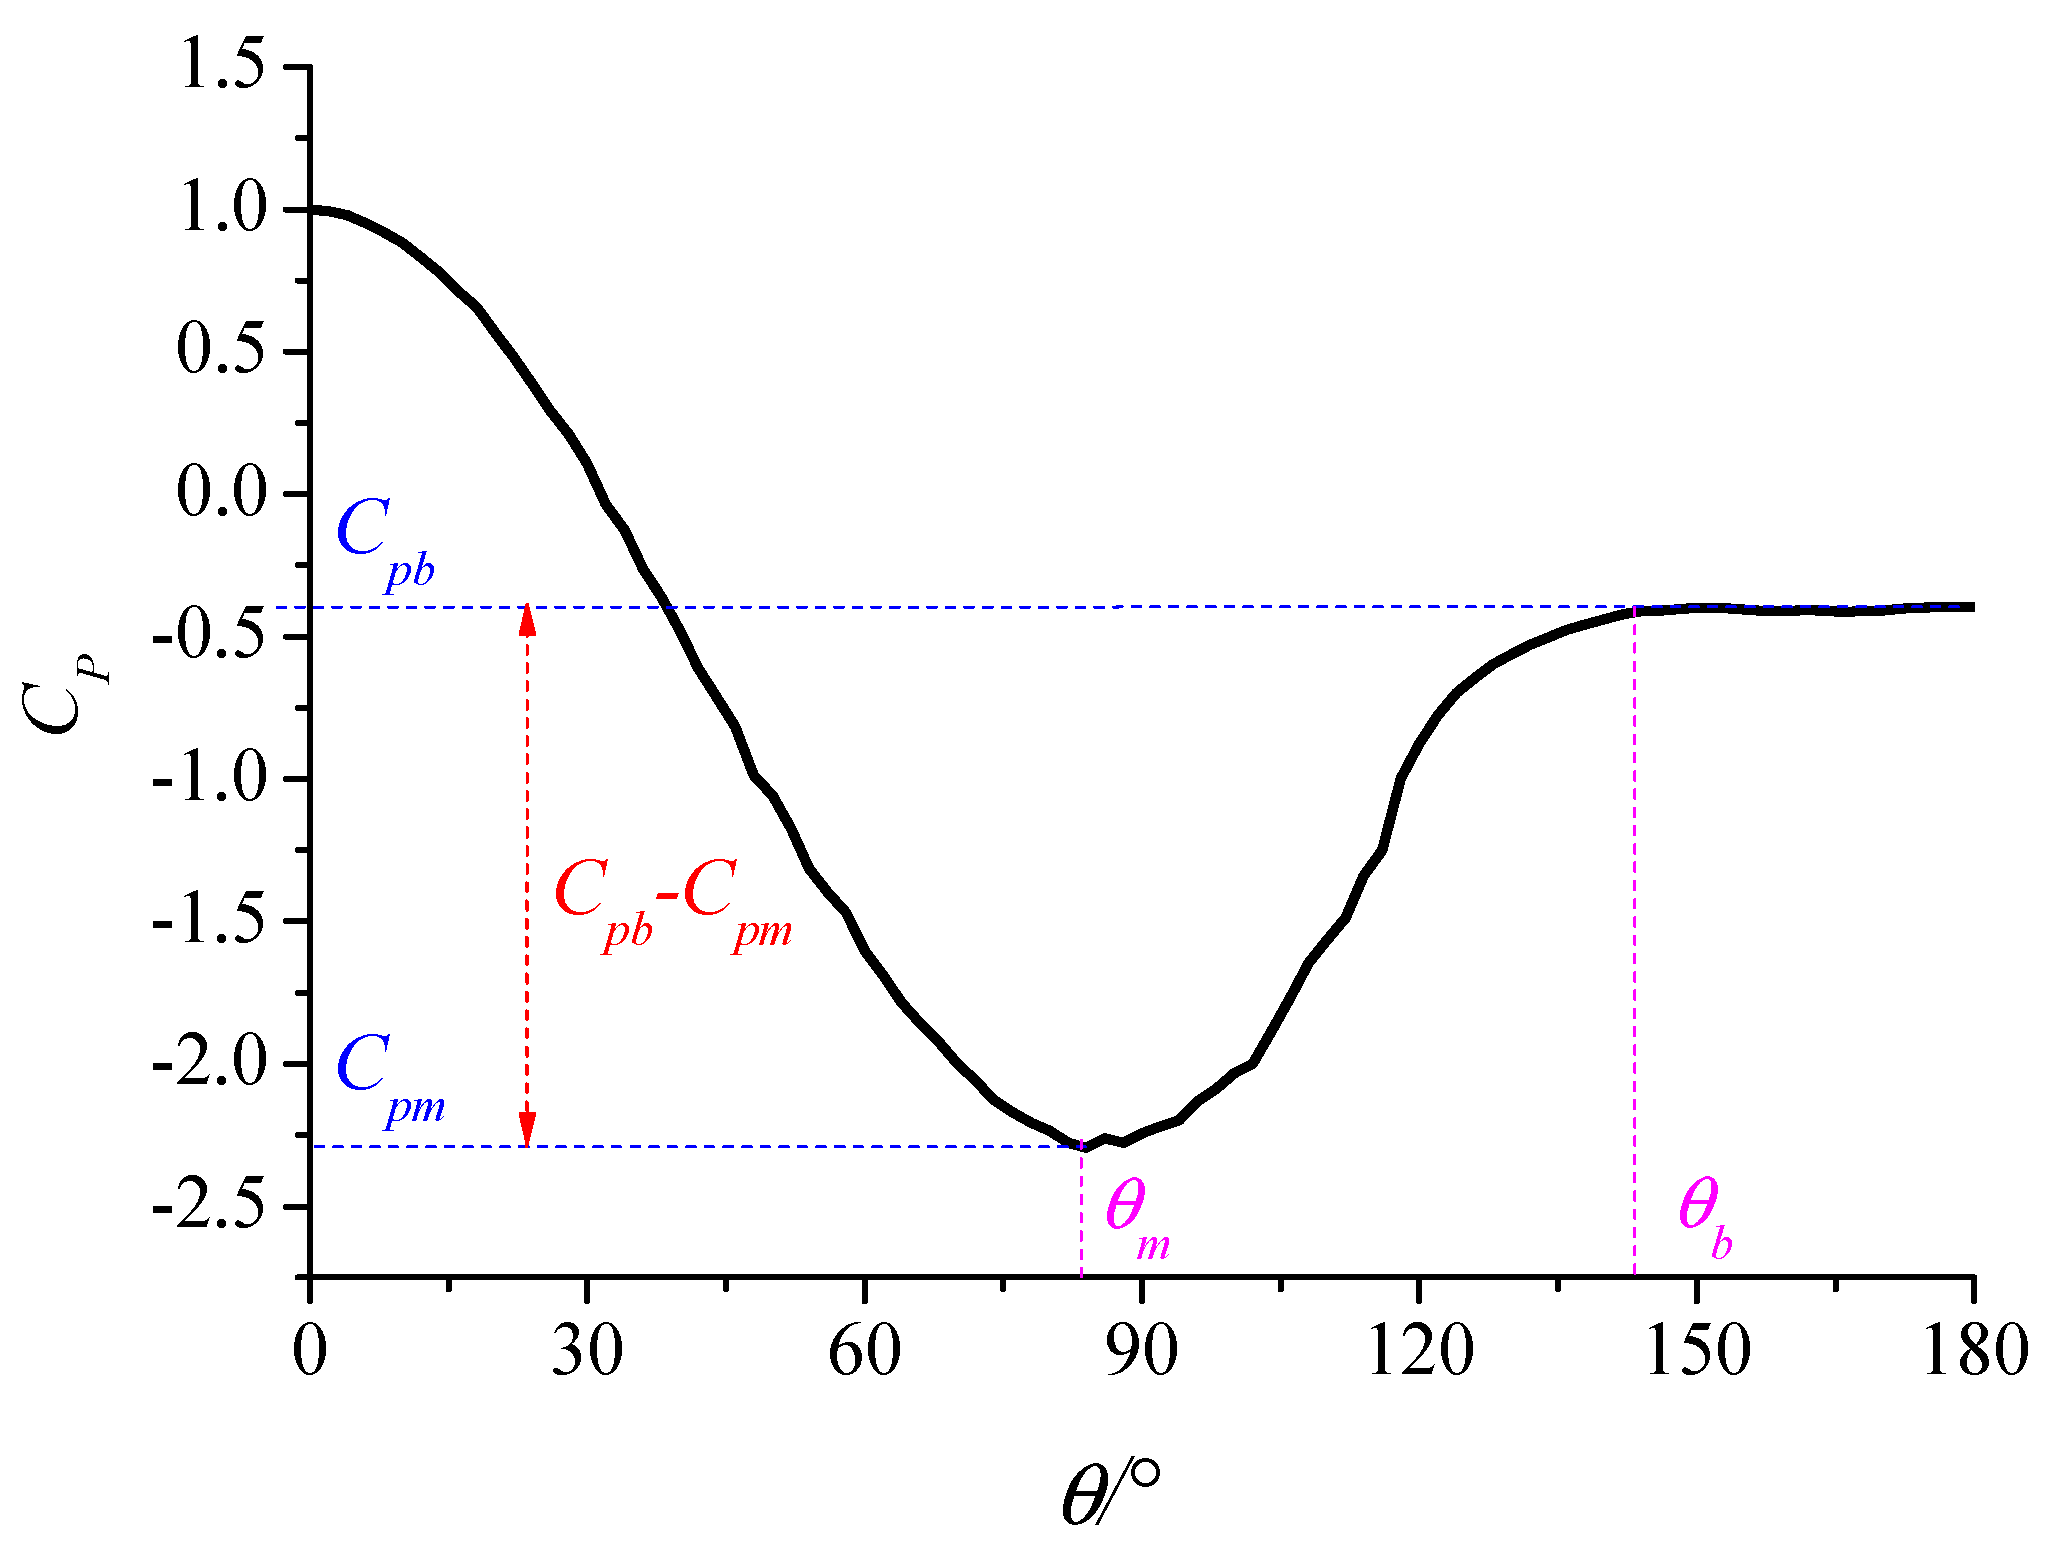
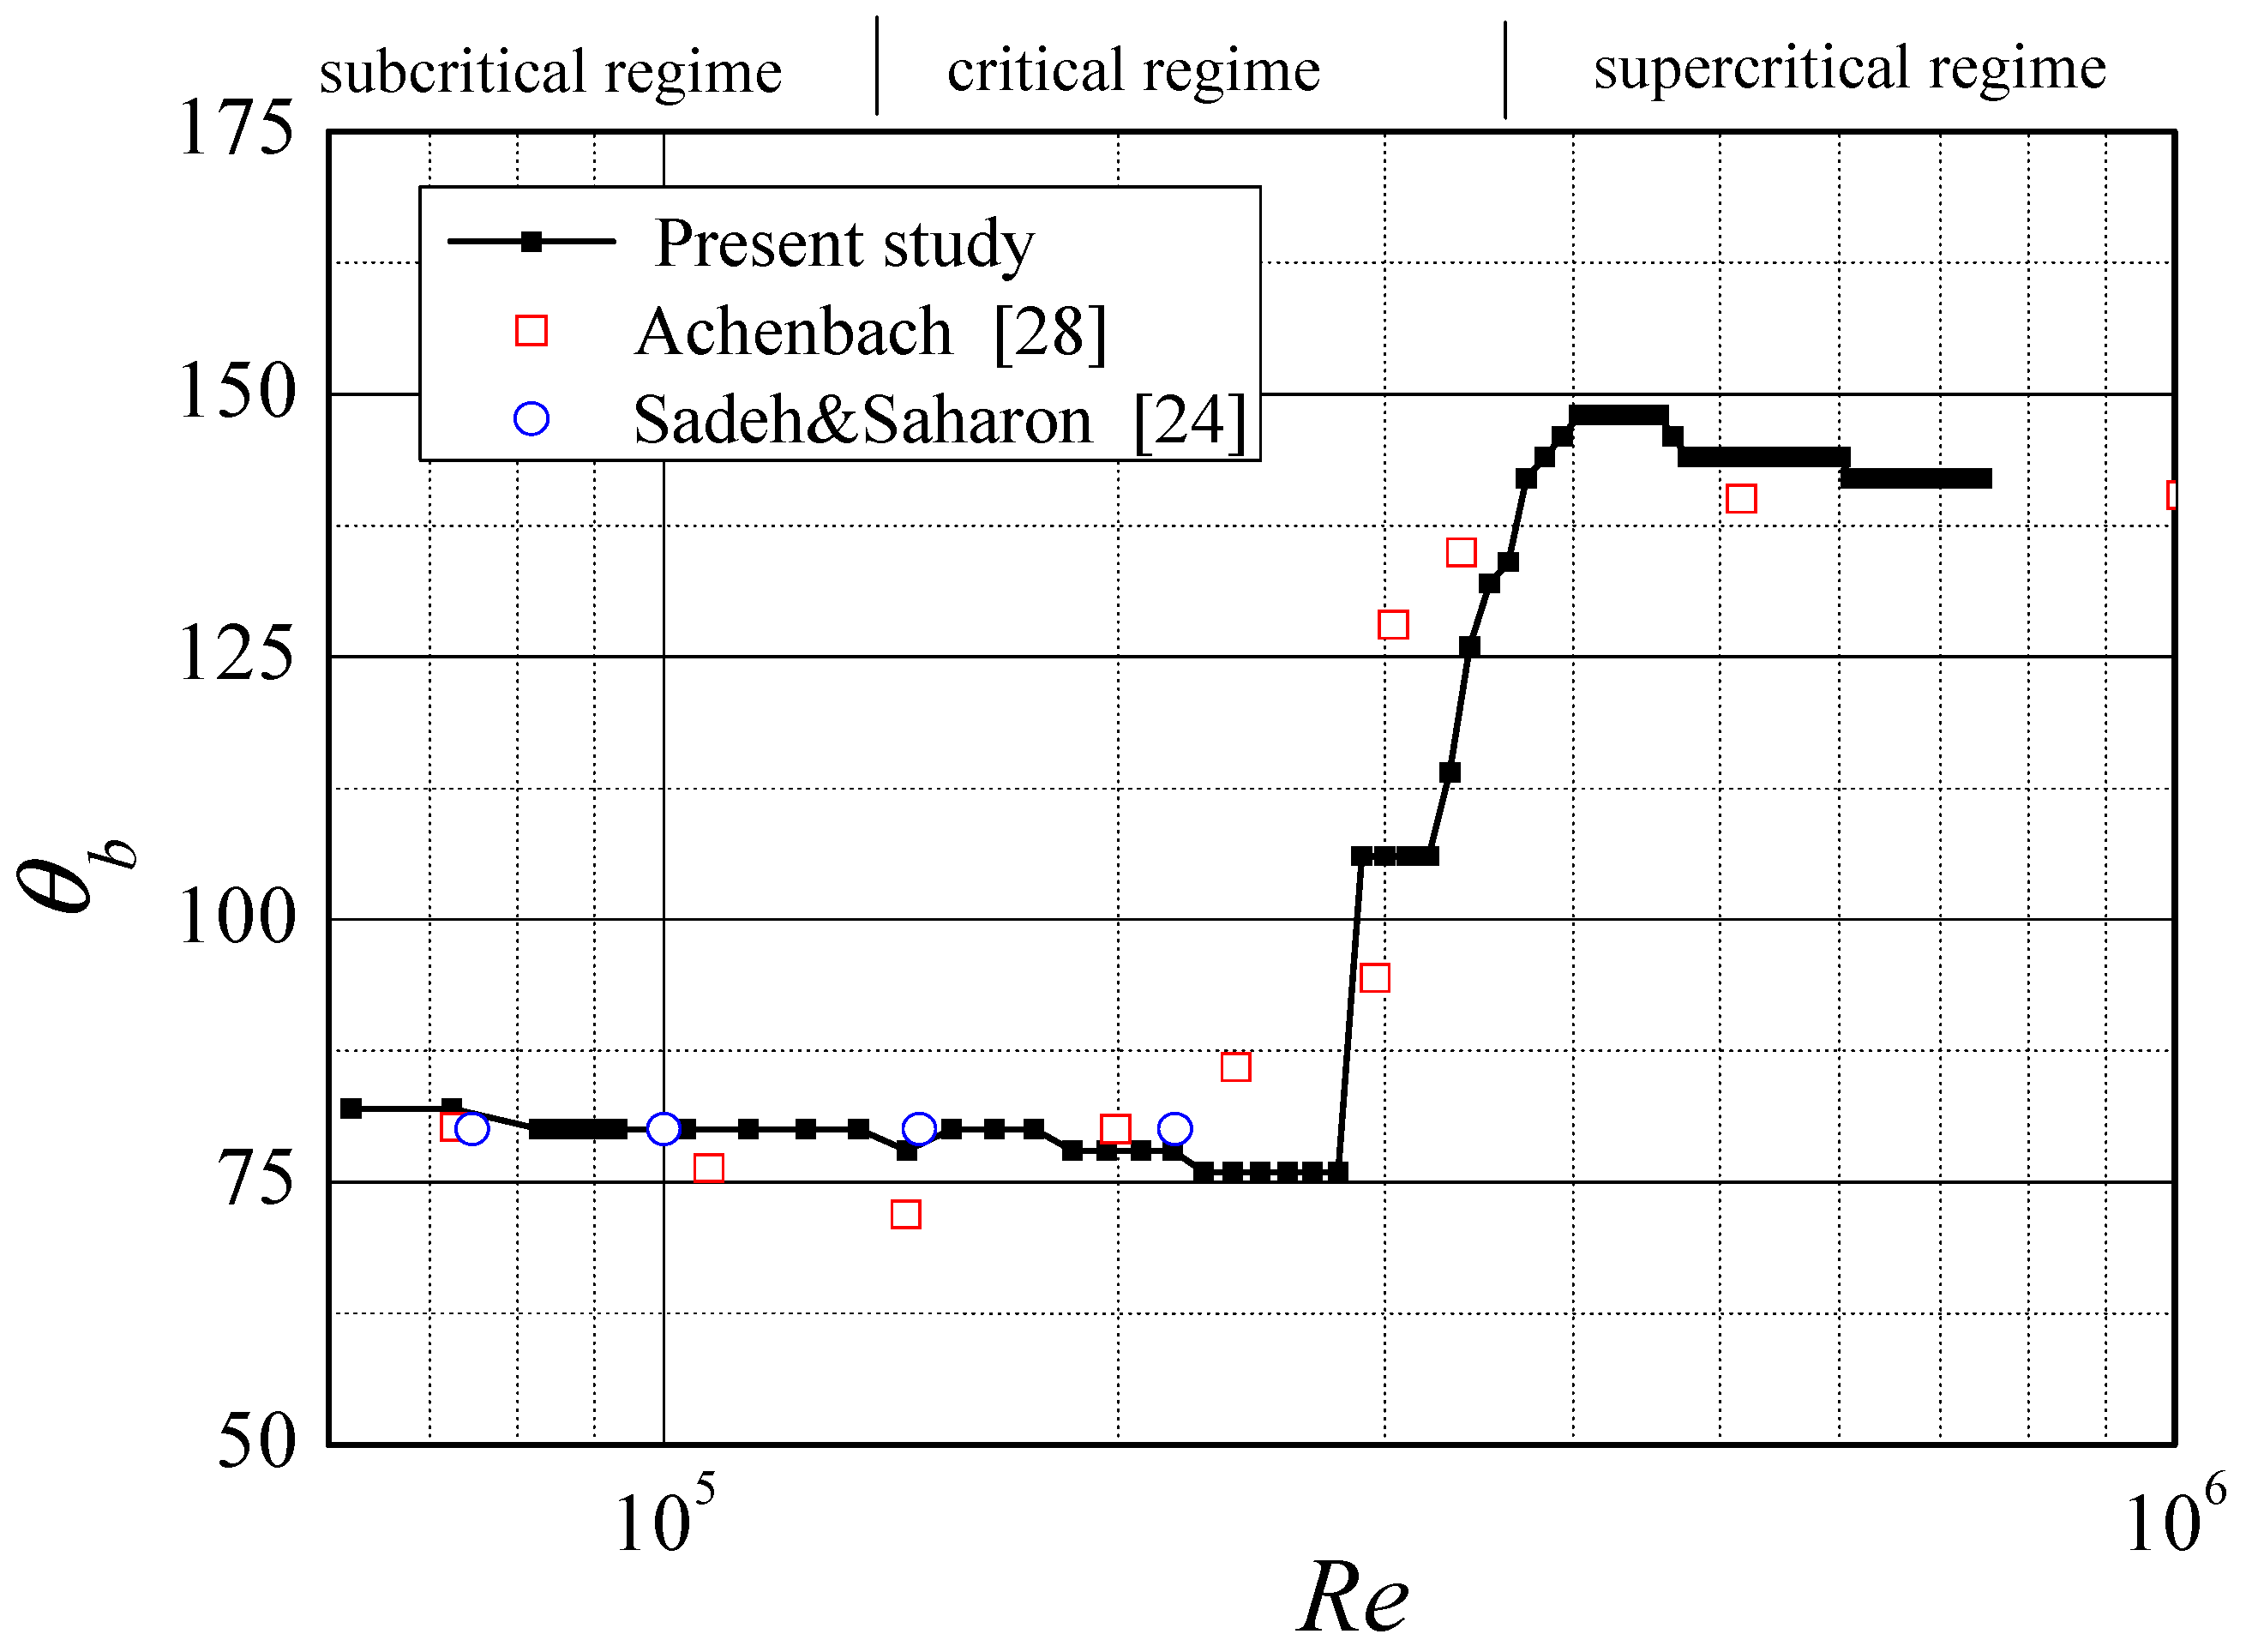
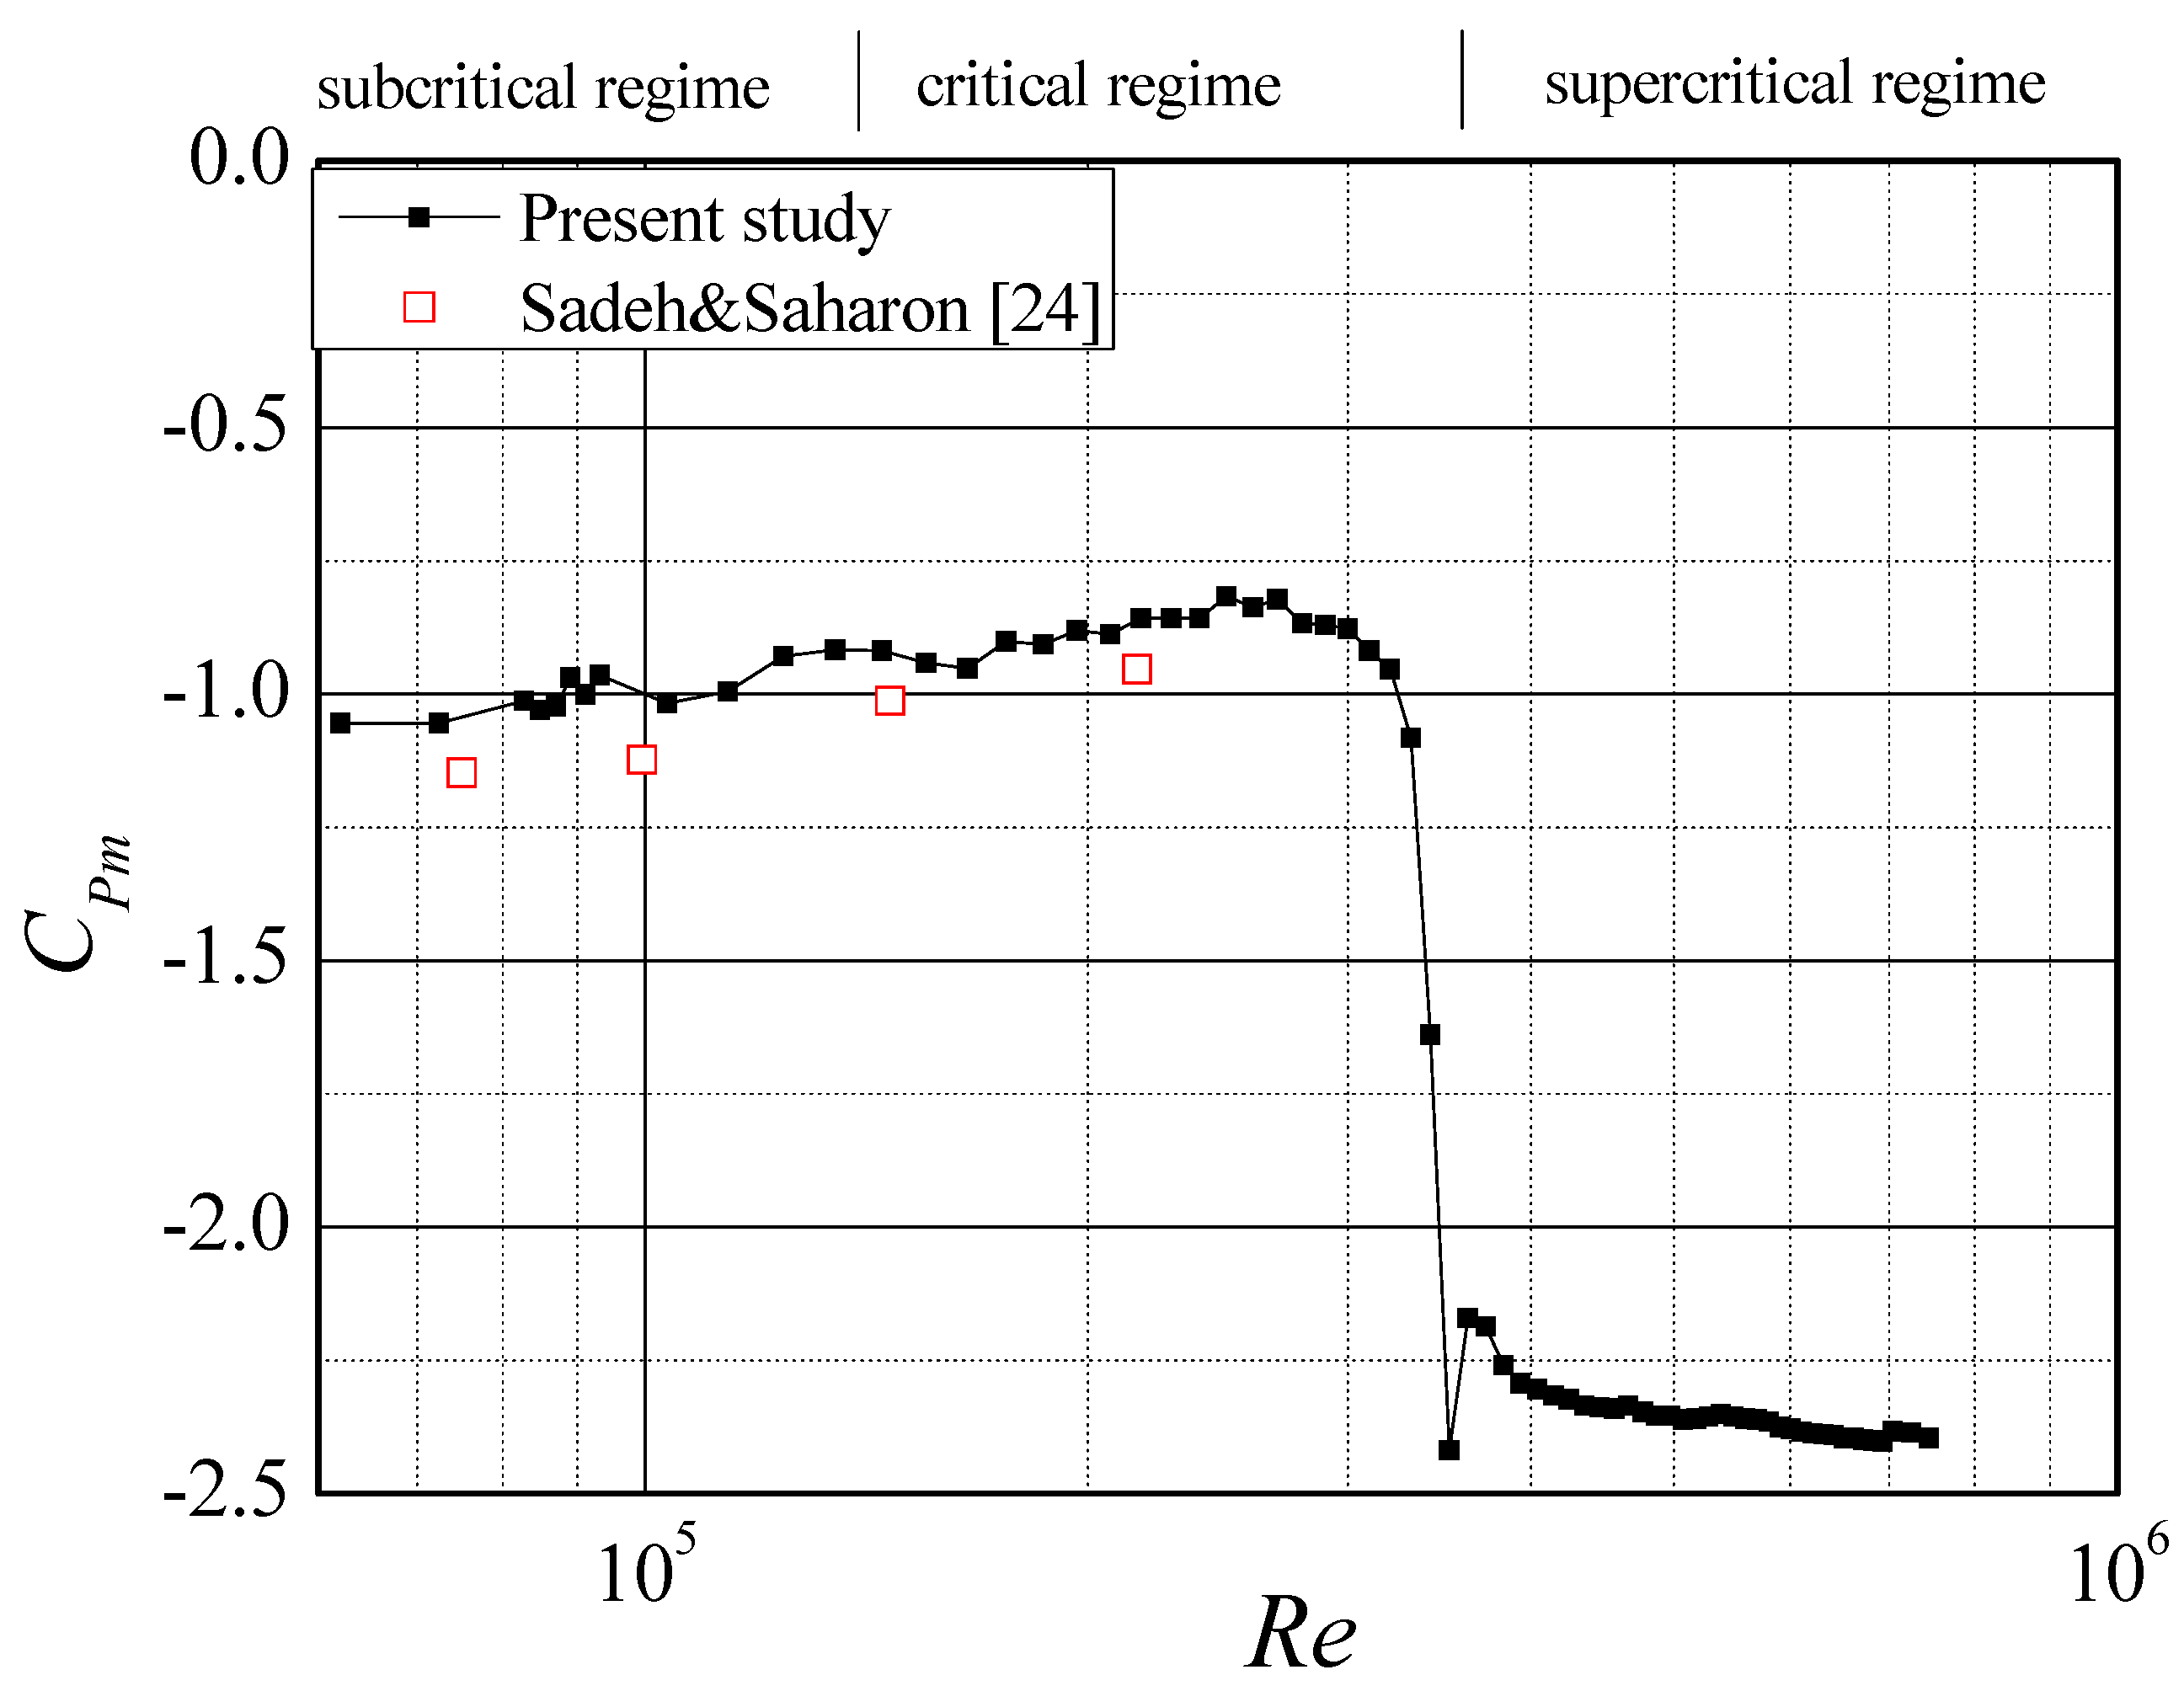
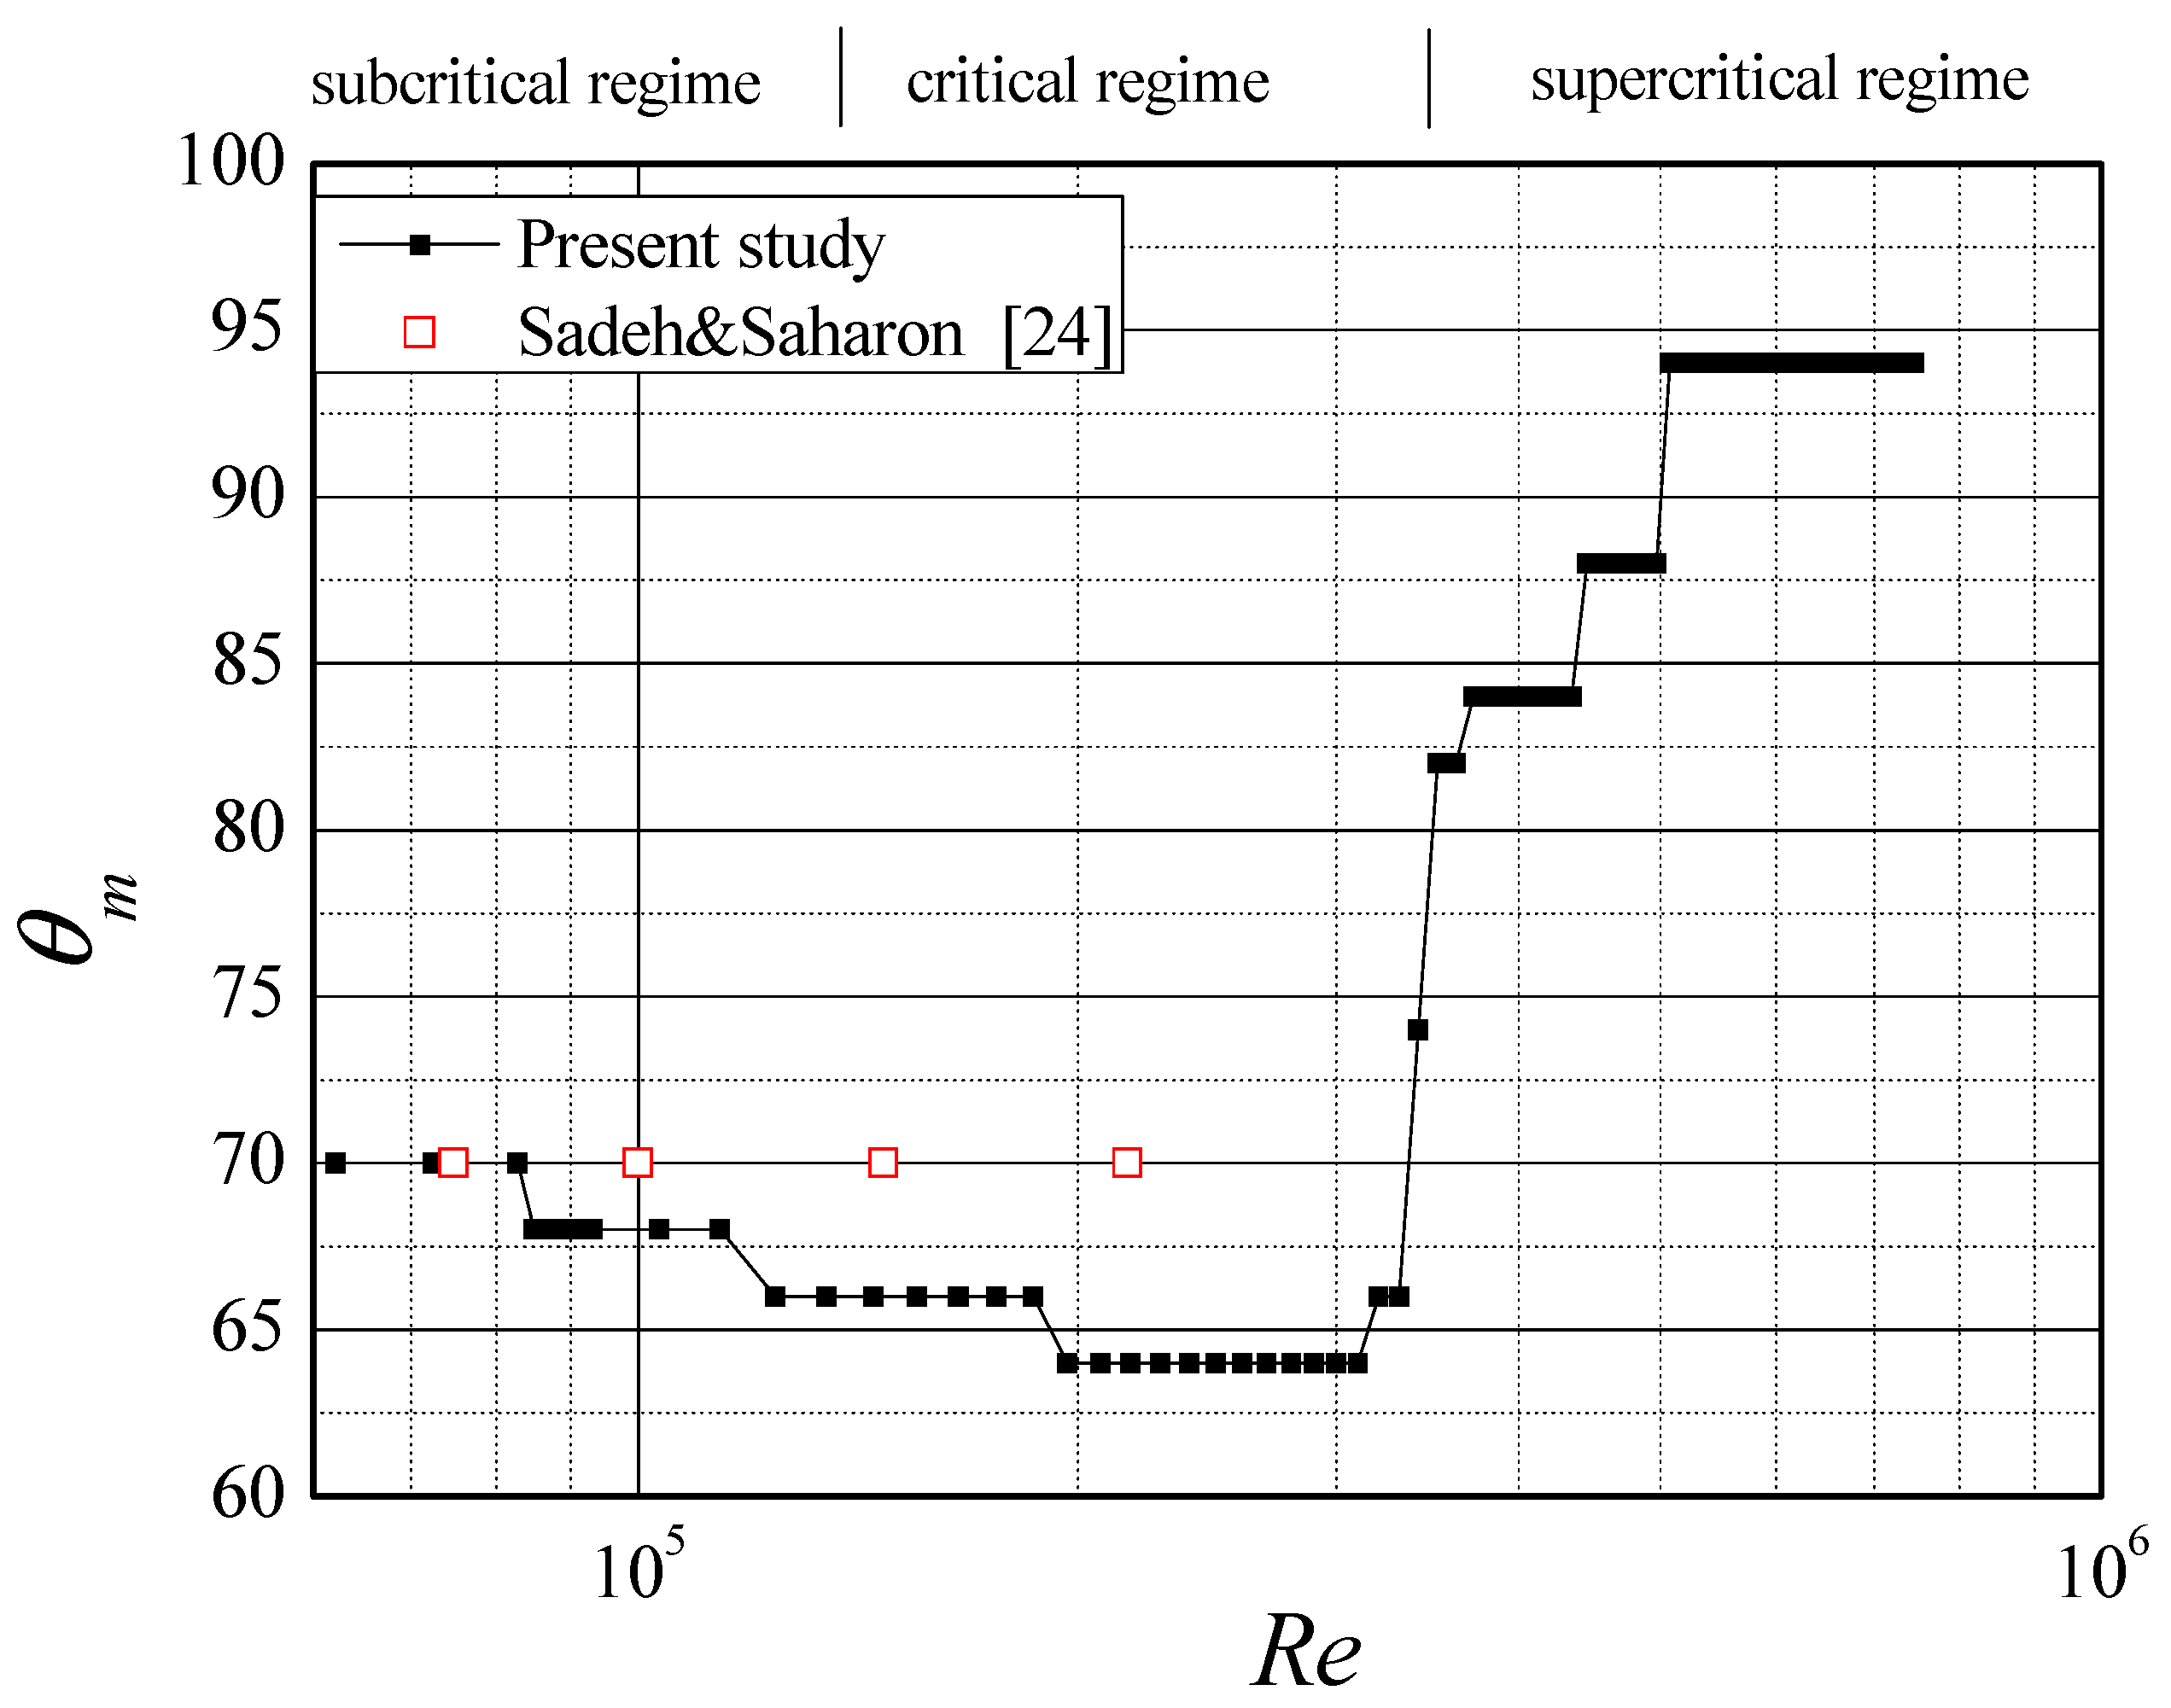
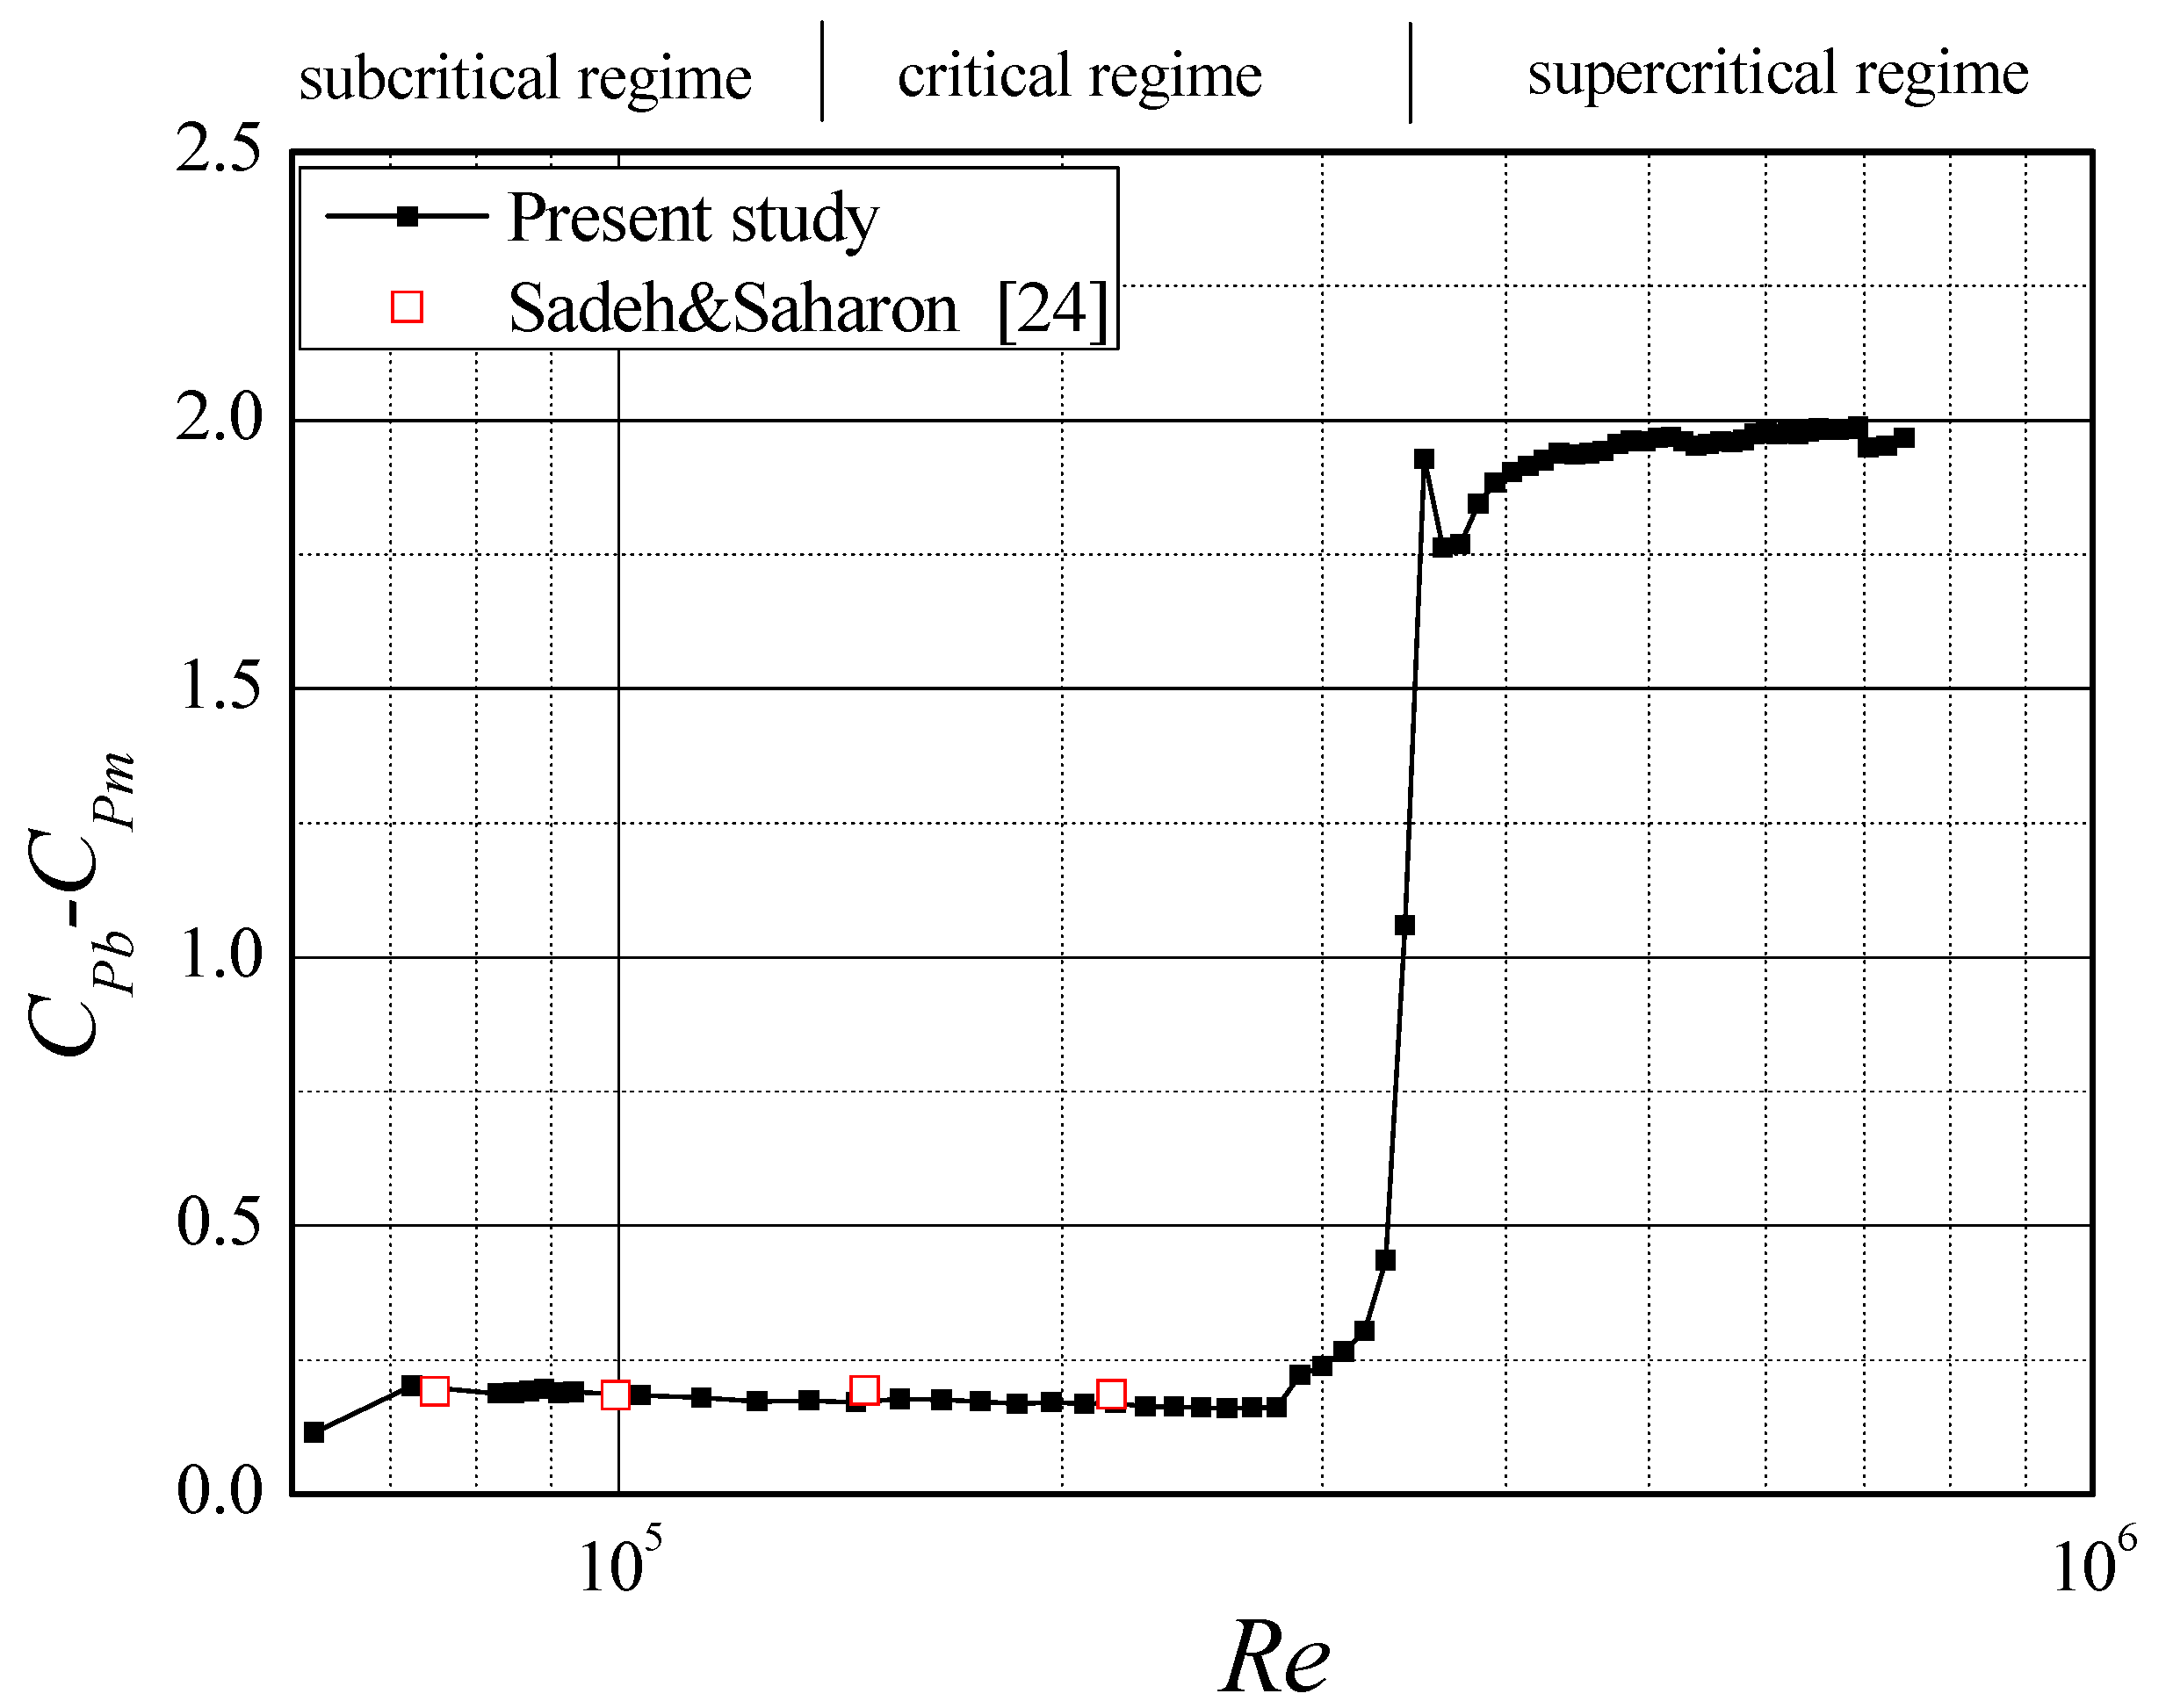
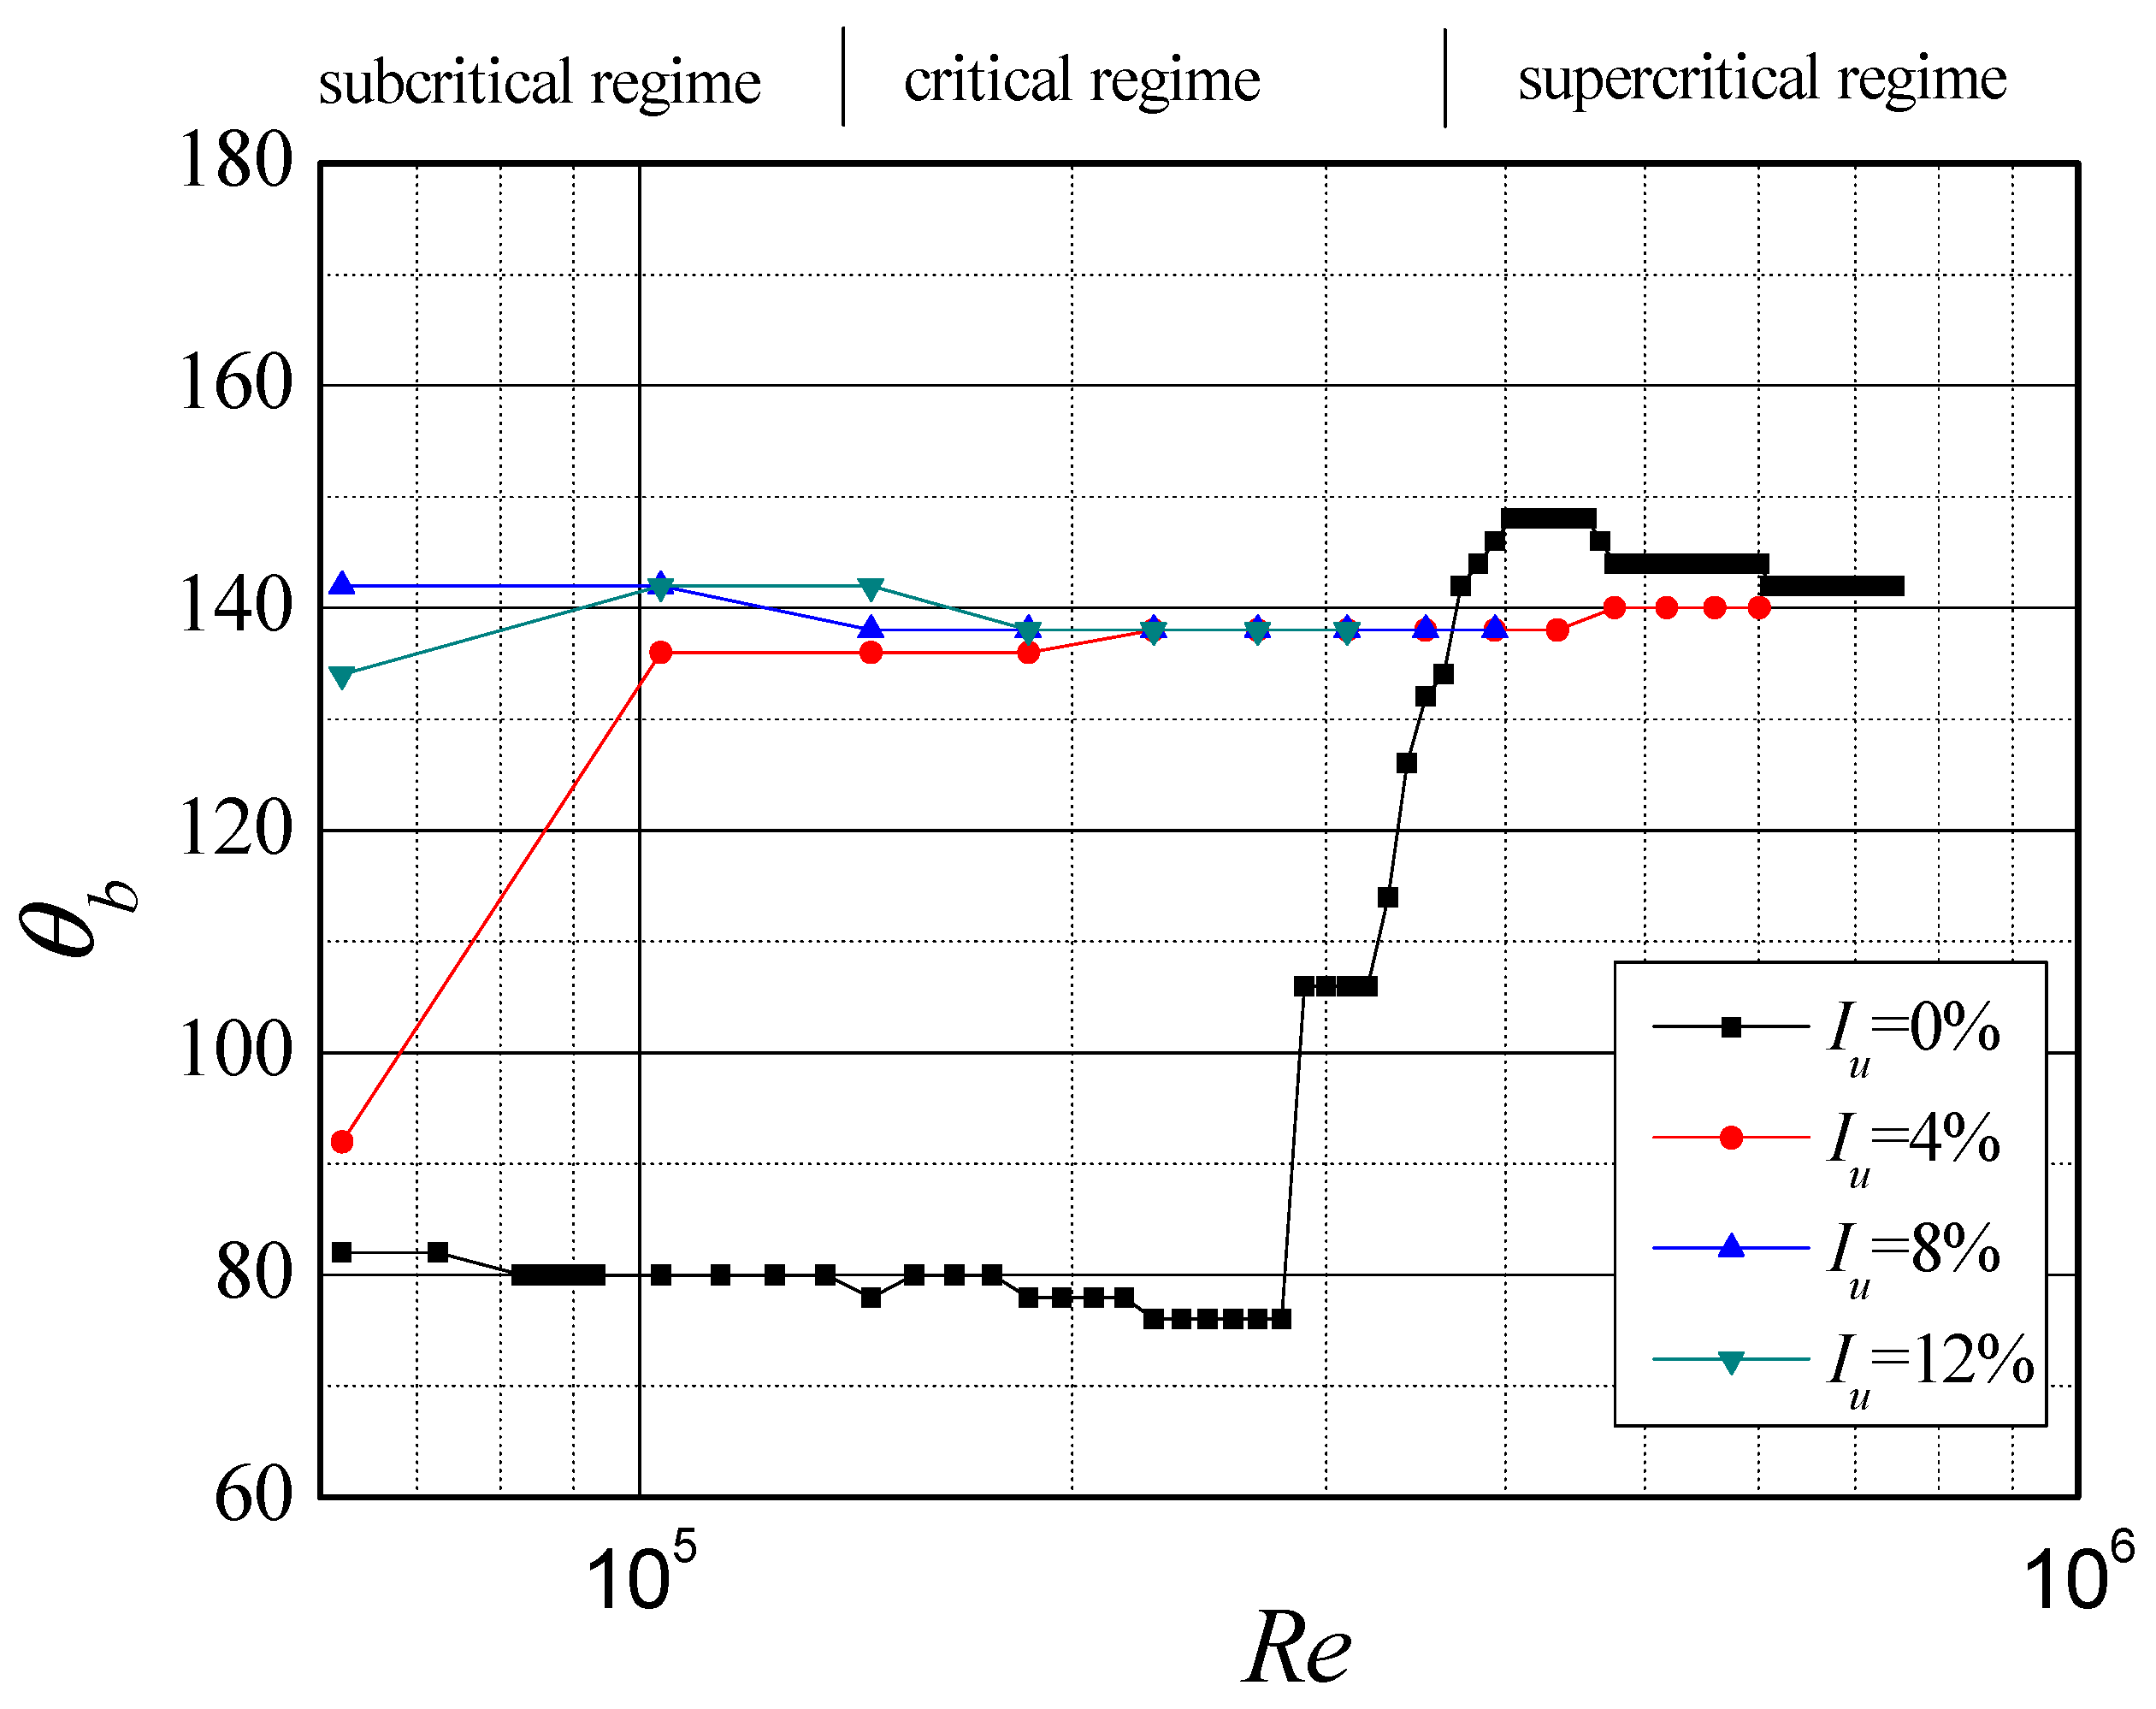
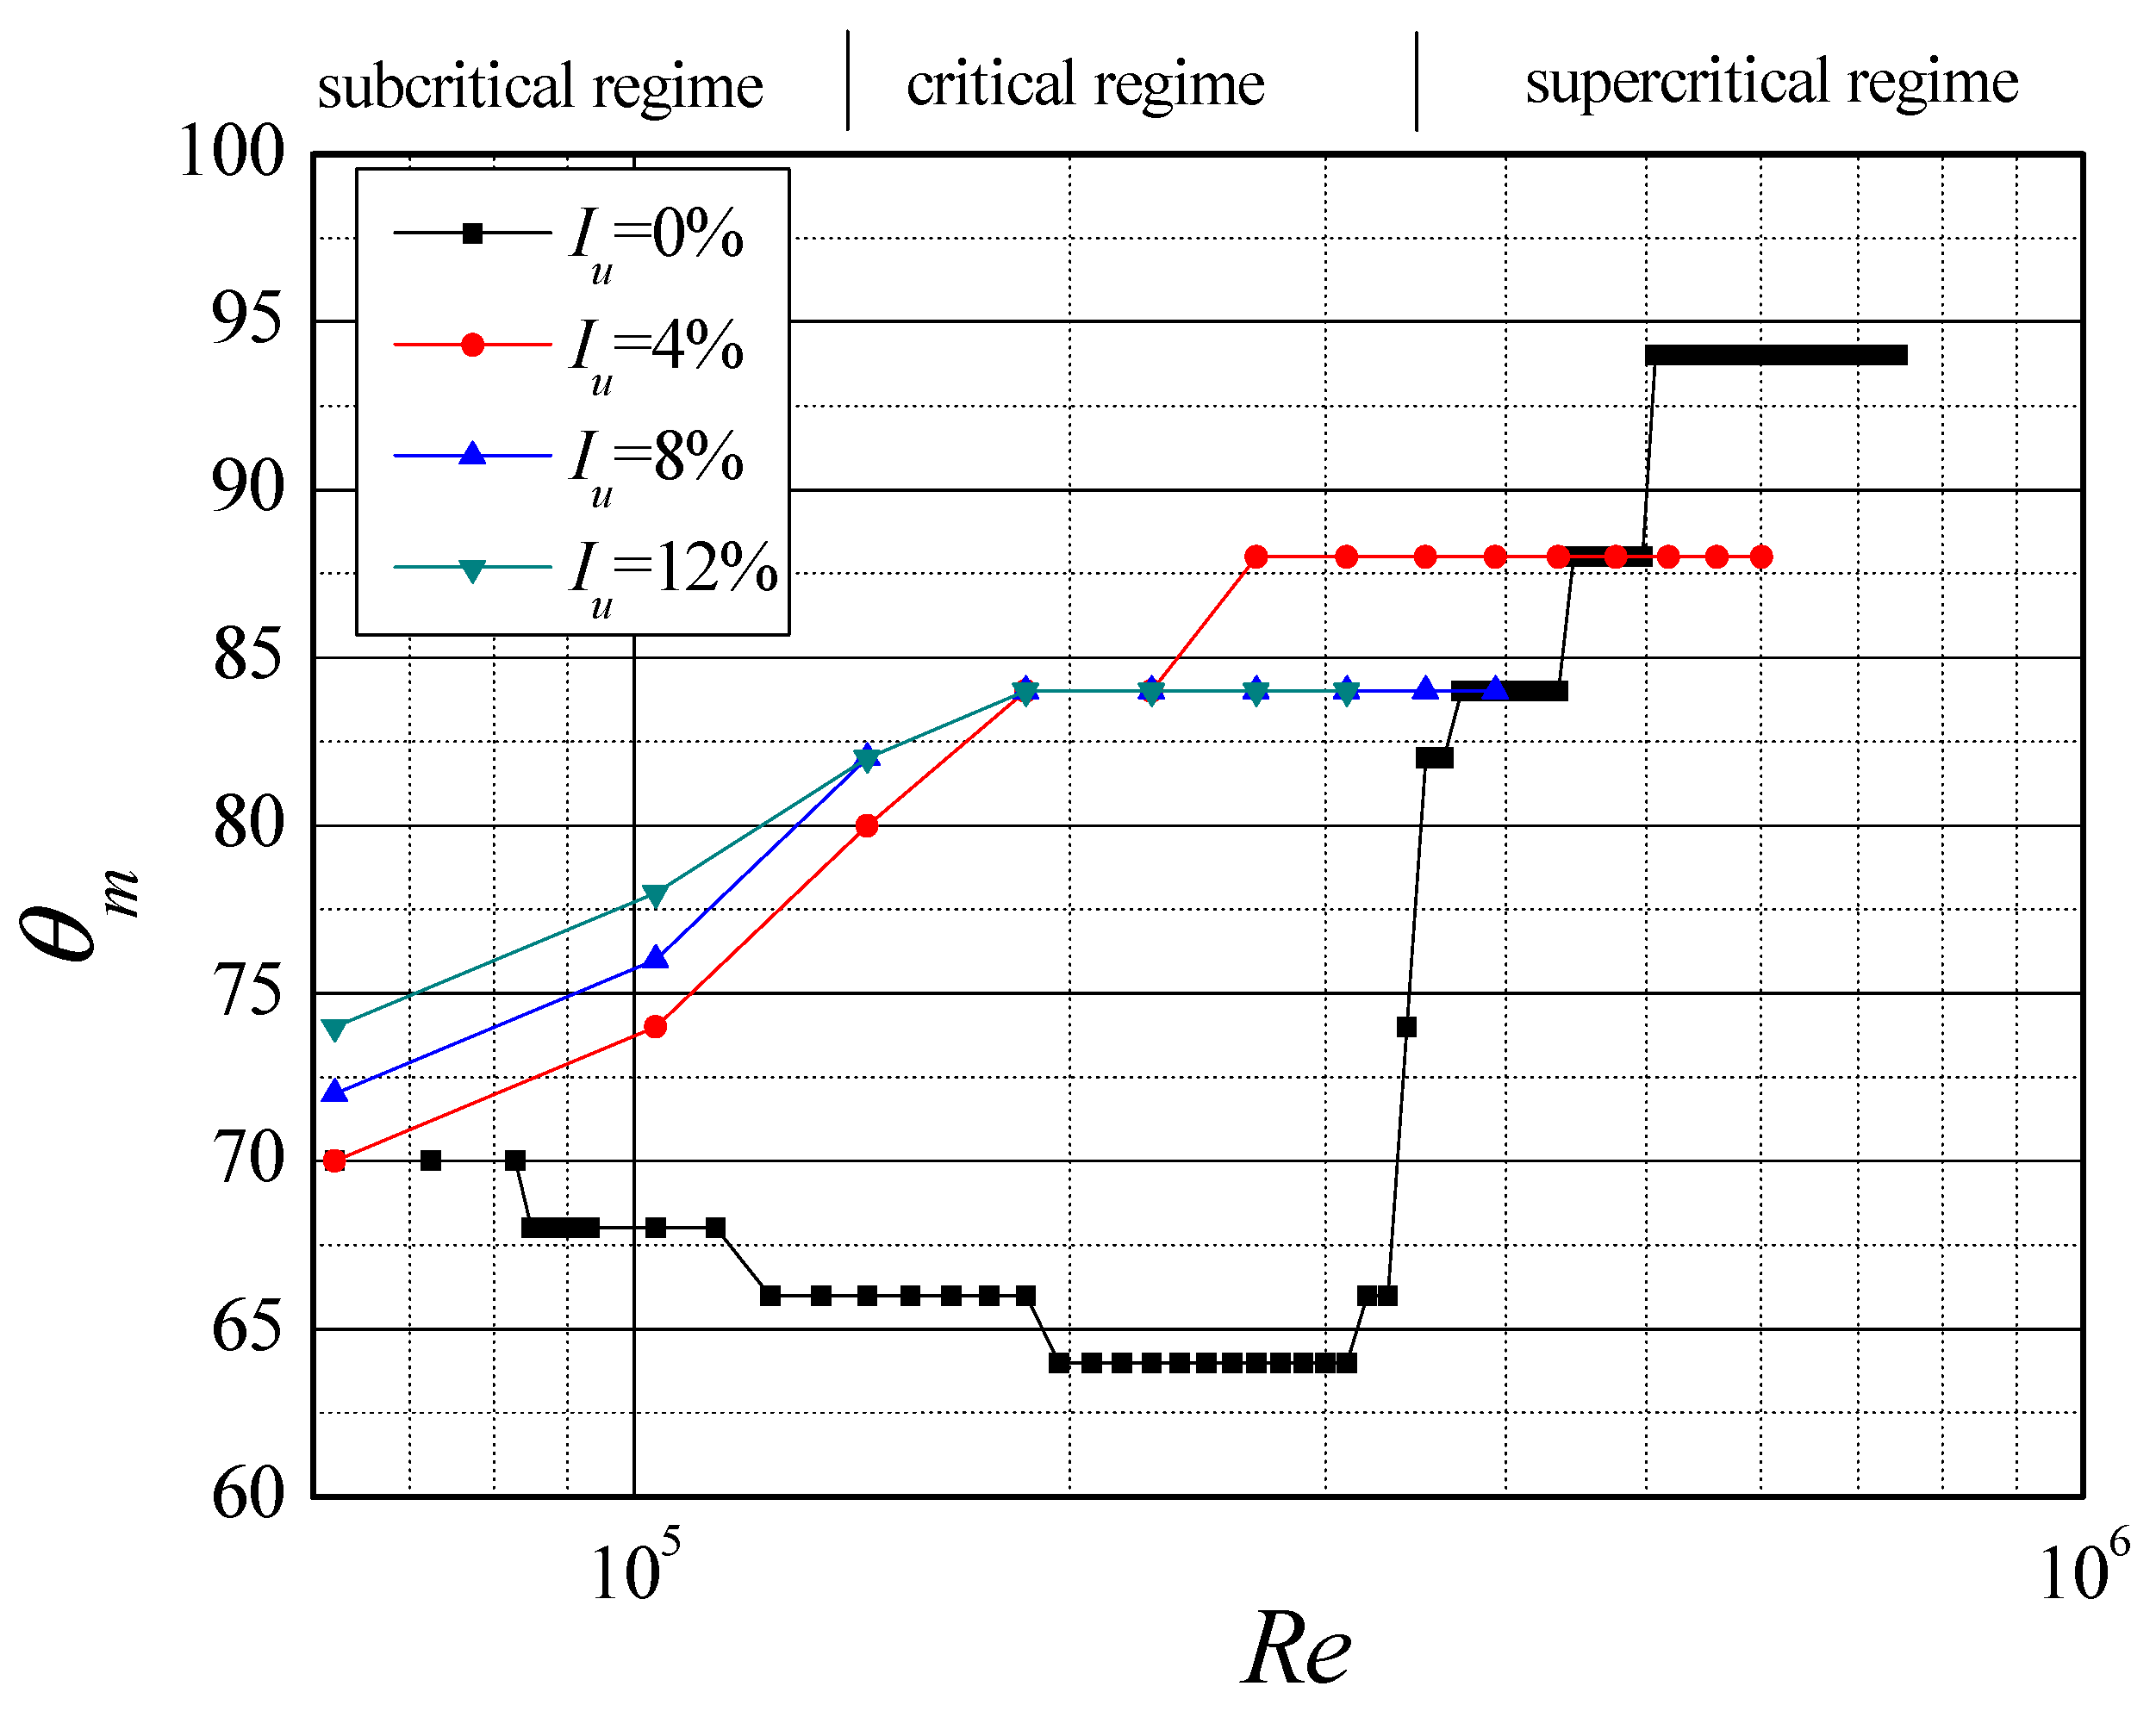
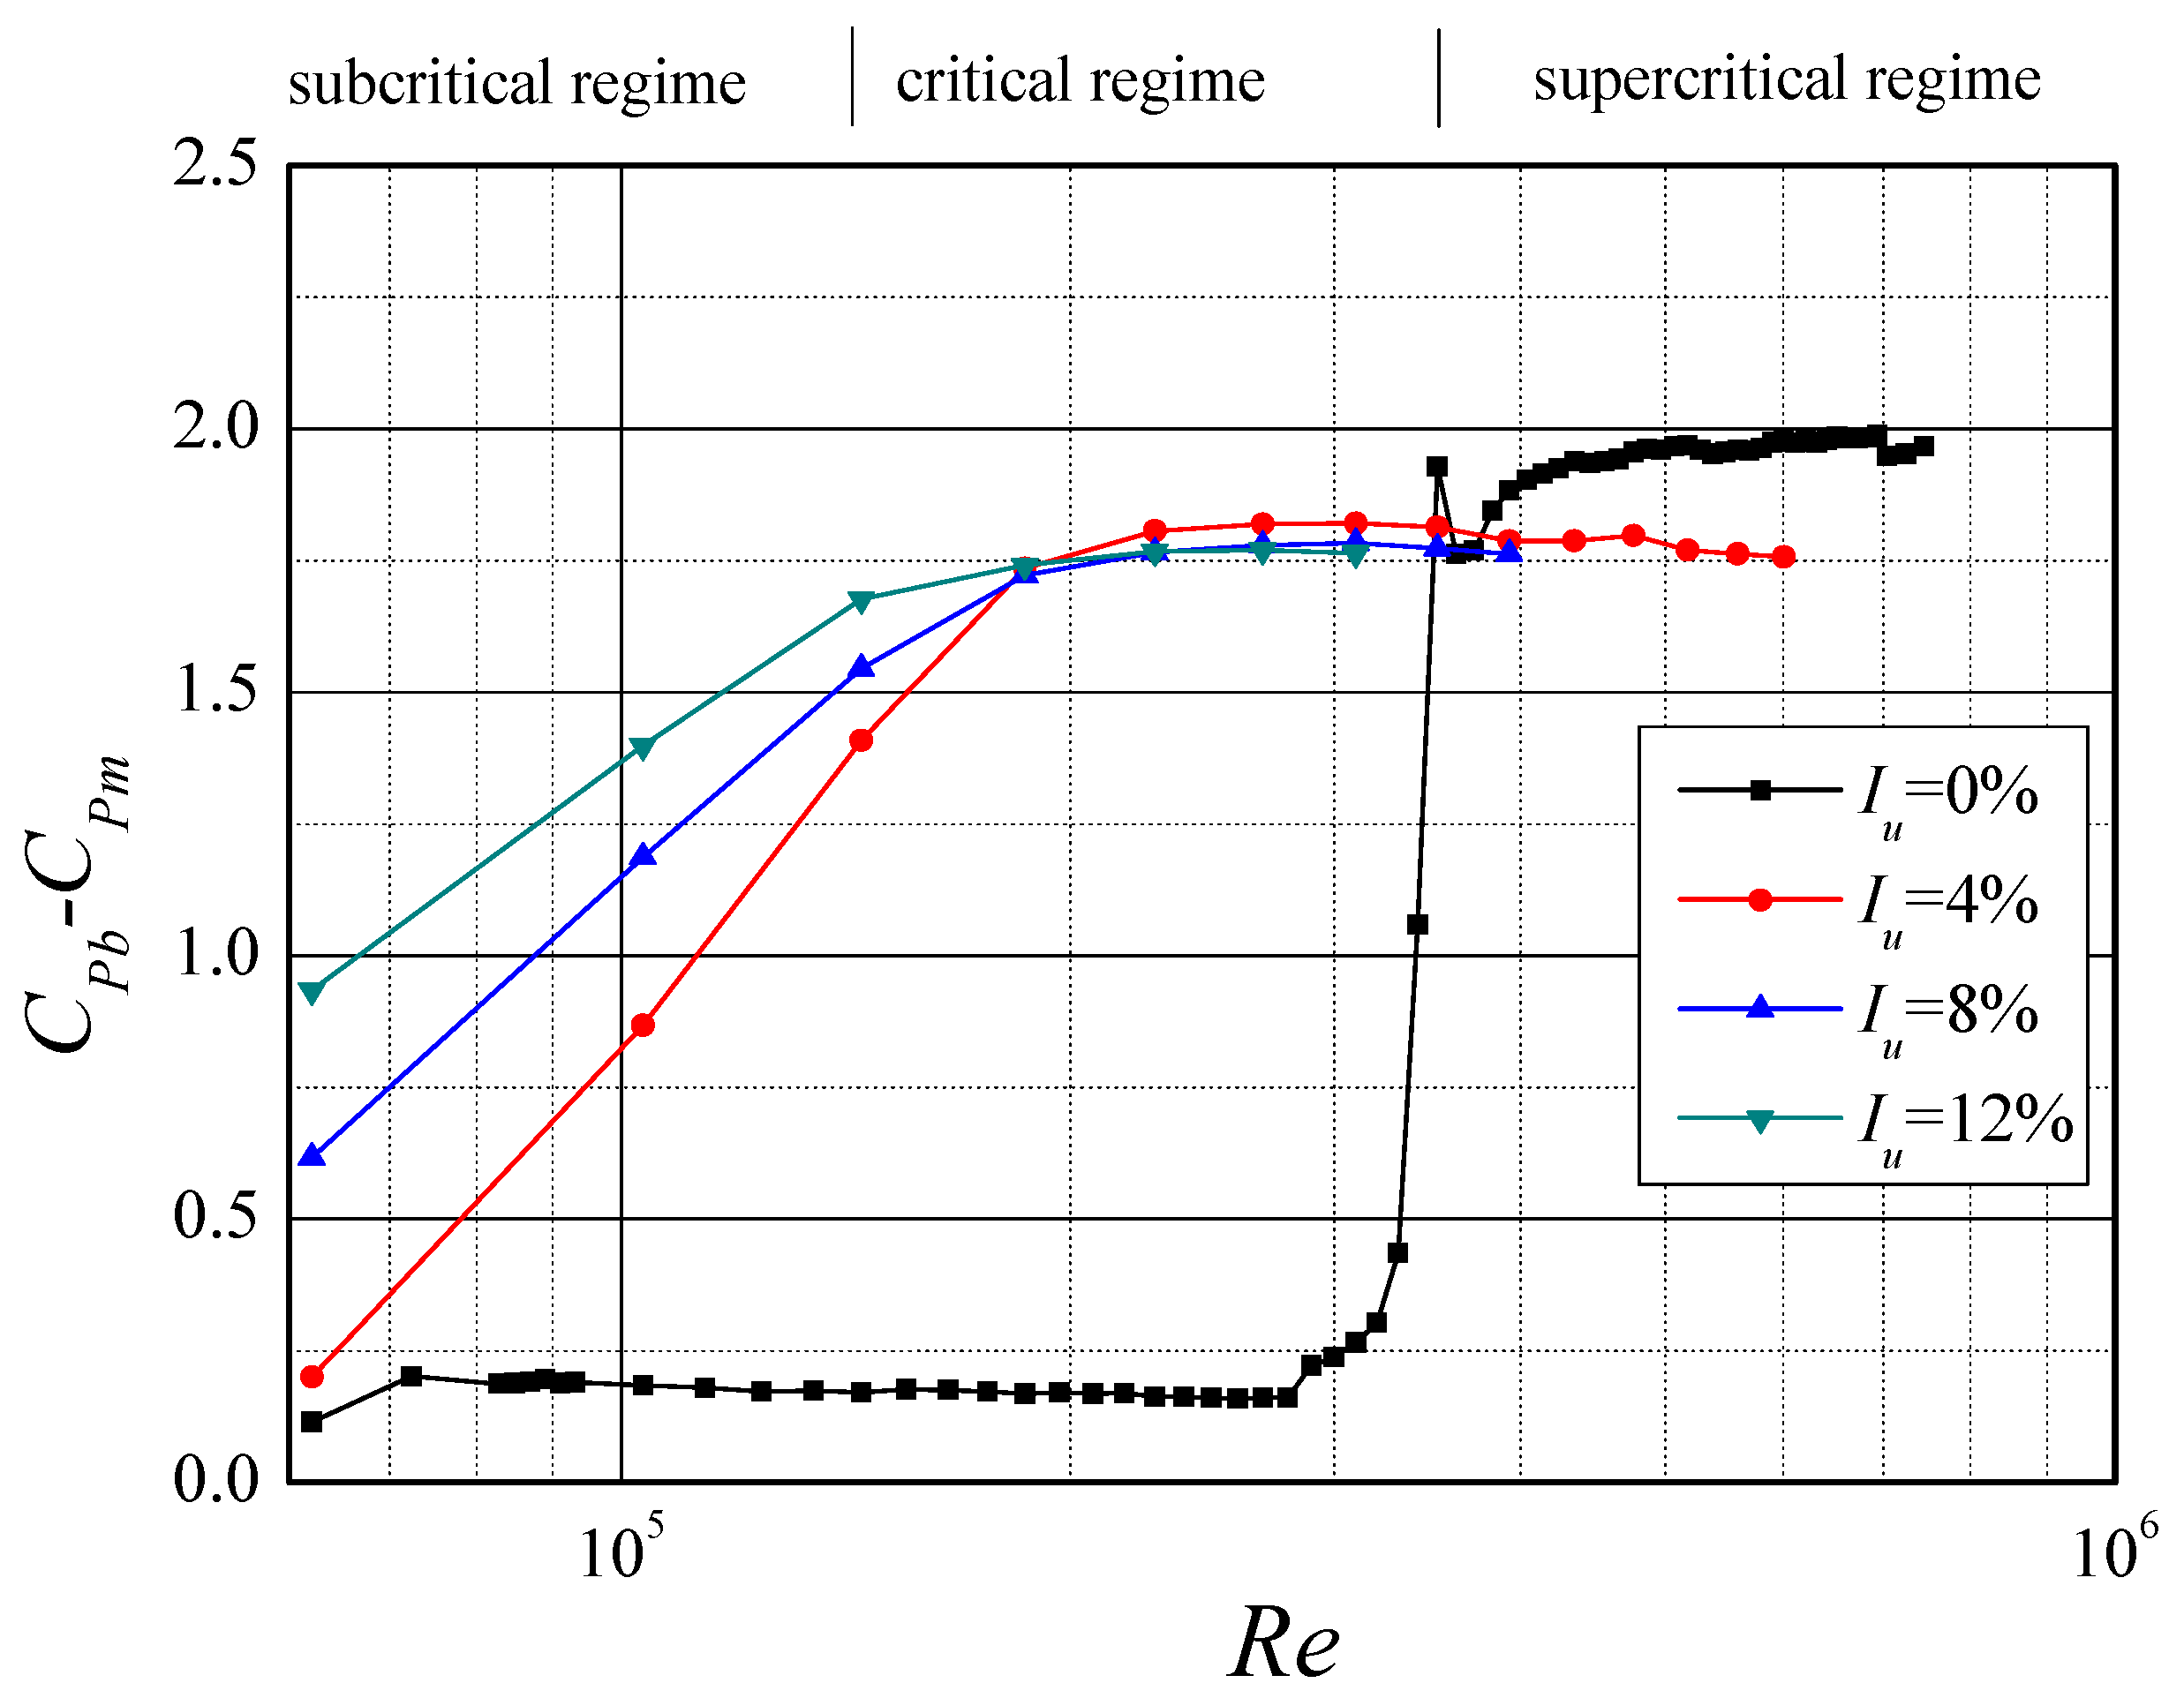
3. Characteristic Parameters of Mean Wind Pressure Coefficient Distribution
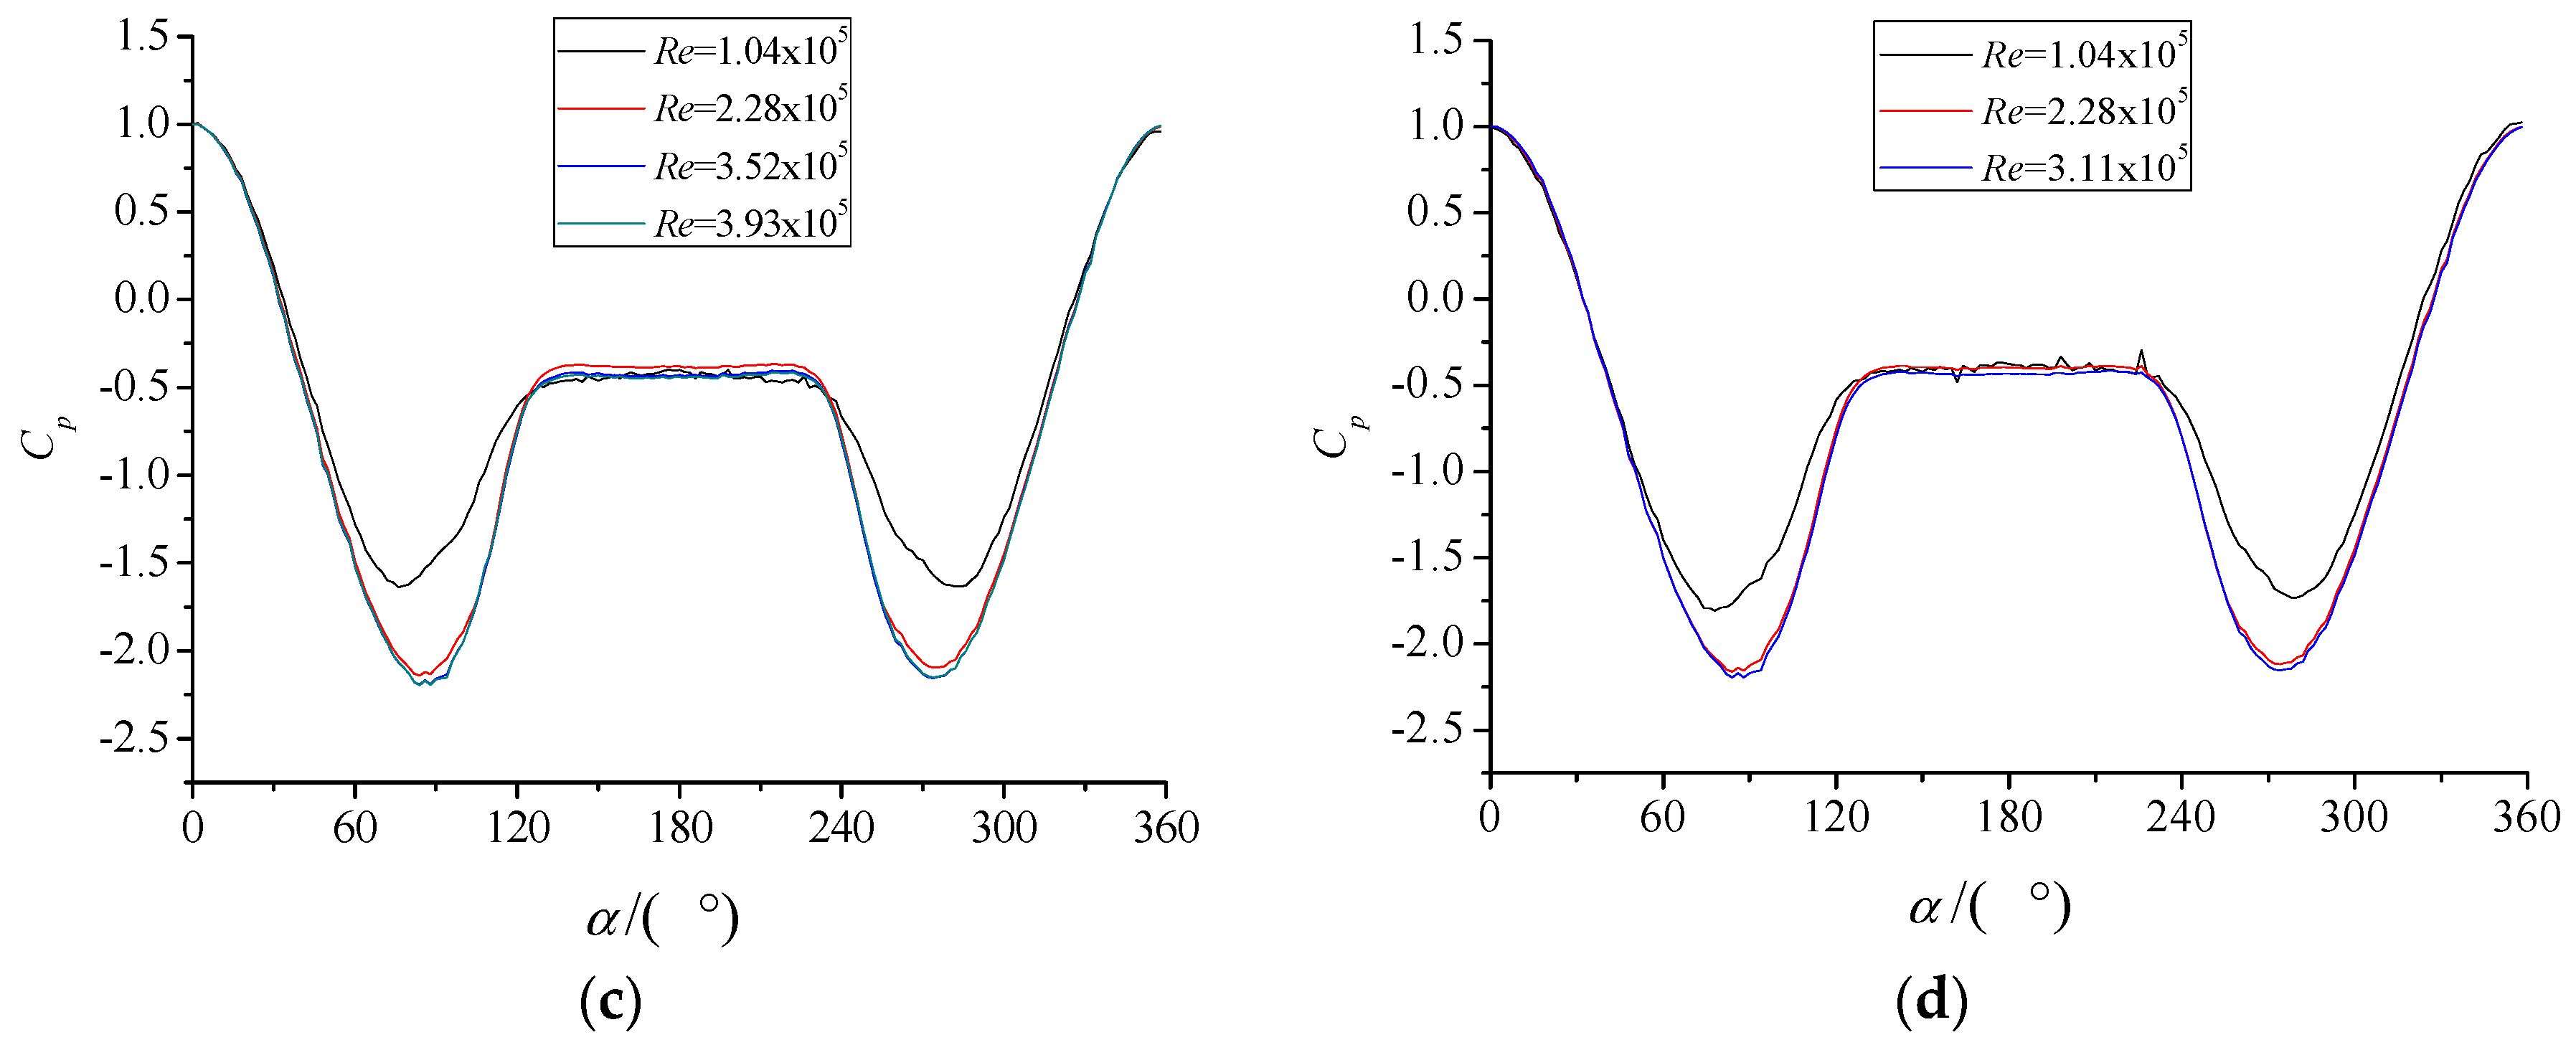
3.1. In the Smooth Flow
3.2. In the Turbulent Flow
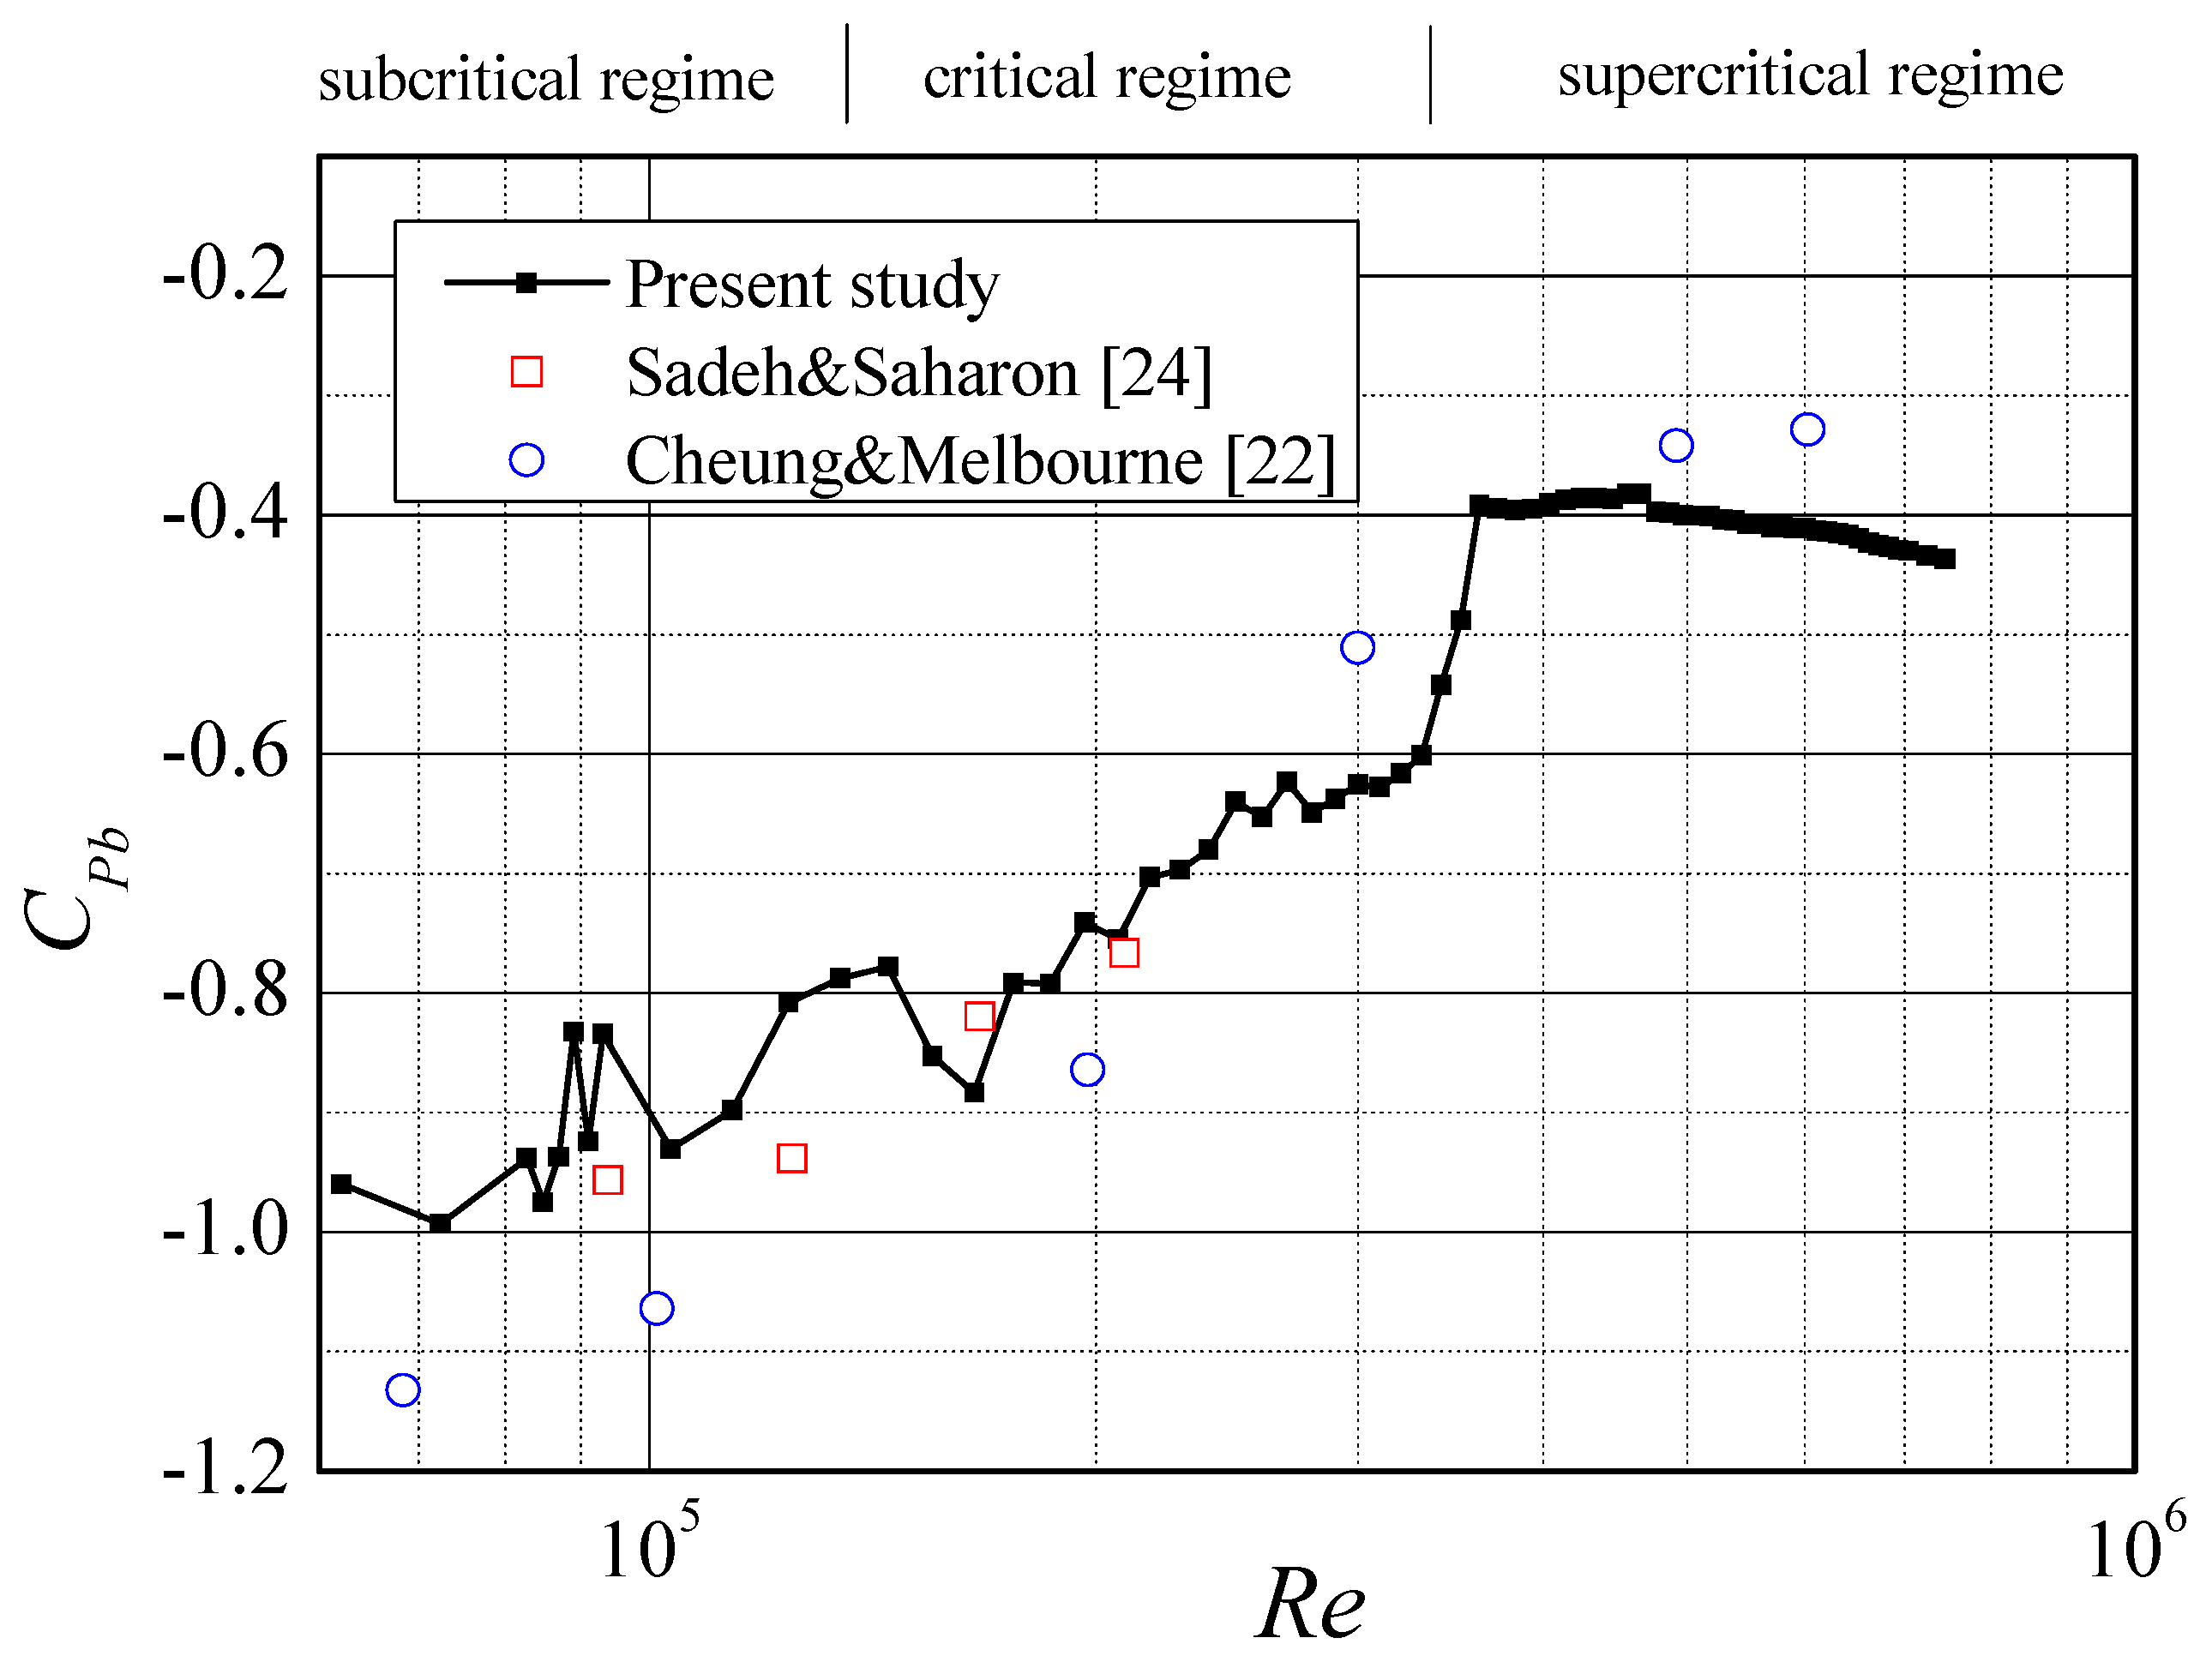
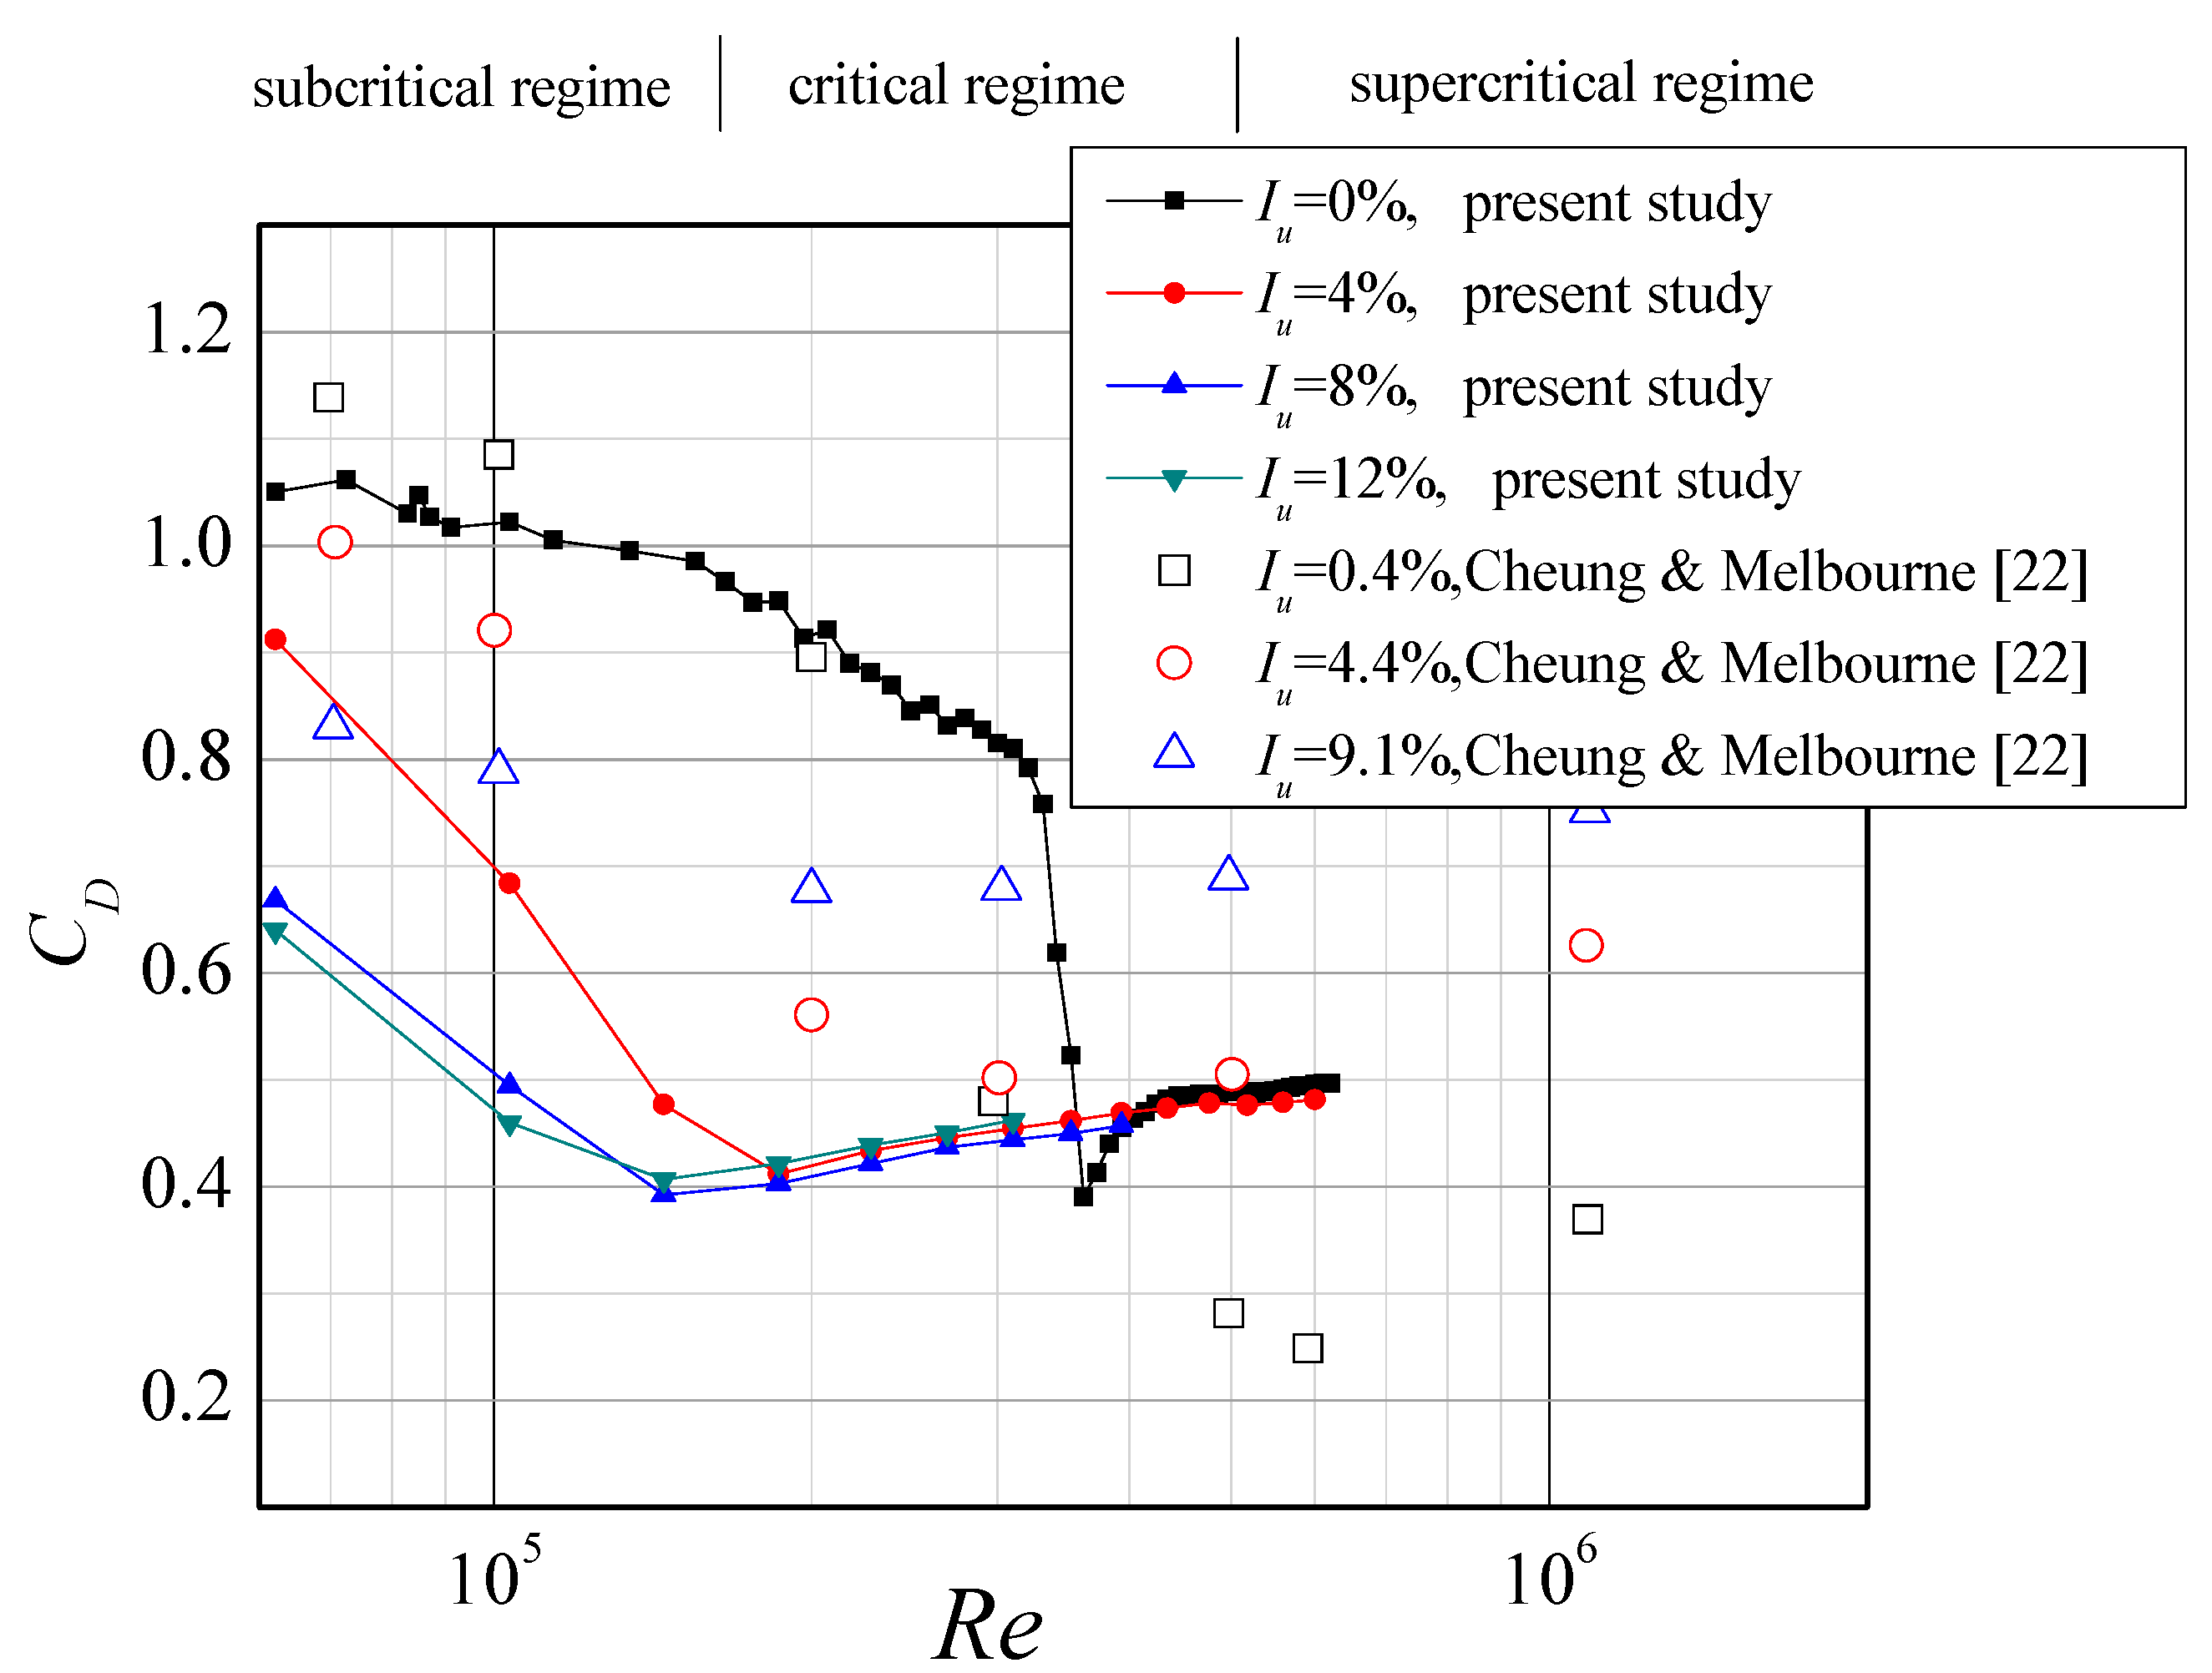
4. Drag Coefficient
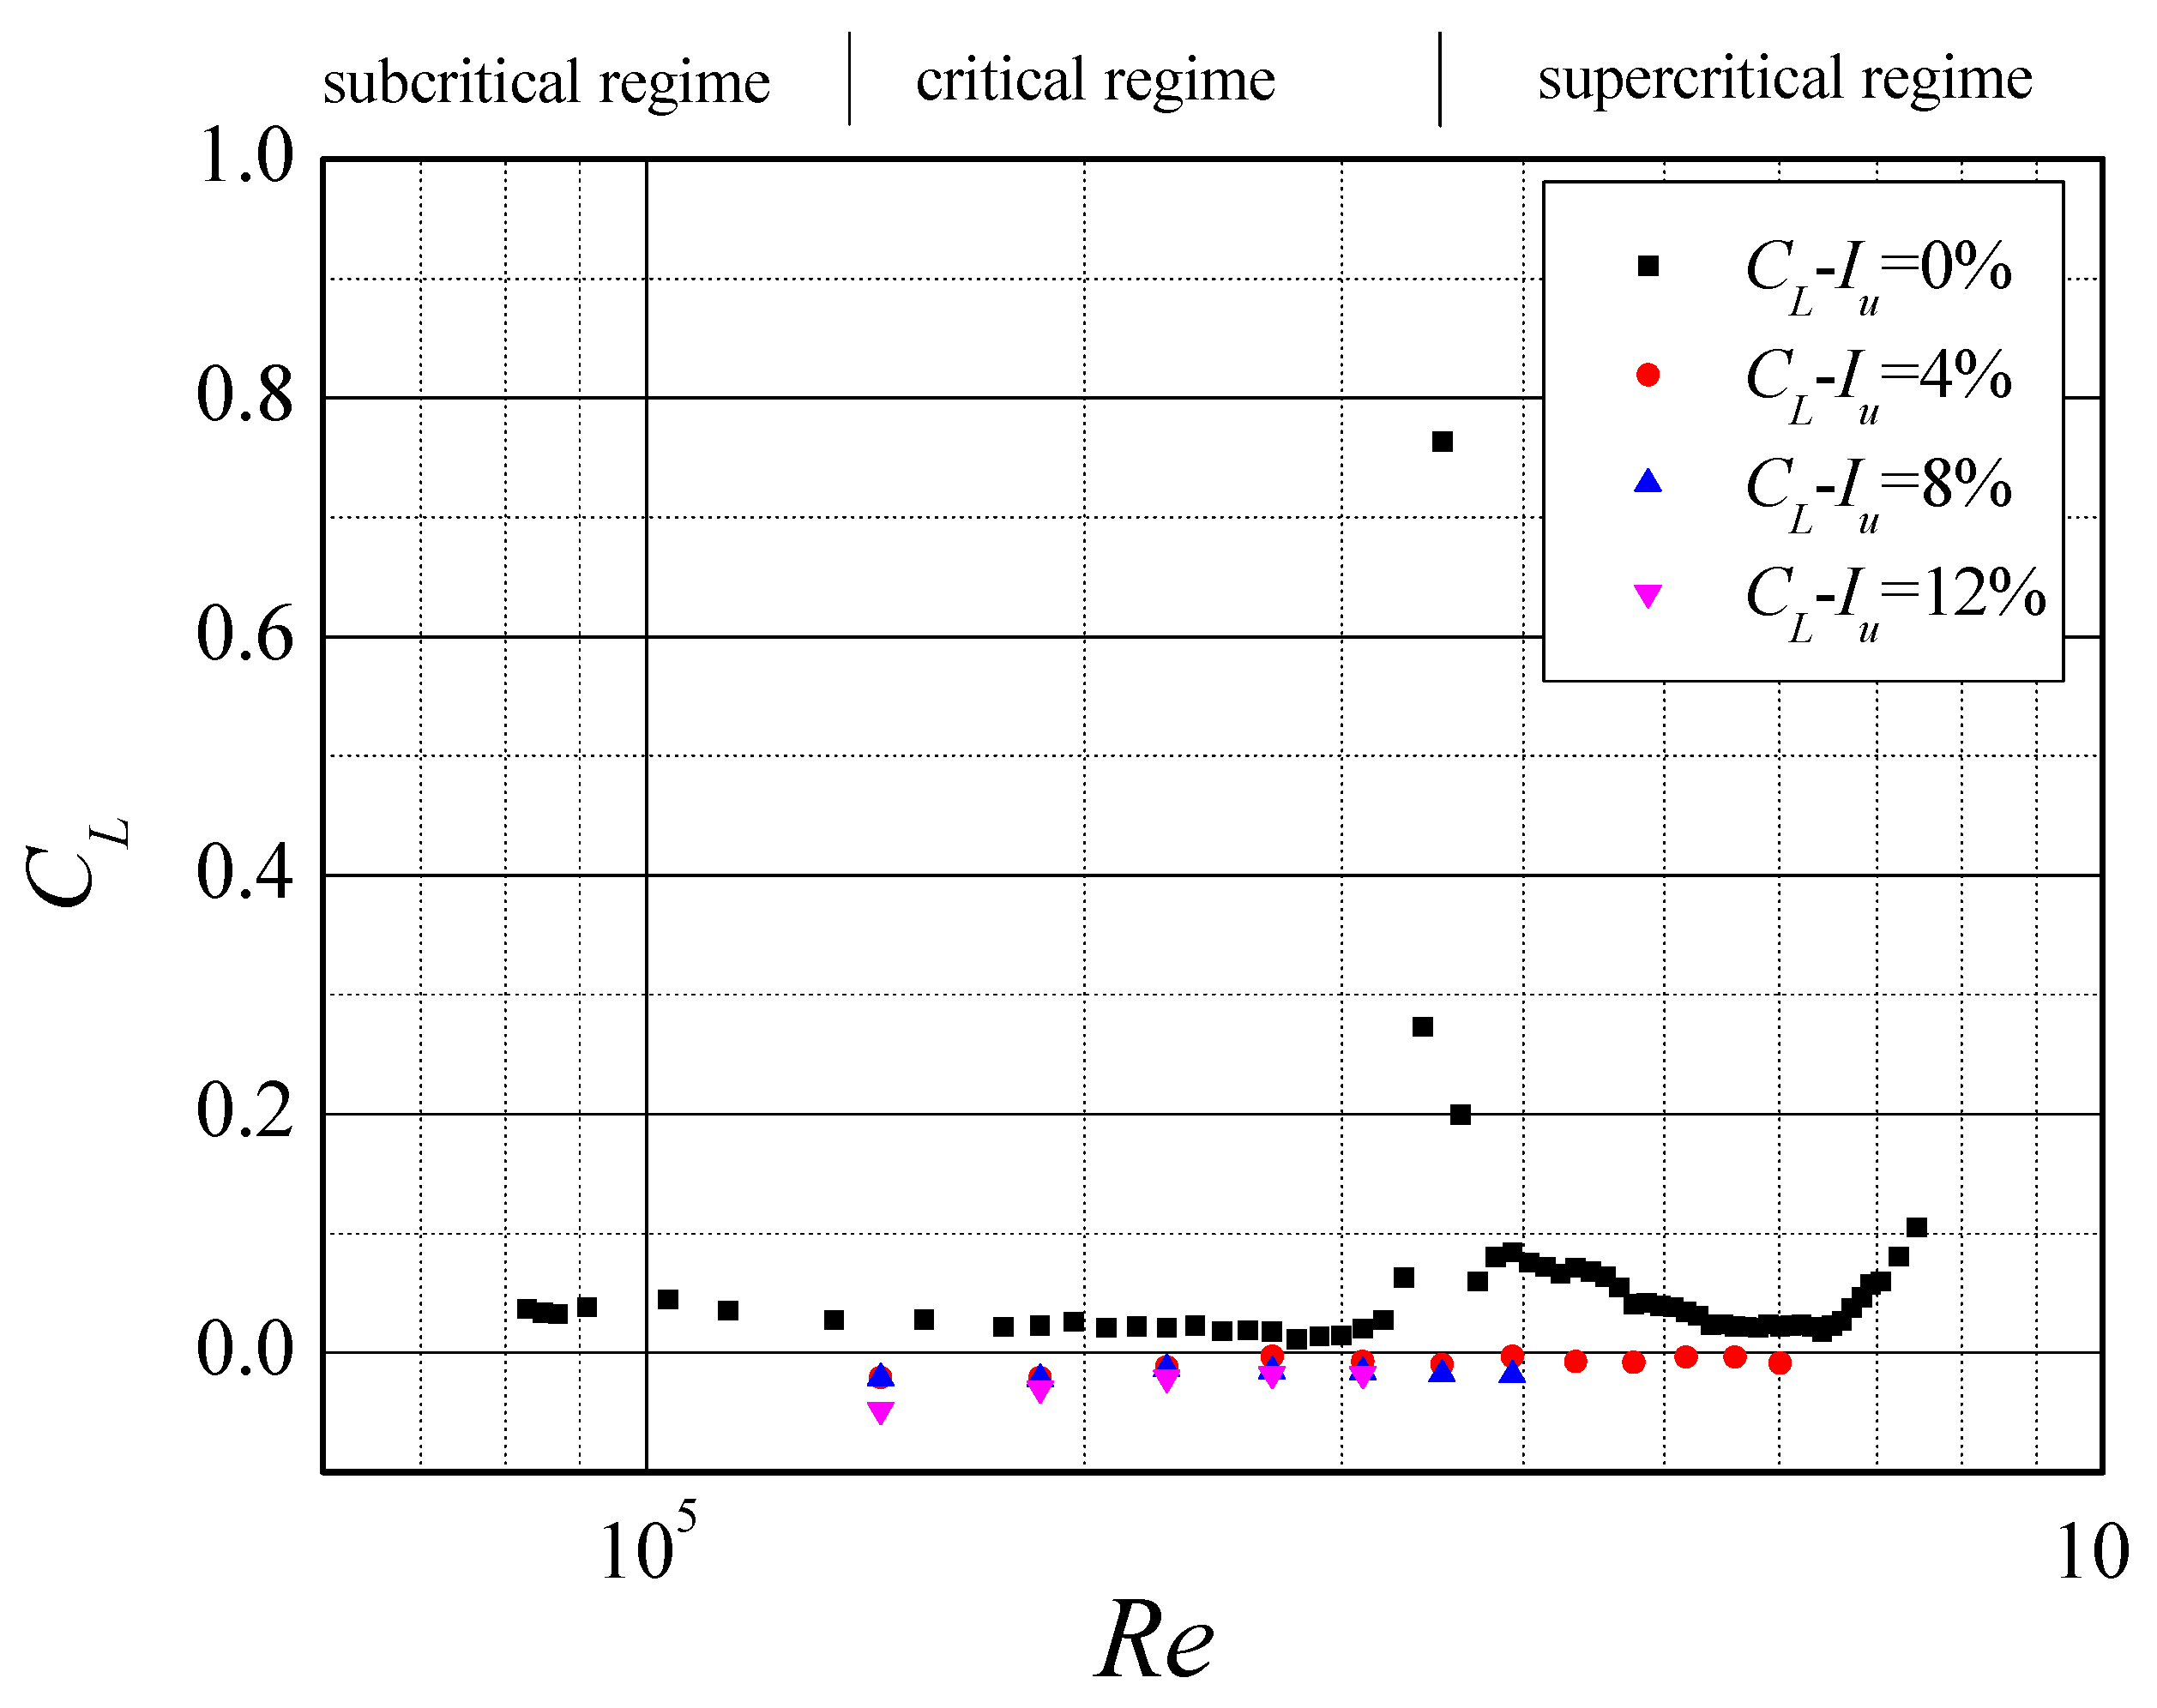
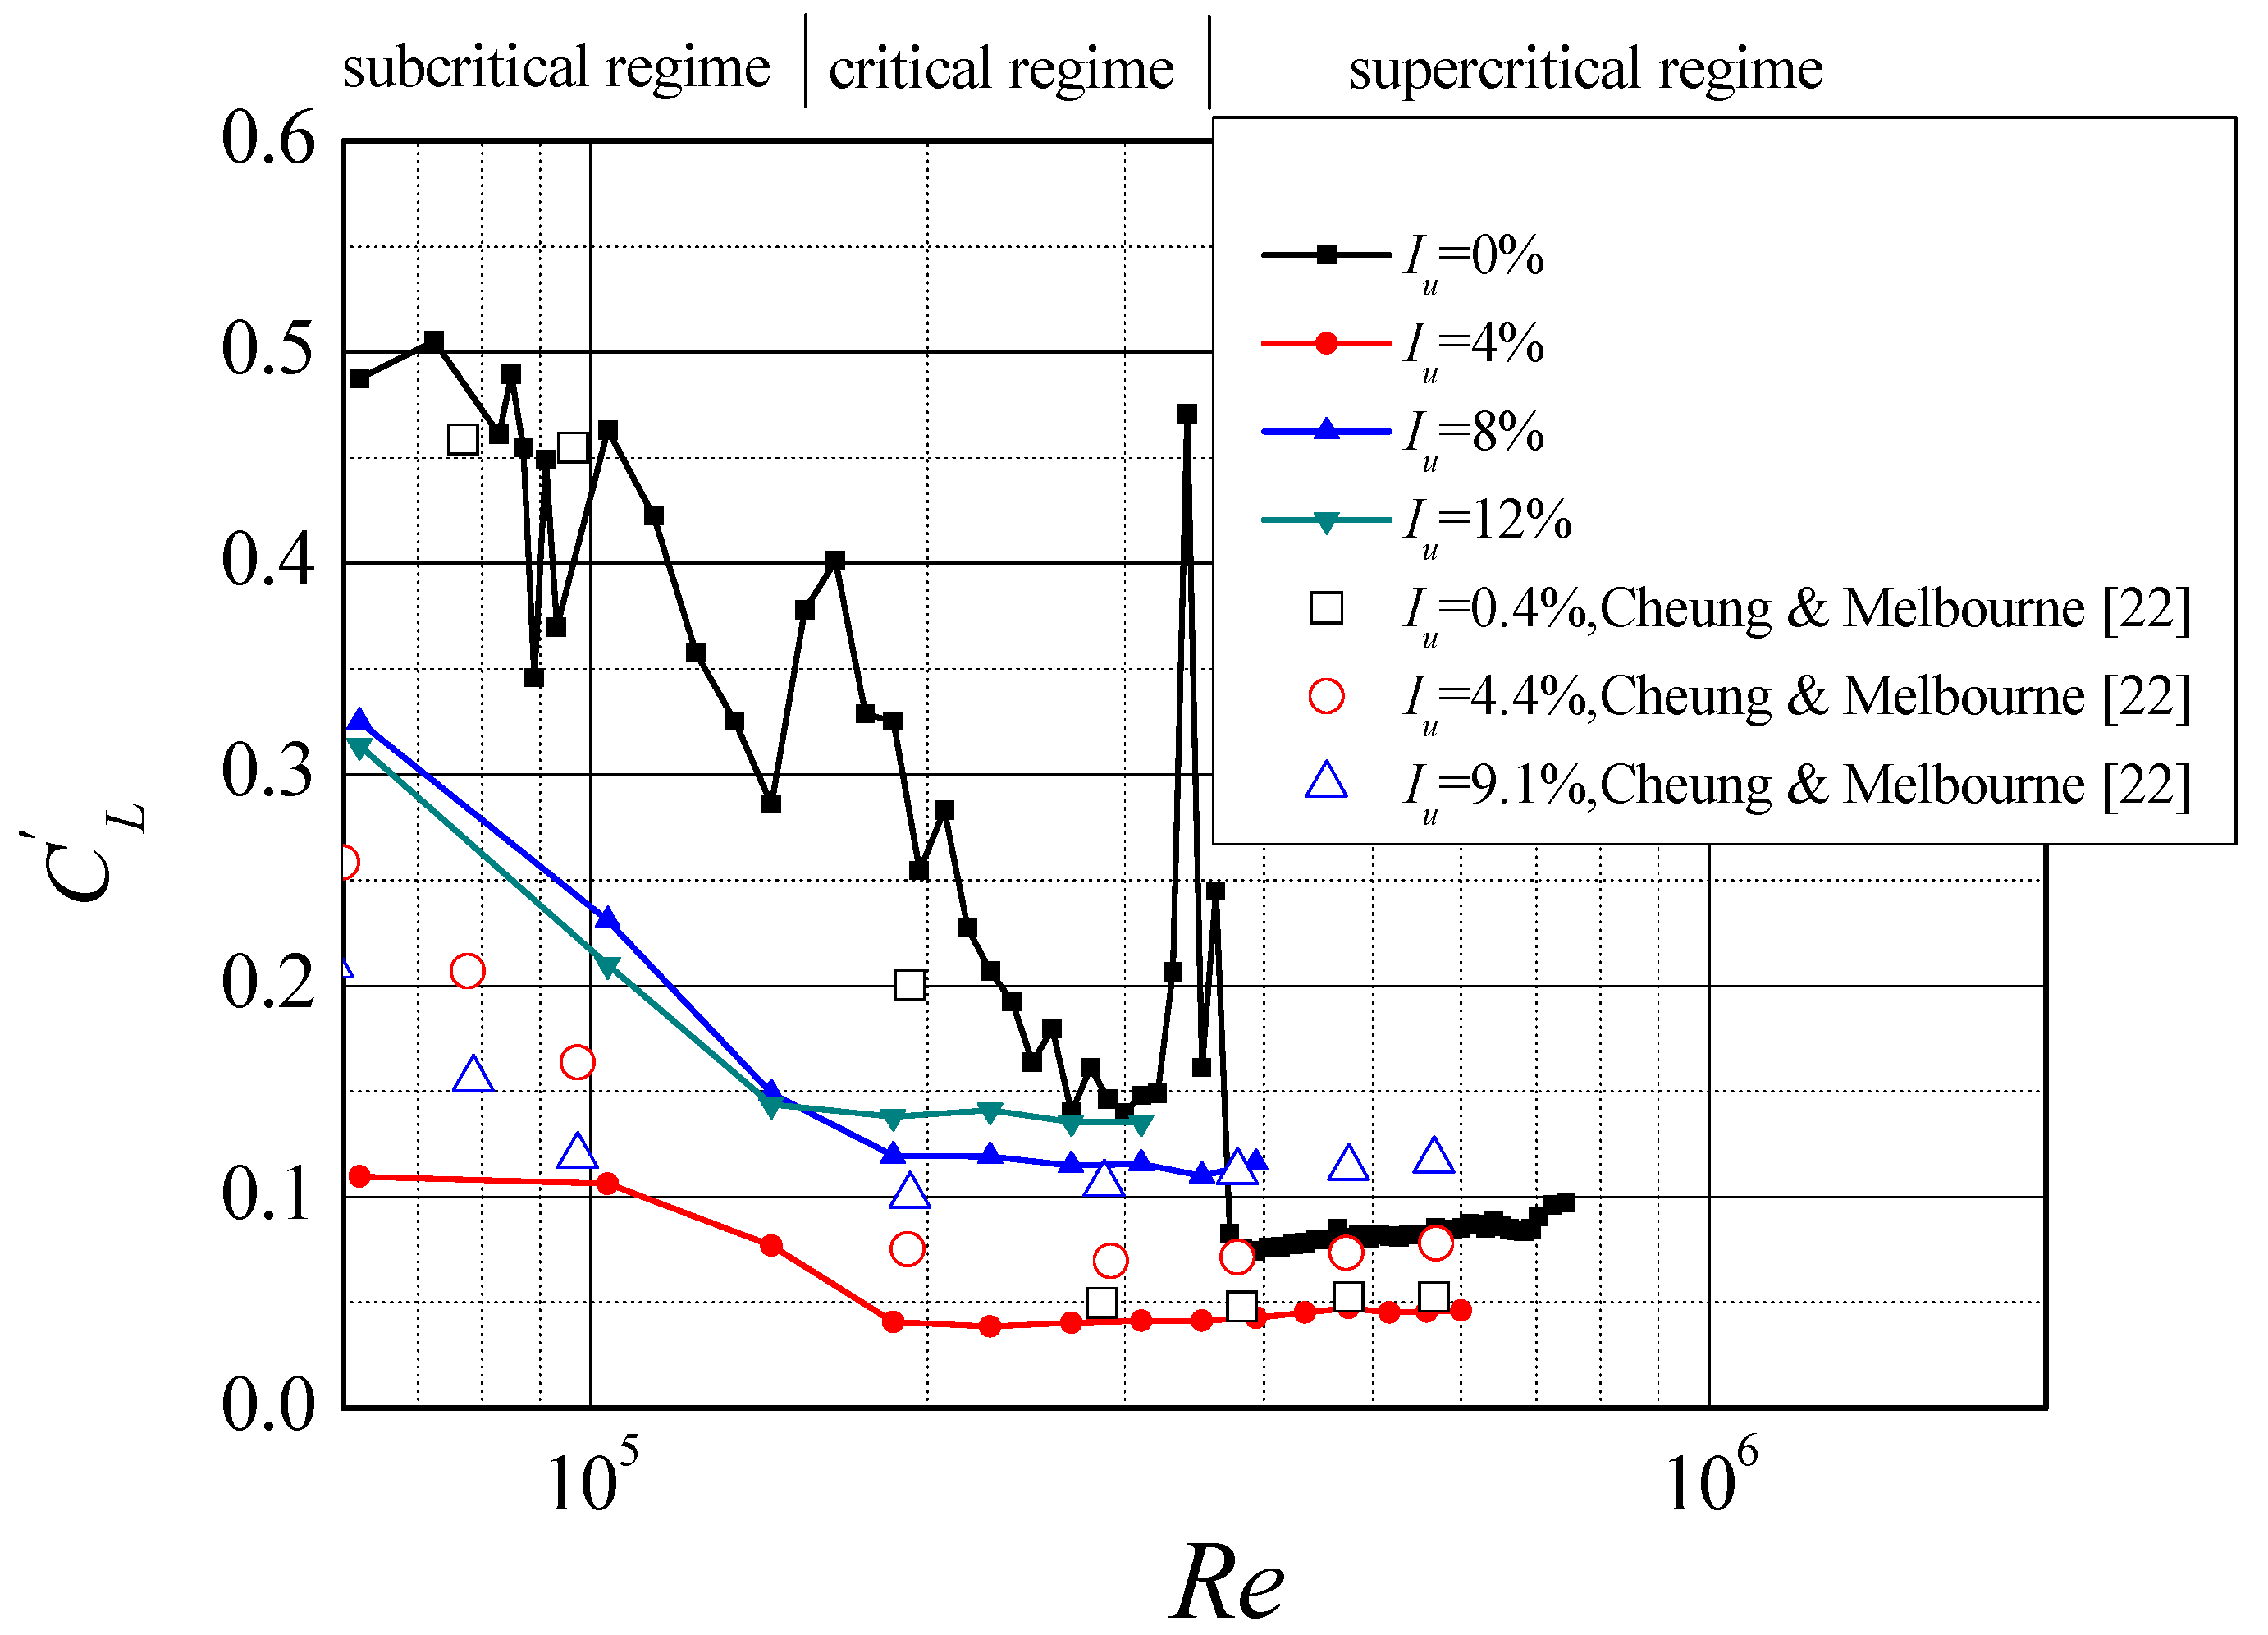
5. Lift Coefficient
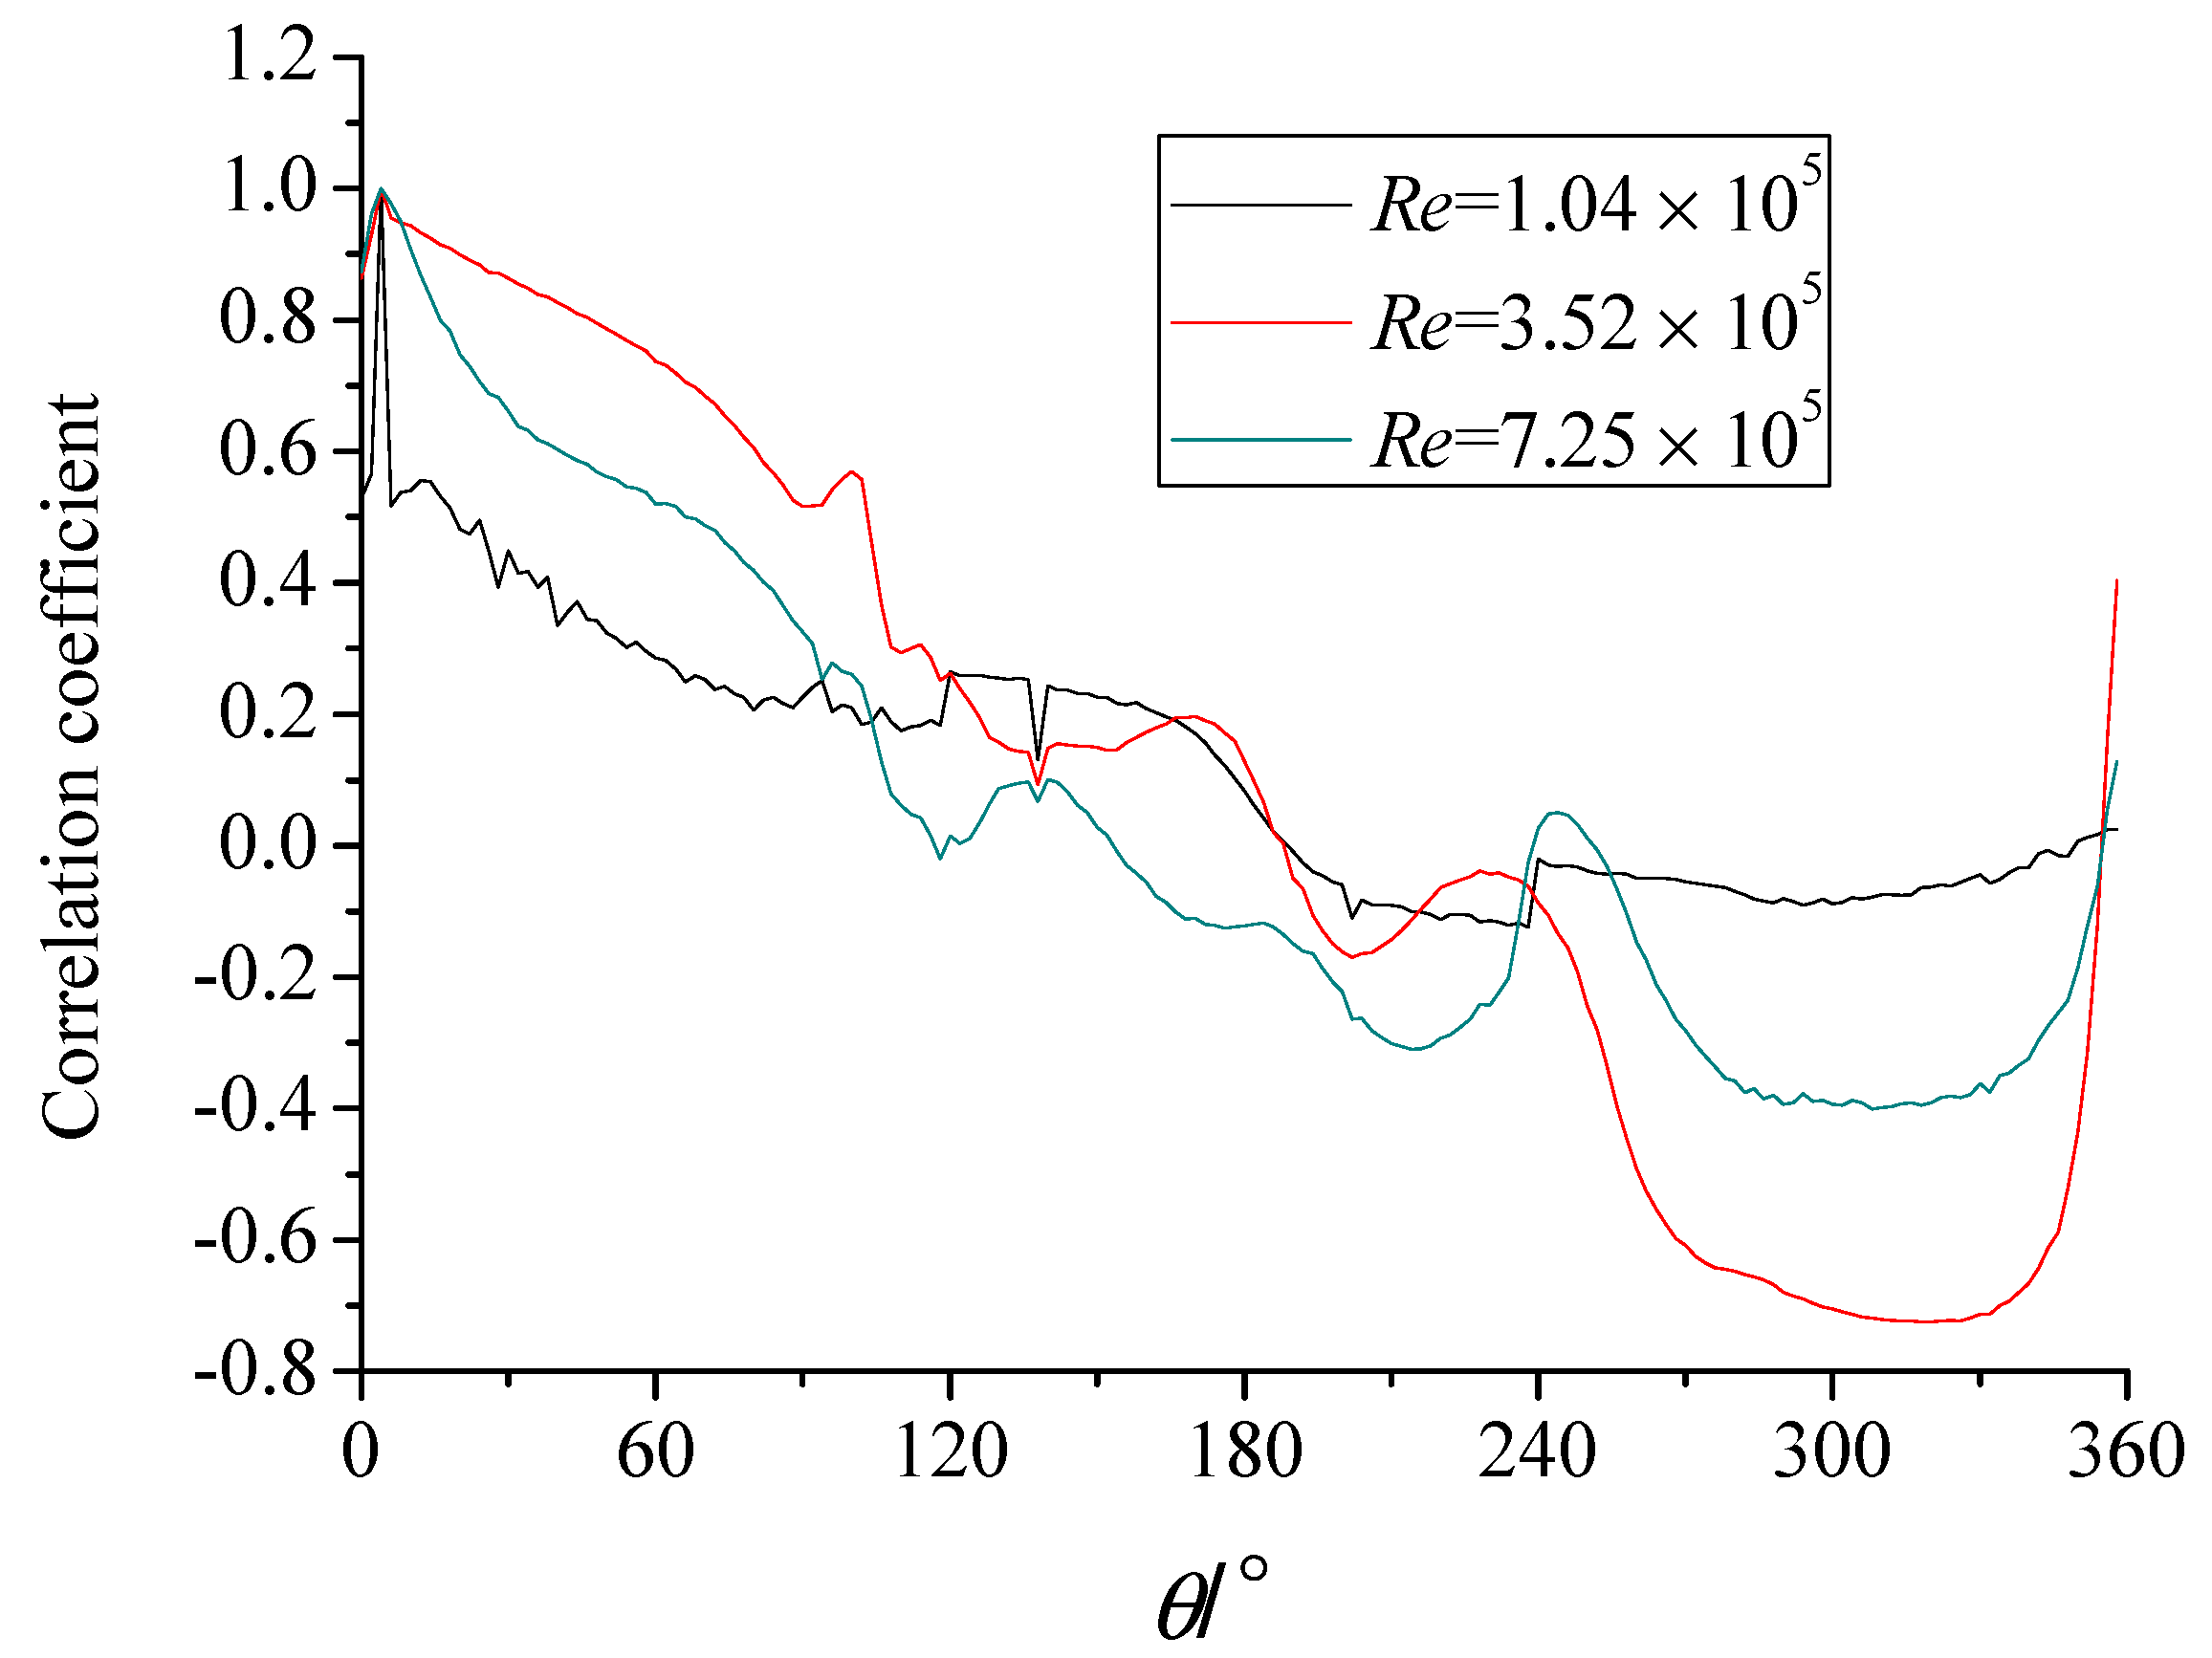
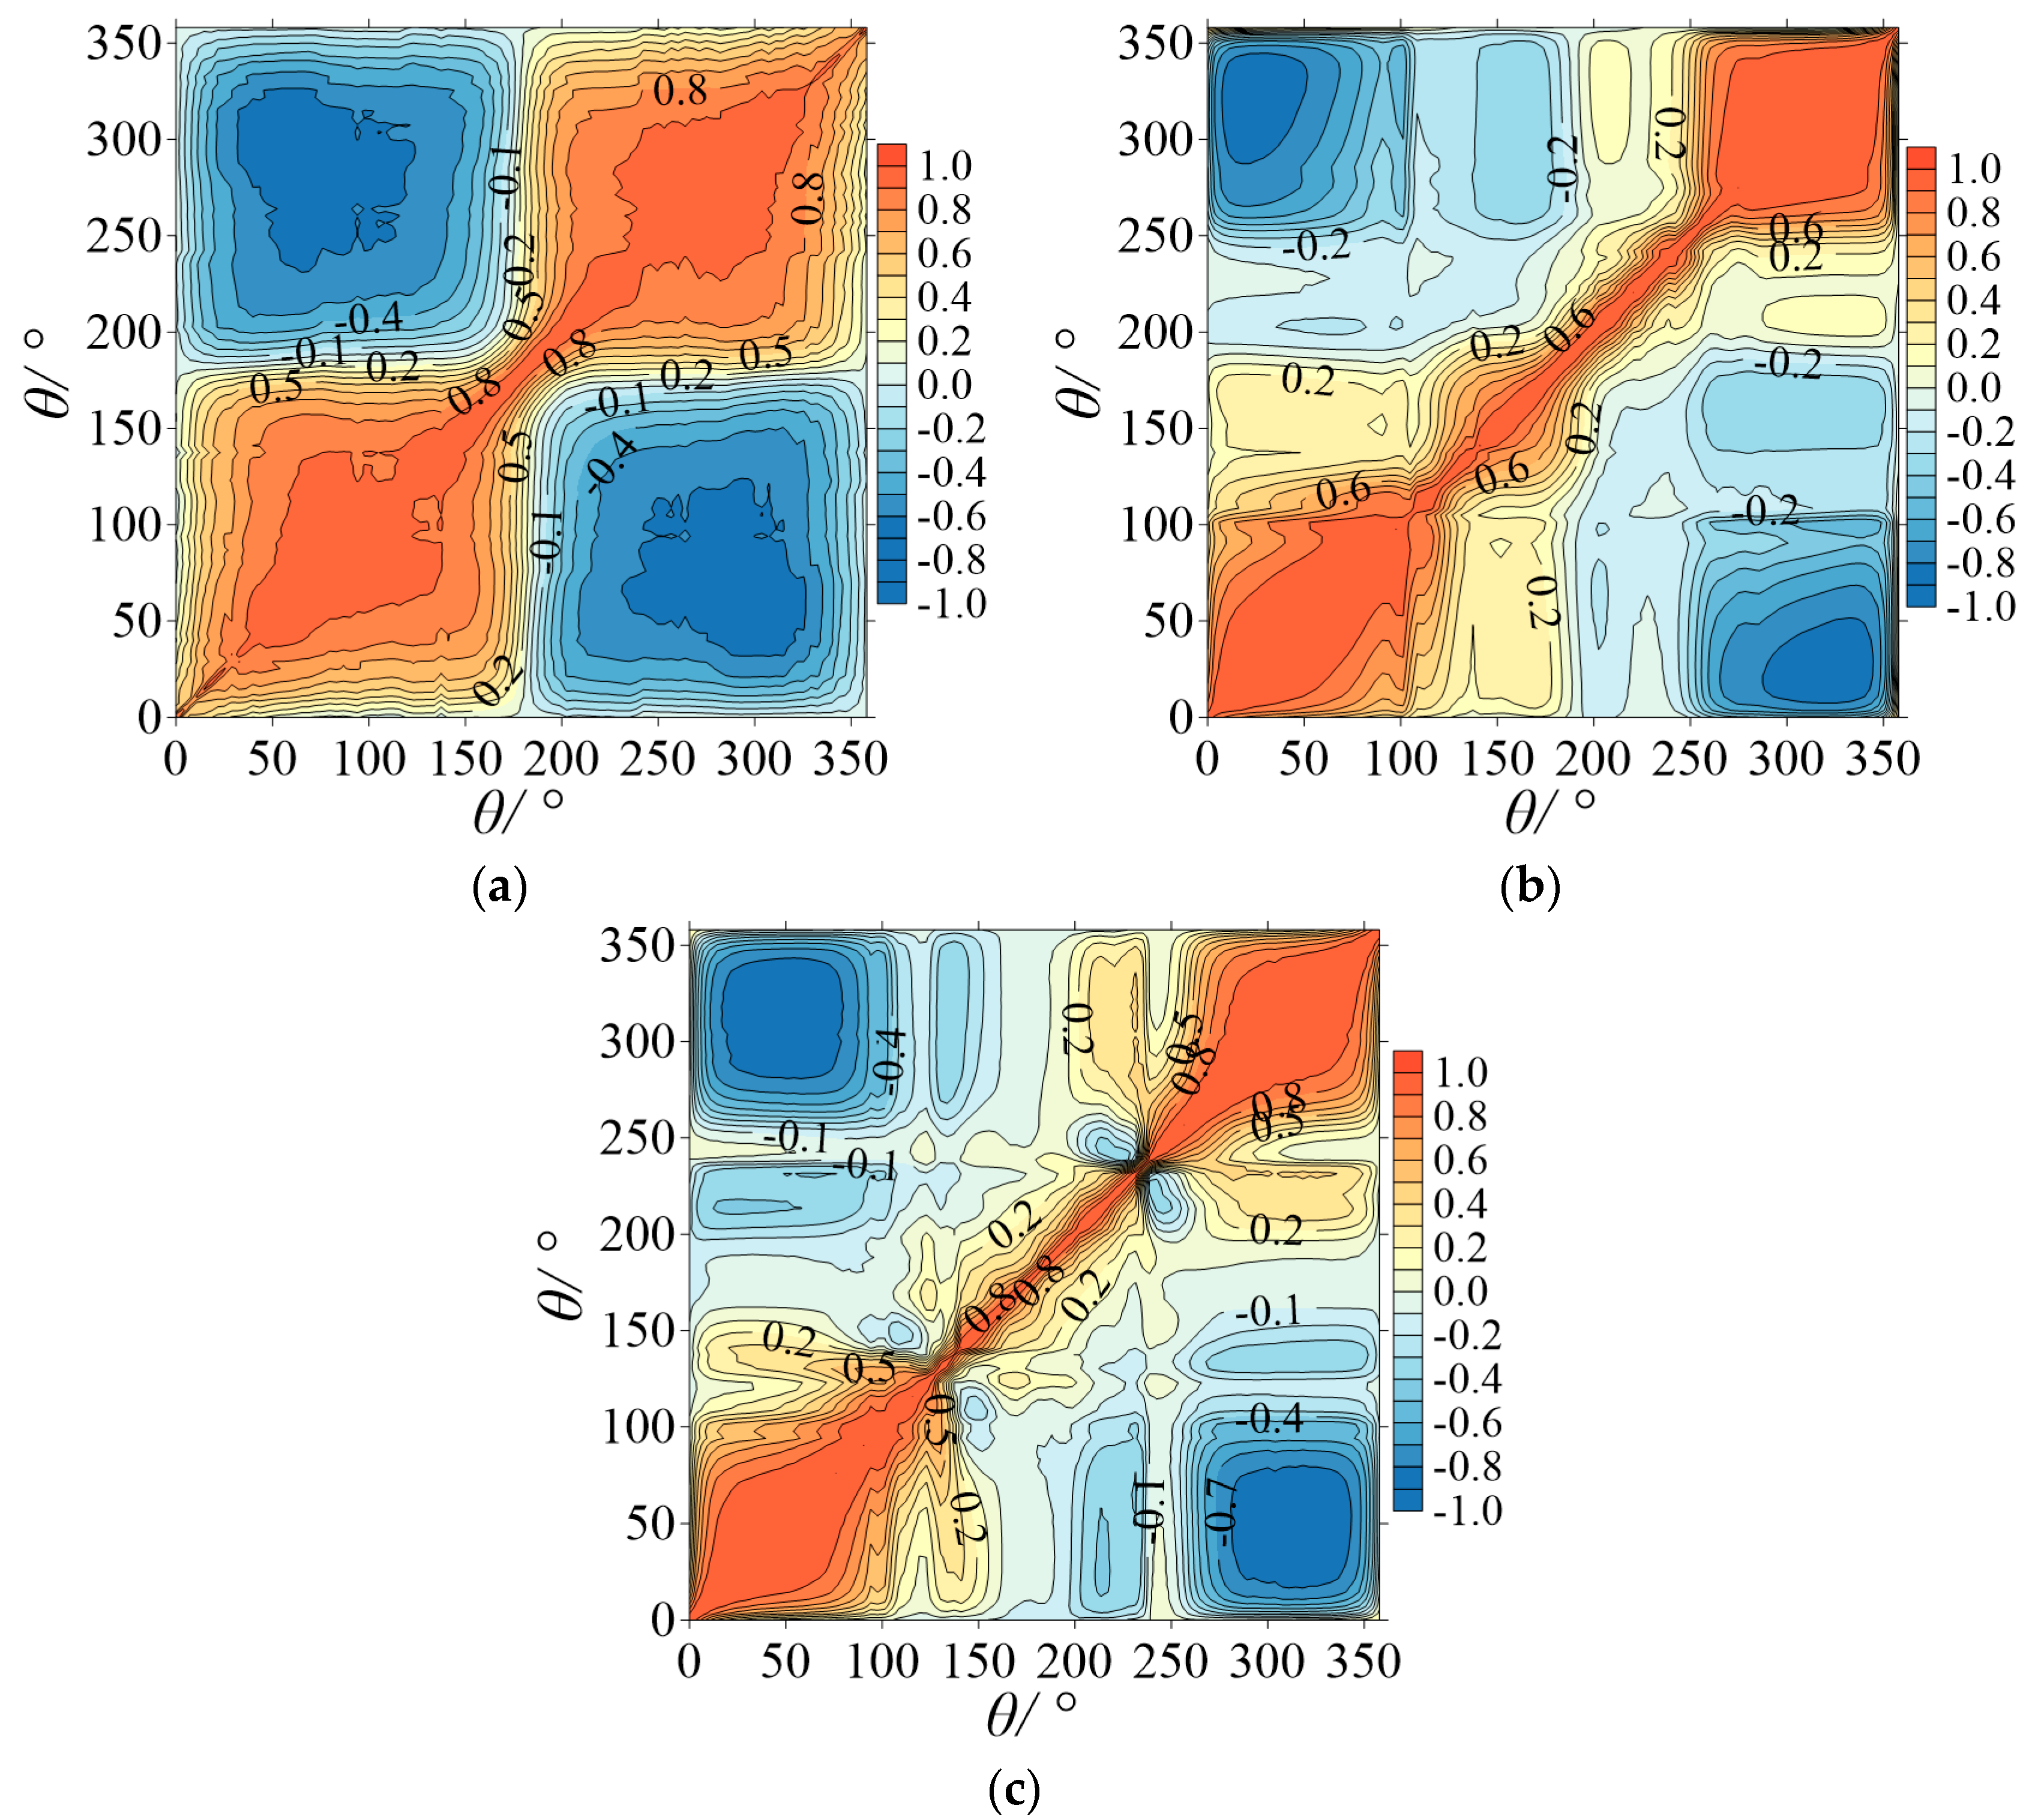
6. Correlation of Wind Pressure
6.1. In the Smooth Flow
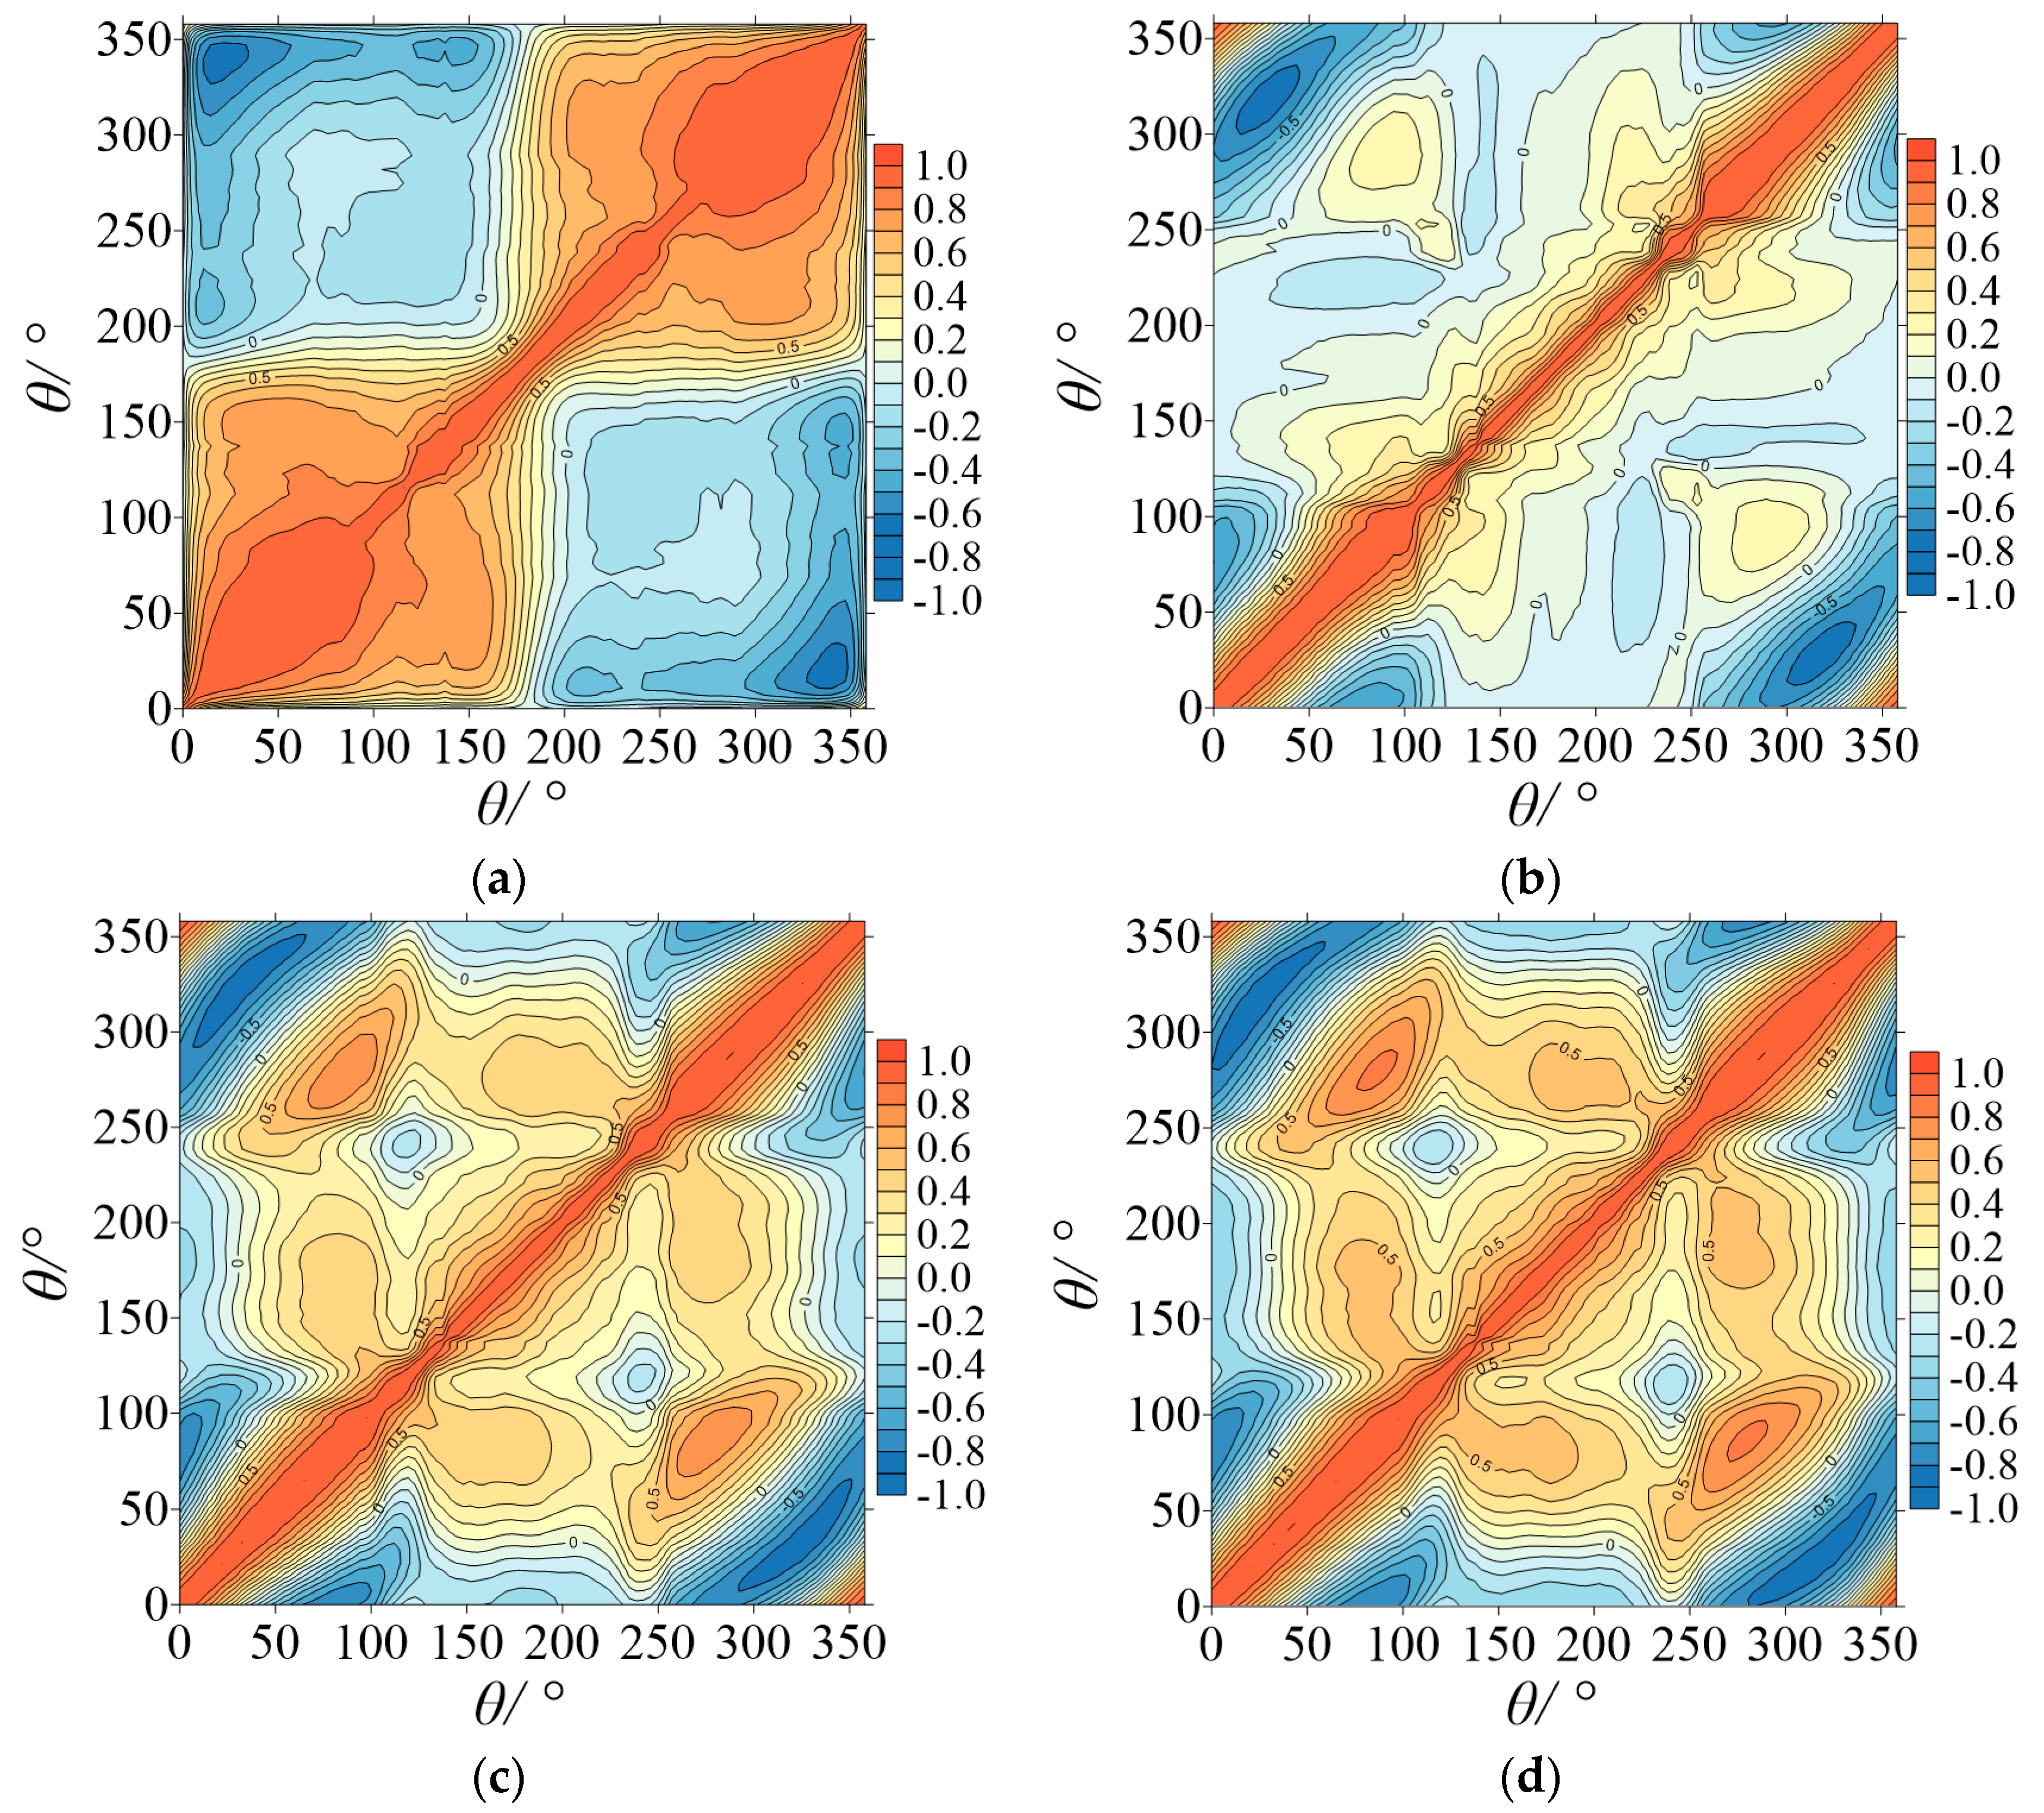
6.2. In the Turbulent Flow
7. Conclusions
Author Contributions
Funding
Conflicts of Interest
References
- Niemann, H.J.; Holscher, N. A review of recent experiments on the flow past circular cylinders. J. Wind Eng. Ind. Aerodyn. 1990, 33, 197–209. [Google Scholar] [CrossRef]
- Simiu, E.; Scanlan, R.H. Wind Effects on Structures: Fundamentals and Applications to Design; John Wiley & Sons Inc.: New York, NY, USA, 1996. [Google Scholar]
- Homes, J.D. Wind Loading of Structures; CRC Press: New York, NY, USA, 2015. [Google Scholar]
- Roshko, A. On the Development of Turbulent Wakes from Vortex Streets; NACA Report 1191; NACA: Washington, DC, USA, 1954. [Google Scholar]
- Achenbach, E. Influence of surface roughness on the cross-flow around a circular cylinder. J. Fluid Mech. 1971, 46, 321–335. [Google Scholar] [CrossRef]
- Buresti, G. The effect of surface roughness on the flow regime around circular cylinders. J. Wind Eng. Ind. Aerodyn. 1981, 8, 105–114. [Google Scholar] [CrossRef]
- Farell, C. Flow around fixed circular cylinders: Fluctuating loads. J. Eng. Mech. Div. 1981, 107, 565–588. [Google Scholar]
- Zdravkovich, M.M. Flow Around Circular Cylinders: Volume 2: Application; Oxford University Press: Oxford, UK, 1997. [Google Scholar]
- Sumer, B.M. Hydrodynamics around Cylindrical Structures; World Scientific: Singapore, 2006. [Google Scholar]
- Schewe, G. On the force fluctuations acting on a circular cylinder in crossflow from subcritical up to transcritical Reynolds numbers. J. Fluid Mech. 1983, 133, 265–285. [Google Scholar] [CrossRef]
- Norberg, C. An experimental investigation of the flow around a circular cylinder: Influence of aspect ratio. J. Fluid Mech. 1994, 258, 287–316. [Google Scholar] [CrossRef]
- Grove, A.S.; Shair, F.H.; Petersen, E.E. An experimental investigation of the steady separated flow past a circular cylinder. J. Fluid Mech. 2006, 19, 60–80. [Google Scholar] [CrossRef]
- Liu, Q.; Shao, Q.; Zheng, Y.; Li, C.; Ma, V.; Liu, X. Experimental study on Reynolds number effect on aerodynamic pressure and forces of cylinder. J. Exp. Fluid Mech. 2016, 30, 7–13. (In Chinese) [Google Scholar]
- Franke, R.; Rodi, W.; Schönung, B. Numerical calculation of laminar vortex-shedding flow past cylinders. J. Wind Eng. Ind. Aerodyn. 1990, 35, 237–257. [Google Scholar] [CrossRef]
- Anagnostopoulos, P. Numerical investigation of response and wake characteristics of a vortex-excited cylinder in a uniform stream. J. Fluids Struct. 1994, 8, 367–390. [Google Scholar] [CrossRef]
- Michael, B. A challenging test case for large eddy simulation: High Reynolds number circular cylinder flow. Heat Fluid Flow 2000, 21, 648–654. [Google Scholar]
- Catalano, P.; Wang, M.; Iaccarino, G.; Moin, P. Numerical simulation of the flow around a circular cylinder at high Reynolds numbers. Int. J. Heat Fluid Flow 2003, 24, 463–469. [Google Scholar] [CrossRef]
- Fage, A.; Warsap, J.H. The effects of turbulence and surface roughness on the drag of a circular cylinder. ARC RM 1929, 1283, 1–8. [Google Scholar]
- Fage, A.; Falkner, V.M. Further experiments on the flow around a circular cylinder. ARC RM 1931, 1369, 186–198. [Google Scholar]
- Bearman, P.W. On vortex shedding from a circular cylinder in the critical Reynolds number regime. J. Fluid Mech. 1969, 37, 577. [Google Scholar] [CrossRef]
- Surry, D. Some effects of intense turbulence on the aerodynamics of a circular cylinder at subcritical Reynolds number. J. Fluid Mech. 1972, 52, 543–563. [Google Scholar] [CrossRef]
- Cheung, C.K.; Melbourne, W.H. Wind tunnel blockage effect on a circular cylinder in turbulent flows. In Proceedings of the 7th Australasian Hydraulics and Fluid Mechanics Conference, Brisbane, Australia, 18–22 August 1980. [Google Scholar]
- So, R.M.C.; Savkar, S.D. Buffeting forces on rigid circular cylinders in cross flows. J. Fluid Mech. 1981, 105, 397–425. [Google Scholar] [CrossRef]
- Sadeh, W.Z.; Saharon, D.B. Turbulence Effect on Crossflow around a Circular Cylinder at Subcritical Reynolds Numbers; NASA Contractor Report 3622; NASA: Washington, DC, USA, 1982. [Google Scholar]
- Demartino, C.; Ricciardelli, F. Aerodynamics of nominally circular cylinders: A review of experimental results for Civil Engineering applications. Eng. Struct. 2017, 137, 76–114. [Google Scholar] [CrossRef]
- Kubo, Y.; Miyazaki, M.; Kato, K. Effects of end plates and blockage of structural members on drag forces. J. Wind Eng. Ind. Aerodyn. 1989, 32, 329–342. [Google Scholar] [CrossRef]
- Zheng, Y.; Liu, Q.; Liu, X.; Ma, W. Influence of end conditions on aerodynamic force of section models for stay-cables. J. Eng. Mech. 2017, 34, 205–209. (In Chinese) [Google Scholar]
- Achenbach, E. Distribution of local pressure and skin friction around a circular cylinder in cross-flow up to Re = 5 × 10⁶. J. Fluid Mech. 1968, 34, 625–639. [Google Scholar] [CrossRef]
- Wieselsberger, C. Neuere feststellungen uber die gesetze des flussigkeits und luftwiderstands. Phys. Z 1921, 22, 321. [Google Scholar]
- Delany, N.K.; Sorensen, N.E. Low-Speed Drag of Cylinders of Various Shapes; Technical Note 3038; National Advisory Committee for Aeronautics: Washington, DC, USA, 1953. [Google Scholar]
- Güven, O.; Farell, C.; Patel, V.C. Surface-roughness effects on the mean flow past circular cylinders. J. Fluid Mech. 1980, 98, 673–701. [Google Scholar] [CrossRef]
- Achenbach, E.; Heinecke, E. On vortex shedding from smooth and rough cylinders in the range of Reynolds numbers 6 × 10³ to 5 × 10⁶. J. Fluid Mech. 1981, 109, 239–251. [Google Scholar] [CrossRef]


| Iu | Wind Speed v (m/s) | Reynolds Number | Integral Scale (mm) |
|---|---|---|---|
| 0% | 3–36 | 6.21 × 10⁴–7.45 × 10⁵ | 111 |
| 4% | 3–29 | 6.21 × 10⁴–6.00 × 10⁵ | 214 |
| 8% | 3–19 | 6.21 × 10⁴–3.93 × 10⁵ | 360 |
| 12% | 3–15 | 6.21 × 10⁴–3.11 × 10⁵ | 323 |
© 2019 by the authors. Licensee MDPI, Basel, Switzerland. This article is an open access article distributed under the terms and conditions of the Creative Commons Attribution (CC BY) license (http://creativecommons.org/licenses/by/4.0/).
Share and Cite
Yao, J.; Lou, W.; Shen, G.; Guo, Y.; Xing, Y. Influence of Inflow Turbulence on the Flow Characteristics around a Circular Cylinder. Appl. Sci. 2019, 9, 3595. https://doi.org/10.3390/app9173595
Yao J, Lou W, Shen G, Guo Y, Xing Y. Influence of Inflow Turbulence on the Flow Characteristics around a Circular Cylinder. Applied Sciences. 2019; 9(17):3595. https://doi.org/10.3390/app9173595
Chicago/Turabian StyleYao, Jianfeng, Wenjuan Lou, Guohui Shen, Yong Guo, and Yuelong Xing. 2019. "Influence of Inflow Turbulence on the Flow Characteristics around a Circular Cylinder" Applied Sciences 9, no. 17: 3595. https://doi.org/10.3390/app9173595
APA StyleYao, J., Lou, W., Shen, G., Guo, Y., & Xing, Y. (2019). Influence of Inflow Turbulence on the Flow Characteristics around a Circular Cylinder. Applied Sciences, 9(17), 3595. https://doi.org/10.3390/app9173595