Adaptation in Gait to Body-Weight Unloading

1
Department of Health and Human Performance, University of Houston, Houston, TX 77004, USA
2
Center for Neuromotor and Biomechanics Research, University of Houston, Houston, TX 77004, USA
3
Center for Neuro-Engineering and Cognitive Science, University of Houston, Houston, TX 77004, USA
*
Author to whom correspondence should be addressed.
Appl. Sci. 2019, 9(21), 4494; https://doi.org/10.3390/app9214494
Submission received: 30 September 2019
/
Revised: 19 October 2019
/
Accepted: 20 October 2019
/
Published: 23 October 2019
(This article belongs to the Special Issue Movement Biomechanics and Motor Control)
Abstract
:Modifications in load-related sensory input during unloaded walking can lead to recalibration of the body schema and result in aftereffects. The main objective of this study was to identify the adaptive changes in gait and body-weight perception produced by unloaded walking. Gait performance during treadmill walking was assessed in 12 young participants before and after 30 min of unloaded walking (38% body weight) by measuring lower limb kinematics, temporal gait measures, and electromyography (EMG). A customized weight-perception scale was used to assess perception of body weight. Participants perceived their body weight to be significantly heavier than normal after unloading while walking. Angular displacement about ankle and knee was significantly reduced immediately after unloaded walking, while temporal gait parameters remained unchanged. The EMG activity in some muscles was significantly reduced after unloading. These findings indicate that walking at reduced body weight results in alterations in segmental kinematics, neuromuscular activity, and perception of body weight, which are the aftereffects of motor adaptation to altered load-related afferent information produced by unloading. Understanding the adaptive responses of gait to unloading and the time course of the aftereffects will be useful for practitioners who use body-weight unloading for rehabilitation.
1. Introduction
The sensorimotor system is comprised of sensory systems, motor systems, and the central integration processes that help in producing and controlling movements. The vestibular, proprioceptive, and visual systems provide sensory information from the external environment as well as that related to body position and movement. The sensory inputs from these systems are integrated in the central nervous system (CNS) following which appropriate motor commands are generated and sent through the descending pathways to the various body segments. Any changes in the sensory information either due to changes in the environmental condition or body condition will affect movement control. The process that enables us to modify and maintain accurate movements as sensory condition changes is called motor adaptation [1].
Several studies have investigated motor adaptation using a variety of experimental paradigms. One of the ways is by studying the changes in the movement characteristics produced by adding and subsequently removing sensory (visual, proprioceptive, acoustic, and vestibular) distortions or perturbations while performing motor tasks [2,3,4,5]. One of the common locomotor adaptation paradigms involves studying locomotor changes by altering the normal interlimb relationship during walking by changing the speeds of treadmill belts relative to each other (commonly called split-belt treadmill walking [6,7,8]). Adaptive changes in step length and double support time are observed during split-belt walk. Similarly, in another paradigm, the effect of increased trunk rotation during walking was studied by having the subjects walk along the circumference of a rotating disc for 2 h [9]. Subsequently, after the adaptation session, the subjects were found to produce curved walking trajectories. Likewise, adaptive changes in heading direction in response to modifications of the direction of optical flow was also observed after exposing subjects to a visual scene that gave the perception of walking along the perimeter of a room [10].
Body-weight unloading (BWU) using various types of body-weight support systems is used to study locomotor adaptation in response to reduced load input [11,12,13,14]. Load-related sensory information is essential for regulating the timing, phasing, and magnitude of neural activities that generate locomotor patterns during stepping [15,16,17]. They also help in maintaining balance control during locomotion and gait termination [18,19,20]. Lower-body positive pressure (LBPP) is an emerging technology that is used to provide body-weight support [21]. It consists of an air chamber that covers the lower part of the body. When inflated with positive pressure, the lower part of the body is lifted upwards from the hips and the body weight is reduced. LBPP is regarded as one of the superior methods of unweighting when compared to upper-body harness [21]. Upper-body harness partially supports the body weight and results in the formation of pressure points. LBPP on the other hand results in uniform distribution of air pressure around the entire surface of the body while still maintaining normal muscle activation and is thus considered superior [22,23]. Body weight as large as 80% can be unloaded in increments as small as 1% using this system. An antigravity treadmill is a special type of treadmill that is equipped with an LBPP air chamber and provides an opportunity to study locomotor adaptation to BWU. Several studies using either the antigravity treadmill or the vertical harness system have investigated the immediate effects of BWU on metabolic energy expenditure and locomotor performance [12,13,24,25,26]. A linear decrease in stride frequency, vertical contact forces, stance time, peak hip and knee flexion, and extensor and flexor muscles’ activity burst during the stance phase with BWU has been reported [24,26,27,28].
Besides having acute effects on gait performance, exposure to BWU for a short period of time in the order of a few minutes and subsequent reloading can alter movement characteristics [29,30]. Further, prolonged exposure to BWU for a longer period of time in the order of a few months can also produce significant changes in movement characteristics that last for a significant period of time as seen in crewmembers returning from space [20,31,32,33,34]. Due to the fact that adaptive changes produced during spaceflight is coupled with changes in structural and functional characteristics of the neuromuscular system, we cannot compare it with short-term changes that we observe on the ground that are solely produced by reduced body load. However, studying the adaptive changes to short-term BWU can improve our understanding of the mechanism adopted by the sensorimotor system during adaptation. Also, with the increase in use of BWU for treadmill training in patients with neurological impairments, studying the adaptive changes to short-term BWU may provide valuable information to practitioners who administer gait or balance rehabilitation using it [21,35,36].
The main objective of this study was to investigate changes in locomotion produced by 30 min of walking at a reduced body weight, which roughly relates to that of Martian gravity (38% of normal body weight). Locomotion was assessed by measuring temporal gait parameters, changes in joint angles, and neuromuscular activation of the lower limbs before, during, and after the adaptation session. We also assessed the adaptive changes in subjective body-weight perception as a function of movement context (walking, standing, and sitting). Body-weight perception was assessed using a customized weight scale. It was hypothesized that the effect of unloaded walking on weight perception would vary as a function of movement context.
2. Materials and Methods
2.1. Participants
Twelve young and healthy participants (23.7 ± 3.3 years; 6 males and 6 females) participated in the study. The experimental protocol was approved by the institutional review board at the University of Houston and was conducted in accordance with the Declaration of Helsinki. The participants were screened using a modified physical activity readiness questionnaire (PAR-Q) [37]. This questionnaire was used to assess if the participants were physically fit and for any conditions that might affect gait and balance. The participants were excluded if their response was “yes” to any of the questions in the modified PAR-Q.
All the participants attended three data collection sessions, which were conducted on three separate days. Their gait performance was assessed during one of the three sessions before, during, and after the adaptation sessions. On the other two days, participants performed two different tests before and after the adaptation sessions while being seated and while standing (Figure 1). These tests were part of another study. Weight perception was assessed on all the three days before, during, and after the two adaptation sessions. During the adaptation sessions, the participants walked continuously for 30 min while being loaded (100% body-weight/control condition) or unloaded (38% body-weight/unloading condition). Post-adaptation sessions consisted of either continuing to walk, sitting, or standing without any movements. The order of the three sessions as well as the order of the two adaptation sessions (control and unloading condition) within each session were randomized across the participants (Figure 1). An overview of the experimental design is depicted in the flow chart below.
2.2. Body-Weight Unloading
Participants were unloaded using an LBPP antigravity treadmill to unload the body weight. The participants donned a pair of neoprene shorts that were used to zip them into the antigravity treadmill. Once inside the chamber, the inside pressure was calibrated and set to a level that corresponded either to 100% body weight or 38% body weight.
2.3. Gait Assessment
After a familiarization period, baseline gait performance (preadaptation) was measured for a duration of two minutes prior to each adaptation session as the participants walked inside the chamber at normal (100%) body weight at a speed of 1 m/s (Figure 2). Following the baseline assessment, they performed the adaptation session for a period of 30 min. In the case of the control adaptation session, they continued to walk at 100% body weight while, during the unloading adaptation session, they were unloaded to 38% body weight. After the adaptation session, the participants performed the post-adaptation session during which their gait was once again assessed at normal body weight (Figure 1). After this, they were given a mandatory break of at least 10 min before starting the other session.
Participants’ gait performance was assessed by measuring kinematics, electromyography (EMG), and temporal parameters before, during, and after the two adaptation sessions. Lower limb kinematics along the sagittal plane were measured by using goniometers (Biometrics©) attached unilaterally on the right ankle and knee joint. Joint kinematics were restricted to ankle and knee joints since the chamber frame obscures the pelvis and hip making recording of the hip motion prohibitive. Kinematic data were collected at a sampling rate of 1000 Hz. EMG was recorded using bipolar surface electrodes (Delsys© Trigno TM wireless EMG system) at a rate of 2000 Hz. EMG was recorded from four muscles viz tibialis anterior (TA), medial head of gastrocnemius (GA), rectus femoris (RF), and biceps femoris (BF) muscles of the right leg. A pair of foot switches (Biometrics©) were attached to the sole of the right foot, one under the great toe and the other under the heel. The data from the foot switches were recorded at a rate of 1000 Hz and were used to determine foot-fall events in the gait cycle.
2.4. Weight Perception
Weight perception was assessed during all three sessions, both during and after the adaptation sessions. We used a 7-point scale, with 1 being very light and 7 being very heavy. The participants were instructed to mentally assign the weight they perceived prior to the adaptation session as 4 on the 7-point scale that translated to “normal” weight. They were instructed to report their perception of weight relative to this during the adaptation session and at three different time intervals after the adaptation session, which were immediately after (T+0), 5 min (T+5) after, and 10 min (T+10) after the session.
2.5. Data Analysis
Data analysis for temporal gait measures, kinematics, and EMG was primarily focused on 7 epochs for each of the control and unloading conditions (Figure 3). These were:
- Mean of the first 30 strides after one minute of walking before the unloaded or control adaptation session (T0)
- Mean of 30 strides just prior to the completion of the control or unloading adaptation session starting from 29 min (Tduring)
- Mean of the first 30 strides immediately after 30 min of the adaptation session (control and unloading), i.e., immediately post adaptation (T1)
- Mean of 30 strides immediately after the first 100 strides of the post-adaptation session (101–130 strides) (T2)
- Mean of the first 30 strides immediately after 3 min of the post-adaptation session (T3)
- Mean of the first 30 strides immediately after 6 min of the post-adaptation session (T4)
- Mean of the first 30 strides immediately after 9 min of the post-adaptation session (T5).
2.6. Temporal Gait Measures
Temporal gait measures were calculated using the gyroscope data obtained from the Trigno EMG sensor attached to the anterior part of the lower right leg (TA muscle). We used a gait feature extraction algorithm that was used previously in an earlier study [38] to identify three main gait-events: (1) initial contact (IC), (2) mid swing (MS), and (3) terminal contact (TC). These gait events were then used to compute stride time, stance time, and swing time. Stride time was defined as the duration between successive IC points. Stance time was defined as the time between IC and TC of each gait cycle. Swing time was defined as the time between TC of one gait cycle to the IC of the next gait cycle. The temporal gait parameters were then averaged within each epoch of interest.
2.7. Kinematic Measures
Joint angular data recorded from the goniometers were low-pass filtered with a cutoff frequency of 10 Hz [39]. Following this, they were divided into individual strides based on heel-strike events obtained from the foot switches and reduced to 100 data points. Then, the joint-angle waveforms were averaged across 30 strides within each epoch of interest. To facilitate comparison across subjects, the joint-angle waveforms of each of the epochs were normalized to the peak joint angle of the T0 waveform by dividing all the points of the waveform by that peak angle value. Range of motion (ROM) of the joints was then computed as an outcome measure at each epoch as the difference between the maximum and minimum angular displacements of the normalized waveforms.
2.8. EMG Measures
The EMG signals were first band-pass filtered using a second-order Butterworth filter using cutoff frequencies of 10 Hz and 450 Hz, followed by full wave rectification [29]. The rectified signals were then low-pass filtered at a cutoff frequency of 25 Hz to obtain the linear envelope [40]. Following this, the signals were separated into individual strides based on heel-strike events and reduced to 100 data points per stride. Then, the EMG waveforms were averaged across 30 strides within each epoch of interest [41]. Waveforms of all the epochs were normalized to the mean EMG activity of the T0 waveform by dividing all the points of the waveform by that mean value [42]. After this, within each epoch, the EMG activity across 7 different gait phases was calculated individually. This was calculated by taking the average of the points that represent the respective gait phases. For example, the average of points 1 through 12 would represent the mean EMG activity of the loading phase. A breakdown of the percentage of the time represented by each of the 7 gait phases within a gait cycle is described below [43].
- Loading response (1–12%)
- Mid-stance (12–31%)
- Terminal stance (31–50%)
- Pre-swing (50–62%)
- Initial swing (62–75%)
- Mid-swing (75–87%)
- Terminal swing (87–100%)
2.9. Statistical Analyses
All statistical analyses were performed using SPSS V.20 (IBM Corp, Somers, NY, USA). Two-way repeated measures analysis of variance (RANOVA) was performed on each of the temporal (stride time, stance time, and swing time), kinematic (range of motion of knee and ankle joint), and EMG (mean EMG activity) outcome measures separately. The EMG activity of each of the 7 phases of the gait cycle was analyzed separately. The two factors in these analyses were “condition” (control vs. unloading) and epochs (T0, Tduring, and T1–T5). Simple planned contrasts were used to assess changes in the outcome measures across epochs relative to T0 whenever there was a main effect of epoch. Additionally, a simple effects analysis was performed on each of the conditions whenever there was a significant interaction effect. Before performing the ANOVA analysis, data were analyzed to assess whether all the required assumptions were met. Whenever the assumption of sphericity was not fulfilled, the degrees-of-freedom was adjusted using Huyn–Feldt correction.
A nonparametric test (Friedman’s ANOVA) was conducted to test for changes in body-weight perception separately for each of the three sessions. This was followed by a Wilcox signed ranked test to compare differences between different time intervals.
3. Results
3.1. Body-Weight Perception
Perception of body weight remained unchanged during and after the control adaptation session regardless of the movement context. During the unloading condition, there was a significant decrease in perceived body weight during unloaded walking across all the three sessions (Z < −2.71, p < 0.007). There was a significant increase in perceived body weight after unloading at T+0 (Z = −3.06, p < 0.05) and T+5 (Z = −2.81, p < 0.05) during the walking session. Although there was a trend towards increased body-weight perception while seated and standing after unloading, the changes in the scores were not significant (Figure 4).
3.2. Temporal Gait Measures
There was a significant main effect of time (F (3.12,37.49) = 4.56, p = 0.007) on swing time and a significant interaction effect between condition and time (F (2.75,33.00) = 4.04, p = 0.017). Results from the simple effects analysis indicated that the swing time was significantly increased at Tduring (0.54 ± 0.01) relative to T0 (0.52 ± 0.01) during the unloading condition and that it returned to baseline immediately after the adaptation session. However, swing time remained unchanged across time during the control condition. Stride time and stance time remained unchanged across time for both the control and unloading conditions. The average stance and swing times across different epochs for the two conditions are summarized in Figure 5.
3.3. Kinematics
Overall, the ROMs of ankle and knee joints during the unloading condition were significantly less when compared to the control condition (main effect of condition, ankle: F (1, 10) = 15.29, p = 0.003; knee: F (1, 10) = 8.47, p = 0.016). There were no changes in ankle and knee ROMs across time in the control condition. For the unloading condition, the ROM for both the joints was significantly reduced at Tduring (ankle: 2.44 ± 0.20; knee: 1.29 ± 0.04) and T1 (ankle: 2.93 ± 0.17; knee: 1.46 ± 0.05) relative to T0 (ankle: 3.31 ± 0.22; knee: 1.58 ± 0.03). Knee ROM was also reduced at T2 (1.47 ± 0.05). However, it was not different from T0, starting fromT3 through T5 (Figure 6).
3.4. EMG
3.4.1. Rectus Femoris Activity
EMG activity during all seven gait phases remained unchanged after walking in the control condition. For the unloading condition, there was a significant effect of time on EMG activity during loading phase (F (3.07, 30.70) = 7.62, p = 0.001), mid-stance (F (3.24, 32.36) = 5.051, p = 0.005), pre-swing (F (3.15, 31.53) = 2.94, p = 0.046), mid-swing (F (2.94, 29.41) = 4.557, p = 0.01), and terminal swing (F (5.38, 53.85) = 8.90, p < 0.0001). There was reduced activity during unloaded walking (1.08 ± 0.11) relative to T0 (1.45 ± 0.15) in the loading phase. Immediately after unloading (T1), the activity increased (1.80 ± 0.18), following which the activity returned to baseline at T2 (1.65 ± 1.7) and remained unchanged through the subsequent epochs (T2–T5). EMG activity during the mid-stance phase was significantly reduced during unloaded walking (0.66 ± 0.07) relative to T0 (0.96 ± 0.10) and returned to baseline at T1 (0.97 ± 0.11). However, it was subsequently reduced at epochs T2 (0.83 ± 0.08) and T3 (0.86 ± 0.09), following which it returned to baseline at T4 (0.84 ± 0.1) and remained unchanged at T5 (0.83 ± 0.09). During pre-swing, there was no significant change in activity during unloading and immediately after unloading at T1, even though there was a major trend towards reduced activity. However, the activity was significantly reduced starting from T2 (0.8 ± 0.07) through subsequent epochs (T3: 0.81 ± 0.08, T4: 0.80 ± 0.07, and T5: 0.80 ± 0.06) relative to T0 (1.08 ± 0.11). The EMG activity during mid-swing was significantly reduced during unloaded walking (0.61 ± 0.06) relative to T0 (0.80 ± 0.05) and returned to baseline immediately after unloading at T1 and was not different from that of T0. Subsequently, it was reduced from T2 through T5 (T2: 0.66 ± 0.05, T3: 0.69 ± 0.06, T4: 0.66 ± 0.07, and T5: 0.68 ± 0.07). Similar to the mid-swing phase, EMG activity was also reduced in the terminal swing phase, during unloaded walking (0.85 ± 0.09) relative to T0 (1.25 ± 0.10). However, it was not different from that of T0 after unloading from T1 through T5. These changes are summarized in Figure 7.
3.4.2. Biceps Femoris Activity
There were no changes in BF activity after the adaptation session during any of the gait phases in the control condition. However, the BF activity changed in the unloading condition during the terminal stance and mid-swing phases as a function of time. During the terminal stance phase, EMG activity remained unchanged during and immediately after unloaded walking at T1 and T2. However, it was reduced relative to T0 (0.58 ± 0.07) starting from T3 (T3: 0.43 ± 0.07; T4: 0.43 ± 0.07) through T5 (0.41 ± 0.05). BF activity during the mid-swing phase was reduced during unloaded walking (0.83 ± 0.13) relative to T0 (1.37 ± 0.17) and was not different from that of T0 from T1 through T5 (Figure 8).
3.4.3. Gastrocnemius Activity
EMG activity of GA remained unchanged relative to baseline during each of the seven phases in the control condition. There was a significant effect of time for the unloading condition during the mid-stance (F (2.14, 21.43) = 8.46, p = 0.002) and terminal stance phases (F (5.33,53.28) = 32.902, p < 0.001). The EMG activity during both phases was significantly reduced during unloaded walking (mid-stance: 0.77 ± 0.15, terminal stance: 0.81 ± 0.13). However, it was not different relative to T0 (mid-stance: 1.58 ± 0.22, terminal stance: 1.93 ± 0.20) from T1 through T5 (Figure 9).
3.4.4. Tibialis Anterior Activity
As in the case with other muscles, TA activity remained unchanged after the adaptation session in the control condition. There were changes in the muscle activity in the unloading condition only during the mid-swing phase. Specifically, the activity significantly increased immediately after unloaded walking relative to T0 (1.00 ± 0.07) from T1 (T1: 1.19 ± 0.07, T2: 1.20 ± 0.08, T3: 1.18 ± 01, and T4: 1.19 ± 0.1) through T5 (1.24 ± 0.1) (Figure 10). Table 1 provides a summary of changes in EMG activity during and after unloaded walking across different epochs and gait phases.
4. Discussion
The main objective of this study was to investigate the changes in temporal, kinematics, and neuromuscular activity during locomotion produced by 30 min of walking at 38% bodyweight and the second was to test the adaptive changes in body-weight perception in response to 30 min of walking at reduced body weight as a function of movement context (walking, standing, and sitting). The results indicate that 30 min of unloaded walking modifies body-weight perception as a function of movement context. Further, it also modifies gait performance characterized by alterations in the movement of ankle and knee joints and neuromuscular activation patterns, some of which persist up to 10 min after the adaptation period. These results are individually discussed in detail in this section.
4.1. Body-Weight Perception
As expected, participants felt lighter during unloaded walking in all three test sessions. Their perception of body weight after unloaded walking varied as a function of the movement context. It significantly increased after unloading only during the gait session, while it returned to baseline immediately after unloading during the sessions when the participants were seated or stood statically. The increase in perceived body weight observed during the gait session aligns with the finding of increased rate of perceived exertion found after 3 min of unloaded running in a similar study [29]. The increase in perceived body weight only during the gait session could be due to the presence of active movements during walking as opposed to during sitting and standing.
In the literature related to sensory psychology, perception of active touch or touching has been shown to be different from passive touch or the act of being touched [44,45]. Active touch involves a combination of active movement and the sensory feedback that results from touching. Thus, the resulting stimulus during active touch contains two components: exterospecific and propriospecific information. Passive touch, on the other hand, involves only the sensory feedback of the stimulus that is applied on the skin. For example, when we use our hand to touch an object, the movement about all the joints present in the hand and the cutaneous inputs arising from contact are continuously integrated while shaping the percept of the object. However, when being touched by an external stimulus, only the sensory inputs from the cutaneous receptors in the skin and its underlying tissue are available. In other words, active touching involves both objective and subjective sensory information, thus making it comparatively a more enriching experience.
Extending the above theory to the context of the current study, the contexts of sitting and standing can be associated to a “passive experience” of the sensory environment. Conversely, walking can be associated with an “active experience” where the participants had the opportunity to “actively explore” the new sensory environment. Thus, it is possible that the perception of body weight during the active experience was modified as a result of changes in the relationship between the sensory and motor elements that were used in forming the percept of body weight. On the other hand, since only the sensory element related to body-load perception was used in forming the percept of body weight during passive experiences such as during sitting and standing, there was no change in perception of body weight. In summary, the findings of the current study support the notion that different movement contexts can have different sensory consequences associated with them.
4.2. Temporal Gait Measures
The results indicate that there were no significant changes in any of the temporal gait measures during and after unloaded walking, except for swing time, which was significantly increased during unloaded walking. The increase in swing time during unloaded walking corroborates the findings from previous studies [11,18,24,46,47]. This observation of increased swing time with body-weight unloading is in line with the predictions of the ballistic pendulum model of walking, which states that the motion of the swing leg is like that of a pendulum of which the oscillation period is inversely related to gravity. Additionally, the setup of LBPP by itself might also have contributed to this increase in swing time. Specifically, since the lower body is supported in this type of setup, there is less of a threat to postural instability, due to which one can afford to spend a longer time in the swing phase.
The lack of significant changes in temporal parameters following adaptation to unloading could be due to the constraints imposed on the walking performance by the speed and the dynamics of the treadmill and particularly due to the lack of stride to stride variability inherently associated with treadmill walking [48]. Thus, potentially testing the aftereffects of adaptation to unloading during over-ground walking as opposed to treadmill walking could provide additional insights into the adaptive process.
Although not statistically significant, there was a trend towards increased stance time accompanied by a decrease in swing time immediately after unloaded walking (at T1) similar to that reported in another similar study [30]. These changes in stance and swing time after unloading have been proposed as a control strategy adopted by the motor control system to maintain prolonged foot contact with the ground and, hence, to maintain stable balance by increasing the stance time while also decreasing the time spent during the unstable swing phase to prevent the risk of falls following adaptation to unloaded walking. However, since the lower body was securely attached to the antigravity chamber in the current study, there was no risk of falling. Thus, similar trends in the adaptive changes of stance and swing times between the two studies indicate that these changes might have been a direct result of modulation of somatosensory information resulting from changes in body-load sensing mechanisms and not that due to postural instability.
4.3. Kinematics
The range of ankle and knee joint angular displacement was significantly reduced during unloaded walking as in other locomotor studies that were focused on assessing immediate online changes in kinematics in response to body-weight unloading [24,46,47,49]. There was reduced angular motion of ankle and knee joints in the form of aftereffects following the adaptation session (post-unloading) for up to three minutes. These modifications in kinematics similar to those observed during the adaptation phase were found to slowly decay and return to baseline levels by the end of the testing session. There were no changes in ankle or knee angular movement during or after the control adaptation session. This confirms that the kinematic changes observed after unloading are not caused by muscular fatigue.
Ruttley [40] found a significant increase in total ankle and knee angular movement from heel strike to peak knee motion during post-adaptation to unloaded walking. The disparity with the current results could be related to the differences in the nature of the unloading system. Unloading systems using a vertical harness produce inertial forces as a result of the systems mass. Thus, excessive joint excursions are produced to overcome these inertial forces while walking, which could have resulted in an aftereffect manifested as increases in knee and ankle joint excursion after unloaded walking in Reference [40]. Since unloaded walking inside the antigravity treadmill is not influenced by such mechanical constraints, the modifications observed in lower-limb movements in the current study might represent the pure aftereffects of adaptation to unloaded walking. Although the body-weight unloading techniques and the outcome measures used to quantify joint motion in the two studies were different, the fact that there was a distinct recovery curve in both studies indicates that there was an adaptive change in kinematics that was produced by unloaded walking.
4.4. EMG
4.4.1. During Adaptation
In line with the findings from other locomotor studies related to body-weight unloading, we found a significant reduction in the EMG activity of the extensor muscle GA during unloaded walking. This change was observed specifically during the mid-stance and terminal stance phases, which (during loaded walking) are the periods of peak muscle activity. GA enables controlled plantar flexion of the ankle joint in order to shift the center of gravity towards the front and allows lifting of the heel from the ground. The need for forward propulsion during push-off is expected to be reduced with reduced body load. A significant decrease in GA activity combined with reduced ankle-joint motion observed during unloaded walking in the current study supports this argument.
Additionally, we found a decrease in RF activity during mid-stance and later swing phases during unloaded walking. RF does not have a dominant role during mid-stance; however, it is known to play a predominant role during the transitory phases from stance to swing phases and vice versa. During the transition from swing to stance phases, it begins to prepare in a feedforward manner for the large ground reaction forces that the limbs will encounter upon heel strike during the next stance phase. Since the magnitude of the ground reaction forces decreases with unloading, the muscular effort required to counteract these forces at reduced body load is also less. This might be the reason why there was a reduced activity in RF during the later phases of the swing phase during unloaded walking. During the transition from the stance to swing phases, i.e., during the pre-swing phase, it acts as a hip flexor and helps in lifting and propelling the limb into swing. One would expect that the muscular effort required to propel the limb is reduced during unloaded walking. In line with this hypothesis, there was a trend towards reduced RF activity during the pre-swing phase as well, which approached significance (p = 0.065).
4.4.2. Post-Adaptation
Neuromuscular changes after unloading were most evident in RF and TA muscles. Additionally, these changes occurred close to two discrete events in the gait cycle which are characterized by large amounts of energy transfers, namely the heel strike and toe off. These observations are similar to those reported in spaceflight-related locomotor studies pointing towards some potentially common adaptive mechanisms [20,33,42]. As in the case with kinematics, there were no significant changes in neuromuscular activity of any of the muscles either during or after the control adaptation session. This further reiterates that the observed changes in neuromuscular activities after unloading are not caused due to fatigue but rather due to adaptation to unloaded walking. Although statistically insignificant, some visually evident changes in activity of some muscles were observed during certain phases of the gait cycle in the control condition. We speculate that these changes are mere random fluctuations as there are no specific methodological or physiological reasons as to why such changes might occur.
Around heel strike, we saw an increase in RF activity during the loading phase immediately after unloaded walking, combined with a reduction in knee and ankle angular excursion. This could be in response to the large ground reaction forces that the body encountered during the loading phase relative to that encountered during unloaded walking. Layne et al. [20] also found an increase in RF activity during the stance phase of the gait cycle after long-duration spaceflight. It has been suggested that modifications in RF activity combined with increased kinematic variability after spaceflight are attempts to attenuate the energy generated by the ground reaction forces around heel strike that are transmitted to the head [42,48,50,51]. Apart from heel-strike-specific modulations, we also observed a small reduction in RF and BF activity during the mid-stance and terminal stance phases of the gait cycle during some of the epochs. Although RF and BF have limited functional roles during these phases, these changes reflect an overall reinterpretation of sensory inputs as a result of adaptation to unloading.
Around toe off, there was a significant reduction in RF activity during the pre-swing phase after the first 100 strides (T2) post-unloading adaptation session. As mentioned earlier, the RF activity during the pre-swing phase is responsible for lifting the leg so that it can be propelled forward during the swing phase. During unloading, as expected, we saw a reduction in activity during this phase as the muscular effort required to propel the leg is less. Extending this logic, we would expect the muscular effort post-unloading to increase due to the increase in body-weight load. As expected, the RF activity increased at T1 relative to Tduring. This increase in RF activity was however transient, as it was significantly reduced from T2 up to 10 min. A reduction in RF activity was also combined with reduced angular excursion of ankle and knee joints during some epochs.
With regards to TA, we observed an increase in activity during the mid-swing phase. This must have been an attempt by the motor control system to compensate for reduced knee flexion by increasing its activity to increase the dorsiflexion about the ankle joint for adequate clearance of the toe. Since we did not observe any foot-scraping events in any of the subjects, it seems that the ankle dorsiflexion during the mid-swing phase was sufficient for toe clearance.
The above patterns of reduced RF activity during the pre-swing phase and increased TA activity during the mid-swing phase of the gait cycle were also observed after long-duration spaceflight during treadmill walking [20]. The fact that a short exposure of 30 min of body-weight unloading on Earth resulted in similar patterns of neuromuscular changes as those observed after long-duration spaceflight is interesting. This finding suggests that there might be some common adaptive mechanisms regardless of the duration of exposure to unloading. In general, modifications in neuromuscular activations after spaceflight have been suggested to be driven by alterations in the neural drive to the motor neurons. There is compelling evidence in the spaceflight literature that shows alterations in postural muscle activity caused by exposure to weightlessness [52,53,54,55]. Muscle disuse as well as muscle loss are also known to cause changes in neural drive after spaceflight. Furthermore, modifications in proprioceptive functioning has also been suggested to contribute to changes in neuromuscular activation.
4.5. Clinical Implications
Gait-training programs with BWU are designed to provide support to the patient’s body weight to allow for the reestablishment of damaged sensorimotor pathways or emergence of new ones to restore normal walking patterns [22]. Gait alterations observed during and after unloaded walking in the current study suggests that lowering body weight to as low as 38% during gait training is not recommendable if we want to reduce the risk of altering normal gait characteristics. Practitioners should be vigilant about choosing the right combination of body-weight level and walking or running speed for training purposes. Particularly, they have to choose a level that does not alter normal kinematic patterns and neuromuscular activities to a large extent.
5. Conclusions
Alterations in kinematics and neuromuscular activities observed during unloaded walking are a result of the adaptation of the neuromuscular system to the reduction in ground reaction forces, shear forces, foot sole pressure, and joint loads associated with unloading. In particular, these changes are caused due to somatosensory-mediated central changes in the body schema produced by new relationships between sensory and motor elements that are characteristic to an unloaded environment. The continued alterations in kinematics and neuromuscular activities observed after unloading are aftereffects of the adapted state of the body schema. The recovery of kinematics and neuromuscular activity over the course of the post-adaptation phase are indicative of the recalibration process that the body schema undergoes in order to restore the original sensory motor relationships. Similarities in the pattern of changes in neuromuscular activation amplitudes between spaceflight and the current study indicate that there might be some common adaptive mechanisms that are mediated by load-related somatosensory changes. Additionally, these alterations in kinematics and neuromuscular characteristics caution practitioners to choose the optimal level of body-weight unloading for gait training.
6. Future Direction
Two important methodological limitations of this study are worth noting. Firstly, the choice of the level of body-weight unloading was limited to 38% body weight. This prevented us from capturing the adaptive effects across different levels of unloading. Future studies should aim to capture the dose-response relationship between level of unloading and the magnitude of adaptive changes in movement characteristics. This will allow us to determine the optimal level of unloading that can be useful for improving gait in patients while producing the least amount of alterations in the movement and neuromuscular activation patterns. Secondly, assessing gait performance during treadmill walking as opposed to during over-ground walking must have limited us from capturing true adaptive effects of unloading with regards to temporal gait measures.
Additionally, it will be worth exploring the effects of passive unloading during standing inside the antigravity chamber for extended periods of time. Comparing the effects of passive unloading and unloaded walking (active loading) as in the current study will help isolate the effects of inactivity from that of unloading.
Author Contributions
R.K. and C.S.L. participated in the conceptualization, methodology, validation, formal analysis, and writing –review and editing. R.K. participated in the software, investigation, data curation, writing-original draft preparation and visualization. C.S.L. participated in resources, supervision and project administration.
Funding
This research received no external funding.
Acknowledgments
The authors thank Mai Lee and David Young for their assistance in running experiments, Beom-Chan Lee for providing us access to the EMG recording system, and Ajitkumar Mulavara for providing valuable inputs during the conception of the study.
Conflicts of Interest
The authors declare no conflict of interest.
References
- Shadmehr, R.; Smith, M.A.; Krakauer, J.W. Error correction, sensory prediction, and adaptation in motor control. Annu. Rev. Neurosci. 2010, 33, 89–108. [Google Scholar] [CrossRef] [PubMed]
- Mazzoni, P.; Krakauer, J.W. An implicit plan overrides an explicit strategy during visuomotor adaptation. J. Neurosci. 2006, 26, 3642–3645. [Google Scholar] [CrossRef] [PubMed]
- Adams, H.; Narasimham, G.; Rieser, J.; Creem-Regehr, S.; Stefanucci, J.; Bodenheimer, B. Locomotive Recalibration and Prism Adaptation of Children and Teens in Immersive Virtual Environments. IEEE Trans. Vis. Comput. Graph. 2018, 24, 1408–1417. [Google Scholar] [CrossRef] [PubMed]
- Martin, T.A.; Keating, J.G.; Goodkin, H.P.; Bastian, A.J.; Thach, W.T. Throwing while looking through prisms. II. Specificity and storage of multiple gaze-throw calibrations. Brain 1996, 119 Pt 4, 1199–1211. [Google Scholar] [CrossRef]
- Temple, D.R.; De Dios, Y.E.; Layne, C.S.; Bloomberg, J.J.; Mulavara, A.P. Efficacy of Stochastic Vestibular Stimulation to Improve Locomotor Performance During Adaptation to Visuomotor and Somatosensory Distortion. Front. Physiol. 2018, 9. [Google Scholar] [CrossRef]
- Reisman, D.S.; Bastian, A.J.; Morton, S.M. Neurophysiologic and rehabilitation insights from the split-belt and other locomotor adaptation paradigms. Phys. Ther. 2010, 90, 187–195. [Google Scholar] [CrossRef]
- Torres-Oviedo, G.; Vasudevan, E.; Malone, L.; Bastian, A.J. Locomotor adaptation. Prog. Brain Res. 2011, 191, 65–74. [Google Scholar] [Green Version]
- Helm, E.E.; Reisman, D.S. The Split-Belt Walking Paradigm: Exploring Motor Learning and Spatiotemporal Asymmetry Poststroke. Phys. Med. Rehabil. Clin. N. Am. 2015, 26, 703–713. [Google Scholar] [CrossRef]
- Gordon, C.R.; Fletcher, W.A.; Melvill Jones, G.; Block, E.W. Adaptive plasticity in the control of locomotor trajectory. Exp. Brain Res. 1995, 102, 540–545. [Google Scholar] [CrossRef]
- Mulavara, A.P.; Richards, J.T.; Ruttley, T.; Marshburn, A.; Nomura, Y.; Bloomberg, J.J. Exposure to a rotating virtual environment during treadmill locomotion causes adaptation in heading direction. Exp. Brain Res. 2005, 166, 210–219. [Google Scholar] [CrossRef] [Green Version]
- Davis, B.L.; Cavanagh, P.R.; Sommer, H.J.; Wu, G. Ground reaction forces during locomotion in simulated microgravity. Aviat. Space Environ. Med. 1996, 67, 235–242. [Google Scholar] [PubMed]
- Ivanenko, Y.P.; Grasso, R.; Macellari, V.; Lacquaniti, F. Control of foot trajectory in human locomotion: Role of ground contact forces in simulated reduced gravity. J. Neurophysiol. 2002, 87, 3070–3089. [Google Scholar] [CrossRef] [PubMed]
- Grabowski, A.M. Metabolic and biomechanical effects of velocity and weight support using a lower-body positive pressure device during walking. Arch. Phys. Med. Rehabil. 2010, 91, 951–957. [Google Scholar] [CrossRef] [PubMed]
- Kurz, M.J.; Deffeyes, J.E.; Arpin, D.J.; Karst, G.M.; Stuberg, W.A. Influence of lower body pressure support on the walking patterns of healthy children and adults. J. Appl. Biomech. 2012, 28, 530–541. [Google Scholar] [CrossRef] [PubMed]
- Takakusaki, K. Neurophysiology of gait: From the spinal cord to the frontal lobe. Mov. Disord. 2013, 28, 1483–1491. [Google Scholar] [CrossRef]
- Nielsen, J.B.; Sinkjaer, T. Afferent feedback in the control of human gait. J. Electromyogr. Kinesiol. 2002, 12, 213–217. [Google Scholar] [CrossRef]
- Pearson, K.G. Generating the walking gait: Role of sensory feedback. Prog. Brain Res. 2004, 143, 123–129. [Google Scholar]
- Dietz, V.; Müller, R.; Colombo, G. Locomotor activity in spinal man: Significance of afferent input from joint and load receptors. Brain 2002, 125, 2626–2634. [Google Scholar] [CrossRef]
- Harkema, S.J.; Hurley, S.L.; Patel, U.K.; Requejo, P.S.; Dobkin, B.H.; Edgerton, V.R. Human lumbosacral spinal cord interprets loading during stepping. J. Neurophysiol. 1997, 77, 797–811. [Google Scholar] [CrossRef]
- Layne, C.S.; Lange, G.W.; Pruett, C.J.; McDonald, P.V.; Merkle, L.A.; Mulavara, A.P.; Smith, S.L.; Kozlovskaya, I.B.; Bloomberg, J.J. Adaptation of neuromuscular activation patterns during treadmill walking after long-duration space flight. Acta Astronaut. 1998, 43, 107–119. [Google Scholar] [CrossRef]
- Takacs, J.; Anderson, J.E.; Leiter, J.R.; MacDonald, P.B.; Peeler, J.D. Lower body positive pressure: An emerging technology in the battle against knee osteoarthritis? Clin. Interv. Aging 2013, 8, 983–991. [Google Scholar] [PubMed]
- Kurz, M.J.; Corr, B.; Stuberg, W.; Volkman, K.G.; Smith, N. Evaluation of lower body positive pressure supported treadmill training for children with cerebral palsy. Pediatr. Phys. Ther. 2011, 23, 232–239. [Google Scholar] [CrossRef] [PubMed]
- Ruckstuhl, H.; Kho, J.; Weed, M.; Wilkinson, M.W.; Hargens, A.R. Comparing two devices of suspended treadmill walking by varying body unloading and Froude number. Gait Posture 2009, 30, 446–451. [Google Scholar] [CrossRef] [PubMed]
- Finch, L.; Barbeau, H.; Arsenault, B. Influence of body weight support on normal human gait: Development of a gait retraining strategy. Phys. Ther. 1991, 71, 842–855, discussion 855–856. [Google Scholar] [CrossRef] [PubMed]
- Sylos-Labini, F.; Lacquaniti, F.; Ivanenko, Y.P. Human locomotion under reduced gravity conditions: Biomechanical and neurophysiological considerations. Biomed. Res. Int. 2014, 2014, 547242. [Google Scholar] [CrossRef] [PubMed]
- Newman, D.J.; Alexander, H.L.; Webbon, B.W. Energetics and mechanics for partial gravity locomotion. Aviat. Space Environ. Med. 1994, 65, 815–823. [Google Scholar]
- Fischer, A.G.; Wolf, A. Assessment of the effects of body weight unloading on overground gait biomechanical parameters. Clin. Biomech. (Bristol, Avon) 2015, 30, 454–461. [Google Scholar] [CrossRef]
- Apte, S.; Plooij, M.; Vallery, H. Influence of body weight unloading on human gait characteristics: A systematic review. J. NeuroEng. Rehabil. 2018, 15, 53. [Google Scholar] [CrossRef]
- Sainton, P.; Nicol, C.; Cabri, J.; Barthelemy-Montfort, J.; Berton, E.; Chavet, P. Influence of short-term unweighing and reloading on running kinetics and muscle activity. Eur. J. Appl. Physiol. 2015, 115, 1135–1145. [Google Scholar] [CrossRef]
- Ruttley, T.M. The Role of Load-Regulating Mechanisms in Gaze Stabilization during Locomotion; University of Texas Medical Branch: Galveston, TX, USA, 2007. [Google Scholar]
- Reschke, M.F.; Bloomberg, J.J.; Harm, D.L.; Paloski, W.H.; Layne, C.; McDonald, V. Posture, locomotion, spatial orientation, and motion sickness as a function of space flight. Brain Res. Rev. 1998, 28, 102–117. [Google Scholar] [CrossRef]
- Mulavara, A.P.; Peters, B.T.; Miller, C.A.; Kofman, I.S.; Reschke, M.F.; Taylor, L.C.; Lawrence, E.L.; Wood, S.J.; Laurie, S.S.; Lee, S.M.C.; et al. Physiological and Functional Alterations after Spaceflight and Bed Rest. Med. Sci. Sports Exerc. 2018. [Google Scholar] [CrossRef] [PubMed]
- Layne, C.; Mulavara, A.P.; McDonald, P.V.; Pruett, C.J.; Kozlovskaya, I.B.; Bloomberg, J. Alterations in human neuromuscular activation during overground locomotion after long-duration spaceflight. J. Gravit. Physiol. 2004, 1–16. [Google Scholar]
- Layne, C.S.; Spooner, B.S. Microgravity effects on “postural” muscle activity patterns. Adv. Space Res. 1994, 14, 381–384. [Google Scholar] [CrossRef]
- Berthelsen, M.P.; Husu, E.; Christensen, S.B.; Prahm, K.P.; Vissing, J.; Jensen, B.R. Anti-gravity training improves walking capacity and postural balance in patients with muscular dystrophy. Neuromuscul. Disord. 2014, 24, 492–498. [Google Scholar] [CrossRef] [PubMed]
- Birgani, P.M.; Ashtiyani, M.; Rasooli, A.; Shahrokhnia, M.; Shahrokhi, A.; Mirbagheri, M.M. Can an anti-gravity treadmill improve stability of children with cerebral palsy? In Proceedings of the 2016 38th Annual International Conference of the IEEE Engineering in Medicine and Biology Society (EMBC), Orlando, FL, USA, 16–20 August 2016; pp. 5465–5468. [Google Scholar]
- Thomas, S.; Reading, J.; Shephard, R.J. Revision of the Physical Activity Readiness Questionnaire (PAR-Q). Can. J. Sport Sci. 1992, 17, 338–345. [Google Scholar] [PubMed]
- Fraccaro, P.; Coyle, L.; Doyle, J.; O’Sullivan, D. Real-world Gyroscope-based Gait Event Detection and Gait Feature Extraction. In Proceedings of the eTELEMED, The Sixth International Conference on eHealth, Telemedicine, and Social Medicine, Barcelona, Spain, 24–27 March 2014; pp. 247–252. [Google Scholar]
- Winter, D.A. Human balance and posture control during standing and walking. Gait Posture 1995, 3, 193–214. [Google Scholar] [CrossRef]
- den Otter, A.R.; Geurts, A.C.H.; Mulder, T.; Duysens, J. Speed related changes in muscle activity from normal to very slow walking speeds. Gait Posture 2004, 19, 270–278. [Google Scholar] [CrossRef] [Green Version]
- Shiavi, R.; Frigo, C.; Pedotti, A. Electromyographic signals during gait: Criteria for envelope filtering and number of strides. Med. Biol. Eng. Comput. 1998, 36, 171–178. [Google Scholar] [CrossRef]
- Layne, C.S.; McDonald, P.V.; Bloomberg, J.J. Neuromuscular activation patterns during treadmill walking after space flight. Exp. Brain Res. 1997, 113, 104–116. [Google Scholar] [CrossRef]
- Kharb, A.; Saini, V.; Jain, Y.K.; Dhiman, S. A review of gait cycle and its parameters. IJCEM Int. J. Computat. Eng. Manag. 2011, 13, 78–83. [Google Scholar]
- Gibson, J.J. The Senses Considered as Perceptual Systems; Houghton Mifflin: Oxford, UK, 1966. [Google Scholar]
- Gibson, J.J. Observations on active touch. Psychol. Rev. 1962, 69, 477–491. [Google Scholar] [CrossRef] [PubMed]
- Awai, L.; Franz, M.; Easthope, C.S.; Vallery, H.; Curt, A.; Bolliger, M. Preserved gait kinematics during controlled body unloading. J. Neuroeng. Rehabil. 2017, 14, 25. [Google Scholar] [CrossRef] [PubMed]
- Donelan, J.M.; Kram, R. The effect of reduced gravity on the kinematics of human walking: A test of the dynamic similarity hypothesis for locomotion. J. Exp. Biol. 1997, 200, 3193–3201. [Google Scholar] [PubMed]
- McDonald, P.V.; Basdogan, C.; Bloomberg, J.J.; Layne, C.S. Lower limb kinematics during treadmill walking after space flight: Implications for gaze stabilization. Exp. Brain Res. 1996, 112, 325–334. [Google Scholar] [CrossRef]
- Lewek, M.D. The influence of body weight support on ankle mechanics during treadmill walking. J. Biomech. 2011, 44, 128–133. [Google Scholar] [CrossRef]
- Mulavara, A.P.; Ruttley, T.; Cohen, H.S.; Peters, B.T.; Miller, C.; Brady, R.; Merkle, L.; Bloomberg, J.J. Vestibular-somatosensory convergence in head movement control during locomotion after long-duration space flight. J. Vestib. Res. 2012, 22, 153–166. [Google Scholar]
- Bloomberg, J.J.; Peters, B.T.; Smith, S.L.; Huebner, W.P.; Reschke, M.F. Locomotor head-trunk coordination strategies following space flight. J. Vestib. Res. 1997, 7, 161–177. [Google Scholar] [CrossRef]
- Clément, G.; André-Deshays, C. Motor activity and visually induced postural reactions during two-g and zero-g phases of parabolic flight. Neurosci. Lett. 1987, 79, 113–116. [Google Scholar] [CrossRef]
- Clément, G.; Gurfinkel, V.S.; Lestienne, F.; Lipshits, M.I.; Popov, K.E. Changes of posture during transient perturbations in microgravity. Aviat. Space Environ. Med. 1985, 56, 666–671. [Google Scholar]
- Lestienne, F.G.; Gurfinkel, V.S. Postural control in weightlessness: A dual process underlying adaptation to an unusual environment. Trends Neurosci. 1988, 11, 359–363. [Google Scholar] [CrossRef]
- Pöyhönen, T.; Avela, J. Effect of head-out water immersion on neuromuscular function of the plantarflexor muscles. Aviat. Space Environ. Med. 2002, 73, 1215–1218. [Google Scholar] [PubMed]
Figure 1.
Flow chart describing the experimental design of the study.

Figure 2.
Figure illustrating the setup of lower-body positive pressure (LBPP) or antigravity treadmill.
Figure 2.
Figure illustrating the setup of lower-body positive pressure (LBPP) or antigravity treadmill.

Figure 3.
Flow chart indicating the epochs of interest for data analysis.

Figure 4.
Group median along with the 25th and 75th percentile scores of weight perception during sitting, standing, and walking across different time intervals for the unloading condition. * Significant difference (p < 0.05) relative to T0 of the corresponding condition.
Figure 4.
Group median along with the 25th and 75th percentile scores of weight perception during sitting, standing, and walking across different time intervals for the unloading condition. * Significant difference (p < 0.05) relative to T0 of the corresponding condition.

Figure 5.
Group means (±SEM) of (A) swing time and (B) stance time across different epochs for the control and unloading conditions. * Significant difference (p < 0.05) relative to T0 of the corresponding condition.
Figure 5.
Group means (±SEM) of (A) swing time and (B) stance time across different epochs for the control and unloading conditions. * Significant difference (p < 0.05) relative to T0 of the corresponding condition.

Figure 6.
Group means (±SEM) of normalized range of motion of (A) ankle and (B) knee joint across different epochs during control and unloading conditions. * Significant difference (p < 0.05) relative to T0 of the corresponding condition.
Figure 6.
Group means (±SEM) of normalized range of motion of (A) ankle and (B) knee joint across different epochs during control and unloading conditions. * Significant difference (p < 0.05) relative to T0 of the corresponding condition.

Figure 7.
Group means (±SEM) of EMG activity of the rectus femoris (RF) muscle across different epochs during the (A) loading, (B) mid-stance, (C) pre-swing, (D) mid-swing, and (E) terminal swing phases for control and unloading conditions. * Significant difference (p < 0.05) relative to T0 of the corresponding condition.

Figure 8.
Group means (±SEM) of biceps femoris (BF) muscle activity during the (A) terminal stance and (B) mid-swing phases of the gait cycle during control and unloading conditions across different epochs. * Significant difference (p < 0.05) relative to T0 of the corresponding condition.
Figure 8.
Group means (±SEM) of biceps femoris (BF) muscle activity during the (A) terminal stance and (B) mid-swing phases of the gait cycle during control and unloading conditions across different epochs. * Significant difference (p < 0.05) relative to T0 of the corresponding condition.
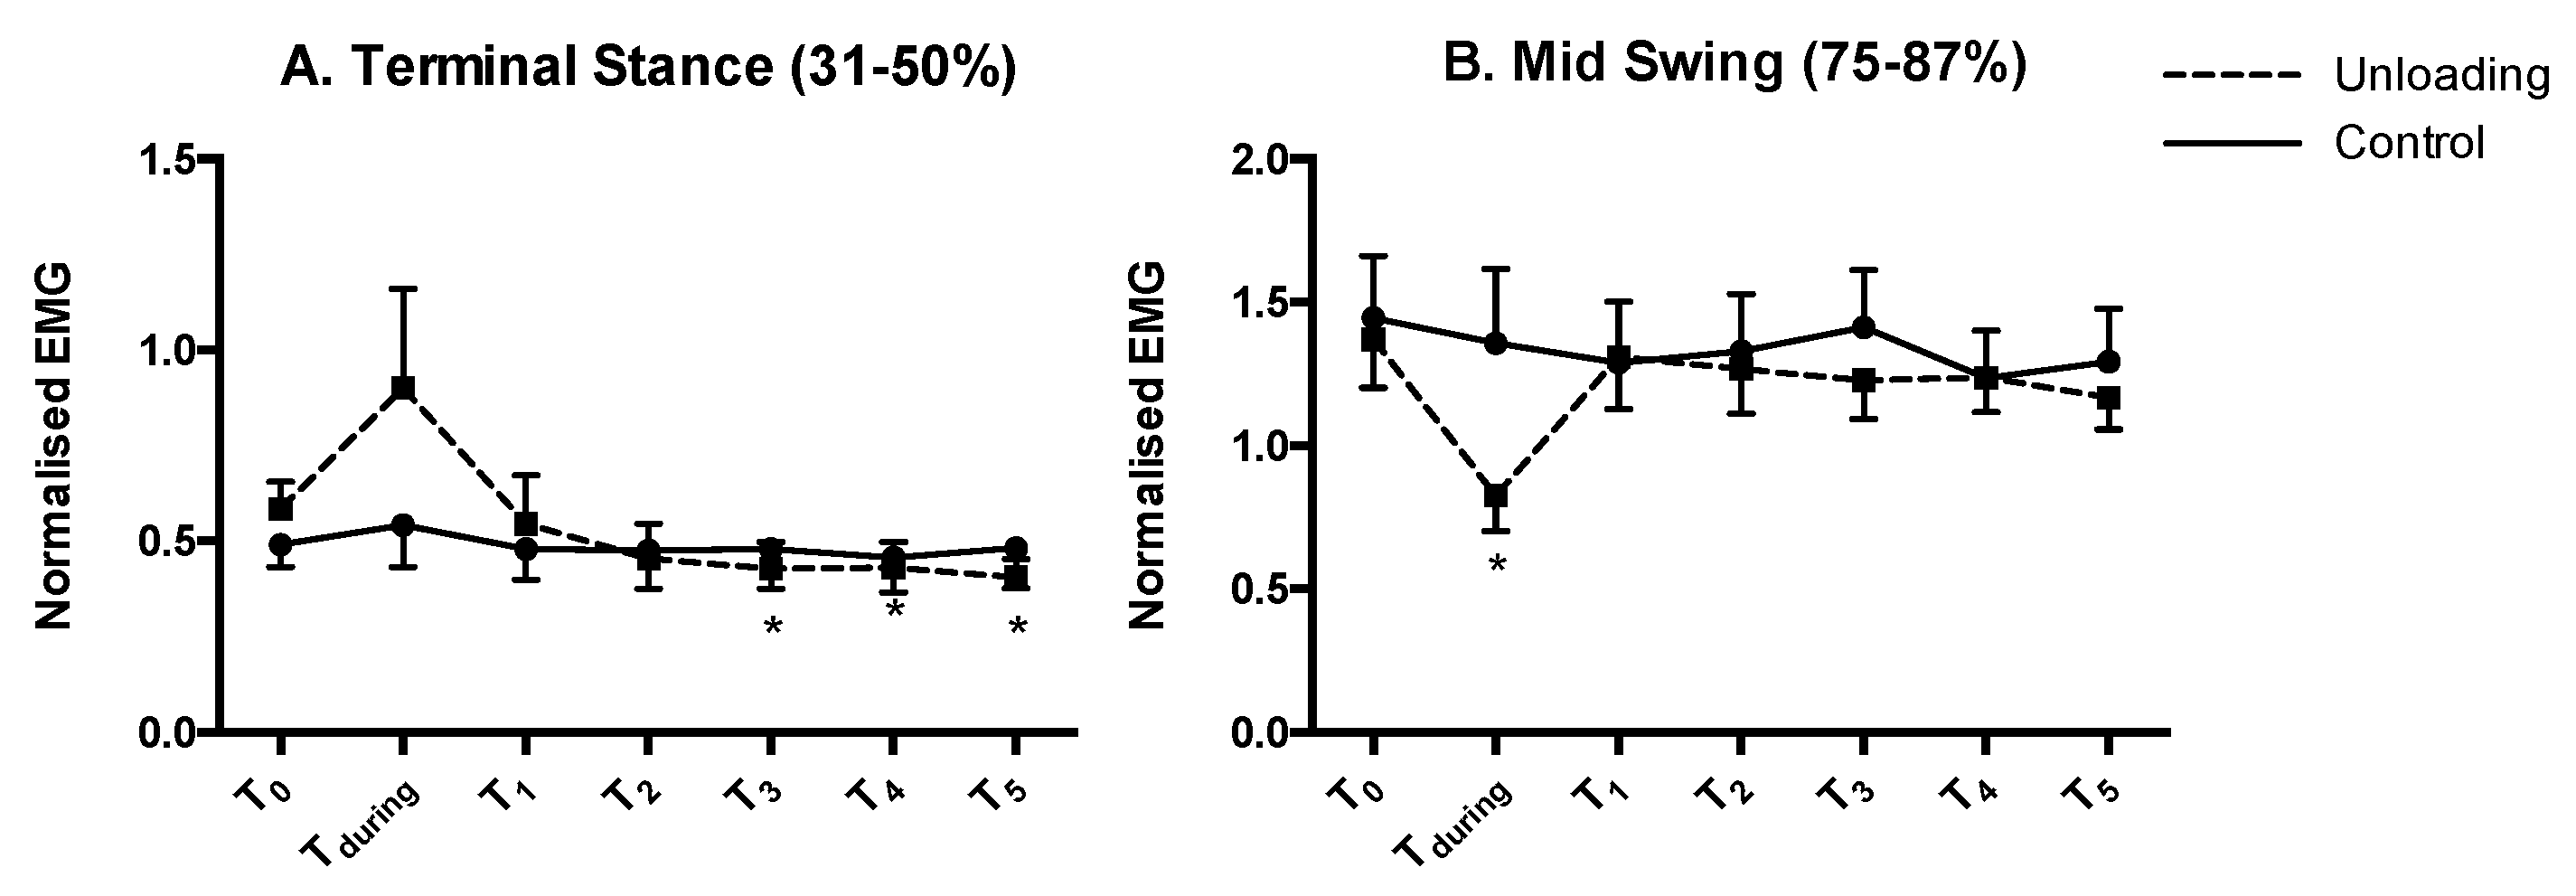
Figure 9.
Group means (±SEM) of the medial head of gastrocnemius (GA) muscle activity during (A) mid-stance and (B) terminal stance during control and unloading conditions across different epochs. * Significant difference (p < 0.05) relative to T0 of the corresponding condition.
Figure 9.
Group means (±SEM) of the medial head of gastrocnemius (GA) muscle activity during (A) mid-stance and (B) terminal stance during control and unloading conditions across different epochs. * Significant difference (p < 0.05) relative to T0 of the corresponding condition.
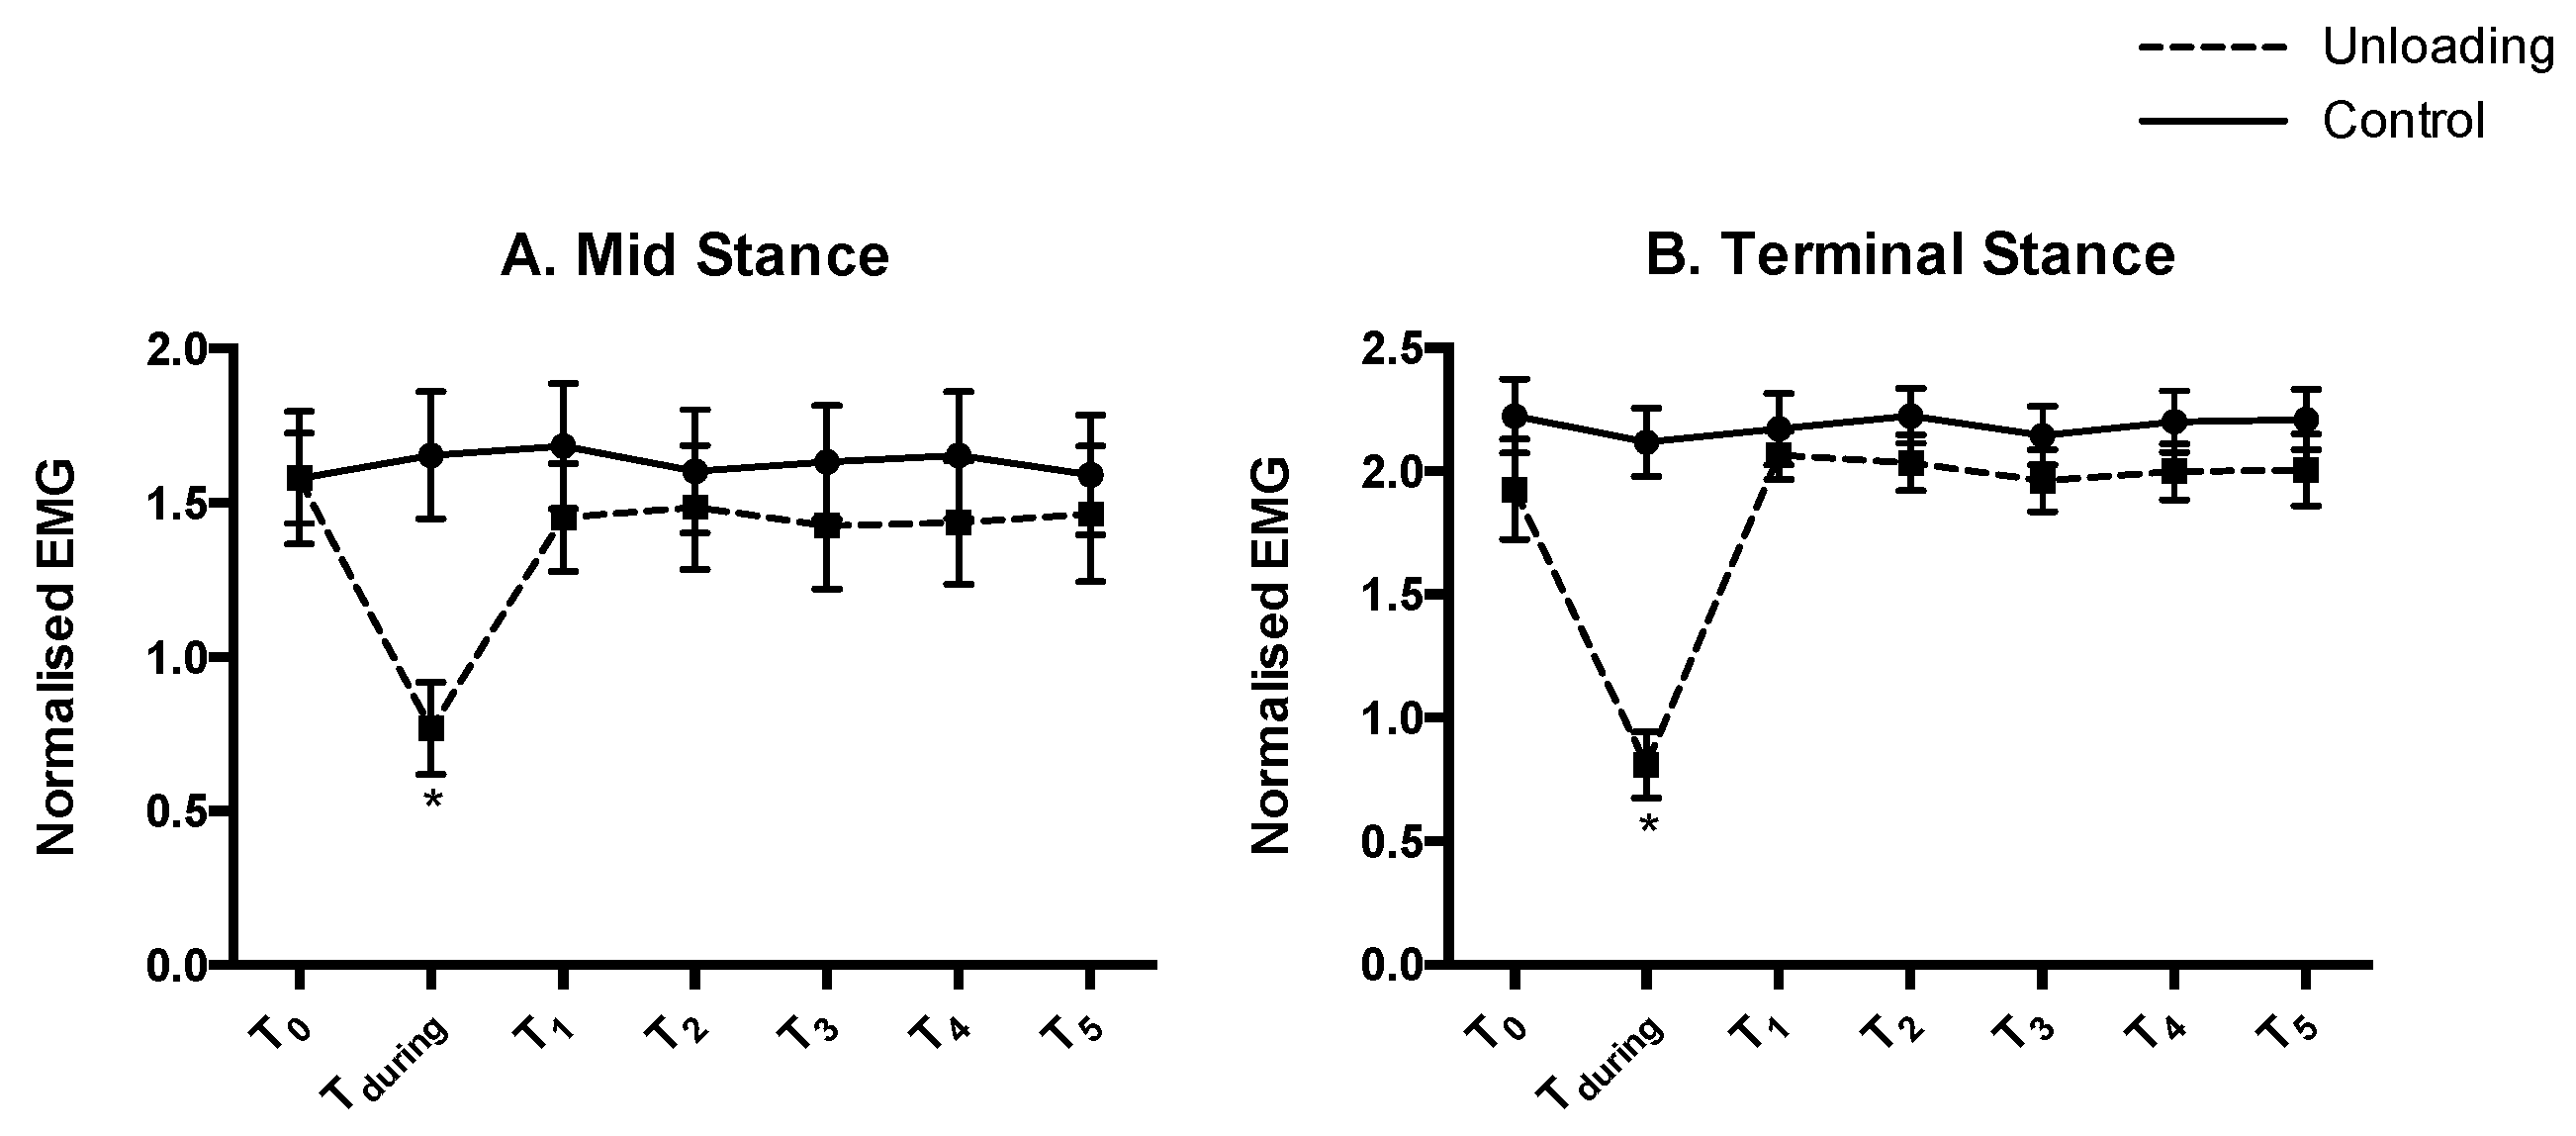
Figure 10.
Group means (±SEM) of tibialis anterior (TA) muscle activity during the mid-swing phase of the gait cycle during control and unloading conditions across different epochs. * Significant difference (p < 0.05) relative to T0 of the corresponding condition.
Figure 10.
Group means (±SEM) of tibialis anterior (TA) muscle activity during the mid-swing phase of the gait cycle during control and unloading conditions across different epochs. * Significant difference (p < 0.05) relative to T0 of the corresponding condition.


Table 1.
A summary of changes in EMG activity of all four muscles across different epochs and gait phases: The upward arrow indicates a significant (p < 0.05) increase, and the downward arrow indicates a significant (p < 0.05) decrease in activity relative to T0, while “-“ indicates no significant changes relative to T0.
| RF | Loading Phase | Mid-Stance | Terminal Stance | Pre-Swing | Initial Swing | Mid-Swing | Terminal Swing |
| Tduring | - | ⇓ | - | - | - | ⇓ | ⇓ |
| T1 | ⇑ | - | - | - | - | - | - |
| T2 | - | ⇓ | - | ⇓ | - | ⇓ | - |
| T3 | - | ⇓ | - | ⇓ | - | ⇓ | - |
| T4 | - | - | - | ⇓ | - | ⇓ | - |
| T5 | - | - | - | ⇓ | - | ⇓ | - |
| BF | Loading Phase | Mid-Stance | Terminal Stance | Pre-Swing | Initial Swing | Mid-Swing | Terminal Swing |
| Tduring | - | - | - | - | - | ⇓ | - |
| T1 | - | - | - | - | - | - | - |
| T2 | - | - | - | - | - | - | - |
| T3 | - | - | ⇓ | - | - | - | - |
| T4 | - | - | ⇓ | - | - | - | - |
| T5 | - | - | ⇓ | - | - | - | - |
| GA | Loading Phase | Mid-Stance | Terminal Stance | Pre-Swing | Initial Swing | Mid-Swing | Terminal Swing |
| Tduring | - | ⇓ | ⇓ | - | - | - | - |
| T1 | - | - | - | - | - | - | - |
| T2 | - | - | - | - | - | - | - |
| T3 | - | - | - | - | - | - | - |
| T4 | - | - | - | - | - | - | - |
| T5 | - | - | - | - | - | - | - |
| TA | Loading Phase | Mid-Stance | Terminal Stance | Pre-Swing | Initial Swing | Mid-Swing | Terminal Swing |
| Tduring | - | - | - | - | - | - | - |
| T1 | - | - | - | - | - | ⇑ | - |
| T2 | - | - | - | - | - | ⇑ | - |
| T3 | - | - | - | - | - | ⇑ | - |
| T4 | - | - | - | - | - | ⇑ | - |
| T5 | - | - | - | - | - | ⇑ | - |
© 2019 by the authors. Licensee MDPI, Basel, Switzerland. This article is an open access article distributed under the terms and conditions of the Creative Commons Attribution (CC BY) license (http://creativecommons.org/licenses/by/4.0/).
Share and Cite
MDPI and ACS Style
Kabbaligere, R.; Layne, C.S. Adaptation in Gait to Body-Weight Unloading. Appl. Sci. 2019, 9, 4494. https://doi.org/10.3390/app9214494
AMA Style
Kabbaligere R, Layne CS. Adaptation in Gait to Body-Weight Unloading. Applied Sciences. 2019; 9(21):4494. https://doi.org/10.3390/app9214494
Chicago/Turabian StyleKabbaligere, Rakshatha, and Charles S. Layne. 2019. "Adaptation in Gait to Body-Weight Unloading" Applied Sciences 9, no. 21: 4494. https://doi.org/10.3390/app9214494
Note that from the first issue of 2016, this journal uses article numbers instead of page numbers. See further details here.