Article

Effects of Pore Structures of Different Maceral Compositions on Methane Adsorption and Diffusion in Anthracite

1
Key Laboratory of Coalbed Methane Resources and Reservoir Formation Process, Ministry of Education, China University of Mining and Technology, Xuzhou 221008, China
2
School of Resources and Geosciences, China University of Mining and Technology, Xuzhou 221116, China
*
Author to whom correspondence should be addressed.
Appl. Sci. 2019, 9(23), 5130; https://doi.org/10.3390/app9235130
Submission received: 23 October 2019 / Revised: 21 November 2019 / Accepted: 25 November 2019 / Published: 27 November 2019
(This article belongs to the Section Earth Sciences)

Abstract

:
The pore structure of coal reservoirs is the main factor influencing the adsorption–diffusion rates of coalbed methane. Mercury intrusion porosimetry (MIP), low-pressure nitrogen adsorption (LP-NA), low-pressure carbon dioxide adsorption (LP-CA), and isothermal adsorption experiments with different macerals were performed to characterize the comprehensive pore distribution and methane adsorption–diffusion of coal. On the basis of the fractal theory, the pore structures determined through MIP and LP-NA can be combined at a pore diameter of 100 nm to achieve a comprehensive pore structural splicing of MIP, LP-NA, and LP-CA. Macro–mesopores and micro-transitional pores had average fractal dimensions of 2.48 and 2.18, respectively. The Langmuir volume (VL) and effective diffusion coefficients (De) varied from 31.55 to 38.63 cm3/g and from 1.42 to 2.88 × 10⁻⁵ s−1, respectively. The study results showed that for super-micropores, a higher vitrinite content led to a larger specific surface area (SSA) and stronger adsorption capacity but also to a weaker diffusion capacity. The larger the average pore diameter (APD) of micro-transitional pores, the stronger the diffusion capacity. The diffusion capacity may be controlled by the APD of micro-transitional pores.

Highlights:
(1)
The pore structure data of MIP and LP-NA can be connected at a pore diameter of 100 nm.
(2)
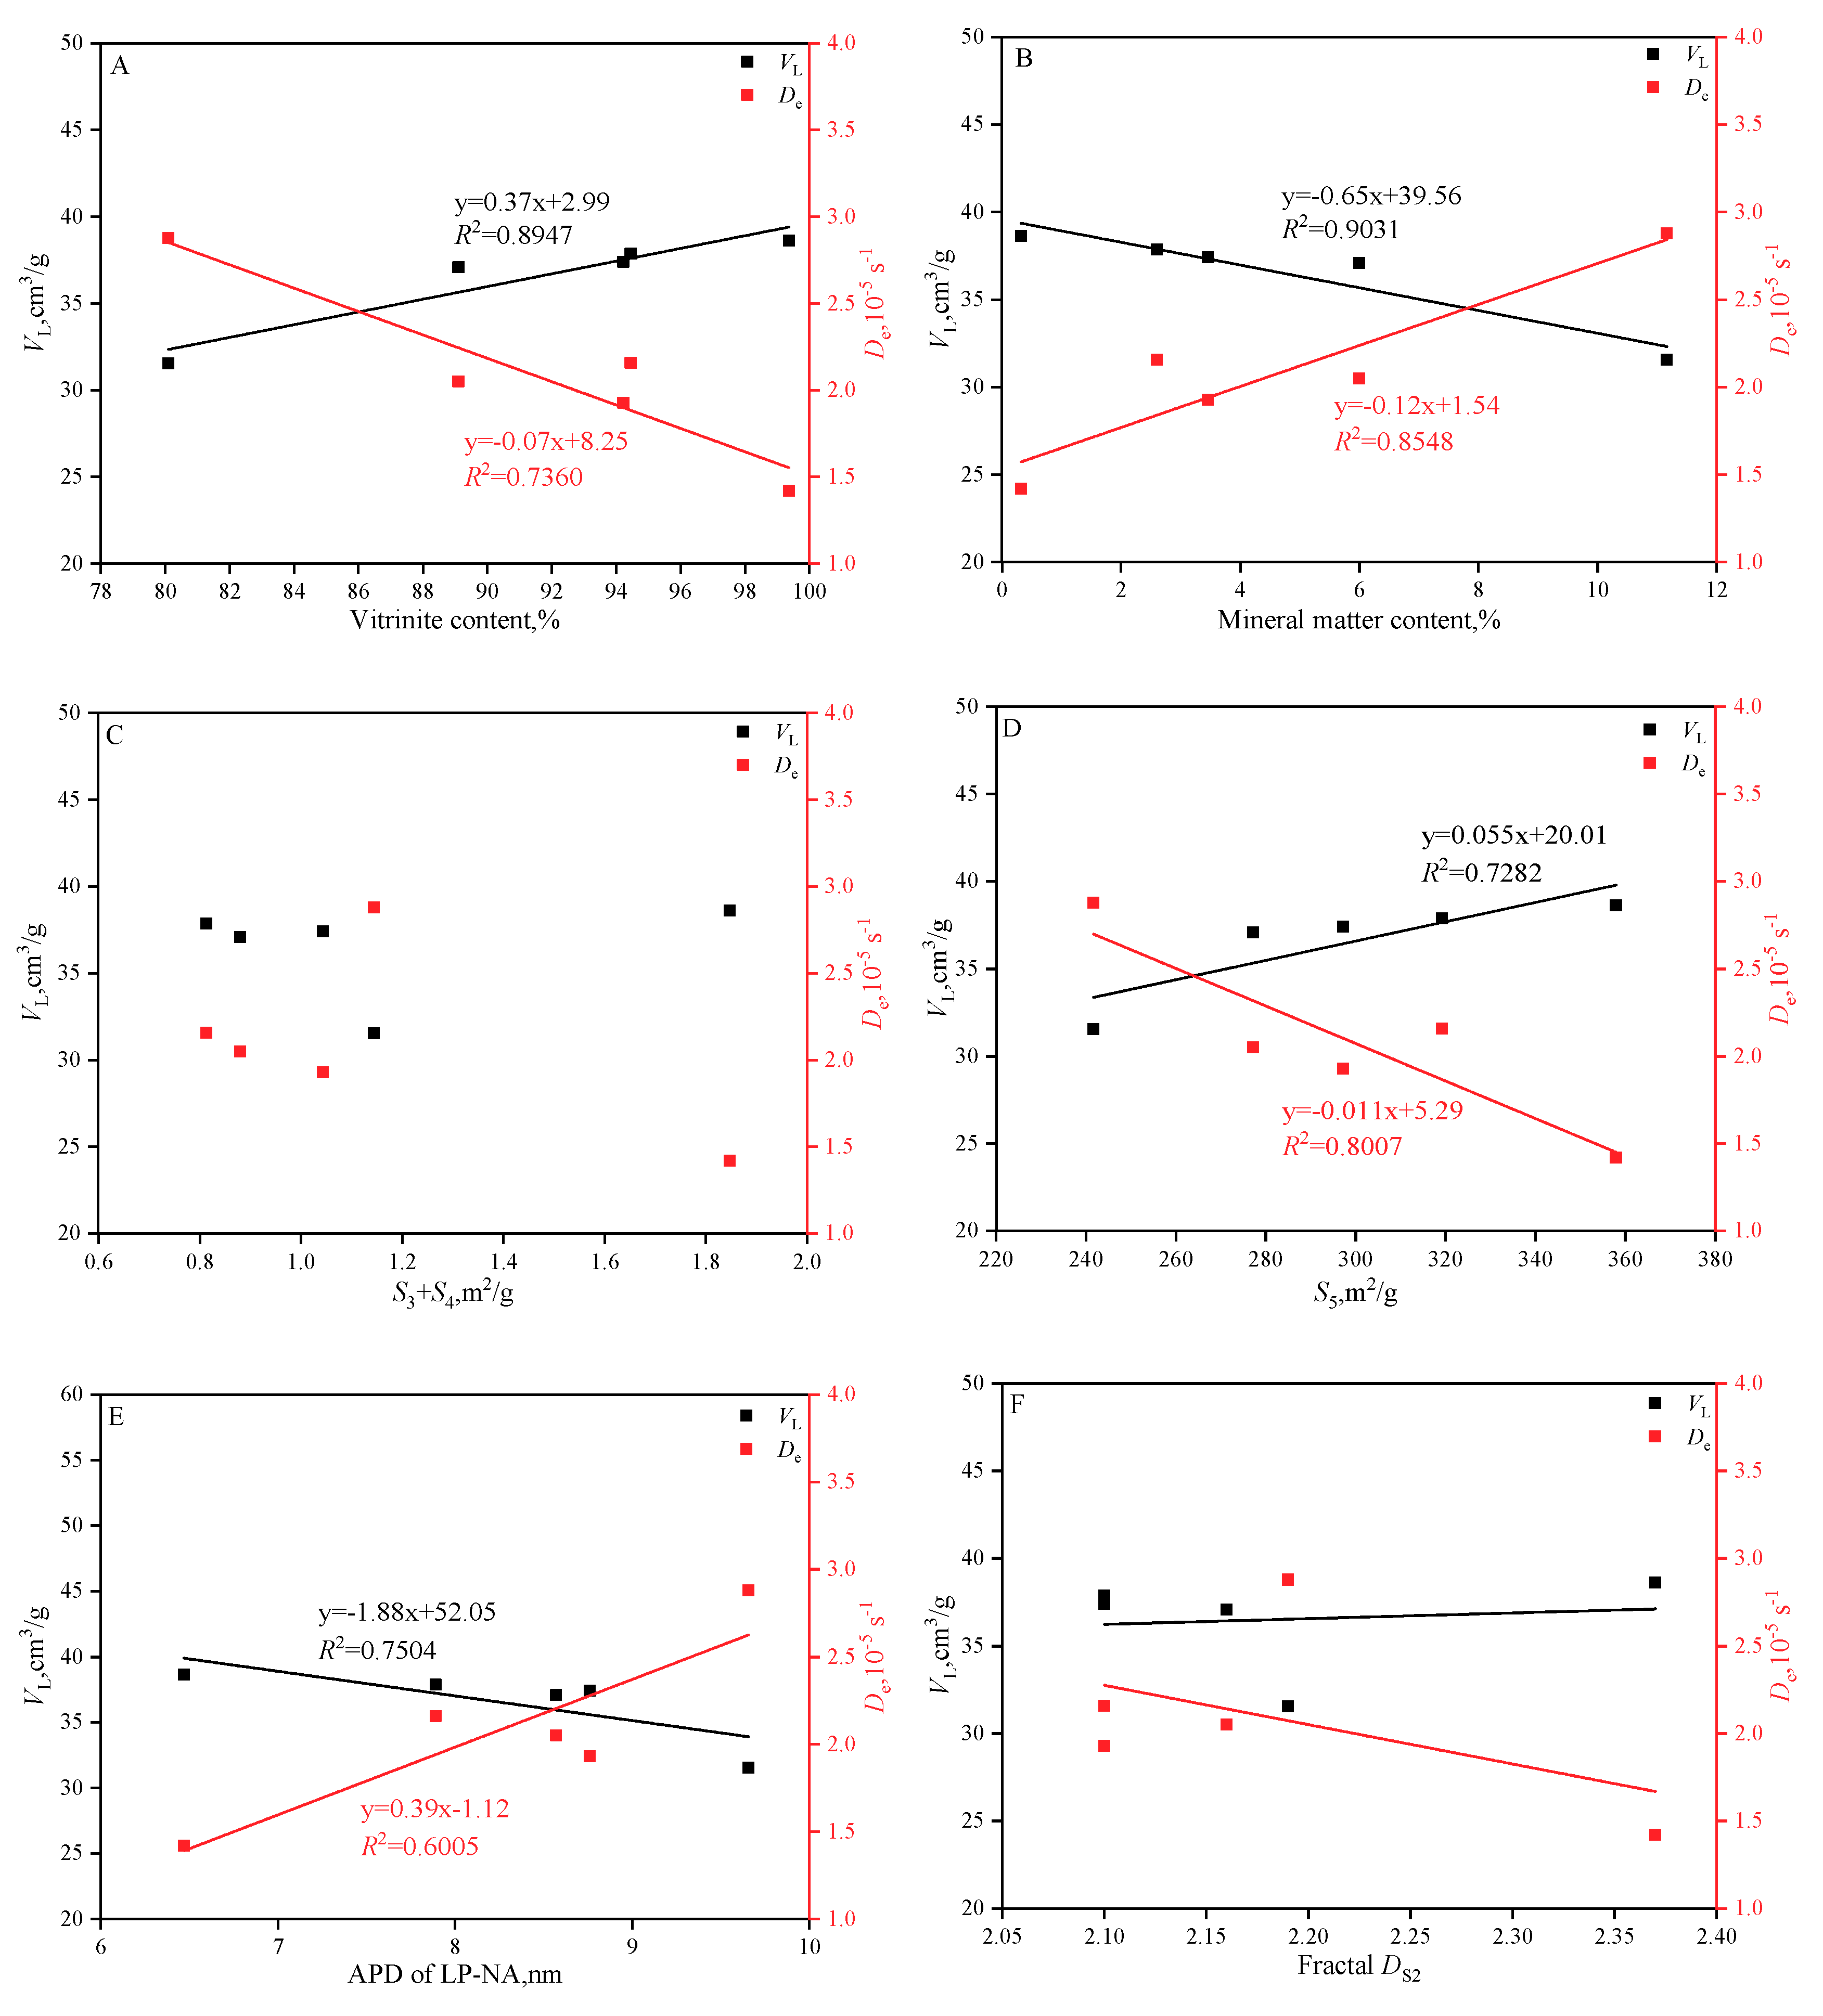
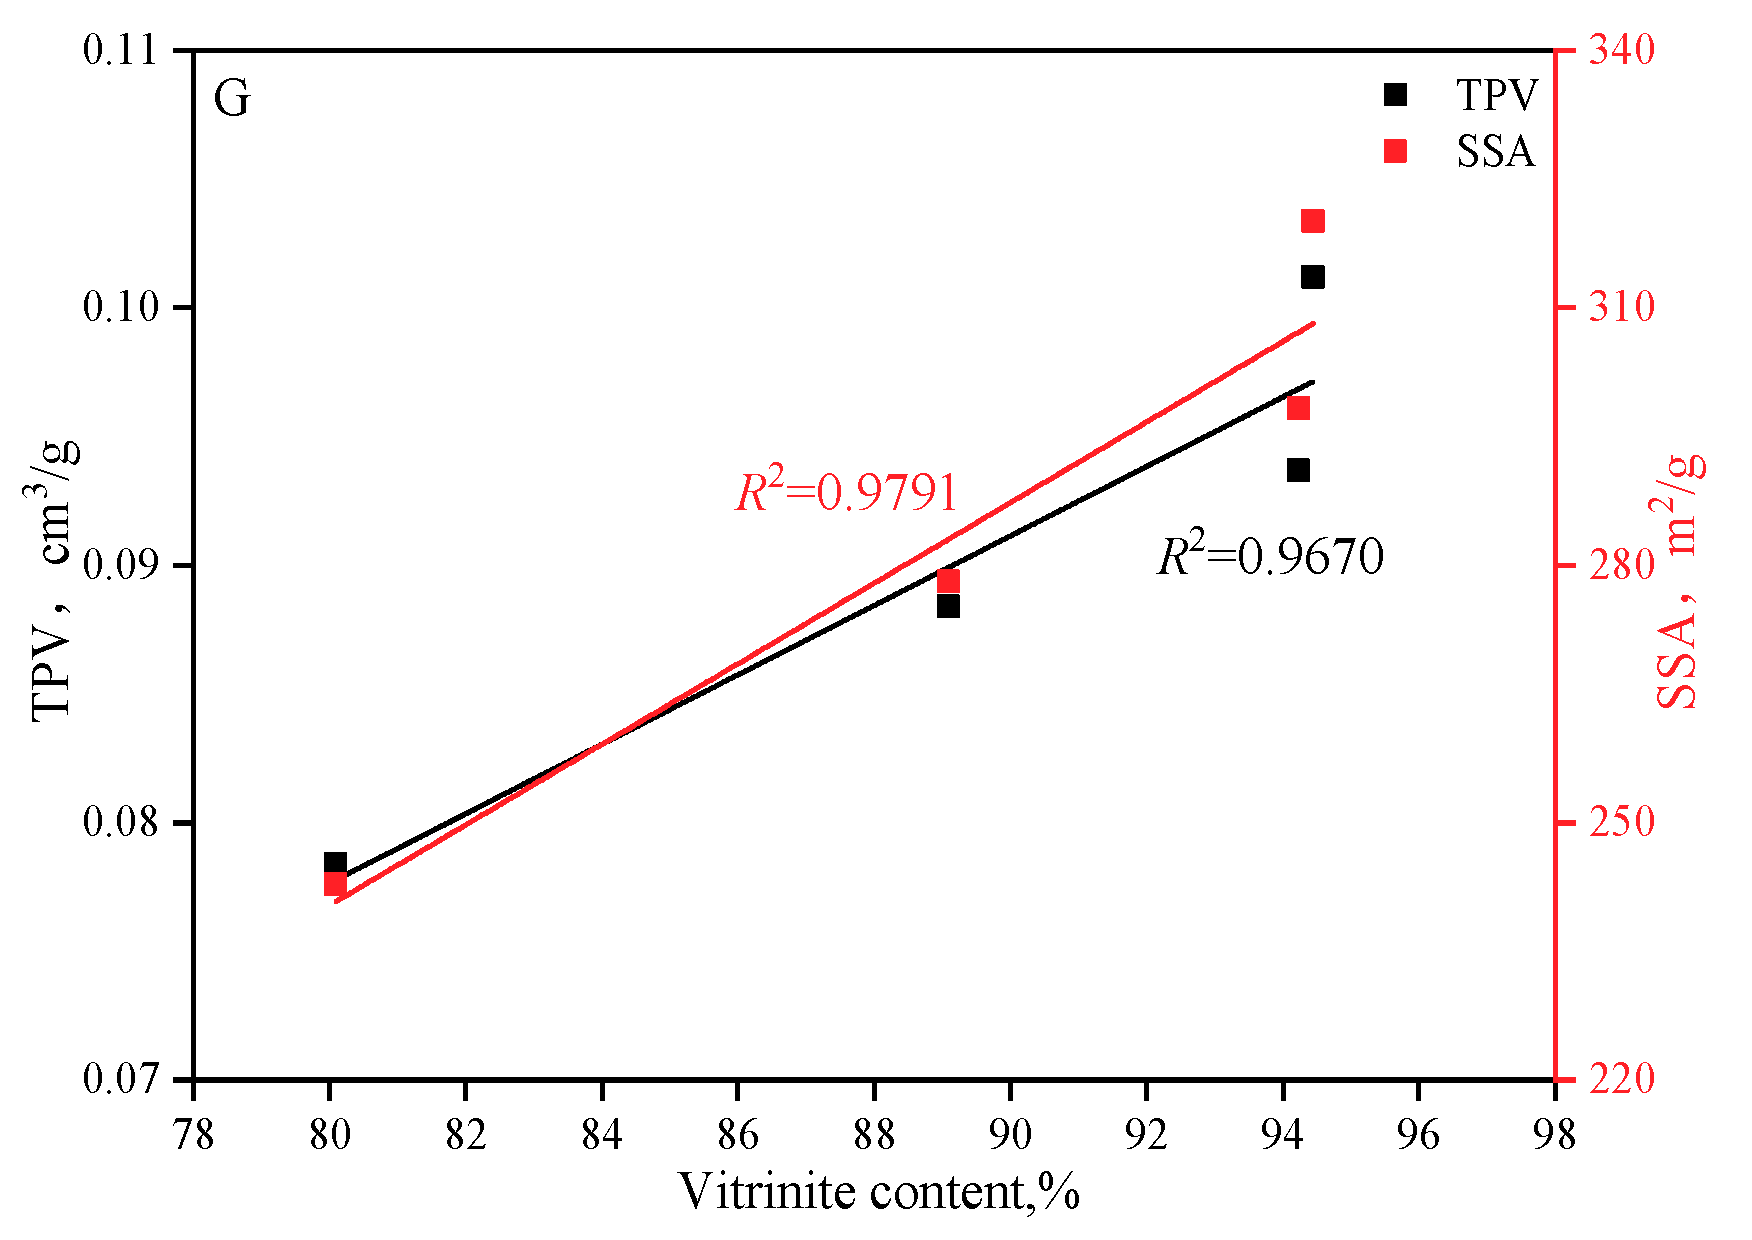
The larger the vitrinite and the SSA, the larger the adsorption capacity but the weaker the diffusion capacity.
(3)
The larger the APD of micro-transitional pores, the stronger the diffusion capacity.

1. Introduction

Coal reservoirs have complex pores and fractures. The pore characteristics of coal in these reservoirs, including porosity, pore structure, and specific surface area (SSA), can directly affect adsorption, desorption, diffusion, and seepage. Goaf caving, auxiliary ventilation equipment, and the drainage method also have a great influence on the productivity of methane [1]. These all can subsequently influence the commercial development of coalbed methane (CBM) [2]. The United States, Canada, and Australia have been successful in developing their CBM resources [3], and Poland has been working on it [4]. The production of CBM from coal in China is gradually increasing. CBM recoverable resources of anthracite in China account for approximately 25% of the country’s total CBM resources, and Qinshui Basin is the most successful block for the exploitation of high-rank coal [5,6]. The CBM production from Qinshui Basin in 2013 reportedly represented more than 85% of the entire amount of CBM production in China [7].
A number of methods have been used for investigating the characteristics of coal pore geometry, including intrusive methods, nonintrusive methods, and image analysis. The intrusive approaches comprise mercury intrusion porosimetry (MIP), low-pressure N2 adsorption (LP-NA), low-pressure CO2 adsorption (LP-CA), and nuclear magnetic resonance (NMR). The nonintrusive methods include small/ultra-small angle neutron scattering and computed tomography (CT). The image analysis methods primarily involve scanning electron microscopy (SEM) and the high-resolution focused ion beam technique [8,9]. Each method, however, has limitations in characterizing the pore size distribution (PSD) of coal because of theoretical or material differences and is only able to detect pores of a certain size [10]. For example, high-pressure MIP can twist pores because of the compressibility of the coal matrix [11,12]. LP-NA is suitable for characterizing pore with sizes between 2 and 100 nm [13], whereas LP-CA can only clearly describe pores smaller than 1.5 nm. SEM, as an intuitive detection method, does not supply quantitative data for entire specimens, whereas CT scans can only recognize macropores and micro-cleats. To overcome these limitations and deficiencies, the combined use of three investigative methods is a practical approach to accurately ascertain the comprehensive PSD of coal specimens [14,15].
Wang et al. [16] found that the pore volume (PV) of micropores is the largest, followed by those of transitional pores, macropores, and mesopores in low- and medium-rank coals (Ro, max, 0.225–0.98%). Jian et al. [17] employed an MIP test to characterize 42 coal samples collected from different low-rank coal-bearing basins, and their results showed that the transitional pore and macropore contents were the highest. Zhang et al. [18] investigated the characteristics of semi-anthracite and found that super-micropores were especially highly developed. Chen et al. found that decreasing coal particle sizes resulted in a continuous increase of macro- and mesopore volumes and specific surface areas [19] and that mylonitic coals have more ink-bottle pores [20].
In contrast, anthracite in China has the following characteristics: highly developed super- micropores and micropores, widely distributed pore structure, minuscule capillaries, high tortuosity, and inadequate pore connectivity [21,22]. The main factors that affect the PSD are coalification, maceral composition, and degree of structural damage [23]. The total pore volume (TPV) changes to the “U” type with the increase of coalification. First, a rapid decrease occurs until the maximum reflectivity (Ro,max) approaches 2.3–2.5%. It thereafter gradually increases with the generation of secondary pores or secondary fractures. The characteristics of different pores vary with the increase in coalification. The macro–mesopores decrease, whereas the super-micropores and micropores exhibit opposite dynamics [24]. Clarkson and Bustin [25] suggested that micropores increased as vitrinite increased and ash decreased. Mastalerz et al. [26] reported that micropores decreased as mineral matter content increased. Gürdal and Yalçın [27] observed that there was a certain correlation between maceral composition and specific surface area, and this correlation had an effect on the Langmuir adsorption volume (VL). Crosdale et al. [28] found that high-inertinite coal had a lower adsorption capacity compared with high-vitrinite coal. For semi-anthracites, there is a significant positive correlation between the amount of super-micropores and their methane adsorption capacity [18].
The fractal theory can be employed to characterize structural and surface irregularities, which directly affect the adsorption capacity of porous media [29,30]. In general, a pore surface is more irregular and complex as the surface fractal dimension approaches the value of 3. The MIP, LP-NA, and NMR techniques can all be used to estimate the fractal dimension of pores [31,32]. On the basis of the MIP test, Wang et al. [16] classified pores into seepage pores and adsorption–diffusion pores. Their results showed that there was a negative correlation between the seepage pore fractal dimension and the coalification degree. Researchers believe that the surface fractal dimension may have a significant influence on the specific surface area according to the LP-NA test, whereas the structure fractal dimension may be more sensitive to ash yield (Ad), moisture content (Mad), pore diameter, and micropore content [33,34]. Zhou et al. [35] proposed multi-scale fractal dimensions and calculated the contributions of different pores to porosity and permeability. They found that a negative correlation exists between the porosity contribution of different pores and the coalification degree.
In summary, previous studies have extensively examined the pore structure of anthracite. The comprehensive pore distribution of different macerals without the effects of anthracite geological structure and its effect on methane adsorption–diffusion, however, remain unclear. To determine them, anthracite samples from bright bands and dull bands of coal were obtained from No.3 coal seam, Hudi coal mine, in Qinshui Basin. For these samples, MIP, LP-NA, and LP-CA were used to characterize the comprehensive PSD, and isothermal adsorption tests were employed to describe the distinctive nature of the adsorption capacity.

2. Materials and Methods

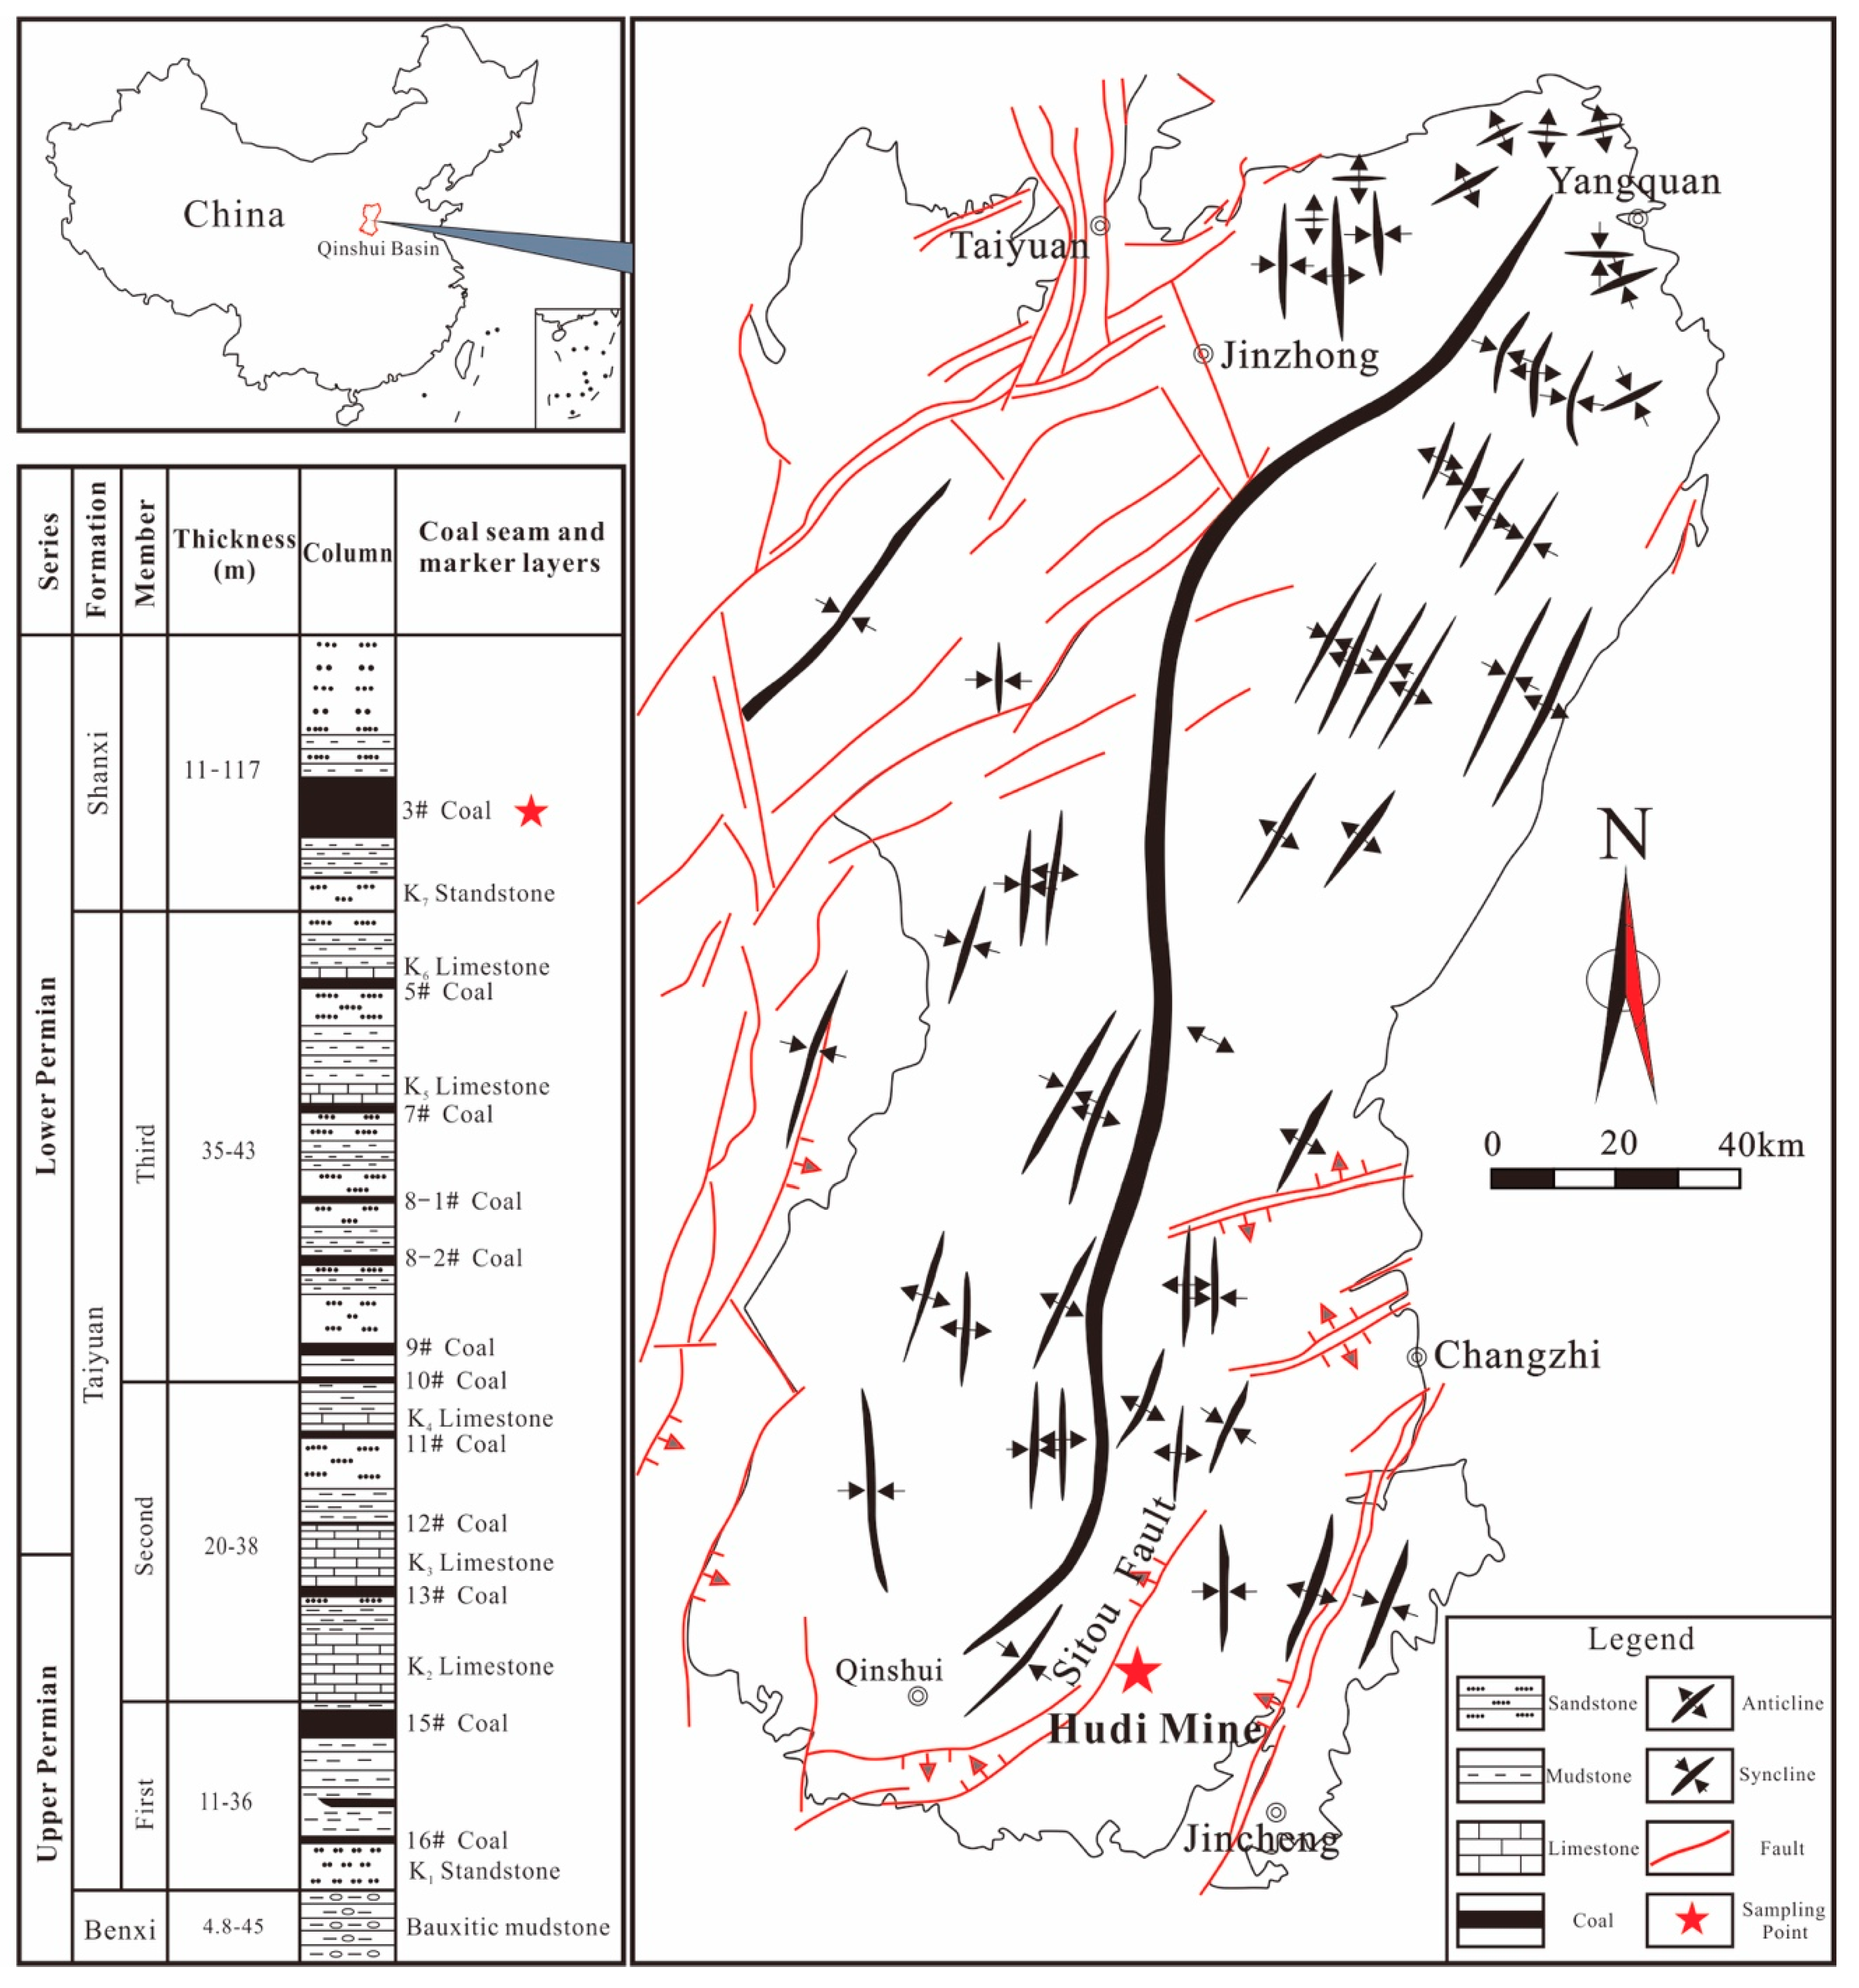
2.1. Materials Collection and Preparation

Samples were collected from No. 3 coal seam of the Shanxi Formation in Hudi coal mines located in southern Qinshui Basin (Figure 1). First, the coal sample lithotypes were determined. In the laboratory, the dull bands and bright bands of coal samples were manually chosen and thereafter crushed into 0.25–0.38 mm particles. Second, sufficient quantities of good-quality dull bands and bright bands were selected and named A1 and A5, respectively. Three samples, A2, A3, and A4, with different proportions of dull and bright bands were thereafter mixed according to the proportions 2:1, 1:1, and 1:2, respectively. A total of five samples were thus obtained (Table 1). Each prepared coal sample was divided into several parts, which were used for the preparation of briquettes, pore structure tests, and isothermal adsorption experiments.

2.2. Experimental Methods

The maximum reflectivity of vitrinite (Ro,max) and coal macerals was determined via an optical microscope with an oil immersion reflection light following ASTM Standard D2798-05 and ISO 7404-3 (2009). The proximate analysis was completed in accordance with ASTM Standard D3172-13. The basic properties of the coal sample are summarized in Table 1.
The MIP measurements were conducted using a mercury porosimeter (Poremaster 60 GT, Quantachrome Instruments, Boynton Beach, FL, USA) at the Nanjing University of Technology. All coal samples were dehydrated for more than 24 h at a constant temperature of 110 °C before the MIP measurements. The maximum test pressure was approximately 274 MPa with a minimum test aperture of 5.4 nm.
The LP-NA tests were conducted at 77 K using V-Sorb 2800TP manufactured by the Gold APP Instrument Corporation (Beijing China). The evacuation time and temperature were 4 h and 150 °C, respectively. The instrument can accurately measure pores with sizes between 2 and 100 nm.
The LP-CA tests were performed at 273 K using Autosorb-IQ (Quantachrome Instruments, Boynton Beach, FL, USA). The evacuation time and temperature for each sample were 12 h and 105 °C, respectively. The PSD of coals was determined on the basis of the density functional theory (DFT). The measurable apertures were between 0.35 and 2 nm.
High-pressure CH4 adsorption was performed on a gravimetric adsorption apparatus (ISOSORF-HP, Rubotherm, Bochum, Germany). The core component of the apparatus is a high-precision magnetically suspended balance with a 10−6 g accuracy. The test process was conducted at a constant temperature of 30 °C, and the highest test pressure was set to 20 MPa. The absolute adsorption was estimated from the measured excess adsorption [37]. The simplified workflow generates the parameters pore structure, fractal dimension, and methane adsorption capacity (Figure 2).

2.3. Fractal Theory

The fractal theory has been widely used to characterize rough and irregular systems in porous media [35,39]. Friesen and Mikula [40] calculated the fractal dimension based on MIP data. The function is as follows:
lg ( d V p / d P ) ( D 4 ) lg P
where VP is the injected mercury volume (cm3/g) at pressure P; P is the experimental pressure (MPa); D is the fractal dimension.
The fractal FHH (Frenkel–Halsey–Hill) model is simple and practical, and the fractal D can be obtained through LP-NA data. The FHH equation is as follows:
ln ( V / V 0 ) = constant + A ln ( ln ( P 0 / P ) )
where V is the adsorption volume (cm3/g) at pressure P; V0 is the monolayer volume (cm3/g); P is the test pressure (MPa); P0 is the saturation pressure (MPa); A is a constant.

2.4. Adsorption Kinetics

Previous researchers have shown that methane diffusion in coal can be represented by a unipore model [41,42] in which the constant surface concentration of the total amount of the diffusing substance that enters the sphere may be expressed as follows:
M t M = 1 6 π 2 n = 1 1 n 2 exp ( D n 2 π 2 t r p 2 )
where Mt is the total diffusion mass (g) at time t; M is the total diffusion gas uptake (g); rp is the diffusion channel length (10−6 m); D is the diffusion coefficient (cm2/s); t is time (s).
For small time intervals (t < 600 s) and small diffusion masses (Mt/M < 0.5), the effective diffusion coefficient (De) can be determined as follows [28,43]:
M t M = 6 π ( D e t ) 1 / 2
where De is the effective diffusion coefficient (s−1).

3. Results and Discussions

3.1. Sample Characterization

The coal sample Ro,max changed from 2.94 to 2.95% (mean 0.0298%). The coal samples consisted of high amounts of vitrinite and low amounts of inertinite in the ranges 80.10%–99.36% (mean 91.47%) and 0.32%–8.67% (mean 3.84%), respectively. The mineral matter content varied from 0.32% to 11.23%, with a mean value of 4.57%.
The proximate analysis results showed that the air-dried moisture (Mad), dried ash yield (Ad), dried ash-free volatile yield (Vdaf), and air-dried fix carbon content (FCad) varied in the ranges 0.92%–1.50%, 1.81%–21.89%, 5.16%–7.56%, and 71.55%–91.72%, with average values of 1.13%, 11.92%, 6.29%, and 81.65%, respectively.

3.2. Pore Structures

3.2.1. MIP Test Results

The TPV and SSA obtained from the MIP test varied in the ranges 0.0275–0.0338 cm3/g and 7.5–12.67 m2/g, with mean values of 0.03 cm3/g and 10.9 m2/g, respectively.
As shown in Figure 3A, the shapes of the mercury intrusion–extrusion curves were similar and could be divided into two distinct parts. When the pressure was small (corresponding to pore diameters in the range 50–10,000 nm), the mercury volume gradually increased; however, when the pressure was high (pore diameter of 6–50 nm), the volume increased rapidly. This indicates that the samples developed considerable micro-transitional pores. The mercury intrusion–extrusion curves were extremely narrow and practically parallel, indicating that the samples primarily developed semi-closed pores. These pores may remarkably affect pore connectivity, and thereafter prevent CBM output [44].

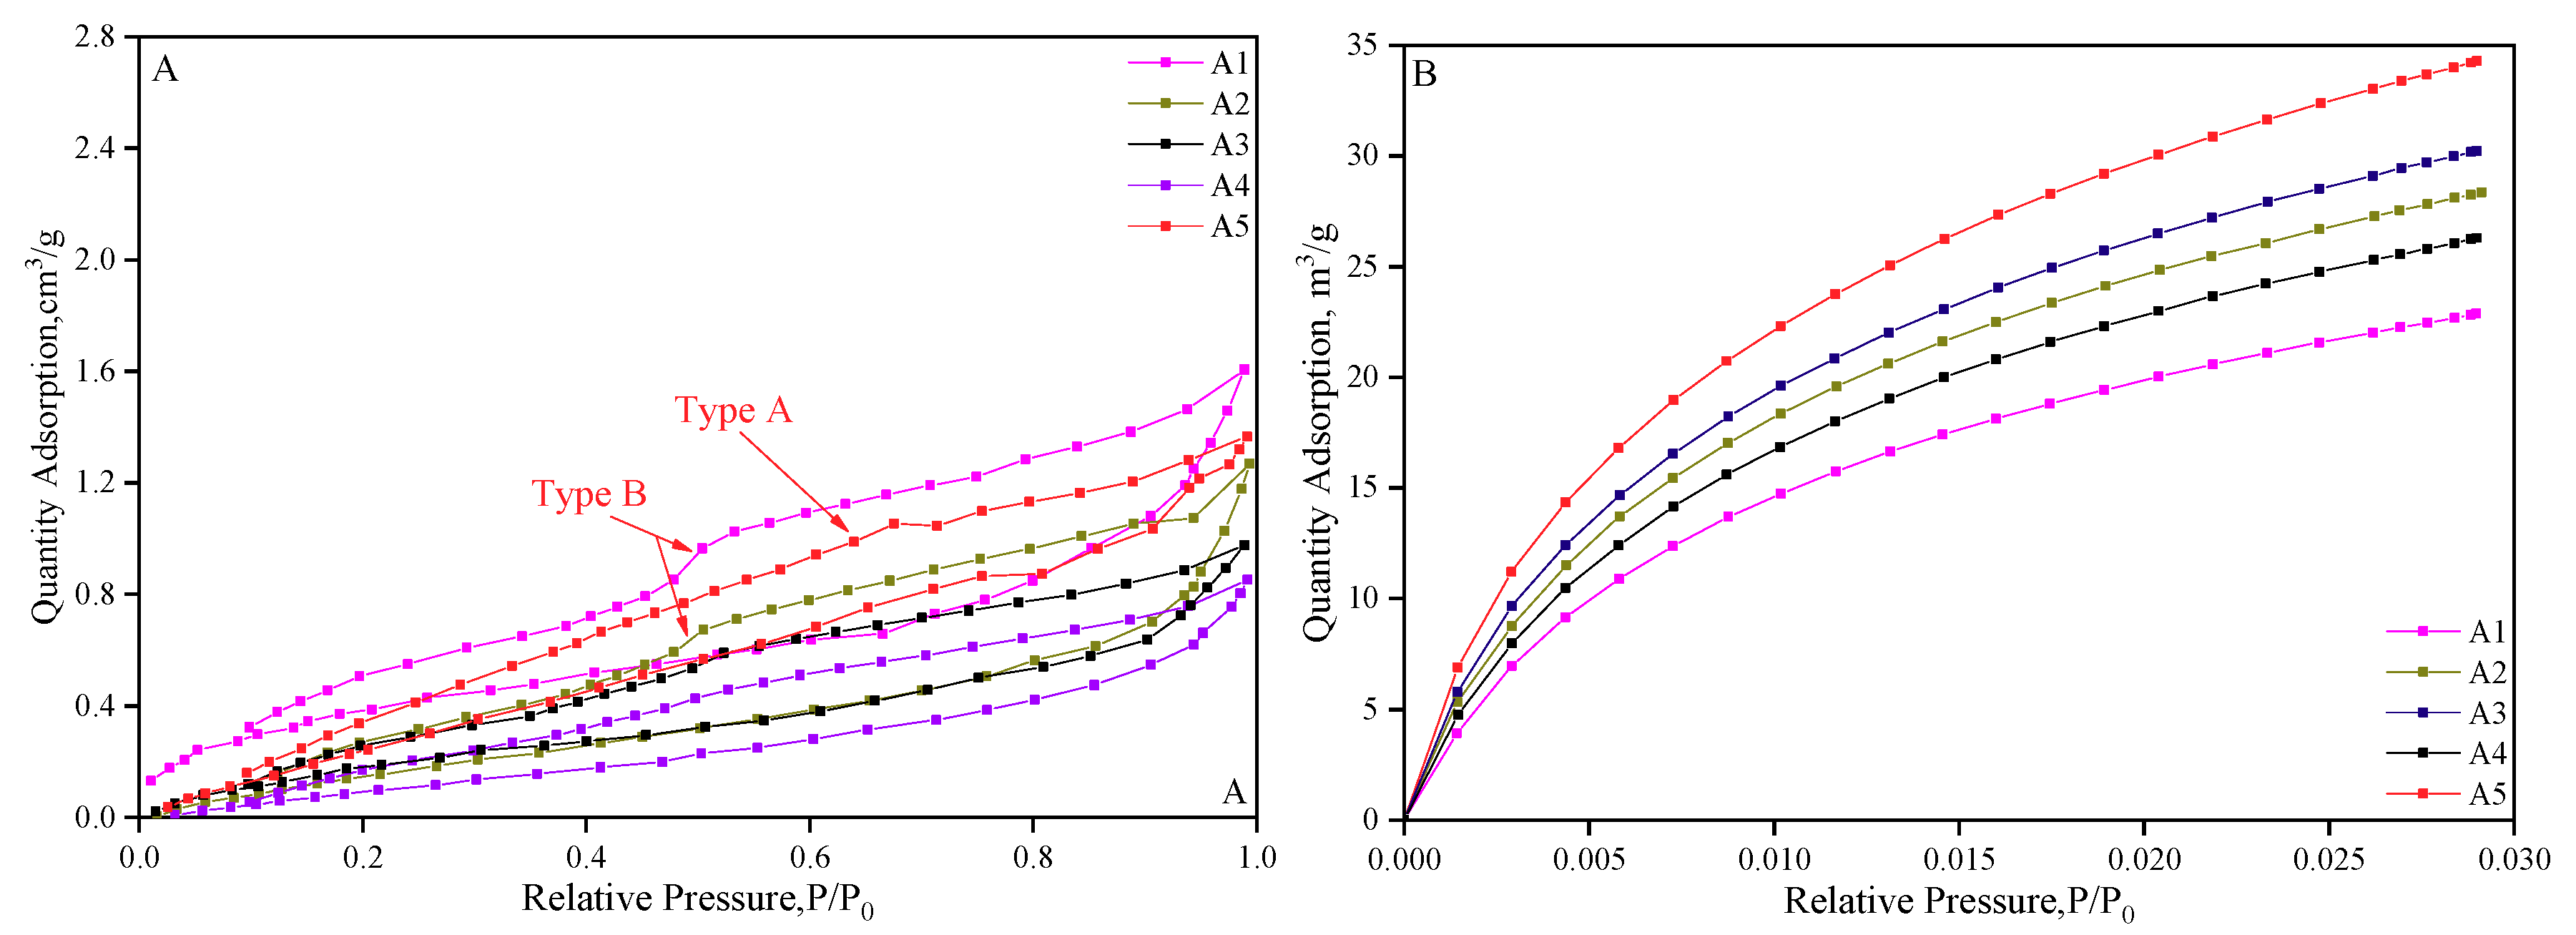
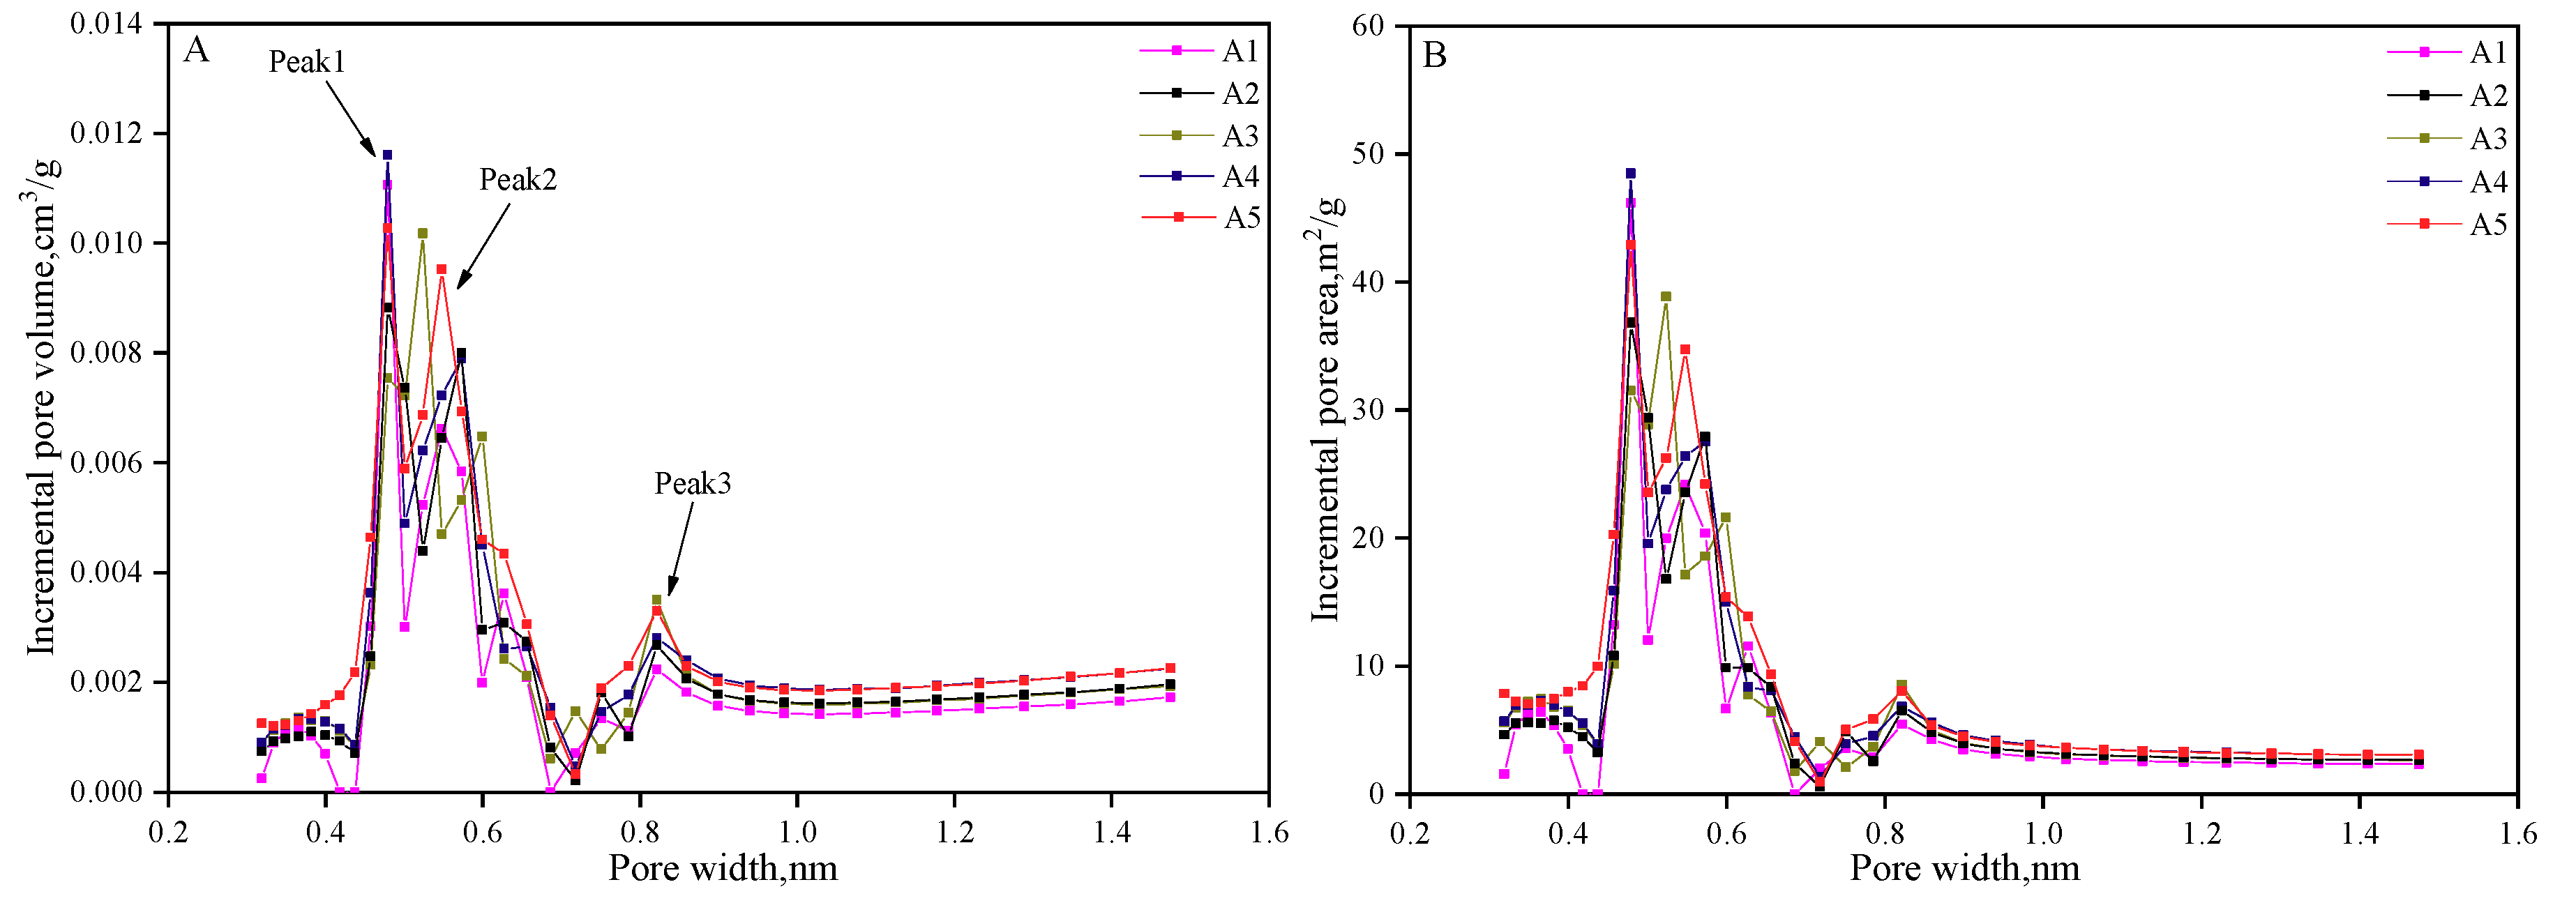
3.2.2. LP-NA and LP-CA Tests Results

The SSA and TPV determined by the LP-NA test varied in the ranges 0.913–1.559 m2/g and 0.0015–0.0025 cm3/g, with averages of 1.161 m2/g and 0.002 cm3/g, respectively (Table 2). The average pore diameter (APD) in the LP-NA test ranged between 6.47 and 9.66 nm. This indicates that the pores’ sizes were mainly below 10 nm.
The LP-NA adsorption–desorption isotherms can be adapted to identify the pore types [45]. According to their isotherm curves, the samples could be classified into two types [33]: Type A and Type B (Figure 4). The A3, A4, and A5 isotherms, which were parallel to the desorption isotherms (P/P0 < 0.2), belonged to Type A. At this relative pressure range, the isotherms were reversible and corresponded to semi-closed pores. The isotherms exhibited moderate hysteresis loops when the relative pressure was higher, implying the existence of slit or cylindrical pores. On the contrary, the isotherms of Type B (A1 and A2) demonstrates a significant change in hysteresis loops (P/P0 ≈ 0.5). This revealed the presence of spherical or ink-bottle pores.
The maximum adsorption volume of CO2 was between 22.88 and 34.29 cm3/g (mean: 28.42 cm3/g). The super-micropore diameters were mainly distributed in the range 0.4–0.9 nm. Three peaks at pore diameters of 0.48, 0.55, and 0.82 nm are shown in Figure 5. The SSA and TPV of LP-CA tests varied in the ranges 241.67–357.96 m2/g and 0.074–0.106 cm3/g, with averages of 298.65 m2/g and 0.0898 cm3/g, respectively. These values are considerably greater than those of the MIP and LP-NA tests.

3.2.3. Comprehensive Characterization of Pore Fractals and Structures

Comprehensive Characterization of Pore Fractals

The fractal dimension is generally from 2 to 3. On account of the fractal theory, there are evident positive correlations in the scatter plots of Figure 6 between lg(dVp/dP) and lgP. The slope, k, can be obtained by fitting the scatters and the fractal D = 4 + k. Figure 6A shows and Table 3 summarizes the calculation process and results, respectively.
The adsorption mechanism transforms with changes in P/P0. The van der Waals forces are dominant when P/P0 is less than 0.5; however, the adsorption mechanism transforms to capillary condensations when P/P0 is larger than 0.5. Ismail and Pfeifer used δ to discriminate the dominant adsorption mechanism. In general, if δ > 0, then the relationship between A and DS is as follows:
D s = 3 × A + 3
if δ < 0, then it changes to:
D s = A + 3
where Ds1 and Ds2 represent the fractal dimensions when P/P0 is in the 0–0.5 and 0.5–1.0 intervals, respectively. The calculation process and results are shown in Figure 6B and summarized in Table 3, respectively.
The macro-mesopore fractal dimensions (D), pore surface fractal dimensions (Ds1), and pore structure fractal dimensions (Ds2) varied in the ranges 2.36–2.60, 1.69–2.43, and 2.10–2.37, with averages of 2.48, 1.96, and 2.18, respectively. The factor Ds1 is not discussed in subsequent sections of this paper because it has distinct anomalies.

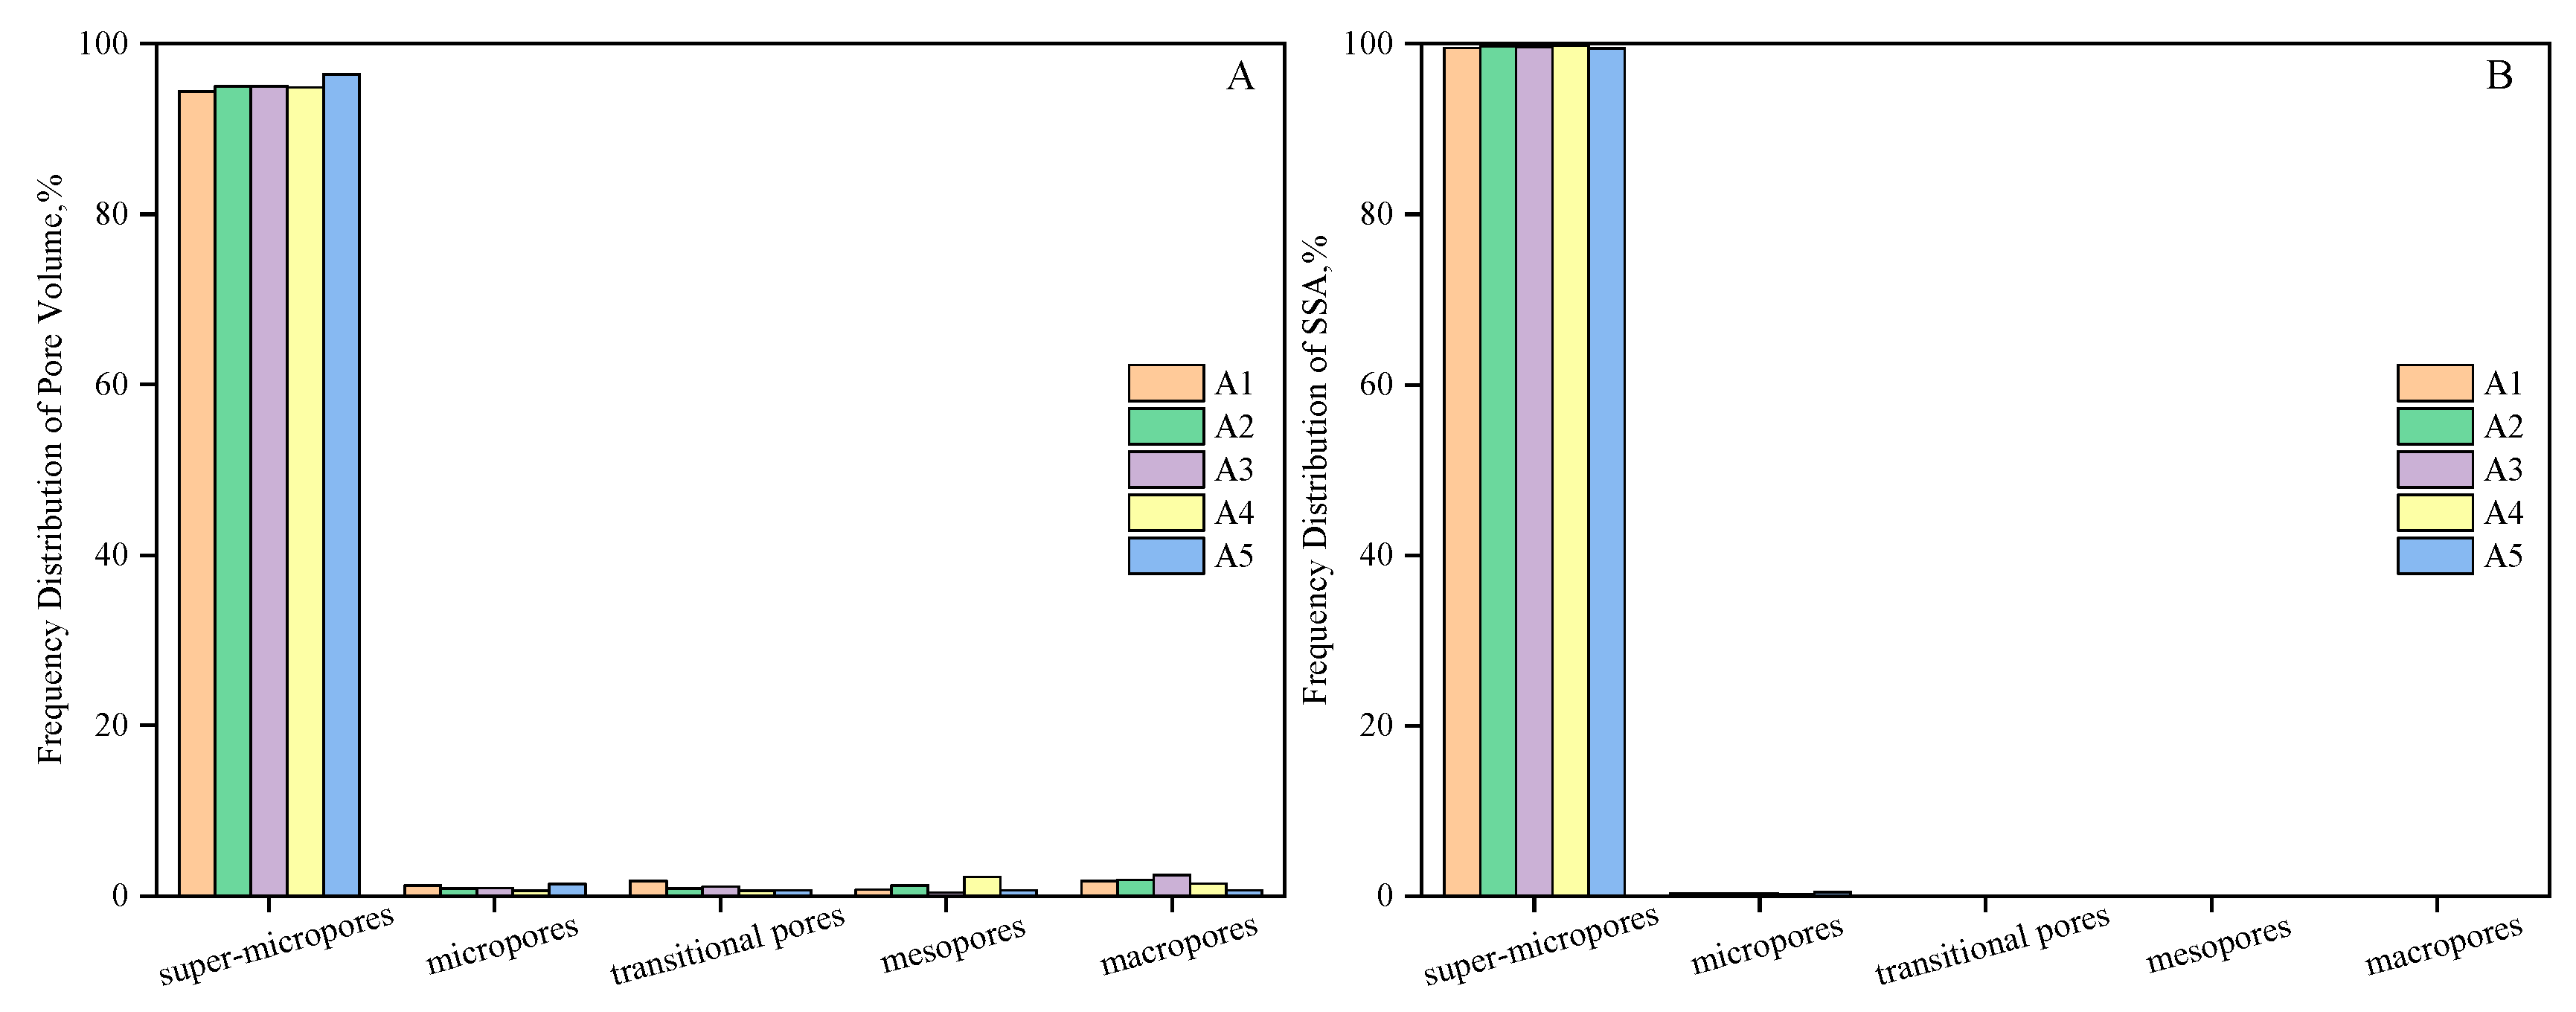
Comprehensive Characterization of Pore Structures

To comprehensively describe the PSD characteristics of anthracite reservoirs, the results of MIP, LP-NA, and LP-CA tests were superimposed. The LP-NA and LP-CA tests caused inconsiderable destruction to the sample. The data of the two experiments did not overlap; hence, the direct superposition method was selected. The MIP and LP-NA, however, characterized the macro-mesopore and micro-transitional pore systems, respectively. The test data overlapped and therefore were cut and combined.
With regard to the coal matrix compressibility [46], a significant increase in mercury volume can be observed when the test pressure of MIP is higher than the critical value that can introduce errors to the fractal study of the pore structure. Relative to this, previous researchers have proposed a method for correcting MIP data based on the LP-NA test [47]. In this study, the fractal theory was used to analyze the compressibility of the coal matrix. By considering the fractal characteristics of MIP, it can be seen that fractal D distinctly changed at lgP = 1.16 (pore diameter = 100 nm in Figure 6A). It shows that when the mercury injection pressure was greater than 14.45 MPa, the coal matrix compressibility was considerable and would severely distort the pore volume test results. When the pressure was less than 14.45 MPa, however, the pore filling effect was dominant, and the mercury intrusion data were accurate. The MIP, LP-NA, and LP-CA data were therefore used to characterize macro–mesopores (larger than 100 nm), micro-transitional pores (2–100 nm), and super-micropores (less than 2 nm). The joint PSDs are listed in Table 4.
The combined PSD showed that the TPV and SSA of anthracite were in the ranges 0.078–0.110 cm3/g and 242.283–359.818 m2/g, respectively. The super-micropores were the most developed; their pore volume varied in the range 94.39%–96.36%, with an average of 95.12%. The super-micropores were followed by micropores, transitional pores, mesopores, and macropores. The super-micropores provided the largest proportion of the pore SSA (>99%) (Figure 7 and Figure 8).

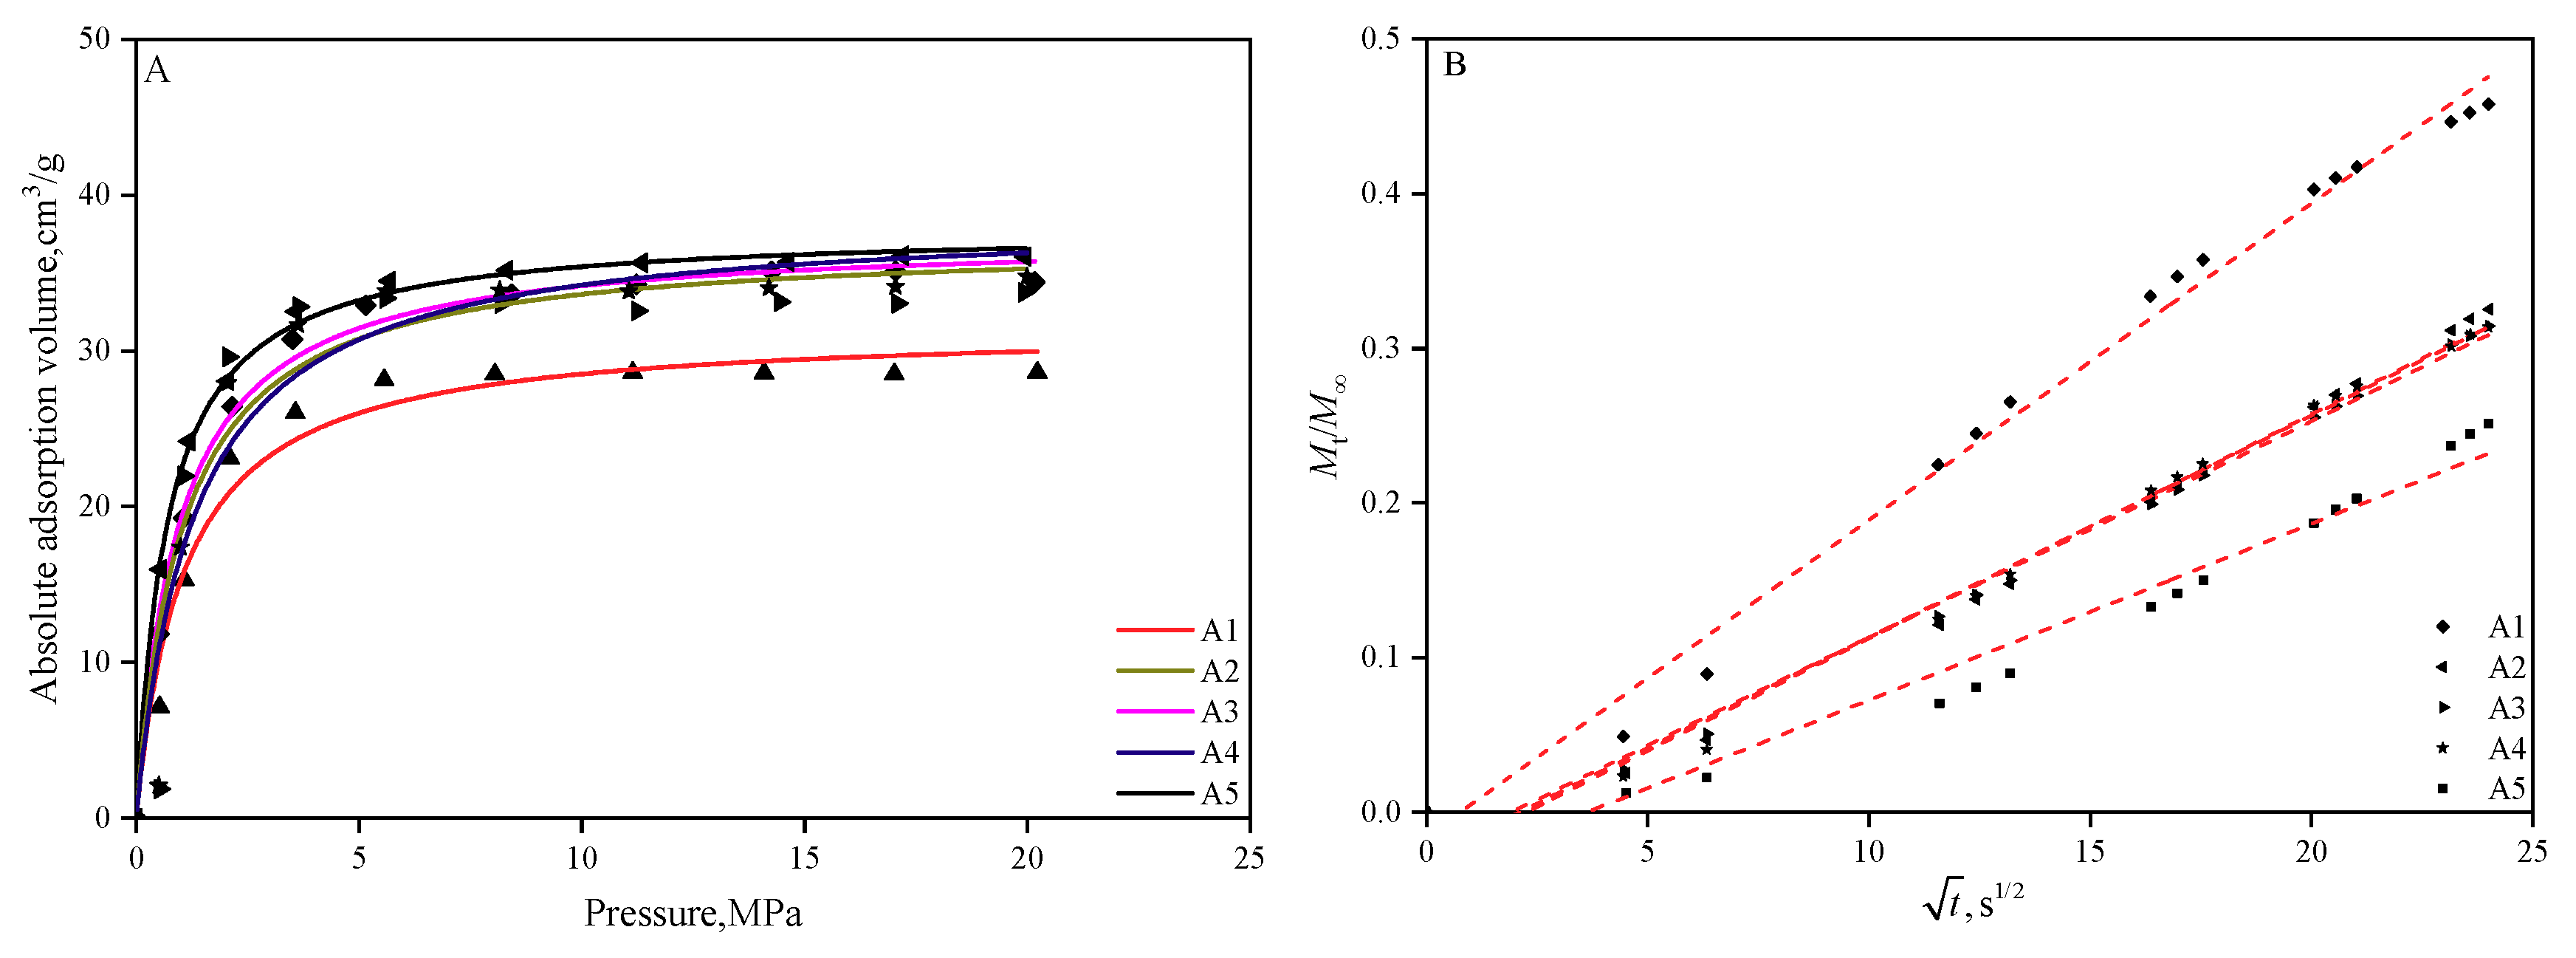
3.3. Isothermal Adsorption and Its Kinetics

The Langmuir equation was used to describe the adsorption equilibrium of coal in this paper. The VL and PL changed from 31.55 to 38.63 cm3/g (mean 36.51 cm3/g) and from 0.70 to 1.29 MPa (mean 1.01 MPa), respectively. According to Figure 9A, the adsorption curves were typical isothermal adsorption curve of high-rank coal, which is characterized by larger VL and smaller PL values compared with semi-anthracites and low- and medium-rank coals [16,18,48].
The calculation method of De is shown in Figure 9B and given by Equation (4). The results are summarized in Table 3. The value of De in Hudi coal mine ranged from 1.42 to 2.88 × 10⁻⁵ s−1 (mean 2.09 × 10⁻⁵ s−1). These results conform with the report of Shen et al., whose research showed an average effective diffusion coefficient of 2.92 × 10⁻⁵ s−1 [42].

3.4. Effects of PSD and Macerals on Adsorption Capacity and Adsorption Kinetics

The coal composition has a substantial influence on the adsorption capacity of methane. Methane is primarily present in the adsorbed state on the inner surface of coal. As the vitrinite content increases, VL distinctly increases. The effective diffusion coefficient, De, however, exhibits a negative correlation with the vitrinite content. The reason is that both the TPV and the SSA have significant linear correlations with the vitrinite content (Figure 10G), and both correlation coefficients (R2) are higher than 0.96. The higher the vitrinite content, the larger the adsorption surface area. Our results are in contrast to those obtained by Laxminarayana [49], whose research showed that the Langmuir volume decreased with the increase of vitrinite content in anthracite, but are consistent with the results of Guo [50] and Lamberson and Bustin [51]. The potential reason is that vitrinite is characterized by higher SSA and TPV of super-micropores [52], which supply more adsorption sites [53]. As shown in Figure 10B, VL is negatively associated with mineral matter contents (R2 = 0.9031), indicating that the mineral matters may mainly develop macro–mesopores. It is therefore beneficial to diffusion (Figure 10B). The correlation coefficient between mineral matter contents and De was 0.8548.
Previous studies have shown a positive correlation between pore SSA and CH4 adsorption capacity [54,55]. As shown in Figure 10D, VL positively correlated with SSA in super-micropores (R2 = 0.7282), but there was a discrete relationship between VL and SSA in micro-transitional pores (Figure 10C). By comparing the graphs in Figure 10A,D, it can be clearly observed that the controlling factors in materials with different compositions are the vitrinite content and the SSA of super-micropores.
Generally, the higher the vitrinite content, the larger the SSA of super-micropores, the stronger the adsorption capacity, the stronger the Knudsen diffusion, and the weaker the Fick diffusion. Research has shown that the Fick diffusion is considerably larger than the Knudsen diffusion [56]. The effective diffusion coefficient, therefore, negatively correlates with the SSA of super-micropores.
Figure 10D shows that as the APD of micro-transitional pores increased, VL decreased, and De increased. This indicates that De is controlled by the APD of micro-transitional pores (R2 = 0.6005). The larger the APD, the shorter the length of the diffusion channel, which is more conducive to diffusion.
Previous studies have also shown that the larger the fractal dimension, the stronger the adsorption capacity. Fractal Ds2, however, showed a weak negative relationship to VL, and the relationship between fractal parameters and De was dispersed (Figure 10F). This may be ascribed to differences in composition, measurement medium, measurement method, etc.

4. Conclusions

To investigate the pore structure of different maceral compositions in anthracite and its effect on methane adsorption–diffusion, maceral analysis, MIP, LP-NA, and LP-CA tests were performed, evaluating the maceral composition and PSDs of five samples. A high-pressure CH4 adsorption experiment was conducted to determine the adsorption properties. The fractal and diffusion characteristics were separately described on the basis of the fractal theory and adsorption kinetics. The main conclusions drawn are as follows:
According to the fractal theory and coal matrix compressibility, the pore structure data of MIP and LP-NA may be combined at a pore diameter of 100 nm, thereby realizing a comprehensive pore structure splicing. The results of comprehensive PSDs showed that super-micropores were abnormally developed (94.39–96.36%), followed by micropores, transitional pores, mesopores, and macropores. The super-micropore SSA was the most developed.
The LP-NA test results for different maceral compositions showed that the pore structure of durain is more complex than that of vitrain, and the former contains spherical or ink-bottle pores.
The MIP and LP-NA data were used to study the fractal D values of macro–mesopores and micro-transitional pores with averages of 2.48 and 2.18, respectively, thereby revealing that durain contains a more complex PSD than vitrain.
The results of different maceral compositions showed that the higher the vitrinite content, the larger the super-micropore SSA, the larger the VL, and the weaker the diffusion. The larger the APD of micro-transitional pores, the stronger the diffusion capacity.

Author Contributions

Conceptualization, J.Z., Y.Q. and J.S.; methodology, validation, formal analysis, investigation, resources, writing—original draft preparation, visualization, J.Z.; software, B.Z.; data curation, C.L. and G.L.; supervision, J.S.; project administration and funding acquisition, Y.Q. and J.S.

Funding

This research was funded by the National Natural Science Foundation of China (Grant No. 41530314, 41672149 and 41872171).

Acknowledgments

Thanks for the support of the National Natural Science Foundation of China (No. 41530314; 41672149; 41872171).

Conflicts of Interest

The authors declare no conflict of interest.

References

  1. Tutak, M.; Brodny, J. Analysing the Utilisation Effectiveness of Mining Machines Using Independent Data Acquisition Systems: A Case Study. Energies 2019, 12, 2505. [Google Scholar]
  2. Tao, S.; Pan, Z.; Chen, S.; Tang, S. Coal seam porosity and fracture heterogeneity of marcolithotypes in the Fanzhuang Block, southern Qinshui Basin, China. J. Nat. Gas Sci. Eng. 2019, 66, 148–158. [Google Scholar] [CrossRef]
  3. Qin, Y.; Moore, T.A.; Shen, J.; Yang, Z.B.; Shen, Y.L.; Wang, G. Resources and geology of coalbed methane in China: A review. Int. Geol. Rev. 2018, 60, 777–812. [Google Scholar] [CrossRef]
  4. Tutak, M.; Brodny, J. Forecasting Methane Emissions from Hard Coal Mines Including the Methane Drainage Process. Energies 2019, 12, 3840. [Google Scholar] [CrossRef]
  5. Zhang, D.; Zhu, J.; Zhao, X.; Gao, N. Dynamic assessment of coalbed methane resources and availability in China. J. China Coal Soc. 2018, 43, 1598–1604. [Google Scholar]
  6. Tao, S.; Chen, S.; Pan, Z.J. Current status, challenges, and policy suggestions for coalbed methane industry development in China: A review. Energy Sci. Eng. 2019, 1–16. [Google Scholar] [CrossRef]
  7. Zhao, X.; Yang, Y.; Chen, L.; Shen, J.; Chao, W.; Shao, G. Production controlling mechanism and mode of solid-fluid coupling of high rank coal reservoirs. Acta Pet. Sin. 2015, 43, 332–339. [Google Scholar]
  8. Giffin, S.; Littke, R.; Klaver, J.; Urai, J.L. Application of BIB–SEM technology to characterize macropore morphology in coal. Int. J. Coal Geol. 2013, 114, 85–95. [Google Scholar] [CrossRef]
  9. Yao, Y.; Liu, D. Comparison of low-field NMR and mercury intrusion porosimetry in characterizing pore size distributions of coals. Fuel 2012, 95, 152–158. [Google Scholar] [CrossRef]
  10. Okolo, G.N.; Everson, R.C.; Neomagus, H.W.J.P.; Roberts, M.J.; Sakurovs, R. Comparing the porosity and surface areas of coal as measured by gas adsorption, mercury intrusion and SAXS techniques. Fuel 2015, 141, 293–304. [Google Scholar] [CrossRef]
  11. Clarkson, C.R.; Freeman, M.; He, L.; Agamalian, M.; Melnichenko, Y.B.; Mastalerz, M.; Bustin, R.M.; Radlinski, A.P.; Blach, T.P. Characterization of Tight Gas Reservoir Pore Structure Using USANS/SANS and Gas Adsorption Analysis. Fuel 2012, 95, 371–385. [Google Scholar] [CrossRef]
  12. Kuila, U.; Prasad, M. Surface area and pore-size distribution in clays and shales. Geophys. Prospect. 2013, 61, 341–362. [Google Scholar] [CrossRef]
  13. Li, G.; Qin, Y.; Wu, M.; Zhang, B.; Wu, X.; Tong, G.; Liu, J. The pore structure of the transitional shale in the Taiyuan formation, Linxing area, Ordos Basin. J. Pet. Sci. Eng. 2019, 181, 1–15. [Google Scholar] [CrossRef]
  14. Zhao, J.; Hao, X.; Tang, D.; Mathews, J.P.; Song, L.; Shu, T. A comparative evaluation of coal specific surface area by CO2 and N2 adsorption and its influence on CH4 adsorption capacity at different pore sizes. Fuel 2016, 183, 420–431. [Google Scholar] [CrossRef]
  15. Schmitt, M.; Fernandes, C.P.; da Cunha Neto, J.A.; Wolf, F.G.; dos Santos, V.S. Characterization of pore systems in seal rocks using Nitrogen Gas Adsorption combined with Mercury Injection Capillary Pressure techniques. Mar. Pet. Geol. 2013, 39, 138–149. [Google Scholar] [CrossRef]
  16. Wang, B.Y.; Qin, Y.; Shen, J.; Zhang, Q.S.; Wang, G. Pore structure characteristics of low- and medium-rank coals and their differential adsorption and desorption effects. J. Pet. Sci. Eng. 2018, 165, 1–12. [Google Scholar] [CrossRef]
  17. Jian, K.; Fu, X.H.; Ding, Y.M.; Wang, H.D.; Li, T. Characteristics of pores and methane adsorption of low-rank coal in China. J. Nat. Gas Sci. Eng. 2015, 27, 207–218. [Google Scholar] [CrossRef]
  18. Zhang, M.; Fu, X. Characterization of pore structure and its impact on methane adsorption capacity for semi-anthracite in Shizhuangnan Block, Qinshui Basin. J. Nat. Gas Sci. Eng. 2018, 60, 49–62. [Google Scholar] [CrossRef]
  19. Chen, Y.L.; Qin, Y.; Wei, C.T.; Huang, L.L.; Shi, Q.M.; Wu, C.F.; Zhang, X.Y. Porosity changes in progressively pulverized anthracite subsamples: Implications for the study of closed pore distribution in coals. Fuel 2018, 225, 612–622. [Google Scholar] [CrossRef]
  20. Chen, Y.L.; Qin, Y.; Li, Z.P.; Shi, Q.M.; Wei, C.T.; Wu, C.F.; Cao, C.H.; Qu, Z.H. Differences in desorption rate and composition of desorbed gases between undeformed and mylonitic coals in the Zhina Coalfield, Southwest China. Fuel 2019, 239, 905–916. [Google Scholar] [CrossRef]
  21. Chen, S.D.; Tao, S.; Tang, D.Z.; Xu, H.; Li, S.; Zhao, J.L.; Jiang, Q.; Yang, H.X. Pore Structure Characterization of Different Rank Coals Using N-2 and CO2 Adsorption and Its Effect on CH4 Adsorption Capacity: A Case in Panguan Syncline, Western Guizhou, China. Energy Fuels 2017, 31, 6034–6044. [Google Scholar] [CrossRef]
  22. Ju, Y.; Huang, C.; Sun, Y.; Wan, Q.; Lu, X.; Lu, S.; He, H.; Wang, X.; Zou, C.; Wu, J. Nanogeosciences: Research history, current status, and development trends. J. Nanosci. Nanotechnol. 2017, 17, 5930–5965. [Google Scholar] [CrossRef]
  23. Singh, A.; Singh, M.; Singh, P. Microstructural relation of macerals with mineral matter in Eocene coal. Energy Sources Part A Recovery Util. Environ. Eff. 2015, 37, 1089–1097. [Google Scholar] [CrossRef]
  24. Moore, T.A. Coalbed methane: A review. Int. J. Coal Geol. 2012, 101, 36–81. [Google Scholar] [CrossRef]
  25. Clarkson, C.R.; Bustin, R.M. The effect of pore structure and gas pressure upon the transport properties of coal: A laboratory and modeling study. 1. Isotherms and pore volume distributions. Fuel 1999, 78, 1333–1344. [Google Scholar] [CrossRef]
  26. Mastalerz, M.; Drobniak, A.; Strapoc, D.; Acosta, W.S.; Rupp, J. Variations in pore characteristics in high volatile bituminous coals: Implications for coal bed gas content. Int. J. Coal Geol. 2008, 76, 205–216. [Google Scholar] [CrossRef]
  27. Gürdal, G.; Yalçın, M.N. Pore volume and surface area of the Carboniferous coals from the Zonguldak basin (NW Turkey) and their variations with rank and maceral composition. Int. J. Coal Geol. 2001, 48, 133–144. [Google Scholar] [CrossRef]
  28. Crosdale, P.J.; Beamish, B.B.; Valix, M.; Flores, R.M. Coalbed methane sorption related to coal composition. Int. J. Coal Geol. 1998, 35, 147–158. [Google Scholar] [CrossRef]
  29. Lefebvre, Y.; Jolicoeur, C. Gas phase adsorption studies of selected probe molecules on powdered silica polymorphs. Colloids Surf. 1992, 63, 67–76. [Google Scholar] [CrossRef]
  30. Posnansky, O.; Guo, J.; Hirsch, S.; Papazoglou, S.; Braun, J.; Sack, I. Fractal network dimension and viscoelastic powerlaw behavior: I. A modeling approach based on a coarse-graining procedure combined with shear oscillatory rheometry. Phys. Med. Biol. 2012, 57, 4023–4040. [Google Scholar] [CrossRef]
  31. Wang, Y.; Baiyu, D.U.; Dou, X.; Liu, J.; Shi, B.; Wang, D.; Tang, H. Study on the pore surface fractal dimension and surface acid-base properties of natural particles around Guanting reservoir. Colloids Surf. A Physicochem. Eng. Asp. 2007, 307, 16–27. [Google Scholar] [CrossRef]
  32. Jiang, X.P.; Qian, M.L.; Qian, C. Morphological Characterization of Super Fine Pulverized Coal Particle. Part 4. Nitrogen adsorption and Small Angle X-ray Scattering Study. Energy Fuels 2010, 24, 084302–084604. [Google Scholar]
  33. Yao, Y.; Liu, D.; Tang, D.; Tang, S.; Huang, W. Fractal characterization of adsorption-pores of coals from North China: An investigation on CH adsorption capacity of coals. Int. J. Coal Geol. 2008, 73, 27–42. [Google Scholar] [CrossRef]
  34. Wang, Y.; Zhu, Y.; Liu, S.; Zhang, R. Pore characterization and its impact on methane adsorption capacity for organic-rich marine shales. Fuel 2016, 181, 227–237. [Google Scholar] [CrossRef]
  35. Zhou, S.; Liu, D.; Cai, Y.; Yao, Y. Gas sorption and flow capabilities of lignite, subbituminous and high-volatile bituminous coals in the Southern Junggar Basin, NW China. J. Nat. Gas Sci. Eng. 2016, 34, 6–21. [Google Scholar] [CrossRef]
  36. Shen, J.; Qin, Y.; Zhao, J. Maceral contribution to pore size distribution in anthracite in the south Qinshui Basin. Energy Fuels 2019, 33, 7234–7243. [Google Scholar] [CrossRef]
  37. Li, T.; Wu, C. Research on the Abnormal Isothermal Adsorption of Shale. Energy Fuels 2015, 29, 634–640. [Google Scholar] [CrossRef]
  38. Zhou, S.D.; Liu, D.M.; Cai, Y.D.; Karpyn, Z.; Yao, Y.B. Comparative analysis of nanopore structure and its effect on methane adsorption capacity of Southern Junggar coalfield coals by gas adsorption and FIB-SEM tomography. Micropor. Mesopor. Mater. 2018, 272, 117–128. [Google Scholar] [CrossRef]
  39. Zhang, S.; Tang, S.; Tang, D.; Huang, W.; Pan, Z. Determining fractal dimensions of coal pores by FHH model: Problems and effects. J. Nat. Gas Sci. Eng. 2014, 21, 929–939. [Google Scholar] [CrossRef]
  40. Friesen, W.I.; Mikula, R.J. Mercury porosimetry of coalsPore volume distribution and compressibility. Fuel 1988, 67, 1516–1520. [Google Scholar] [CrossRef]
  41. Charrière, D.; Pokryszka, Z.; Behra, P. Effect of pressure and temperature on diffusion of CO and CH into coal from the Lorraine basin (France). Int. J. Coal Geol. 2010, 81, 373–380. [Google Scholar] [CrossRef]
  42. Shen, J.; Qin, Y.; Fu, X.; Wang, G.; Chen, R.; Zhao, L. Study of high-pressure sorption of methane on Chinese coals of different rank. Arab. J. Geosci. 2015, 8, 3451–3460. [Google Scholar] [CrossRef]
  43. Clarkson, C.R.; Bustin, R.M. The effect of pore structure and gas pressure upon the transport properties of coal: A laboratory and modeling study. 2. Adsorption rate modeling. Fuel 1999, 78, 1345–1362. [Google Scholar] [CrossRef]
  44. Tao, S.; Chen, S.; Tang, D.; Zhao, X.; Xu, H.; Li, S. Material composition, pore structure and adsorption capacity of low-rank coals around the first coalification jump: A case of eastern Junggar Basin, China. Fuel 2018, 211, 804–815. [Google Scholar] [CrossRef]
  45. Gregg, S.; Sing, K.W. Adsorption, Surface Area and Porosity; Academic Press: London, UK, 1982; pp. 195–197. [Google Scholar]
  46. Li, Z.; Liu, D.; Cai, Y.; Yao, Y.; Wang, H. Pore structure and compressibility of coal matrix with elevated temperatures by mercury intrusion porosimetry. Energy Explor. Exploit. 2015, 33, 809–826. [Google Scholar] [CrossRef] [Green Version]
  47. Shao, P.; Wang, X.; Song, Y.; Li, Y. Study on the characteristics of matrix compressibility and its influence factors for different rank coals. J. Nat. Gas Sci. Eng. 2018, 56, 93–106. [Google Scholar] [CrossRef]
  48. Zhou, F.; Hussain, F.; Guo, Z.; Yanici, S.; Cinar, Y. Adsorption/desorption characteristics for methane, nitrogen and carbon dioxide of coal samples from Southeast Qinshui Basin, China. Energy Explor. Exploit. 2013, 31, 645–665. [Google Scholar] [CrossRef] [Green Version]
  49. Laxminarayana, C.; Crosdale, P.J. Role of coal type and rank on methane sorption characteristics of Bowen Basin, Australia coals. Int. J. Coal Geol. 1999, 40, 309–325. [Google Scholar] [CrossRef]
  50. Guo, D.Y.; Guo, X.J. The influence factors for gas adsorption with different ranks of coals. Adsorpt. Sci. Technol. 2018, 36, 904–918. [Google Scholar] [CrossRef] [Green Version]
  51. Lamberson, M.N.; Bustin, R.M.J.A.b. Coalbed methane characteristics of Gates Formation coals, northeastern British Columbia: Effect of maceral composition. AAPG Bull. 1993, 77, 2062–2076. [Google Scholar]
  52. Gan, H.; Nandi, S.; Walker, P., Jr. Nature of the porosity in American coals. Fuel 1972, 51, 272–277. [Google Scholar] [CrossRef]
  53. Walker, R.; Glikson, M.; Mastalerz, M. Relations between coal petrology and gas content in the Upper Newlands Seam, central Queensland, Australia. Int. J. Coal Geol. 2001, 46, 83–92. [Google Scholar] [CrossRef]
  54. Yao, Y.B.; Liu, D.M.; Cai, Y.D.; Li, J.Q. Advanced characterization of pores and fractures in coals by nuclear magnetic resonance and X-ray computed tomography. Sci. China 2010, 53, 854–862. [Google Scholar] [CrossRef]
  55. Wang, F.; Cheng, Y.; Lu, S.; Jin, K.; Zhao, W. Influence of coalification on the pore characteristics of middle–high rank coal. Energy Fuels 2014, 28, 5729–5736. [Google Scholar] [CrossRef]
  56. Zhang, X.D.; Du, Z.G.; Li, P.P. Physical characteristics of high-rank coal reservoirs in different coal-body structures and the mechanism of coalbed methane production. Sci. China Earth Sci. 2017, 60, 246–255. [Google Scholar] [CrossRef]
Figure 1. Geological background and sampling location (modified after Shen et al. [36]).
Applsci 09 05130 g001
Figure 2. Workflow for the determination of the parameters pore structure, fractal dimension, and methane adsorption capacity (modified after Zhou et al. [38]). MIP: mercury intrusion porosimetry, BET: Brunauer-Emmett-Teller, BJH: Barrett-Joyner-Halenda, FHH: Frenkel–Halsey–Hill.
Applsci 09 05130 g002
Figure 3. Curves of (A) cumulative mercury quantity and (B) incremental pore volume vs. pore diameter according to MIP data.
Applsci 09 05130 g003
Figure 4. Adsorption isothermal curves obtained from the (A) LP-NA and (B) LP-CA tests.
Applsci 09 05130 g004
Figure 5. (A) Pore volume and (B) specific surface area (SSA) distributions for different pore sizes determined by LP-CA tests.
Applsci 09 05130 g005
Figure 6. Calculation process of the fractal dimension, (A) by MIP; (B) by LP-NA.
Applsci 09 05130 g006
Figure 7. Contribution of pore structures to (A) pore volume and (B) SSA.
Applsci 09 05130 g007
Figure 8. Incremental pore volume and SSA in relation to pore diameter (A, Sample A1;. B, Sample A2;. C, Sample A3;. D, Sample A4;. E, Sample A5).
Applsci 09 05130 g008
Figure 9. Adsorption isothermal curves of CH4 (A) absolute adsorption volume and (B) characterization of adsorption kinetics.
Applsci 09 05130 g009
Figure 10. Relationships between maceral compositions, structural parameters, and adsorption and diffusion properties (A, vitrinite content; B, mineral matter content; C, S3+S4; D, S5; E, APD of LP-NA; F, Fractal DS2; G, Relationship between TPV, SSA and vitrinite content).
Applsci 09 05130 g010aApplsci 09 05130 g010b
Table 1. Basic properties of coal samples.
SamplesCoal Particle Size(mesh)Ro,max (%)Macerals Composition (%)Proximate Analysis (%)
VIMMadAdVdafFCad
A140–602.9480.108.6711.230.9221.897.5671.55
A240–602.9489.104.904.621.0215.336.7178.19
A340–602.9594.232.373.511.1312.056.1481.61
A440–602.9494.552.953.181.108.545.8685.16
A540–602.9599.360.320.321.501.815.1691.72
Average40–602.9491.473.844.571.1311.926.2981.65
Note: Ro,max = maximum vitrinite reflectance with oil immersion; V = vitrinite; I = inertinite; M = mineral matter; Mad = air-dried moisture; Ad = dried ash yield; Vdaf = dried ash-free volatile yield; FCad = air-dried fix carbon content.
Table 2. Characteristics of pore structure and methane adsorption.
SamplesMIPLP-NALP-CACH4 Adsorption
VM (cm3/g)SM (m2/g)VBJH (cm3/g)SBET (m2/g)APD (nm)VCO2 (cm3/g)VDFT (cm3/g)SDFT (m2/g)VL, cm3/gPL, MPa
A10.02777.50.00231.4969.65622.880.074241.6731.551.07
A20.030111.550.00160.9228.57126.310.084277.1637.081.03
A30.027510.620.00210.9158.76128.360.089297.2037.410.96
A40.033812.160.00150.9137.89130.240.096319.2637.870.7
A50.029812.670.00251.5596.47034.290.106357.9638.631.29
Average0.029810.900.00201.1618.27028.420.090298.6536.511.01
Note: LP-NA = low-pressure N2 adsorption; LP-CA = low-pressure CO2 adsorption; VM = Volume of MIP; SM = Specific surface area of MIP; VBJH = Volume of LP-NA; SBET = Specific surface area of LP-NA; APD = Average pore diameter; VCO2 = Adsorption volume of CO2; VDFT = Volume of LP-CA; SDFT = Specific surface area of LP-CA; VL = Langmuir adsorption volume; PL = Langmuir pressure.
Table 3. Characteristics of fractal dimensions from MIP data and low-pressure adsorption data.
SampleskDA1δ1Ds1A2δ2Ds2De, 10−5 s−1
A1−1.452.55−0.57−0.712.43−0.270.192.192.88
A2−1.502.5−0.92−1.762.08−0.280.162.162.05
A3−1.642.36−1.15−2.451.85−0.300.102.101.93
A4−1.622.38−1.31−2.931.69−0.300.102.102.16
A5−1.402.60−1.27−2.811.73−0.210.372.371.42
Average−1.522.48−1.04−2.131.96−0.270.182.182.09
Table 4. Combined results of MIP, LP-NA, and LP-CA.
SamplesVt (cm3/g)St (m2/g)Pore Volume Ratio (%)Specific Surface Area Ratio (%)
V1/VtV2/VtV3/VtV4/VtV5/VtS1/StS2/StS3/StS4/StS5/St
A10.078242.8231.7860.7651.7861.27694.3880.0010.0030.0850.38699.525
A20.088278.0511.9231.2440.9050.90595.0230.0010.0040.0390.27899.68
A30.094298.2502.4550.4271.1740.96194.98400.0020.0460.30499.648
A40.101320.1211.4822.2730.6920.69294.8620.0010.0140.0320.22299.731
A50.110359.8180.7270.7270.7271.45596.36400.0030.040.47499.484
Average0.094299.811.6751.0871.0571.05895.1240.0010.0050.0480.33399.614
Note: Vt = Total pore volume (TPV); St = Total specific surface area (SSA); V1 = Macropore volume (>1000 nm); V2 = Mesopore volume (100–1000 nm); V3 = Transitional pore volume (10–100 nm); V4 = Micropore volume (2–10 nm); V5 = Super−micropore volume (<2 nm); S1 = Macropore SSA; S2 = Mesopore SSA; S3 = Transitional pore SSA; S4 = Micropore SSA; S5 = Super-micropore SSA.

