Article

Investigation on Smoke Flow in Stairwells induced by an Adjacent Compartment Fire in High Rise Buildings

1
State Key Laboratory of Fire Science, University of Science and Technology of China, Hefei 230022, China
2
Tianjin Fire Research Institute of MEM, Tianjin 300381, China
3
Department of Civil and Architectural Engineering, City University of Hong Kong, Hong Kong 999077, China
*
Authors to whom correspondence should be addressed.
Appl. Sci. 2019, 9(7), 1431; https://doi.org/10.3390/app9071431
Submission received: 16 February 2019 / Revised: 28 March 2019 / Accepted: 1 April 2019 / Published: 4 April 2019
(This article belongs to the Section Civil Engineering)

Abstract

:
The aim of this study was to evaluate the transport phenomena of smoke flow and vertical temperature distribution in a 21-story stairwell with multiple fire locations and openings. A large eddy simulation (LES) method was used to model the smoke flow in a stairwell model with a set of simulation parameters, wherein the fire heat release rate (HRR) and fire location were varied. Based on the results, a wall attachment effect was found in three-dimensional figures. Moreover, with an increase in the fire HRR, the effects were more pronounced. The simulation results verified that the vertical temperature distribution is an index model with a natural logarithm, where the pre-finger factor and attenuation coefficient increase considerably in accordance with an increase in the fire HRR. Moreover, there was a decrease in the maximum temperature (Tm) with an increase in the fire location factor (h*) due to the upward thermal smoke. Moreover, heat mainly accumulates in the area above a fire source. However, h* has a slight influence on the time required to reach Tm within the range of 53–64 s. Furthermore, the direction of the airflow at each side opening in the stairwell varied in accordance with the variation in the fire location changes, and a regular calculation was carried out.

1. Introduction

In recent years, a significant number of skyscrapers have been constructed to fully utilize vertical space and to reduce land occupation. However, there are several fire safety problems in relation to high rise buildings [1,2,3,4,5]. A notable case is that of the teacher apartment building fire in 2010, in Shanghai, China, which resulted in 58 fatalities. The fire spread to the 28th floor in less than 4 minutes with the help of stack effects; thus, the majority of people had no time to escape. Another significant case is that of the closed-circuit television (CCTV) Cultural Center Building fire, which led to 17 casualties and economic losses of 160 million yuan in 2009 [6].
In a high rise building fire, the fire plume rapidly develops due to many flammable exterior insulation materials and internal flammable items. Moreover, the high-temperature and toxic smoke are fatal. Based on studies, casualties caused by smoke account for approximately 40–70% of fire-related casualties in high-rise buildings. It is common knowledge that the smoke in building fires mainly consists of asphyxiating gases, such as carbon monoxide, hydrogen cyanide, and hydrogen chloride, which may cause people to faint or suffocate. For example, the MGM Grand fire occurred in 1980 in the United States and led to 85 fatalities, most of which were located on the upper floors, which were a distance away from the fire source, as the fatalities were due to toxic smoke. [3,4,5,6,7]. Furthermore, the stack effect intensifies flame propagation in high rise buildings, which results from the difference between the densities of the warm internal air and cold external air [4,5,6,7,8,9]. In addition, the stack effect is more pronounced in vertical shaft structures with an increase in height, by which the thermal smoke moves more rapidly from the lower to upper floors.
Owing to this, it is necessary to evaluate smoke flow in vertical shaft structures, such as the stairwells of high-rise buildings. Several researchers have conducted studies on smoke flow in the stairwells or shafts of building spaces over the last decades. Marshall [10] conducted experiments on a five-story stairwell model and observed thermal smoke and the changes in temperature. Tamura [11] evaluated the characteristics of the temperature distributions of fire-induced smoke in high-rise buildings. In addition, it was reported that the distributions of the openings have an influence on the pressure and temperature distribution within a five-story stairwell, with the fire located at the bottom and with two openings. A basic physical phenomenon and a relationship were found during their study on the mixing process of combustion. Chow and Cooper [12,13] further developed a model on smoke flow driven by buoyancy based on previous studies. Moreover, a set of equations was developed to simulate the combined buoyancy- and ventilation-driven flow through long vertical shafts. Zukoski [14] investigated the mixing process in a stairwell and predicted the relationship between the rest time and height of the opening, and thus introduced the Boussinesq approximation into the calculation. Qin [15] evaluated the effects of mass of air entrainment on the average temperature in a stairwell with a fire located on the bottom floor by varying the heat release rates (HRRs). The results revealed that the HRR has a significant effect on the distribution of the smoke, temperature, and velocity. Gao [16] deduced a steady-state model of temperature distribution in a stairwell with a top opening and one fire location based on multi-element region simulation. The results indicated that the upper average smoke temperatures in the fire room decrease with an increase in the HRR, and the heat pressure induced by smoke in the stairwell increases with an increase in the HRR and opening height. Zhang [17] conducted experiments at the University of Science and Technology of China (USTC) Large Space Experiment Hall to determine the temperature distribution at the top and bottom of a shaft, and then established a model of the shaft temperature and velocity distribution in a stairwell with only one fire location. Ji et al. [18] evaluated the transport characteristics of the thermal smoke flow driven by turbulent mixing in a stairwell with one fire location at the bottom, changing the opening height during experiments. Their results revealed that the opening height has a significant impact on the air entrainment, and further clarified turbulent mixing in stairwells.
In previous studies, experiments and simulations were conducted on the smoke flow induced by adjacent fires in shafts with the fire source only located at the bottom. With an increase in the height of the fire location, different amounts of ambient air that flowed into the stairwell had a significant influence on the combustion process and smoke flow. Moreover, most previous studies were conducted in stairwells with openings set at a fixed height. The height of openings and fire locations have an influence on the turbulent mixing movement. However, the effects of the fire locations, opening height, and number of openings on the upward smoke flow in stairwells were not addressed in previous studies. Furthermore, the effect of fire HRRs has not been studied systematically, although they have been studied. Regarding the research, due to limited time and cost in experiments, several complex and comprehensive fire conditions were difficult to evaluate in previous experiments, and minimal studies have been conducted using a series of simulations focused on the fire case. Therefore, phenomena based on fire dynamics and slight differences may be neglected, such as the wall attachment effect, otherwise known as the Coanda effect. When the smoke moves upward in the shaft, it continuously entrains the air; whereas the left wall surface of the shaft restricts the smoke entrainment, thus resulting in smoke attachment onto the left side of the wall [19,20,21,22]. Harrison and Spearponit [23] observed this phenomenon in a study on an adhering spill plume.
In this study, to make the research more comprehensive, the numerical method was used to simulate fire-induced smoke flow through a 21-story stairwell in a high-rise building model. The aim of this study was to investigate the transport phenomenon of thermal smoke, and to determine the flow field in the stairwell under the stack effect with changing fire heights, HRRs, and openings height in the stairwell. In addition, the temperature distributions were considered with respect to different simulation configurations, and the simulation results were used to verify the theoretical model.

2. Simulation Setup

In this study, fire dynamics simulator (FDS) 2018 was used to simulate fire-induced environments, and it includes two models, namely, the direct numerical simulation (DNS) and large eddy simulation (LES) [15,24]. Given that the focus of this work is on buoyancy-driven thermal smoke flow, LES was employed for the simulation. Prior to the simulation, a model should be built. Then, a train of grids should be set and divided into basic units according to the grid independence; thus, a reliable grid-set can be obtained. Thereafter, general fire parameters, such as the temperature, velocity, visibility, and gas concentration can be monitored and outputted after the computation, which is mainly based on viscous fluid equations, i.e., the Navier–Stokes equations [24].

Simplified Model and Configurations

Modeling: In this paper, the selected building is a 21-storey office building located in the Cross-border E-Commerce Comprehensive Experimental Zone (Hefei, China). Figure 1 shows a model of the whole building (Figure 1A) based on the Computer Aided Design (CAD) of the building (Figure 1B).
However, to save computational cost and enhance the simulation accuracy, a simplified model was applied in this paper, presented in Figure 2, simulating the stairwell (as well as compartment) of a 21-story high rise building with a height of 89.8 m. The building parameters of the stairwell are presented in Table 1. Each floor was of a different height, ranging from 3.9–8.0 m, and the floor slabs were 0.2 m thick. The cross-sectional dimensions of the stairwell and compartment were 6.75 m × 2.9 m and 4.2 m × 2.9 m, respectively. The dimensions of the side door and front door were 1.4 m × 2.1 m and 1.4 m × 2.1 m, respectively. These doors were all located at the middle of the wall, and the coordinates in the y direction of the front door ranged from 2.65–2.95 m.
Thereafter, the mesh size was reduced to further refine the mesh. According to the FDS user Guide, the characteristic diameter of the fire source D* could be used to conduct a grid independence study, as shown in Equation (1):
D * = ( Q ρ 0   c 0   T 0 g     ) 2 / 5
where Q is the HRR of the fire source, kW; ρ0 is the air density, kg/m3; c0 is the air specific heat, kJ/(kg·°C); T0 is the ambient temperature, K; and g is the acceleration of gravity, m/s2.
According to the FDS user Guide, the ratio of D*/δ (δ is the side length of the mesh), which implies good computational accuracy, should be in the range of 8–12. Considering the fire HRR of 3 MW as an example, the most suitable mesh length is in the range of 0.12–0.18. At last the one type of grid (0.2 m × 0.2 m × 0.2 m) was chosen after preforming a grid independence. The total number of grids is 55 × 20 × 452 = 4.972 × 10⁵. Besides, for the stability of the numerical transmission, the grid was configured as only one set of grids rather than several sets.
In addition, the lining material of the stairwell construction was specified as “CONCRETE”, and its density, specific heat, and conductivity were 2200 kg/m3, 0.88 kJ/(kg K), and 1.2 W/(m K), respectively [24,25,26]. The ambient temperature was 20 °C, and the area of the fire source was 0.5 m2. Detailed information was listed in Table 2.
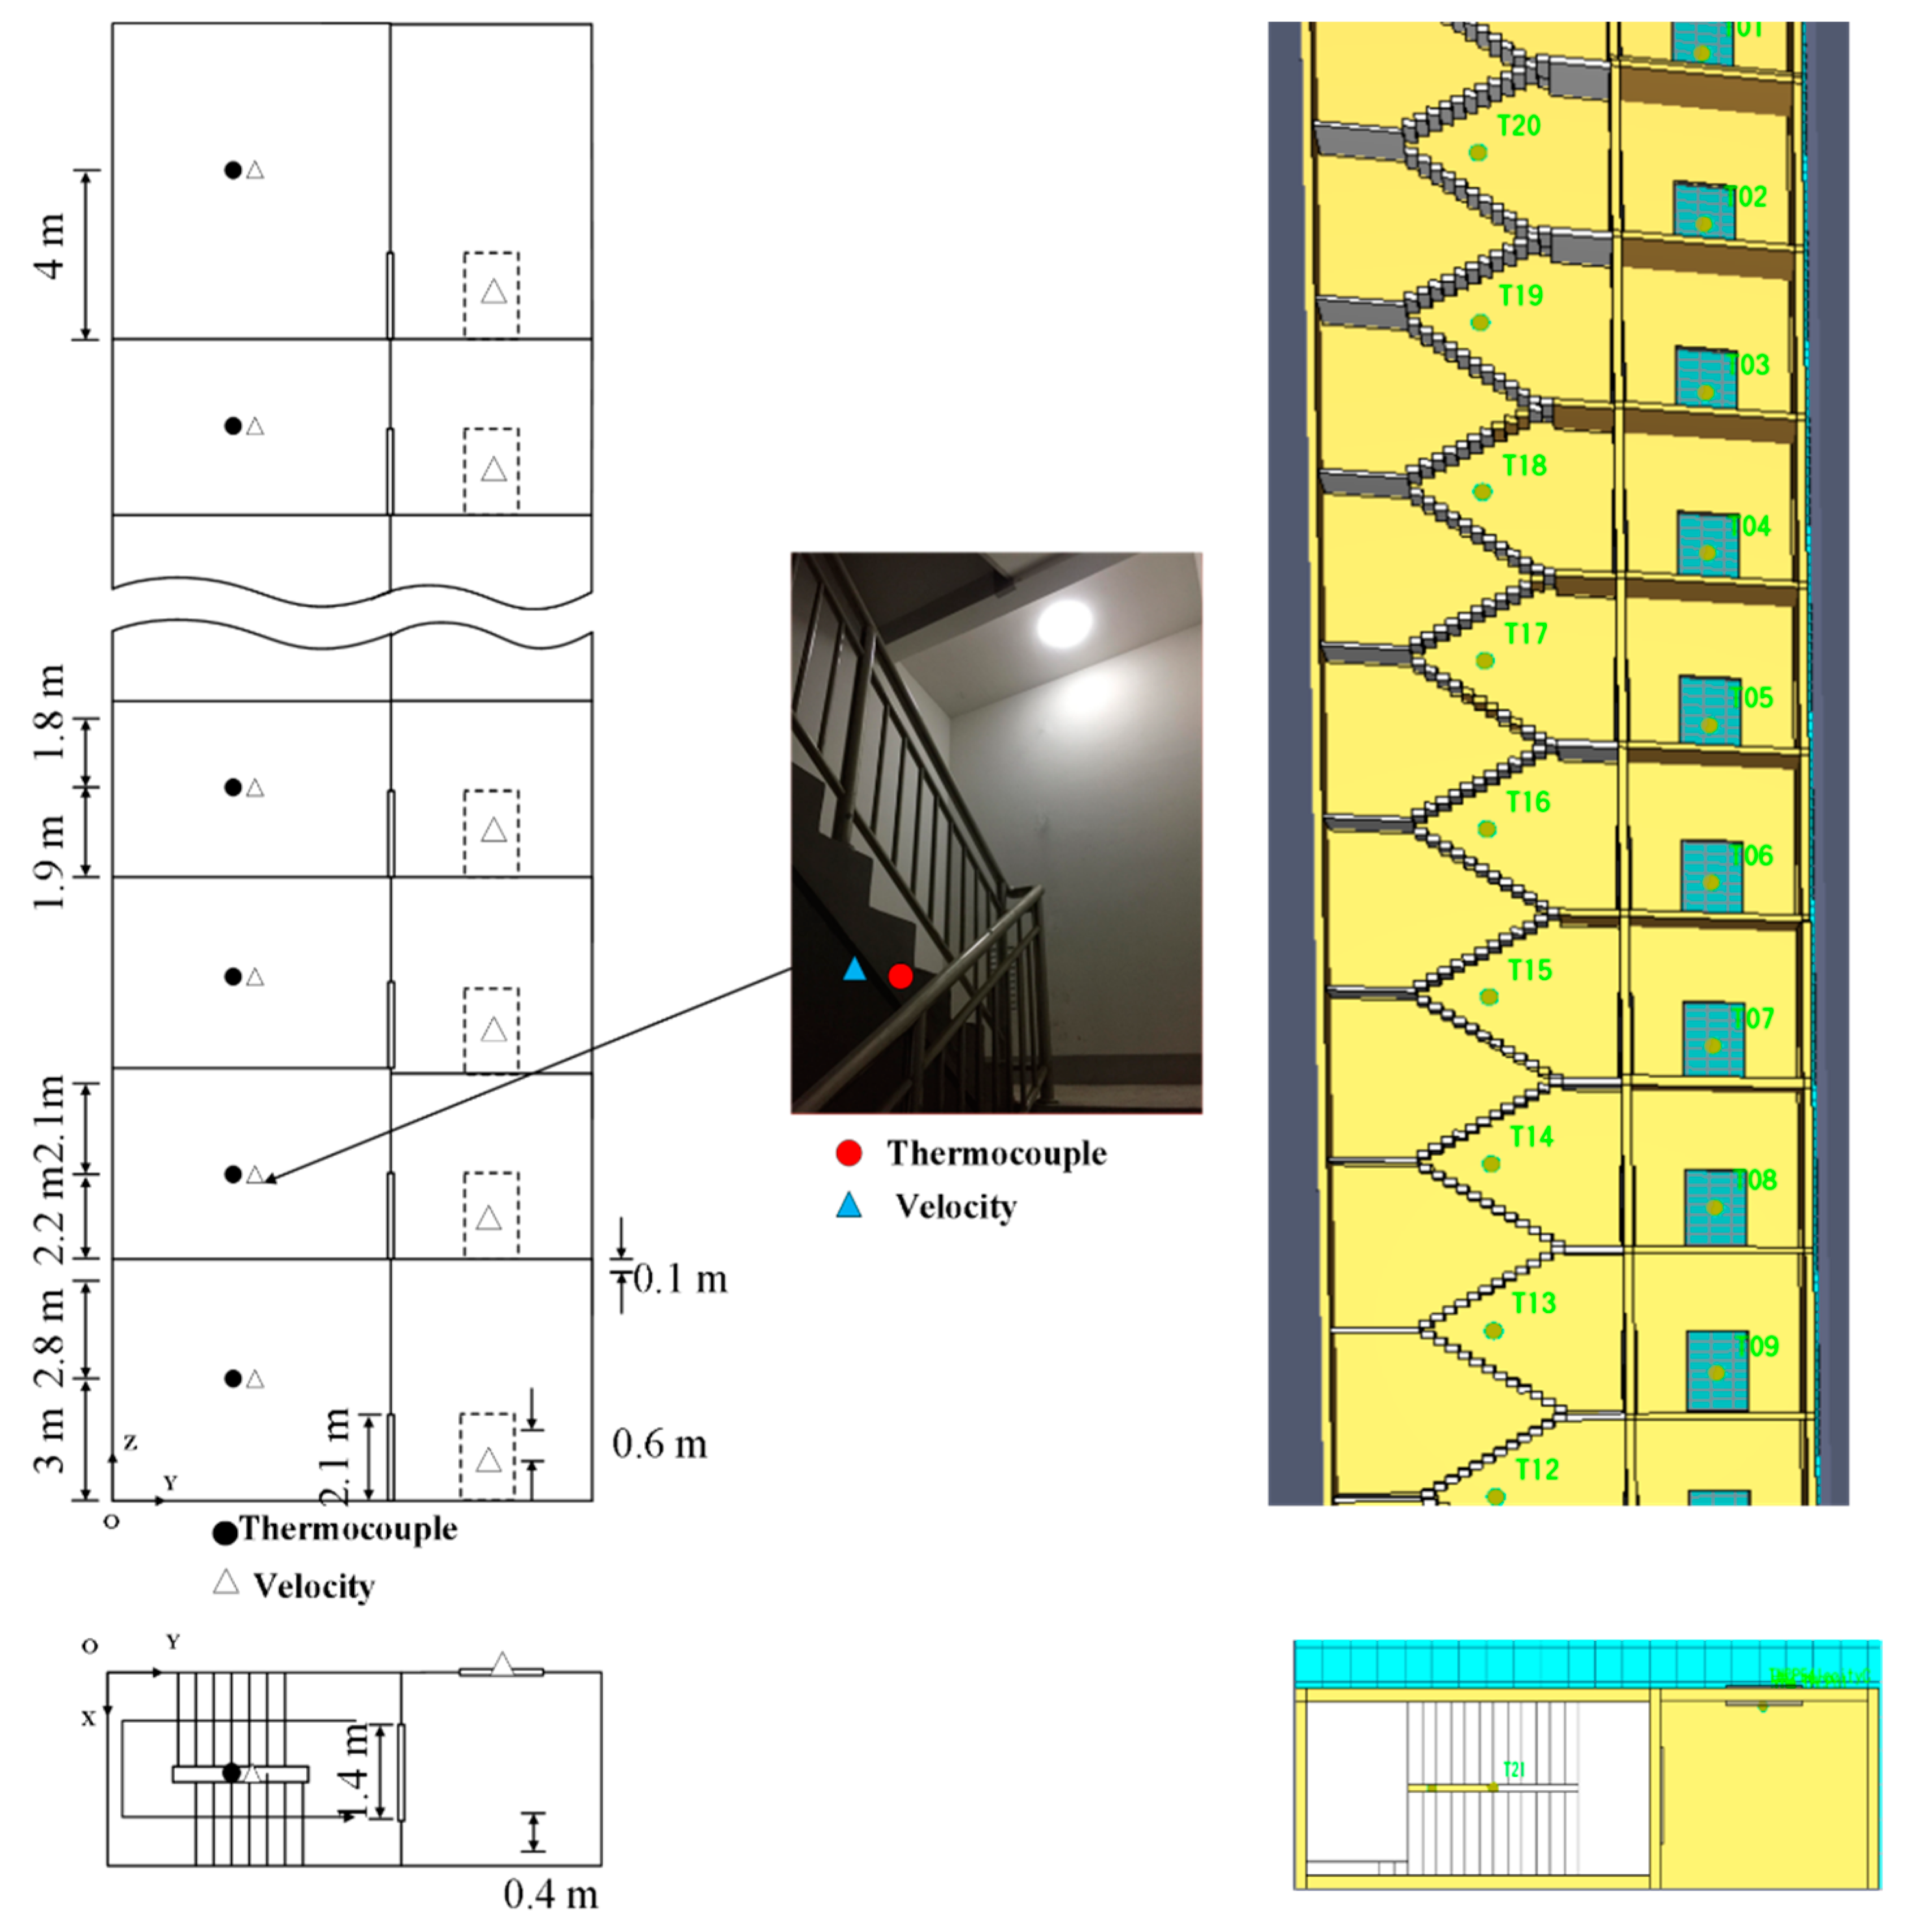
Layout of measuring point ---- Several sensor planes were positioned in the model to obtain the temperature distribution and smoke flow for a qualitative analysis. However, an accurate quantitative study should be based on detector results; thus, more probes, such as thermocouples and velocity sensors, were employed in the model as follows. For the recording of the temperature, 21 thermocouples were positioned in the gaps between two stairs in the model, as showed in Figure 3. For the recording of the velocity; similarly, the sensors were placed in the gap in the middle of the stairwell in the simulation model. These measurement points were placed in the same line in the model and their coordinates can be expressed as (3, 1.5, z). All these placement in the model are clearly presented in Figure 3.
Configurations: In this simulation, the most critical factor was the fire source, which includes the fire HRR and fire location. Moreover, two types of models were applied, namely, the uniform-opening stairwell and non-uniform opening stairwell along the length varying from each other with respect to the number of openings and their locations.
Group I: There are seven tests conducted in the model that differ from each other with respect to the fire HRRs, which range from 0.1–3.5 MW. This group of tests was designed to evaluate the influences of different HRRs. Moreover, the HRRs simulated in this section were selected according to combustion tests of common flammable objects that piled up in the stairwell [28,29,30,31]. Moreover, this was carried out with reference to previous studies [15,16,17,18].
Group II: Nine tests were conducted, which differ from each other with respect to the atria fire location in uniform-opening stairwell and non-uniform opening stairwell, respectively. There were four tests conducted on the uniform-opening stairwell model (there are openings on all floors), varied only with respect to the fire location, i.e., at Floors 1, 5, 10, and 15, respectively. Another five tests were conducted on the non-uniform opening stairwell model (there are only two openings for the air flow loop). With a change in the height of the fire location, the height of the side opening changed as well. However, the side opening was still located on the same floor as the fire source, which allowed for a classic stairwell model to be established.
The details are listed in Table 3.

3. Results and Discussion

3.1. Effects of Fire Size

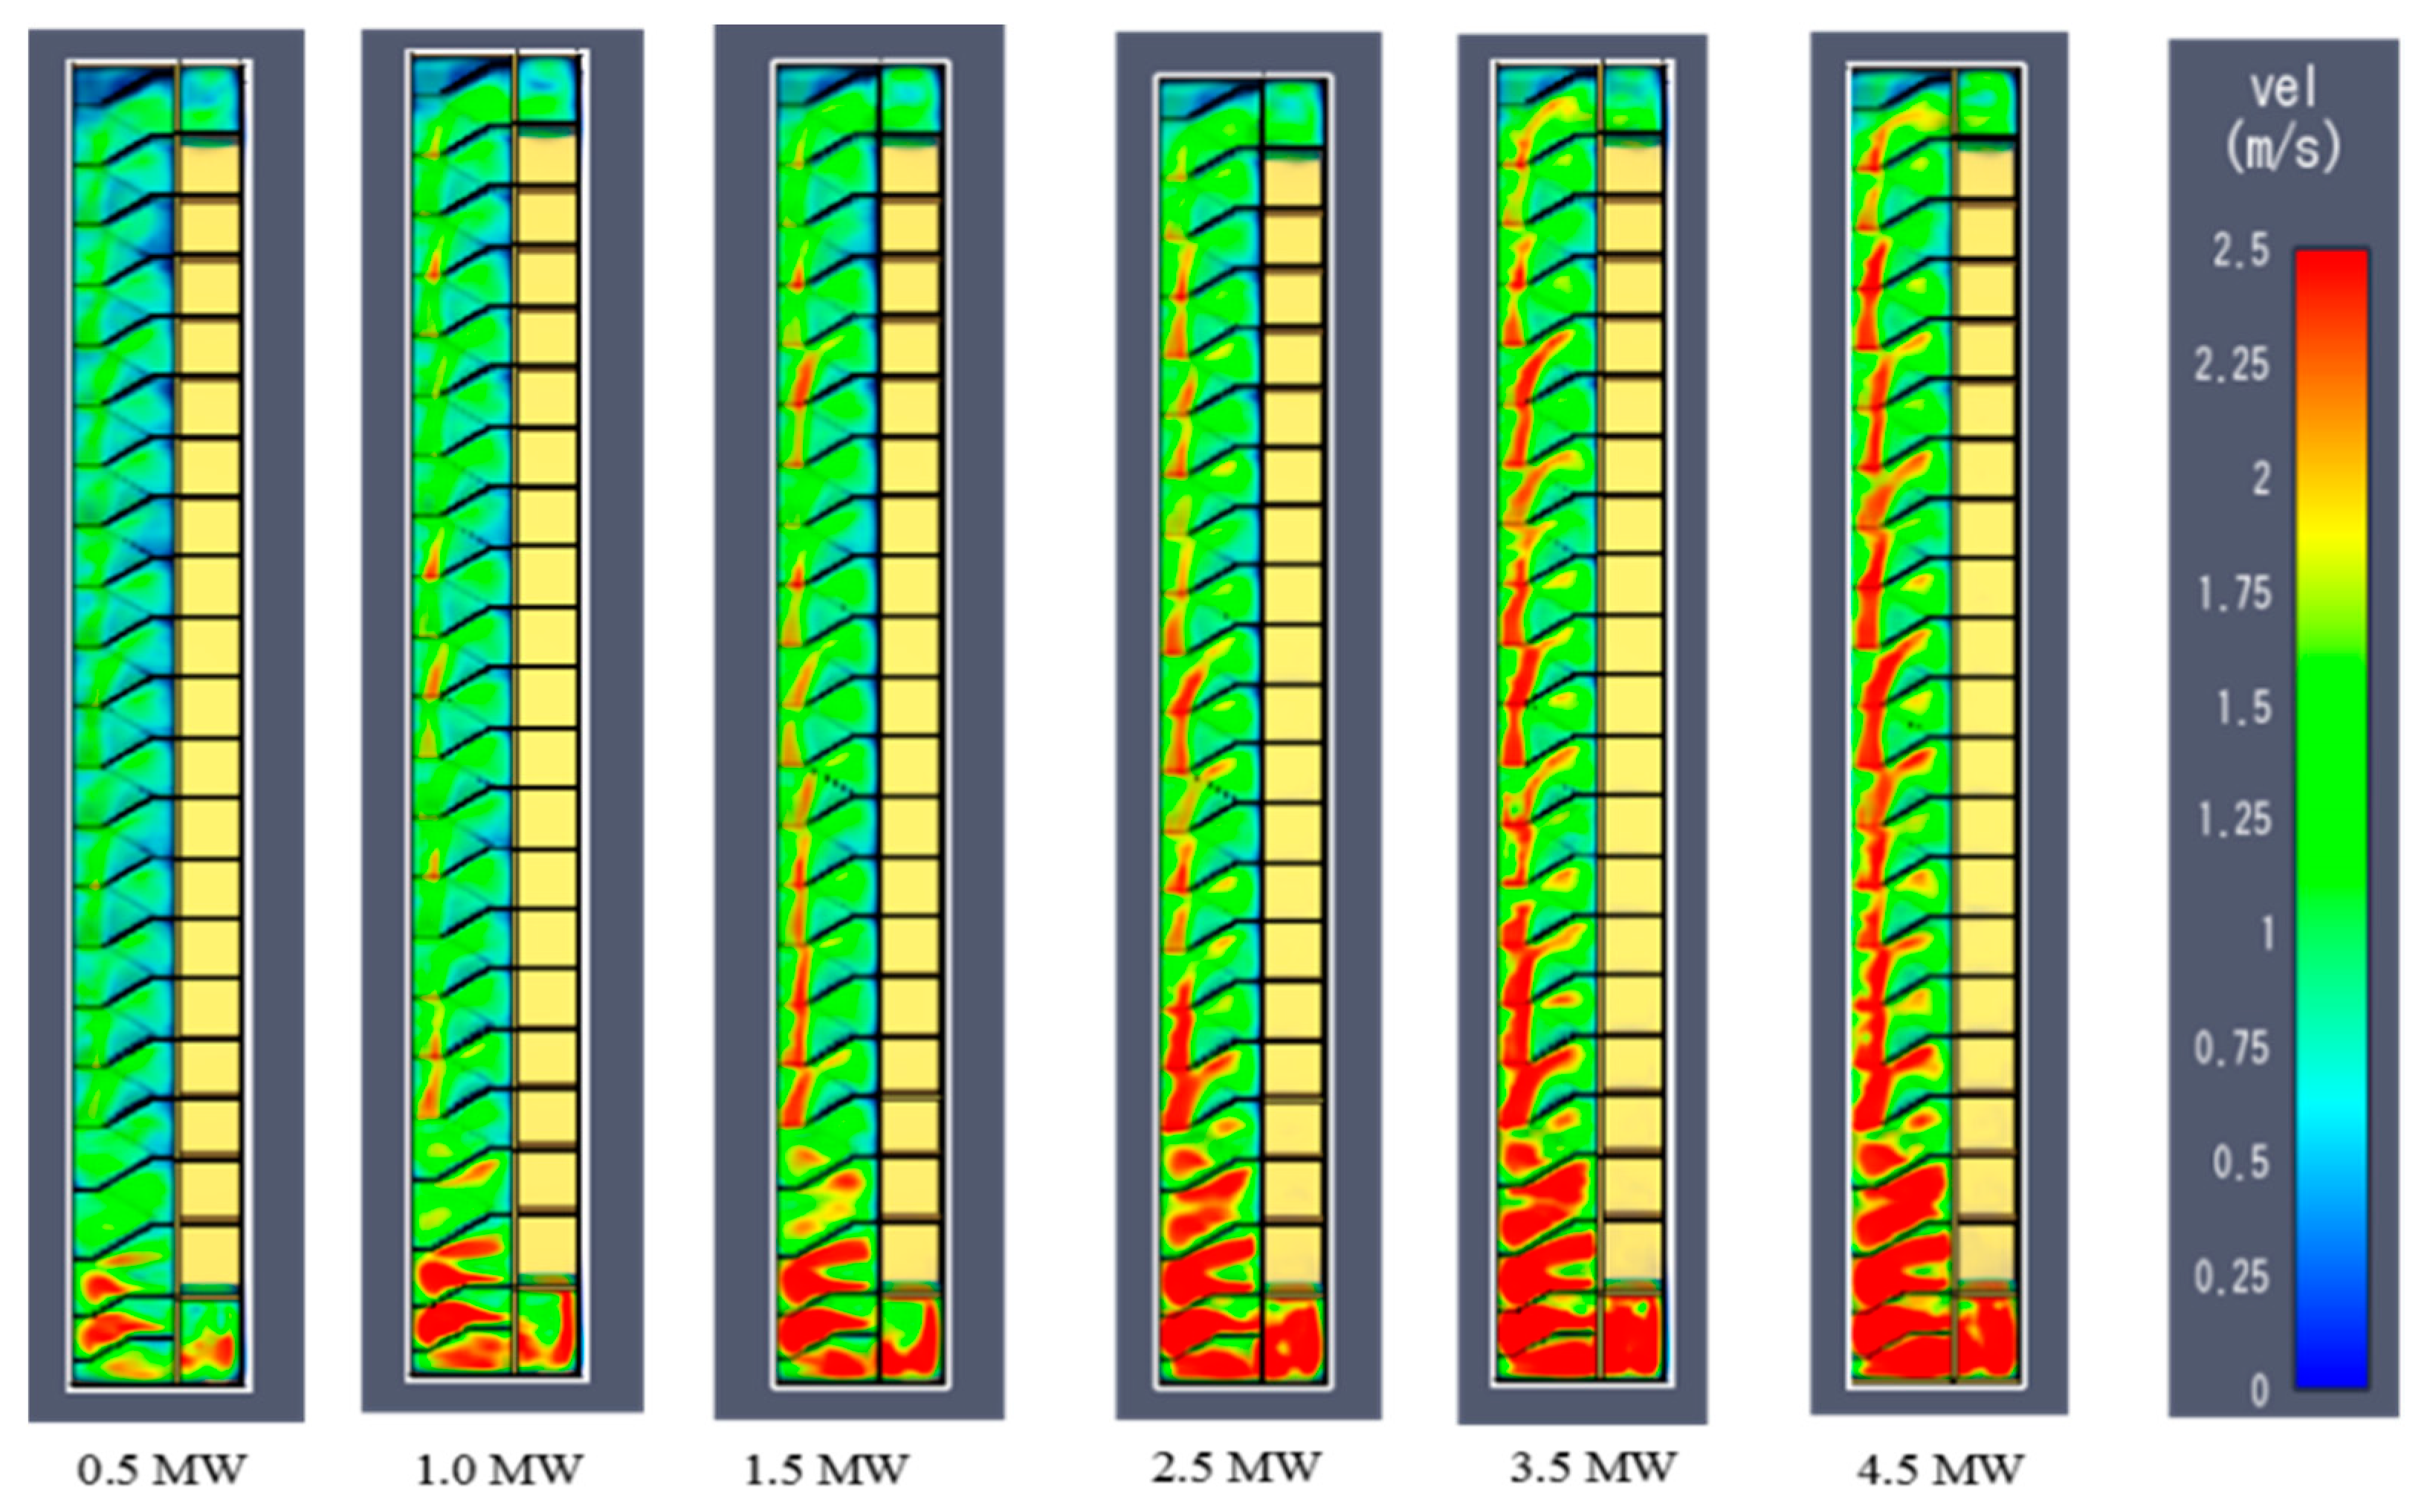
During the simulations, several types of HRRs were considered, i.e., 0.5 MW, 1.0 MW, 1.5 MW, 2.5 MW, and 3.5 MW. Figure 4 was obtained from the FDS, in which there was a sharp increase in the velocity of smoke flow in accordance with an increase in the fire HRR. In addition, with an increase in the height, there was a decrease in the velocity of smoke flow from 2.5 m/s near the fire to 1.75 m/s away from the fire on the top floor. The buoyancy plume driving force decreased in accordance with an increase in the distance from the fire source. Moreover, an increase in the fire HRR would contribute to a more pronounced wall attachment effect on the side away from the fire. The air near the side wall (especially the left side) was identified to move at a higher speed, namely, most of the air flow was in the forward direction along the wall at a high speed.
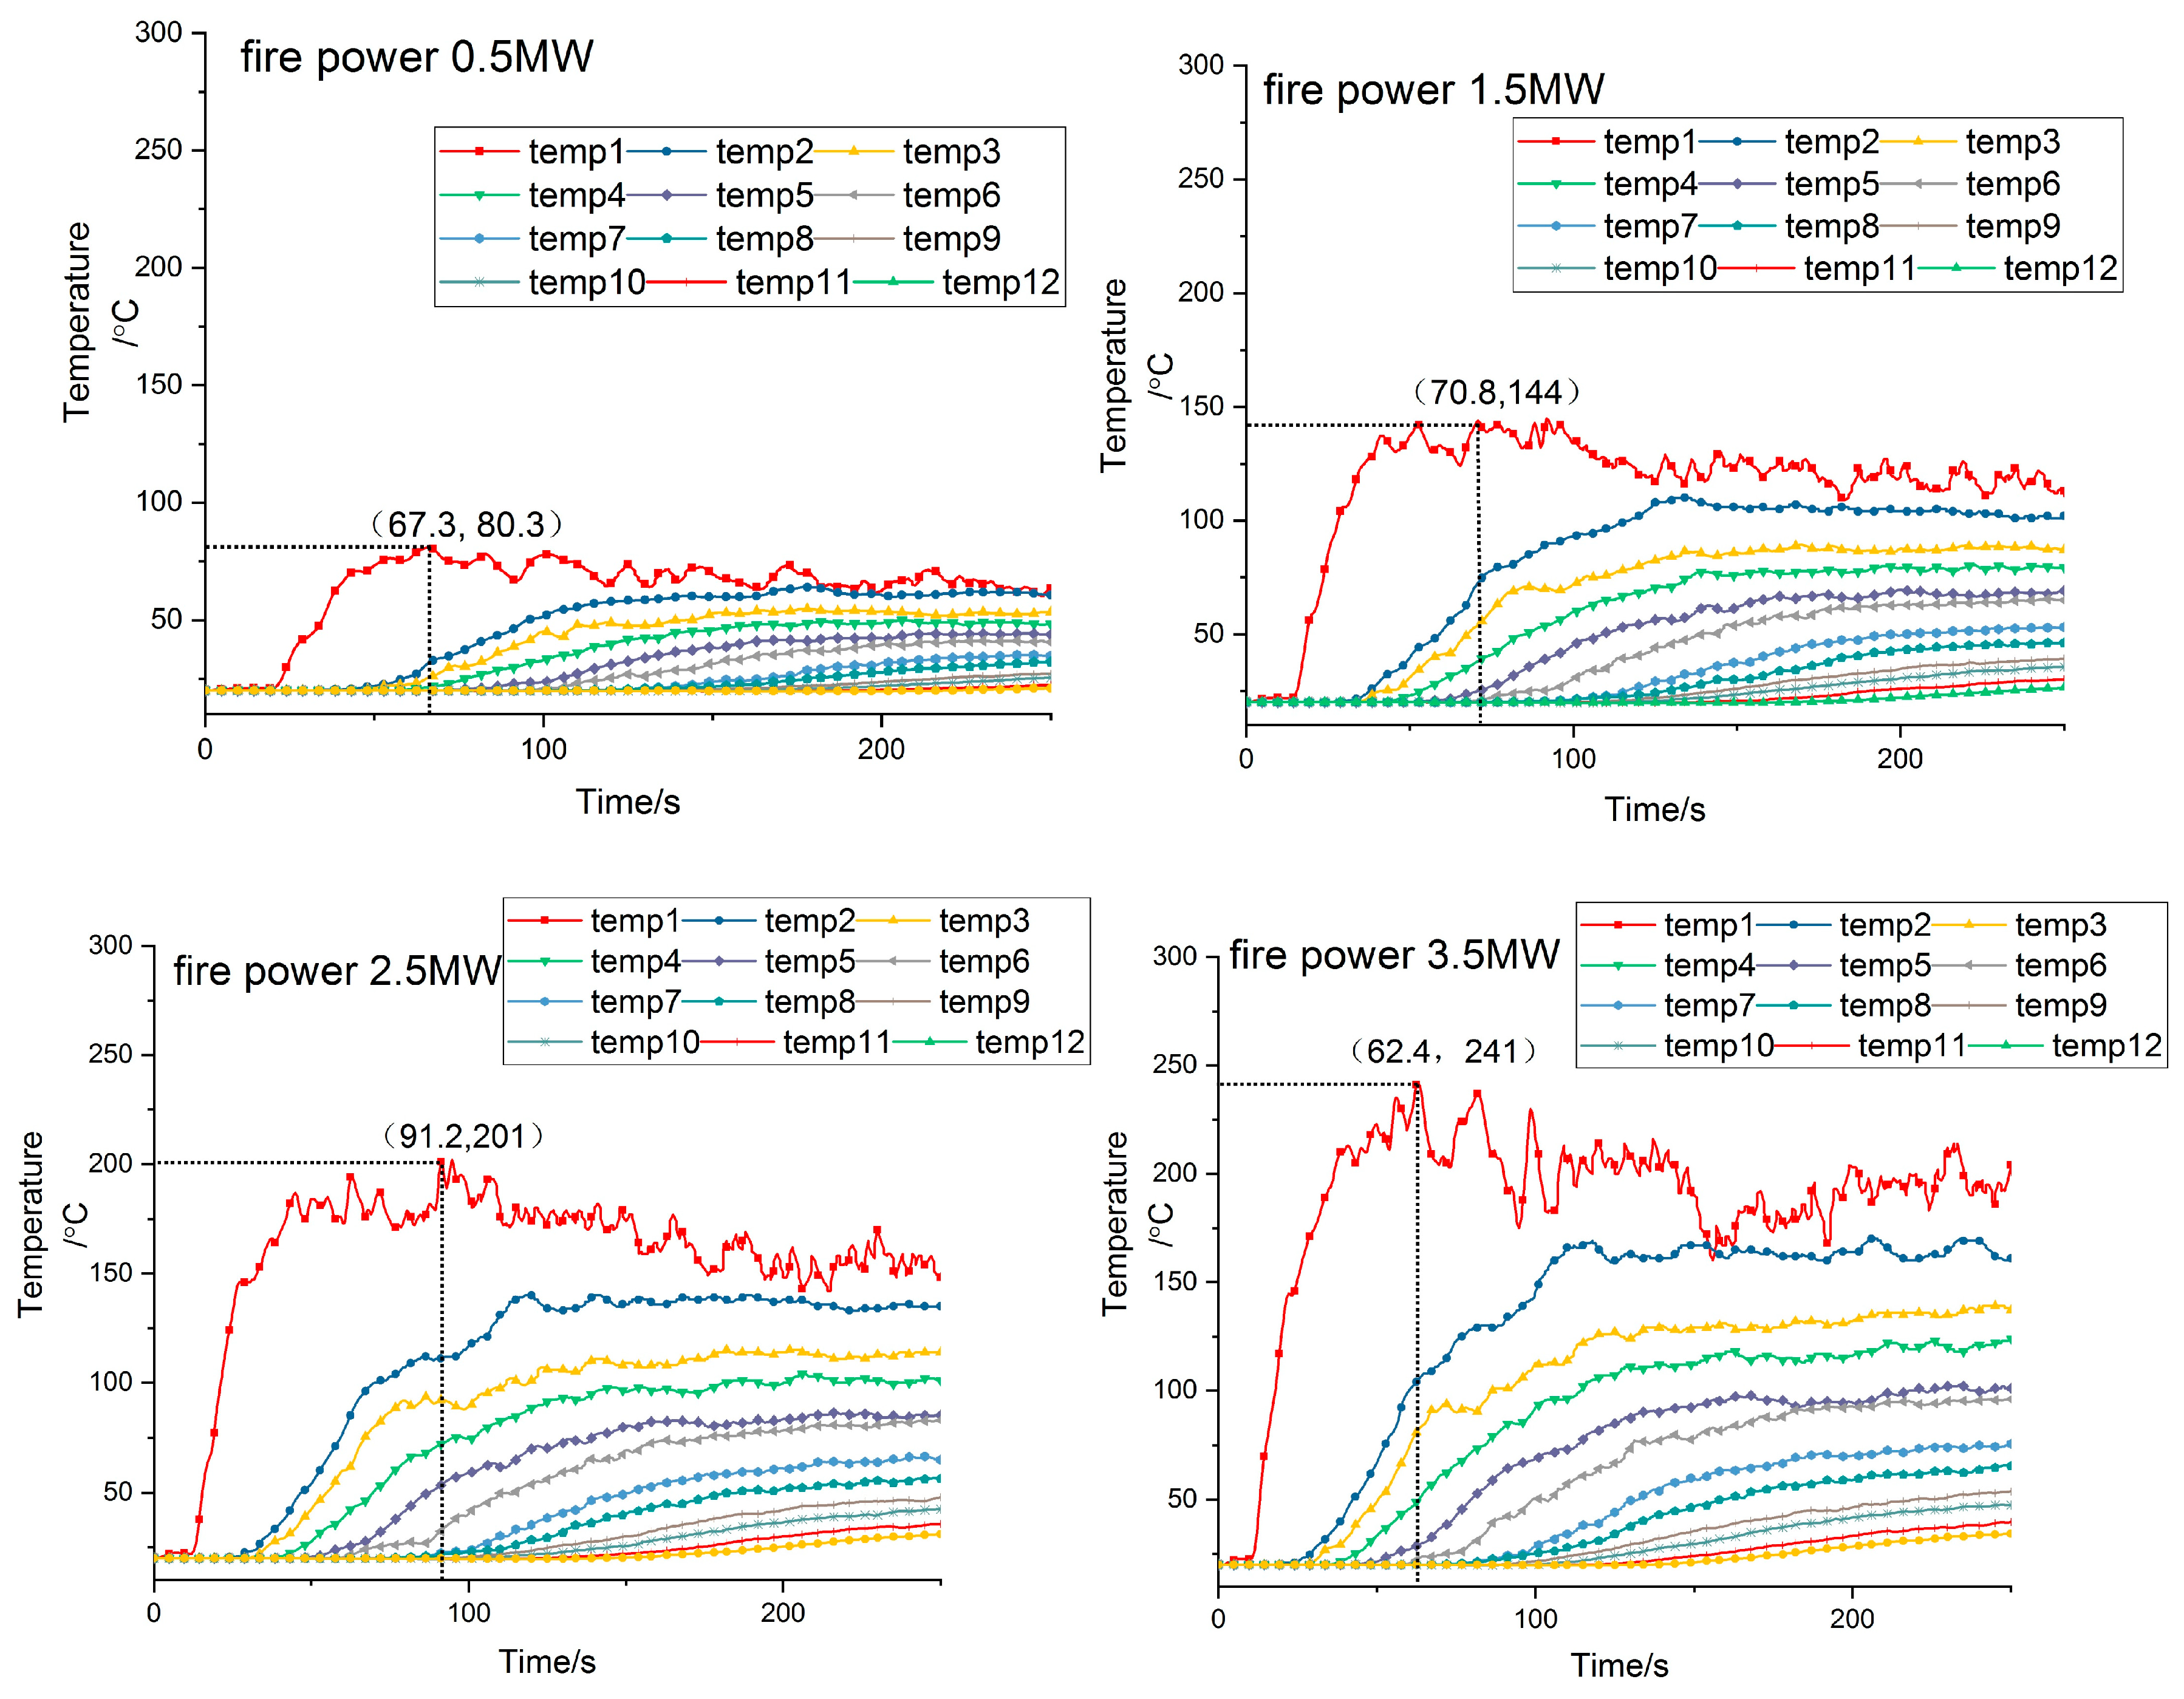
Buoyancy-driven thermal smoke has a significant influence on the temperature distribution in a stairwell [18]. Based on Figure 3, the influence of the fire HRR on the temperature distribution in the stairwell could not be clearly determined. Hence, the temperatures recorded using the thermocouples placed on each floor during the simulations were employed for further evaluation. Figure 5 presents the changes in temperature with respect to different fire HRRs (0.5 MW, 1.5 MW, 2.5 MW, and 3.5 MW), wherein curves of different colors represent different heights. It was concluded that an increase in the power of the fire source resulted in an increase in the temperature of the stairwell. At a fire HRR of 0.5 MW, the maximum temperature of Floor 1 was 80.3 °C, whereas at a fire HRR of 3.5 MW, the maximum temperature of Floor 1 was 241 °C, which is nearly greater than the value at a fire HRR of 0.5 MW by a factor of 3. Furthermore, the temperature curves of the lower floors were few and widely spaced; whereas for higher floors, the temperature curves were closely spaced. In particular, the temperature difference in the near-fire area was more pronounced, and the temperature difference in the area far away from the fire was smaller.
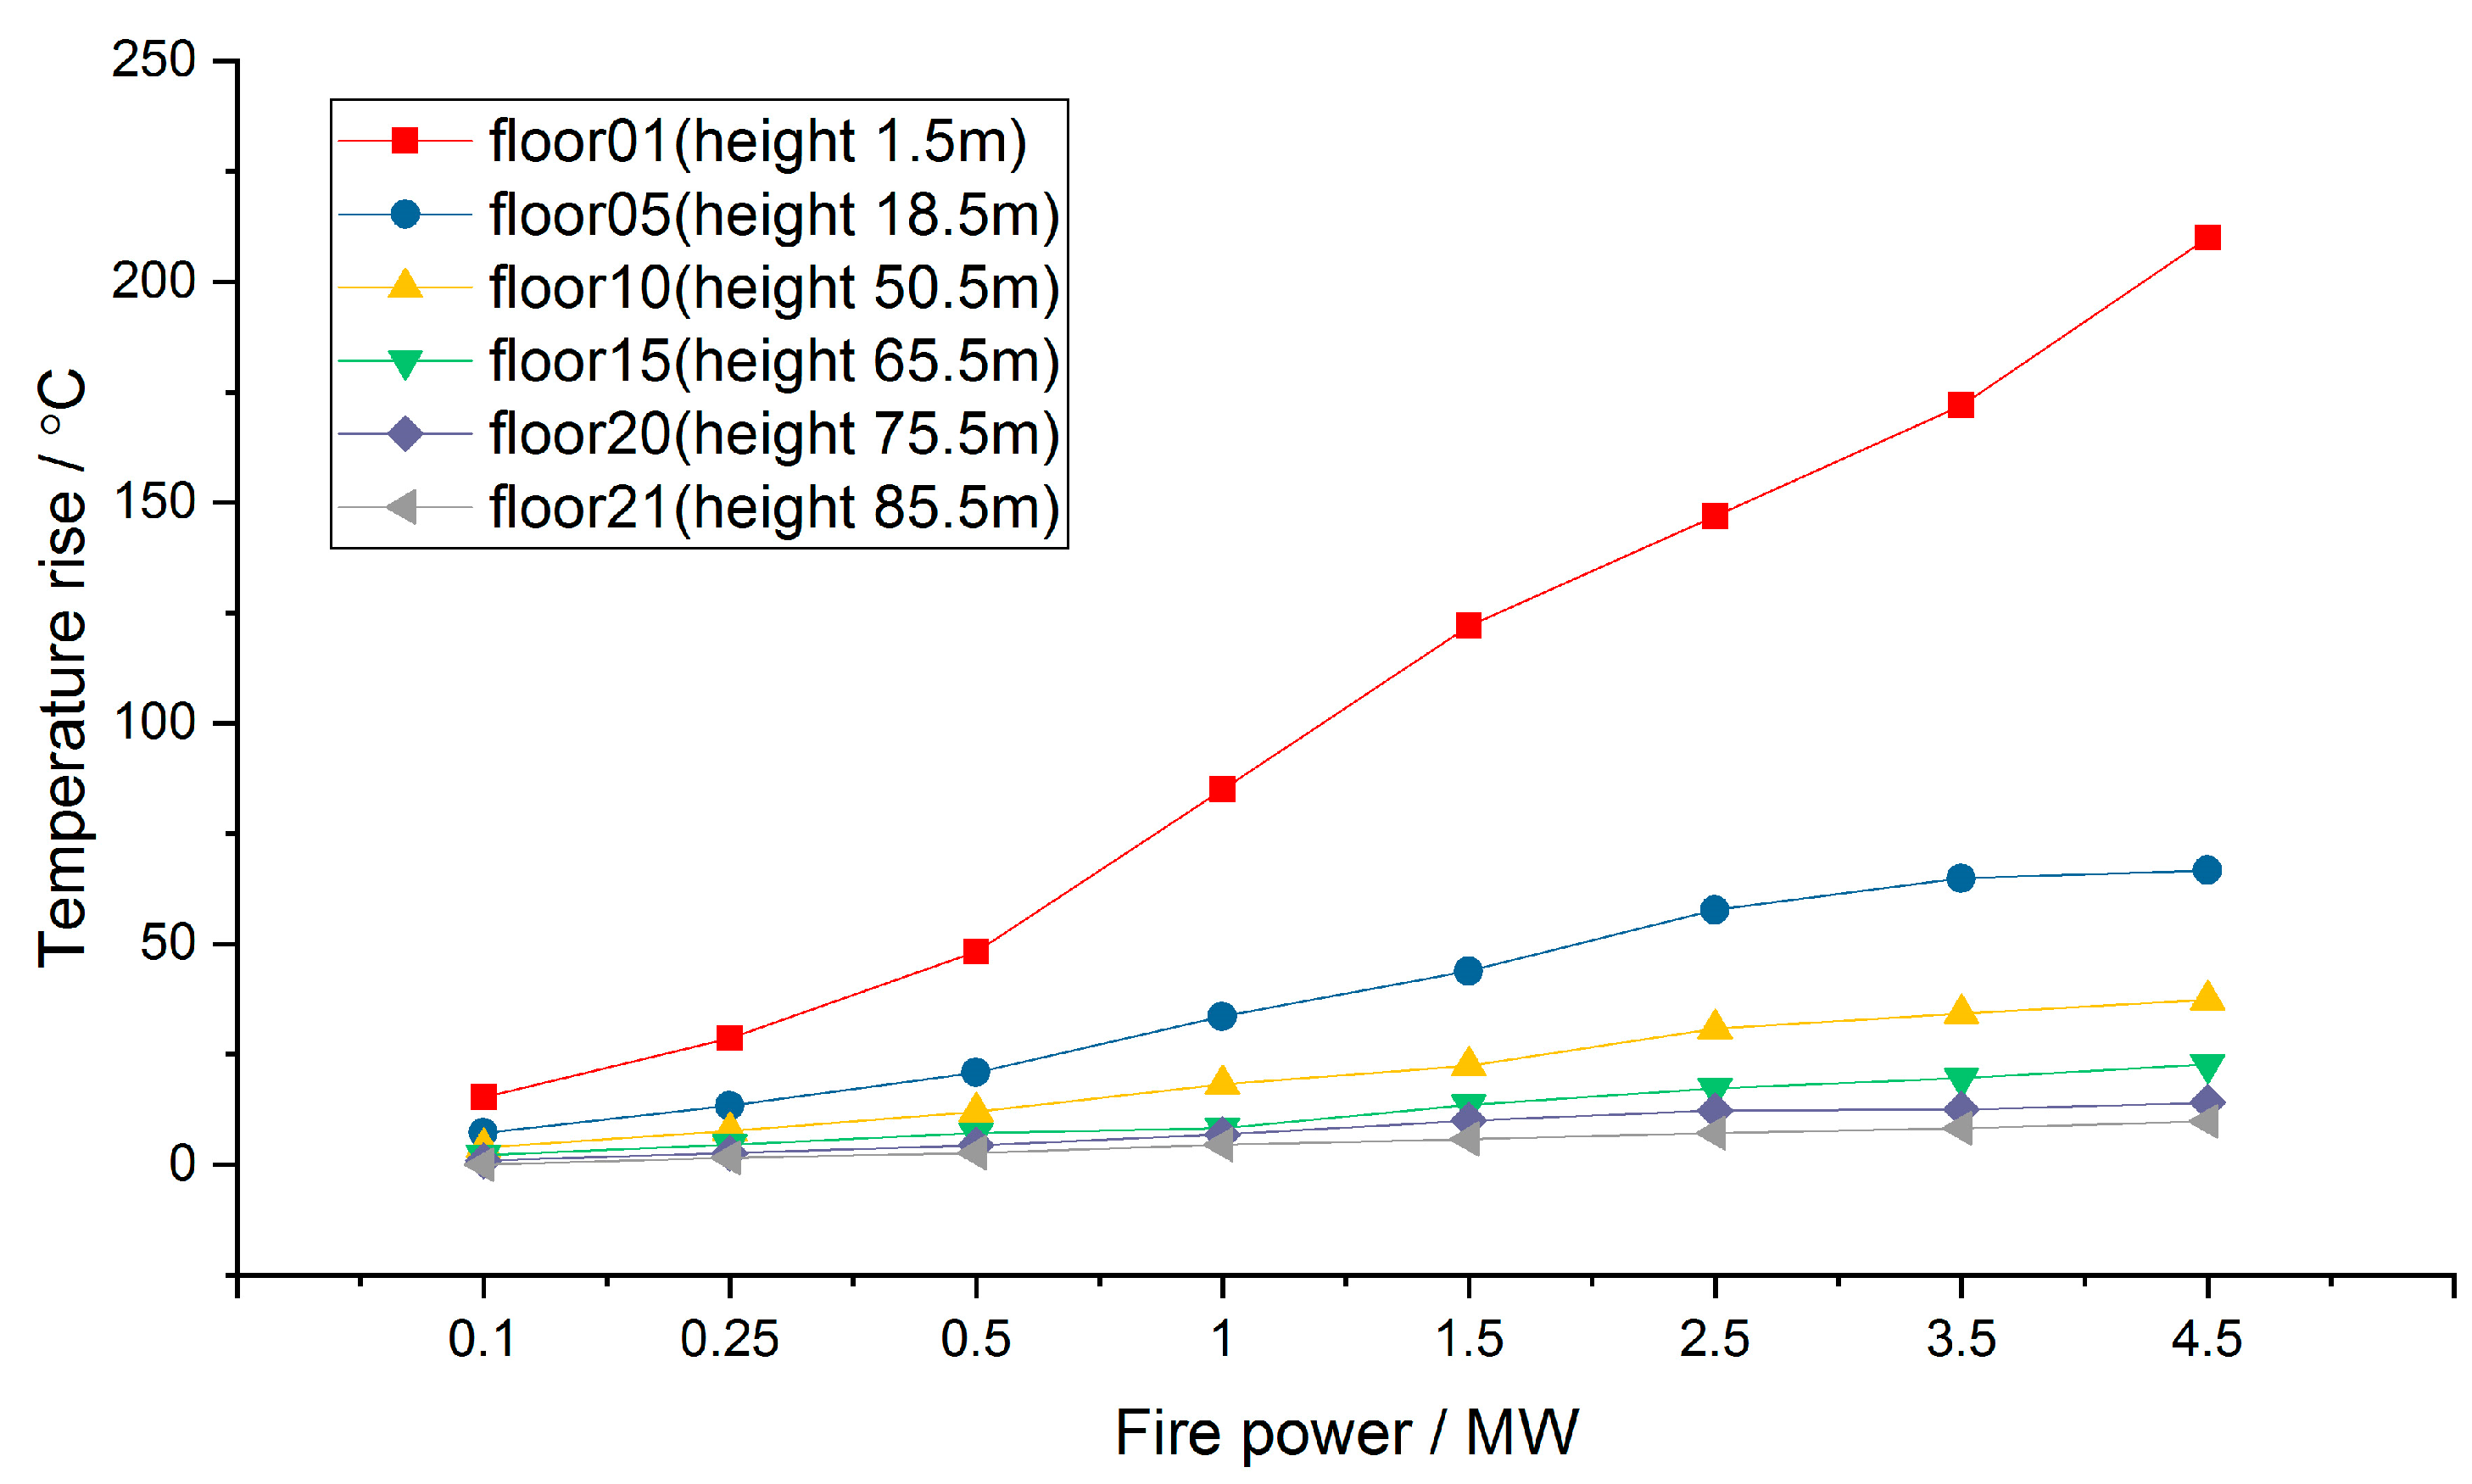
To further evaluate the temperature variation with respect to the fire HRR and increase in height, the maximum value of the temperature increase is presented in Figure 6, wherein curves of different colors represent different heights. Figure 6 shows that the slope of the red curve (Floor 1, 1.5 m) had the maximum slope, whereas the gray curve (Floor 21, 85.5 m) had the minimum slope. In particular, with an increase in the height, the influence of the fire HRR decreased. This was due to the cold air caused by the air entrainment [3,18], which resulted in a decrease in temperature due to the neutralization of hot and cold air. In addition, the temperature difference increased in accordance with an increase in the fire HRRs. Hence, higher fire HRRs result in larger temperature differences, and an increase in height also results in larger temperature differences.
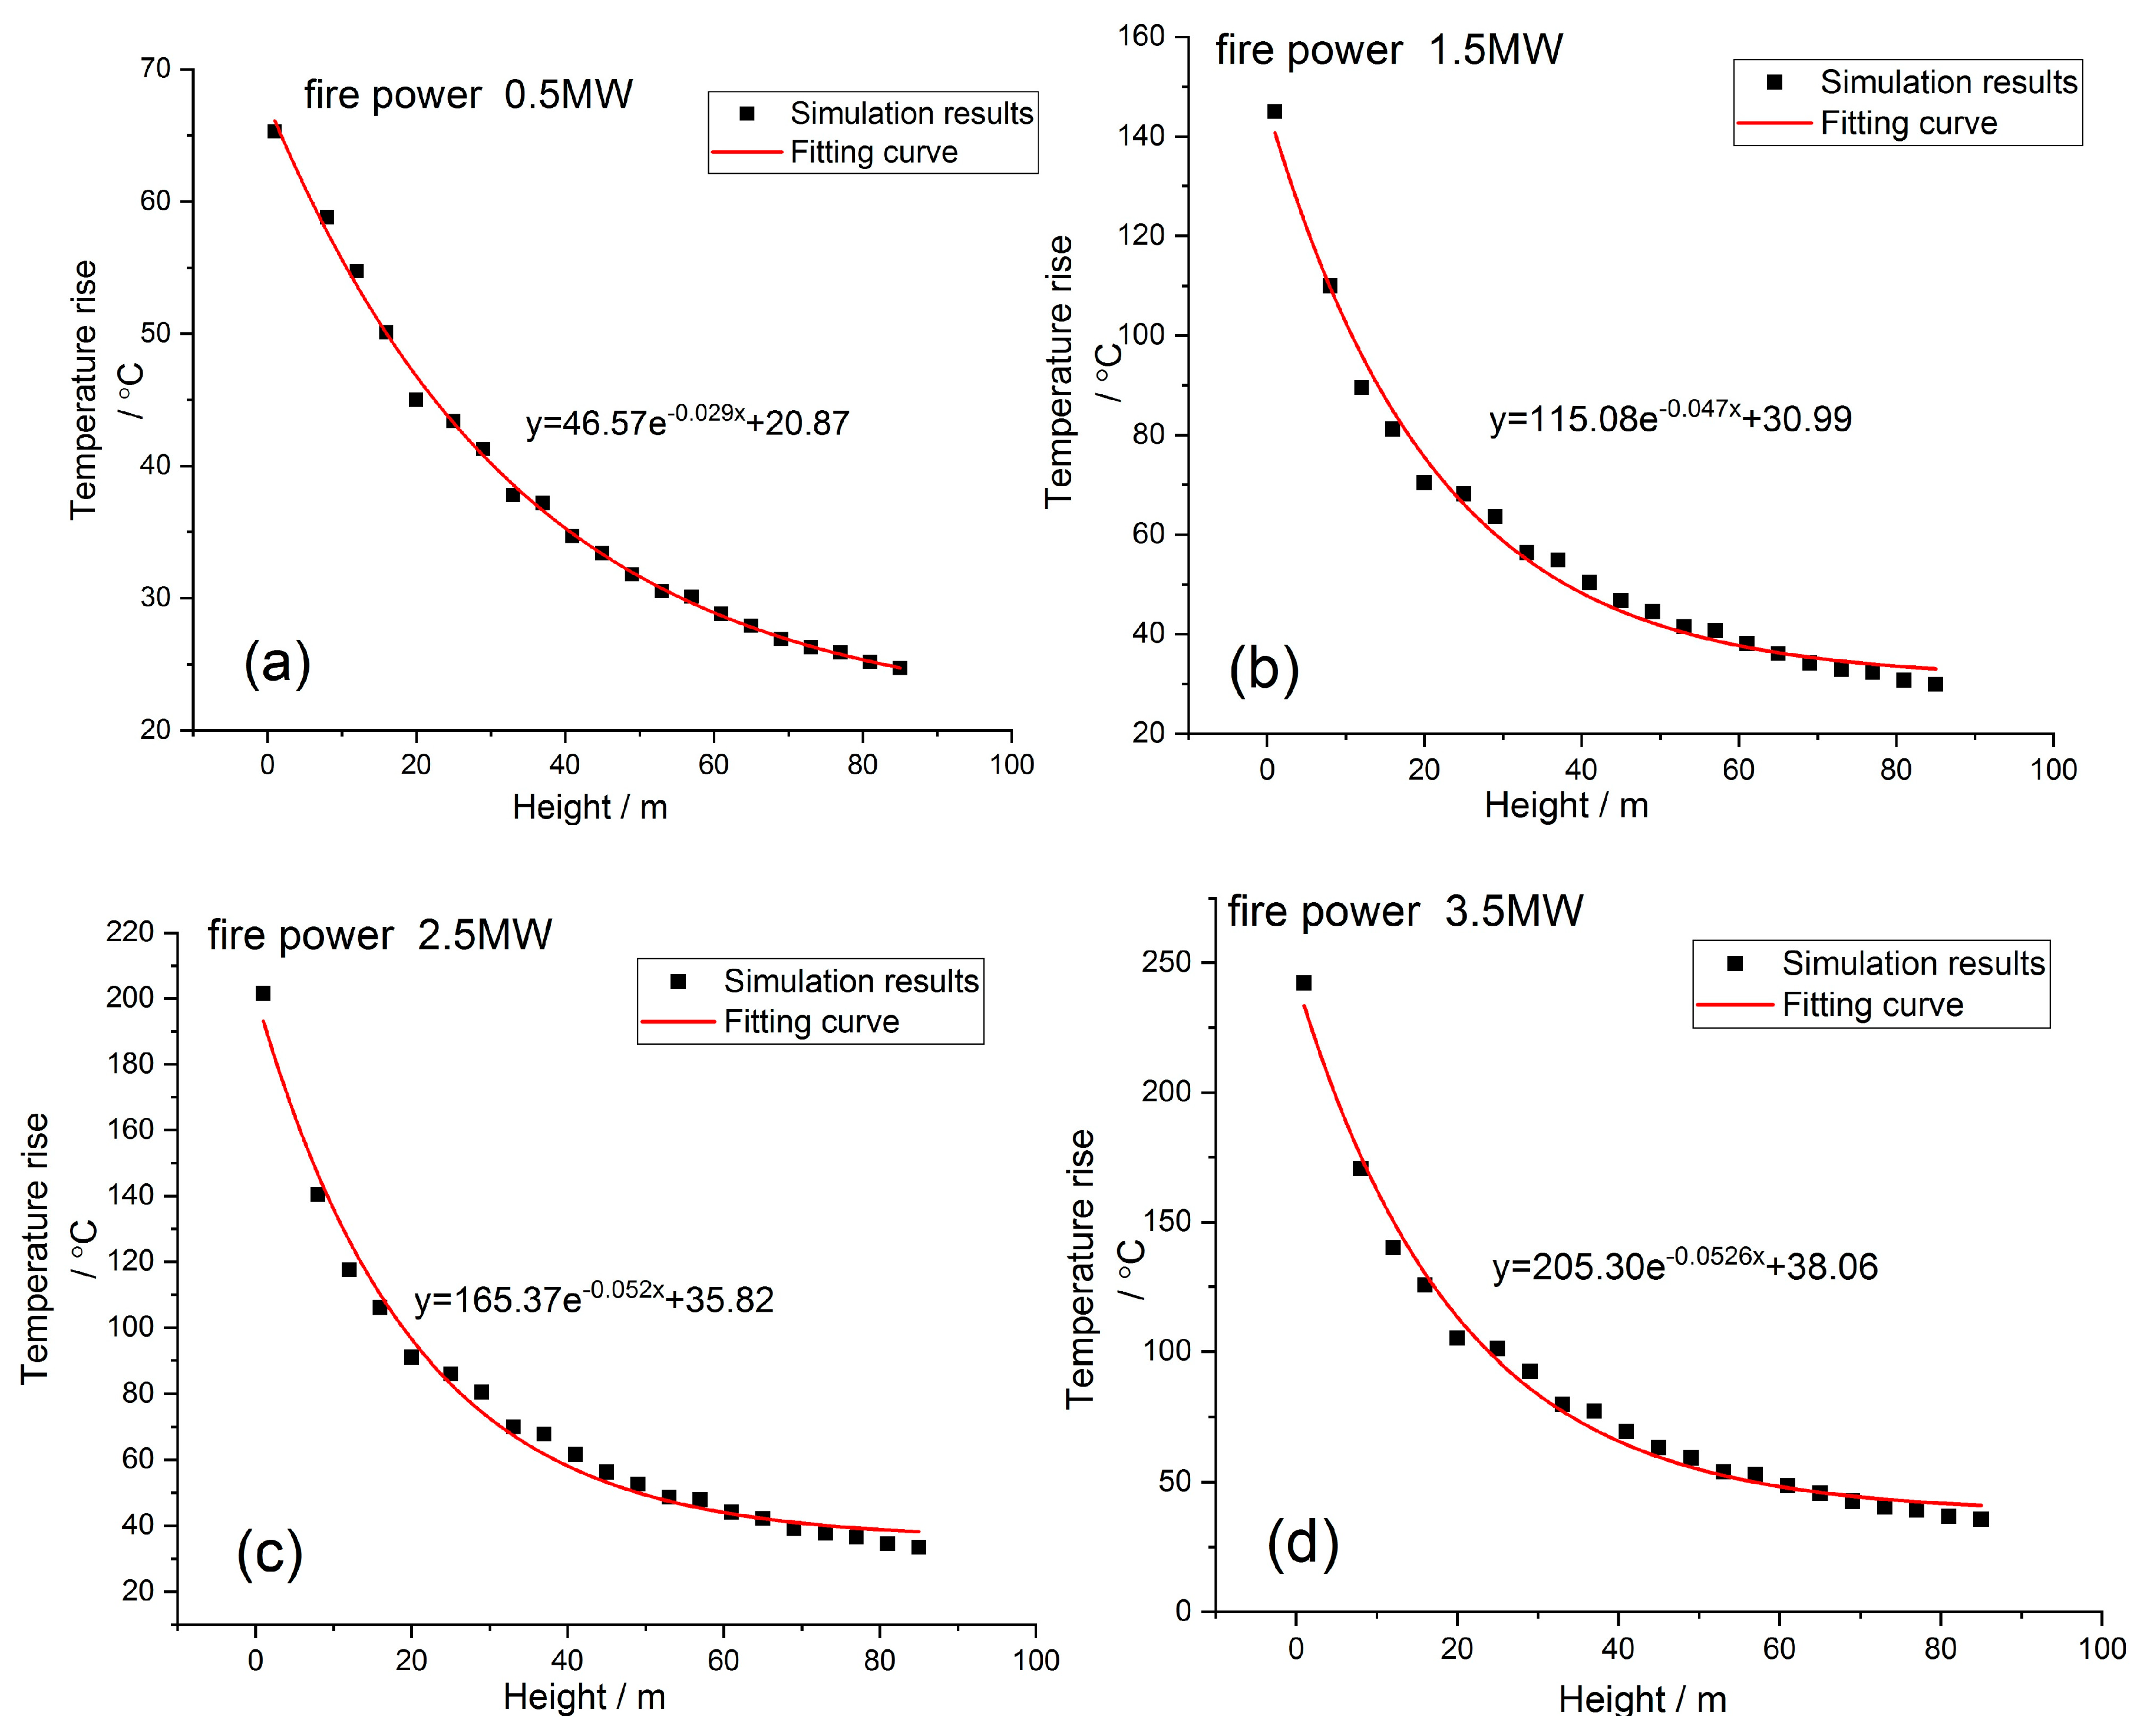
Figure 7 illustrates the vertical temperature distribution in the stairwell, which describes the increase in temperature, as measured using different thermocouples at a certain height in the model, wherein they were varied with respect to the fire HRRs of 0.5 MW, 1.5 MW, 2.5 MW, and 3.5 MW.
Gao et al. [3,16] developed a one-dimension model of the vertical temperature distribution in a stairwell at a stable stage, in which the vertical distribution of the temperature in the stairwell is an exponential model based on logarithms. Based on the multi-unit area simulation method, Gao et al. made some deductions from the temperature distribution model in a stairwell. They defined a control-element to analyze its energy and mass conservation issues, and put forward the following equation.
T i + 1 T i = ( m i k d ) T i + k h T 0 m i + 1 T i = k d ( T i T 0 ) m i + 1
When the control-element was infinitely small, it could be regarded as a micro-element. Then Equation (3) could be obtain based on Equation (2):
d T s = T i + 1 T i = k d z ( T s T 0 ) m s
where z is the height, Tz is the temperature at point z, mz is the mass flow.
Thereafter, in the steady flow state, the temperature distribution could be described as:
T s = C e k m e + m f z + T 0
where C is a constant, me is the mass of air entrained into the stairwell through the bottom opening, mf is the mass flow rate of smoke entraining the stairwell from the fire room, k is a constant at stable state, T0 is the ambient temperature.
Therefore, in this work, scattered temperature data was fitted in a non-linear manner based on the natural logarithm presented in Figure 7, which can be expressed in the following form:
y = A e B x + C
where y is the increase in temperature, as recorded using different thermocouples at a certain height; and x is the height of a given thermocouple.
To better investigate the applicability and regularity of the mathematical models [15,16,17] and the changing trend of scatters expressed in Equation (5), the coefficients A, B, C, and the correlation coefficient R are listed for analysis in Table 4.
Equation (5) and Table 4 show that A is the pre-finger factor, B is the attenuation coefficient [32,33,34], and C is the intercept on the y-axis.
From a comparison of the growth rates of A, B, and C, A was found to increase most rapidly in accordance with an increase in the fire HRR, given that a larger value of A indicates a more pronounced temperature difference. Hence, the effects on A due to the fire HRR were more significant. There are two principal reasons for this. On one hand, an increase in the fire HRR led to an increase in the mass flow rate of the overflow from the atria to the stairwell. On the other hand, with an increase in the fire HRR, there was an increase in the temperature differences between the inside and outside of the stairwell, which resulted in the increase of air entrainment.
The attenuation coefficient B characterizes the rate of temperature decay and the slopes of curves. The increase in temperature of the thermal smoke indicates an increase in the heat radiation directed at the stairwell wall, and more heat is transferred outward. Hence, there is an increase in the rate of temperature decay in accordance with an increase in the fire HRR, i.e., B increases in accordance with an increase in the fire HRR.
In addition, the correlation coefficient R in the fitting functions above is greater than 0.987, which validates the fitting curves and further verifies the accuracy of the mathematical model. Hence, the mathematical model expressed by Equation (5) can be used as a reference to predict the temperature distribution in this type of stairwell in practical engineering applications.

3.2. Effects of Fire Locations

In the previous section, the influence of the fire HRR was evaluated, whereas in this section an analysis of the effect of the fire location is presented. In an actual accident case, the location of the fire source may be random due to the location of atria, meaning piled up flammable debris cannot be predicted; thus, the location of the smoke is also random, which has a significant influence on the flow of smoke. Moreover, changes in the location of the fire source lead to changes in the neutral surface. Therefore, it is necessary to study the influence of the fire location on the smoke flow and temperature distribution in the stairwell. To control the variables, the doors of the compartment of each stairwell were opened to form a stairwell model with laterally uniform openings. In addition, the simulation configurations of the fire sources were varied, as they were positioned on Floors 1, 5, 10, and 15.
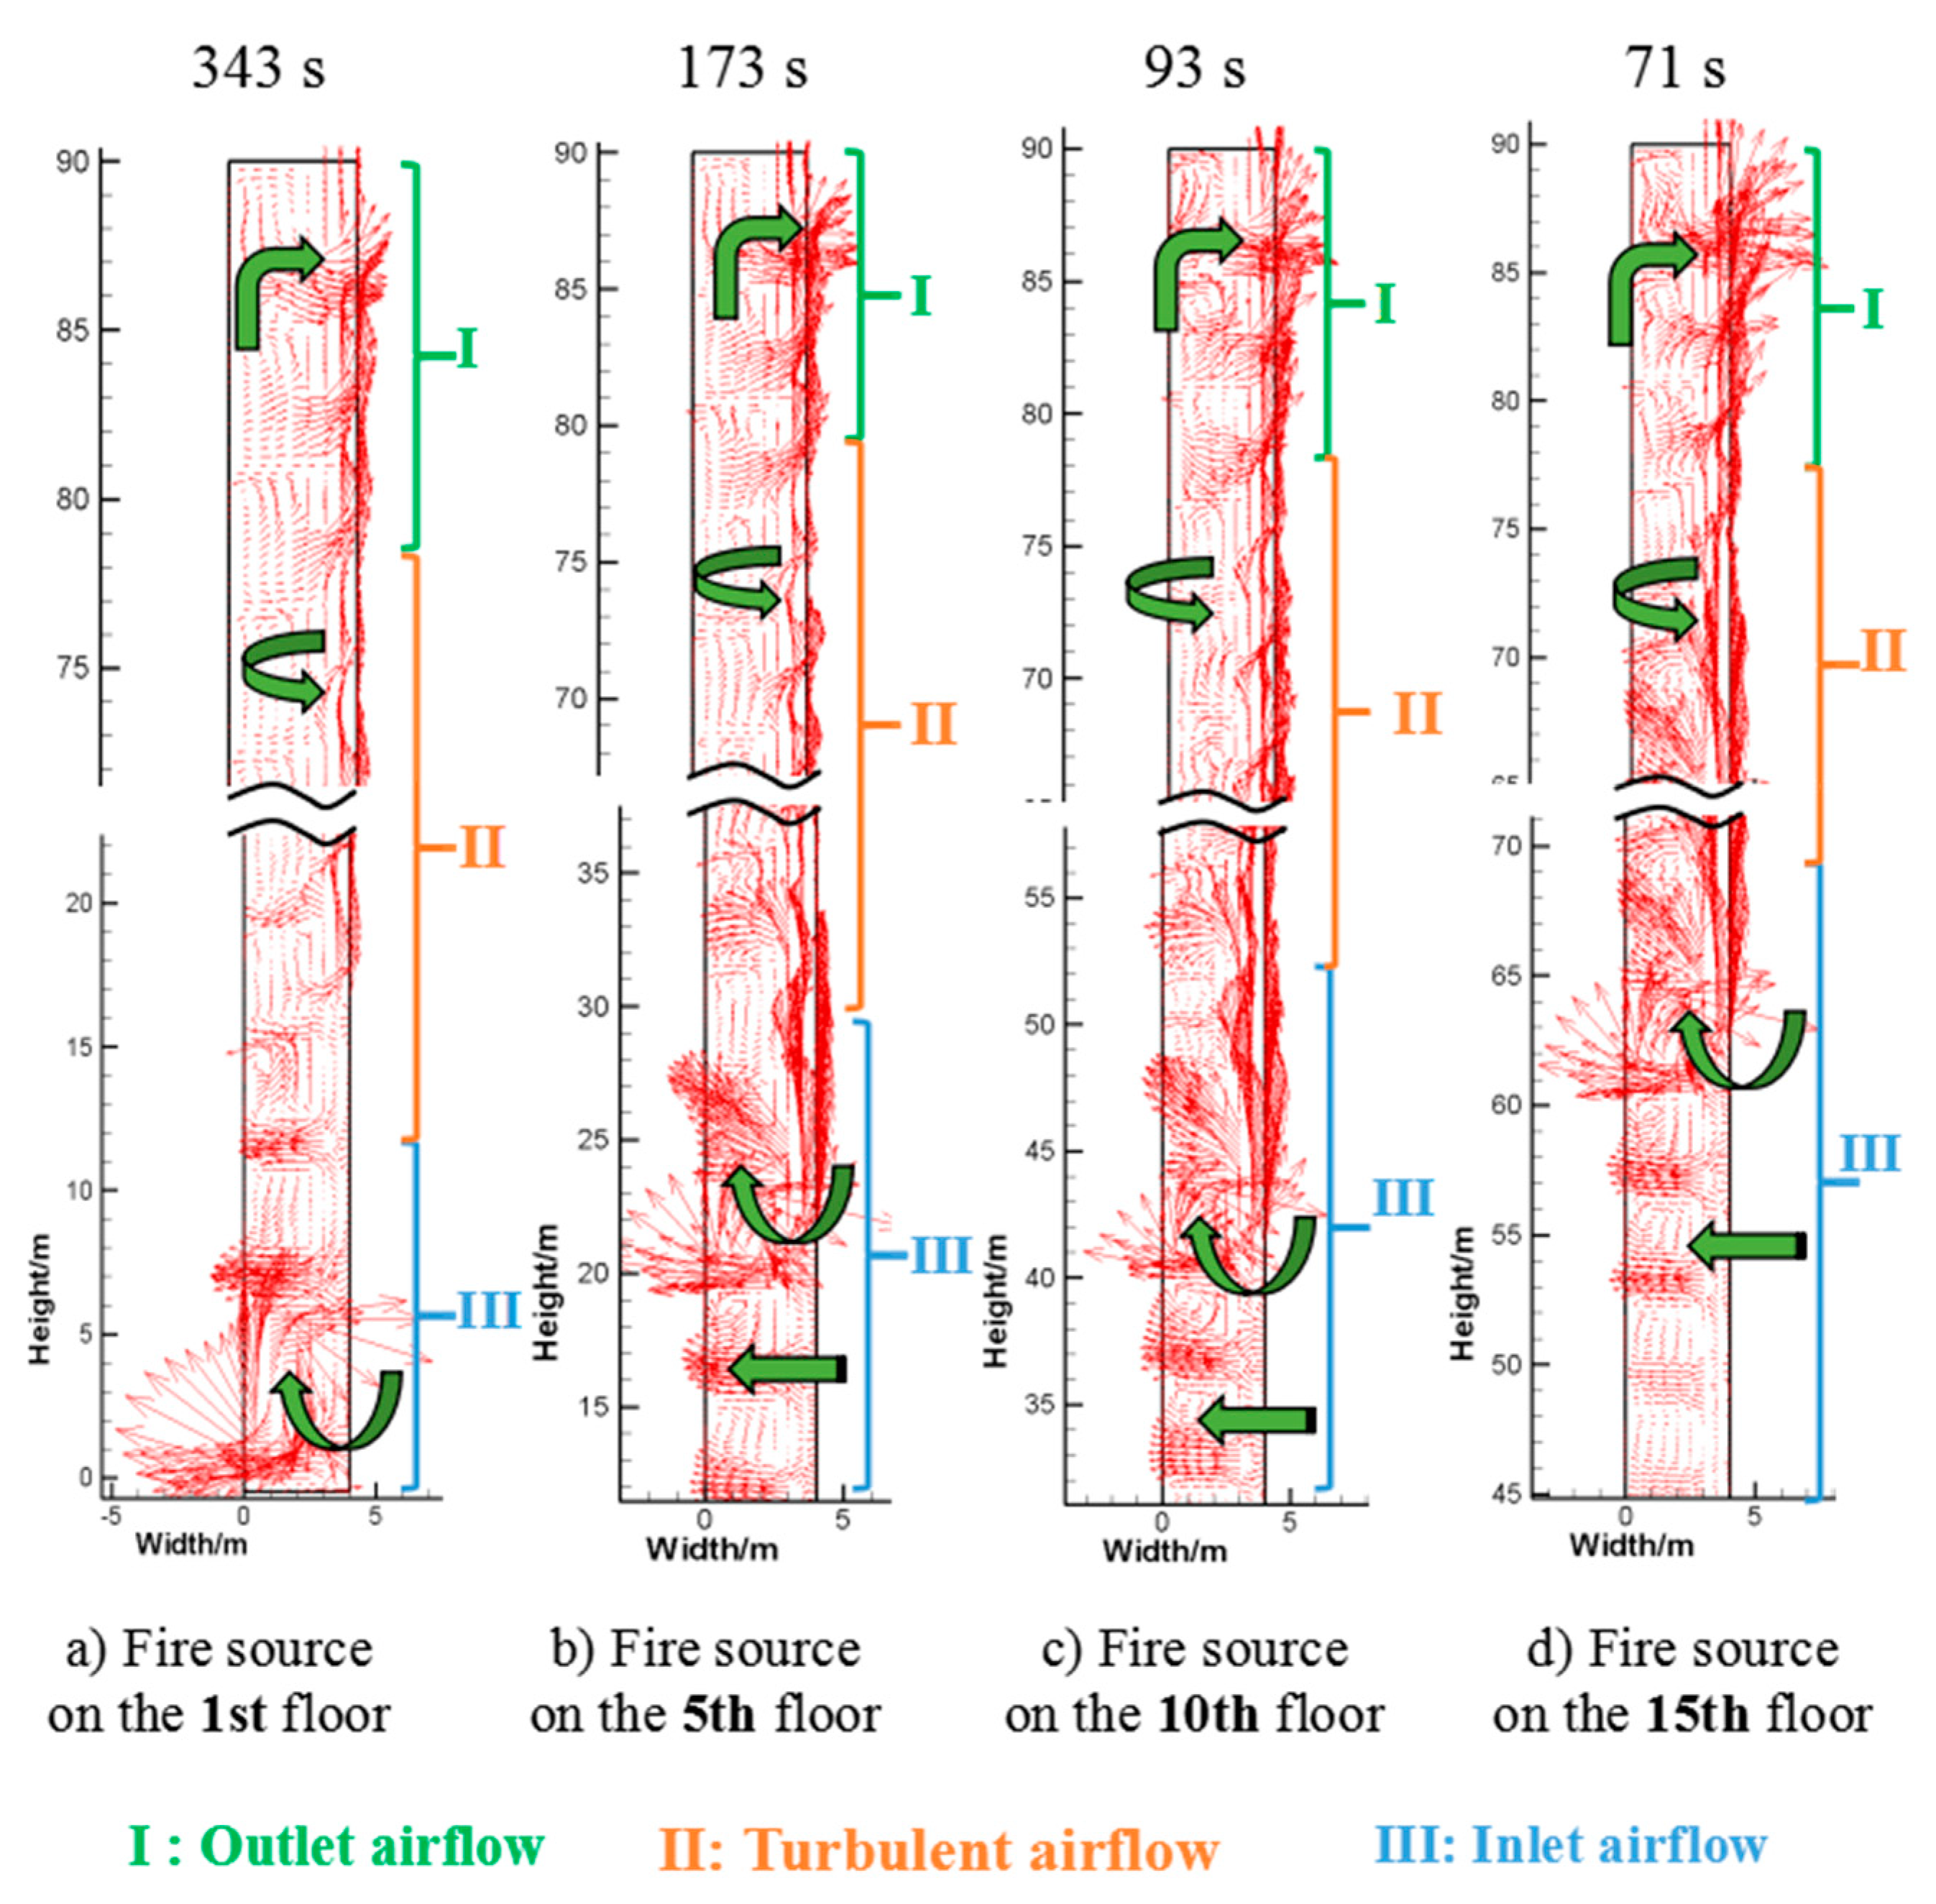
To understand the flow state of the thermal smoke, the velocity vector fields at x = 8.5 m in the stairwell and atria room at different fire HRRs are presented in Figure 8, which were compiled using Tecplot software [35,36,37]. As can be seen from Figure 8, the entire flow field of the 21-floor stairwell was divided into three parts (I, II, III) according to the direction of airflow. Part I includes all the outlet airflow, part III includes all the inlet airflow, and part II includes the lift, which is referred to as turbulent airflow, wherein the airflow can be either inlet or outlet flow.
By changing the fire location from lower to higher heights in the simulation process, a regularity was found, in that the direction of the airflow in the openings below the fire location was considered as the “inlet”. Hence, the amount of air entrainment was greater at a higher fire location. For example, if the fire is on Floor 1 (Figure 8a), fresh air can only enter through a single opening; however, if the fire is on Floor 15 (Figure 8d), the air entrainment can be formed by air from openings on Floors 1–14. However, the air from openings below is non-uniform. As can be seen from Figure 8d, the area near the fire location had a higher air entrainment capacity with high intensity speed vector arrows, i.e., the air flow was more turbulent near the fire source.
Moreover, from the data of the smoke flow direction, irrespective of the fire location, the smoke flow direction of the top three floors (Floors 19, 20, and 21) was “outlet”. Therefore, the height of fire location has no influence of the quantity of the “outlet openings”; however, it may have an influence on the degree of airflow disorder. With an increase in the height of the fire location, there was an increase in the intensity of the airflow in the opening on Floor 21, as indicated by the more emphasized and disorderly arrows shown in the opening area.
Hence, it was briefly concluded that with an increase in the height of the fire location, there is an increase in the number of inlet openings (Part III), and the number of outlet openings (Part I) remain constant; thus, there is a decrease in the number of turbulent openings (Part II). These regular patterns (applicable when the fire is on Floors 1–18) can be expressed as follows:
{ N o u t l e t = 3 N turbulent = 21 3 N inlet = 18 N inlet N i n l e t = N f i r e 1
where Noutlet is the number of openings through which the direction of the airflow is outward, Noutlet is the number of openings through which the direction of the airflow is inward, Nturbulent is the number of openings through which the direction of the airflow is neither outward or inward, and Nfire is the floor on which the fire source is present.
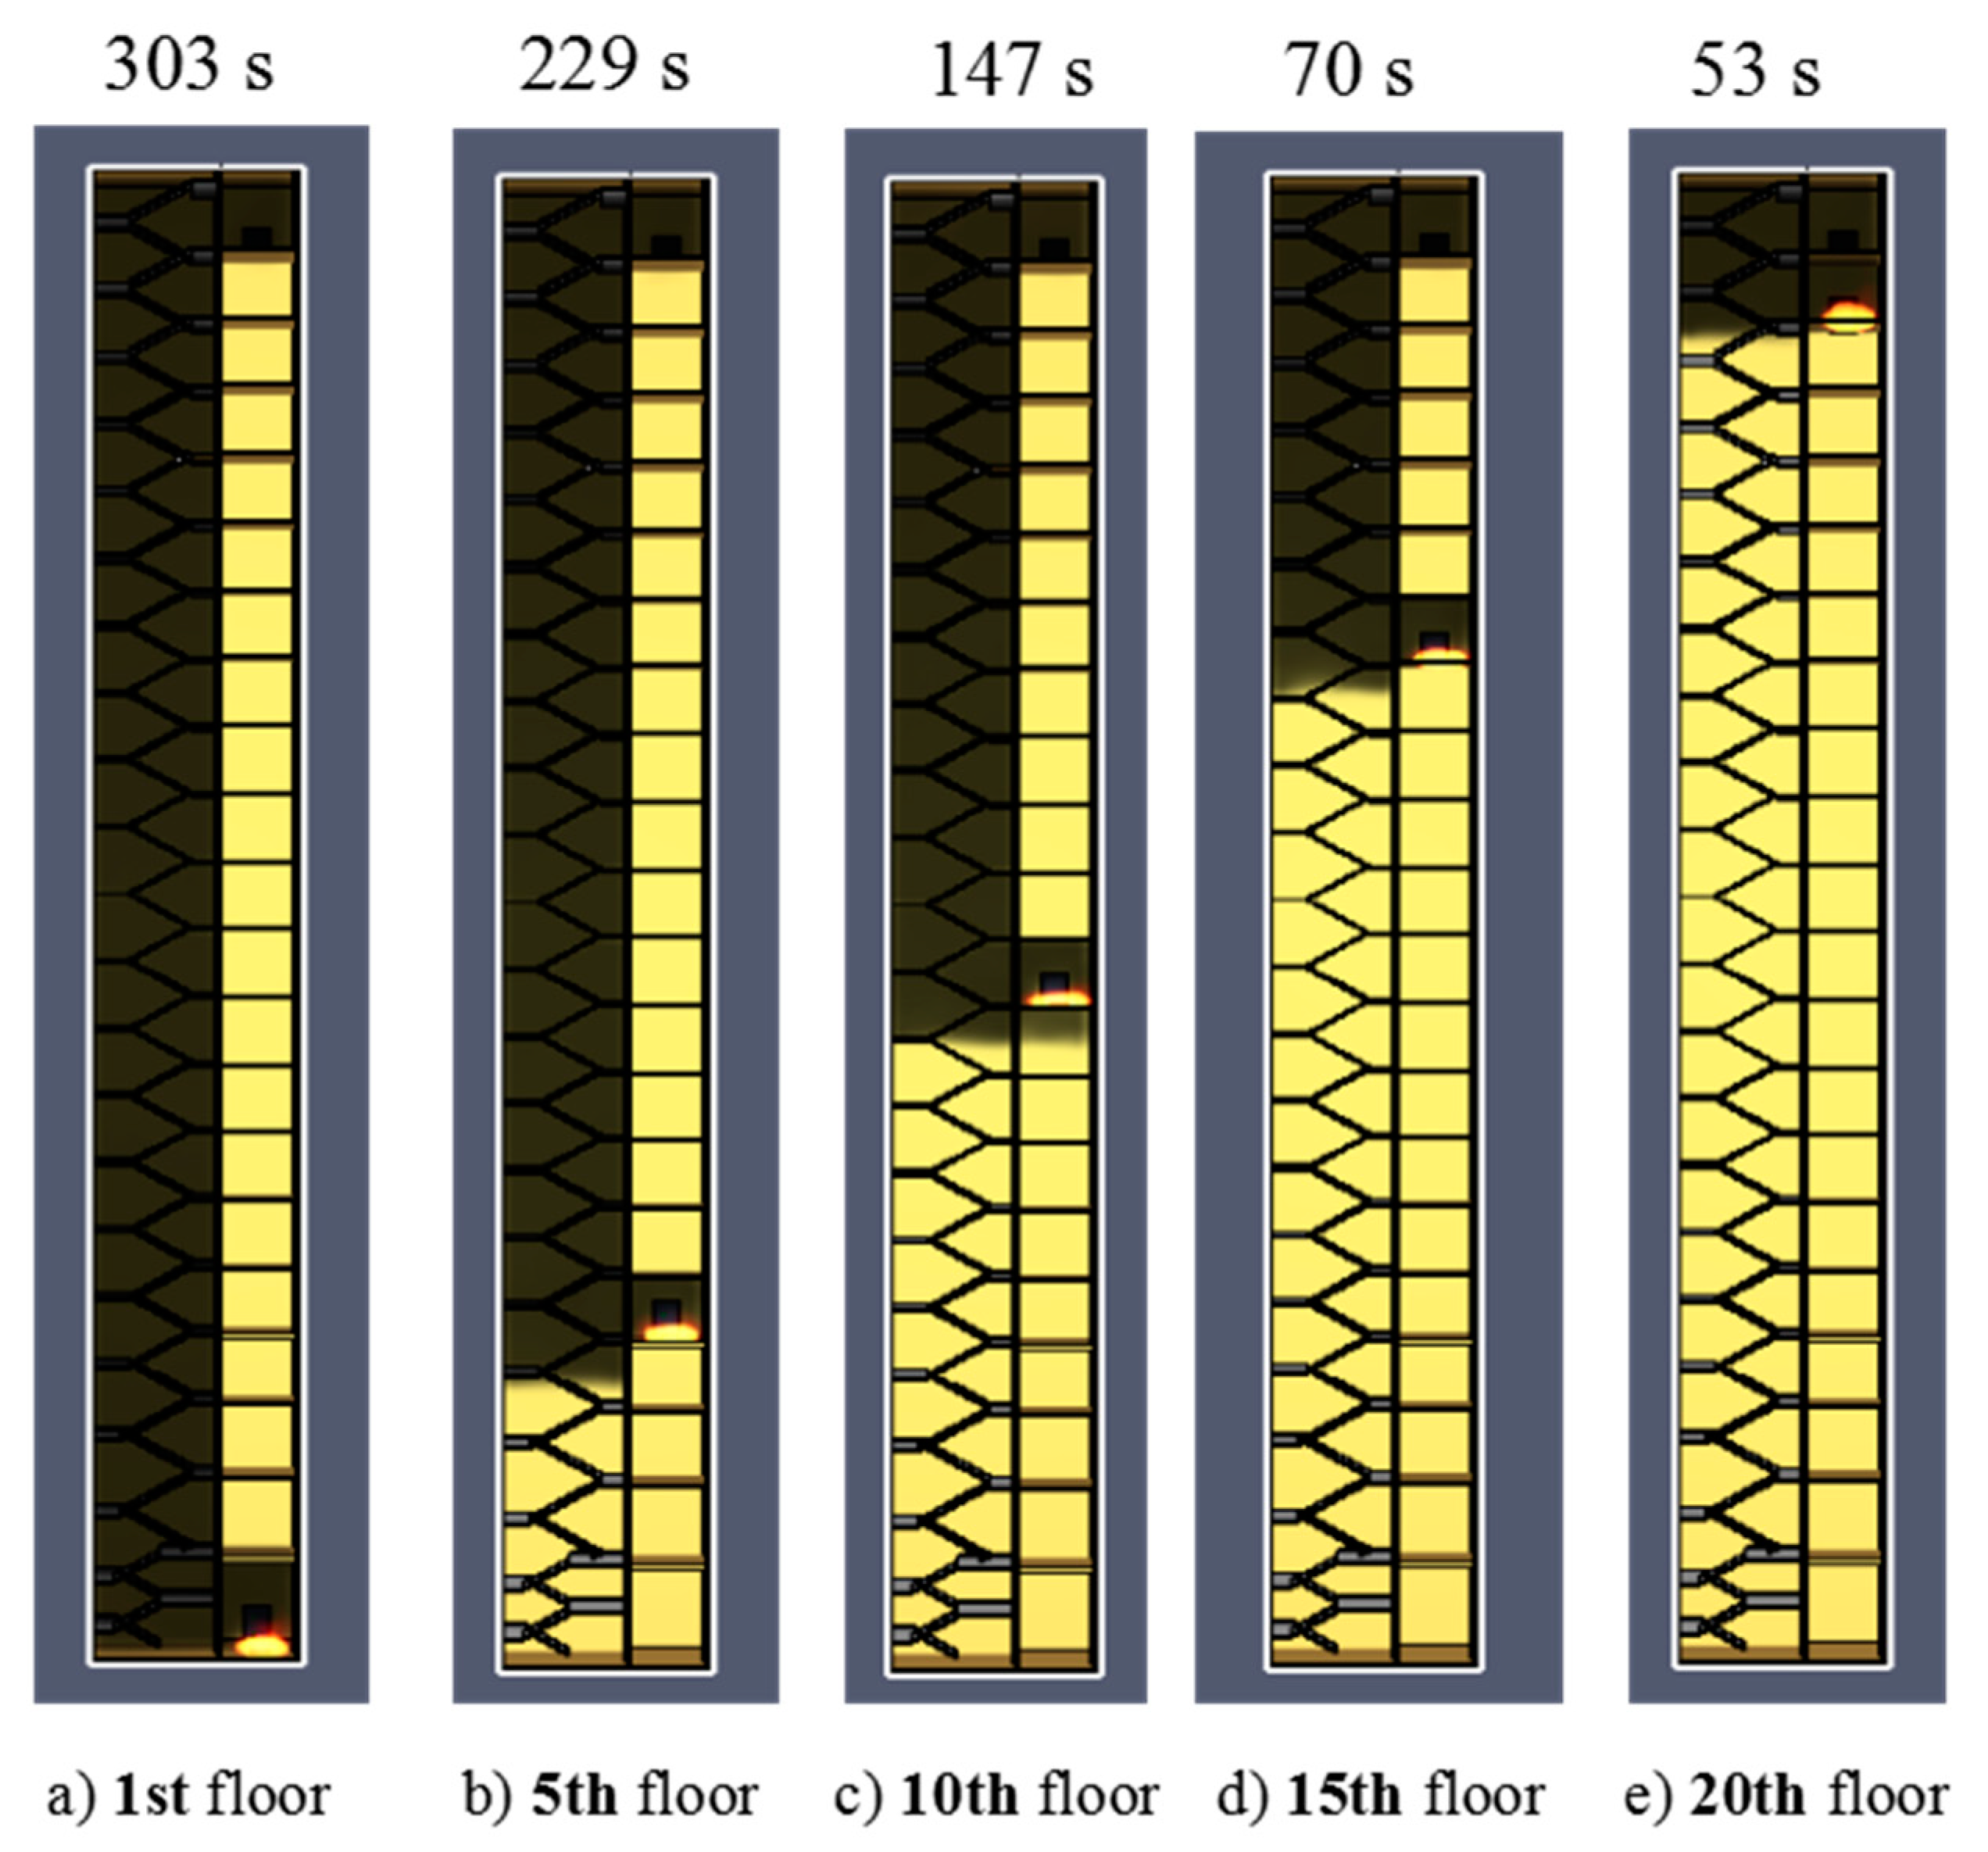
As mentioned above, Figure 9 describes the simulation results in a stairwell with laterally uniform openings. To better evaluate the smoke flow in a uniform lateral opening stairwell, Figure 9 was obtained from the simulation data of the stairwell model with the opening at each floor. Moreover, Figure 9a–e differ with respect to the location of the fire source. The smoke was found to mainly flow in the stairwell above the fire source. This phenomenon is due to the difference between the air density and thermal smoke density, i.e., the pressure difference between the air and thermal smoke. It is, therefore, safer for a person to be situated downstairs in the stairwell after the initiation of the fire. Moreover, this makes it necessary for people to lean forward when evacuating a fire disaster.
As discussed above, the temperature distribution in the stairwell is mostly due to the thermal smoke flow. An increase in the smoke flow in certain areas leads to an increase in temperature. To quantify the impact of thermal smoke flow, the data collected by the thermocouples during the simulation in which the fire HRR was 1.5 MW were further evaluated. Herein, the fire location factor h* was defined as the relative location of the fire source in the entire building, which can be expressed as follows:
h * = h / H
where h* is the fire location factor, h is the height of the fire source, and H is the total height of the building (H = 89.3 m). Table 5 presents the detailed data obtained from the simulation results by changing the fire location.
The scattered data in Figure 10 were obtained from the third and fourth columns of Table 5, which illustrate the relationship between the maximum temperature and fire source location. A linear relationship was found between the maximum temperature and the fire source location [16], which could be fitted using the least squares method, and it is indicated by the red line in Figure 10. Moreover, it can be expressed mathematically by Equation (8):
Tm = −30.5 × h* + 147.7
Hence, as can be seen from Equation (8) and Figure 8, at the same fire HRR, changes in the height of the fire source led to changes in the maximum temperature, i.e., with a decrease in the fire location factor or height of the fire source, there was a linear decrease in the maximum temperature in the stairwell. This can be explained by the smoke flow and buoyancy plume. In the final section, Figure 10 reveals that the thermal smoke moves upward under the influence of the buoyancy plume. Therefore, there was a decrease in the space above the thermal smoke in accordance with an increase in the height of the fire. Consequently, the heat accumulation from the thermal smoke decreased, thus, the maximum temperature in the stairwell decreased. In general, an increase in the height of the fire location contributes to the safety of the environment with respect to public evacuation and the tolerance limit for high temperatures [38,39,40].
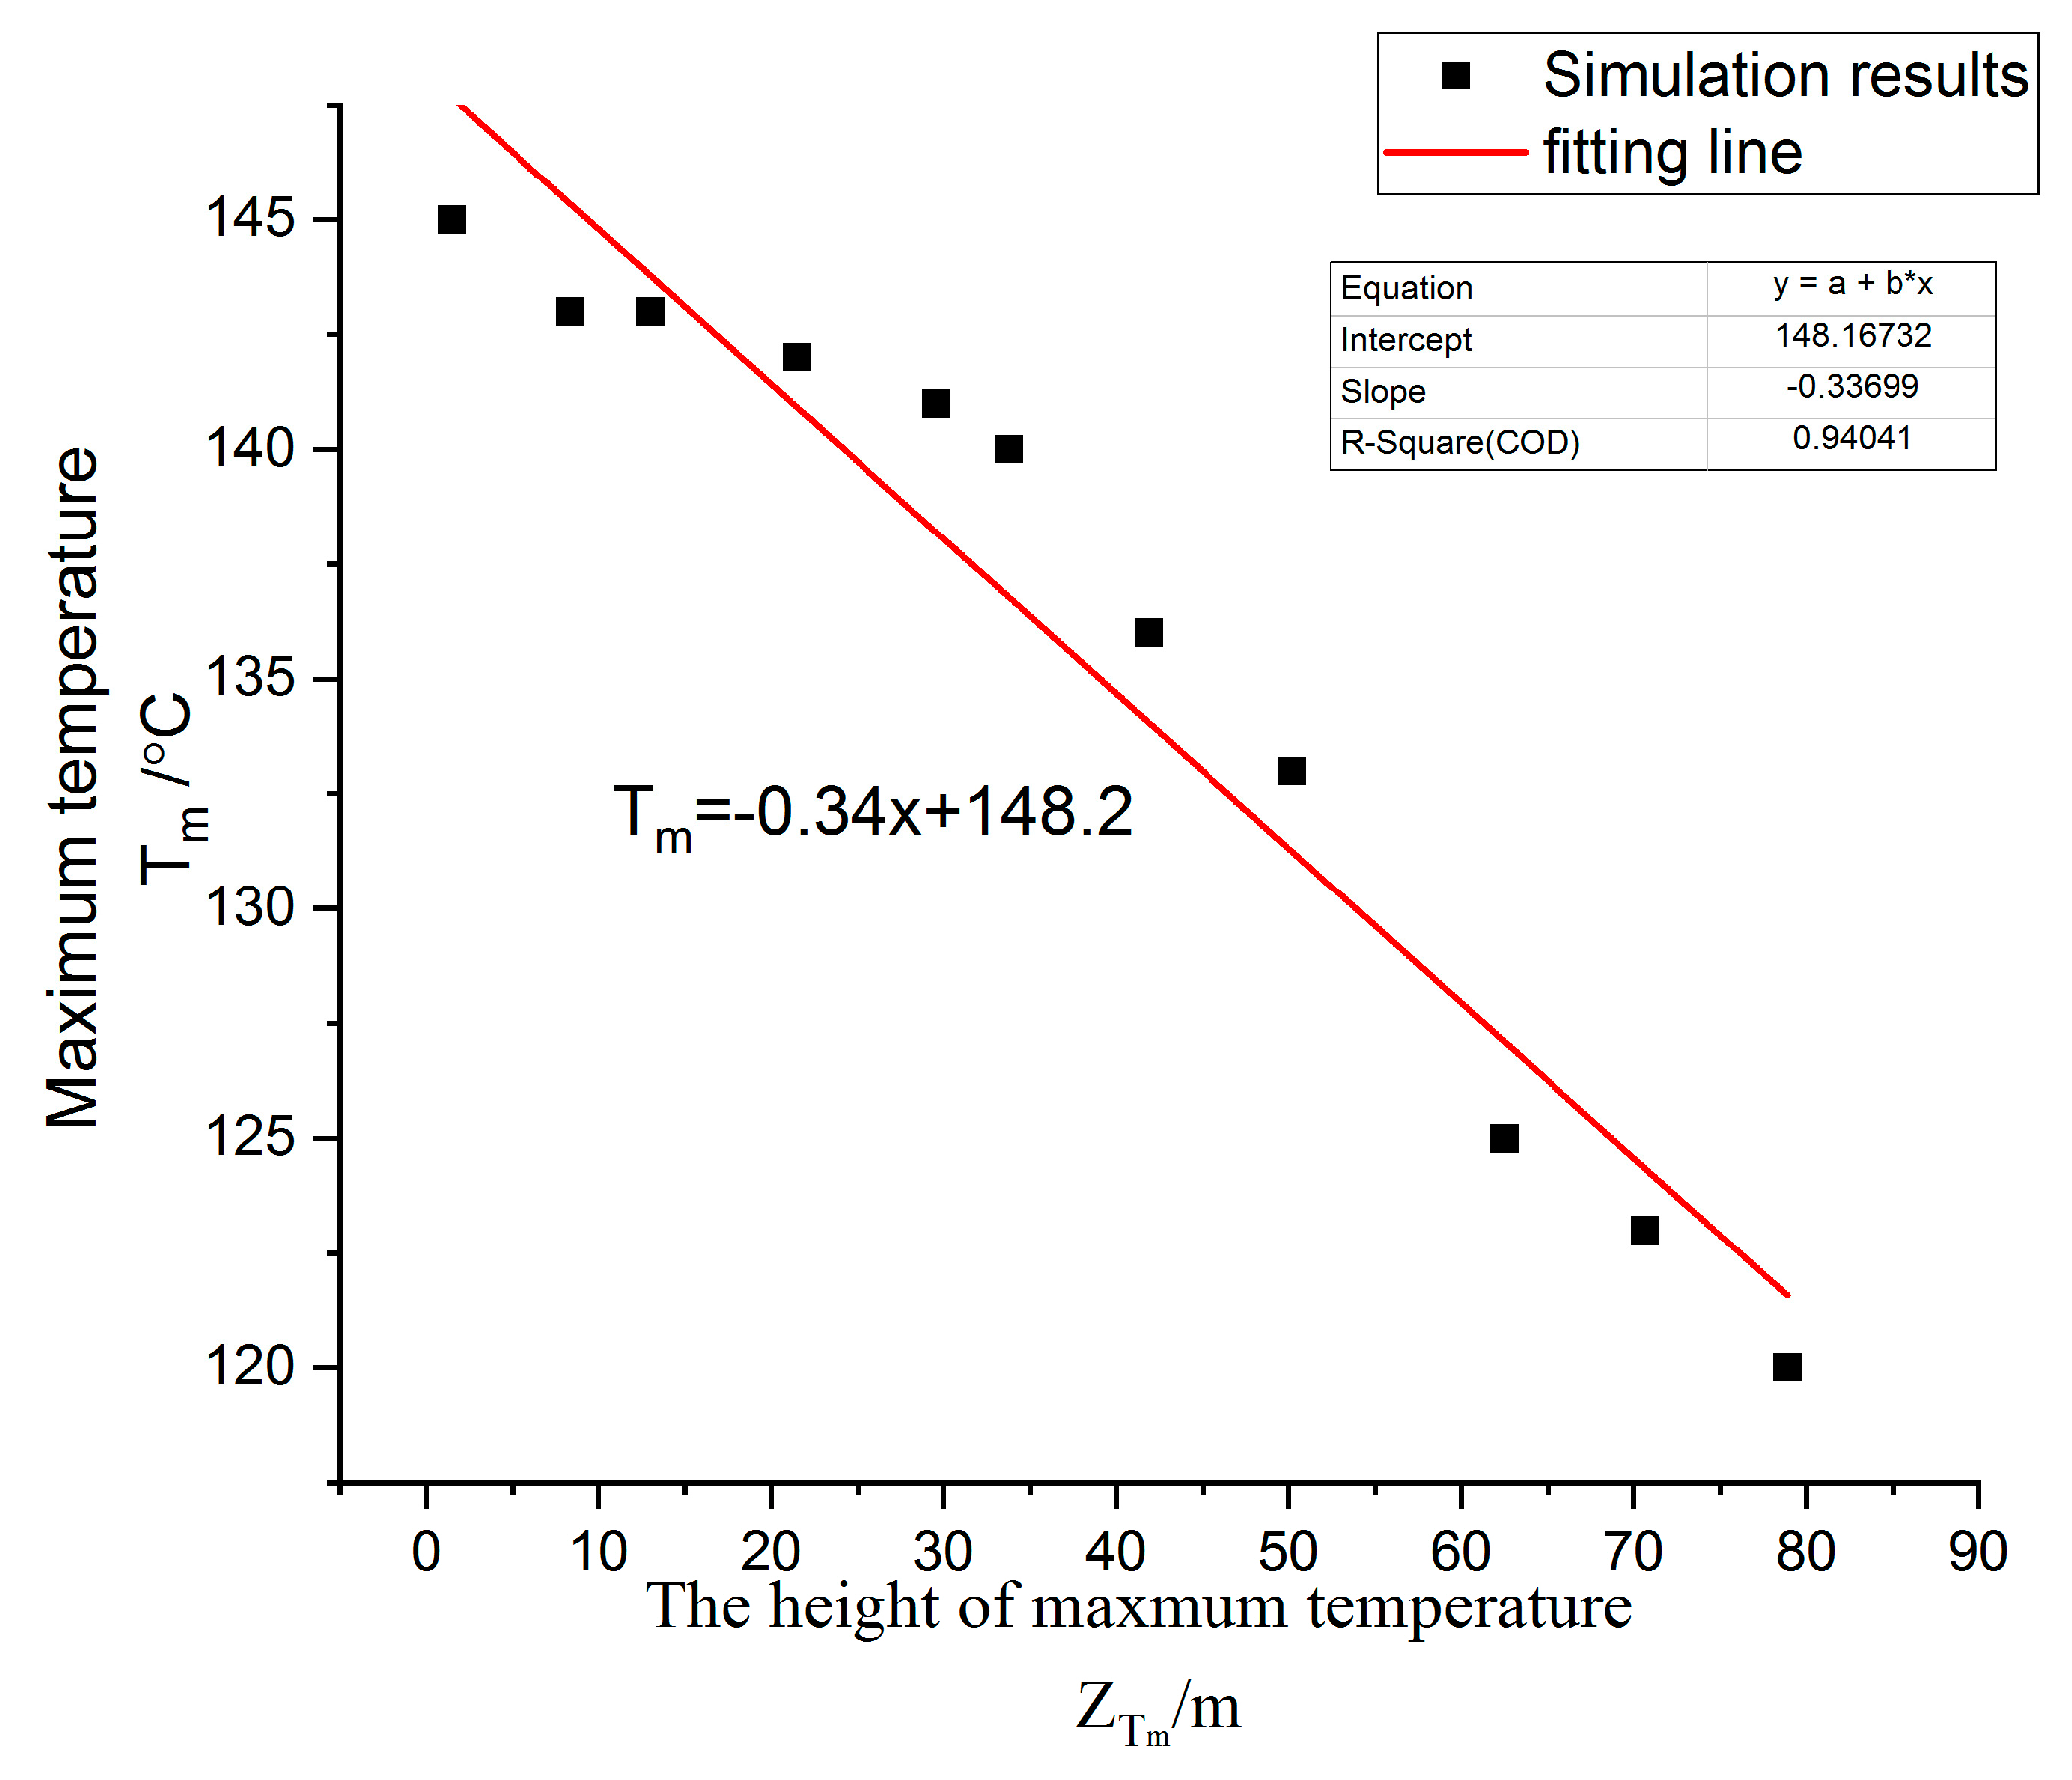
The scattered data presented in Figure 11 were obtained from the fourth and sixth columns of Table 5, and their distribution trend is in accordance with Figure 10. Similarly, the relationship can be fitted using the least squares method, as expressed by Equation (9). Moreover, Equations (8) and (9) differ with respect to the slope. Figure 11 reveals that the distance from the fire source determines the amount of thermal smoke and the HRR. In particular, the fresh air through the entrainment movement loses heat during its upward movement; thus, there is a gradual decrease in the temperature of the thermal smoke in accordance with an increase in the height of the fire location.
Tm = −0.34 × ZTm + 148.2
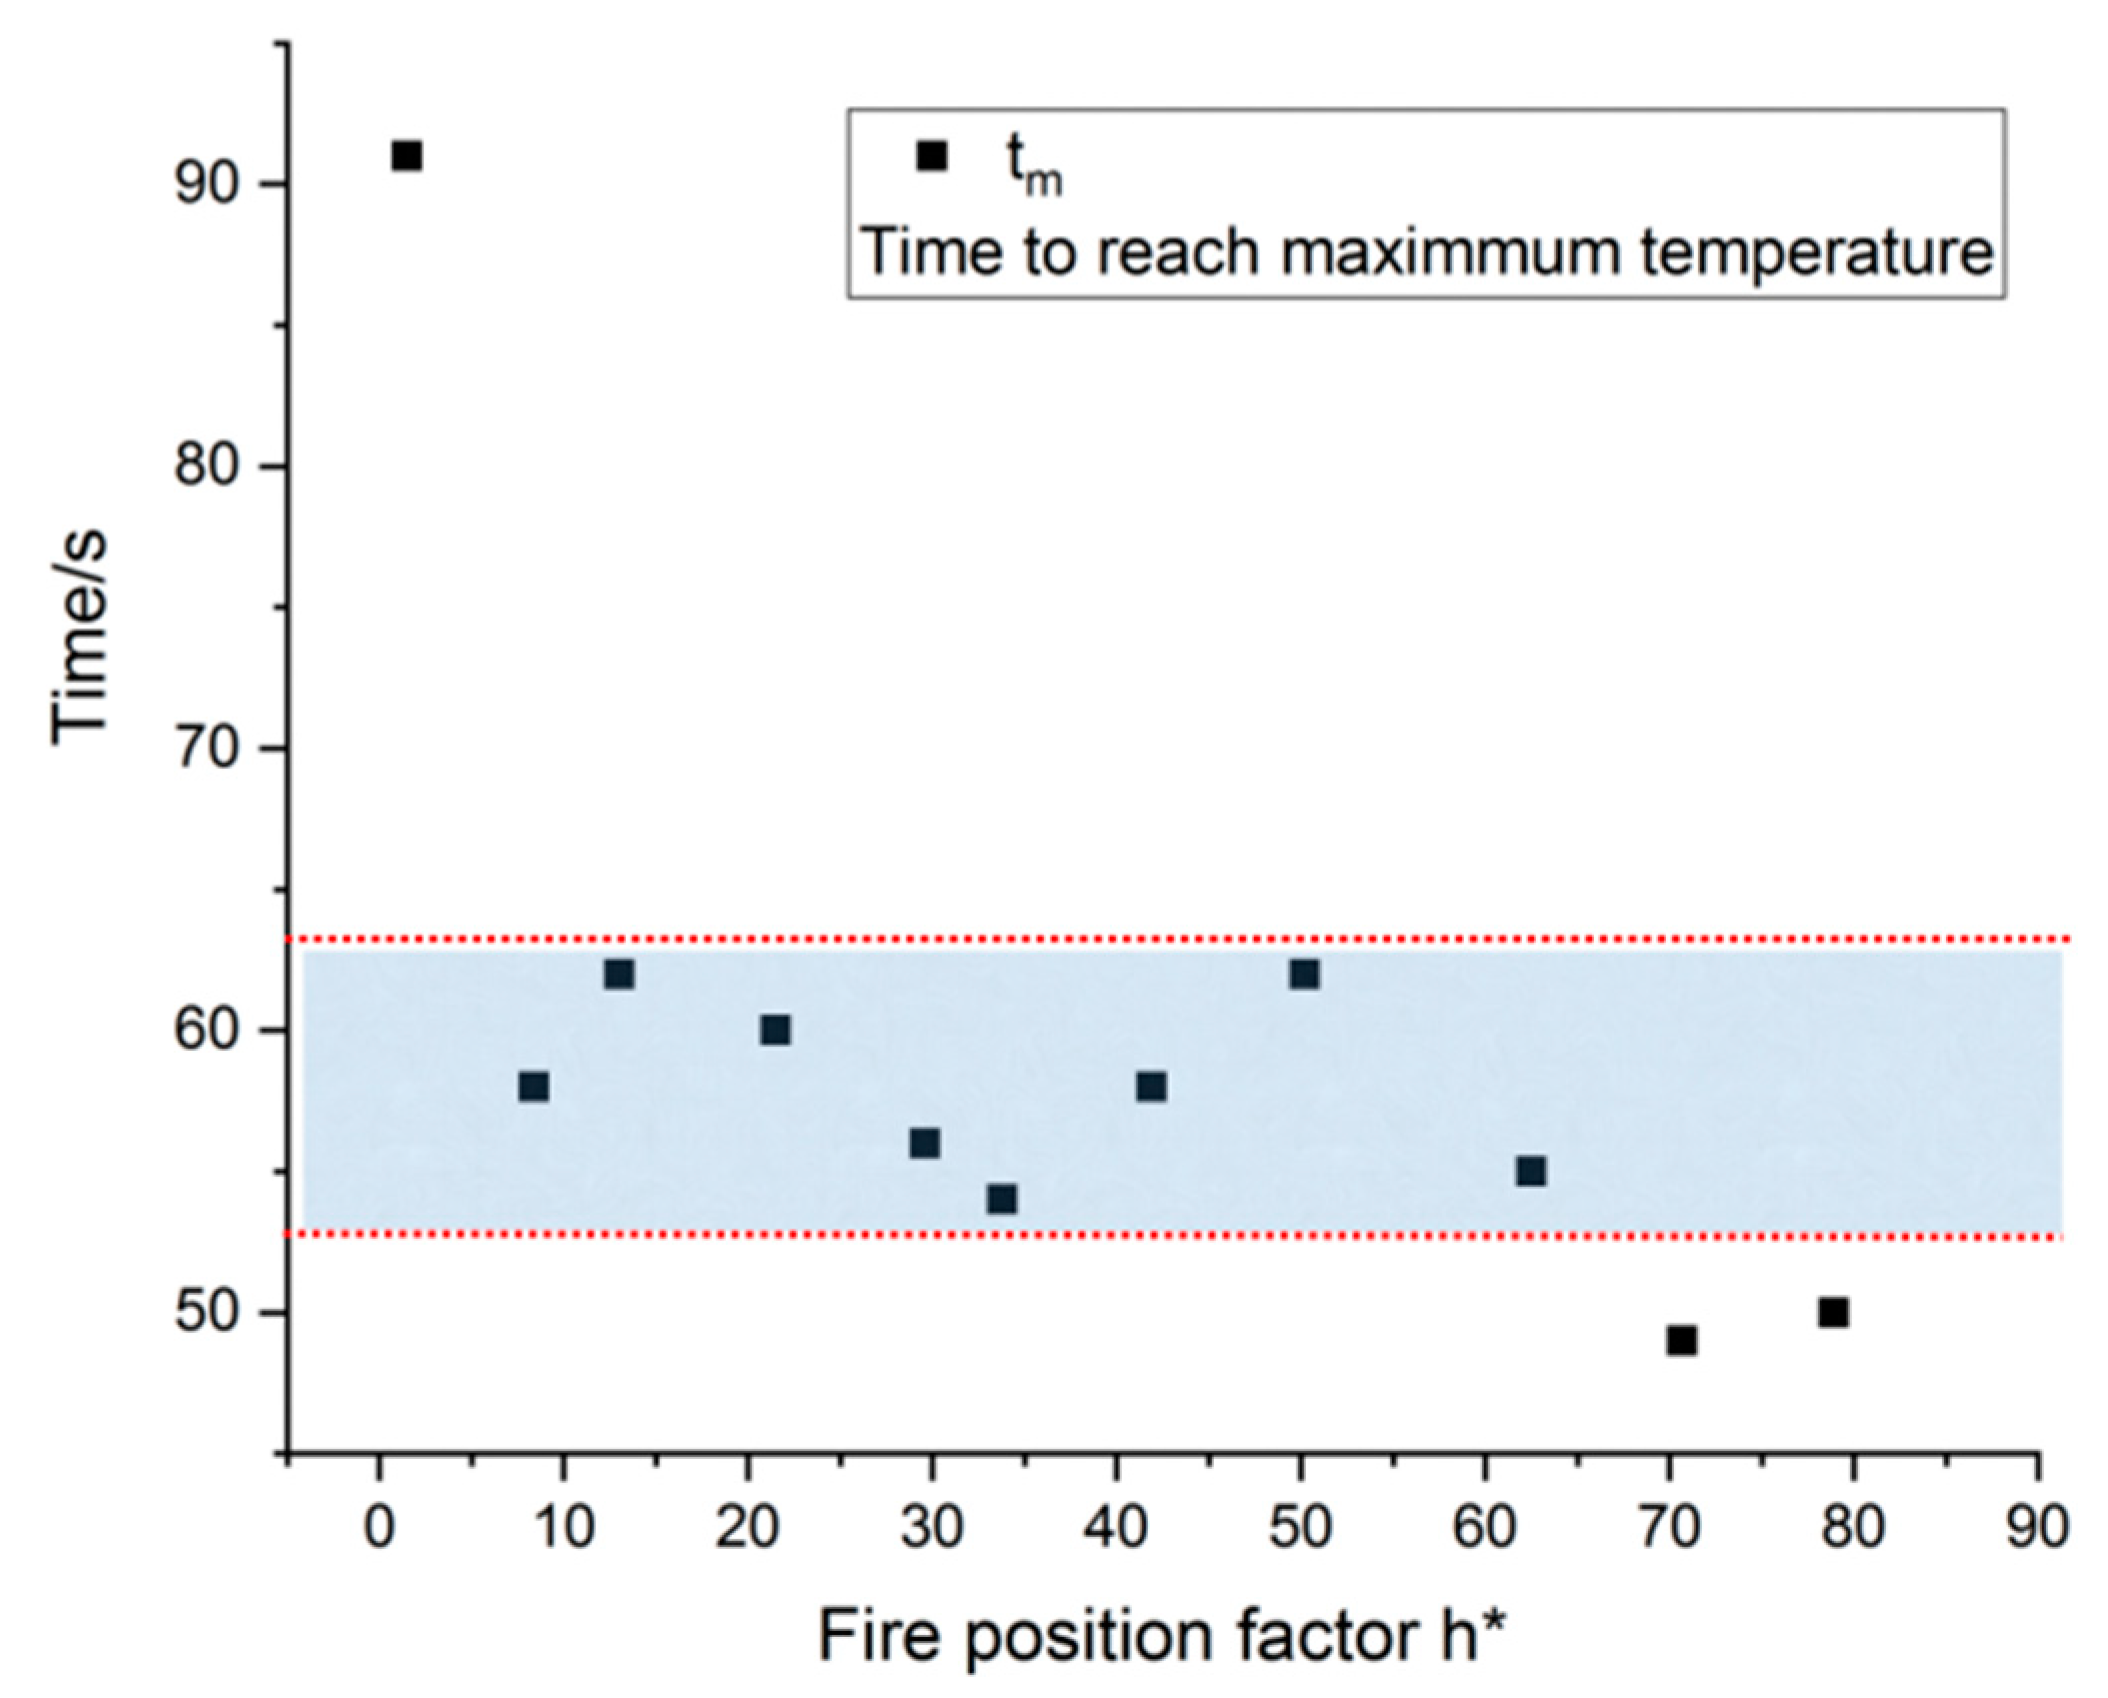
The scattered data presented in Figure 12 were obtained from the third and fifth columns of Table 5, thus representing tm (time required to reach maximum temperature) at different fire locations and an HRR of 1.5 MW. The majority of the scattered data was found to be distributed in the area between the two red lines in Figure 11, i.e., the range of tm was 53–64 s for different fire location factors. Hence, to an extent, the fire location has a slight influence on the duration of the thermal smoke flow. However, when the fire was in the atria of Floor 1 (h* = 0.002), tm was significantly longer. This is because in comparison with the others, the fresh air required to support combustion flowed only from the first floor and upper space. However, with an increase in the height of the fire, the fresh air could be obtained from the space below and above. In particular, with an increase in h*, the fire developed at a higher rate with increased air entrainment, which transferred more oxygen from the outside. Moreover, below the colored area, there are two data points (h* = 0.76 and h* = 0.86 with corresponding fire locations on Floors 17 and 19), which indicate a shorter tm in the simulation. This may be because the shorter path of the stack effect resulted in faster smoke flow, and therefore, a shorter time was required to reach the maximum temperature.

4. Conclusions

In this study, a set of simulations was conducted using the LES method to evaluate the transport phenomena of fire-induced smoke flow in a 21-story stairwell model. The influences of the fire location and HRR on the flow field and temperature distribution were analyzed, respectively.
The results can be presented as follows:
(1) With an increase in the fire HRR, there is an increase in the velocity of the smoke flow, followed by more pronounced wall attachment effects. It is mainly because the fire strength determines the buoyancy of smoke flow. Higher fire HRRs result in larger temperature differences, and an increase in height also results in larger temperature differences. The temperature difference in the near-fire area is greater, whereas an increase in the height leads to a lower increase in temperature. The vertical distribution of the temperature is in accordance with natural logarithms.
(2) The heights of openings and fire locations have a great influence on the turbulent mixing movement. Changes in the height of the fire location leads to changes in the direction of air flow through the side openings. With an increase in the height of the fire location, different amounts of ambient air flowing into the stairwell have a significant influence on the combustion process and smoke flow. Moreover, most previous studies were conducted in stairwells with openings set at a fixed height. Moreover, a relationship among Noutlet, Ninlet, and Nturbulent was established (applicable on floors 1–18).
(3) A linear relationship was found between the maximum temperature and the fire source location, i.e., the relationship between the fire location factor h* and maximum temperature Tm, in addition to that between the maximum temperature Tm and height at which the maximum temperature ZTm is located, can be linearly fitted using the least squares method.
In general, over-all good agreement was obtained in previous studies [41,42]. Moreover, given the good agreement, insights regarding the smoke motion can be obtained from simulation results [43,44]. The results in this paper could help researchers further understand the thermal smoke flow, as well as turbulent mixing in stairwells. Simulations and even experiments with more configurations will be conducted in the future to verify the proposed expressions and classify a new phenomenon.

Author Contributions

Conceptualization, J.Z.; data curation, R.W.; investigation, T.Z. and Q.C.; software, J.W.; supervision, D.O.; validation, J.W.

Acknowledgments

This work was supported by the National Key R&D Program of China (No.2018YFC0808600).

Conflicts of Interest

The authors declare no conflict of interest.

References

  1. Ahn, C.S.; Bang, B.H.; Kim, M.W.; James, S.C.; Yarin, A.L.; Yoon, S.S. Theoretical, numerical, and experimental investigation of smoke dynamics in high-rise buildings. Int. J. Heat Mass Transf. 2019, 135, 604–613. [Google Scholar] [CrossRef]
  2. Qi, D.; Wang, L.; Zmeureanu, R. An analytical model of heat and mass transfer through non-adiabatic high-rise shafts during fires. Int. J. Heat Mass Transf. 2014, 72, 585–594. [Google Scholar] [CrossRef]
  3. Li, M.; Gao, Z.; Ji, J.; Li, K. Modeling of positive pressure ventilation to prevent smoke spreading in sprinklered high-rise buildings. Fire Saf. J. 2018, 95, 87–100. [Google Scholar] [CrossRef]
  4. Seidu, R.; Robinson, H.; Young, B. Cost of Fire in Highrise Building. Presented at International Conference on Professionalism and Ethics in Construction, London, UK, 21–22 November 2018. [Google Scholar]
  5. Salankar, S.; Tauseef, S.M.; Sharma, R.K. Need for Better High-Rise Building Evacuation Practices. In Advances in Fire and Process Safety; Springer: Singapore, 2018; pp. 191–205. [Google Scholar]
  6. Boroń, S.; Węgrzyński, W.; Kubica, P.; Czarnecki, L. Numerical Modelling of the Fire Extinguishing Gas Retention in Small Compartments. Appl. Sci. 2019, 9, 663. [Google Scholar] [CrossRef]
  7. Alarie, Y. Toxicity of fire smoke. Crit. Rev. Toxicol. 2002, 32, 259–289. [Google Scholar] [CrossRef]
  8. Giebułtowicz, J.; Rużycka, M.; Wroczyński, P.; Purser, D.A.; Stec, A.A. Analysis of fire deaths in Poland and influence of smoke toxicity. Forensic Sci. Int. 2017, 277, 77–87. [Google Scholar] [CrossRef] [PubMed] [Green Version]
  9. Alarifi AA, S.; Phylaktou, H.N.; Andrews, G.E. What kills people in a fire? heat or smoke? In Proceedings of the 9th SSC, Birmingham, UK, 13–14 February 2016. [Google Scholar]
  10. Marshall, N.R. The behaviour of hot gases flowing within a staircase. Fire Saf. J. 1985, 9, 245–255. [Google Scholar] [CrossRef]
  11. Tamura, G.T. Smoke Movement and Control in High-Rise Buildings. 2008. Available online: https://nrc-publications.canada.ca/eng/view/accepted/?id=af1afd4c-f8d6-4daf-8d2b-0aea9bf0089e (accessed on 20 October 2018).
  12. Chow, W.K.; Fong, N.K.; Cui, E.; Ho, P.L.; Wong, L.T.; Huo, R.; Fan, W.; Li, Y.; Yuan, L. PolyU/USTC Atrium: A full-scale burning facility—Preliminary experiments. J. Appl. Fire Sci. 1999, 8, 229–241. [Google Scholar]
  13. Cooper, L.Y. Simulating smoke movement through long vertical shafts in zone-type compartment fire models. Fire Saf. J. 1998, 31, 85–99. [Google Scholar] [CrossRef]
  14. Zukoski, E.E. Review of Flows Driven by Natural Convection in Adiabatic Shaft; NASA, US Department of Commerce, Technology Administration, National Institute of Standards and Technology: Washington, DC, USA, 1995; (19980017476). [Google Scholar]
  15. Qin, T.X.; Guo, Y.C.; Chan, C.K.; Lau, K.S.; Lin, W.Y. Numerical simulation of fire-induced flow through a stairwell. Build. Environ. 2005, 40, 183–194. [Google Scholar] [CrossRef]
  16. Gao, Z.; Yuan, X.; Ji, J.; Li, Y.; Yang, L. Influence of stack effect on flame shapes of gas burner fires. Appl. Therm. Eng. 2017, 127, 1574–1581. [Google Scholar] [CrossRef]
  17. Zhang, J.Y.; Lu, W.Z.; Huo, R.; Feng, R. A new model for determining neutral-plane location in shaft space of a building under fire situation. Build. Environ. 2008, 43, 1101–1108. [Google Scholar] [CrossRef]
  18. Ji, J.; Li, M.; Gao, Z.H.; Li, Y.F.; Shi, W.X.; Sun, J.H. Experimental investigation of combustion characteristics under different ventilation conditions in a compartment connected to a stairwell. Appl. Therm. Eng. 2016, 101, 390–401. [Google Scholar] [CrossRef]
  19. Cengel, Y.A. Fluid Mechanics; Tata McGraw-Hill Education: New York, NY, USA, 2010. [Google Scholar]
  20. Himoto, K.; Tsuchihashi, T.; Tanaka, Y.; Tanaka, T. Modeling the trajectory of window flames with regard to flow attachment to the adjacent wall. Fire Saf. J. 2009, 44, 250–258. [Google Scholar] [CrossRef] [Green Version]
  21. Ji, J.; Fan, C.G.; Gao, Z.H.; Sun, J.H. Effects of vertical shaft geometry on natural ventilation in urban road tunnel fires. J. Civ. Eng. Manag. 2014, 20, 466–476. [Google Scholar] [CrossRef]
  22. Fan, C.G.; Ji, J.; Gao, Z.H.; Sun, J.H. Experimental study on transverse smoke temperature distribution in road tunnel fires. Tunn. Undergr. Space Technol. 2013, 37, 89–95. [Google Scholar] [CrossRef]
  23. Harrison, R.; Spearpoint, M. Physical scale modelling of adhered spill plume entrainment. Fire Saf. J. 2010, 45, 149–158. [Google Scholar] [CrossRef] [Green Version]
  24. Li, D.; Zhou, T.; Liu, Z.; Wang, J. Transport phenomena of fire-induced smoke flow in a semi-open vertical shaft. Int. J. Numer. Methods Heat Fluid Flow 2018, 28, 2664–2680. [Google Scholar] [CrossRef]
  25. Jones, K. Density of Concrete, The Physics Factbook, Retrieved 7 January 2015. Available online: https://hypertextbook.com/facts/1999/KatrinaJones.shtml (accessed on 20 October 2018).
  26. Washer, G.; Fuchs, P.; Graybeal, B. Elastic properties of reactive powder concrete. In Proceedings of the International Symposium on Non-Destrconreteuctive Testing in Civil Engineering (NDT-CE 2003), Berlin, Germany, 16–19 September 2003. [Google Scholar]
  27. Doroudiani, S.; Omidian, H. Environmental, health and safety concerns of decorative mouldings made of expanded polystyrene in buildings. Build. Environ. 2010, 45, 647–654. [Google Scholar] [CrossRef]
  28. Xu, Q.; Jin, C.; Griffin, G.; Jiang, Y. Fire safety evaluation of expanded polystyrene foam by multi-scale methods. J. Therm. Anal. Calorim. 2014, 115, 1651–1660. [Google Scholar] [CrossRef]
  29. An, W.; Jiang, L.; Sun, J.; Liew, K.M. Correlation analysis of sample thickness, heat flux, and cone calorimetry test data of polystyrene foam. J. Therm. Anal. Calorim. 2015, 119, 229–238. [Google Scholar] [CrossRef]
  30. Wang, S.; Chen, H.; Liu, N. Ignition of expandable polystyrene foam by a hot particle: An experimental and numerical study. J. Hazard. Mater. 2015, 283, 536–543. [Google Scholar] [CrossRef] [PubMed]
  31. Jiang, L.; Xiao, H.; Zhou, Y.; An, W.; Yan, W.; He, J.; Sun, J. Theoretical and experimental study of width effects on horizontal flame spread over extruded and expanded polystyrene foam surfaces. J. Fire Sci. 2014, 32, 193–209. [Google Scholar] [CrossRef]
  32. Ji, J.; Li, L.J.; Shi, W.X.; Fan, C.G.; Sun, J.H. Experimental investigation on the rising characteristics of the fire-induced buoyant plume in stairwells. Int. J. Heat Mass Transf. 2013, 64, 193–201. [Google Scholar] [CrossRef]
  33. Atallah, S.; Allan, D.S. Safe separation distances from liquid fuel fires. Fire Technol. 1971, 7, 47–56. [Google Scholar] [CrossRef]
  34. Thomas, P.H. Rates of spread of some wind-driven fires. For. Int. J. For. Res. 1971, 44, 155–175. [Google Scholar] [CrossRef]
  35. Guan, J.; Fang, J.; Zhang, D.; Wang, J.; Zhang, Y. Experiment study of oil tank fire characteristics dependent on the opening of tank top. Procedia Eng. 2013, 62, 932–939. [Google Scholar] [CrossRef]
  36. You, D.; Wang, X.Z.; Chen, W.J.; Wu, G.X. Numerical Simulation Analysis of Smoke Control and Flow for Large Building Fire. In Applied Mechanics and Materials; Trans Tech Publications China: Beijing, China, 2014; Volume 608, pp. 61–65. [Google Scholar]
  37. Wang, Y.; Wang, Q.; Sun, J.; He, L.; Liew, K.M. Thermal performance of exposed framing glass façades in fire. Mater. Struct. 2016, 49, 2961–2970. [Google Scholar] [CrossRef]
  38. Hasemi, Y.; Shigekawa, K. Radiation Tolerance Criterion of People in Big Fire. Bull. Jpn. Assoc. Fire Sci. Eng. 1981, 31, 7–14. [Google Scholar]
  39. Raj, P.K. A review of the criteria for people exposure to radiant heat flux from fires. J. Hazard. Mater. 2008, 159, 61–71. [Google Scholar] [CrossRef] [PubMed]
  40. Martin, R.E.; Cushwa, C.T.; Miller, R.L. Fire as a physical factor in wildland management. In Proceedings of the Annual [9th] Tall Timbers Fire Ecology Conference, Tallahassee, FL, USA, 10–11 April 1969; pp. 10–11. [Google Scholar]
  41. Hadjisophocleous, G.; Jia, Q. Comparison of FDS prediction of smoke movement in a 10-storey building with experimental data. Fire Technol. 2009, 45, 163–177. [Google Scholar] [CrossRef]
  42. Zhao, G.; Beji, T.; Merci, B. Study of FDS simulations of buoyant fire-induced smoke movement in a high-rise building stairwell. Fire Saf. J. 2017, 91, 276–283. [Google Scholar] [CrossRef]
  43. Byström, A.; Cheng, X.; Wickström, U.; Veljkovic, M. Full-scale experimental and numerical studies on compartment fire under low ambient temperature. Build. Environ. 2012, 51, 255–262. [Google Scholar] [CrossRef]
  44. Peppes, A.A.; Santamouris, M.; Asimakopoulos, D.N. Experimental and numerical study of buoyancy-driven stairwell flow in a three storey building. Build. Environ. 2002, 37, 497–506. [Google Scholar] [CrossRef]
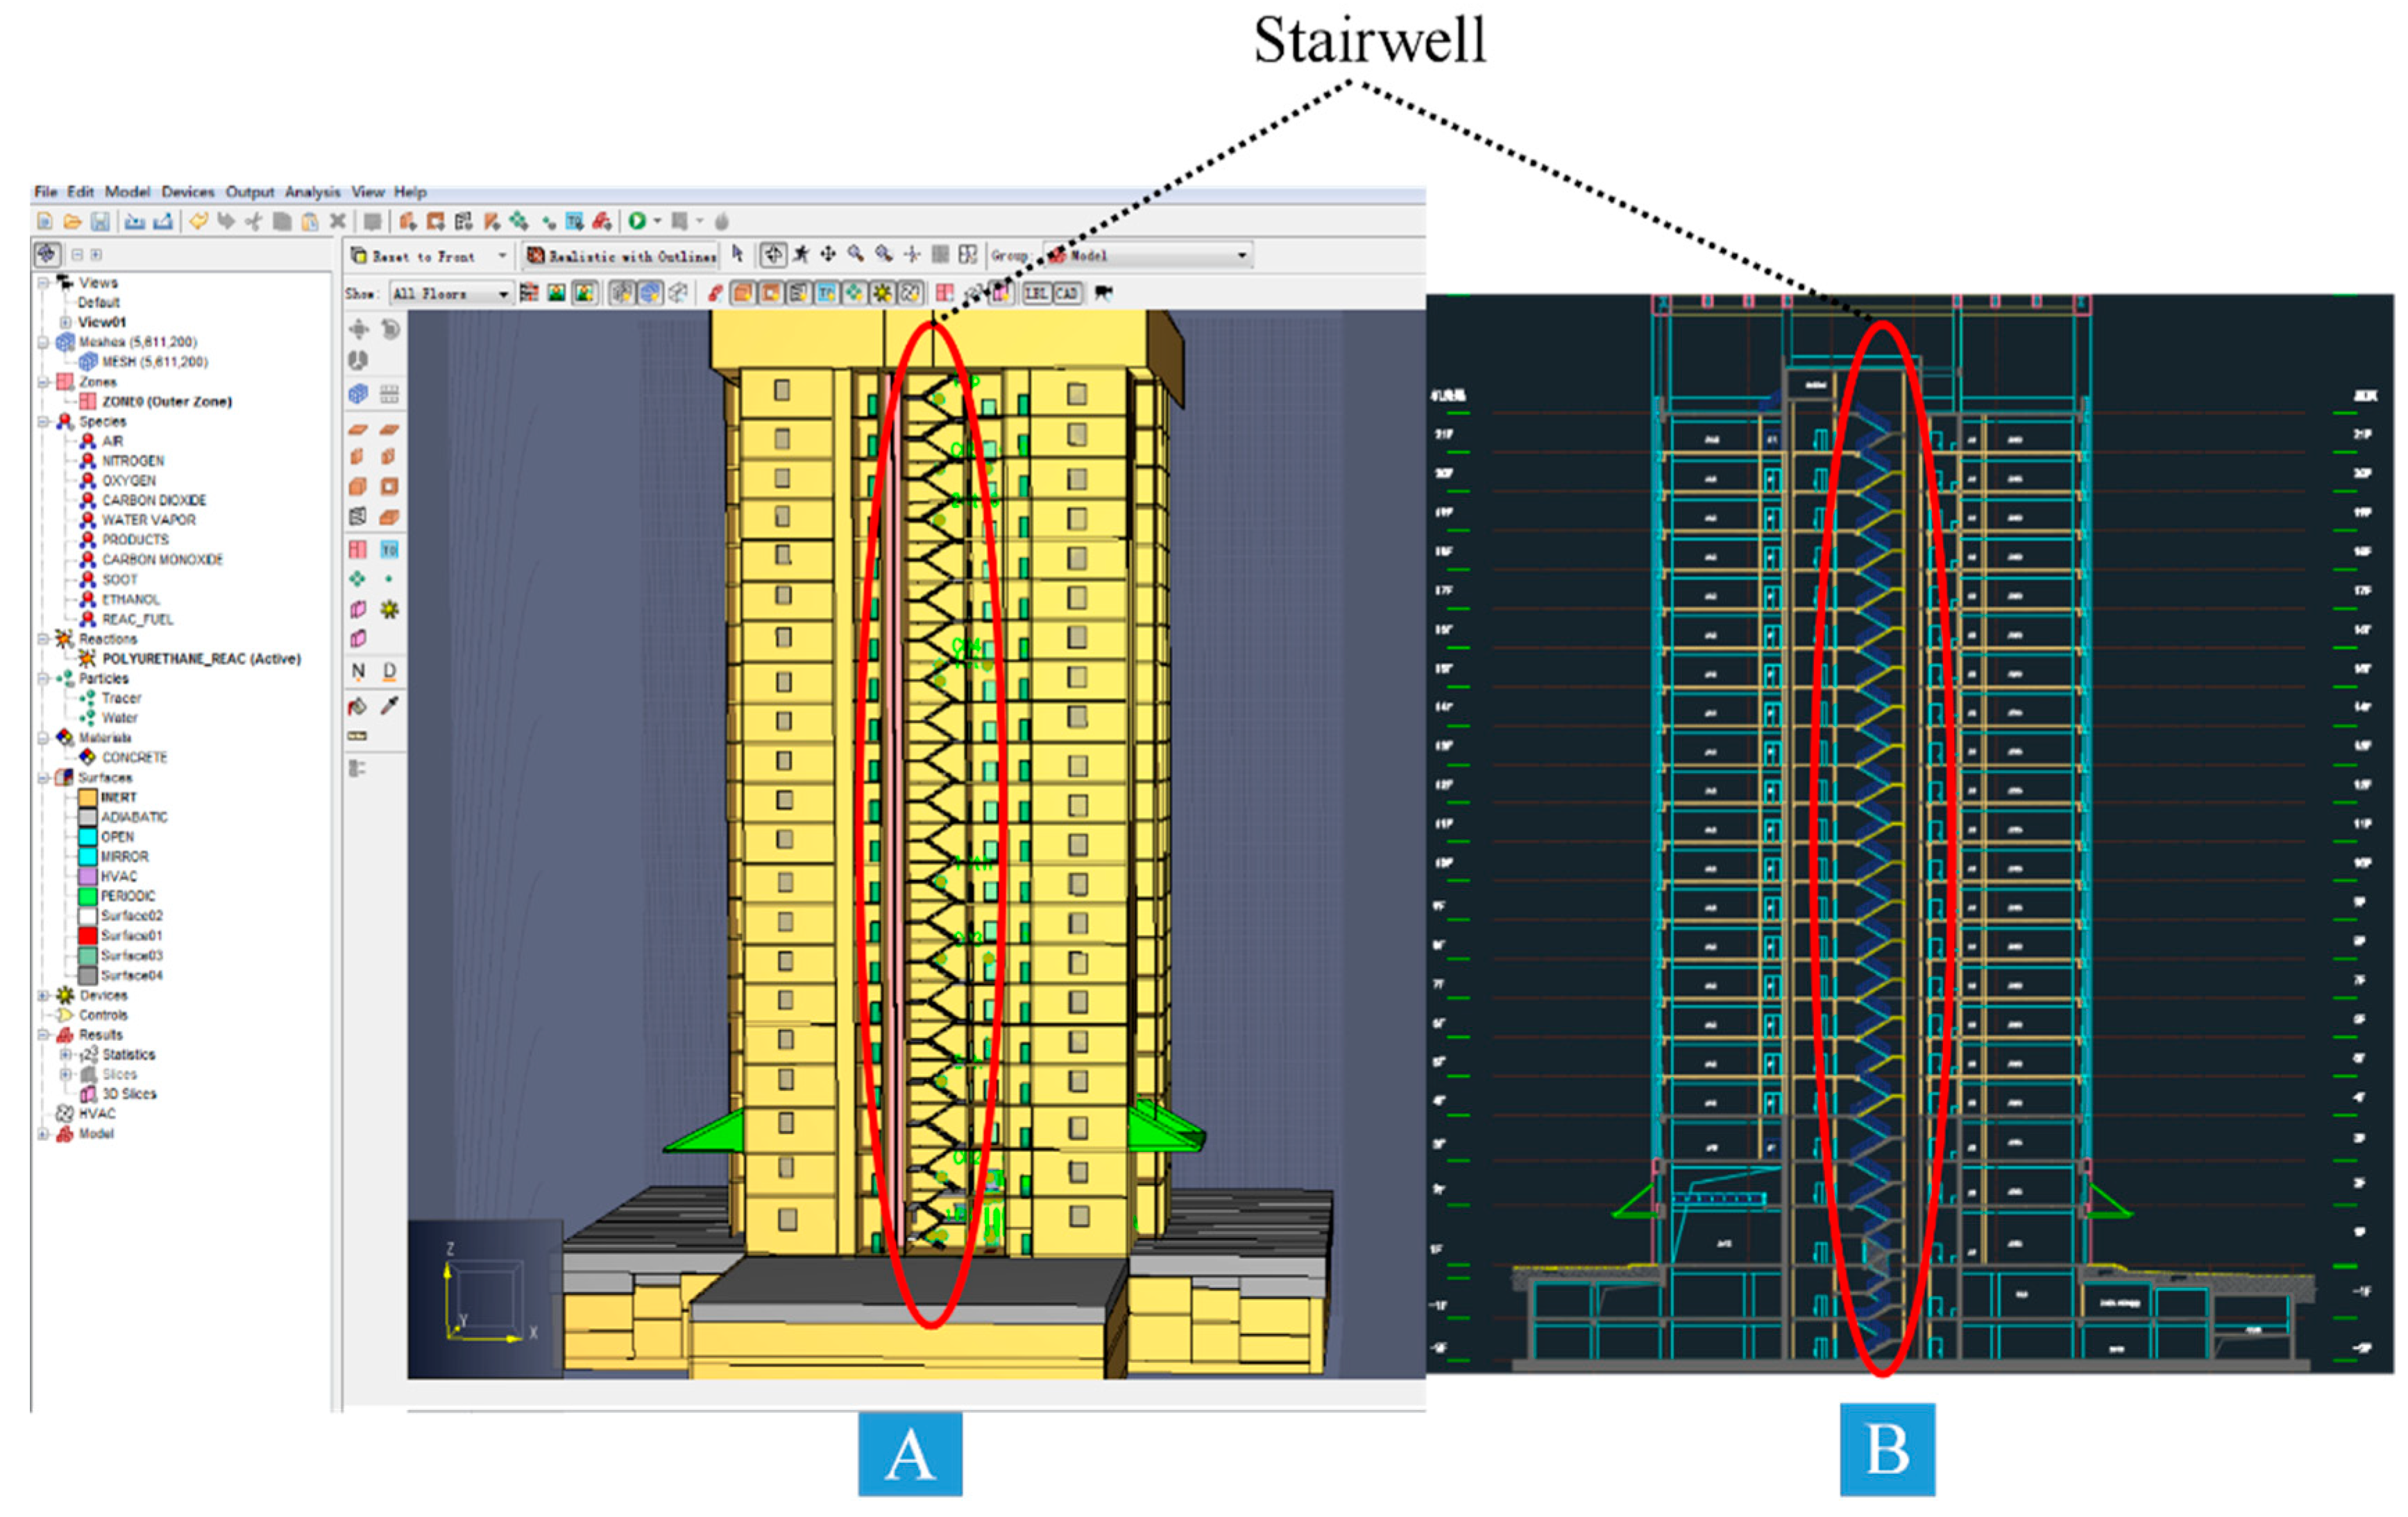
Figure 1. The picture of: (A) the whole building model; (B) Computer Aided Design (CAD) of the building.
Applsci 09 01431 g001
Figure 2. Simplified diagram of stairwell model.
Applsci 09 01431 g002
Figure 3. Layout of measuring points.
Applsci 09 01431 g003
Figure 4. Velocity of smoke flow at different fire HRRs with only 1F and 21F open (all at 300 s).
Applsci 09 01431 g004
Figure 5. Temperature variation of different measuring points (at different floors) in the stairwell at different fire HRRs (0.5 MW, 1.5 MW, 2.5 MW, and 3.5 MW).
Applsci 09 01431 g005
Figure 6. Variation of temperature at different measuring points in stairwell at different fire HRRs (0.1 MW, 0.25 MW, 0.5 MW, 1 MW, 1.5 MW, 2.5 MW, 3.5 MW, and 4.5 MW).
Applsci 09 01431 g006
Figure 7. Vertical temperature distribution in stairwell at different fire HRRs ((a) fire power 0.5 MW, (b) fire power 1.5 MW, (c) fire power 2.5 MW, (d) fire power 3.5 MW) on Floor 01.
Applsci 09 01431 g007
Figure 8. Velocity vector fields at x = 8.5 m at different fire locations (fire located at Floors 1, 5, and 15) with a fire HRR of 1.5 MW.
Applsci 09 01431 g008
Figure 9. Smoke flow at different fire source locations (Floors 1, 5, 10, 15, and 20) and at an HRR of 1.5 MW.
Applsci 09 01431 g009
Figure 10. Relationship between maximum temperature (Tm) and fire location factor (h*).
Applsci 09 01431 g010
Figure 11. Relationship between height of maximum temperature (ZTm) and maximum temperature (Tm).
Applsci 09 01431 g011
Figure 12. Time required to reach maximum temperature for different fire location factors.
Applsci 09 01431 g012
Table 1. Building parameters of simplified model.
FloorRoom Height (m) Size of Stairwell (m)
(Length × Width × Height)
Size of Compartment Room (m)
(Length × Width × Height)
16.06.75 × 2.9 × 64.2 × 2.9 × 6
2–34.56.75 × 2.9 × 4.54.2 × 2.9 × 4.5
4–203.96.75 × 2.9 × 3.94.2 × 2.9 × 3.9
218.06.75 × 2.9 × 84.2 × 2.9 × 8
Table 2. Detailed information on simulation setup.
SubjectContent
The type of actionPolyurethane reaction
(C = 1.0, H = 1.7, O = 0.3, N = 0.08, CO Yield = 0.042, Soot Yield = 0.12)
Simulation time600 s
Initial conditionsAmbient temperature20.0 °C
Ambient pressure1.01325 Pa
Relative humidity40.0%
Table 3. Detailed data of configurations employed in this study.
Group TestFire HRR
(MW)
Atria Fire Location Opening Locations
I. Varied fire size10.11 F1F, 21F
20.251 F1F, 21F
30.51 F1F, 21F
411 F1F, 21F
51.51 F1F, 21F
62.51 F1F, 21F
73.51 F1F,21F
II. Varied fire locationUniform opening in side direction 11.51 FAll open
21.55 FAll open
31.510 FAll open
41.515 FAll open
Non-uniform opening in side direction51.51 F1F, 21F
61.55 F5F, 21F
71.510 F8F, 21F
81.515 F15F, 21F
91.519 F19F, 21F
Table 4. Coefficients in function of fitting curve.
Figure Fire HRR (MW)Coefficient ACoefficient BCoefficient CCorrelation Coefficient R
Figure 7a0.546.570.02920.870.9972
Figure 7b1.5115.080.04730.990.9893
Figure 7c2.5165.370.05235.820.9879
Figure 7d3.5205.300.05338.060.9896
Table 5. Maximum temperature of measuring points at different heights.
TestFire Location
h (m)
Fire Location Factor
h*
Maximum Temperature of Measuring Points
Tm (°C)
Time Required to Reach Maximum Temperature
tm (s)
Height of Maximum Temperature
ZTm (m)
10.20.002145911.5
26.00.067143588.4
310.80.1211436213.0
419.50.2181426021.5
527.60.3091415629.6
631.70.3501405433.8
740.00.4481365841.9
848.10.5391336250.2
960.50.6771255562.5
1068.60.7681234970.7
1176.80.8601205078.9