Article

Is There a Relation between 677C>T Polymorphism in the MTHFR Gene and the Susceptibility to Epilepsy in Young Patients? A Meta-Analysis

by
Beata Sarecka-Hujar
Department of Basic Biomedical Science, Faculty of Pharmaceutical Sciences in Sosnowiec, Medical University of Silesia in Katowice, 41-200 Sosnowiec, Poland
Brain Sci. 2021, 11(10), 1327; https://doi.org/10.3390/brainsci11101327
Submission received: 1 September 2021 / Revised: 3 October 2021 / Accepted: 5 October 2021 / Published: 6 October 2021

Abstract

:
Background: Numerous data show a role for genetic polymorphisms in the development of epilepsy. Previously, the TT genotype of the MTHFR 677C>T polymorphism was found to be associated with a decreased leucocyte DNA methylation status. Polymorphisms in the MTHFR gene could modify the pharmacodynamics of many drugs. This meta-analysis aimed to assess the relationship between MTHFR 677C>T polymorphism and susceptibility to epilepsy in young patients. Methods: Available databases (PubMed, Embase, Google Scholar, SciELO, and Medline) were searched using specific keywords. Eight studies, published between 1999 and 2019, with 1678 young patients with epilepsy and 1784 controls, met the inclusion criteria. Apart from the total groups, additional analyses in age subgroups (i.e., young adults and children) were conducted. Statistical analyses were conducted using the RevMan 5.4 and MedCalc software. The pooled odds ratio (OR) was estimated with a random- or fixed-effects model depending on the heterogeneity. Analyses were performed for five genetic models, i.e., dominant (CT + TT vs. CC), recessive (TT vs. CC + CT), additive (TT vs. CC), heterozygous (CT vs. CC), and allelic (T vs. C). The publication bias was assessed with the use of Egger’s and Begg’s tests. Results: Both the MTHFR TT genotype (in the additive model) and the T allele (in the allelic model) significantly increased the risk of epilepsy when the total groups were compared (OR = 1.44, p = 0.002, and OR = 1.183, p = 0.001, respectively). The sensitivity analysis for these models indicated the stability of the results. Similarly, significant results were obtained among young adults for all the genetic models (dominant model: OR = 1.28, p = 0.002; recessive model: OR = 1.48, p = 0.003; additive model: OR = 1.63, p < 0.001; heterozygous model: OR = 1.21, p = 0.028; and allelic model: OR = 1.256, p < 0.001). Those results were also stable and reliable. In the group of children, no relation between 677C>T polymorphism and epilepsy was observed; however, the analysis was based only on three studies, and one study also comprised young adults. No publication bias was demonstrated. Conclusions: The meta-analysis revealed that the carrier state for the T allele as well as the TT genotype of the MTHFR 677C>T polymorphism increases the risk of epilepsy in young adults but not in children.

1. Introduction

The pathogenesis of epilepsy, which is one of the most common neurological disorders worldwide, is heterogeneous but still not fully known. Epileptogenesis is a dynamic process that begins with the action of one or several damaging factors (e.g., metabolic factors, genetic defects or trauma). In response to the damage factor within the latent period, the changes begin at the molecular level in gene expression and protein synthesis, and then, disturbances in the functioning of ion channels and neurons begin. The consequence of these changes is epileptic seizure as a clinical manifestation [1]. Based on a clinical phenomenology of the seizures, as well as electroencephalography (EEG) and neuroimaging recordings, seizures can be classified as focal, generalized and those of unknown onset. According to their first feature, motor or non-motor seizures can be distinguished. Furthermore, focal seizures may be classified into focal aware seizures and focal impaired-awareness seizures. In turn, epilepsy may be of focal, generalized, combined focal and generalized, and unknown type. Focal and generalized epilepsies are diagnosed based on clinical background, while, when information on the epilepsy type is lacking, the term “unknown” can be used [2].
The first remarks on the hereditary component in epilepsy were emphasized in 400 years BC by Hippocrates, who was also the first one who suggested a possible etiology and therapy for the disease [3]. Due to the development of genetic techniques over the last few decades, the impact of genetic background in epilepsy has been explored more extensively. The study by Vadlamudi et al. [4] based on 384 twin pairs confirmed genetic influences for specific epilepsies. Almost 11% of the analyzed twin pairs had mutations of large effect in known epilepsy genes or carried validated susceptibility alleles [4]. The latest data also demonstrate that genetic polymorphisms have an important role in the development of epilepsy [5].
In experimental animal models, the genome-wide alteration of DNA methylation signatures was demonstrated as a general pathomechanism associated with epileptogenesis and epilepsy [6]. The authors observed increased methylation in genes as well as in a large number of differentially methylated non-genic regions [6]. In human epilepsy, DNA methylation may also differentially regulate certain genes [7,8].
Methylenetetrahydrofolate reductase (MTHFR, EC 1.5.1.20) is an enzyme involved in the remethylation process. MTHFR catalyzes the reduction of 5,10-methyltetrahydrofolate to 5-methyltetrahydrofolate, the dominant form of folate and carbon donor in the remethylation of homocysteine to methionine. The gene encoding MTHFR is located on chromosome 1, in the p36.3 region. The common 677C>T polymorphism within the MTHFR gene was found to be related to the thermolability of the enzyme, which, in consequence, leads to an elevated level of homocysteine. Previously, it was observed that a disturbance in homocysteine metabolism may influence cellular methylation processes, including DNA methylation [9]. In the study by Castro et al. [9], the MTHFR TT genotype was associated with a decreased leucocyte DNA methylation status. Polymorphisms within the MTHFR gene could modify the pharmacodynamics of many drugs that require methylation reactions during metabolism or their biochemical effects [10]. Vilaseca et al. [11] observed the lowest folate levels in carbamazepine-treated patients with the MTHFR TT genotype. On the other hand, the authors reported no genotype-dependent effect of carbamazepine treatment on the levels of the B6 and B12 vitamins. Additionally, the effect of valproic acid on the levels of vitamins was not related to MTHFR genotypes [11]. Some studies have shown a relation between MTHFR 677C>T polymorphism and epilepsy, while others have not [5,11,12,13,14]. In addition, the ages of the patients with epilepsy analyzed in these studies ranged from infancy to adulthood.
To overcome the discrepancies of the results published, a meta-analysis was conducted to assess the relationship between 677C>T polymorphism in the MTHFR gene and susceptibility to epilepsy. The attention was focused on young patients, who included children and young adults up to 45 years old. In young people, the involvement of genes in the development of the disease may be of greater importance than in older patients.

2. Materials and Methods

2.1. Search Strategy

Databases (PubMed, Embase, Google Scholar, SciELO and Medline) were searched for relevant papers (the last search was performed in late August 2021) using the following keywords: (“MTHFR polymorphism” or “677C>T polymorphism”) and (“epilepsy” or “antiepileptic drugs”) and (“young adults” or “adolescents” or “children” or “infants”). The studies searched were included in the meta-analysis when the following criteria were met: (a) confirmed epilepsy, (b) patients and control groups, (c) ages of the patients younger than 45 years old, (d) access to data on genotypes, (e) full-length paper or brief communication, and (f) article written in English. In turn, publications were excluded for the following reasons: (a) unavailability of genotyping results; (b) lack of a reference (control) group; (c) mean ages of the epilepsy patients above 45 years; (d) conference proceedings, review articles, case reports, meta-analyses or animal studies as article types; and (e) language of the article other than English. Eventually, 8 case–control studies [5,11,12,13,14,15,16,17] published from 1999 to 2019, with a total number of 1678 young patients with epilepsy and 1784 controls, met the inclusion criteria. Figure 1 shows a flow diagram for the process regarding the search and reasons for excluding the studies according to the PRISMA guidelines [18].

2.2. Data Extraction and Methodological Quality

The following data were extracted from each study included in the present meta-analysis: the first author’s name, year of publication, population, ages of cases and control subjects, and sizes of the analyzed groups, as well as the number with a particular genotype of the MTHFR 677C>T polymorphism in both the subjects and controls. If applicable, the number of MTHFR alleles was also extracted; otherwise, the alleles were calculated based on genotype frequencies. To establish the methodological quality of the studies, an assessment with the Newcastle–Ottawa scale (NOS) for case–control studies was performed [19]. Using the NOS scale, a study can be scored within the range of 0 to 11 points. When an article achieved at least 5 points, it was considered of sufficient quality. The Hardy–Weinberg equilibrium (HWE) for controls was calculated in each study.

2.3. Statistical Analyses

Statistical analyses were conducted twice with the use of the Review Manager software (RevMan version 5.4; Cochrane, London, UK) and MedCalc software (version 19.5.3.; MedCalc Software Ltd., Ostend, Belgium), and an experienced biostatistician served to solve doubts. To determine the strength of association between the selected genetic model and the disease, the pooled odds ratio (OR) with 95% confidence intervals (CIs) was assessed. To assess the degree of heterogeneity between the studies included, the I2 was calculated. It describes the proportion of variance (from 0% to 100%) that is due to variance in the true effect sizes rather than sampling error. The selection of the statistical model for the analyses was performed on the basis of heterogeneity. I2 at 25%, 50%, and 75% suggested low, intermediate, and high inconsistency, respectively. In the case of significant heterogeneity between studies, the random-effects method (DerSimonian–Laird; REM) was used to calculate the pooled OR with the 95% CI, whereas in the case of nonsignificant heterogeneity, the calculation was performed with the fixed-effects method (Mantel–Haenszel, FEM). The strength of the correlation between the MTHFR 677C>T polymorphism and epilepsy was assessed in the following models: dominant (CT + TT vs. CC), recessive (TT vs. CC + CT), additive (TT vs. CC), heterozygote (CT vs. CC), and allelic (T vs. C).
To assess the potential publication bias, both Egger’s regression and Begg’s rank correlation tests were performed. In addition, to evaluate the stability of the results, sensitivity analyses were performed by the sequential exclusion of each study. The result was considered to be statistically significant when the p value was below 0.05.

3. Results

3.1. Characteristics of the Studies Included

The crucial data extracted from the studies included in the present meta-analysis (i.e., the population, year of publication, sample size, age, and relationship assessed) are shown in Table 1.
In general, the studies were performed in different racial populations, whereas Caucasians were the most numerous. In the case of the age of the studied patients and controls, two studies analyzed only children [5,11]. In turn, the study by Ono et al. [16] analyzed patients from 1 year old to 40 years old; thus, this population contained both children and young adults. In the case of this study, the mean age of the patients was lower than that of the controls, while the age range for the patients was wider compared to that for the control group [16]. In the study by Kini et al. [17], the age of the epileptic patients was not provided; however, the study group consisted of pairs: pregnant women with epilepsy and their babies examined after delivery. Therefore, women analyzed by Kini et al. [17] were assumed to be of reproductive age, which allowed the classification of them as young patients. The largest groups of epilepsy patients and controls were recruited by Scher et al. [14], Al-Eitan et al. [5], and Dean et al. [12] as well as Kini et al. [17]. In turn, the lowest number of patients and control subjects was recruited by Vilaseca et al. [11] and Ono et al. [16].
The correlation between 677C>T polymorphism in the MTHFR gene was observed in three studies [12,14,15]. In the study by Ono et al. [16], the relationship of MTHFR genotypes with symptomatic or cryptogenic epilepsy but not with idiopathic epilepsy was reported. In turn, Aydin et al. [13] and Vilaseca et al. [11] observed no correlation, whereas AL-Eitan et al. [5] established an association only in a generalized tonic-clonic epilepsy subgroup. In one study, no clear relation was described [17].
The distribution of the genotypes and alleles of the MTHFR 677C>T polymorphism, together with the results of the HWE in the controls and quality assessment for each study, is shown in Table 2.
One study [11] demonstrated a lack of agreement with the Hardy–Weinberg equilibrium in the prevalence of genotypes in controls, which is probably due to the low number of subjects in the control group (Table 2). However, the assumption of Minelli et al. [20] was adopted in order not to exclude studies that differed from the HWE.

3.2. Association between 677C>T Polymorphism in MTHFR Gene and Epilepsy in Total Groups

The TT genotype of the MTHFR gene was present in over 12% of the total group of epileptic young patients compared to almost 10% of the healthy controls. Additionally, carriers of the T allele (subjects with CT or TT genotypes) were more frequent in the epilepsy group than in the controls (55% vs. 51%).
Significant heterogeneity between the analyzed studies was observed only in the case of the dominant model (i.e., MTHFR CT + TT vs. CC) for the total groups (I2 = 52%; p = 0.04); thus, the pooled OR was calculated using the REM (Figure 2). In other genetic models, no heterogeneity was demonstrated, which allowed the use of FEM. The results of the statistical analyses showed that the carrier state for the MTHFR 677T allele may be related to epilepsy (OR = 1.26; 95% CI 1.01–1.59; p = 0.04) (Figure 2). The recessive model (i.e., TT vs. CT + CC) also revealed a significant difference in the prevalence of TT homozygotes in comparison to CC and CT genotypes between the analyzed groups of young patients (OR = 1.33; 95% CI 1.07–1.65; p = 0.01).
Similarly, in the additive model (i.e., the comparison of TT homozygotes vs. CC homozygotes), the results were statistically significant (OR = 1.44; 95% CI 1.14–1.81; p = 0.002). A weaker relation, but again significant, was observed for the allelic model (T vs. C; OR = 1.18; 95% CI 1.07–1.31; p = 0.001), whereas a lack of relation was demonstrated for the heterozygous model (CT vs. CC, p = 0.06).

3.3. Sensitivity Analysis for Comparisons in Total Groups

In the sensitivity analysis, no change in the OR value was demonstrated in the case of additive, heterozygous, and allelic models after excluding subsequent studies. Therefore, these analyses were considered stable. However, in the dominant model after omitting both the study by Scher et al. [14] and the study by Yoo et al. [16], the significance was lost (OR = 1.22, 95% CI 0.96–1.56, p = 0.10, and OR = 1.31, 95% CI 0.96–1.77, p = 0.09, respectively, in the REM). In turn, omitting the study by Scher et al. [14] also changed the results in the recessive model of the present meta-analysis into nonsignificant (OR = 1.26; 95% CI 0.96–1.65; p = 0.09). Thus, the results in the dominant and recessive model should be treated with caution.

3.4. Publication Bias in Total Groups

In the total group, no publication bias was observed since the shapes of the funnel plots of all the genetic models analyzed were roughly symmetrical. Table 3 shows the exact results of both Egger’s and Begg’s tests for all the genetic models in the total groups.

3.5. Subgroup Analyses

Due to the wide range of the ages of the epileptic patients from the studies included, two analyses in age subgroups were additionally performed, i.e., in the group of young adults (age over 18 years but below 45 years) and in the group of children.

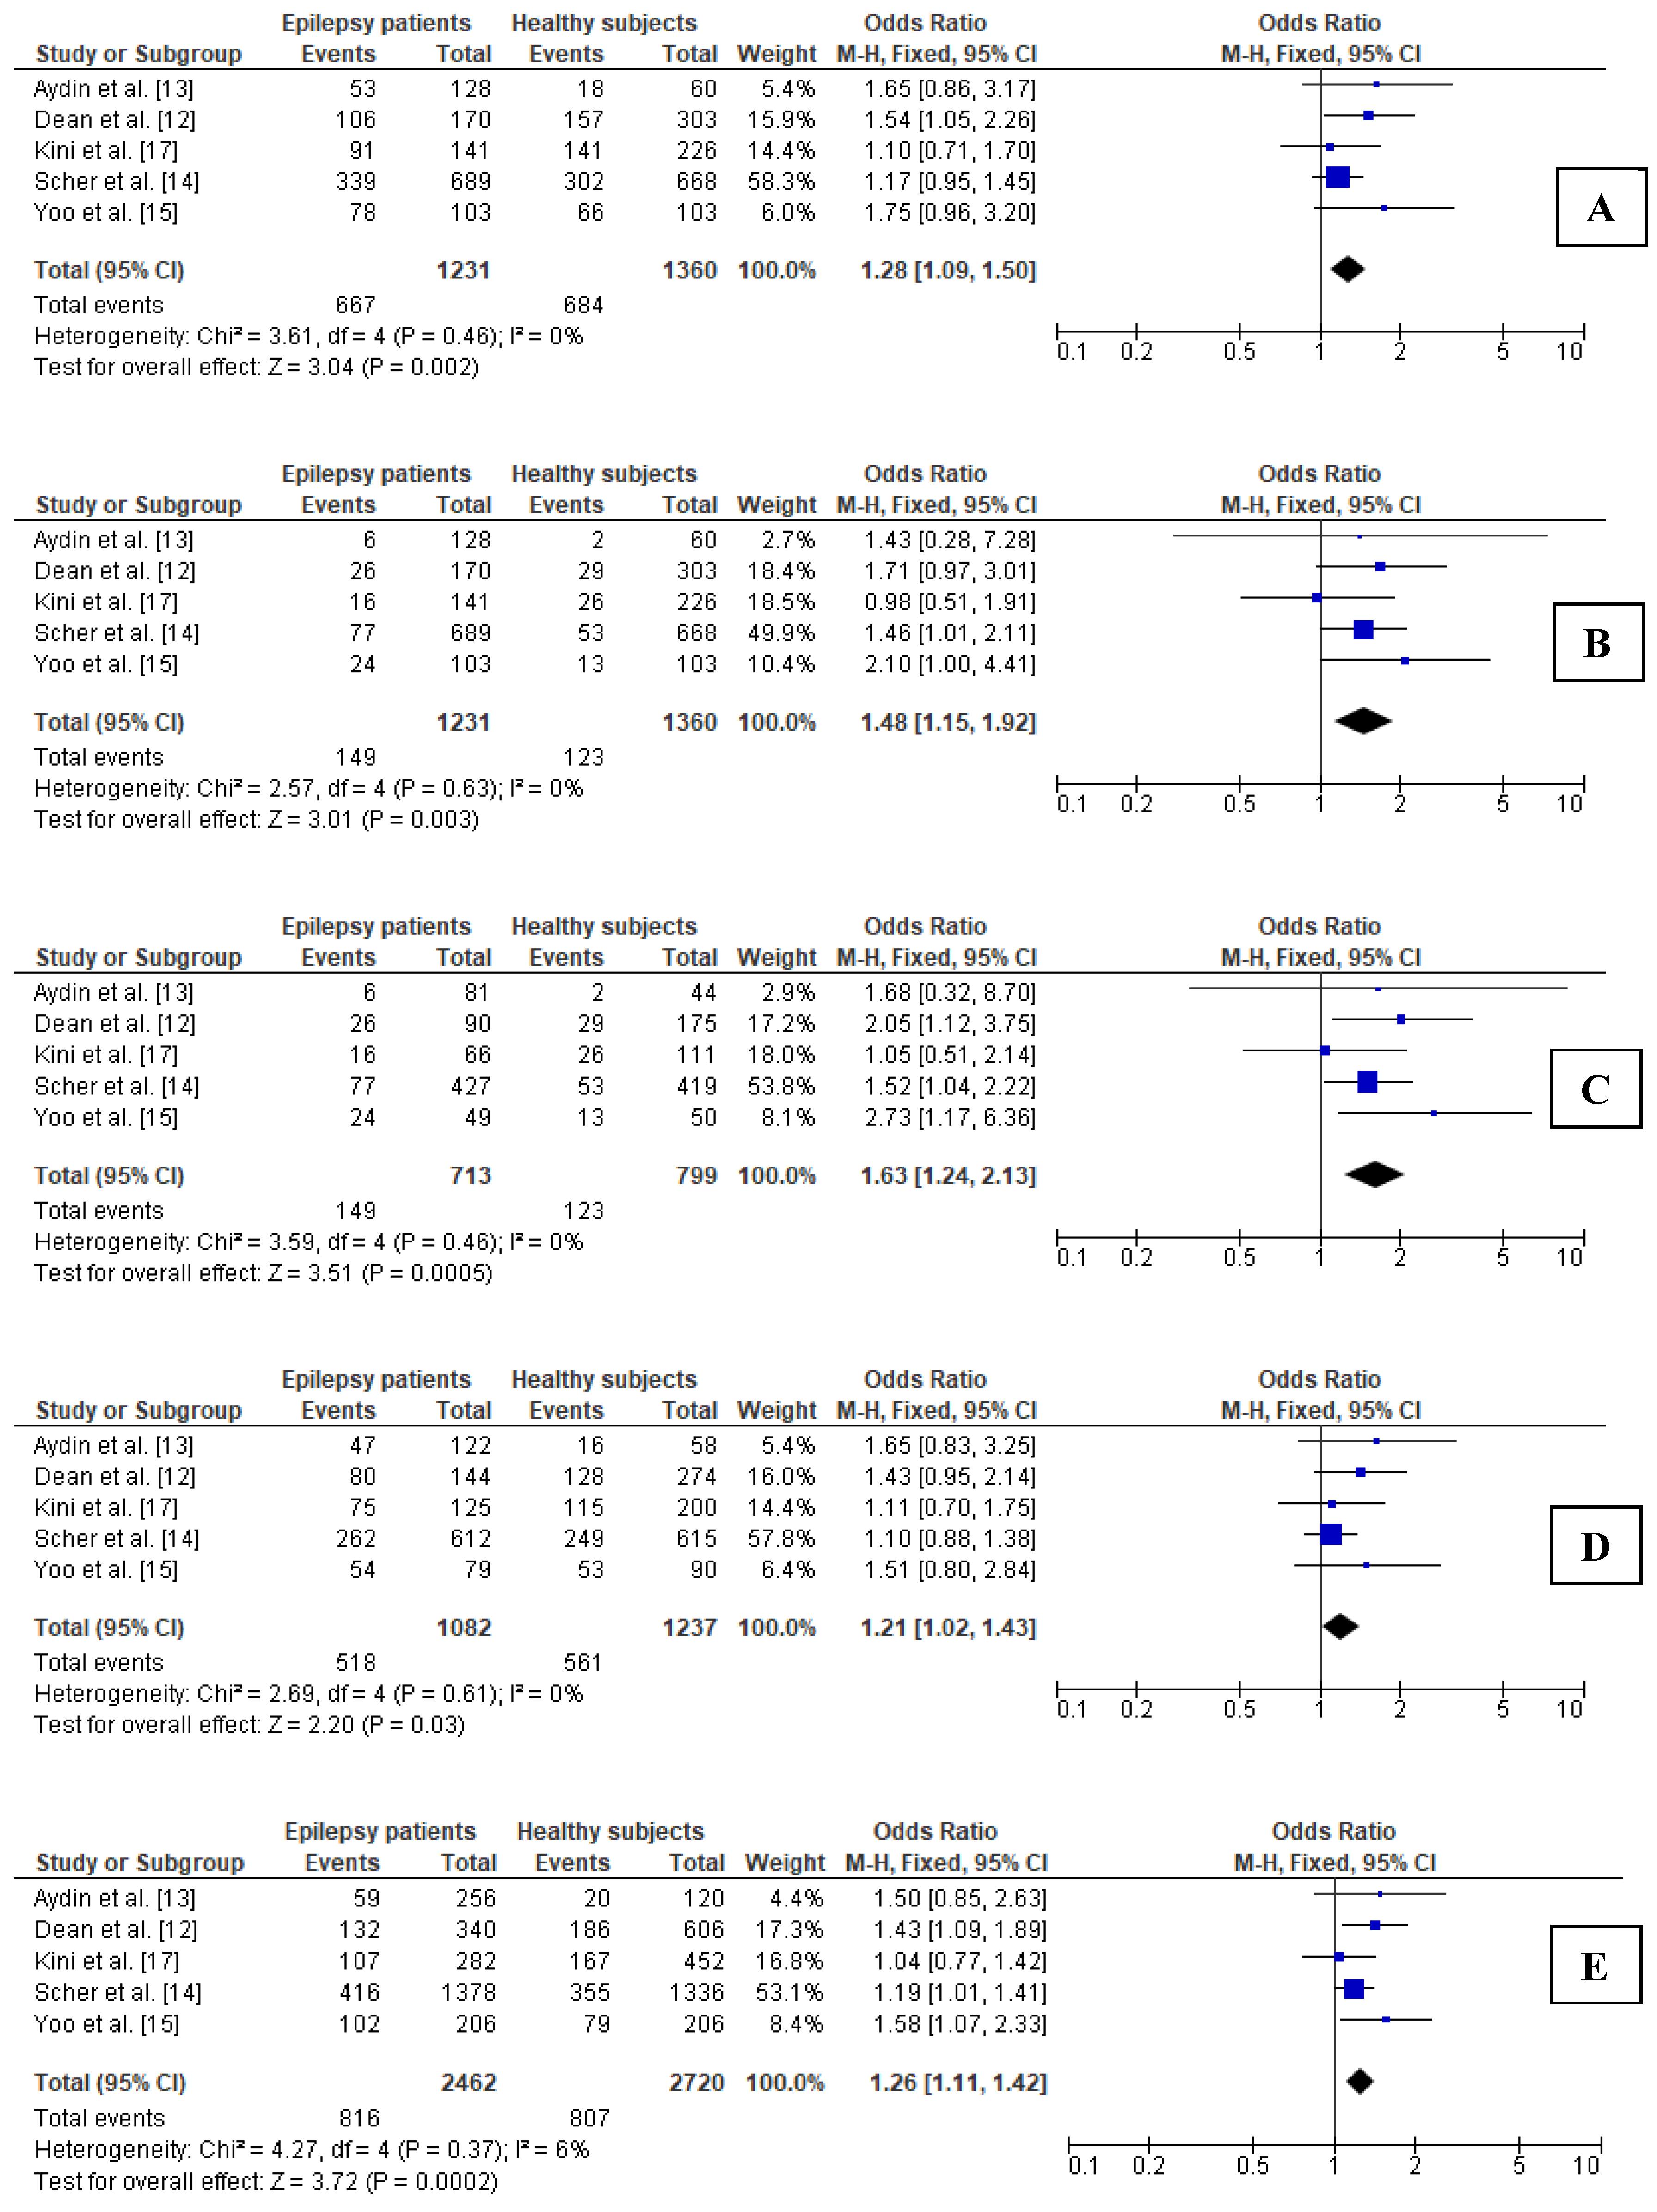
3.5.1. Association between 677C>T Polymorphism in MTHFR Gene and Epilepsy in Young Adults

In this meta-analysis, five studies were included [12,13,14,15,17], with 1231 young patients with epilepsy and 1360 healthy subjects as controls. The proportion of the carriers of the MTHFR T allele in the young adults with epilepsy and controls was similar to that observed in the total group (54% vs. 50%, respectively).
In all the analyzed genetic models for young adults, nonsignificant heterogeneity between the analyzed studies was observed; thus, FEM was used to calculate the OR (Figure 3).
In young adults, the carrier state for the MTHFR 677T allele may be a risk factor for epilepsy (OR = 1.28; 95% CI 1.09–1.50; p = 0.002). A higher OR was found in the case of the recessive model in young adults (OR = 1.48; 95% CI 1.15–1.92; p = 0.003), while the highest OR was shown for the additive model (OR = 1.63; 95% CI 1.24–2.13; p < 0.001). In turn, comparable values of pooled OR were demonstrated for both heterozygous as well as allelic models in young adults (OR = 1.21; 95% CI 1.02–1.43; p = 0.028, and OR = 1.26; 95% CI 1.11–1.42; p < 0.001, respectively).

3.5.2. Sensitivity Analysis for Comparisons in Subgroup of Young Adults

The sequential exclusion of each study included in the meta-analysis in the subgroup of young adults revealed no change in the OR value in the case of any of the genetic models. Thus, the results are stable and reliable.

3.5.3. Publication Bias in Subgroup of Young Adults

Similarly to in the total groups, in the subgroup of young adults, no publication bias was demonstrated (Table 4).

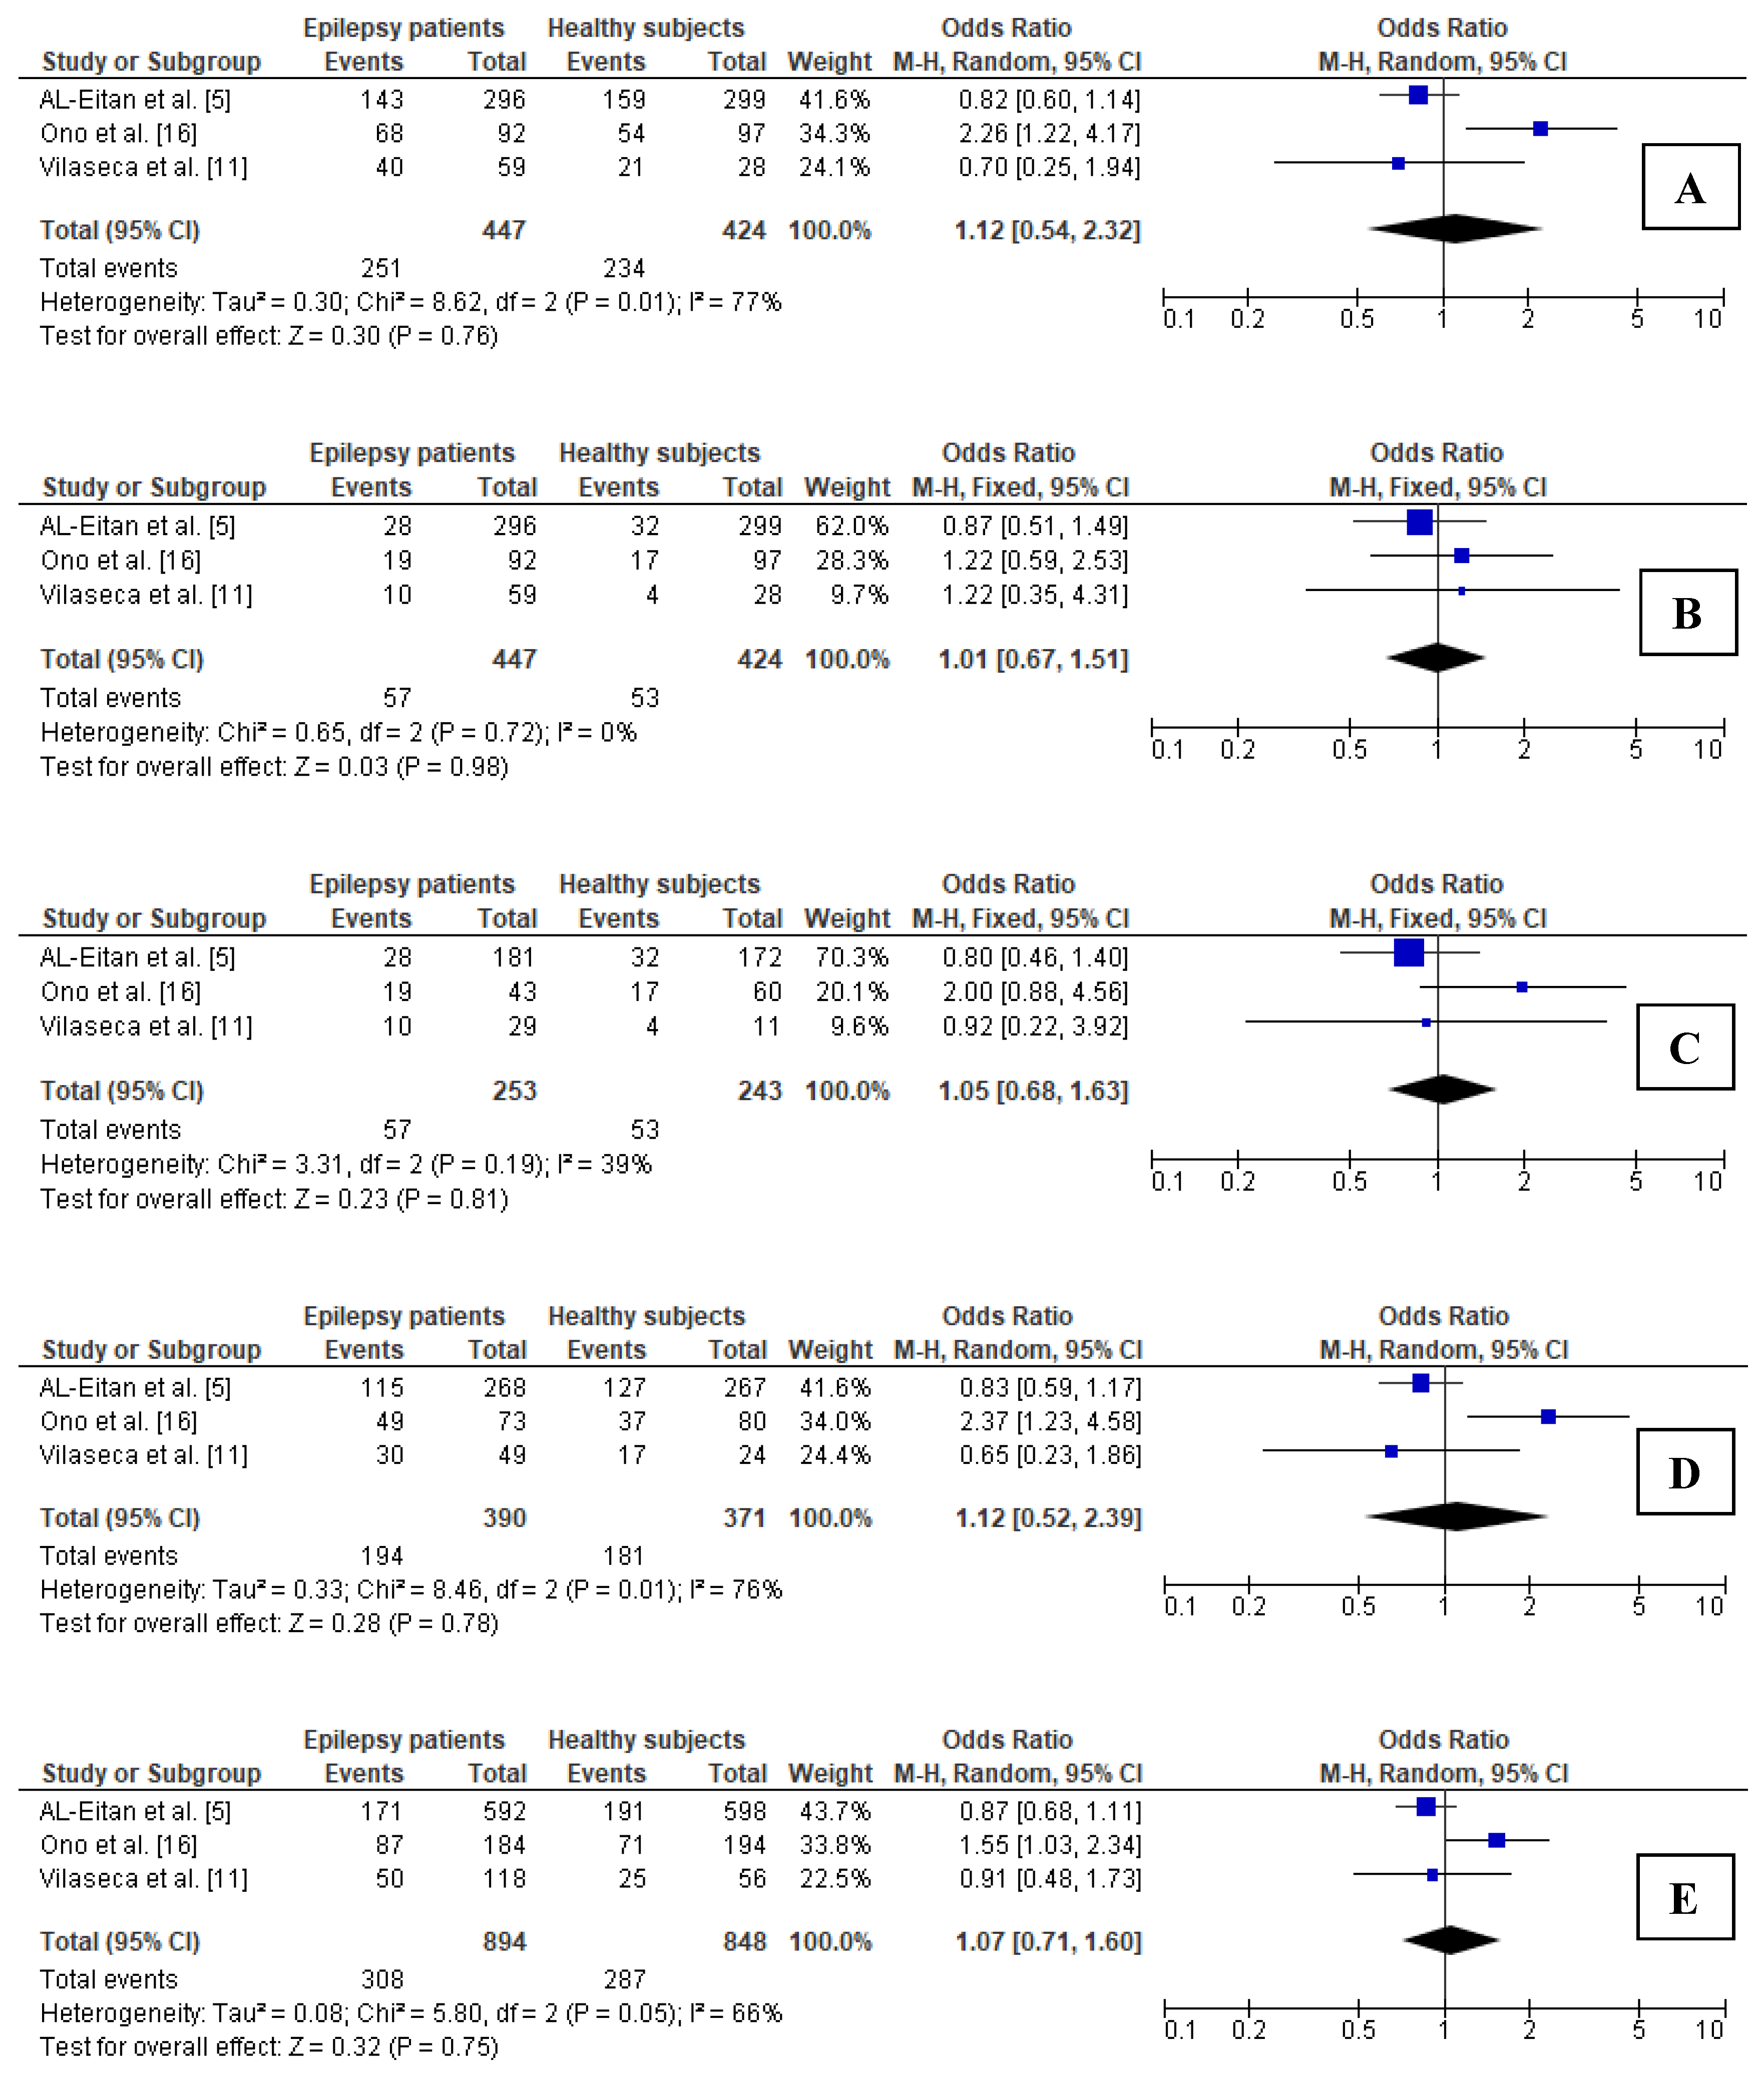
3.5.4. Association between 677C>T Polymorphism in MTHFR Gene and Epilepsy in Children

This meta-analysis contained three studies [5,11,16] with an epilepsy group involving 447 children and control group comprising 424 healthy subjects. In this analysis, the frequency of MTHFR T allele carriers in children with epilepsy was comparable to that observed in the controls (56% vs. 55%, respectively).
Significant heterogeneity between the analyzed studies was observed for the dominant as well as heterozygous model; thus, the random-effects model was used to calculate the pooled OR. In the children subgroup, none of the analyzed genetic models showed significance (Figure 4).

3.5.5. Sensitivity Analysis for Comparisons in Subgroup of Children

The sequential exclusion of each study included in the meta-analysis in the subgroup of children demonstrated that the values of the OR in the case of any of the genetic models did not change. Thus, the results are stable and reliable.

3.5.6. Publication Bias in Subgroup of Children

In the subgroup of children, no publication bias was demonstrated, which was consistent with the results in the total groups and in the subgroup of young adults (Table 5).

4. Discussion

The updated meta-analysis revealed that, in the total groups, the MTHFR TT genotype may be related to epilepsy in comparison to the CC genotype (i.e., in the additive model, TT vs. CC; OR = 1.44; p = 0.002). The sensitivity analysis indicated the results were stable and therefore reliable. Table 6 summarizes the detailed results for all the genetic models in all the groups/subgroups.
The results of the dominant (CT + TT vs. CC) and recessive (TT vs. CT + CC) models were not stable; therefore, despite the fact of significance, they should be treated with caution.
Previously, two meta-analyses analyzing the relation between 677C>T polymorphism in the MTHFR gene and epilepsy were published [21,22]. The study by Wu et al. [21] from 2014 included ten studies, while the study by Rai et al. [22] was published in 2018 and included 12 studies, i.e., 10 studies were the same as in Wu et al.’s analysis [21] and two additional studies were included [23,24]. Both of these papers were not included into the present meta-analysis since the study of Balamuralikrishnan et al. [23] was not a full-length paper, just a conference abstract, while the study by Munisamy et al. [24] was conducted on patients with ages ranging from 16 to 60 years old. Due to age, several studies were excluded from the current meta-analysis [25,26,27,28]. Caccamo et al. [25] observed that all patients chronically treated with enzyme-inducing, folate-depleting antiepileptic drugs and simultaneously bearing the 677 TT genotype and 1298 AA genotype or 677 CT and 1298 AA genotypes of the MTHFR gene had elevated plasma levels of homocysteine. Earlier data demonstrated that the inhibitory effect of homocysteine thiolactone on Na+/K ATPase activity in the hippocampus cells of male rats can cause seizures [29]. Since the MTHFR gene may affect different transcriptomes and proteomes, it may influence the clinical response to various drugs, e.g., antiepileptic drugs [30]. In the study by Ullah et al. [30], epilepsy patients from a Pakhtun population (Pakistan) who were heterozygotes for both common polymorphisms of the MTHFR gene had poor seizure control. In the study by Kini et al. [17], no relation between MTHFR 677C>T polymorphism and epilepsy itself was established since the authors analyzed the impact of the MTHFR genotype on the rate of major malformations in the offspring of women taking antiepileptic drugs as a secondary outcome. The study demonstrated that neither controls carrying the T allele (CT+TT genotypes) nor cases exposed to antiepileptic drugs having the CC genotype had a higher risk of major malformations [17].
After dividing the studies involved in the present paper according to age, greater odds for the correlation between MTHFR 677C>T polymorphism and epilepsy among young adults were demonstrated within all the analyzed genetic models, especially for the recessive model (OR = 1.48; 95% CI 1.15–1.92; p = 0.003) and additive model (OR = 1.63; 95% CI 1.24–2.13; p < 0.001). The results were stable and reliable. The present meta-analysis is the first one to include a children subgroup. However, no relation between 677C>T polymorphism and epilepsy in the children groups was observed. The analysis should be treated with caution since it was based on only three studies, and one study also comprised young adults. The study by Ono et al. [16] was included in the children subgroup due to the fact that the ages of the cases ranged from 1 to 40 years (mean age: 14.8 years), although the authors did not provide information on the proportion of children/young adults. No publication bias was demonstrated for the children subgroup. Two articles based on pediatric patients were excluded from the meta-analysis since no information on the genetic distribution in the controls was found [31,32]. Vurucu et al. [32] demonstrated that 677C>T polymorphism of the MTHFR gene had no impact on elevated levels of homocysteine in epileptic children receiving carbamazepine or valproic acid. In addition, a recent study by Zhu et al. [33] analyzed MTHFR polymorphism in epileptic patients and controls aged 15–55 years old but in reference to its impact on homocysteine levels. The authors did not demonstrate genotype distributions. However, in the study, the MTHFR TT genotype was observed to increase patients’ susceptibility to the effect of oxcarbazepine in disrupting homocysteine homeostasis [33].
The strength of the present study is the analysis within age subgroups, which was performed for the first time. This approach showed that the 677C>T polymorphism may be related to epilepsy in young adults, whereas including children in the overall analysis lowered the results. Therefore, it can be assumed that the analyses regarding the relationship of the 677C> T polymorphism in the MTHFR gene should be carried out in strictly defined age groups, so that the results are not underestimated or overestimated.
In the present study, some limitations should be addressed. The first one is the small number of studies included in the meta-analysis. Secondly, the analysis was generally conducted for epilepsy; there was no possibility to perform analyses in specific epilepsy subgroups. In addition, there were also no additional data on other factors that could possibly interact with the MTHFR polymorphism in the development of epilepsy. Performing meta-analyses of interactions between particular genes and factors that are simultaneously present in the patients would be more accurate for understanding the role of the polymorphism in the pathogenesis of the disease. In the case of MTHFR polymorphism, the level of homocysteine should be especially considered, as the presence of a particular MTHFR genotype without elevated levels of homocysteine may have no impact on the pathogenesis of epilepsy.

5. Conclusions

Performing research to identify possible genetic biomarkers that will be clinically useful may be of great importance from the point of view of the diagnosis and treatment of epilepsy. The present meta-analysis revealed that the carrier state for the MTHFR 677T allele as well as the TT genotype in comparison with both the CC genotype and CC + CT genotypes is related to epilepsy in young adults, but no such correlations were observed for the pediatric population.

Funding

This research received no external funding.

Institutional Review Board Statement

As the present meta-analysis was based on previously published data, no patient was recruited during the study; thus, no ethical approval was needed.

Informed Consent Statement

Not applicable.

Data Availability Statement

The data presented in this study are available on request from the Department of Basic Biomedical Science, Faculty of Pharmaceutical Sciences in Sosnowiec, Medical University of Silesia in Katowice (Poland). The data are not publicly available due to privacy restrictions.

Conflicts of Interest

The author declares no conflict of interest.

References

  1. Pitkänen, A.; Lukasiuk, K.; Dudek, F.E.; Staley, K.J. Epileptogenesis. Cold Spring Harb. Perspect. Med. 2015, 5, a022822. [Google Scholar] [CrossRef] [Green Version]
  2. Scheffer, I.E.; Berkovic, S.; Capovilla, G.; Connolly, M.B.; French, J.; Guilhoto, L.; Hirsch, E.; Jain, S.; Mathern, G.W.; Moshé, S.L.; et al. ILAE classification of the epilepsies: Position paper of the ILAE Commission for Classification and Terminology. Epilepsia 2017, 58, 512–521. [Google Scholar] [CrossRef] [Green Version]
  3. Magiorkinis, E.; Sidiropoulou, K.; Diamantis, A. Hallmarks in the History of Epilepsy: From Antiquity till the Twentieth Century. In Novel Aspects on Epilepsy; Foyaca-Sibat, H., Ed.; InTech: Rijeka, Croatia, 2011; pp. 132–133. [Google Scholar]
  4. Vadlamudi, L.; Milne, R.L.; Lawrence, K.; Heron, S.E.; Eckhaus, J.; Keay, D.; Connellan, M.; Torn-Broers, Y.; Howell, R.A.; Mulley, J.C.; et al. Genetics of epilepsy: The testimony of twins in the molecular era. Neurology 2014, 83, 1042–1048. [Google Scholar] [CrossRef] [Green Version]
  5. Al-Eitan, L.N.; Al-Dalalah, I.M.; Mustafa, M.M.; Alghamdi, M.A.; Elshammari, A.K.; Khreisat, W.H.; Aljamal, H.A. Effects of MTHFR and ABCC2 gene polymorphisms on antiepileptic drug responsiveness in Jordanian epileptic patients. Pharmgenom. Pers. Med. 2019, 12, 87–95. [Google Scholar] [CrossRef] [Green Version]
  6. Dębski, K.J.; Pitkanen, A.; Puhakka, N.; Bot, A.M.; Khurana, I.; Harikrishnan, K.N.; Ziemann, M.; Kaspi, A.; El-Osta, A.; Lukasiuk, K.; et al. Etiology matters—Genomic DNA Methylation Patterns in Three Rat Models of Acquired Epilepsy. Sci. Rep. 2016, 6, 25668. [Google Scholar] [CrossRef] [PubMed]
  7. Liu, X.; Ou, S.; Xu, T.; Liu, S.; Yuan, J.; Huang, H.; Qin, L.; Yang, H.; Chen, L.; Tan, X.; et al. New differentially expressed genes and differential DNA methylation underlying refractory epilepsy. Oncotarget 2016, 7, 87402–87416. [Google Scholar] [CrossRef] [PubMed] [Green Version]
  8. Wang, L.; Fu, X.; Peng, X.; Xiao, Z.; Li, Z.; Chen, G.; Wang, X. DNA Methylation Profiling Reveals Correlation of Differential Methylation Patterns with Gene Expression in Human Epilepsy. J. Mol. Neurosci. 2016, 59, 68–77. [Google Scholar] [CrossRef] [PubMed]
  9. Castro, R.; Rivera, I.; Ravasco, P.; Camilo, M.E.; Jakobs, C.; Blom, H.J.; de Almeida, I.T. 5,10-methylenetetrahydrofolate reductase (MTHFR) 677C-->T and 1298A-->C mutations are associated with DNA hypomethylation. J. Med. Genet. 2004, 41, 454–458. [Google Scholar] [CrossRef] [Green Version]
  10. Schwahn, B.; Rozen, R. Polymorphisms in the methylenetetrahydrofolate reductase gene: Clinical consequences. Am. J. Pharm. 2001, 1, 189–201. [Google Scholar] [CrossRef]
  11. Vilaseca, M.A.; Monrós, E.; Artuch, R.; Colomé, C.; Farré, C.; Valls, C.; Cardo, E.; Pineda, M. Anti-epileptic drug treatment in children: Hyperhomocysteinaemia, B-vitamins and the 677C-->T mutation of the methylenetetrahydrofolate reductase gene. Eur. J. Paediatr. Neurol. 2000, 4, 269–277. [Google Scholar] [CrossRef]
  12. Dean, J.C.; Robertson, Z.; Reid, V.; Wang, Q.; Hailey, H.; Moore, S.; Rasalam, A.D.; Turnpenny, P.; Lloyd, D.; Shaw, D.; et al. A high frequency of the MTHFR 677C>T polymorphism in Scottish women with epilepsy: Possible role in pathogenesis. Seizure 2008, 17, 269–275. [Google Scholar] [CrossRef] [PubMed] [Green Version]
  13. Aydin, A.; Varoglu, A.O. Methylenetetrahydrofolate reductase gene polymorphism and clinical importance in epilepsy patients using valproic acid, carbamazepine and levetiracetam. J. Lab. Med. 2017, 41, 147–151. [Google Scholar] [CrossRef]
  14. Scher, A.I.; Wu, H.; Tsao, J.W.; Blom, H.J.; Feit, P.; Nevin, R.L.; Schwab, K.A. MTHFR C677T genotype as a risk factor for epilepsy including post-traumatic epilepsy in a representative military cohort. J. Neurotrauma 2011, 28, 1739–1745. [Google Scholar] [CrossRef] [PubMed]
  15. Yoo, J.H.; Hong, S.B. A common mutation in the methylenetetrahydrofolate reductase gene is a determinant of hyperhomocysteinemia in epileptic patients receiving anticonvulsants. Metabolism 1999, 48, 1047–1051. [Google Scholar] [CrossRef]
  16. Ono, H.; Sakamoto, A.; Mizoguchi, N.; Sakura, N. Methylenetetrahydrofolate reductase 677C > T mutation and epilepsy. J. Inherit. Metab. Dis. 2000, 23, 525–526. [Google Scholar] [CrossRef]
  17. Kini, U.; Lee, R.; Jones, A.; Smith, S.; Ramsden, S.; Fryer, A.; Clayton-Smith, J.; Liverpool Manchester Neurodevelopmental Study Group. Influence of the MTHFR genotype on the rate of malformations following exposure to antiepileptic drugs in utero. Eur. J. Med. Genet. 2007, 50, 411–420. [Google Scholar] [CrossRef]
  18. Moher, D.; Liberati, A.; Tetzlaff, J.; Altman, D.G.; PRISMA Group. Preferred reporting items for systematic reviews and meta-analyses: The PRISMA statement. PLoS Med. 2009, 6, e1000097. [Google Scholar] [CrossRef] [Green Version]
  19. Wells, G.A.; Shea, B.; O’Connell, D.; Peterson, J.; Welch, V.; Losos, M.; Tugwell, P. The Newcastle-Ottawa Scale (NOS) for Assessing the Quality of Nonrandomised Studies in Meta-Analyses. Available online: http://www.ohri.ca/programs/clinical_epidemiology/oxford.asp (accessed on 12 August 2021).
  20. Minelli, C.; Thompson, J.R.; Abrams, K.R.; Thakkinstian, A.; Attia, J. How should we use information about HWE in the meta-analyses of genetic association studies? Int. J. Epidemiol. 2008, 37, 136–146. [Google Scholar] [CrossRef]
  21. Wu, Y.L.; Yang, H.Y.; Ding, X.X.; Zhao, X.; Chen, J.; Bi, P.; Sun, Y.H. Association between methylenetetrahydrofolate reductase C677T polymorphism and epilepsy susceptibility: A meta-analysis. Seizure 2014, 23, 411–416. [Google Scholar] [CrossRef] [Green Version]
  22. Rai, V.; Kumar, P. Methylenetetrahydrofolate reductase C677T polymorphism and susceptibility to epilepsy. Neurol. Sci. 2018, 39, 2033–2041. [Google Scholar] [CrossRef]
  23. Balamuralikrishnan, B.; Balachandar, V.; Devi, S.M.; Kumar, A.; Sasikala, K. Cytogenetic evaluation in epilepsy patients correlated with MTHFR C677T gene mutation and frequency of homocysteine levels. J. Neurol. Sci. 2013, 333, e44–e45. [Google Scholar] [CrossRef]
  24. Munisamy, M.; Al-Gahtany, M.; Tripathi, M.; Subbiah, V. Impact of MTHFR (C677T) gene polymorphism on antiepileptic drug monotherapy in North Indian epileptic population. Ann. Saudi Med. 2015, 35, 51–57. [Google Scholar] [CrossRef] [Green Version]
  25. Caccamo, D.; Condello, S.; Gorgone, G.; Crisafulli, G.; Belcastro, V.; Gennaro, S.; Striano, P.; Pisani, F.; Ientile, R. Screening for C677T and A1298C MTHFR polymorphisms in patients with epilepsy and risk of hyperhomocysteinemia. Neuromol. Med. 2004, 6, 117–126. [Google Scholar] [CrossRef]
  26. Belcastro, V.; Striano, P.; Gorgone, G.; Costa, C.; Ciampa, C.; Caccamo, D.; Pisani, L.R.; Oteri, G.; Marciani, M.G.; Aguglia, U.; et al. Hyperhomocysteinemia in epileptic patients on new antiepileptic drugs. Epilepsia 2010, 51, 274–279. [Google Scholar] [CrossRef] [Green Version]
  27. Gorgone, G.; Caccamo, D.; Pisani, L.R.; Currò, M.; Parisi, G.; Oteri, G.; Ientile, R.; Rossini, P.M.; Pisani, F. Hyperhomocysteinemia in patients with epilepsy: Does it play a role in the pathogenesis of brain atrophy? A preliminary report. Epilepsia 2009, 50, 33–36. [Google Scholar] [CrossRef] [PubMed]
  28. Sniezawska, A.; Dorszewska, J.; Rozycka, A.; Przedpelska-Ober, E.; Lianeri, M.; Jagodzinski, P.P.; Kozubski, W. MTHFR, MTR, and MTHFD1 gene polymorphisms compared to homocysteine and asymmetric dimethylarginine concentrations and their metabolites in epileptic patients treated with antiepileptic drugs. Seizure 2011, 20, 533–540. [Google Scholar] [CrossRef] [Green Version]
  29. Rasić-Marković, A.; Stanojlović, O.; Hrncić, D.; Krstić, D.; Colović, M.; Susić, V.; Radosavljević, T.; Djuric, D. The activity of erythrocyte and brain Na+/K+ and Mg2+-ATPases in rats subjected to acute homocysteine and homocysteine thiolactone administration. Mol. Cell Biochem. 2009, 327, 39–45. [Google Scholar] [CrossRef]
  30. Ullah, S.; Ali, N.; Khan, A.; Ali, S.; Nazish, H.R.; Uddin, Z. Epilepsy control with carbamazepine monotherapy from a genetic perspective. BMC Pharmacol. Toxicol. 2018, 19, 73. [Google Scholar] [CrossRef]
  31. Coppola, G.; Ingrosso, D.; Operto, F.F.; Signoriello, G.; Lattanzio, F.; Barone, E.; Matera, S.; Verrotti, A. Role of folic acid depletion on homocysteine serum level in children and adolescents with epilepsy and different MTHFR C677T genotypes. Seizure 2012, 21, 340–343. [Google Scholar] [CrossRef] [Green Version]
  32. Vurucu, S.; Demirkaya, E.; Kul, M.; Unay, B.; Gul, D.; Akin, R.; Gokçay, E. Evaluation of the relationship between C677T variants of methylenetetrahydrofolate reductase gene and hyperhomocysteinemia in children receiving antiepileptic drug therapy. Prog. Neuropsychopharmacol. Biol. Psychiatry 2008, 32, 844–848. [Google Scholar] [CrossRef]
  33. Zhu, S.; Ni, G.; Sui, L.; Zhao, Y.; Zhang, X.; Dai, Q.; Chen, A.; Lin, W.; Li, Y.; Huang, M.; et al. Genetic Polymorphisms in Enzymes Involved in One-Carbon Metabolism and Anti-epileptic Drug Monotherapy on Homocysteine Metabolism in Patients with Epilepsy. Front. Neurol. 2021, 12, 683275. [Google Scholar] [CrossRef] [PubMed]
Figure 1. Flow chart presenting the process of searching for the eligible articles.
Brainsci 11 01327 g001
Figure 2. Forest plots for relations between different genetic models of MTHFR polymorphism and epilepsy in total groups: (A) CT + TT vs. CC; (B) TT vs. CT + CC; (C) TT vs. CC; (D) CT vs. CC; (E) T vs. C. M.-H.—Mantel–Haenszel; CI—confidence interval; I2—heterogeneity; df—degrees of freedom.
Brainsci 11 01327 g002
Figure 3. Forest plots for relations between different genetic models of MTHFR polymorphism and epilepsy in the subgroup of young adults: (A) CT + TT vs. CC; (B) TT vs. CT + CC; (C) TT vs. CC; (D) CT vs. CC; (E) T vs. C. M.-H.—Mantel–Haenszel; CI—confidence interval; I2—heterogeneity; df—degrees of freedom.
Brainsci 11 01327 g003
Figure 4. Forest plots for relations between different genetic models of MTHFR polymorphism and epilepsy in the subgroup of children: (A) CT + TT vs. CC; (B) TT vs. CT + CC; (C) TT vs. CC; (D) CT vs. CC; (E) T vs. C. M.-H.—Mantel–Haenszel; CI—confidence interval; I2—heterogeneity; df—degrees of freedom.
Brainsci 11 01327 g004
Table 1. Characteristics of the studies included in the meta-analysis.
StudyYear of PublicationPopulationEpilepsy Group
n
Age
(Years)
Control GroupnAge
(Years)
Established Relationship
AL-Eitan et al. [5]2019Jordan269 Under 15299 5.9 ± 3.8No (in the total group)
Yes (in generalized epilepsy subgroup)
Vilaseca et al. [11]2000Spain59Range: 1–1828Age-matched to casesNo
Dean et a. [12]2008Scotland170NA (but both groups were age-matched)30329.0 ± 11.3Yes
Aydin et al. [13]2017Turkey128 27.6 ± 16.060Age-matched to casesNo
Scher et al. [14]2011USA68932.0 ± 8.566832.0 ± 8.5Yes
Yoo et al. [15]1999South Korea10327.5 ± 8.5103 28.1 ± 9.8Yes
Ono et al. [16]2000Japan92Mean: 14.8 (range: 1–40)97Mean: 25 (range: 20–30)Yes (in symptomatic or cryptogenic epilepsy)
Kini et al. [17]2007UK141NA226Age-matched to casesNA
Total1678 1784
M—male; F—female; NA—not applicable.
Table 2. Distribution of genotypes and alleles of MTHFR 677C>T polymorphism, as well as HWE and quality assessments, in the studies included.
StudyEpilepsy GroupControl GroupHWE
(for Controls)
2; p)
NOS
Genotypes of MTHFR 677C>T Polymorphism
n (%)
Alleles of MTHFR 677C>T Polymorphism
n (%)
Genotypes of MTHFR 677C>T Polymorphism
n (%)
Alleles of MTHFR 677C>T Polymorphism
n (%)
AL-Eitan et al. [5]CC: 153 (51.7)
CT: 115 (38.8)
TT: 28 (9.5)
C: 421 (71.1)
T: 171 (28.9)
CC: 140 (46.8)
CT: 127 (42.5)
TT: 32 (10.7)
C: 407 (68.1)
T: 191 (31.9)
0.051; 0.828
Vilaseca et al. [11]CC: 19 (32.2)
CT: 30 (50.8)
TT: 10 (17.0)
C: 68 (57.6)
T: 50 (42.4)
CC: 7 (25.0)
CT: 17 (60.7)
TT: 4 (14.3)
C: 31 (55.4)
T: 25 (44.6)
5.022; 0.026
Dean et a. [12]CC: 64 (37.6)
CT: 80 (47.1)
TT: 26 (15.3)
C: 208 (61.2)
T: 132 (38.8)
CC: 146 (48.2)
CT: 128 (42.2)
TT: 29 (9.6)
C: 420 (69.3)
T: 186 (30.7)
0.007; 0.937
Aydin et al. [13]CC: 75 (58.6)
CT: 47 (36.7)
TT: 6 (4.7)
C: 197 (76.9)
T: 59 (23.1)
CC: 42 (70.0)
CT: 16 (26.7)
TT: 2 (3.3)
C: 100 (83.3)
T: 20 (16.7)
0.145; 0.707
Scher et al. [14]CC: 350 (50.8)
CT: 262 (38.0)
TT: 77 (11.2)
C: 962 (69.8)
T: 416 (30.2)
CC: 366 (54.8)
CT: 249 (37.3)
TT: 53 (7.9)
C: 981 (73.4)
T: 355 (26.6)
0.190; 0.667
Yoo et al. [15]CC: 25 (24.3)
CT: 54 (52.4)
TT: 24 (23.3)
C: 104 (50.5)
T: 102 (49.5)
CC: 37 (35.9)
CT: 53 (51.5)
TT: 13 (12.6)
C: 127 (61.6)
T: 79 (38.4)
0.794; 0.376
Ono et al. [16]CC: 24 (26.1)
CT: 49 (53.3)
TT: 19 (20.6)
C: 97 (52.7)
T: 87 (47.3)
CC: 43 (44.4)
CT: 37 (38.1)
TT: 17 (17.5)
C: 123 (63.4)
T: 71 (36.6)
0.007; 0.935
Kini et al. [17]CC: 50 (35.5)
CT: 75 (53.2)
TT: 16 (11.3)
C: 175 (62.1)
T: 107 (37.9)
CC: 85 (37.6)
CT: 115 (50.9)
TT: 26 (11.5)
C: 285 (63.1)
T: 167 (36.9)
0.854; 0.367
TotalCC: 760 (45.3)
CT: 712 (42.4)
TT: 206 (12.3)
C: 2232 (66.5)
T: 1124 (33.5)
CC: 866 (48.5)
CT: 742 (41.6)
TT: 176 (9.9)
C: 2474 (69.3)
T: 1094 (30.7)
HWE—Hardy–Weinberg equilibrium; NOS—Newcastle–Ottawa Scale.
Table 3. The results of Egger’s and Begg’s tests for all genetic models in total groups.
Genetic ModelEgger’s TestBegg’s Test
Intercept95% CIpKendall’s Taup
Dominant1.023−1.956 to 4.0020.4330.0710.805
Recessive−0.075−2.304 to 2.1530.9370.2140.458
Additive0.216−2.522 to 2.9550.8530.1430.621
Heterozygous 1.069−1.660 to 3.7970.3750.2140.458
Allelic0.784−2.467 to 4.0360.5770.0710.805
CI—confidence interval.
Table 4. The results of Egger’s and Begg’s tests for all genetic models in the subgroup of young adults.
Genetic ModelEgger’s TestBegg’s Test
Intercept95% CIpKendall’s Taup
Dominant1.485−1.202 to 4.1710.1770.4000.327
Recessive0.074−3.269 to 3.4180.9480.2000.624
Additive0.475−3.252 to 4.2030.7120.2000.624
Heterozygous1.498−0.440 to 3.4360.0910.6000.142
Allelic1.256−2.549 to 5.0620.3710.2000.624
CI—confidence interval.
Table 5. The results of Egger’s and Begg’s tests for all genetic models in the subgroup of children.
Genetic ModelEgger’s TestBegg’s Test
Intercept95% CIpKendall’s Taup
Dominant1.464−46.030 to 48.9580.7620.3330.602
Recessive1.100−11.880 to 14.0810.4760.3330.602
Additive1.083−35.202 to 37.3680.7690.3330.602
Heterozygous1.324−46.659 to 49.3070.7850.3330.602
Allelic1.713−42.493 to 45.9190.7090.3330.602
CI—confidence interval.
Table 6. Summary of heterogeneity; effect model used; the results for pooled ORs, 95% CIs, and p; and sensitivity analysis (i.e., stability of the results obtained) in all genetic models within all analyzed groups/subgroups.
Genetic ModelHeterogeneity
I2 (%), p
Effect ModelPooled OR, 95% CI, pStability of Results (Yes/No)
Total Groups (8 Studies)
Dominant (CT + TT vs. CC)52.19, 0.041random1.264, 1.005–1.589, 0.045No
Recessive (TT vs. CC + CT)0.00, 0.572fixed1.327, 1.069–1.648, 0.010No
Additive (TT vs. CC)27.35, 0.210fixed1.440, 1.144–1.812, 0.002Yes
Heterozygous (CT vs. CC)43.39, 0.089fixed1.153, 0.997–1.333, 0.055Yes
Allelic (T vs. C)48.84, 0.057fixed1.183, 1.067–1.311, 0.001Yes
Young adults
(5 studies)
Dominant (CT + TT vs. CC)0.00, 0.462fixed1.281, 1.092–1.503, 0.002Yes
Recessive (TT vs. CC + CT)0.00, 0.632fixed1.483, 1.148–1.918, 0.003Yes
Additive (TT vs. CC)0.00, 0.464fixed1.627, 1.240–2.135, <0.001Yes
Heterozygous (CT vs. CC)0.00, 0.611fixed1.209, 1.021–1.431, 0.028Yes
Allelic (T vs. C)6.42, 0.370fixed1.256, 1.114–1.417, <0.001Yes
Children
(3 studies)
Dominant (CT + TT vs. CC)76.80, 0.013random1.119, 0.540–2.318, 0.762Yes
Recessive (TT vs. CC + CT)0.00, 0.722fixed1.006, 0.670–1.510, 0.978Yes
Additive (TT vs. CC)39.50, 0.192fixed1.054, 0.682–1.628, 0.814Yes
Heterozygous (CT vs. CC)76.36, 0.015random1.117, 0.521–2.394, 0.777Yes
Allelic (T vs. C)65.53, 0.055random1.070, 0.710–1.600, 0.750Yes
OR—odds ratio; CI—confidence interval; Significant results are in bold.
Publisher’s Note: MDPI stays neutral with regard to jurisdictional claims in published maps and institutional affiliations.

