
Eye Tracking-Based Characterization of Fixations during Reading in Children with Neurodevelopmental Disorders


Abstract
:1. Introduction
2. Materials and Methods
2.1. Patients
2.2. Examination Protocol
2.3. Statistical Analysis
3. Results
3.1. General Clinical Data
3.2. Oculomotor Analysis
4. Discussion
5. Conclusions
Author Contributions
Funding
Institutional Review Board Statement
Informed Consent Statement
Data Availability Statement
Conflicts of Interest
References
- Dodge, R. Five Types of Eye Movement in the Horizontal Meridian Plane of the Field of Regard. Am. J. Physiol. 1903, 8, 307–329. [Google Scholar] [CrossRef]
- Bucci, M.P.; Brémond-Gignac, D.; Kapoula, Z. Poor binocular coordination of saccades in dyslexic children. Graefes Arch. Clin. Exp. Ophthalmol. 2008, 246, 417–428. [Google Scholar] [CrossRef] [PubMed]
- Gila, L.; Villanueva, A.; Cabeza, R. Physiopathology and Recording Techniques of the Ocular Movements. An. Sist. Sanit. Navar. 2009, 32, 9–26. [Google Scholar] [CrossRef]
- Alexander, R.G.; Macknik, S.L.; Martinez-Conde, S. Microsaccades in Applied Environments: Real-World Applications of Fixational Eye Movement Measurements. J. Eye Mov. Res. 2020, 12, 6. [Google Scholar] [CrossRef]
- Alahyane, N.; Lardennois, C.L.; Tailhefer, C.; Collins, T.; Fagard, J.; Doré-Mazars, K. Development and Learning of Saccadic Eye Movements in 7- to 42-Month-Old Children. J. Vis. 2016, 16, 6. [Google Scholar] [CrossRef]
- Anderson, T.J.; MacAskill, M.R. Eye Movements in Patients with Neurodegenerative Disorders. Nat. Rev. Neurol. 2013, 9, 74–85. [Google Scholar] [CrossRef] [PubMed]
- Inhoff, A.W.; Kim, A.; Radach, R. Regressions during Reading. Vision 2019, 3, 35. [Google Scholar] [CrossRef]
- McDowell, J.E.; Dyckman, K.A.; Austin, B.P.; Clementz, B.A. Neurophysiology and neuroanatomy of reflexive and volitional saccades: Evidence from studies of humans. Brain Cogn. 2008, 68, 255–270. [Google Scholar] [CrossRef] [PubMed]
- Gil-Casas, A.; Piñero, D.P.; Molina-Martin, A. Binocular, Accommodative and Oculomotor Alterations In Multiple Sclerosis: A Review. Semin. Ophthalmol. 2020, 35, 103–115. [Google Scholar] [CrossRef]
- Lukasova, K.; Silva, I.P.; Macedo, E.C. Impaired Oculomotor Behavior of Children with Developmental Dyslexia in Antisaccades and Predictive Saccades Tasks. Front. Psychol. 2016, 7, 987. [Google Scholar] [CrossRef]
- Seassau, M.; Bucci, M.P. Reading and Visual Search: A Developmental Study in Normal Children. PLoS ONE 2013, 8, e70261. [Google Scholar] [CrossRef] [PubMed]
- Land, M.F. Eye Movements and the Control of Actions in Everyday Life. Prog. Retin. Eye Res. 2006, 25, 296–324. [Google Scholar] [CrossRef] [PubMed]
- Tiadi, A.; Seassau, M.; Gerard, C.L.; Bucci, M.P. Differences Between Dyslexic and Non-Dyslexic Children in the Performance of Phonological Visual-Auditory Recognition Tasks: An Eye-Tracking Study. PLoS ONE 2016, 11, e0159190. [Google Scholar] [CrossRef] [PubMed]
- Redondo, B.; Molina, R.; Cano-Rodríguez, A.; Vera, J.; García, J.A.; Muñoz-Hoyos, A.; Jiménez, R. Visual Perceptual Skills in Attention-Deficit/Hyperactivity Disorder Children: The Mediating Role of Comorbidities. Optom. Vis. Sci. 2019, 96, 655–663. [Google Scholar] [CrossRef] [PubMed]
- Preston, N.; Magallón, S.; Hill, L.J.; Andrews, E.; Ahern, S.M.; Mon-Williams, M. A systematic review of high quality randomized controlled trials investigating motor skill programmes for children with developmental coordination disorder. Clin. Rehabil. 2017, 31, 857–870. [Google Scholar] [CrossRef] [PubMed]
- Bilbao, C.; Piñero, D.P. Distribution of Visual and Oculomotor Alterations in a Clinical Population of Children with and Without Neurodevelopmental Disorders. Brain Sci. 2021, 11, 351. [Google Scholar] [CrossRef] [PubMed]
- Maples, W.C.; Atchley, J.; Ficklin, T. Northeastern State University College of Optometry’s Oculomotor Norms. J. Behav. Optom. 1992, 3, 143–150. [Google Scholar]
- Eden, G.F.; Stein, J.F.; Wood, H.M.; Wood, F.B. Differences in Eye Movements and Reading Problems in Dyslexic and Normal Children. Vis. Res. 1994, 34, 1345–1358. [Google Scholar] [CrossRef] [PubMed]
- Mahone, E.M.; Mostofsky, S.H.; Lasker, A.G.; Zee, D.; Denckla, M.B. Oculomotor Anomalies in Attention-Deficit/Hyperactivity Disorder: Evidence for Deficits in Response Preparation and Inhibition. J. Am. Acad. Child Adolesc. Psychiatry 2009, 48, 749–756. [Google Scholar] [CrossRef]
- Bilbao, C.; Piñero, D.P. Clinical Characterization of Oculomotricity in Children with and without Specific Learning Disorders. Brain Sci. 2020, 10, 836. [Google Scholar] [CrossRef]
- Camden, C.; Wilson, B.; Kirby, A.; Sugden, D.; Missiuna, C. Best Practice Principles for Management of Children with Developmental Coordination Disorder (DCD): Results of a Scoping Review. Child Care Health Dev. 2015, 41, 147–159. [Google Scholar] [CrossRef] [PubMed]
- Juarros-Basterretxea, J.; Aonso-Diego, G.; Postigo, Á.; Montes-Álvarez, P.; Menéndez-Aller, Á.; García-Cueto, E. Post Hoc Tests in One-Way ANOVA: The Case of Normal Distribution. Methodology 2024, 20, 84–99. [Google Scholar] [CrossRef]
- López-de-la-Fuente, C.; Saz-Onrubia, E.; Orduna-Hospital, E.; Sánchez-Cano, A. Comparison of two visual-verbal tests of ocular motility using an eye-tracker. J. Optom. 2024, 17, 100517. [Google Scholar] [CrossRef] [PubMed]
- Ayton, L.N.; Abel, L.A.; Fricke, T.R.; McBrien, N.A. Developmental Eye Movement Test: What is it Really Measuring? Optom. Vis. Sci. 2009, 86, 722–730. [Google Scholar] [CrossRef] [PubMed]
- Blignaut, P.; van Rensburg, E.J.; Oberholzer, M. Visualization and Quantification of Eye Tracking Data for the Evaluation of Oculomotor Function. Heliyon 2019, 5, e01127. [Google Scholar] [CrossRef] [PubMed]
- Maples, W.; Ficklin, T. Comparison of Oculomotor Skills Between Above-Average and Below-Average Readers. J. Behav. Optom. 1990, 1, 87–91. [Google Scholar]
- Termsarasab, P.; Thammongkolchai, T.; Rucker, J.C.; Frucht, S.J. The Diagnostic Value of Saccades in Movement Disorder Patients: A Practical Guide and Review. J. Clin. Mov. Disord. 2015, 2, 14. [Google Scholar] [CrossRef] [PubMed]
- Tiadi, A.; Gérard, C.L.; Peyre, H.; Bui-Quoc, E.; Bucci, M.P. Immaturity of Visual Fixations in Dyslexic Children. Front. Hum. Neurosci. 2016, 10, 58. [Google Scholar] [CrossRef] [PubMed]
- Raghuram, A.R.; Gowrisankaran, S.; Swanson, E.; Zurakowski, D.; Hunter, D.G.; Waber, D.P. Frequency of Visual Deficits in Children with Developmental Dyslexia. JAMA Ophthalmol. 2018, 136, 1089–1095. [Google Scholar] [CrossRef]
- Buzzelli, A.R. Stereopsis, Accommodative and Vergence Facility: Do They Relate to Dyslexia? Optom. Vis. Sci. 1991, 68, 842–846. [Google Scholar] [CrossRef]
- Bucci, M.P.; Nassibi, N.; Gerard, C.L.; Bui-Quoc, E.; Seassau, M. Immaturity of Saccadic Oculomotor and Vergence Interaction in Dyslexic Children: Evidence from a Visual Search and Reading Study. PLoS ONE 2012, 7, e33458. [Google Scholar] [CrossRef] [PubMed]
- Muzaliha, M.N.; Nurhamiza, B.; Hussein, A.; Norabibas, A.R.; Mohd-Hisham-Basrun, J.; Sarimah, A.; Leo, S.W.; Shatriah, I. Visual Acuity and Visual Skills in Malaysian Children with Learning Disabilities. Clin. Ophthalmol. 2012, 6, 1527–1533. [Google Scholar] [CrossRef] [PubMed]
- Arthur, T.; Harris, D.J.; Allen, K.; Naylor, C.E.; Wood, G.; Vine, S.; Wilson, M.R.; Tsaneva-Atanasova, K.; Buckingham, G. Visuo-motor attention during object interaction in children with developmental coordination disorder. Cortex 2021, 138, 318–328. [Google Scholar] [CrossRef] [PubMed]
- Stein, J. The magnocellular theory of developmental dyslexia. In Reading and Dyslexia: From Basic Functions to Higher Order Cognition; Springer: Cham, Switzerland, 2018; pp. 103–134. [Google Scholar]
- Caldani, S.; Acquaviva, E.; Moscoso, A.; Peyre, H.; Delorme, R.; Bucci, M.P. Reading Performance in Children with ADHD: An Eye-Tracking Study. Ann. Dyslexia 2022, 72, 552–565. [Google Scholar] [CrossRef] [PubMed]
- Seassau, M.; Gérard, C.L.; Bui-Quoc, E.; Bucci, M.P. Binocular Saccade Coordination in Reading and Visual Search: A Developmental Study in Typical Reader and Dyslexic Children. Front. Integr. Neurosci. 2014, 8, 85. [Google Scholar] [CrossRef] [PubMed]
- Vagge, A.; Cavanna, M.; Traverso, C.E.; Iester, M. Evaluation of Ocular Movements in Patients with Dyslexia. Ann. Dyslexia 2015, 65, 24–32. [Google Scholar] [CrossRef] [PubMed]
- Molina, R.; Redondo, B.; Vera, J.; García, J.A.; Muñoz-Hoyos, A.; Jiménez, R. Children with Attention-Deficit/Hyperactivity Disorder Show an Altered Eye Movement Pattern during Reading. Optom. Vis. Sci. 2020, 97, 265–274. [Google Scholar] [CrossRef]
- Sherigar, S.S.; Gamsa, A.H.; Srinivasan, K. Oculomotor Deficits in Attention Deficit Hyperactivity Disorder: A Systematic Review and Meta-Analysis. Eye 2023, 37, 1975–1981. [Google Scholar] [CrossRef] [PubMed]
- Bonifacci, P.; Tobia, V.; Sansavini, A.; Guarini, A. Eye-Movements in a Text Reading Task: A Comparison of Preterm Children, Children with Dyslexia and Typical Readers. Brain Sci. 2023, 13, 425. [Google Scholar] [CrossRef]
- Lee, T.L.; Yeung, M.K.; Sze, S.L.; Chan, A.S. Computerized Eye-Tracking Training Improves the Saccadic Eye Movements of Children with Attention-Deficit/Hyperactivity Disorder. Brain Sci. 2020, 10, 1016. [Google Scholar] [CrossRef]
- Sumner, E.; Hutton, S.B.; Kuhn, G.; Hill, E.L. Oculomotor Atypicalities in Developmental Coordination Disorder. Dev. Sci. 2018, 21, e12501. [Google Scholar] [CrossRef] [PubMed]
- Razuk, M.; Barela, J.A.; Peyre, H.; Gerard, C.L.; Bucci, M.P. Eye Movements and Postural Control in Dyslexic Children Performing Different Visual Tasks. PLoS ONE 2018, 13, e0198001. [Google Scholar] [CrossRef] [PubMed]
- Piaget, J. Cognitive Development in Children: Piaget Development and Learning. J. Res. Sci. Teach. 1964, 2, 176–186. [Google Scholar] [CrossRef]


| Performance Area | Evaluation Procedure | Scoring System |
|---|---|---|
| Ability | Patient’s ability to perform 5 cycles of change in fixation between two stimuli presented | 1 point: 1 cycle or no ability 2 points: 2 cycles 3 points: 3 cycles 4 points: 4 cycles 5 points: 5 cycles |
| Accuracy | Patient’s ability to perform 5 cycles of change in fixation without performing refixations | 1 point: significant hyper- or hypometric movements 2 points: large to moderate hyper- or hypometric movements 3 points: slight hyper- or hypometric movements but constant 4 points: slight hyper- or hypometric movements but intermittent 5 points: no correcting refixations |
| Head movement associated | Patient’s ability to perform 5 cycles of change in fixation without head or body movements | 1 point: 1 cycle or no ability 2 points: 2 cycles 3 points: 3 cycles 4 points: 4 cycles 5 points: 5 cycles |
| Correlation, n = 68 | ρ Spearman | p-Value |
|---|---|---|
| NSUCO ability + 5 rounds completed (objetive measure) | 0.702 | 0.00 (0.00) |
| NSUCO accuracy + hypometric saccades (eye tracking) | 0.686 | 0.00 (0.00) |
| Mean (SD) Median (Range) | CG (n = 20) | OAG (n = 24) | NDDG (n = 24) | p-Value |
|---|---|---|---|---|
| Age (years) | 8.35 (2.25) 8.00 (6 to 11) | 8.87 (1.84) 9.00 (6 to 12) | 8.70 (1.45) 9.00 (6 to 11) | 0.499 |
| Sphere RE (D) | 0.00 (0.00) 0.00 (−0.75 to +3.00) | 0.00 (0.00) 0.00 (0.00 to 0.00) | 0.14 (1.18) 0.00 (0.00 to +0.50) | 0.837 |
| Cylinder RE (D) | −0.21 (0.773) 0.00 (−3.25 to 0.00) | 0.00 (0.00) 0.00 (0.00 to 0.00) | −0.14 (0.43) 0.00 (−1.50 to 0.00) | 0.180 |
| Sphere LE (D) | 0.08 (0.72) 0.00 (0.00 to +3.50) | 0 (0.00) 0.00 (0.00 to 0.00) | 0.16 (1.21) 0.00 (0.00 to +5.00) | 0.748 |
| Cylinder LE (D) | −0.16 (0.71) 0.00 (−3.50 to 0.00) | 0.00 (0.00) 0.00 (0.00 to 0.00) | −0.11 (0.37) 0.00 (−1.50 to 0.00) | 0.301 |
| LogMAR CDVA (RE) | 0.00 (0.00) 0.00 (0.00 to 0.00) | 0.00 (0.00) 0.00 (0.00 to 0.00) | 0.00 (0.00) 0.00 (0.00 to 0.00) | 0.156 |
| LogMAR CDVA (LE) | 0.00 (0.00) 0.00 (0.00 to 0.00) | 0.00 (0.00) 0.00 (0.00 to 0.00) | 0.00 (0.00) 0.00 (0.00 to 0.00) | 0.156 |
| Near Stereopsis (sec arc) | 31.00 (13.73) 20.00 (20.00 to 60.00) | 38.08 (18.81) 40.00 (20 to 100) | 72.46 (79.46) 45.00 (20.00 to 400.00) | 0.002 * CG-OAG 0.193 CG-NDDG 0.001 * OAG-NDDG 0.014 * |
| NPC Break (cm) | 4.55 (5.70) 3.00 (0.00 to 20.00) | 6.83 (5.94) 7.00 (0.00 to 20.00) | 7.71 (5.86) 8.00 (0.00 to 20.00) | 0.121 |
| NPC Recovery (cm) | 4.20 (5.37) 2.00 (0.00 to 18.00) | 6.54 (5.89) 6.00 (0.00 to 18.00) | 7.46 (6.63) 7.00 (0.00 to 25.00) | 0.173 |
| Near Cover Test (∆) | −1.05 (2.23) 0.00 (−6.00 to 0.00) | −3.87 (4.20) −4.00 (−15.00 to 0.00) | −3.17 (5.09) −2.00 (−14.00 to 0.00) | 0.043 * CG-OAG 0.012 * CG-NDDG 0.052 OAG-NDDG 0.677 |
| DEM_Type | 1.0 (0.00) 1.0 (1.00 to 1.00) | 2.45 (0.83) 2.00 (2.00 to 4.00) | 2.91 (1.08) 3.00 (1.00 to 4.00) | <0.001 * CG-OAG < 0.001 * CG-NDDG < 0.001 * OAG-NDDG 0.032 * |
| Mean (SD) Median (Range) | CG (n = 20) | OAG (n = 24) | NDDG (n = 24) | p-Value |
|---|---|---|---|---|
| Time Sheet A (s) | 22.10 (4.87) 20.00 (15.00 to 34.00) | 23.29 (5.60) 23.00 (15:00 to 40.00) | 28.58 (7.78) 29.00 (15:00 to 42.00) | 0.005 * CG-OAG 0.362 CG-NDDG 0.002 * OAG-NDDG 0.018 * |
| Time Sheet B (s) | 23.65 (4.98) 22.50 (15.00 to 42.00) | 25.96 (5.83) 25.00 (18.00 to 39.00) | 32.16 (9.80) 30.50 (19.00 to 55.00) | 0.004 * CG-OAG 0.226 CG-NDDG 0.002 * OAG-NDDG 0.022 * |
| Time Sheet C (s) | 64.10 (19.70) 59.00 (43.00 to 110.00) | 91.08 (29.25) 78.00 (49.00 to 166.00) | 114.75 (50.66) 105.00 (37.00 to 212.00) | <0.001 * CG-OAG 0.001 * CG-NDDG < 0.001 * OAG-NDDG 0.097 |
| DEM Ratio | 1.39 (0.21) 1.35 (1.02 to 1.70) | 1.85 (0.45) 1.80 (1.03 to 2.92) | 1.94 (0.92) 1.70 (0.91 to 5.12) | 0.001 * CG-OAG < 0.001 * CG-NDDG 0.007 * OAG-NDDG 0.509 |
| Number of Errors | 0.70 (1.081) 0.00 (0.00 to 3.00) | 5.00 (4.41) 4.00 (0.00 to 20.00) | 10.09 (10.62) 6.00 (1.00 to 45.00) | <0.001 * CG-OAG < 0.001 * CG-NDDG < 0.001 * OAG-NDDG 0.044 * |
| Mean (SD) Median (Range) | CG (n = 20) | OAG (n = 24) | NDDG (n = 24) | p-Value |
|---|---|---|---|---|
| Fixation | 4.85 (0.36) 5.00 (3.00 to 5.00) | 3.12 (0.79) 3.00 (1.00 to 5.00) | 3.58 (1.38) 4.00 (1.00 to 4.00) | <0.001 * CG-OAG < 0.001 * CG-NDDG 0.010 * OAG-NDDG 0.014 * |
| NSUCO test: saccades | ||||
| Ability | 4.80 (0.41) 5.00 (3.00 to 5.00) | 2.33 (0.70) 2.00 (1.00 to 4.00) | 2.37 (0.767) 2.00 (1.00 to 4.00) | <0.001 * CG-OAG < 0.001 * CG-NDDG < 0.001 * OAG-NDDG 0.940 |
| Precision | 4.75 (0.44) 5.00 (3.00 to 5.00) | 2.33 (0.82) 2.00 (1.00 to 4.00) | 2.33 (0.82) 2.00 (1.00 to 4.00) | <0.001 * CG-OAG < 0.001 * CG-NDDG < 0.001 * OAG-NDDG 0.689 |
| Head/Body Movement | 4.80 (0.410) 5.00 (3.00 to 5.00) | 2.25 (0.79) 2.00 (1.00 to 4.00) | 2.00 (0.83) 2.00 (1.00 to 4.00) | <0.001 * CG-OAG < 0.001 * CG-NDDG < 0.001 * OAG-NDDG 0.680 |
| Mean (SD) Median (Range) | CG (n = 20) | OAG (n = 24) | NDDG (n = 24) | p-Value |
|---|---|---|---|---|
| Resolution Time (s) | 67.75 (25.31) 57.50 (34.80 to 142.60) | 80.86 (44.04) 74.35 (31.90 to 248.10) | 103.71 (51.49) 153.00 (36.80 to 286.00) | 0.011 * CG-OAG 0.225 CG-NDDG 0.003 * OAG-NDDG 0.068 |
| Words Per Minute | 79.85 (25.03) 84.52 (34.08 to 139.66) | 73.85 (33.34) 65.30 (19.59 to 152.35) | 57.02 (25.26) 56.23 (19.38 to 132.07) | 0.011 * CG-OAG 0.225 CG-NDDG 0.003 * OAG-NDDG 0.068 |
| No. Fixations | 144.85 (69.65) 125.50 (32.00 to 286) | 167.25 (72.87) 150.00 (41.00 to 323.00) | 167.00 (56.88) 153.00 (80.00 to 279.00) | 0.329 |
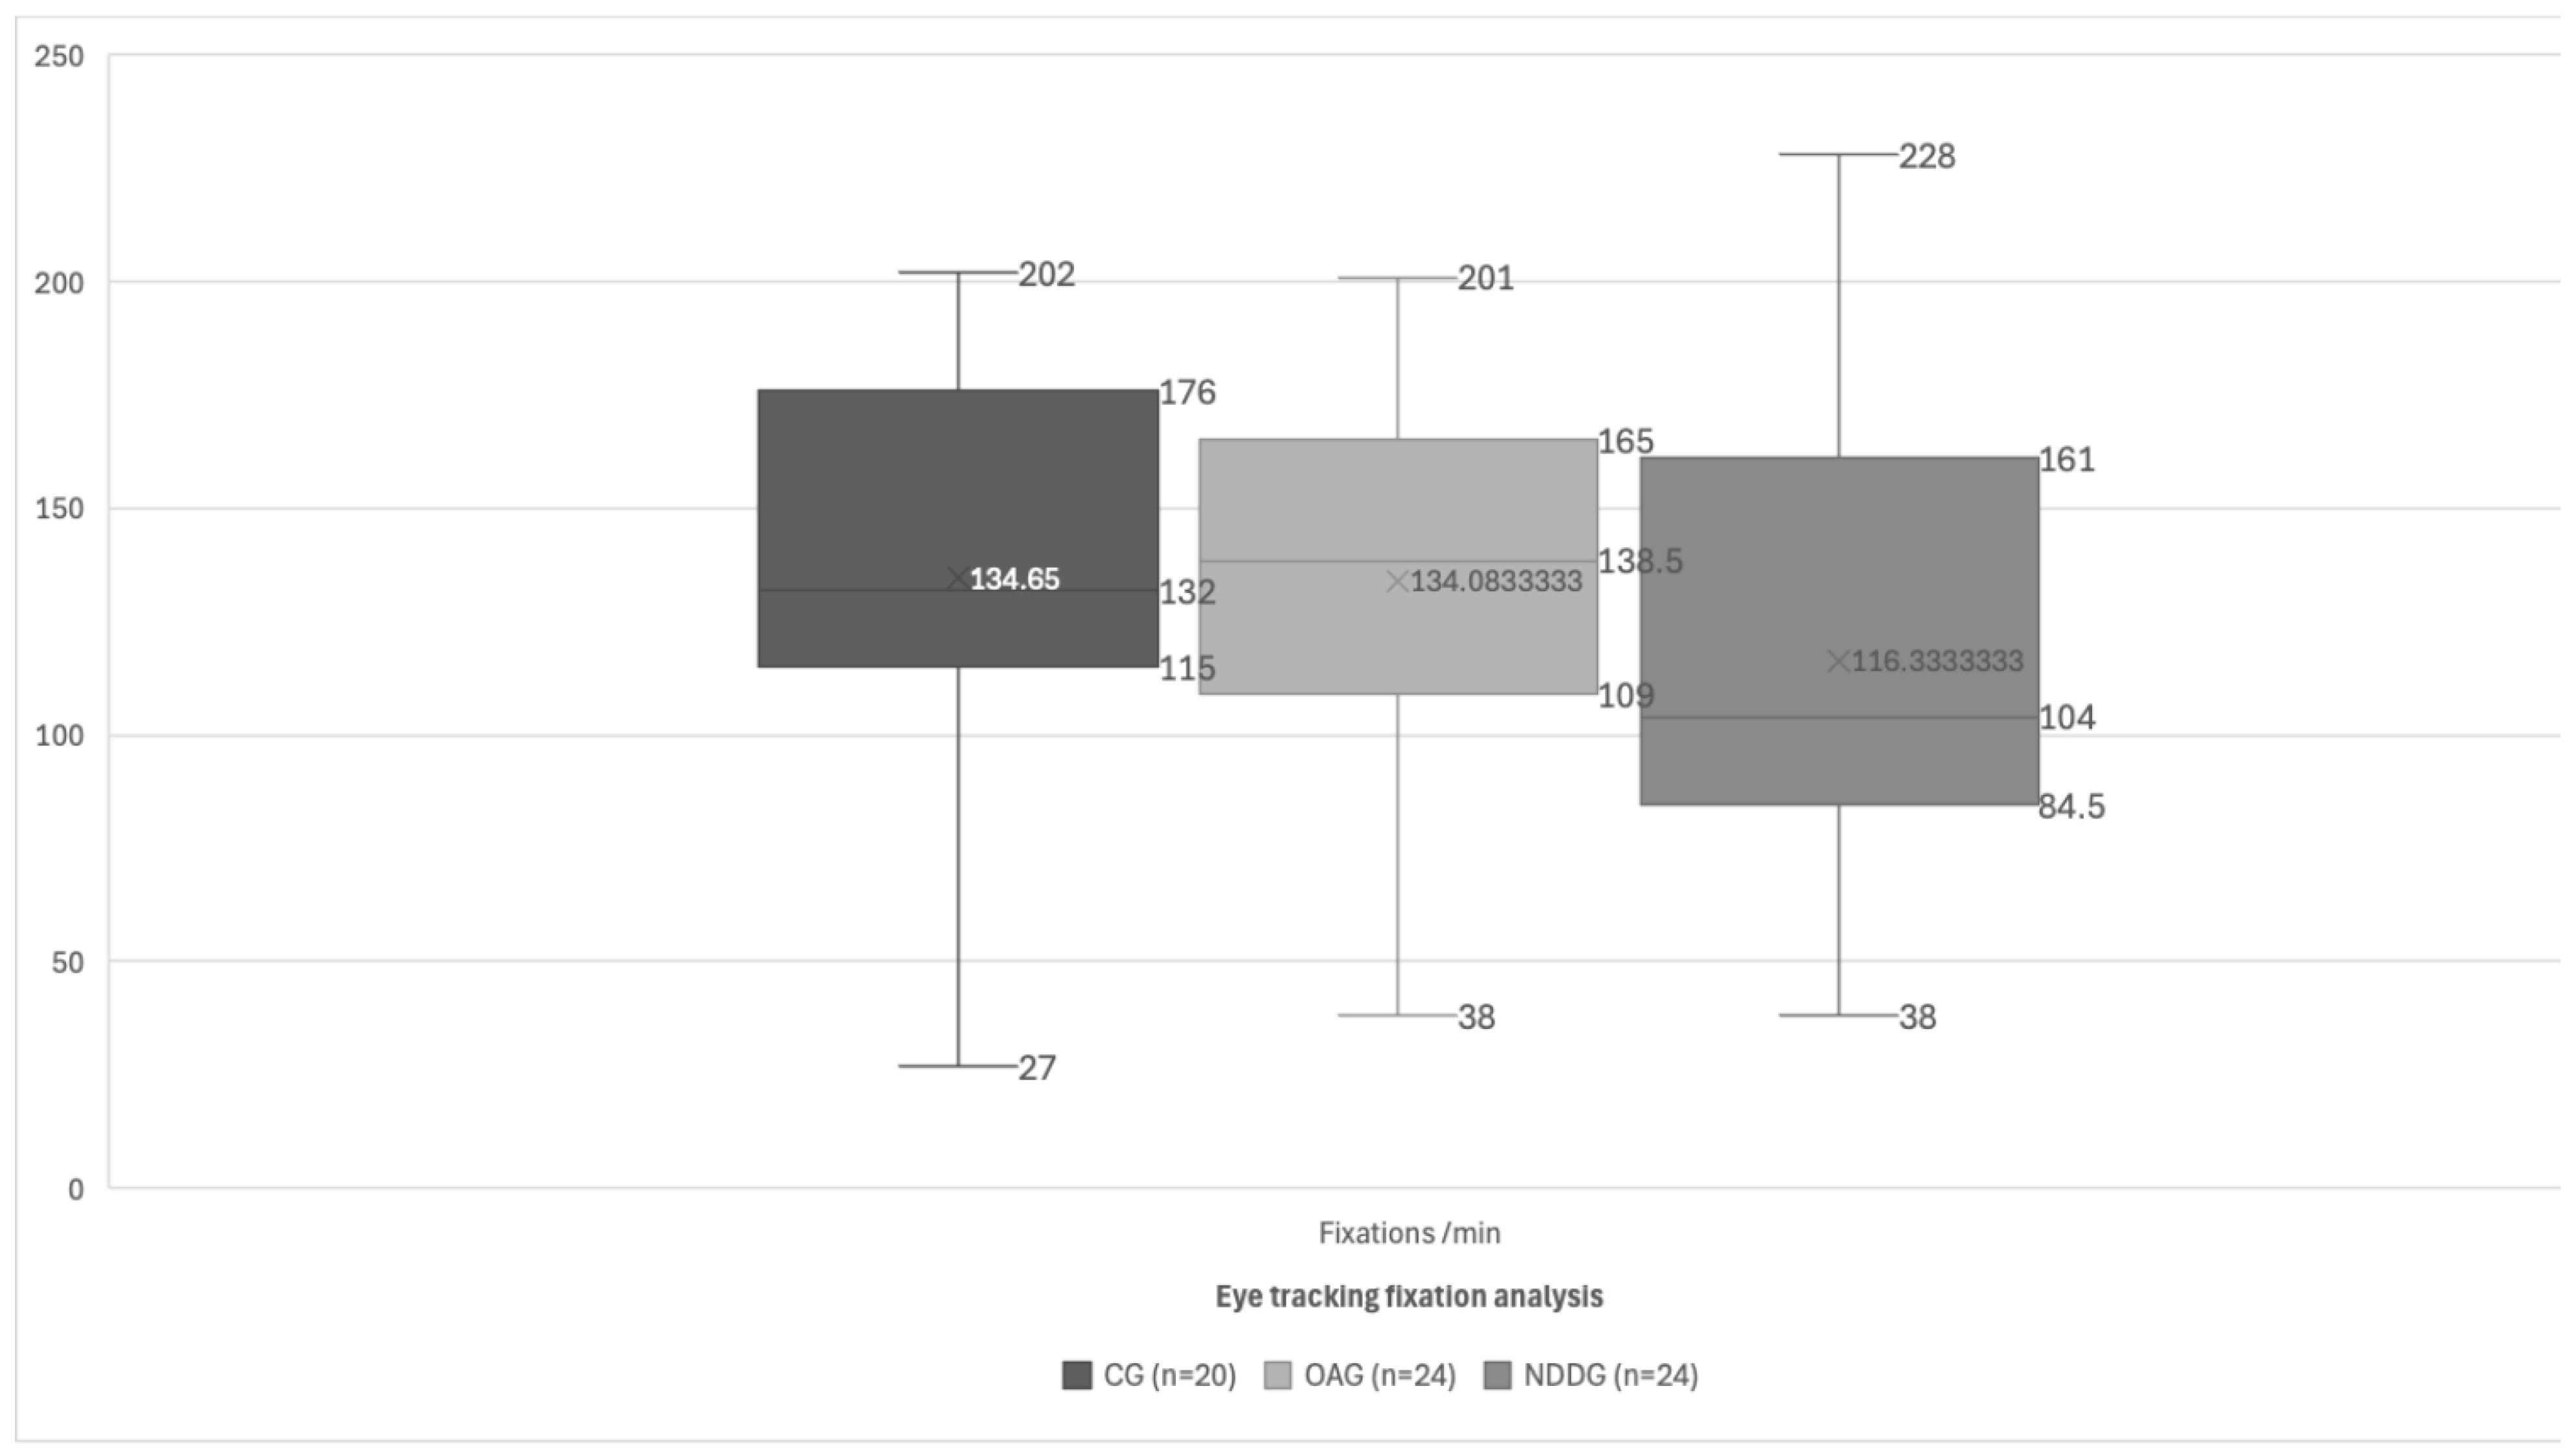
| Fixations/min | 134.65 (47.88) 132.00 (27.00 to 202.00) | 134.08 (42.32) 138.50 (60.00 to 201.00) | 116.33 (51.65) 104.00 (38.00 to 228.00) | 0.223 |
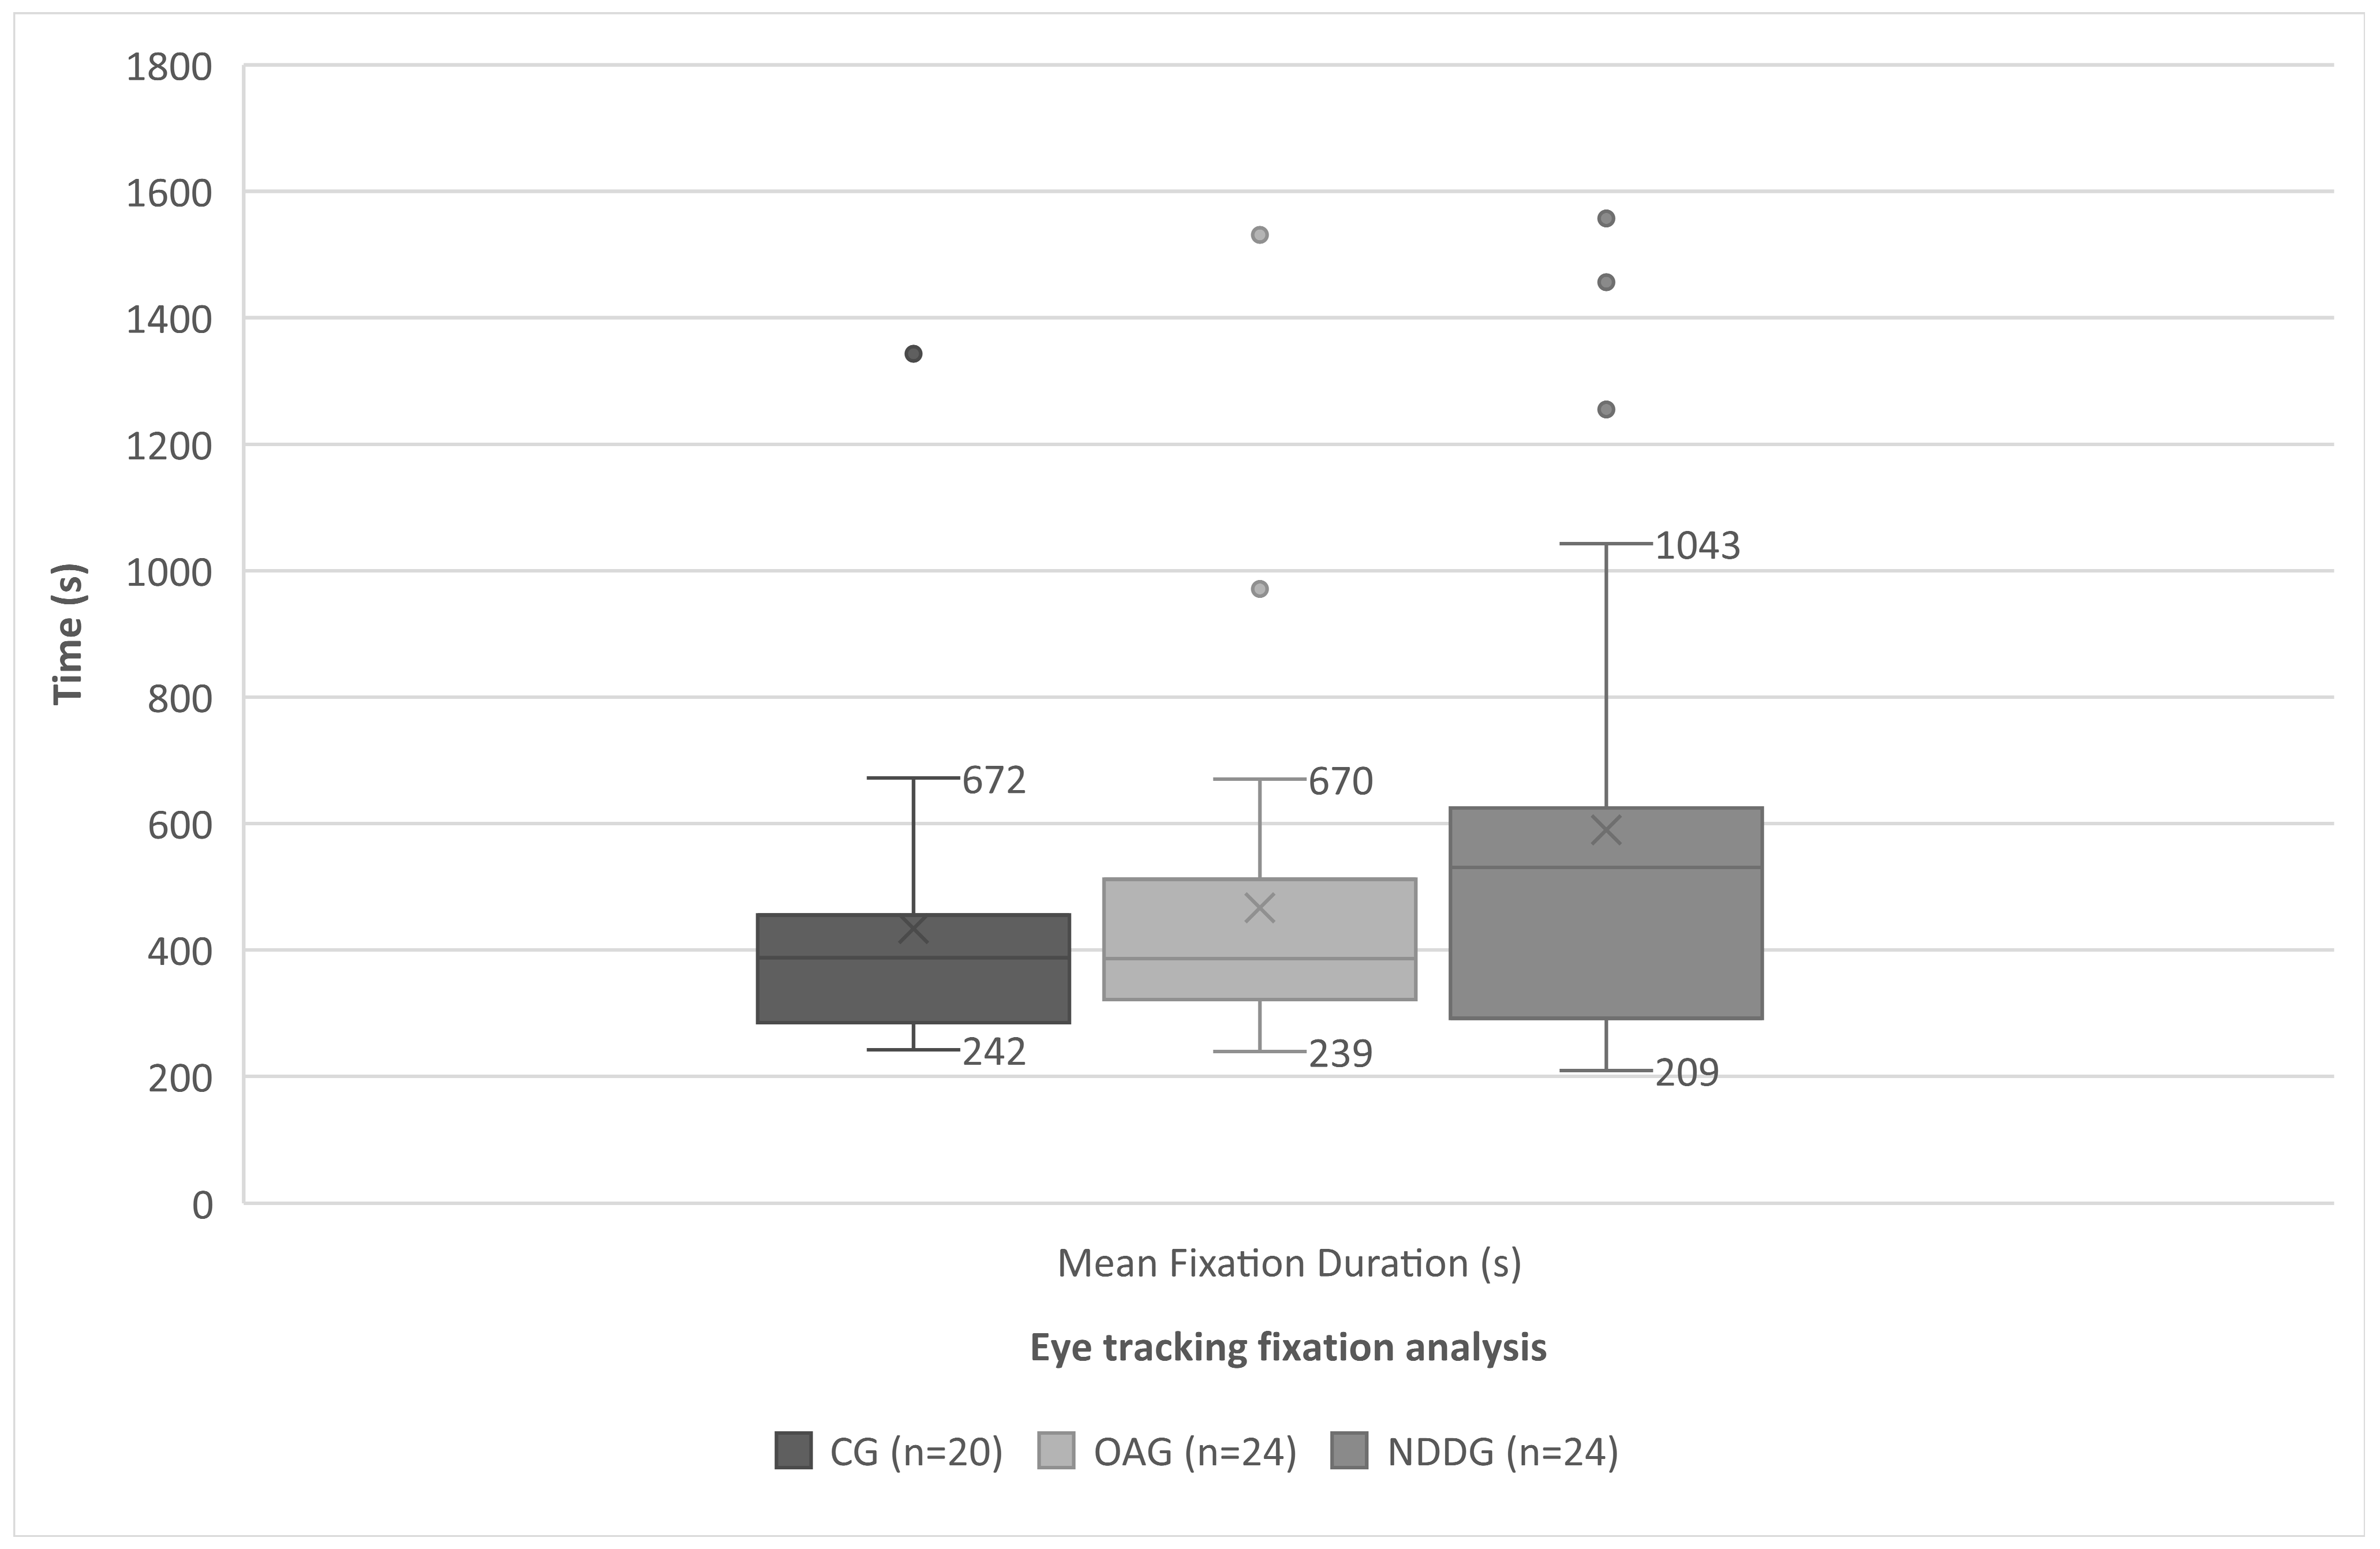
| Mean Fixation Duration (s) | 433.75 (242.96) 387.50 (242.00 to 1343.00) | 466.66 (278.59) 386.00 (246.00 to 1531.00) | 589.66 (376.747) 530.50 (209.00 to 1557.00) | 0.224 |
| Mean No. Fixations/Row | 16.20 (35.09) 15.96 (9.50 to 26.75) | 19.69 (6.25) 18.63 (11.44 to 31.29) | 17.86 (6.58) 16.00 (11.17 to 42.50) | 0.137 |
| Percentage of Regressions (%) | 24.03 (3.78) 24.10 (15.30 to 31.70) | 31.72 (36.82) 31.80 (19.40 to 48.80) | 33.13 (35.47) 31.80 (20.90 to 45.00) | <0.001 * CG-OAG < 0.001 * CG-NDDG < 0.001 * OAG-NDDG 0.370 |
| η2 | Power | |
|---|---|---|
| Resolution Time (s) | 0.111 * | 0.705 * |
| Words Per Minute | 0.108 * | 0.690 * |
| No. Fixations | 0.024 | 0.179 |
| Fixation/min | 0.33 * | 0.239 * |
| Mean Fixation Duration (s) | 0.047 | 0.330 |
| Mean No. Fixations/Row | 0.053 | 0.366 |
| Percentage of Regressions (%) | 0.334 * | 0.999 * |
Disclaimer/Publisher’s Note: The statements, opinions and data contained in all publications are solely those of the individual author(s) and contributor(s) and not of MDPI and/or the editor(s). MDPI and/or the editor(s) disclaim responsibility for any injury to people or property resulting from any ideas, methods, instructions or products referred to in the content. |
© 2024 by the authors. Licensee MDPI, Basel, Switzerland. This article is an open access article distributed under the terms and conditions of the Creative Commons Attribution (CC BY) license (https://creativecommons.org/licenses/by/4.0/).
Share and Cite
Bilbao, C.; Carrera, A.; Otin, S.; Piñero, D.P. Eye Tracking-Based Characterization of Fixations during Reading in Children with Neurodevelopmental Disorders. Brain Sci. 2024, 14, 750. https://doi.org/10.3390/brainsci14080750
Bilbao C, Carrera A, Otin S, Piñero DP. Eye Tracking-Based Characterization of Fixations during Reading in Children with Neurodevelopmental Disorders. Brain Sciences. 2024; 14(8):750. https://doi.org/10.3390/brainsci14080750
Chicago/Turabian StyleBilbao, Carmen, Alba Carrera, Sofia Otin, and David P. Piñero. 2024. "Eye Tracking-Based Characterization of Fixations during Reading in Children with Neurodevelopmental Disorders" Brain Sciences 14, no. 8: 750. https://doi.org/10.3390/brainsci14080750
APA StyleBilbao, C., Carrera, A., Otin, S., & Piñero, D. P. (2024). Eye Tracking-Based Characterization of Fixations during Reading in Children with Neurodevelopmental Disorders. Brain Sciences, 14(8), 750. https://doi.org/10.3390/brainsci14080750